OKLAHOMA · PDF fileand payroll figures for the state and each county for the calendar year...
93
Transcript of OKLAHOMA · PDF fileand payroll figures for the state and each county for the calendar year...


OKLAHOMA
Quarterly Census of Employment and Wages (QCEW)
2008
Oklahoma Employment Security Commission Jon Brock, Executive Director
Economic Research and Analysis Division
Lynn Gray, Director
Will Rogers Memorial Office Building P.O. Box 52003
Oklahoma City, OK 73152-2003 Phone: (405) 557-7245
Fax: (405) 525-0139 Email: [email protected]
November 2009
This publication is issued and is part of the activities of the Oklahoma Employment Security Commission as authorized by the Oklahoma Employment Security Act.
Equal Opportunity Employer/Program Auxiliary aids and services are available upon request for individuals with disabilities.

Table of Contents
Introduction……………………………………………………………………..………1 North American Industry Classification System and Titles…………..………..4 Section I: Annual Average Covered Employment by County………...….……5
(1985 – 2008) Section II: QCEW Data 2008 by State and MSA…………………..……………10 Section III: QCEW Data 2008 by County………..……………………………….14

Introduction
Description of Data The Quarterly Census of Employment and Wages (QCEW) program produces a comprehensive tabulation of employment and wage information for workers covered by State unemployment insurance (UI) laws and Federal workers covered by the Unemployment Compensation for Federal Employees (UCFE) program. This publication contains average annual employment and payroll figures for the state and each county for the calendar year 2008. In addition, covered employment and average weekly earnings figures are included by major industry division for the state, every county in the state and the Oklahoma City, Tulsa, and Lawton Metropolitan Statistical Areas. The information contained in this handbook was tabulated from the quarterly contributions reports and Multiple Work-site Report supplements submitted by employers subject to the Oklahoma Employment Security Act. Establishments and Employment Size An establishment is an economic unit, such as a farm, mine, factory, or store that produces goods or provides services. It is typically at a single physical location and engaged in one, or predominantly one, type of economic activity for which a single industrial classification may be applied. Occasionally, a single physical location encompasses two or more distinct and significant activities. Each activity is reported as a separate establishment, if separate records are kept, and the various activities are classified under different industries. Data reported for the first quarter of 2008 were tabulated into size categories ranging from worksites with few employees, to those with 1,000 or more employees. The size category is determined by the establishment's March employment level. It is important to note that data for each establishment of a multi-establishment firm are tabulated separately into the appropriate size category. The total employment level of the reporting multi-establishment firm is not used in the size tabulation. Covered Employment Employment data under the QCEW program represent the number of covered workers who worked during, or received pay for, the pay period including the 12th of the month. Excluded are members of the armed forces, the self-employed, proprietors, domestic workers, unpaid family workers, and railroad workers covered by the railroad unemployment insurance system. Average Annual Employment The average annual employment figures shown for each year in this publication are the arithmetic means of the 12 monthly figures. Because these figures are rounded to the nearest whole number, the sum of the industry division may not add up to the average for a county. Also, the sum of the county averages will not necessarily add up to the state average for the same reason.
Total Wages The annual total wage figures and the average weekly wages used in this publication include all wages and salaries paid to federal and covered employees including bonuses, commissions and cash value of all remuneration received in any medium other than cash. These wages include both taxable and non-taxable wages. Average Weekly Wages The average weekly wages shown were computed by dividing the total wages for the year by the average employment to arrive at an annual average wages rate. This rate, in turn, was divided by 52 weeks to determine average weekly wages. Industrial Divisions Employment and wages are reported by major industry division as defined in the 2007 edition of the North American Industry Classification System Manual. Industry detail shown in this handbook covers the following industry divisions:
Agriculture, Forestry, Fishing and Hunting Mining Construction Manufacturing Wholesale Trade Retail Trade Transportation Information Finance and Insurance Real Estate, Rental, and Leasing Professional, Scientific, and Technical Services Management of Companies and Enterprises Administrative & Support, Waste Management, and Remediation Services Education Services Health Care and Social Assistance Arts, Entertainment, and Recreation Accommodation and Food Service Other Services Public Administration
Industry division employment in this issue differs from previous issues. Previously, private sector employment was classified in one of nine industry divisions while all Government employment was counted in Public Administration or Federal Government. Beginning in this issue Government employment will be classified with private sector employment in the appropriate industrial division. The only employment counted in the Government division will be those Government jobs that are not classifiable in one of the nine industry divisions.
Contacts Additional information may be obtained from: Oklahoma Employment Security Commission Economic Research & Analysis Division Will Rogers Memorial Office Building 2401 North Lincoln Boulevard P.O. Box 52003 Oklahoma City, Oklahoma 73152 Phone: 405-557-7245 Fax: 405-525-0139 E-mail: [email protected]

North American Industry Classification System Codes and Titles
NAICS CODE TITLE
Natural Resources and Mining11 Agriculture, Forestry, Fishing and Hunting21 Mining
Construction23 Construction
Manufacturing31-33 Manufacturing
Trade, Transportation, and Utilities42 Wholesale Trade44-45 Retail Trade48-49 Transportation and Warehousing22 Utilities
Information51 Information
Financial Activities52 Finance and Insurance53 Real Estate, Rental, and Leasing
Professional and Business Services54 Professional, Scientific, and Technical Services55 Management of Companies and Enterprises56 Administrative, Support, Waste Management, and Remediation Services
Education and Health Services61 Education Services62 Health Care and Social Assistance
Leisure and Hospitality71 Arts, Entertainment, and Recreation72 Accommodation and Food Services
Other Services81 Other Services, except Public Administration
Public Administration92 Public Administration
Unclassified99 Unclassified
4

Annual Average Covered Employment by County(1985-2008)
State Total Adair Alfalfa Atoka Beaver Beckham Blaine Bryan
1985 1,090,030 3,079 1,433 2,513 1,542 5,654 3,158 7,1571986 1,050,930 3,074 1,436 2,453 1,399 4,969 2,974 7,1071987 1,035,670 3,355 1,473 2,485 1,362 4,532 2,986 7,1431988 1,061,016 3,369 1,397 2,532 1,436 4,907 3,003 7,5201989 1,087,675 3,522 1,346 2,535 1,353 4,933 3,018 7,8561990 1,119,450 3,883 1,375 2,403 1,388 4,862 3,053 8,3381991 1,182,195 4,408 1,305 2,576 1,406 5,137 3,076 8,2721992 1,196,845 4,616 1,396 2,558 1,322 5,156 2,959 8,4361993 1,221,073 4,833 1,353 2,676 1,329 5,521 3,205 8,7381994 1,250,170 5,127 1,340 2,722 1,410 5,791 3,247 9,0131995 1,281,076 4,933 1,347 2,813 1,396 5,937 3,191 9,2451996 1,308,335 4,801 1,231 2,813 1,297 5,948 3,231 9,8681997 1,360,489 4,531 1,300 2,882 1,390 6,189 3,251 10,3071998 1,404,870 4,517 1,390 2,943 1,385 6,251 3,157 11,9721999 1,419,448 4,516 1,359 3,003 1,268 6,368 3,086 12,0022000 1,452,166 4,840 1,410 3,061 1,259 6,904 3,313 12,3602001 1,463,622 4,692 1,322 3,097 1,302 7,066 3,128 13,2422002 1,441,032 4,601 1,332 3,172 1,284 7,042 3,119 13,4442003 1,425,391 4,632 1,282 3,194 1,276 7,208 3,126 13,2222004 1,427,351 4,731 1,312 3,179 1,304 7,543 3,166 14,0172005 1,465,199 4,932 1,225 3,261 1,341 7,922 3,266 15,1192006 1,506,760 5,378 1,236 3,368 1,429 8,599 3,390 15,9392007 1,534,925 5,571 1,216 3,387 1,473 9,506 3,368 16,3152008 1,550,722 5,381 1,262 3,437 1,514 10,096 3,330 15,675
Caddo Canadian Carter Cherokee Choctaw Cimarron Cleveland Coal
1985 6,262 14,335 16,866 7,622 2,919 752 37,501 9991986 5,998 14,542 15,878 7,829 2,840 738 36,793 1,0491987 5,983 13,772 15,297 7,903 2,938 829 36,738 1,0471988 5,632 13,440 15,290 8,161 3,043 750 38,217 1,0611989 5,647 13,923 15,531 8,503 3,117 705 38,184 1,0791990 5,940 15,003 15,984 9,166 3,399 721 41,074 9981991 6,544 16,283 16,388 9,865 3,719 840 43,225 1,0301992 6,736 17,178 16,571 10,092 3,587 878 44,484 1,0361993 6,800 17,987 17,618 10,260 3,504 833 46,463 1,1141994 6,805 18,695 17,856 10,592 3,639 799 47,774 1,1281995 6,877 19,650 18,358 10,908 3,460 792 50,652 1,2521996 7,099 19,711 18,653 10,380 3,402 790 52,694 7671997 7,475 20,152 18,862 11,710 3,509 786 54,617 1,3171998 8,012 20,982 18,970 12,230 3,710 880 56,272 1,2511999 8,147 22,355 18,995 12,772 3,822 851 58,340 1,2482000 7,344 22,240 19,251 12,866 3,830 852 60,237 1,1952001 7,422 22,255 20,065 13,074 3,983 769 61,359 1,1872002 7,400 21,682 19,923 13,513 4,150 751 62,768 1,1522003 7,262 21,315 20,366 13,308 3,931 730 64,000 1,0012004 7,093 21,997 21,082 13,980 3,935 751 65,634 9212005 7,249 23,550 21,396 14,152 4,175 681 68,723 9242006 6,987 24,861 21,951 14,675 4,399 712 70,635 1,0492007 7,033 25,750 22,234 15,574 4,446 658 75,189 1,0782008 7,321 26,458 22,904 15,195 4,394 637 72,248 1,082
5
Annual Average Covered Employment by County(1985-2008)
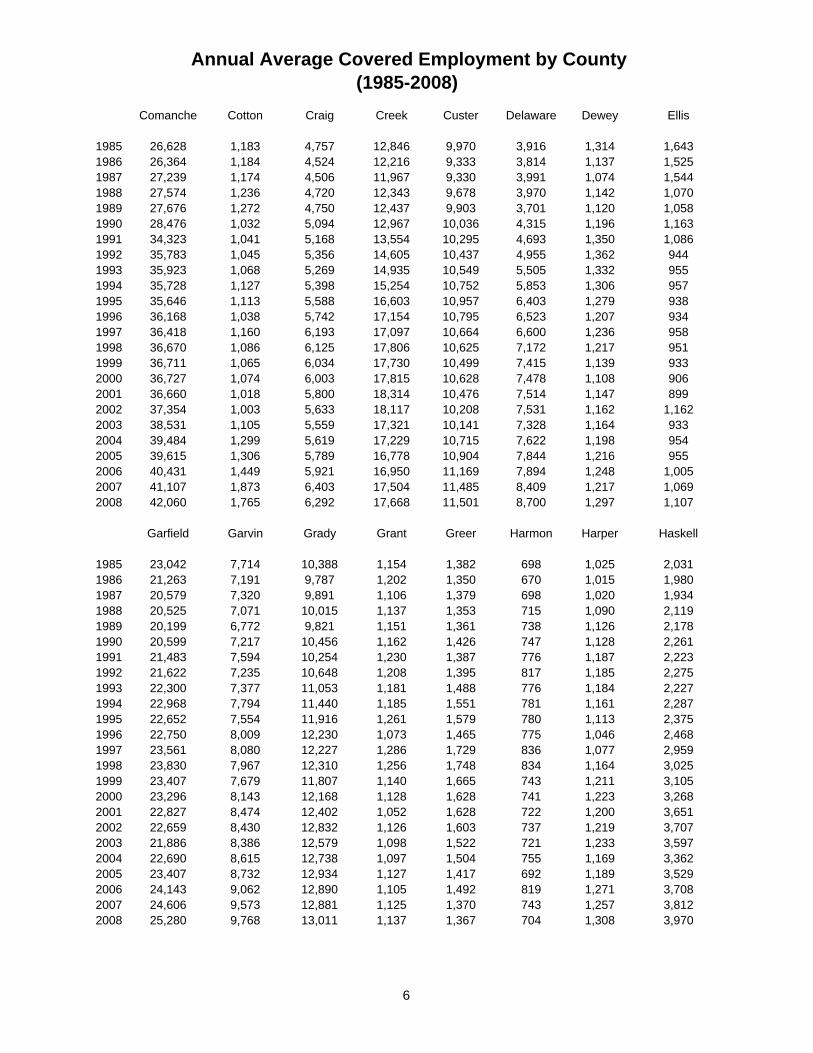
Comanche Cotton Craig Creek Custer Delaware Dewey Ellis
1985 26,628 1,183 4,757 12,846 9,970 3,916 1,314 1,6431986 26,364 1,184 4,524 12,216 9,333 3,814 1,137 1,5251987 27,239 1,174 4,506 11,967 9,330 3,991 1,074 1,5441988 27,574 1,236 4,720 12,343 9,678 3,970 1,142 1,0701989 27,676 1,272 4,750 12,437 9,903 3,701 1,120 1,0581990 28,476 1,032 5,094 12,967 10,036 4,315 1,196 1,1631991 34,323 1,041 5,168 13,554 10,295 4,693 1,350 1,0861992 35,783 1,045 5,356 14,605 10,437 4,955 1,362 9441993 35,923 1,068 5,269 14,935 10,549 5,505 1,332 9551994 35,728 1,127 5,398 15,254 10,752 5,853 1,306 9571995 35,646 1,113 5,588 16,603 10,957 6,403 1,279 9381996 36,168 1,038 5,742 17,154 10,795 6,523 1,207 9341997 36,418 1,160 6,193 17,097 10,664 6,600 1,236 9581998 36,670 1,086 6,125 17,806 10,625 7,172 1,217 9511999 36,711 1,065 6,034 17,730 10,499 7,415 1,139 9332000 36,727 1,074 6,003 17,815 10,628 7,478 1,108 9062001 36,660 1,018 5,800 18,314 10,476 7,514 1,147 8992002 37,354 1,003 5,633 18,117 10,208 7,531 1,162 1,1622003 38,531 1,105 5,559 17,321 10,141 7,328 1,164 9332004 39,484 1,299 5,619 17,229 10,715 7,622 1,198 9542005 39,615 1,306 5,789 16,778 10,904 7,844 1,216 9552006 40,431 1,449 5,921 16,950 11,169 7,894 1,248 1,0052007 41,107 1,873 6,403 17,504 11,485 8,409 1,217 1,0692008 42,060 1,765 6,292 17,668 11,501 8,700 1,297 1,107
Garfield Garvin Grady Grant Greer Harmon Harper Haskell
1985 23,042 7,714 10,388 1,154 1,382 698 1,025 2,0311986 21,263 7,191 9,787 1,202 1,350 670 1,015 1,9801987 20,579 7,320 9,891 1,106 1,379 698 1,020 1,9341988 20,525 7,071 10,015 1,137 1,353 715 1,090 2,1191989 20,199 6,772 9,821 1,151 1,361 738 1,126 2,1781990 20,599 7,217 10,456 1,162 1,426 747 1,128 2,2611991 21,483 7,594 10,254 1,230 1,387 776 1,187 2,2231992 21,622 7,235 10,648 1,208 1,395 817 1,185 2,2751993 22,300 7,377 11,053 1,181 1,488 776 1,184 2,2271994 22,968 7,794 11,440 1,185 1,551 781 1,161 2,2871995 22,652 7,554 11,916 1,261 1,579 780 1,113 2,3751996 22,750 8,009 12,230 1,073 1,465 775 1,046 2,4681997 23,561 8,080 12,227 1,286 1,729 836 1,077 2,9591998 23,830 7,967 12,310 1,256 1,748 834 1,164 3,0251999 23,407 7,679 11,807 1,140 1,665 743 1,211 3,1052000 23,296 8,143 12,168 1,128 1,628 741 1,223 3,2682001 22,827 8,474 12,402 1,052 1,628 722 1,200 3,6512002 22,659 8,430 12,832 1,126 1,603 737 1,219 3,7072003 21,886 8,386 12,579 1,098 1,522 721 1,233 3,5972004 22,690 8,615 12,738 1,097 1,504 755 1,169 3,3622005 23,407 8,732 12,934 1,127 1,417 692 1,189 3,5292006 24,143 9,062 12,890 1,105 1,492 819 1,271 3,7082007 24,606 9,573 12,881 1,125 1,370 743 1,257 3,8122008 25,280 9,768 13,011 1,137 1,367 704 1,308 3,970
6

Annual Average Covered Employment by County(1985-2008)
Hughes Jackson Jefferson Johnston Kay Kingfisher Kiowa Latimer
1985 2,206 6,422 1,421 1,877 18,862 4,509 2,372 2,2581986 2,058 6,440 1,232 1,793 18,340 4,181 2,383 2,2411987 2,036 6,305 1,255 1,807 18,257 4,094 2,405 2,4201988 2,078 6,227 1,261 1,768 18,971 4,178 2,383 2,6671989 2,118 6,342 1,314 1,757 19,130 4,220 2,459 2,7691990 2,176 6,299 1,253 1,915 19,373 4,263 2,467 2,7691991 2,266 7,195 1,346 1,951 20,252 4,512 2,562 3,3171992 2,306 7,336 1,504 2,176 20,517 4,463 2,622 3,1191993 2,396 7,867 1,562 2,352 20,075 4,648 2,671 3,0721994 2,488 8,156 1,631 2,508 19,719 4,977 2,690 3,3441995 2,590 8,477 1,693 2,589 20,063 5,318 2,687 3,5891996 2,622 8,923 1,697 2,461 18,560 4,898 2,602 3,9271997 2,799 9,843 1,816 2,500 20,426 5,658 2,720 4,0331998 2,926 10,162 1,773 2,676 20,615 5,851 2,845 3,7381999 2,907 10,280 1,698 2,856 20,043 5,324 2,877 4,1002000 3,208 10,367 1,648 2,932 20,314 5,194 3,013 4,4272001 2,987 10,429 1,431 2,877 21,273 5,275 2,963 4,7252002 2,914 10,457 1,288 2,823 20,896 5,206 2,949 3,7712003 2,801 10,745 1,212 2,979 19,461 5,196 2,695 3,6852004 2,883 10,811 1,216 2,713 19,691 5,339 2,645 3,8742005 2,830 10,663 1,128 2,825 18,906 5,438 2,424 3,7172006 2,845 10,907 1,249 3,078 20,185 5,903 2,429 3,8692007 2,576 10,807 1,179 3,078 20,941 6,098 2,399 3,8942008 2,670 10,457 1,155 3,048 21,672 6,161 2,381 4,431
Le Flore Lincoln Logan Love McClain McCurtain McIntosh Major
1985 5,729 4,502 4,951 1,413 3,436 8,006 2,548 1,8771986 5,968 4,211 4,662 1,447 3,263 7,979 2,512 1,6671987 6,261 4,129 4,602 1,498 3,226 8,223 2,703 1,6521988 6,706 4,507 5,008 1,529 3,598 8,601 2,991 1,6721989 8,315 4,712 5,113 1,618 3,575 8,819 3,225 1,7641990 8,405 5,127 5,238 1,877 3,762 9,116 3,228 1,7911991 8,082 5,519 5,332 1,921 4,306 9,222 3,131 1,8881992 8,412 5,777 5,320 1,969 4,551 9,892 3,253 1,9111993 9,029 6,179 5,632 1,914 4,756 9,955 3,522 1,9141994 9,667 6,199 5,888 1,863 5,130 10,303 3,704 1,9811995 10,165 6,397 5,906 1,847 5,300 10,386 3,839 2,0981996 10,318 6,365 6,107 1,420 5,259 10,370 3,920 2,1491997 10,440 6,327 6,143 1,819 5,441 10,601 3,999 2,2301998 10,753 6,283 6,348 1,818 5,550 10,960 3,959 2,2131999 11,112 6,421 6,440 1,482 5,850 11,305 4,110 2,1552000 10,744 6,447 6,672 1,941 5,802 11,405 4,004 2,1412001 10,845 6,659 6,520 1,894 6,131 11,975 4,066 2,0052002 10,982 6,384 6,593 1,995 6,218 11,218 3,966 2,0982003 10,956 5,800 6,485 2,253 6,037 10,462 4,005 2,0552004 11,351 6,356 6,563 2,161 6,301 10,810 4,294 2,0412005 11,921 6,676 6,533 2,436 6,703 10,856 4,359 2,0292006 12,767 7,079 6,694 3,370 7,223 10,931 4,257 2,2602007 13,796 7,142 6,794 3,554 7,541 10,510 4,343 2,2952008 13,671 7,704 6,854 3,744 7,810 10,393 4,377 2,464
7

Annual Average Covered Employment by County(1985-2008)
Marshall Mayes Murray Muskogee Noble Nowata Okfuskee Oklahoma
1985 2,562 7,708 3,202 22,208 3,615 1,664 2,223 311,2181986 2,370 7,519 3,003 21,943 3,467 1,604 2,098 296,3831987 2,347 7,695 3,011 21,668 3,192 1,659 2,029 289,9891988 2,518 8,251 3,288 22,170 3,352 1,638 2,071 298,4311989 2,681 8,447 3,077 22,240 3,437 1,527 2,088 305,8541990 2,888 8,973 3,030 22,889 3,498 1,712 2,276 312,1231991 2,977 9,171 3,405 24,213 3,664 1,853 2,324 337,4371992 3,200 8,917 3,336 24,227 3,471 1,870 2,416 342,2711993 3,334 9,178 3,386 24,963 3,547 1,898 2,356 347,5821994 3,534 9,696 3,401 25,146 3,919 1,858 2,367 357,0301995 3,624 10,295 3,609 25,347 3,889 1,822 2,403 365,5341996 3,561 10,711 3,622 26,644 2,642 1,812 2,450 377,3651997 3,701 9,917 3,690 27,924 4,118 1,956 2,648 383,0741998 3,760 10,478 3,706 29,414 4,294 1,974 2,441 393,5351999 3,971 11,292 3,551 30,111 4,200 1,854 2,177 403,2492000 4,001 11,954 3,674 29,930 4,355 1,855 2,320 414,2392001 3,908 11,693 3,636 29,937 4,060 1,843 2,478 415,5072002 3,966 10,286 3,557 30,669 3,881 1,869 2,479 407,4032003 3,981 9,803 3,577 28,462 3,760 1,816 2,210 399,3912004 4,169 10,040 3,980 28,493 3,704 1,855 2,192 404,8752005 4,093 10,530 4,454 29,792 3,643 1,864 2,221 411,6002006 4,307 11,185 5,088 29,828 4,290 1,788 2,282 419,9252007 4,269 11,767 5,185 29,392 4,360 1,818 2,356 420,3352008 4,333 11,797 5,385 29,297 4,215 1,825 2,317 424,479
Okmulgee Osage Ottawa Pawnee Payne Pittsburg Pontotoc Pottawatoimie
1985 8,981 6,387 9,665 2,641 24,160 9,762 11,085 15,2041986 8,734 5,856 8,118 2,549 23,783 10,209 11,051 14,9431987 8,403 5,584 8,252 2,460 23,432 10,136 10,721 14,6401988 8,294 5,589 8,237 2,612 24,057 10,161 10,972 15,0081989 7,636 5,566 8,420 2,671 25,649 10,227 10,868 15,8501990 7,853 5,598 8,612 2,931 26,251 10,513 11,326 15,6411991 8,200 5,599 8,732 2,751 27,123 12,216 11,979 16,0911992 8,415 5,348 8,663 2,715 28,176 12,066 11,960 16,3741993 8,530 5,887 9,067 2,715 28,895 12,578 12,442 16,7701994 8,863 6,018 9,090 2,736 29,744 12,544 12,604 17,2571995 8,723 6,073 9,436 2,769 30,949 12,766 12,910 17,9501996 8,878 6,060 8,980 2,915 31,991 12,956 13,218 18,0031997 8,936 6,225 9,615 2,898 32,420 13,420 14,043 18,9011998 9,135 6,472 9,529 2,830 32,977 13,198 14,208 19,2991999 9,109 6,138 9,910 2,978 34,871 13,761 14,654 19,6752000 9,248 6,026 10,436 3,209 35,580 13,739 15,072 20,0272001 9,274 5,304 10,232 3,416 34,247 13,946 15,011 19,4682002 9,404 5,456 9,694 3,408 33,497 14,141 14,916 19,0992003 9,545 5,605 9,560 3,397 33,075 14,729 15,742 18,8392004 9,548 5,760 10,192 3,534 32,934 15,094 15,500 19,3062005 9,839 5,885 10,897 3,372 30,664 15,839 16,842 20,0062006 9,994 6,129 11,347 3,377 34,265 16,873 18,299 20,6942007 10,331 6,399 11,310 3,405 35,955 17,614 17,884 21,6042008 10,571 6,364 11,831 3,526 32,535 18,426 17,914 21,525
8
Annual Average Covered Employment by County(1985-2008)
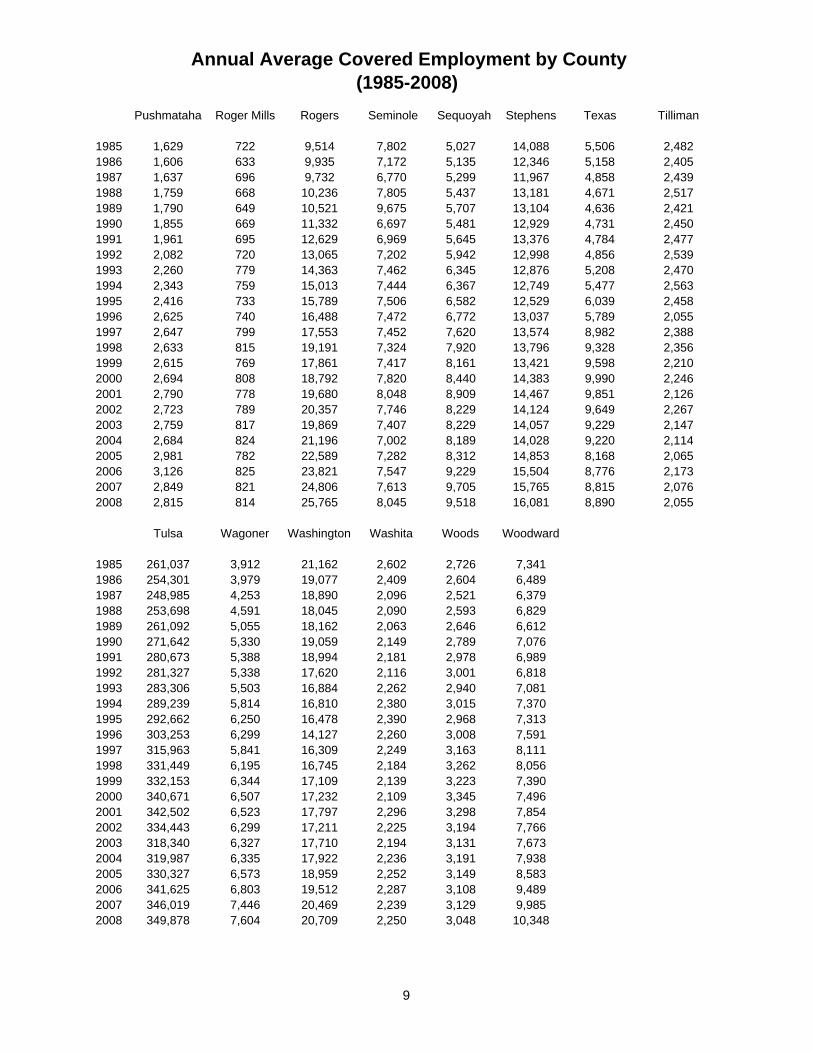
Pushmataha Roger Mills Rogers Seminole Sequoyah Stephens Texas Tilliman
1985 1,629 722 9,514 7,802 5,027 14,088 5,506 2,4821986 1,606 633 9,935 7,172 5,135 12,346 5,158 2,4051987 1,637 696 9,732 6,770 5,299 11,967 4,858 2,4391988 1,759 668 10,236 7,805 5,437 13,181 4,671 2,5171989 1,790 649 10,521 9,675 5,707 13,104 4,636 2,4211990 1,855 669 11,332 6,697 5,481 12,929 4,731 2,4501991 1,961 695 12,629 6,969 5,645 13,376 4,784 2,4771992 2,082 720 13,065 7,202 5,942 12,998 4,856 2,5391993 2,260 779 14,363 7,462 6,345 12,876 5,208 2,4701994 2,343 759 15,013 7,444 6,367 12,749 5,477 2,5631995 2,416 733 15,789 7,506 6,582 12,529 6,039 2,4581996 2,625 740 16,488 7,472 6,772 13,037 5,789 2,0551997 2,647 799 17,553 7,452 7,620 13,574 8,982 2,3881998 2,633 815 19,191 7,324 7,920 13,796 9,328 2,3561999 2,615 769 17,861 7,417 8,161 13,421 9,598 2,2102000 2,694 808 18,792 7,820 8,440 14,383 9,990 2,2462001 2,790 778 19,680 8,048 8,909 14,467 9,851 2,1262002 2,723 789 20,357 7,746 8,229 14,124 9,649 2,2672003 2,759 817 19,869 7,407 8,229 14,057 9,229 2,1472004 2,684 824 21,196 7,002 8,189 14,028 9,220 2,1142005 2,981 782 22,589 7,282 8,312 14,853 8,168 2,0652006 3,126 825 23,821 7,547 9,229 15,504 8,776 2,1732007 2,849 821 24,806 7,613 9,705 15,765 8,815 2,0762008 2,815 814 25,765 8,045 9,518 16,081 8,890 2,055
Tulsa Wagoner Washington Washita Woods Woodward
1985 261,037 3,912 21,162 2,602 2,726 7,3411986 254,301 3,979 19,077 2,409 2,604 6,4891987 248,985 4,253 18,890 2,096 2,521 6,3791988 253,698 4,591 18,045 2,090 2,593 6,8291989 261,092 5,055 18,162 2,063 2,646 6,6121990 271,642 5,330 19,059 2,149 2,789 7,0761991 280,673 5,388 18,994 2,181 2,978 6,9891992 281,327 5,338 17,620 2,116 3,001 6,8181993 283,306 5,503 16,884 2,262 2,940 7,0811994 289,239 5,814 16,810 2,380 3,015 7,3701995 292,662 6,250 16,478 2,390 2,968 7,3131996 303,253 6,299 14,127 2,260 3,008 7,5911997 315,963 5,841 16,309 2,249 3,163 8,1111998 331,449 6,195 16,745 2,184 3,262 8,0561999 332,153 6,344 17,109 2,139 3,223 7,3902000 340,671 6,507 17,232 2,109 3,345 7,4962001 342,502 6,523 17,797 2,296 3,298 7,8542002 334,443 6,299 17,211 2,225 3,194 7,7662003 318,340 6,327 17,710 2,194 3,131 7,6732004 319,987 6,335 17,922 2,236 3,191 7,9382005 330,327 6,573 18,959 2,252 3,149 8,5832006 341,625 6,803 19,512 2,287 3,108 9,4892007 346,019 7,446 20,469 2,239 3,129 9,9852008 349,878 7,604 20,709 2,250 3,048 10,348
9
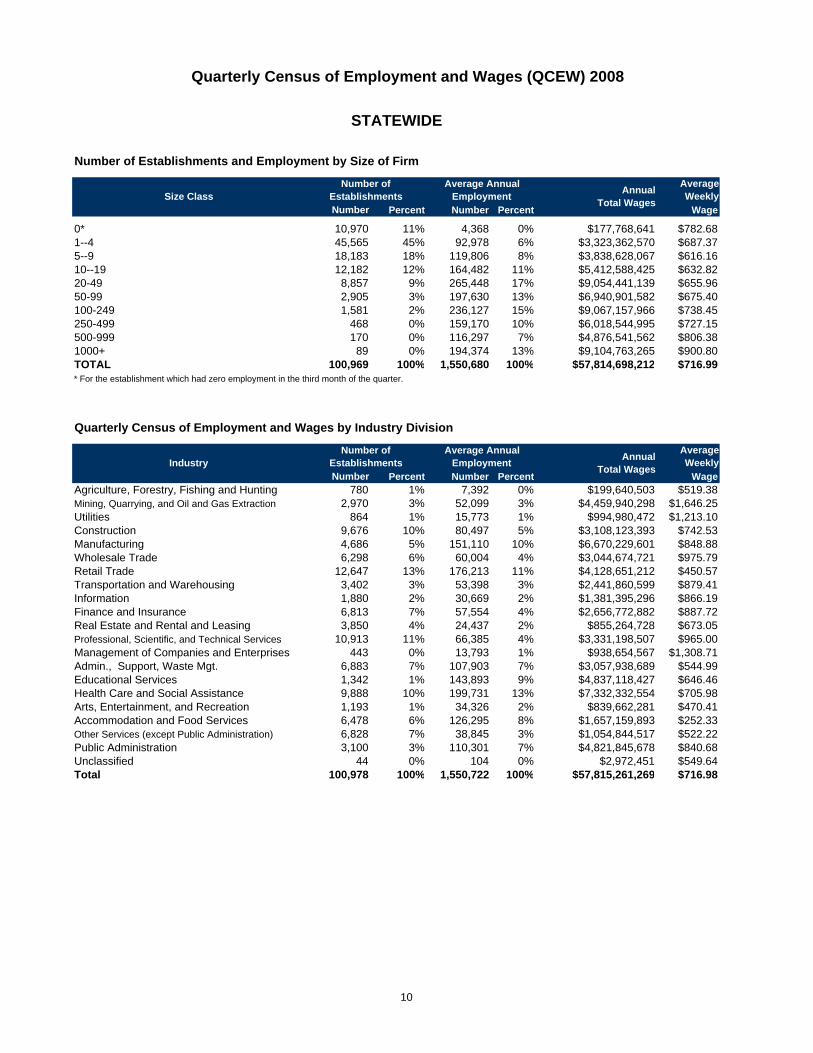
Quarterly Census of Employment and Wages (QCEW) 2008
AverageWeekly
Number Percent Number Percent Wage
0* 10,970 11% 4,368 0% $177,768,641 $782.681--4 45,565 45% 92,978 6% $3,323,362,570 $687.375--9 18,183 18% 119,806 8% $3,838,628,067 $616.1610--19 12,182 12% 164,482 11% $5,412,588,425 $632.8220-49 8,857 9% 265,448 17% $9,054,441,139 $655.9650-99 2,905 3% 197,630 13% $6,940,901,582 $675.40100-249 1,581 2% 236,127 15% $9,067,157,966 $738.45250-499 468 0% 159,170 10% $6,018,544,995 $727.15500-999 170 0% 116,297 7% $4,876,541,562 $806.381000+ 89 0% 194,374 13% $9,104,763,265 $900.80TOTAL 100,969 100% 1,550,680 100% $57,814,698,212 $716.99* For the establishment which had zero employment in the third month of the quarter.
AverageWeekly
Number Percent Number Percent WageAgriculture, Forestry, Fishing and Hunting 780 1% 7,392 0% $199,640,503 $519.38Mining, Quarrying, and Oil and Gas Extraction 2,970 3% 52,099 3% $4,459,940,298 $1,646.25Utilities 864 1% 15,773 1% $994,980,472 $1,213.10Construction 9,676 10% 80,497 5% $3,108,123,393 $742.53Manufacturing 4,686 5% 151,110 10% $6,670,229,601 $848.88Wholesale Trade 6,298 6% 60,004 4% $3,044,674,721 $975.79Retail Trade 12,647 13% 176,213 11% $4,128,651,212 $450.57Transportation and Warehousing 3,402 3% 53,398 3% $2,441,860,599 $879.41Information 1,880 2% 30,669 2% $1,381,395,296 $866.19Finance and Insurance 6,813 7% 57,554 4% $2,656,772,882 $887.72Real Estate and Rental and Leasing 3,850 4% 24,437 2% $855,264,728 $673.05Professional, Scientific, and Technical Services 10,913 11% 66,385 4% $3,331,198,507 $965.00Management of Companies and Enterprises 443 0% 13,793 1% $938,654,567 $1,308.71Admin., Support, Waste Mgt. 6,883 7% 107,903 7% $3,057,938,689 $544.99Educational Services 1,342 1% 143,893 9% $4,837,118,427 $646.46Health Care and Social Assistance 9,888 10% 199,731 13% $7,332,332,554 $705.98Arts, Entertainment, and Recreation 1,193 1% 34,326 2% $839,662,281 $470.41Accommodation and Food Services 6,478 6% 126,295 8% $1,657,159,893 $252.33Other Services (except Public Administration) 6,828 7% 38,845 3% $1,054,844,517 $522.22Public Administration 3,100 3% 110,301 7% $4,821,845,678 $840.68Unclassified 44 0% 104 0% $2,972,451 $549.64Total 100,978 100% 1,550,722 100% $57,815,261,269 $716.98
STATEWIDE
Number of Establishments and Employment by Size of Firm
Size ClassNumber of
EstablishmentsAverage Annual
Employment AnnualTotal Wages
Quarterly Census of Employment and Wages by Industry Division
IndustryNumber of
EstablishmentsAverage Annual
Employment AnnualTotal Wages
10
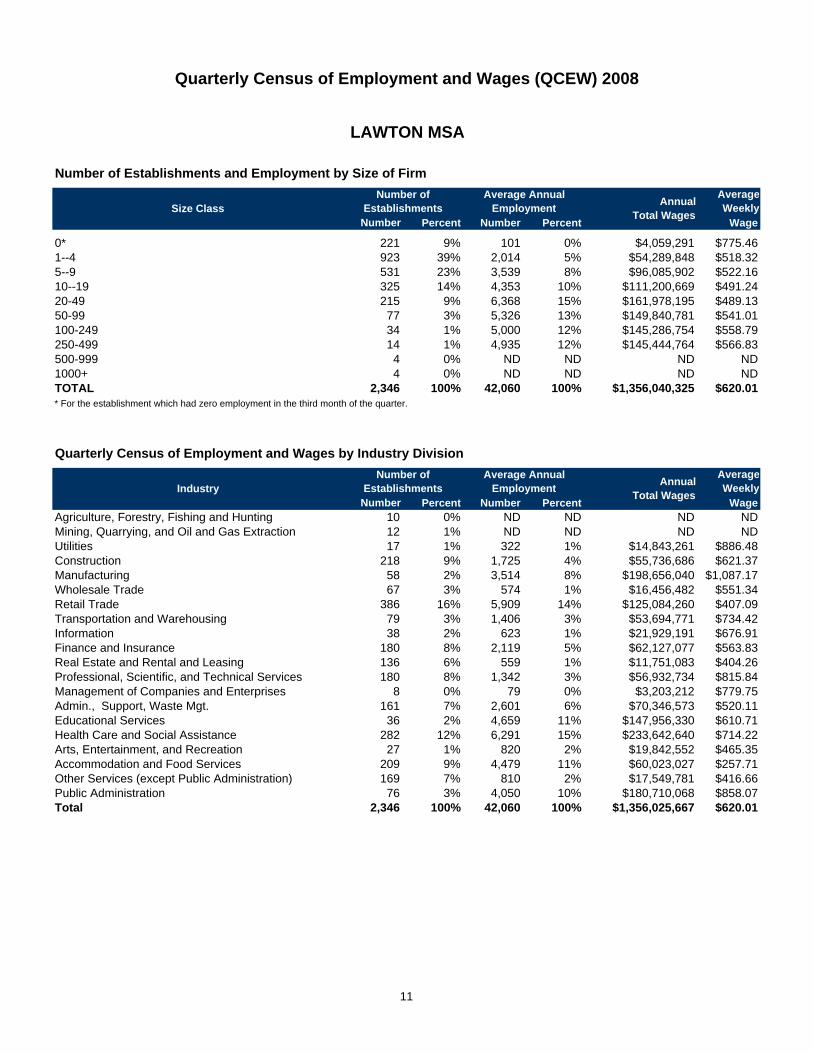
Quarterly Census of Employment and Wages (QCEW) 2008
AverageWeekly
Number Percent Number Percent Wage
0* 221 9% 101 0% $4,059,291 $775.461--4 923 39% 2,014 5% $54,289,848 $518.325--9 531 23% 3,539 8% $96,085,902 $522.1610--19 325 14% 4,353 10% $111,200,669 $491.2420-49 215 9% 6,368 15% $161,978,195 $489.1350-99 77 3% 5,326 13% $149,840,781 $541.01100-249 34 1% 5,000 12% $145,286,754 $558.79250-499 14 1% 4,935 12% $145,444,764 $566.83500-999 4 0% ND ND ND ND1000+ 4 0% ND ND ND NDTOTAL 2,346 100% 42,060 100% $1,356,040,325 $620.01* For the establishment which had zero employment in the third month of the quarter.
AverageWeekly
Number Percent Number Percent WageAgriculture, Forestry, Fishing and Hunting 10 0% ND ND ND NDMining, Quarrying, and Oil and Gas Extraction 12 1% ND ND ND NDUtilities 17 1% 322 1% $14,843,261 $886.48Construction 218 9% 1,725 4% $55,736,686 $621.37Manufacturing 58 2% 3,514 8% $198,656,040 $1,087.17Wholesale Trade 67 3% 574 1% $16,456,482 $551.34Retail Trade 386 16% 5,909 14% $125,084,260 $407.09Transportation and Warehousing 79 3% 1,406 3% $53,694,771 $734.42Information 38 2% 623 1% $21,929,191 $676.91Finance and Insurance 180 8% 2,119 5% $62,127,077 $563.83Real Estate and Rental and Leasing 136 6% 559 1% $11,751,083 $404.26Professional, Scientific, and Technical Services 180 8% 1,342 3% $56,932,734 $815.84Management of Companies and Enterprises 8 0% 79 0% $3,203,212 $779.75Admin., Support, Waste Mgt. 161 7% 2,601 6% $70,346,573 $520.11Educational Services 36 2% 4,659 11% $147,956,330 $610.71Health Care and Social Assistance 282 12% 6,291 15% $233,642,640 $714.22Arts, Entertainment, and Recreation 27 1% 820 2% $19,842,552 $465.35Accommodation and Food Services 209 9% 4,479 11% $60,023,027 $257.71Other Services (except Public Administration) 169 7% 810 2% $17,549,781 $416.66Public Administration 76 3% 4,050 10% $180,710,068 $858.07Total 2,346 100% 42,060 100% $1,356,025,667 $620.01
Quarterly Census of Employment and Wages by Industry Division
IndustryNumber of
EstablishmentsAverage Annual
Employment AnnualTotal Wages
LAWTON MSA
Number of Establishments and Employment by Size of Firm
Size ClassNumber of
EstablishmentsAverage Annual
Employment AnnualTotal Wages
11
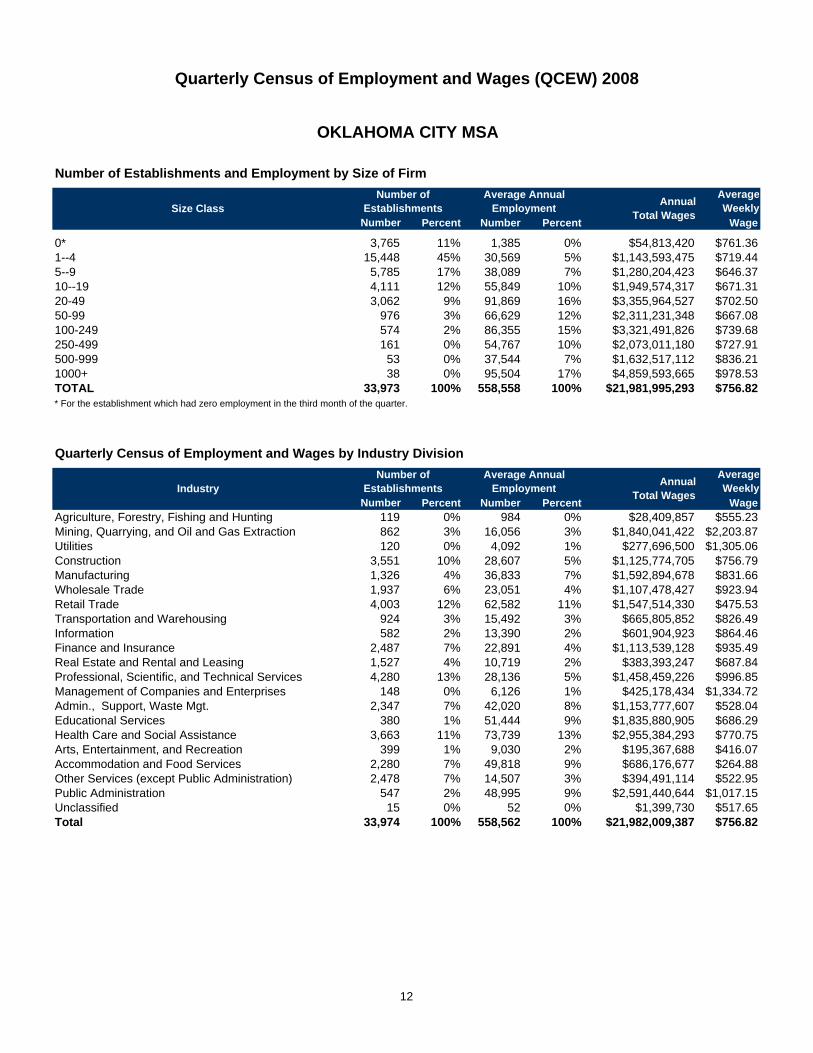
Quarterly Census of Employment and Wages (QCEW) 2008
AverageWeekly
Number Percent Number Percent Wage
0* 3,765 11% 1,385 0% $54,813,420 $761.361--4 15,448 45% 30,569 5% $1,143,593,475 $719.445--9 5,785 17% 38,089 7% $1,280,204,423 $646.3710--19 4,111 12% 55,849 10% $1,949,574,317 $671.3120-49 3,062 9% 91,869 16% $3,355,964,527 $702.5050-99 976 3% 66,629 12% $2,311,231,348 $667.08100-249 574 2% 86,355 15% $3,321,491,826 $739.68250-499 161 0% 54,767 10% $2,073,011,180 $727.91500-999 53 0% 37,544 7% $1,632,517,112 $836.211000+ 38 0% 95,504 17% $4,859,593,665 $978.53TOTAL 33,973 100% 558,558 100% $21,981,995,293 $756.82* For the establishment which had zero employment in the third month of the quarter.
AverageWeekly
Number Percent Number Percent WageAgriculture, Forestry, Fishing and Hunting 119 0% 984 0% $28,409,857 $555.23Mining, Quarrying, and Oil and Gas Extraction 862 3% 16,056 3% $1,840,041,422 $2,203.87Utilities 120 0% 4,092 1% $277,696,500 $1,305.06Construction 3,551 10% 28,607 5% $1,125,774,705 $756.79Manufacturing 1,326 4% 36,833 7% $1,592,894,678 $831.66Wholesale Trade 1,937 6% 23,051 4% $1,107,478,427 $923.94Retail Trade 4,003 12% 62,582 11% $1,547,514,330 $475.53Transportation and Warehousing 924 3% 15,492 3% $665,805,852 $826.49Information 582 2% 13,390 2% $601,904,923 $864.46Finance and Insurance 2,487 7% 22,891 4% $1,113,539,128 $935.49Real Estate and Rental and Leasing 1,527 4% 10,719 2% $383,393,247 $687.84Professional, Scientific, and Technical Services 4,280 13% 28,136 5% $1,458,459,226 $996.85Management of Companies and Enterprises 148 0% 6,126 1% $425,178,434 $1,334.72Admin., Support, Waste Mgt. 2,347 7% 42,020 8% $1,153,777,607 $528.04Educational Services 380 1% 51,444 9% $1,835,880,905 $686.29Health Care and Social Assistance 3,663 11% 73,739 13% $2,955,384,293 $770.75Arts, Entertainment, and Recreation 399 1% 9,030 2% $195,367,688 $416.07Accommodation and Food Services 2,280 7% 49,818 9% $686,176,677 $264.88Other Services (except Public Administration) 2,478 7% 14,507 3% $394,491,114 $522.95Public Administration 547 2% 48,995 9% $2,591,440,644 $1,017.15Unclassified 15 0% 52 0% $1,399,730 $517.65Total 33,974 100% 558,562 100% $21,982,009,387 $756.82
Quarterly Census of Employment and Wages by Industry Division
IndustryNumber of
EstablishmentsAverage Annual
Employment AnnualTotal Wages
OKLAHOMA CITY MSA
Number of Establishments and Employment by Size of Firm
Size ClassNumber of
EstablishmentsAverage Annual
Employment AnnualTotal Wages
12

Quarterly Census of Employment and Wages (QCEW) 2008
AverageWeekly
Number Percent Number Percent Wage
0* 2,576 10% 1,117 0% $52,840,629 $909.801--4 10,995 44% 22,420 5% $840,406,642 $720.865--9 4,468 18% 29,416 7% $1,052,708,220 $688.2210--19 3,108 12% 42,073 10% $1,496,991,672 $684.2420-49 2,299 9% 68,869 16% $2,575,657,535 $719.2250-99 763 3% 51,825 12% $2,065,138,064 $766.32100-249 471 2% 69,838 17% $2,995,385,323 $824.82250-499 137 1% 46,755 11% $2,032,828,287 $836.12500-999 53 0% 35,822 9% $1,676,112,765 $899.811000+ 26 0% 53,244 13% $2,157,562,177 $779.27TOTAL 24,895 100% 421,378 100% $16,945,631,314 $773.36* For the establishment which had zero employment in the third month of the quarter.
AverageWeekly
Number Percent Number Percent WageAgriculture, Forestry, Fishing and Hunting 79 0% 642 0% $16,533,465 $495.25Mining, Quarrying, and Oil and Gas Extraction 579 2% 7,221 2% $669,862,787 $1,783.96Utilities 170 1% 4,748 1% $381,705,739 $1,546.02Construction 2,490 10% 23,837 6% $977,127,882 $788.31Manufacturing 1,598 6% 52,923 13% $2,625,512,539 $954.04Wholesale Trade 1,614 6% 17,667 4% $1,037,754,854 $1,129.61Retail Trade 2,923 12% 45,666 11% $1,109,094,543 $467.06Transportation and Warehousing 664 3% 20,854 5% $1,075,788,874 $992.05Information 480 2% 10,322 2% $520,002,425 $968.81Finance and Insurance 1,641 7% 16,387 4% $864,989,340 $1,015.10Real Estate and Rental and Leasing 1,055 4% 7,922 2% $298,748,917 $725.22Professional, Scientific, and Technical Services 3,037 12% 20,587 5% $1,137,734,329 $1,062.78Management of Companies and Enterprises 138 1% 5,984 1% $437,459,925 $1,405.86Admin., Support, Waste Mgt. 1,691 7% 37,540 9% $1,117,734,322 $572.59Educational Services 273 1% 30,837 7% $1,016,117,126 $633.68Health Care and Social Assistance 2,358 9% 51,588 12% $2,070,916,750 $771.99Arts, Entertainment, and Recreation 296 1% 6,803 2% $184,216,371 $520.74Accommodation and Food Services 1,602 6% 33,244 8% $453,787,163 $262.50Other Services (except Public Administration) 1,846 7% 11,039 3% $315,938,963 $550.39Public Administration 360 1% 15,556 4% $634,324,298 $784.17Unclassified 4 0% 10 0% $173,634 $333.91Total 24,894 100% 421,376 100% $16,945,524,246 $773.36
Quarterly Census of Employment and Wages by Industry Division
IndustryNumber of
EstablishmentsAverage Annual
Employment AnnualTotal Wages
TULSA MSA
Number of Establishments and Employment by Size of Firm
Size ClassNumber of
EstablishmentsAverage Annual
Employment AnnualTotal Wages
13
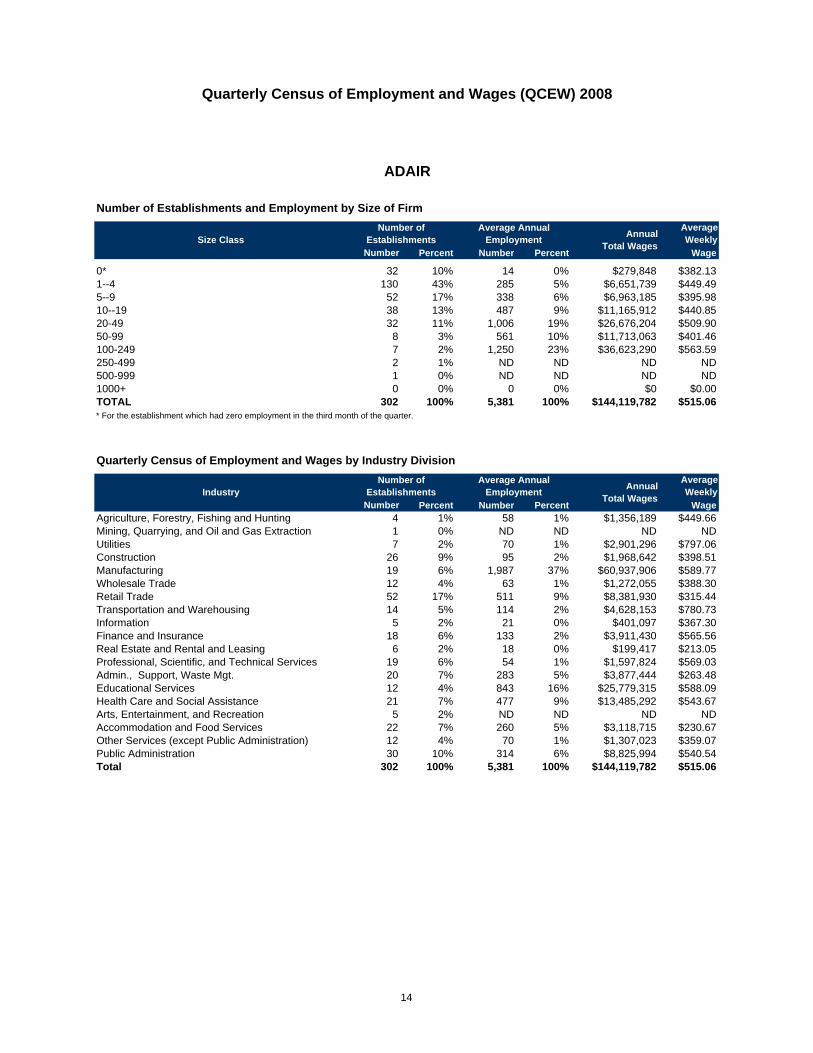
Quarterly Census of Employment and Wages (QCEW) 2008
AverageWeekly
Number Percent Number Percent Wage
0* 32 10% 14 0% $279,848 $382.131--4 130 43% 285 5% $6,651,739 $449.495--9 52 17% 338 6% $6,963,185 $395.9810--19 38 13% 487 9% $11,165,912 $440.8520-49 32 11% 1,006 19% $26,676,204 $509.9050-99 8 3% 561 10% $11,713,063 $401.46100-249 7 2% 1,250 23% $36,623,290 $563.59250-499 2 1% ND ND ND ND500-999 1 0% ND ND ND ND1000+ 0 0% 0 0% $0 $0.00TOTAL 302 100% 5,381 100% $144,119,782 $515.06* For the establishment which had zero employment in the third month of the quarter.
AverageWeekly
Number Percent Number Percent WageAgriculture, Forestry, Fishing and Hunting 4 1% 58 1% $1,356,189 $449.66Mining, Quarrying, and Oil and Gas Extraction 1 0% ND ND ND NDUtilities 7 2% 70 1% $2,901,296 $797.06Construction 26 9% 95 2% $1,968,642 $398.51Manufacturing 19 6% 1,987 37% $60,937,906 $589.77Wholesale Trade 12 4% 63 1% $1,272,055 $388.30Retail Trade 52 17% 511 9% $8,381,930 $315.44Transportation and Warehousing 14 5% 114 2% $4,628,153 $780.73Information 5 2% 21 0% $401,097 $367.30Finance and Insurance 18 6% 133 2% $3,911,430 $565.56Real Estate and Rental and Leasing 6 2% 18 0% $199,417 $213.05Professional, Scientific, and Technical Services 19 6% 54 1% $1,597,824 $569.03Admin., Support, Waste Mgt. 20 7% 283 5% $3,877,444 $263.48Educational Services 12 4% 843 16% $25,779,315 $588.09Health Care and Social Assistance 21 7% 477 9% $13,485,292 $543.67Arts, Entertainment, and Recreation 5 2% ND ND ND NDAccommodation and Food Services 22 7% 260 5% $3,118,715 $230.67Other Services (except Public Administration) 12 4% 70 1% $1,307,023 $359.07Public Administration 30 10% 314 6% $8,825,994 $540.54Total 302 100% 5,381 100% $144,119,782 $515.06
ADAIR
Number of Establishments and Employment by Size of Firm
Size ClassNumber of
EstablishmentsAverage Annual
Employment AnnualTotal Wages
Quarterly Census of Employment and Wages by Industry Division
IndustryNumber of
EstablishmentsAverage Annual
Employment AnnualTotal Wages
14

Quarterly Census of Employment and Wages (QCEW) 2008
AverageWeekly
Number Percent Number Percent Wage
0* 12 8% ND ND ND ND1--4 70 47% 156 12% $3,661,238 $450.855--9 33 22% 225 18% $5,496,517 $469.6110--19 19 12% 240 19% $5,643,686 $451.4320-49 14 9% 396 31% $9,564,395 $463.9850-99 4 3% ND ND ND ND100-249 0 0% 0 0% $0 $0.00250-499 0 0% 0 0% $0 $0.00500-999 0 0% 0 0% $0 $0.001000+ 0 0% 0 0% $0 $0.00TOTAL 151 100% 1,262 100% $33,044,761 $503.55* For the establishment which had zero employment in the third month of the quarter.
AverageWeekly
Number Percent Number Percent WageAgriculture, Forestry, Fishing and Hunting 2 1% ND ND ND NDMining, Quarrying, and Oil and Gas Extraction 5 3% 21 2% $638,043 $584.29Utilities 3 2% ND ND ND NDConstruction 12 8% 75 6% $2,946,572 $755.53Manufacturing 4 3% 48 4% $1,184,462 $474.54Wholesale Trade 16 11% 112 9% $2,536,157 $435.47Retail Trade 17 11% 156 12% $3,326,145 $410.03Transportation and Warehousing 12 8% 33 3% $934,734 $544.72Information 2 1% ND ND ND NDFinance and Insurance 13 9% 72 6% $2,053,798 $548.56Real Estate and Rental and Leasing 2 1% ND ND ND NDProfessional, Scientific, and Technical Services 7 5% 30 2% $799,460 $512.47Admin., Support, Waste Mgt. 1 1% ND ND ND NDEducational Services 4 3% 166 13% $4,931,093 $571.26Health Care and Social Assistance 9 6% 121 10% $2,443,007 $388.27Accommodation and Food Services 9 6% 54 4% $463,573 $165.09Other Services (except Public Administration) 8 5% 37 3% $732,592 $380.77Public Administration 24 16% 250 20% $6,936,970 $533.61Total 151 100% 1,262 100% $33,044,761 $503.55
ALFALFA
Number of Establishments and Employment by Size of Firm
Size ClassNumber of
EstablishmentsAverage Annual
Employment AnnualTotal Wages
Quarterly Census of Employment and Wages by Industry Division
IndustryNumber of
EstablishmentsAverage Annual
Employment AnnualTotal Wages
15

Quarterly Census of Employment and Wages (QCEW) 2008
AverageWeekly
Number Percent Number Percent Wage
0* 36 12% 27 1% $620,008 $445.731--4 128 44% 287 8% $7,875,873 $527.585--9 49 17% 321 9% $7,836,402 $469.1110--19 31 11% 411 12% $9,612,226 $449.4820-49 30 10% 923 27% $23,581,885 $491.2050-99 11 4% 742 22% $15,636,991 $405.32100-249 3 1% ND ND ND ND250-499 1 0% ND ND ND ND500-999 0 0% 0 0% $0 $0.001000+ 0 0% 0 0% $0 $0.00TOTAL 290 100% 3,437 100% $90,098,110 $504.12* For the establishment which had zero employment in the third month of the quarter.
AverageWeekly
Number Percent Number Percent WageAgriculture, Forestry, Fishing and Hunting 2 1% ND ND ND NDMining, Quarrying, and Oil and Gas Extraction 6 2% 163 5% $5,925,448 $699.09Utilities 6 2% 22 1% $964,086 $842.73Construction 21 7% 77 2% $1,612,549 $402.73Manufacturing 14 5% 150 4% $4,112,274 $527.21Wholesale Trade 12 4% 66 2% $2,465,022 $718.25Retail Trade 50 17% 500 15% $10,082,835 $387.80Transportation and Warehousing 25 9% 141 4% $3,630,315 $495.13Information 5 2% 40 1% $1,421,360 $683.35Finance and Insurance 15 5% 113 3% $4,122,355 $701.56Real Estate and Rental and Leasing 6 2% 19 1% $285,181 $288.64Professional, Scientific, and Technical Services 10 3% 36 1% $846,525 $452.20Admin., Support, Waste Mgt. 10 3% 19 1% $504,599 $510.73Educational Services 10 3% 429 12% $12,710,600 $569.78Health Care and Social Assistance 24 8% 363 11% $8,618,065 $456.56Arts, Entertainment, and Recreation 4 1% ND ND ND NDAccommodation and Food Services 22 8% 356 10% $3,541,133 $191.29Other Services (except Public Administration) 22 8% 139 4% $2,553,407 $353.27Public Administration 25 9% 707 21% $24,480,128 $665.87Total 290 100% 3,437 100% $90,098,110 $504.12
ATOKA
Number of Establishments and Employment by Size of Firm
Size ClassNumber of
EstablishmentsAverage Annual
Employment AnnualTotal Wages
Quarterly Census of Employment and Wages by Industry Division
IndustryNumber of
EstablishmentsAverage Annual
Employment AnnualTotal Wages
16

Quarterly Census of Employment and Wages (QCEW) 2008
AverageWeekly
Number Percent Number Percent Wage
0* 8 5% ND ND ND ND1--4 97 55% 193 13% $5,601,616 $558.155--9 30 17% 194 13% $5,031,786 $498.3610--19 21 12% 279 18% $8,583,135 $590.9120-49 14 8% 449 30% $17,087,987 $732.5650-99 6 4% 401 26% 3,210,680 $616.41100-249 0 0% ND ND ND ND250-499 0 0% 0 0% $0 $0.00500-999 0 0% 0 0% $0 $0.001000+ 0 0% 0 0% $0 $0.00TOTAL 176 100% 1,514 100% $47,637,336 $605.09
* For the establishment which had zero employment in the third month of the quarter.
AverageWeekly
Number Percent Number Percent WageAgriculture, Forestry, Fishing and Hunting 13 7% 87 6% $2,852,950 $630.63Mining, Quarrying, and Oil and Gas Extraction 26 15% 272 18% $11,479,711 $811.63Utilities 2 1% ND ND ND NDConstruction 14 8% 156 10% $5,338,216 $658.06Manufacturing 5 3% 56 4% $2,449,826 $841.29Wholesale Trade 5 3% 24 2% $908,385 $727.87Retail Trade 16 9% 100 7% $1,681,494 $323.36Transportation and Warehousing 11 6% 49 3% $1,786,361 $701.08Information 4 2% 7 0% $198,757 $546.04Finance and Insurance 11 6% 61 4% $1,725,217 $543.89Real Estate and Rental and Leasing 3 2% 21 1% $961,962 $880.92Professional, Scientific, and Technical Services 13 7% 27 2% $777,264 $553.61Admin., Support, Waste Mgt. 3 2% 76 5% $1,272,544 $322.00Educational Services 4 2% 212 14% $6,823,290 $618.95Health Care and Social Assistance 6 3% 132 9% $3,112,028 $453.38Arts, Entertainment, and Recreation 2 1% ND ND ND NDAccommodation and Food Services 6 3% 46 3% $362,591 $151.58Other Services (except Public Administration) 13 7% 34 2% $852,265 $482.05Public Administration 19 11% 110 7% $3,001,345 $524.71Total 176 100% 1,514 100% $47,637,336 $605.09
BEAVER
Number of Establishments and Employment by Size of Firm
Size ClassNumber of
EstablishmentsAverage Annual
Employment AnnualTotal Wages
Quarterly Census of Employment and Wages by Industry Division
IndustryNumber of
EstablishmentsAverage Annual
Employment AnnualTotal Wages
17

Quarterly Census of Employment and Wages (QCEW) 2008
AverageWeekly
Number Percent Number Percent Wage
0* 66 8% ND ND ND ND1--4 350 42% 771 8% $22,545,342 $562.165--9 178 21% 1,179 12% $36,318,265 $592.4710--19 110 13% 1,516 15% $49,962,269 $633.8920-49 90 11% 2,650 26% $101,110,763 $733.6350-99 26 3% 1,688 17% $81,612,641 $930.01100-249 9 1% 1,198 12% $77,341,306 $1,242.03250-499 3 0% ND ND ND ND500-999 0 0% 0 0% $0 $0.001000+ 0 0% 0 0% $0 $0.00TOTAL 831 100% 10,096 100% $407,947,429 $777.05* For the establishment which had zero employment in the third month of the quarter.
AverageWeekly
Number Percent Number Percent WageAgriculture, Forestry, Fishing and Hunting 9 1% ND ND ND NDMining, Quarrying, and Oil and Gas Extraction 97 12% 1,686 17% $136,025,370 $1,551.53Utilities 15 2% 109 1% $4,355,290 $768.40Construction 65 8% 550 5% $21,196,416 $741.13Manufacturing 14 2% 462 5% $27,420,122 $1,141.36Wholesale Trade 32 4% 407 4% $17,560,300 $829.73Retail Trade 130 16% 1,412 14% $30,381,909 $413.79Transportation and Warehousing 43 5% 491 5% $24,457,394 $957.91Information 14 2% 92 1% $2,556,984 $534.49Finance and Insurance 36 4% 307 3% $11,403,526 $714.33Real Estate and Rental and Leasing 33 4% 326 3% $22,148,157 $1,306.52Professional, Scientific, and Technical Services 64 8% 205 2% $7,140,568 $669.85Management of Companies and Enterprises 2 0% ND ND ND NDAdmin., Support, Waste Mgt. 35 4% 553 5% $19,903,524 $692.15Educational Services 8 1% 599 6% $17,551,742 $563.49Health Care and Social Assistance 86 10% 1,170 12% $34,692,714 $570.23Arts, Entertainment, and Recreation 7 1% 45 0% $597,778 $255.46Accommodation and Food Services 66 8% 1,024 10% $12,003,566 $225.43Other Services (except Public Administration) 44 5% 218 2% $4,780,939 $421.75Public Administration 31 4% 379 4% $11,072,326 $561.82Total 831 100% 10,096 100% $407,947,429 $777.05
BECKHAM
Number of Establishments and Employment by Size of Firm
Size ClassNumber of
EstablishmentsAverage Annual
Employment AnnualTotal Wages
Quarterly Census of Employment and Wages by Industry Division
IndustryNumber of
EstablishmentsAverage Annual
Employment AnnualTotal Wages
18

Quarterly Census of Employment and Wages (QCEW) 2008
AverageWeekly
Number Percent Number Percent Wage
0* 30 9% 14 0% $227,452 $314.301--4 192 55% 361 11% $9,043,494 $482.095--9 58 16% 395 12% $9,324,390 $453.7710--19 37 11% 494 15% $13,449,969 $523.6820-49 20 6% 597 18% $17,555,471 $565.5850-99 10 3% 675 20% $17,114,080 $487.58100-249 1 0% ND ND ND ND250-499 2 1% ND ND ND ND500-999 0 0% 0 0% $0 $0.001000+ 0 0% 0 0% $0 $0.00TOTAL 349 100% 3,330 100% $97,240,281 $561.56* For the establishment which had zero employment in the third month of the quarter.
AverageWeekly
Number Percent Number Percent WageAgriculture, Forestry, Fishing and Hunting 6 2% ND ND ND NDMining, Quarrying, and Oil and Gas Extraction 26 7% 109 3% $4,547,746 $802.35Utilities 9 3% 23 1% $792,588 $662.70Construction 29 8% 151 5% $3,921,307 $499.40Manufacturing 12 3% 446 13% $18,694,019 $806.05Wholesale Trade 18 5% 148 4% $6,567,618 $853.38Retail Trade 42 12% 259 8% $3,800,749 $282.21Transportation and Warehousing 26 7% 136 4% $5,789,831 $818.70Information 8 2% 35 1% $1,047,788 $575.71Finance and Insurance 21 6% 129 4% $4,088,508 $609.50Real Estate and Rental and Leasing 6 2% 50 2% $2,056,820 $791.08Professional, Scientific, and Technical Services 24 7% 65 2% $1,717,515 $508.14Admin., Support, Waste Mgt. 10 3% ND ND ND NDEducational Services 4 1% 376 11% $10,664,774 $545.46Health Care and Social Assistance 24 7% 374 11% $9,206,019 $473.37Arts, Entertainment, and Recreation 3 1% 68 2% $1,347,504 $381.08Accommodation and Food Services 22 6% 172 5% $1,472,478 $164.63Other Services (except Public Administration) 29 8% 89 3% $1,799,880 $388.91Public Administration 32 9% 306 9% $6,897,572 $433.48Total 349 100% 3,330 100% $97,240,281 $561.56
BLAINE
Number of Establishments and Employment by Size of Firm
Size ClassNumber of
EstablishmentsAverage Annual
Employment AnnualTotal Wages
Quarterly Census of Employment and Wages by Industry Division
IndustryNumber of
EstablishmentsAverage Annual
Employment AnnualTotal Wages
19
Quarterly Census of Employment and Wages (QCEW) 2008
AverageWeekly
Number Percent Number Percent Wage
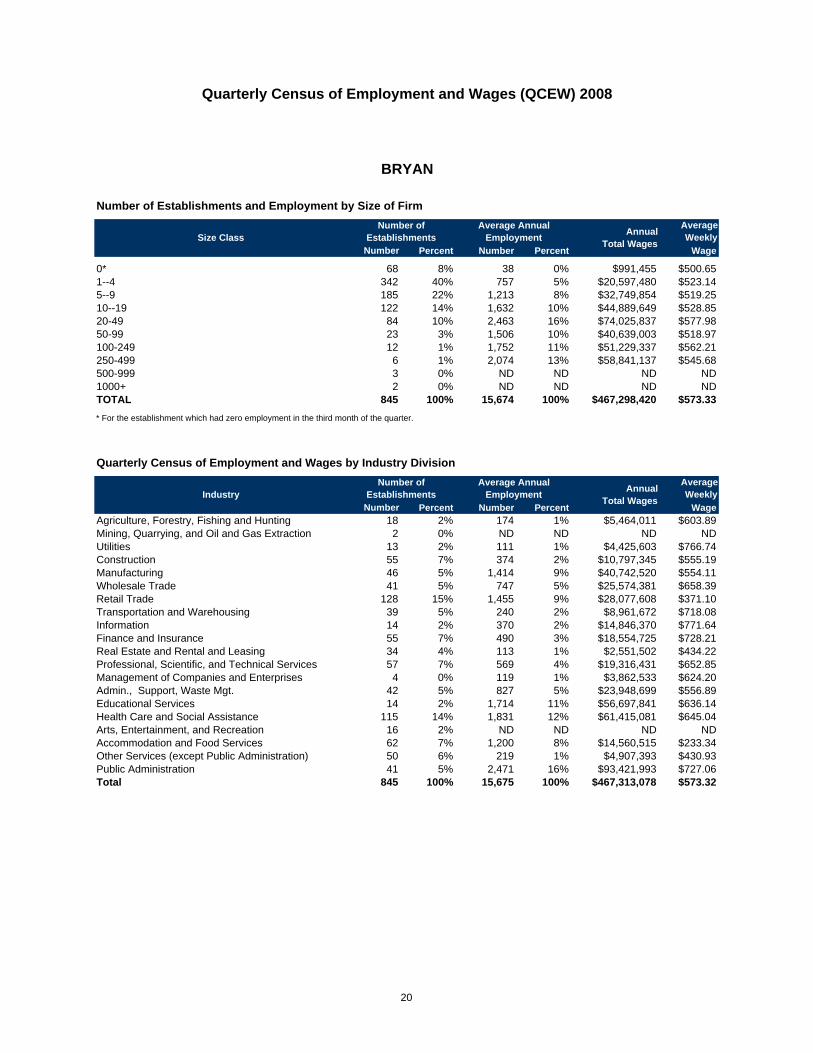
0* 68 8% 38 0% $991,455 $500.651--4 342 40% 757 5% $20,597,480 $523.145--9 185 22% 1,213 8% $32,749,854 $519.2510--19 122 14% 1,632 10% $44,889,649 $528.8520-49 84 10% 2,463 16% $74,025,837 $577.9850-99 23 3% 1,506 10% $40,639,003 $518.97100-249 12 1% 1,752 11% $51,229,337 $562.21250-499 6 1% 2,074 13% $58,841,137 $545.68500-999 3 0% ND ND ND ND1000+ 2 0% ND ND ND NDTOTAL 845 100% 15,674 100% $467,298,420 $573.33* For the establishment which had zero employment in the third month of the quarter.
AverageWeekly
Number Percent Number Percent WageAgriculture, Forestry, Fishing and Hunting 18 2% 174 1% $5,464,011 $603.89Mining, Quarrying, and Oil and Gas Extraction 2 0% ND ND ND NDUtilities 13 2% 111 1% $4,425,603 $766.74Construction 55 7% 374 2% $10,797,345 $555.19Manufacturing 46 5% 1,414 9% $40,742,520 $554.11Wholesale Trade 41 5% 747 5% $25,574,381 $658.39Retail Trade 128 15% 1,455 9% $28,077,608 $371.10Transportation and Warehousing 39 5% 240 2% $8,961,672 $718.08Information 14 2% 370 2% $14,846,370 $771.64Finance and Insurance 55 7% 490 3% $18,554,725 $728.21Real Estate and Rental and Leasing 34 4% 113 1% $2,551,502 $434.22Professional, Scientific, and Technical Services 57 7% 569 4% $19,316,431 $652.85Management of Companies and Enterprises 4 0% 119 1% $3,862,533 $624.20Admin., Support, Waste Mgt. 42 5% 827 5% $23,948,699 $556.89Educational Services 14 2% 1,714 11% $56,697,841 $636.14Health Care and Social Assistance 115 14% 1,831 12% $61,415,081 $645.04Arts, Entertainment, and Recreation 16 2% ND ND ND NDAccommodation and Food Services 62 7% 1,200 8% $14,560,515 $233.34Other Services (except Public Administration) 50 6% 219 1% $4,907,393 $430.93Public Administration 41 5% 2,471 16% $93,421,993 $727.06Total 845 100% 15,675 100% $467,313,078 $573.32
BRYAN
Number of Establishments and Employment by Size of Firm
Size ClassNumber of
EstablishmentsAverage Annual
Employment AnnualTotal Wages
Quarterly Census of Employment and Wages by Industry Division
IndustryNumber of
EstablishmentsAverage Annual
Employment AnnualTotal Wages
20

Quarterly Census of Employment and Wages (QCEW) 2008
AverageWeekly
Number Percent Number Percent Wage
0* 54 9% ND ND ND ND1--4 287 47% 605 8% $15,488,232 $492.045--9 121 20% 799 11% $21,204,448 $510.3610--19 74 12% 993 14% $25,481,659 $493.4420-49 46 7% 1,409 19% $41,810,114 $570.7850-99 19 3% 1,199 16% $34,812,329 $558.32100-249 11 2% 1,626 22% $55,275,216 $653.88250-499 2 0% ND ND ND ND500-999 0 0% 0 0% $0 $0.001000+ 0 0% 0 0% $0 $0.00TOTAL 614 100% 7,321 100% $219,949,943 $577.76* For the establishment which had zero employment in the third month of the quarter.
AverageWeekly
Number Percent Number Percent WageAgriculture, Forestry, Fishing and Hunting 24 4% 155 2% $3,674,431 $455.88Mining, Quarrying, and Oil and Gas Extraction 28 5% 175 2% $8,409,653 $924.14Utilities 13 2% 397 5% $24,435,125 $1,183.64Construction 54 9% 413 6% $14,773,100 $687.89Manufacturing 11 2% 47 1% $972,803 $398.04Wholesale Trade 27 4% 296 4% $9,590,459 $623.08Retail Trade 110 18% 869 12% $17,333,374 $383.58Transportation and Warehousing 28 5% 122 2% $4,935,536 $777.98Information 13 2% 93 1% $3,401,126 $703.29Finance and Insurance 39 6% 241 3% $8,522,654 $680.07Real Estate and Rental and Leasing 11 2% ND ND ND NDProfessional, Scientific, and Technical Services 43 7% 215 3% $7,710,221 $689.64Management of Companies and Enterprises 2 0% ND ND ND NDAdmin., Support, Waste Mgt. 19 3% 273 4% $8,947,951 $630.31Educational Services 12 2% 1,126 15% $33,721,161 $575.92Health Care and Social Assistance 42 7% 774 11% $17,274,303 $429.20Arts, Entertainment, and Recreation 8 1% 295 4% $6,408,717 $417.78Accommodation and Food Services 45 7% 417 6% $4,524,412 $208.65Other Services (except Public Administration) 23 4% 67 1% $1,353,290 $388.43Public Administration 62 10% 1,279 17% $42,007,196 $631.61Total 614 100% 7,321 100% $219,949,943 $577.76
CADDO
Number of Establishments and Employment by Size of Firm
Size ClassNumber of
EstablishmentsAverage Annual
Employment AnnualTotal Wages
Quarterly Census of Employment and Wages by Industry Division
IndustryNumber of
EstablishmentsAverage Annual
Employment AnnualTotal Wages
21

Quarterly Census of Employment and Wages (QCEW) 2008
AverageWeekly
Number Percent Number Percent Wage
0* 234 10% 71 0% $2,300,217 $623.761--4 1,190 52% 2,160 8% $63,362,624 $564.155--9 353 16% 2,333 9% $68,874,049 $567.7910--19 239 10% 3,215 12% $100,618,498 $601.7820-49 177 8% 5,232 20% $164,877,871 $606.0150-99 44 2% 3,010 11% $106,801,005 $682.33100-249 22 1% 3,340 13% $114,766,242 $660.76250-499 14 1% 5,022 19% $195,545,329 $748.77500-999 2 0% ND ND ND ND1000+ 1 0% ND ND ND NDTOTAL 2,275 100% 26,456 100% $899,250,121 $653.66* For the establishment which had zero employment in the third month of the quarter.
AverageWeekly
Number Percent Number Percent WageAgriculture, Forestry, Fishing and Hunting 18 1% 141 1% $5,188,434 $707.64Mining, Quarrying, and Oil and Gas Extraction 84 4% 1,382 5% $112,103,863 $1,559.94Utilities 13 1% 174 1% $9,144,188 $1,010.63Construction 371 16% 1,944 7% $64,672,863 $639.77Manufacturing 77 3% 3,477 13% $159,707,511 $883.32Wholesale Trade 115 5% 696 3% $29,589,961 $817.58Retail Trade 232 10% 3,418 13% $78,703,254 $442.81Transportation and Warehousing 106 5% 885 3% $35,370,473 $768.59Information 30 1% 250 1% $7,377,595 $567.51Finance and Insurance 148 7% 719 3% $27,320,168 $730.72Real Estate and Rental and Leasing 98 4% 402 2% $16,546,961 $791.57Professional, Scientific, and Technical Services 227 10% 738 3% $25,530,001 $665.26Management of Companies and Enterprises 7 0% 100 0% $5,239,799 $1,007.65Admin., Support, Waste Mgt. 151 7% 839 3% $22,668,214 $519.58Educational Services 27 1% 3,308 13% $100,516,318 $584.34Health Care and Social Assistance 187 8% 2,364 9% $61,242,005 $498.19Arts, Entertainment, and Recreation 27 1% 677 3% $17,796,186 $505.52Accommodation and Food Services 143 6% 2,409 9% $28,000,709 $223.53Other Services (except Public Administration) 164 7% 717 3% $19,658,240 $527.26Public Administration 52 2% 1,803 7% $72,660,491 $775.00Total 2,276 100% 26,458 100% $899,270,224 $653.63
CANADIAN
Number of Establishments and Employment by Size of Firm
Size ClassNumber of
EstablishmentsAverage Annual
Employment AnnualTotal Wages
Quarterly Census of Employment and Wages by Industry Division
IndustryNumber of
EstablishmentsAverage Annual
Employment AnnualTotal Wages
22

Quarterly Census of Employment and Wages (QCEW) 2008
AverageWeekly
Number Percent Number Percent Wage
0* 124 8% 79 0% $2,747,582 $670.961--4 680 44% 1,488 6% $44,360,062 $573.315--9 300 19% 1,997 9% $55,646,638 $535.8010--19 218 14% 2,886 13% $91,402,813 $608.9720-49 141 9% 4,267 19% $132,946,239 $599.1250-99 56 4% 3,720 16% $132,586,022 $685.35100-249 17 1% 2,627 11% $84,464,806 $618.30250-499 5 0% 1,744 8% $86,668,488 $955.49500-999 3 0% ND ND ND ND1000+ 2 0% ND ND ND NDTOTAL 1,545 100% 22,904 100% $804,774,107 $675.71* For the establishment which had zero employment in the third month of the quarter.
AverageWeekly
Number Percent Number Percent WageAgriculture, Forestry, Fishing and Hunting 8 1% 27 0% $656,256 $467.42Mining, Quarrying, and Oil and Gas Extraction 116 8% 1,502 7% $86,485,818 $1,107.32Utilities 11 1% 179 1% $8,772,735 $942.49Construction 114 7% 1,042 5% $40,348,364 $744.65Manufacturing 58 4% 3,074 13% $162,851,495 $1,018.79Wholesale Trade 80 5% 1,204 5% $47,044,156 $751.41Retail Trade 225 15% 2,615 11% $58,723,179 $431.85Transportation and Warehousing 55 4% 1,671 7% $59,608,095 $686.00Information 19 1% 172 1% $5,193,012 $580.61Finance and Insurance 113 7% 689 3% $25,439,598 $710.05Real Estate and Rental and Leasing 62 4% 303 1% $10,148,026 $644.07Professional, Scientific, and Technical Services 126 8% 790 3% $31,306,361 $762.08Management of Companies and Enterprises 8 1% 22 0% $1,286,012 $1,124.14Admin., Support, Waste Mgt. 74 5% 995 4% $25,248,666 $487.99Educational Services 22 1% 1,594 7% $46,730,495 $563.78Health Care and Social Assistance 192 12% 3,528 15% $118,665,354 $646.83Arts, Entertainment, and Recreation 18 1% 183 1% $2,966,302 $311.72Accommodation and Food Services 87 6% 1,738 8% $22,704,882 $251.23Other Services (except Public Administration) 101 7% 583 3% $17,776,564 $586.38Public Administration 55 4% 995 4% $32,818,737 $634.30Total 1,545 100% 22,904 100% $804,774,107 $675.71
CARTER
Number of Establishments and Employment by Size of Firm
Size ClassNumber of
EstablishmentsAverage Annual
Employment AnnualTotal Wages
Quarterly Census of Employment and Wages by Industry Division
IndustryNumber of
EstablishmentsAverage Annual
Employment AnnualTotal Wages
23

Quarterly Census of Employment and Wages (QCEW) 2008
AverageWeekly
Number Percent Number Percent Wage
0* 64 8% 48 0% $1,420,645 $564.271--4 325 43% 717 5% $17,301,630 $463.785--9 166 22% 1,111 7% $26,542,847 $459.4410--19 101 13% 1,353 9% $28,274,534 $401.9520-49 60 8% 1,763 12% $41,229,882 $449.6350-99 23 3% 1,615 11% $42,992,561 $511.89100-249 10 1% 1,344 9% $26,333,285 $376.91250-499 3 0% ND ND ND ND500-999 4 1% ND ND ND ND1000+ 2 0% ND ND ND NDTOTAL 757 100% 15,195 100% $432,626,535 $547.53* For the establishment which had zero employment in the third month of the quarter.
AverageWeekly
Number Percent Number Percent WageAgriculture, Forestry, Fishing and Hunting 9 1% 880 6% $19,901,336 $434.91Mining, Quarrying, and Oil and Gas Extraction 4 1% ND ND ND NDUtilities 15 2% 224 1% $8,828,088 $757.91Construction 58 8% 393 3% $9,670,552 $473.21Manufacturing 27 4% 232 2% $6,889,699 $571.10Wholesale Trade 16 2% 463 3% $12,193,149 $506.44Retail Trade 118 16% 1,527 10% $28,394,361 $357.59Transportation and Warehousing 17 2% 75 0% $2,984,663 $765.30Information 14 2% 99 1% $2,764,064 $536.92Finance and Insurance 64 8% 361 2% $11,410,284 $607.84Real Estate and Rental and Leasing 31 4% 133 1% $2,810,351 $406.35Professional, Scientific, and Technical Services 45 6% 177 1% $4,302,752 $467.49Management of Companies and Enterprises 5 1% ND ND ND NDAdmin., Support, Waste Mgt. 36 5% 175 1% $3,538,611 $388.86Educational Services 22 3% 2,305 15% $74,091,793 $618.15Health Care and Social Assistance 105 14% 2,332 15% $79,001,611 $651.48Arts, Entertainment, and Recreation 22 3% 786 5% $32,066,227 $784.55Accommodation and Food Services 77 10% 1,134 7% $11,966,774 $202.94Other Services (except Public Administration) 37 5% 338 2% $4,566,711 $259.83Public Administration 38 5% 3,429 23% $110,302,836 $618.61Total 757 100% 15,195 100% $432,626,535 $547.53
CHEROKEE
Number of Establishments and Employment by Size of Firm
Size ClassNumber of
EstablishmentsAverage Annual
Employment AnnualTotal Wages
Quarterly Census of Employment and Wages by Industry Division
IndustryNumber of
EstablishmentsAverage Annual
Employment AnnualTotal Wages
24

Quarterly Census of Employment and Wages (QCEW) 2008
AverageWeekly
Number Percent Number Percent Wage
0* 25 8% 8 0% $182,320 $462.351--4 148 44% 332 8% $7,884,967 $456.845--9 66 20% 423 10% $9,316,829 $423.6510--19 38 11% 525 12% $13,782,317 $505.1720-49 41 12% 1,243 28% $31,776,124 $491.7550-99 11 3% 688 16% $20,305,759 $567.92100-249 5 1% ND ND ND ND250-499 1 0% ND ND ND ND500-999 0 0% 0 0% $0 $0.001000+ 0 0% 0 0% $0 $0.00TOTAL 335 100% 4,394 100% $114,277,877 $500.15* For the establishment which had zero employment in the third month of the quarter.
AverageWeekly
Number Percent Number Percent WageAgriculture, Forestry, Fishing and Hunting 3 1% ND ND ND NDMining, Quarrying, and Oil and Gas Extraction 5 1% 64 1% $2,635,061 $791.79Utilities 10 3% 195 4% $10,501,125 $1,035.61Construction 22 7% 159 4% $4,820,488 $583.03Manufacturing 12 4% 214 5% $6,671,584 $599.53Wholesale Trade 14 4% 118 3% $2,508,540 $408.82Retail Trade 42 13% 513 12% $9,916,658 $371.74Transportation and Warehousing 22 7% 168 4% $6,190,041 $708.57Information 5 1% ND ND ND NDFinance and Insurance 24 7% 118 3% $3,026,699 $493.27Real Estate and Rental and Leasing 9 3% 178 4% $4,810,704 $519.74Professional, Scientific, and Technical Services 24 7% 108 2% $3,377,198 $601.35Admin., Support, Waste Mgt. 8 2% 59 1% $1,333,413 $434.62Educational Services 8 2% 468 11% $13,547,859 $556.70Health Care and Social Assistance 37 11% 805 18% $19,289,992 $460.82Arts, Entertainment, and Recreation 6 2% 343 8% $7,657,945 $429.35Accommodation and Food Services 22 7% 253 6% $2,642,281 $200.84Other Services (except Public Administration) 35 10% 268 6% $6,177,485 $443.28Public Administration 27 8% 243 6% $7,015,215 $555.18Total 335 100% 4,394 100% $114,277,877 $500.15
CHOCTAW
Number of Establishments and Employment by Size of Firm
Size ClassNumber of
EstablishmentsAverage Annual
Employment AnnualTotal Wages
Quarterly Census of Employment and Wages by Industry Division
IndustryNumber of
EstablishmentsAverage Annual
Employment AnnualTotal Wages
25
Quarterly Census of Employment and Wages (QCEW) 2008
AverageWeekly
Number Percent Number Percent Wage
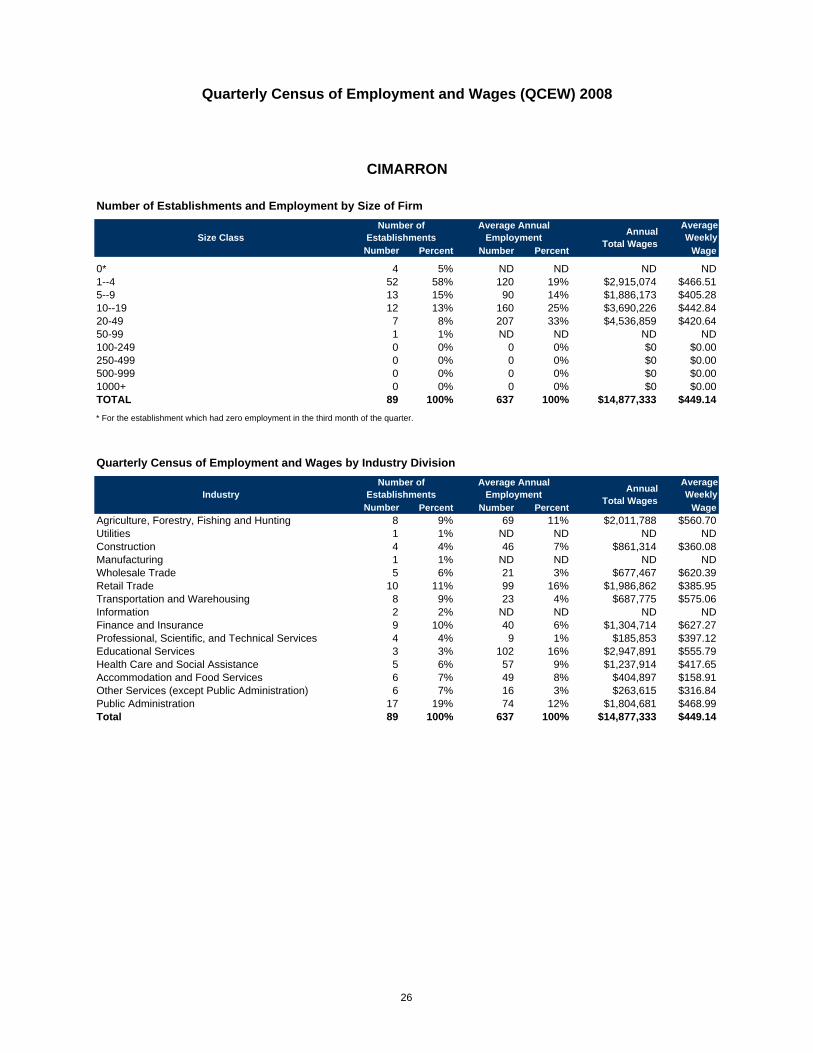
0* 4 5% ND ND ND ND1--4 52 58% 120 19% $2,915,074 $466.515--9 13 15% 90 14% $1,886,173 $405.2810--19 12 13% 160 25% $3,690,226 $442.8420-49 7 8% 207 33% $4,536,859 $420.6450-99 1 1% ND ND ND ND100-249 0 0% 0 0% $0 $0.00250-499 0 0% 0 0% $0 $0.00500-999 0 0% 0 0% $0 $0.001000+ 0 0% 0 0% $0 $0.00TOTAL 89 100% 637 100% $14,877,333 $449.14* For the establishment which had zero employment in the third month of the quarter.
AverageWeekly
Number Percent Number Percent WageAgriculture, Forestry, Fishing and Hunting 8 9% 69 11% $2,011,788 $560.70Utilities 1 1% ND ND ND NDConstruction 4 4% 46 7% $861,314 $360.08Manufacturing 1 1% ND ND ND NDWholesale Trade 5 6% 21 3% $677,467 $620.39Retail Trade 10 11% 99 16% $1,986,862 $385.95Transportation and Warehousing 8 9% 23 4% $687,775 $575.06Information 2 2% ND ND ND NDFinance and Insurance 9 10% 40 6% $1,304,714 $627.27Professional, Scientific, and Technical Services 4 4% 9 1% $185,853 $397.12Educational Services 3 3% 102 16% $2,947,891 $555.79Health Care and Social Assistance 5 6% 57 9% $1,237,914 $417.65Accommodation and Food Services 6 7% 49 8% $404,897 $158.91Other Services (except Public Administration) 6 7% 16 3% $263,615 $316.84Public Administration 17 19% 74 12% $1,804,681 $468.99Total 89 100% 637 100% $14,877,333 $449.14
CIMARRON
Number of Establishments and Employment by Size of Firm
Size ClassNumber of
EstablishmentsAverage Annual
Employment AnnualTotal Wages
Quarterly Census of Employment and Wages by Industry Division
IndustryNumber of
EstablishmentsAverage Annual
Employment AnnualTotal Wages
26
Quarterly Census of Employment and Wages (QCEW) 2008
AverageWeekly
Number Percent Number Percent Wage
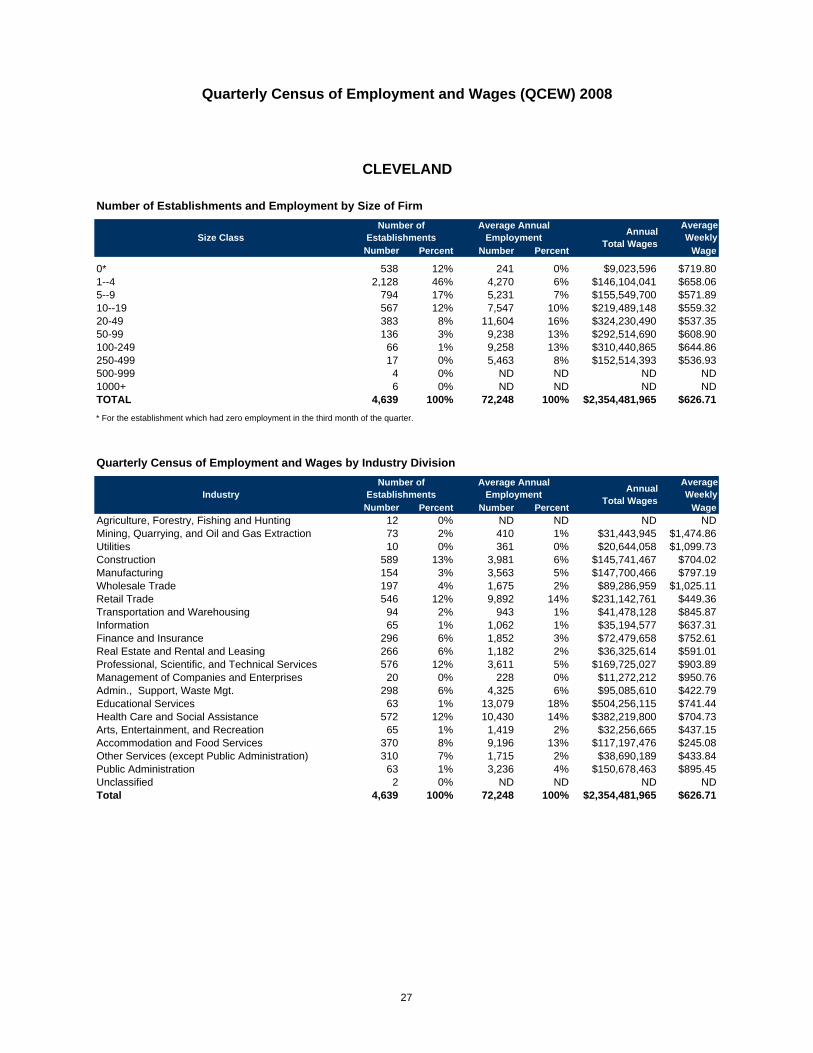
0* 538 12% 241 0% $9,023,596 $719.801--4 2,128 46% 4,270 6% $146,104,041 $658.065--9 794 17% 5,231 7% $155,549,700 $571.8910--19 567 12% 7,547 10% $219,489,148 $559.3220-49 383 8% 11,604 16% $324,230,490 $537.3550-99 136 3% 9,238 13% $292,514,690 $608.90100-249 66 1% 9,258 13% $310,440,865 $644.86250-499 17 0% 5,463 8% $152,514,393 $536.93500-999 4 0% ND ND ND ND1000+ 6 0% ND ND ND NDTOTAL 4,639 100% 72,248 100% $2,354,481,965 $626.71* For the establishment which had zero employment in the third month of the quarter.
AverageWeekly
Number Percent Number Percent WageAgriculture, Forestry, Fishing and Hunting 12 0% ND ND ND NDMining, Quarrying, and Oil and Gas Extraction 73 2% 410 1% $31,443,945 $1,474.86Utilities 10 0% 361 0% $20,644,058 $1,099.73Construction 589 13% 3,981 6% $145,741,467 $704.02Manufacturing 154 3% 3,563 5% $147,700,466 $797.19Wholesale Trade 197 4% 1,675 2% $89,286,959 $1,025.11Retail Trade 546 12% 9,892 14% $231,142,761 $449.36Transportation and Warehousing 94 2% 943 1% $41,478,128 $845.87Information 65 1% 1,062 1% $35,194,577 $637.31Finance and Insurance 296 6% 1,852 3% $72,479,658 $752.61Real Estate and Rental and Leasing 266 6% 1,182 2% $36,325,614 $591.01Professional, Scientific, and Technical Services 576 12% 3,611 5% $169,725,027 $903.89Management of Companies and Enterprises 20 0% 228 0% $11,272,212 $950.76Admin., Support, Waste Mgt. 298 6% 4,325 6% $95,085,610 $422.79Educational Services 63 1% 13,079 18% $504,256,115 $741.44Health Care and Social Assistance 572 12% 10,430 14% $382,219,800 $704.73Arts, Entertainment, and Recreation 65 1% 1,419 2% $32,256,665 $437.15Accommodation and Food Services 370 8% 9,196 13% $117,197,476 $245.08Other Services (except Public Administration) 310 7% 1,715 2% $38,690,189 $433.84Public Administration 63 1% 3,236 4% $150,678,463 $895.45Unclassified 2 0% ND ND ND NDTotal 4,639 100% 72,248 100% $2,354,481,965 $626.71
CLEVELAND
Number of Establishments and Employment by Size of Firm
Size ClassNumber of
EstablishmentsAverage Annual
Employment AnnualTotal Wages
Quarterly Census of Employment and Wages by Industry Division
IndustryNumber of
EstablishmentsAverage Annual
Employment AnnualTotal Wages
27

Quarterly Census of Employment and Wages (QCEW) 2008
AverageWeekly
Number Percent Number Percent Wage
0* 7 6% 3 0% $89,988 $561.261--4 53 47% 122 11% $2,801,954 $443.495--9 22 20% 140 13% $3,251,322 $445.5510--19 14 12% 182 17% $5,382,966 $570.0920-49 13 11% 332 31% $7,922,458 $459.0250-99 2 2% ND ND ND ND100-249 2 2% ND ND ND ND250-499 0 0% 0 0% $0 $0.00500-999 0 0% 0 0% $0 $0.001000+ 0 0% 0 0% $0 $0.00TOTAL 112 100% 1,082 100% $27,626,287 $491.01* For the establishment which had zero employment in the third month of the quarter.
AverageWeekly
Number Percent Number Percent WageAgriculture, Forestry, Fishing and Hunting 3 3% 25 2% $596,605 $458.93Mining, Quarrying, and Oil and Gas Extraction 4 4% 40 4% $1,778,407 $855.00Utilities 5 4% 13 1% $604,916 $894.85Construction 9 8% 72 7% $1,963,745 $524.50Manufacturing 3 3% 43 4% $1,079,398 $482.74Wholesale Trade 2 2% ND ND ND NDRetail Trade 18 16% 127 12% $2,020,425 $305.94Transportation and Warehousing 10 9% 29 3% $995,730 $660.30Finance and Insurance 7 6% 56 5% $2,016,979 $692.64Professional, Scientific, and Technical Services 4 4% 13 1% $263,140 $389.26Management of Companies and Enterprises 1 1% ND ND ND NDAdmin., Support, Waste Mgt. 3 3% 14 1% $233,840 $321.21Educational Services 3 3% 210 19% $6,541,701 $599.06Health Care and Social Assistance 9 8% 195 18% $4,206,562 $414.85Arts, Entertainment, and Recreation 2 2% ND ND ND NDAccommodation and Food Services 5 4% 73 7% $774,946 $204.15Other Services (except Public Administration) 5 4% 10 1% $209,066 $402.05Public Administration 21 19% 142 13% $3,719,212 $503.69Total 112 100% 1,082 100% $27,626,287 $491.01
COAL
Number of Establishments and Employment by Size of Firm
Size ClassNumber of
EstablishmentsAverage Annual
Employment AnnualTotal Wages
Quarterly Census of Employment and Wages by Industry Division
IndustryNumber of
EstablishmentsAverage Annual
Employment AnnualTotal Wages
28

Quarterly Census of Employment and Wages (QCEW) 2008
AverageWeekly
Number Percent Number Percent Wage
0* 221 9% 101 0% 4,059,291 $775.461--4 923 39% 2,014 5% 54,289,848 $518.325--9 531 23% 3,539 8% 96,085,902 $522.1610--19 325 14% 4,353 10% 111,200,669 $491.2420-49 215 9% 6,368 15% 161,978,195 $489.1350-99 77 3% 5,326 13% 149,840,781 $541.01100-249 34 1% 5,000 12% 145,286,754 $558.79250-499 14 1% 4,935 12% 145,444,764 $566.83500-999 4 0% ND ND ND ND1000+ 4 0% ND ND ND NDTOTAL 2,346 100% 42,060 100% 1,356,040,325 $620.01* For the establishment which had zero employment in the third month of the quarter.
AverageWeekly
Number Percent Number Percent WageAgriculture, Forestry, Fishing and Hunting 10 0% ND ND ND NDMining, Quarrying, and Oil and Gas Extraction 12 1% ND ND ND NDUtilities 17 1% 322 1% $14,843,261 $886.48Construction 218 9% 1,725 4% $55,736,686 $621.37Manufacturing 58 2% 3,514 8% $198,656,040 $1,087.17Wholesale Trade 67 3% 574 1% $16,456,482 $551.34Retail Trade 386 16% 5,909 14% $125,084,260 $407.09Transportation and Warehousing 79 3% 1,406 3% $53,694,771 $734.42Information 38 2% 623 1% $21,929,191 $676.91Finance and Insurance 180 8% 2,119 5% $62,127,077 $563.83Real Estate and Rental and Leasing 136 6% 559 1% $11,751,083 $404.26Professional, Scientific, and Technical Services 180 8% 1,342 3% $56,932,734 $815.84Management of Companies and Enterprises 8 0% 79 0% $3,203,212 $779.75Admin., Support, Waste Mgt. 161 7% 2,601 6% $70,346,573 $520.11Educational Services 36 2% 4,659 11% $147,956,330 $610.71Health Care and Social Assistance 282 12% 6,291 15% $233,642,640 $714.22Arts, Entertainment, and Recreation 27 1% 820 2% $19,842,552 $465.35Accommodation and Food Services 209 9% 4,479 11% $60,023,027 $257.71Other Services (except Public Administration) 169 7% 810 2% $17,549,781 $416.66Public Administration 76 3% 4,050 10% $180,710,068 $858.07Total 2,346 100% 42,060 100% $1,356,025,667 $620.01
COMANCHE
Number of Establishments and Employment by Size of Firm
Size ClassNumber of
EstablishmentsAverage Annual
Employment AnnualTotal Wages
Quarterly Census of Employment and Wages by Industry Division
IndustryNumber of
EstablishmentsAverage Annual
Employment AnnualTotal Wages
29

Quarterly Census of Employment and Wages (QCEW) 2008
AverageWeekly
Number Percent Number Percent Wage
0* 6 5% 3 0% $52,799 $338.461--4 64 55% 142 8% $3,500,395 $474.335--9 22 19% 142 8% $3,044,188 $412.0310--19 10 8% 119 7% $3,139,867 $507.4120-49 9 7% 312 18% $6,738,273 $415.7750-99 4 3% ND ND ND ND100-249 1 1% ND ND ND ND250-499 2 1% ND ND ND ND500-999 0 0% 0 0% $0 $0.001000+ 0 0% 0 0% $0 $0.00TOTAL 117 100% 1,765 100% $48,548,726 $528.97* For the establishment which had zero employment in the third month of the quarter.
AverageWeekly
Number Percent Number Percent WageAgriculture, Forestry, Fishing and Hunting 1 1% ND ND ND NDMining, Quarrying, and Oil and Gas Extraction 6 5% 11 1% $296,168 $517.78Utilities 4 3% ND ND ND NDConstruction 5 4% 22 1% $412,365 $360.46Manufacturing 4 3% 12 1% $198,023 $317.34Wholesale Trade 2 2% ND ND ND NDRetail Trade 19 16% 142 8% $2,813,227 $380.99Transportation and Warehousing 8 7% 27 2% $908,498 $647.08Information 2 2% ND ND ND NDFinance and Insurance 10 9% 47 3% $1,616,107 $661.25Professional, Scientific, and Technical Services 3 3% 7 0% $330,839 $908.90Admin., Support, Waste Mgt. 2 2% ND ND ND NDEducational Services 3 3% 198 11% $5,641,735 $547.95Health Care and Social Assistance 12 10% 230 13% $5,248,535 $438.84Arts, Entertainment, and Recreation 2 2% ND ND ND NDAccommodation and Food Services 7 6% 62 4% $501,170 $155.45Other Services (except Public Administration) 6 5% 25 1% $648,356 $498.74Public Administration 21 18% 163 9% $4,347,871 $512.96Total 117 100% 1,765 100% $48,548,726 $528.97
COTTON
Number of Establishments and Employment by Size of Firm
Size ClassNumber of
EstablishmentsAverage Annual
Employment AnnualTotal Wages
Quarterly Census of Employment and Wages by Industry Division
IndustryNumber of
EstablishmentsAverage Annual
Employment AnnualTotal Wages
30

Quarterly Census of Employment and Wages (QCEW) 2008
AverageWeekly
Number Percent Number Percent Wage
0* 22 5% 7 0% $183,052 $528.031--4 181 45% 390 6% $9,323,433 $460.235--9 83 21% 552 9% $13,938,087 $485.6510--19 47 12% 631 10% $17,073,709 $520.5620-49 43 11% 1,282 20% $31,867,502 $478.0050-99 17 4% 1,124 18% $36,891,659 $631.23100-249 7 2% 1,158 18% $29,004,636 $481.78250-499 2 0% ND ND ND ND500-999 1 0% ND ND ND ND1000+ 0 0% 0 0% $0 $0.00TOTAL 402 100% 6,292 100% $177,630,530 $542.91* For the establishment which had zero employment in the third month of the quarter.
AverageWeekly
Number Percent Number Percent WageAgriculture, Forestry, Fishing and Hunting 10 2% 102 2% $2,573,881 $485.27Mining, Quarrying, and Oil and Gas Extraction 2 0% ND ND ND NDUtilities 7 2% 193 3% $9,215,055 $918.20Construction 28 7% 180 3% $4,378,773 $467.82Manufacturing 17 4% 454 7% $13,717,138 $581.04Wholesale Trade 19 5% 210 3% $6,568,087 $601.47Retail Trade 46 11% 602 10% $12,839,305 $410.15Transportation and Warehousing 16 4% 243 4% $8,621,027 $682.26Information 9 2% 69 1% $2,126,204 $592.59Finance and Insurance 20 5% 204 3% $6,888,527 $649.37Real Estate and Rental and Leasing 8 2% 29 0% $798,930 $529.79Professional, Scientific, and Technical Services 22 5% 132 2% $4,826,533 $703.17Management of Companies and Enterprises 3 1% 98 2% $6,960,354 $1,365.85Admin., Support, Waste Mgt. 17 4% 433 7% $10,243,658 $454.95Educational Services 7 2% 476 8% $14,639,318 $591.44Health Care and Social Assistance 78 19% 1,805 29% $47,943,353 $510.80Arts, Entertainment, and Recreation 3 1% ND ND ND NDAccommodation and Food Services 35 9% 496 8% $5,445,503 $211.13Other Services (except Public Administration) 23 6% 91 1% $2,695,926 $569.72Public Administration 34 8% 411 7% $14,389,388 $673.28Total 402 100% 6,292 100% $177,630,530 $542.91
CRAIG
Number of Establishments and Employment by Size of Firm
Size ClassNumber of
EstablishmentsAverage Annual
Employment AnnualTotal Wages
AnnualTotal Wages
Quarterly Census of Employment and Wages by Industry Division
IndustryNumber of
EstablishmentsAverage Annual
Employment
31

Quarterly Census of Employment and Wages (QCEW) 2008
AverageWeekly
Number Percent Number Percent Wage
0* 139 10% ND ND ND ND1--4 636 45% 1,357 8% $38,777,761 $549.515--9 264 19% 1,759 10% $49,511,218 $541.2710--19 168 12% 2,275 13% $69,168,020 $584.8120-49 129 9% 3,825 22% $121,041,728 $608.5050-99 45 3% 2,968 17% $106,608,372 $690.72100-249 23 2% 3,459 20% $157,743,069 $877.04250-499 4 0% 1,390 8% $58,520,676 $809.69500-999 1 0% ND ND ND ND1000+ 0 0% 0 0% $0 $0.00TOTAL 1,408 100% 17,668 100% $621,770,368 $676.77* For the establishment which had zero employment in the third month of the quarter.
AverageWeekly
Number Percent Number Percent WageAgriculture, Forestry, Fishing and Hunting 5 0% ND ND ND NDMining, Quarrying, and Oil and Gas Extraction 68 5% 458 3% $19,033,632 $799.20Utilities 19 1% 171 1% $7,785,760 $875.59Construction 213 15% 1,817 10% $77,711,083 $822.48Manufacturing 132 9% 3,598 20% $177,278,898 $947.53Wholesale Trade 67 5% 768 4% $36,032,920 $902.27Retail Trade 180 13% 2,076 12% $45,050,059 $417.32Transportation and Warehousing 67 5% 727 4% $35,445,371 $937.61Information 23 2% 168 1% $6,406,720 $733.37Finance and Insurance 77 5% 545 3% $18,695,442 $659.68Real Estate and Rental and Leasing 34 2% 102 1% $2,127,646 $401.14Professional, Scientific, and Technical Services 94 7% 314 2% $9,996,167 $612.21Management of Companies and Enterprises 2 0% 45 0% $1,943,064 $830.37Admin., Support, Waste Mgt. 73 5% 450 3% $12,328,454 $526.86Educational Services 24 2% 2,041 12% $64,761,707 $610.20Health Care and Social Assistance 101 7% 1,926 11% $53,984,764 $539.03Arts, Entertainment, and Recreation 12 1% 148 1% $3,017,114 $392.04Accommodation and Food Services 77 5% 1,095 6% $12,232,048 $214.82Other Services (except Public Administration) 95 7% 427 2% $13,488,666 $607.49Public Administration 44 3% 781 4% $24,123,737 $594.01Unclassified 2 0% ND ND ND NDTotal 1,408 100% 17,668 100% $621,770,368 $676.77
CREEK
Number of Establishments and Employment by Size of Firm
Size ClassNumber of
EstablishmentsAverage Annual
Employment AnnualTotal Wages
Quarterly Census of Employment and Wages by Industry Division
IndustryNumber of
EstablishmentsAverage Annual
Employment AnnualTotal Wages
32

Quarterly Census of Employment and Wages (QCEW) 2008
AverageWeekly
Number Percent Number Percent Wage
0* 75 8% 40 0% $1,738,524 $844.631--4 392 43% 870 8% $22,775,006 $503.475--9 208 23% 1,362 12% $38,408,500 $542.1410--19 115 12% 1,520 13% $49,719,598 $629.0820-49 92 10% 2,714 24% $80,545,924 $570.7150-99 23 3% 1,567 14% $46,971,404 $576.57100-249 11 1% 1,607 14% $63,035,283 $754.57250-499 4 0% ND ND ND ND500-999 1 0% ND ND ND ND1000+ 0 0% 0 0% $0 $0.00TOTAL 920 100% 11,501 100% $364,867,641 $610.09* For the establishment which had zero employment in the third month of the quarter.
AverageWeekly
Number Percent Number Percent WageAgriculture, Forestry, Fishing and Hunting 12 1% ND ND ND NDMining, Quarrying, and Oil and Gas Extraction 33 4% 604 5% $39,800,939 $1,267.22Utilities 18 2% 151 1% $7,270,360 $925.92Construction 89 10% 610 5% $27,907,012 $879.79Manufacturing 39 4% 1,096 10% $46,345,748 $813.20Wholesale Trade 41 4% 481 4% $19,452,979 $777.75Retail Trade 151 16% 1,624 14% $33,675,889 $398.78Transportation and Warehousing 42 5% 322 3% $13,715,754 $819.14Information 14 2% 121 1% $2,886,991 $458.84Finance and Insurance 67 7% 359 3% $12,650,423 $677.65Real Estate and Rental and Leasing 35 4% 155 1% $5,031,151 $624.21Professional, Scientific, and Technical Services 72 8% 322 3% $9,152,947 $546.64Management of Companies and Enterprises 1 0% ND ND ND NDAdmin., Support, Waste Mgt. 35 4% 263 2% $5,452,848 $398.72Educational Services 9 1% 1,327 12% $44,512,787 $645.08Health Care and Social Assistance 80 9% 1,462 13% $41,224,174 $542.25Arts, Entertainment, and Recreation 10 1% 345 3% $8,729,049 $486.57Accommodation and Food Services 68 7% 1,201 10% $13,920,672 $222.90Other Services (except Public Administration) 58 6% 381 3% $8,048,023 $406.22Public Administration 48 5% 627 5% $23,449,724 $719.23Total 920 100% 11,501 100% $364,867,641 $610.09
CUSTER
Number of Establishments and Employment by Size of Firm
Size ClassNumber of
EstablishmentsAverage Annual
Employment AnnualTotal Wages
Quarterly Census of Employment and Wages by Industry Division
IndustryNumber of
EstablishmentsAverage Annual
Employment AnnualTotal Wages
33

Quarterly Census of Employment and Wages (QCEW) 2008
AverageWeekly
Number Percent Number Percent Wage
0* 79 10% 27 0% $754,174 $535.511--4 354 46% 805 9% $18,786,522 $448.705--9 163 21% 1,056 12% $26,632,683 $485.1210--19 95 12% 1,226 14% $31,825,839 $499.0420-49 48 6% 1,386 16% $33,680,693 $467.2150-99 13 2% 917 11% $23,120,120 $484.68100-249 9 1% 1,185 14% $29,681,420 $481.79250-499 6 1% 1,926 22% $59,117,909 $590.28500-999 0 0% 0 0% $0 $0.001000+ 0 0% 0 0% $0 $0.00TOTAL 767 100% 8,700 100% $229,470,761 $507.23* For the establishment which had zero employment in the third month of the quarter.
AverageWeekly
Number Percent Number Percent WageAgriculture, Forestry, Fishing and Hunting 6 1% 17 0% $433,381 $490.25Mining, Quarrying, and Oil and Gas Extraction 3 0% ND ND ND NDUtilities 8 1% 59 1% $2,723,306 $887.65Construction 109 14% 649 7% $19,293,938 $571.71Manufacturing 36 5% 900 10% $26,019,963 $555.98Wholesale Trade 24 3% 90 1% $3,343,359 $714.39Retail Trade 122 16% 1,198 14% $23,838,541 $382.67Transportation and Warehousing 31 4% 142 2% $4,280,497 $579.70Information 16 2% 76 1% $3,168,141 $801.66Finance and Insurance 44 6% 242 3% $8,456,934 $672.04Real Estate and Rental and Leasing 30 4% 86 1% $1,594,706 $356.60Professional, Scientific, and Technical Services 51 7% 185 2% $6,221,806 $646.76Management of Companies and Enterprises 2 0% ND ND ND NDAdmin., Support, Waste Mgt. 34 4% 121 1% $2,393,436 $380.39Educational Services 11 1% 1,033 12% $31,430,440 $585.12Health Care and Social Assistance 75 10% 1,236 14% $38,537,070 $599.59Arts, Entertainment, and Recreation 16 2% 809 9% $23,364,586 $555.40Accommodation and Food Services 56 7% 956 11% $10,370,788 $208.62Other Services (except Public Administration) 61 8% 410 5% $10,436,944 $489.54Public Administration 34 4% 486 6% $13,474,189 $533.17Total 767 100% 8,700 100% $229,470,761 $507.23
DELAWARE
Number of Establishments and Employment by Size of Firm
Size ClassNumber of
EstablishmentsAverage Annual
Employment AnnualTotal Wages
Quarterly Census of Employment and Wages by Industry Division
IndustryNumber of
EstablishmentsAverage Annual
Employment AnnualTotal Wages
34
Quarterly Census of Employment and Wages (QCEW) 2008
AverageWeekly
Number Percent Number Percent Wage
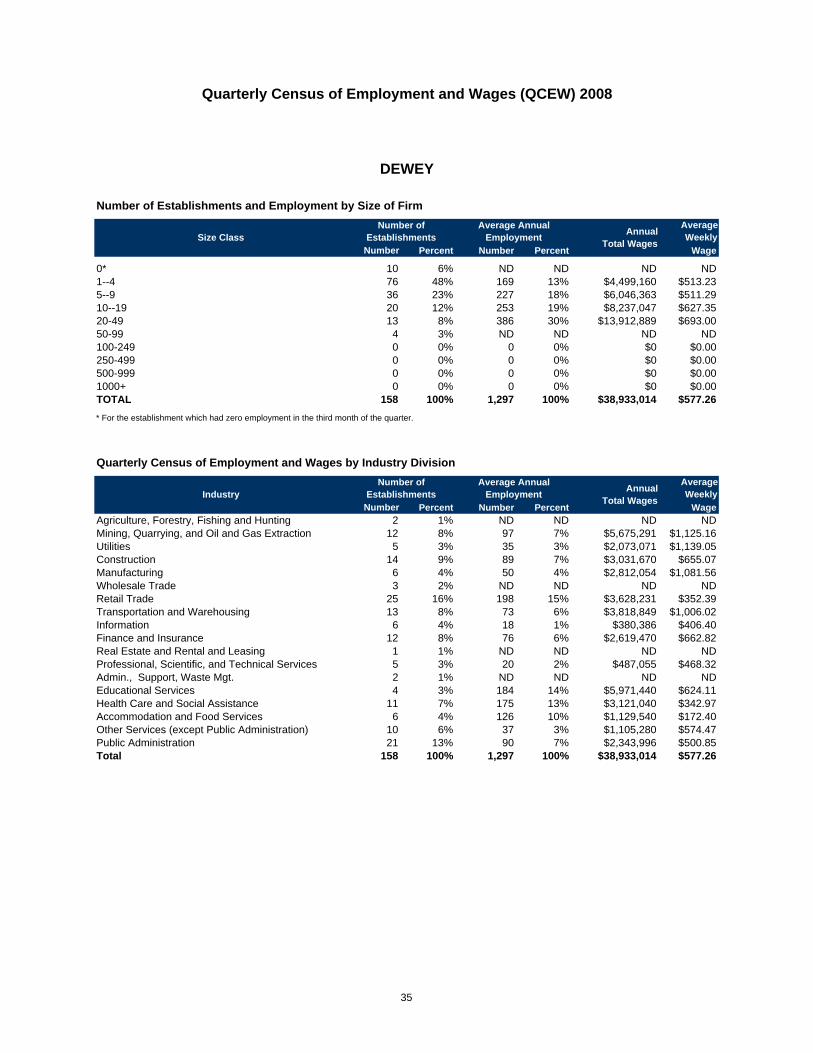
0* 10 6% ND ND ND ND1--4 76 48% 169 13% $4,499,160 $513.235--9 36 23% 227 18% $6,046,363 $511.2910--19 20 12% 253 19% $8,237,047 $627.3520-49 13 8% 386 30% $13,912,889 $693.0050-99 4 3% ND ND ND ND100-249 0 0% 0 0% $0 $0.00250-499 0 0% 0 0% $0 $0.00500-999 0 0% 0 0% $0 $0.001000+ 0 0% 0 0% $0 $0.00TOTAL 158 100% 1,297 100% $38,933,014 $577.26* For the establishment which had zero employment in the third month of the quarter.
AverageWeekly
Number Percent Number Percent WageAgriculture, Forestry, Fishing and Hunting 2 1% ND ND ND NDMining, Quarrying, and Oil and Gas Extraction 12 8% 97 7% $5,675,291 $1,125.16Utilities 5 3% 35 3% $2,073,071 $1,139.05Construction 14 9% 89 7% $3,031,670 $655.07Manufacturing 6 4% 50 4% $2,812,054 $1,081.56Wholesale Trade 3 2% ND ND ND NDRetail Trade 25 16% 198 15% $3,628,231 $352.39Transportation and Warehousing 13 8% 73 6% $3,818,849 $1,006.02Information 6 4% 18 1% $380,386 $406.40Finance and Insurance 12 8% 76 6% $2,619,470 $662.82Real Estate and Rental and Leasing 1 1% ND ND ND NDProfessional, Scientific, and Technical Services 5 3% 20 2% $487,055 $468.32Admin., Support, Waste Mgt. 2 1% ND ND ND NDEducational Services 4 3% 184 14% $5,971,440 $624.11Health Care and Social Assistance 11 7% 175 13% $3,121,040 $342.97Accommodation and Food Services 6 4% 126 10% $1,129,540 $172.40Other Services (except Public Administration) 10 6% 37 3% $1,105,280 $574.47Public Administration 21 13% 90 7% $2,343,996 $500.85Total 158 100% 1,297 100% $38,933,014 $577.26
DEWEY
Number of Establishments and Employment by Size of Firm
Size ClassNumber of
EstablishmentsAverage Annual
Employment AnnualTotal Wages
Quarterly Census of Employment and Wages by Industry Division
IndustryNumber of
EstablishmentsAverage Annual
Employment AnnualTotal Wages
35

Quarterly Census of Employment and Wages (QCEW) 2008
AverageWeekly
Number Percent Number Percent Wage
0* 14 9% ND ND ND ND1--4 76 52% 166 15% $4,563,386 $529.995--9 30 20% 199 18% $6,551,646 $634.7310--19 14 9% 179 16% $4,951,213 $531.4420-49 10 7% 289 26% $11,070,215 $737.4950-99 4 2% ND ND ND ND100-249 0 0% 0 0% $0 $0.00250-499 0 0% 0 0% $0 $0.00500-999 0 0% 0 0% $0 $0.001000+ 0 0% 0 0% $0 $0.00TOTAL 146 100% 1,107 100% $37,518,964 $651.78* For the establishment which had zero employment in the third month of the quarter.
AverageWeekly
Number Percent Number Percent WageAgriculture, Forestry, Fishing and Hunting 6 4% 31 3% $740,844 $459.58Mining, Quarrying, and Oil and Gas Extraction 8 5% 68 6% $4,225,256 $1,194.93Utilities 1 1% ND ND ND NDConstruction 9 6% 50 5% $1,311,486 $504.42Manufacturing 6 4% 11 1% $280,007 $489.52Wholesale Trade 7 5% 57 5% $3,325,314 $1,121.90Retail Trade 18 12% 132 12% $2,611,881 $380.52Transportation and Warehousing 17 12% 155 14% $7,679,888 $952.84Information 1 1% ND ND ND NDFinance and Insurance 8 5% 39 4% $1,102,457 $543.62Real Estate and Rental and Leasing 1 1% ND ND ND NDProfessional, Scientific, and Technical Services 10 7% 31 3% $885,410 $549.26Management of Companies and Enterprises 1 1% ND ND ND NDAdmin., Support, Waste Mgt. 3 2% 6 1% $75,025 $240.46Educational Services 4 3% 142 13% $4,321,587 $585.26Health Care and Social Assistance 9 6% 187 17% $6,284,061 $646.24Arts, Entertainment, and Recreation 2 1% ND ND ND NDAccommodation and Food Services 7 5% 44 4% $384,347 $167.98Other Services (except Public Administration) 10 7% 20 2% $429,163 $412.66Public Administration 20 14% 117 11% $3,167,425 $520.62Total 146 100% 1,107 100% $37,518,964 $651.78
ELLIS
Number of Establishments and Employment by Size of Firm
Size ClassNumber of
EstablishmentsAverage Annual
Employment AnnualTotal Wages
Quarterly Census of Employment and Wages by Industry Division
IndustryNumber of
EstablishmentsAverage Annual
Employment AnnualTotal Wages
36
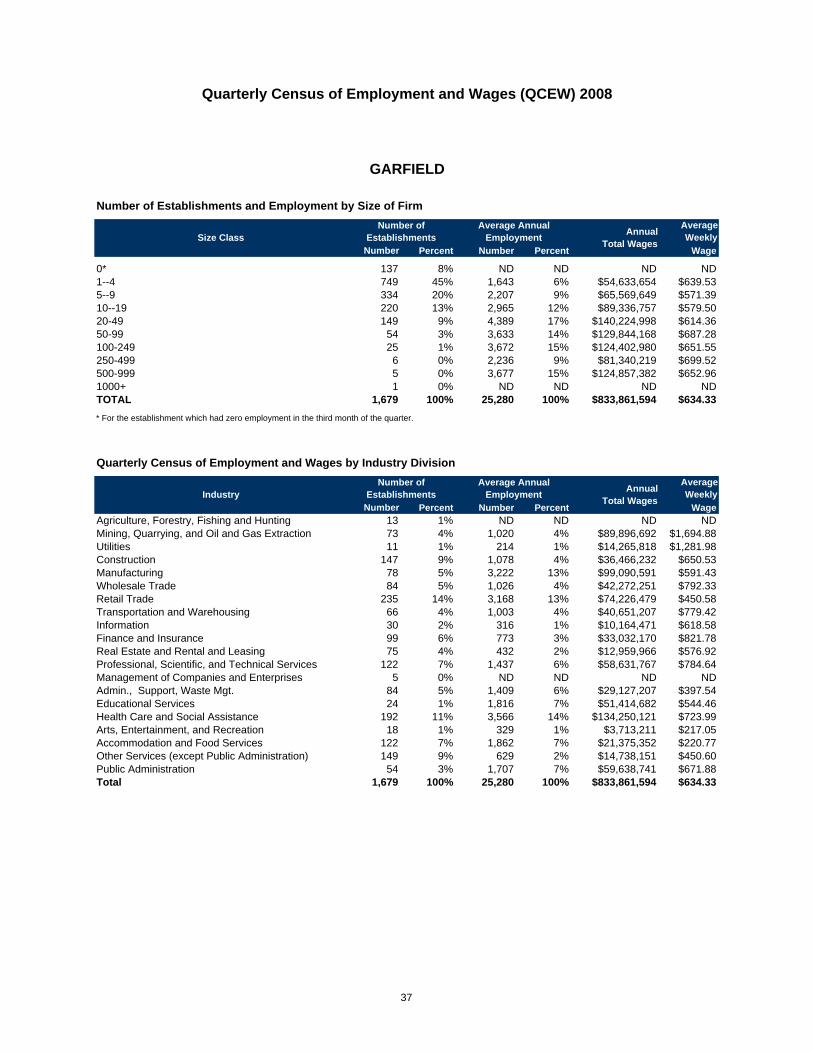
Quarterly Census of Employment and Wages (QCEW) 2008
AverageWeekly
Number Percent Number Percent Wage
0* 137 8% ND ND ND ND1--4 749 45% 1,643 6% $54,633,654 $639.535--9 334 20% 2,207 9% $65,569,649 $571.3910--19 220 13% 2,965 12% $89,336,757 $579.5020-49 149 9% 4,389 17% $140,224,998 $614.3650-99 54 3% 3,633 14% $129,844,168 $687.28100-249 25 1% 3,672 15% $124,402,980 $651.55250-499 6 0% 2,236 9% $81,340,219 $699.52500-999 5 0% 3,677 15% $124,857,382 $652.961000+ 1 0% ND ND ND NDTOTAL 1,679 100% 25,280 100% $833,861,594 $634.33* For the establishment which had zero employment in the third month of the quarter.
AverageWeekly
Number Percent Number Percent WageAgriculture, Forestry, Fishing and Hunting 13 1% ND ND ND NDMining, Quarrying, and Oil and Gas Extraction 73 4% 1,020 4% $89,896,692 $1,694.88Utilities 11 1% 214 1% $14,265,818 $1,281.98Construction 147 9% 1,078 4% $36,466,232 $650.53Manufacturing 78 5% 3,222 13% $99,090,591 $591.43Wholesale Trade 84 5% 1,026 4% $42,272,251 $792.33Retail Trade 235 14% 3,168 13% $74,226,479 $450.58Transportation and Warehousing 66 4% 1,003 4% $40,651,207 $779.42Information 30 2% 316 1% $10,164,471 $618.58Finance and Insurance 99 6% 773 3% $33,032,170 $821.78Real Estate and Rental and Leasing 75 4% 432 2% $12,959,966 $576.92Professional, Scientific, and Technical Services 122 7% 1,437 6% $58,631,767 $784.64Management of Companies and Enterprises 5 0% ND ND ND NDAdmin., Support, Waste Mgt. 84 5% 1,409 6% $29,127,207 $397.54Educational Services 24 1% 1,816 7% $51,414,682 $544.46Health Care and Social Assistance 192 11% 3,566 14% $134,250,121 $723.99Arts, Entertainment, and Recreation 18 1% 329 1% $3,713,211 $217.05Accommodation and Food Services 122 7% 1,862 7% $21,375,352 $220.77Other Services (except Public Administration) 149 9% 629 2% $14,738,151 $450.60Public Administration 54 3% 1,707 7% $59,638,741 $671.88Total 1,679 100% 25,280 100% $833,861,594 $634.33
GARFIELD
Number of Establishments and Employment by Size of Firm
Size ClassNumber of
EstablishmentsAverage Annual
Employment AnnualTotal Wages
Quarterly Census of Employment and Wages by Industry Division
IndustryNumber of
EstablishmentsAverage Annual
Employment AnnualTotal Wages
37

Quarterly Census of Employment and Wages (QCEW) 2008
AverageWeekly
Number Percent Number Percent Wage
0* 48 7% 24 0% $1,599,957 $1,290.981--4 332 47% 723 7% $19,944,324 $530.745--9 138 20% 931 10% $25,821,004 $533.6510--19 91 13% 1,211 12% $38,793,741 $616.2620-49 58 8% 1,789 18% $56,470,867 $607.0350-99 27 4% 1,866 19% $82,540,381 $850.54100-249 8 1% 1,242 13% $47,340,902 $733.21250-499 3 0% ND ND ND ND500-999 2 0% ND ND ND ND1000+ 0 0% 0 0% $0 $0.00TOTAL 706 100% 9,768 100% $332,599,749 $654.81* For the establishment which had zero employment in the third month of the quarter.
AverageWeekly
Number Percent Number Percent WageAgriculture, Forestry, Fishing and Hunting 13 2% 72 1% $1,734,523 $463.28Mining, Quarrying, and Oil and Gas Extraction 64 9% 1,049 11% $67,806,553 $1,243.06Utilities 12 2% 139 1% $5,702,544 $788.95Construction 74 10% 665 7% $25,970,842 $751.04Manufacturing 31 4% 1,080 11% $48,953,980 $871.69Wholesale Trade 36 5% 245 3% $10,245,240 $804.18Retail Trade 110 16% 1,782 18% $42,613,476 $459.87Transportation and Warehousing 44 6% 310 3% $13,685,044 $848.95Information 9 1% 36 0% $715,646 $382.29Finance and Insurance 41 6% 250 3% $9,134,177 $702.63Real Estate and Rental and Leasing 10 1% ND ND ND NDProfessional, Scientific, and Technical Services 54 8% 216 2% $6,544,055 $582.63Management of Companies and Enterprises 2 0% ND ND ND NDAdmin., Support, Waste Mgt. 22 3% 98 1% $2,615,663 $513.28Educational Services 8 1% 872 9% $24,337,427 $536.73Health Care and Social Assistance 58 8% 1,141 12% $31,746,917 $535.07Arts, Entertainment, and Recreation 4 1% 38 0% $492,140 $249.06Accommodation and Food Services 46 7% 665 7% $7,057,837 $204.10Other Services (except Public Administration) 34 5% 97 1% $2,178,587 $431.92Public Administration 35 5% 983 10% $30,433,768 $595.39Total 706 100% 9,768 100% $332,599,749 $654.81
GARVIN
Number of Establishments and Employment by Size of Firm
Size ClassNumber of
EstablishmentsAverage Annual
Employment AnnualTotal Wages
Quarterly Census of Employment and Wages by Industry Division
IndustryNumber of
EstablishmentsAverage Annual
Employment AnnualTotal Wages
38
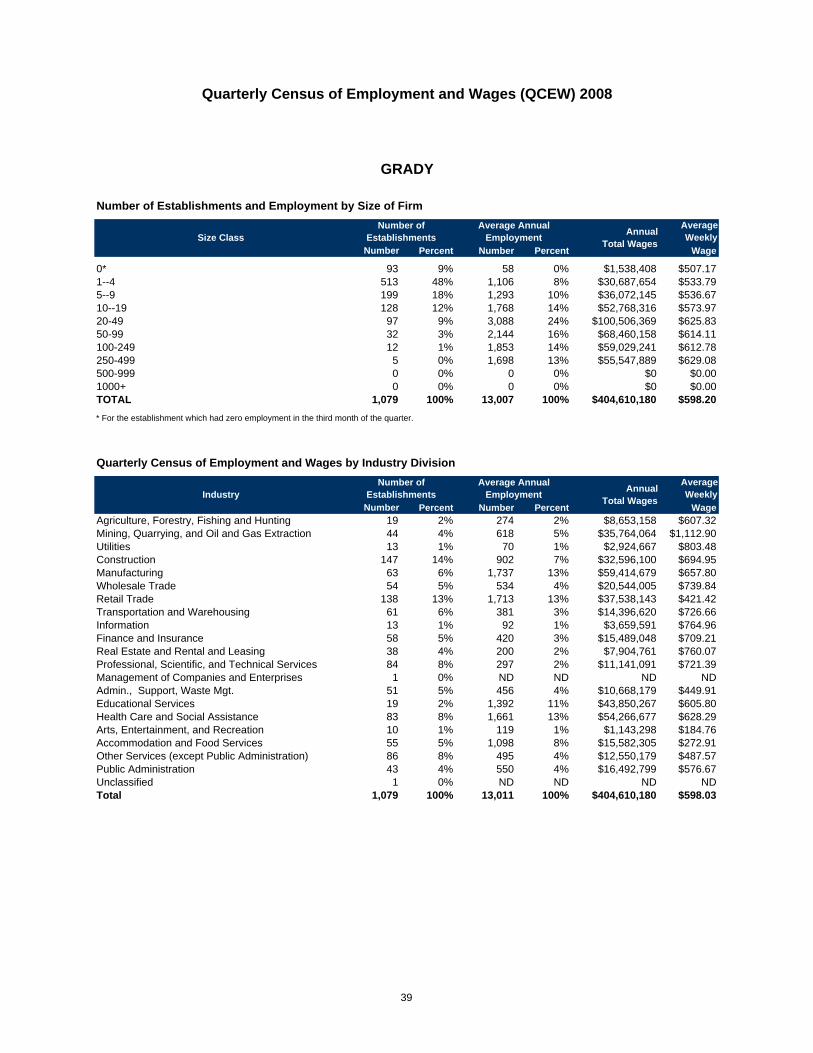
Quarterly Census of Employment and Wages (QCEW) 2008
AverageWeekly
Number Percent Number Percent Wage
0* 93 9% 58 0% $1,538,408 $507.171--4 513 48% 1,106 8% $30,687,654 $533.795--9 199 18% 1,293 10% $36,072,145 $536.6710--19 128 12% 1,768 14% $52,768,316 $573.9720-49 97 9% 3,088 24% $100,506,369 $625.8350-99 32 3% 2,144 16% $68,460,158 $614.11100-249 12 1% 1,853 14% $59,029,241 $612.78250-499 5 0% 1,698 13% $55,547,889 $629.08500-999 0 0% 0 0% $0 $0.001000+ 0 0% 0 0% $0 $0.00TOTAL 1,079 100% 13,007 100% $404,610,180 $598.20* For the establishment which had zero employment in the third month of the quarter.
AverageWeekly
Number Percent Number Percent WageAgriculture, Forestry, Fishing and Hunting 19 2% 274 2% $8,653,158 $607.32Mining, Quarrying, and Oil and Gas Extraction 44 4% 618 5% $35,764,064 $1,112.90Utilities 13 1% 70 1% $2,924,667 $803.48Construction 147 14% 902 7% $32,596,100 $694.95Manufacturing 63 6% 1,737 13% $59,414,679 $657.80Wholesale Trade 54 5% 534 4% $20,544,005 $739.84Retail Trade 138 13% 1,713 13% $37,538,143 $421.42Transportation and Warehousing 61 6% 381 3% $14,396,620 $726.66Information 13 1% 92 1% $3,659,591 $764.96Finance and Insurance 58 5% 420 3% $15,489,048 $709.21Real Estate and Rental and Leasing 38 4% 200 2% $7,904,761 $760.07Professional, Scientific, and Technical Services 84 8% 297 2% $11,141,091 $721.39Management of Companies and Enterprises 1 0% ND ND ND NDAdmin., Support, Waste Mgt. 51 5% 456 4% $10,668,179 $449.91Educational Services 19 2% 1,392 11% $43,850,267 $605.80Health Care and Social Assistance 83 8% 1,661 13% $54,266,677 $628.29Arts, Entertainment, and Recreation 10 1% 119 1% $1,143,298 $184.76Accommodation and Food Services 55 5% 1,098 8% $15,582,305 $272.91Other Services (except Public Administration) 86 8% 495 4% $12,550,179 $487.57Public Administration 43 4% 550 4% $16,492,799 $576.67Unclassified 1 0% ND ND ND NDTotal 1,079 100% 13,011 100% $404,610,180 $598.03
GRADY
Number of Establishments and Employment by Size of Firm
Size ClassNumber of
EstablishmentsAverage Annual
Employment AnnualTotal Wages
Quarterly Census of Employment and Wages by Industry Division
IndustryNumber of
EstablishmentsAverage Annual
Employment AnnualTotal Wages
39
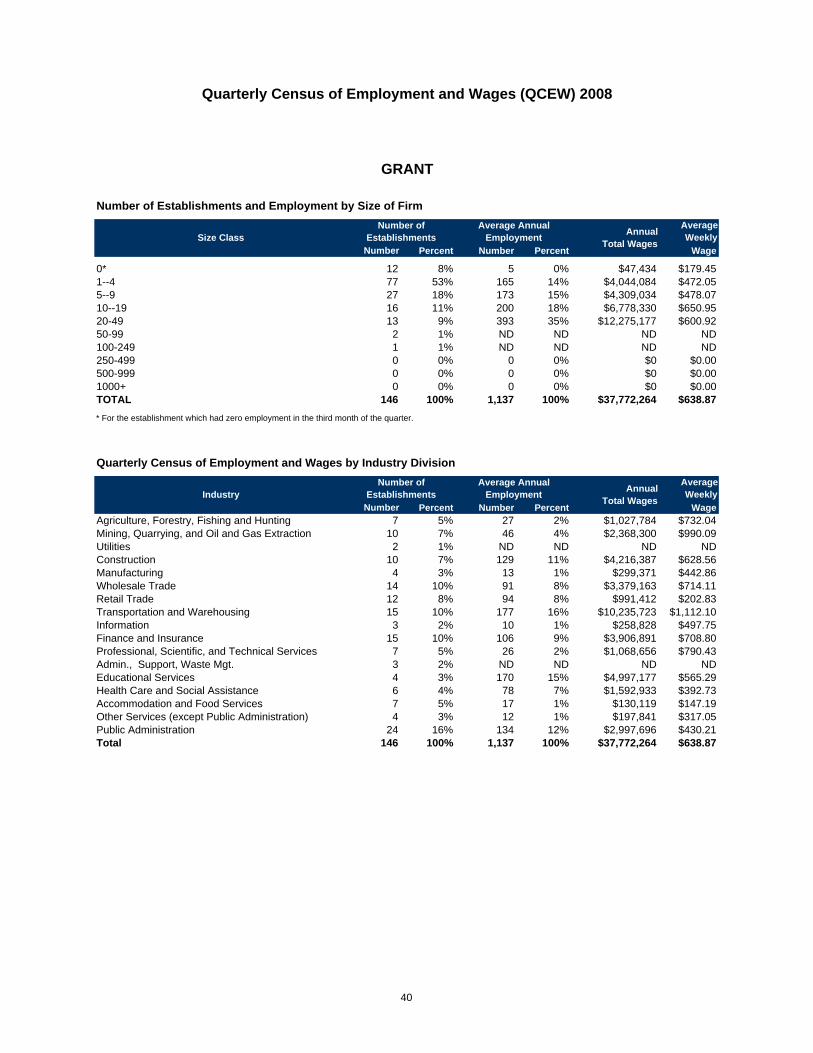
Quarterly Census of Employment and Wages (QCEW) 2008
AverageWeekly
Number Percent Number Percent Wage
0* 12 8% 5 0% $47,434 $179.451--4 77 53% 165 14% $4,044,084 $472.055--9 27 18% 173 15% $4,309,034 $478.0710--19 16 11% 200 18% $6,778,330 $650.9520-49 13 9% 393 35% $12,275,177 $600.9250-99 2 1% ND ND ND ND100-249 1 1% ND ND ND ND250-499 0 0% 0 0% $0 $0.00500-999 0 0% 0 0% $0 $0.001000+ 0 0% 0 0% $0 $0.00TOTAL 146 100% 1,137 100% $37,772,264 $638.87* For the establishment which had zero employment in the third month of the quarter.
AverageWeekly
Number Percent Number Percent WageAgriculture, Forestry, Fishing and Hunting 7 5% 27 2% $1,027,784 $732.04Mining, Quarrying, and Oil and Gas Extraction 10 7% 46 4% $2,368,300 $990.09Utilities 2 1% ND ND ND NDConstruction 10 7% 129 11% $4,216,387 $628.56Manufacturing 4 3% 13 1% $299,371 $442.86Wholesale Trade 14 10% 91 8% $3,379,163 $714.11Retail Trade 12 8% 94 8% $991,412 $202.83Transportation and Warehousing 15 10% 177 16% $10,235,723 $1,112.10Information 3 2% 10 1% $258,828 $497.75Finance and Insurance 15 10% 106 9% $3,906,891 $708.80Professional, Scientific, and Technical Services 7 5% 26 2% $1,068,656 $790.43Admin., Support, Waste Mgt. 3 2% ND ND ND NDEducational Services 4 3% 170 15% $4,997,177 $565.29Health Care and Social Assistance 6 4% 78 7% $1,592,933 $392.73Accommodation and Food Services 7 5% 17 1% $130,119 $147.19Other Services (except Public Administration) 4 3% 12 1% $197,841 $317.05Public Administration 24 16% 134 12% $2,997,696 $430.21Total 146 100% 1,137 100% $37,772,264 $638.87
GRANT
Number of Establishments and Employment by Size of Firm
Size ClassNumber of
EstablishmentsAverage Annual
Employment AnnualTotal Wages
Quarterly Census of Employment and Wages by Industry Division
IndustryNumber of
EstablishmentsAverage Annual
Employment AnnualTotal Wages
40

Quarterly Census of Employment and Wages (QCEW) 2008
AverageWeekly
Number Percent Number Percent Wage
0* 7 6% 4 0% $99,770 $489.871--4 57 49% 131 10% $2,763,365 $404.895--9 30 26% 201 15% $4,721,721 $451.3810--19 14 12% 197 14% $4,335,791 $423.9720-49 3 3% 179 13% $2,010,438 $431.5850-99 4 3% 279 20% $1,908,751 $526.26100-249 1 1% ND ND ND ND250-499 1 1% ND ND ND ND500-999 0 0% 0 0% $0 $0.001000+ 0 0% 0 0% $0 $0.00TOTAL 116 100% 1,367 100% $39,824,838 $560.25* For the establishment which had zero employment in the third month of the quarter.
AverageWeekly
Number Percent Number Percent WageAgriculture, Forestry, Fishing and Hunting 2 2% ND ND ND NDMining, Quarrying, and Oil and Gas Extraction 3 3% 10 1% $188,661 $362.81Utilities 4 3% ND ND ND NDConstruction 3 3% 13 1% $285,945 $423.00Manufacturing 2 2% ND ND ND NDWholesale Trade 2 2% ND ND ND NDRetail Trade 16 14% 153 11% $2,776,533 $348.99Transportation and Warehousing 8 7% 40 3% $1,197,816 $575.87Information 2 2% ND ND ND NDFinance and Insurance 10 9% 52 4% $1,335,086 $493.74Real Estate and Rental and Leasing 1 1% ND ND ND NDProfessional, Scientific, and Technical Services 5 4% 11 1% $198,869 $347.67Admin., Support, Waste Mgt. 6 5% 9 1% $153,968 $328.99Educational Services 2 2% ND ND ND NDHealth Care and Social Assistance 17 15% 214 16% $6,592,763 $592.45Arts, Entertainment, and Recreation 1 1% ND ND ND NDAccommodation and Food Services 4 3% 41 3% $438,101 $205.49Other Services (except Public Administration) 7 6% 28 2% $529,352 $363.57Public Administration 21 18% 544 40% $19,119,781 $675.90Total 116 100% 1,367 100% $39,824,838 $560.25
GREER
Number of Establishments and Employment by Size of Firm
Size ClassNumber of
EstablishmentsAverage Annual
Employment AnnualTotal Wages
Quarterly Census of Employment and Wages by Industry Division
IndustryNumber of
EstablishmentsAverage Annual
Employment AnnualTotal Wages
41

Quarterly Census of Employment and Wages (QCEW) 2008
AverageWeekly
Number Percent Number Percent Wage
0* 7 8% ND ND ND ND1--4 45 54% 89 13% $2,261,766 $487.805--9 15 18% 95 13% $2,219,489 $451.6710--19 5 6% 82 12% $1,599,377 $500.8020-49 9 11% 291 41% $7,506,273 $495.4950-99 2 2% ND ND ND ND100-249 0 0% 0 0% $0 $0.00250-499 0 0% 0 0% $0 $0.00500-999 0 0% 0 0% $0 $0.001000+ 0 0% 0 0% $0 $0.00TOTAL 83 100% 704 100% $18,362,992 $501.61* For the establishment which had zero employment in the third month of the quarter.
AverageWeekly
Number Percent Number Percent WageAgriculture, Forestry, Fishing and Hunting 7 8% 66 9% $1,722,331 $501.84Utilities 1 1% ND ND ND NDConstruction 5 6% 40 6% $851,242 $409.25Manufacturing 2 2% ND ND ND NDWholesale Trade 3 4% 67 10% $1,056,039 $303.11Retail Trade 14 17% 72 10% $1,108,911 $296.18Transportation and Warehousing 6 7% 16 2% $474,057 $569.78Information 2 2% ND ND ND NDFinance and Insurance 7 8% 68 10% $2,465,893 $697.37Real Estate and Rental and Leasing 1 1% ND ND ND NDProfessional, Scientific, and Technical Services 4 5% 7 1% $127,666 $350.73Management of Companies and Enterprises 1 1% ND ND ND NDAdmin., Support, Waste Mgt. 1 1% ND ND ND NDEducational Services 1 1% ND ND ND NDHealth Care and Social Assistance 9 11% ND ND ND NDArts, Entertainment, and Recreation 1 1% ND ND ND NDAccommodation and Food Services 2 2% ND ND ND NDOther Services (except Public Administration) 3 4% 8 1% $94,377 $226.87Public Administration 13 16% 70 10% $1,901,361 $522.35Total 83 100% 704 100% $18,362,992 $501.61
HARMON
Number of Establishments and Employment by Size of Firm
Size ClassNumber of
EstablishmentsAverage Annual
Employment AnnualTotal Wages
Quarterly Census of Employment and Wages by Industry Division
IndustryNumber of
EstablishmentsAverage Annual
Employment AnnualTotal Wages
42

Quarterly Census of Employment and Wages (QCEW) 2008
AverageWeekly
Number Percent Number Percent Wage
0* 7 5% 6 0% $692,695 $2,160.171--4 75 51% 159 12% $3,744,446 $453.125--9 30 21% 197 15% $5,397,857 $528.0510--19 18 12% 249 19% $6,210,790 $480.3120-49 11 7% 309 24% $9,490,372 $590.3250-99 4 3% ND ND ND ND100-249 1 1% ND ND ND ND250-499 0 0% 0 0% $0 $0.00500-999 0 0% 0 0% $0 $0.001000+ 0 0% 0 0% $0 $0.00TOTAL 146 100% 1,308 100% $38,410,391 $564.73* For the establishment which had zero employment in the third month of the quarter.
AverageWeekly
Number Percent Number Percent WageAgriculture, Forestry, Fishing and Hunting 14 10% 277 21% $11,078,703 $769.14Mining, Quarrying, and Oil and Gas Extraction 6 4% 74 6% $3,157,921 $820.67Utilities 4 3% 25 2% $823,483 $633.45Construction 11 8% 96 7% $3,203,925 $641.81Manufacturing 1 1% ND ND ND NDWholesale Trade 5 3% 24 2% $880,503 $705.53Retail Trade 17 12% 120 9% $1,865,470 $298.95Transportation and Warehousing 11 8% 28 2% $1,329,245 $912.94Information 2 1% ND ND ND NDFinance and Insurance 10 7% 50 4% $1,218,503 $468.66Real Estate and Rental and Leasing 2 1% ND ND ND NDProfessional, Scientific, and Technical Services 7 5% 29 2% $943,693 $625.79Management of Companies and Enterprises 1 1% ND ND ND NDAdmin., Support, Waste Mgt. 4 3% 9 1% $71,644 $153.09Educational Services 3 2% 142 11% $4,047,013 $548.08Health Care and Social Assistance 10 7% 148 11% $2,632,615 $342.08Accommodation and Food Services 5 3% 18 1% $119,059 $127.20Other Services (except Public Administration) 18 12% 58 4% $1,098,392 $364.19Public Administration 16 11% 173 13% $4,991,459 $554.85Total 146 100% 1,308 100% $38,410,391 $564.73
HARPER
Number of Establishments and Employment by Size of Firm
Size ClassNumber of
EstablishmentsAverage Annual
Employment AnnualTotal Wages
Quarterly Census of Employment and Wages by Industry Division
IndustryNumber of
EstablishmentsAverage Annual
Employment AnnualTotal Wages
43

Quarterly Census of Employment and Wages (QCEW) 2008
AverageWeekly
Number Percent Number Percent Wage
0* 21 8% 5 0% $108,010 $429.751--4 122 47% 265 7% $7,522,318 $545.205--9 47 18% 319 8% $7,336,604 $442.5210--19 23 9% 316 8% $8,547,407 $520.8620-49 32 12% 1,011 25% $31,093,667 $591.2550-99 9 4% 627 16% $16,752,537 $514.16100-249 3 1% ND ND ND ND250-499 0 0% 0 0% $0 $0.00500-999 1 0% ND ND ND ND1000+ 0 0% 0 0% $0 $0.00TOTAL 258 100% 3,970 100% $98,936,922 $479.25* For the establishment which had zero employment in the third month of the quarter.
AverageWeekly
Number Percent Number Percent WageAgriculture, Forestry, Fishing and Hunting 13 5% 56 1% $1,460,822 $501.66Mining, Quarrying, and Oil and Gas Extraction 23 9% 366 9% $13,373,033 $702.66Utilities 7 3% 59 1% $2,649,074 $863.45Construction 29 11% 281 7% $9,171,174 $627.65Manufacturing 4 2% ND ND ND NDWholesale Trade 7 3% 119 3% $2,608,557 $421.55Retail Trade 31 12% 472 12% $9,457,618 $385.33Transportation and Warehousing 14 5% 81 2% $2,060,403 $489.17Information 4 2% 36 1% $1,152,829 $615.83Finance and Insurance 11 4% 64 2% $1,986,898 $597.02Real Estate and Rental and Leasing 2 1% ND ND ND NDProfessional, Scientific, and Technical Services 26 10% 72 2% $2,684,964 $717.14Admin., Support, Waste Mgt. 11 4% 92 2% $2,707,954 $566.04Educational Services 6 2% 372 9% $11,103,451 $574.00Health Care and Social Assistance 29 11% 1,436 36% $29,428,881 $394.11Arts, Entertainment, and Recreation 2 1% ND ND ND NDAccommodation and Food Services 10 4% 134 3% $1,141,790 $163.86Other Services (except Public Administration) 8 3% 29 1% $622,640 $412.89Public Administration 21 8% 236 6% $5,962,822 $485.89Total 258 100% 3,970 100% $98,936,922 $479.25
HASKELL
Number of Establishments and Employment by Size of Firm
Size ClassNumber of
EstablishmentsAverage Annual
Employment AnnualTotal Wages
Quarterly Census of Employment and Wages by Industry Division
IndustryNumber of
EstablishmentsAverage Annual
Employment AnnualTotal Wages
44

Quarterly Census of Employment and Wages (QCEW) 2008
AverageWeekly
Number Percent Number Percent Wage
0* 21 8% 13 0% $215,681 $315.021--4 136 50% 278 10% $6,882,798 $476.125--9 52 19% 332 12% $7,848,416 $455.1810--19 29 11% 407 15% $9,907,290 $468.2220-49 25 9% 748 28% $22,353,886 $574.3950-99 4 1% ND ND ND ND100-249 4 2% 726 27% $12,573,474 $666.42250-499 0 0% 0 0% $0 $0.00500-999 0 0% 0 0% $0 $0.001000+ 0 0% 0 0% $0 $0.00TOTAL 270 100% 2,670 100% $73,311,779 $528.03* For the establishment which had zero employment in the third month of the quarter.
AverageWeekly
Number Percent Number Percent WageAgriculture, Forestry, Fishing and Hunting 4 1% 20 1% $662,410 $636.93Mining, Quarrying, and Oil and Gas Extraction 13 5% 52 2% $1,638,766 $606.05Utilities 7 3% 19 1% $321,303 $325.21Construction 27 10% 183 7% $6,550,481 $688.36Manufacturing 8 3% 231 9% $7,494,472 $623.92Wholesale Trade 9 3% 46 2% $963,375 $402.75Retail Trade 49 18% 351 13% $5,863,185 $321.24Transportation and Warehousing 19 7% 132 5% $6,959,295 $1,013.88Information 5 2% 39 1% $1,128,621 $556.52Finance and Insurance 23 9% 88 3% $2,649,720 $579.05Real Estate and Rental and Leasing 3 1% ND ND ND NDProfessional, Scientific, and Technical Services 9 3% 21 1% $469,202 $429.67Management of Companies and Enterprises 1 0% ND ND ND NDAdmin., Support, Waste Mgt. 9 3% ND ND ND NDEducational Services 7 3% 369 14% $12,760,028 $665.00Health Care and Social Assistance 24 9% 373 14% $9,031,467 $465.64Arts, Entertainment, and Recreation 3 1% 23 1% $262,487 $219.47Accommodation and Food Services 13 5% 156 6% $1,604,008 $197.73Other Services (except Public Administration) 10 4% 15 1% $270,474 $346.76Public Administration 30 11% 274 10% $6,511,217 $456.99Total 270 100% 2,670 100% $73,311,779 $528.03
HUGHES
Number of Establishments and Employment by Size of Firm
Size ClassNumber of
EstablishmentsAverage Annual
Employment AnnualTotal Wages
Quarterly Census of Employment and Wages by Industry Division
IndustryNumber of
EstablishmentsAverage Annual
Employment AnnualTotal Wages
45

Quarterly Census of Employment and Wages (QCEW) 2008
AverageWeekly
Number Percent Number Percent Wage
0* 54 9% 78 1% $1,279,194 $314.041--4 244 40% 567 5% $14,027,415 $475.835--9 137 22% 908 9% $23,154,238 $490.4310--19 89 15% 1,239 12% $32,597,149 $506.1520-49 57 9% 1,735 17% $43,297,742 $479.8450-99 16 3% 1,012 10% $25,014,035 $475.14100-249 8 1% 1,295 12% $47,073,168 $698.95250-499 2 0% ND ND ND ND500-999 3 0% ND ND ND ND1000+ 1 0% ND ND ND NDTOTAL 610 100% 10,452 100% $319,402,267 $587.66* For the establishment which had zero employment in the third month of the quarter.
AverageWeekly
Number Percent Number Percent WageAgriculture, Forestry, Fishing and Hunting 45 7% 302 3% $6,900,260 $439.40Mining, Quarrying, and Oil and Gas Extraction 2 0% ND ND ND NDUtilities 7 1% 78 1% $2,970,504 $732.37Construction 44 7% 235 2% $5,508,677 $450.79Manufacturing 14 2% 945 9% $33,071,413 $673.00Wholesale Trade 20 3% 176 2% $5,785,159 $632.12Retail Trade 108 18% 1,520 15% $31,475,885 $398.23Transportation and Warehousing 34 6% 426 4% $15,542,552 $701.63Information 11 2% 110 1% $3,361,493 $587.67Finance and Insurance 40 7% 262 3% $10,466,266 $768.22Real Estate and Rental and Leasing 19 3% 80 1% $2,014,504 $484.26Professional, Scientific, and Technical Services 43 7% 135 1% $4,474,948 $637.46Management of Companies and Enterprises 3 0% ND ND ND NDAdmin., Support, Waste Mgt. 34 6% 273 3% $6,770,622 $476.94Educational Services 16 3% 1,322 13% $50,587,370 $735.88Health Care and Social Assistance 50 8% 1,344 13% $42,874,284 $613.47Arts, Entertainment, and Recreation 9 1% 71 1% $1,009,917 $273.54Accommodation and Food Services 42 7% 1,115 11% $11,843,002 $204.26Other Services (except Public Administration) 37 6% 179 2% $4,205,158 $451.78Public Administration 36 6% 1,830 18% $77,931,945 $818.96Total 611 100% 10,457 100% $319,503,650 $587.58
JACKSON
Number of Establishments and Employment by Size of Firm
Size ClassNumber of
EstablishmentsAverage Annual
Employment AnnualTotal Wages
Quarterly Census of Employment and Wages by Industry Division
IndustryNumber of
EstablishmentsAverage Annual
Employment AnnualTotal Wages
46

Quarterly Census of Employment and Wages (QCEW) 2008
AverageWeekly
Number Percent Number Percent Wage
0* 16 10% ND ND ND ND1--4 76 49% 171 15% $4,612,277 $517.445--9 29 19% 194 17% $5,951,438 $589.7010--19 19 12% 248 21% $6,904,370 $536.1120-49 12 8% 361 31% $7,784,277 $414.5850-99 3 2% ND ND ND ND100-249 0 0% 0 0% $0 $0.00250-499 0 0% 0 0% $0 $0.00500-999 0 0% 0 0% $0 $0.001000+ 0 0% 0 0% $0 $0.00TOTAL 153 100% 1,155 100% $31,098,985 $517.80* For the establishment which had zero employment in the third month of the quarter.
AverageWeekly
Number Percent Number Percent WageAgriculture, Forestry, Fishing and Hunting 8 5% 35 3% $915,656 $503.11Mining, Quarrying, and Oil and Gas Extraction 6 4% 17 1% $809,749 $916.01Construction 8 5% 53 5% $1,442,202 $523.30Manufacturing 10 7% 69 6% $2,001,446 $557.82Wholesale Trade 6 4% 57 5% $748,382 $252.49Retail Trade 28 18% 149 13% $2,607,394 $336.52Transportation and Warehousing 12 8% 53 5% $1,879,490 $681.96Information 4 3% 20 2% $906,759 $871.88Finance and Insurance 11 7% 80 7% $2,386,933 $573.78Real Estate and Rental and Leasing 4 3% 8 1% $348,151 $836.90Professional, Scientific, and Technical Services 8 5% 23 2% $638,743 $534.07Educational Services 5 3% 191 17% $6,434,770 $647.88Health Care and Social Assistance 7 5% 174 15% $4,816,068 $532.28Accommodation and Food Services 6 4% 59 5% $641,124 $208.97Other Services (except Public Administration) 7 5% 36 3% $601,007 $321.05Public Administration 22 14% 126 11% $3,261,825 $497.84Total 153 100% 1,155 100% $31,098,985 $517.80
JEFFERSON
Number of Establishments and Employment by Size of Firm
Size ClassNumber of
EstablishmentsAverage Annual
Employment AnnualTotal Wages
Quarterly Census of Employment and Wages by Industry Division
IndustryNumber of
EstablishmentsAverage Annual
Employment AnnualTotal Wages
47
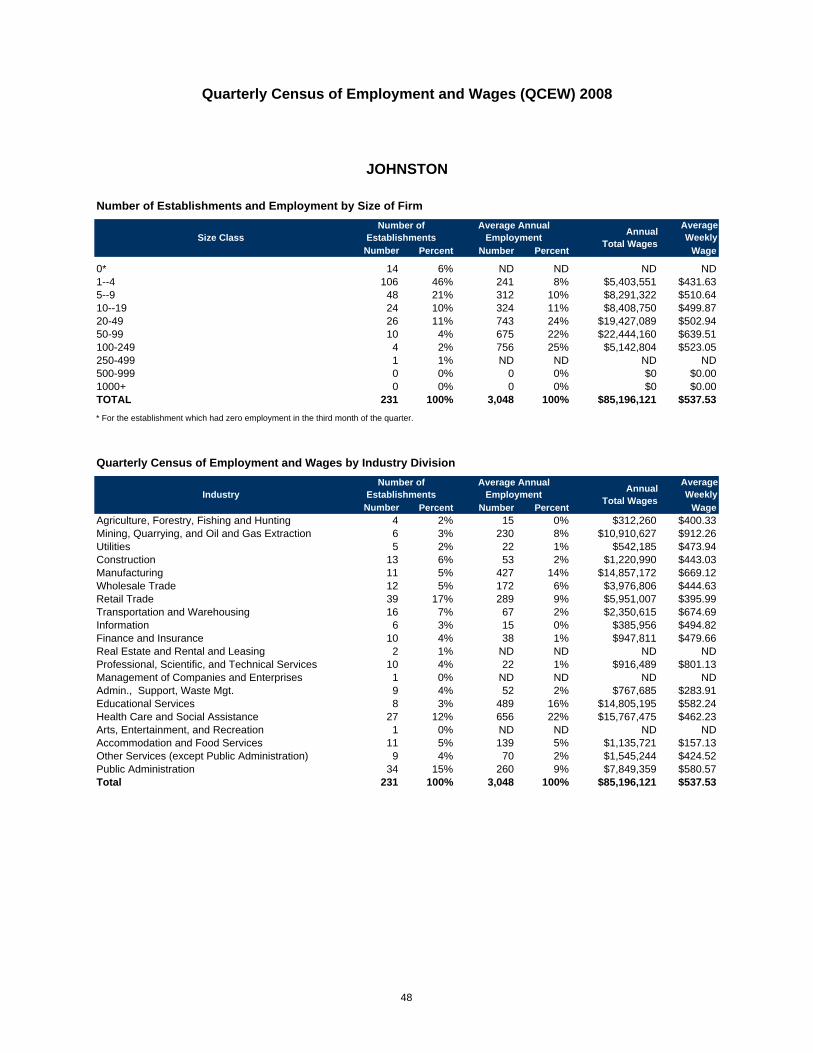
Quarterly Census of Employment and Wages (QCEW) 2008
AverageWeekly
Number Percent Number Percent Wage
0* 14 6% ND ND ND ND1--4 106 46% 241 8% $5,403,551 $431.635--9 48 21% 312 10% $8,291,322 $510.6410--19 24 10% 324 11% $8,408,750 $499.8720-49 26 11% 743 24% $19,427,089 $502.9450-99 10 4% 675 22% $22,444,160 $639.51100-249 4 2% 756 25% $5,142,804 $523.05250-499 1 1% ND ND ND ND500-999 0 0% 0 0% $0 $0.001000+ 0 0% 0 0% $0 $0.00TOTAL 231 100% 3,048 100% $85,196,121 $537.53* For the establishment which had zero employment in the third month of the quarter.
AverageWeekly
Number Percent Number Percent WageAgriculture, Forestry, Fishing and Hunting 4 2% 15 0% $312,260 $400.33Mining, Quarrying, and Oil and Gas Extraction 6 3% 230 8% $10,910,627 $912.26Utilities 5 2% 22 1% $542,185 $473.94Construction 13 6% 53 2% $1,220,990 $443.03Manufacturing 11 5% 427 14% $14,857,172 $669.12Wholesale Trade 12 5% 172 6% $3,976,806 $444.63Retail Trade 39 17% 289 9% $5,951,007 $395.99Transportation and Warehousing 16 7% 67 2% $2,350,615 $674.69Information 6 3% 15 0% $385,956 $494.82Finance and Insurance 10 4% 38 1% $947,811 $479.66Real Estate and Rental and Leasing 2 1% ND ND ND NDProfessional, Scientific, and Technical Services 10 4% 22 1% $916,489 $801.13Management of Companies and Enterprises 1 0% ND ND ND NDAdmin., Support, Waste Mgt. 9 4% 52 2% $767,685 $283.91Educational Services 8 3% 489 16% $14,805,195 $582.24Health Care and Social Assistance 27 12% 656 22% $15,767,475 $462.23Arts, Entertainment, and Recreation 1 0% ND ND ND NDAccommodation and Food Services 11 5% 139 5% $1,135,721 $157.13Other Services (except Public Administration) 9 4% 70 2% $1,545,244 $424.52Public Administration 34 15% 260 9% $7,849,359 $580.57Total 231 100% 3,048 100% $85,196,121 $537.53
JOHNSTON
Number of Establishments and Employment by Size of Firm
Size ClassNumber of
EstablishmentsAverage Annual
Employment AnnualTotal Wages
Quarterly Census of Employment and Wages by Industry Division
IndustryNumber of
EstablishmentsAverage Annual
Employment AnnualTotal Wages
48

Quarterly Census of Employment and Wages (QCEW) 2008
AverageWeekly
Number Percent Number Percent Wage
0* 85 7% ND ND ND ND1--4 554 44% 1,264 6% $35,547,499 $540.905--9 243 19% 1,612 7% $42,794,993 $510.5910--19 178 14% 2,450 11% $69,457,259 $545.1020-49 129 10% 3,896 18% $115,415,565 $569.6550-99 33 3% 2,344 11% $68,919,061 $565.33100-249 22 2% 3,338 15% $122,543,448 $706.05250-499 9 1% 3,136 14% $93,132,653 $571.05500-999 3 0% 2,740 13% $55,701,946 $781.891000+ 1 0% ND ND ND NDTOTAL 1,256 100% 21,672 100% $753,900,835 $668.98* For the establishment which had zero employment in the third month of the quarter.
AverageWeekly
Number Percent Number Percent WageAgriculture, Forestry, Fishing and Hunting 4 0% 10 0% $243,444 $468.16Mining, Quarrying, and Oil and Gas Extraction 24 2% ND ND ND NDUtilities 13 1% 150 1% $6,732,493 $863.14Construction 108 9% 1,601 7% $74,626,337 $896.39Manufacturing 72 6% 2,960 14% $109,378,398 $710.62Wholesale Trade 59 5% 586 3% $32,704,184 $1,073.25Retail Trade 181 14% 2,209 10% $44,738,006 $389.47Transportation and Warehousing 38 3% 535 2% $22,983,501 $826.15Information 26 2% 425 2% $14,204,478 $642.74Finance and Insurance 81 6% 617 3% $19,794,843 $616.97Real Estate and Rental and Leasing 47 4% 185 1% $4,323,607 $449.44Professional, Scientific, and Technical Services 92 7% 764 4% $36,643,372 $922.36Management of Companies and Enterprises 9 1% 99 0% $4,458,122 $865.99Admin., Support, Waste Mgt. 68 5% 1,483 7% $33,695,526 $436.95Educational Services 14 1% 1,933 9% $54,625,058 $543.45Health Care and Social Assistance 159 13% 2,168 10% $60,963,906 $540.77Arts, Entertainment, and Recreation 19 2% 1,030 5% $23,440,078 $437.64Accommodation and Food Services 89 7% 1,419 7% $15,399,310 $208.70Other Services (except Public Administration) 91 7% 615 3% $21,097,596 $659.71Public Administration 62 5% 1,018 5% $33,789,706 $638.31Unclassified 2 0% ND ND ND NDTotal 1,256 100% 21,672 100% $753,900,835 $668.98
KAY
Number of Establishments and Employment by Size of Firm
Size ClassNumber of
EstablishmentsAverage Annual
Employment AnnualTotal Wages
Quarterly Census of Employment and Wages by Industry Division
IndustryNumber of
EstablishmentsAverage Annual
Employment AnnualTotal Wages
49

Quarterly Census of Employment and Wages (QCEW) 2008
AverageWeekly
Number Percent Number Percent Wage
0* 35 7% 19 0% $657,050 $662.131--4 238 48% 505 8% $16,064,577 $611.755--9 105 21% 692 11% $21,642,787 $601.8210--19 55 11% 720 12% $21,585,955 $576.2120-49 48 10% 1,475 24% $48,896,361 $637.7250-99 9 2% 590 10% $29,357,616 $956.90100-249 6 1% 826 13% $30,859,951 $718.19250-499 2 0% ND ND ND ND500-999 1 0% ND ND ND ND1000+ 0 0% 0 0% $0 $0.00TOTAL 500 100% 6,161 100% $220,299,801 $687.64* For the establishment which had zero employment in the third month of the quarter.
AverageWeekly
Number Percent Number Percent WageAgriculture, Forestry, Fishing and Hunting 10 2% 36 1% $947,428 $506.10Mining, Quarrying, and Oil and Gas Extraction 74 15% 849 14% $46,130,891 $1,044.91Utilities 8 2% 124 2% $6,453,338 $1,000.83Construction 50 10% 411 7% $15,367,933 $719.07Manufacturing 28 6% 1,130 18% $38,761,359 $659.66Wholesale Trade 22 4% 207 3% $8,043,434 $747.25Retail Trade 61 12% 669 11% $18,153,389 $521.83Transportation and Warehousing 26 5% 163 3% $7,320,175 $863.64Information 9 2% ND ND ND NDFinance and Insurance 29 6% 191 3% $6,248,961 $629.17Real Estate and Rental and Leasing 11 2% ND ND ND NDProfessional, Scientific, and Technical Services 30 6% 184 3% $8,255,367 $862.81Admin., Support, Waste Mgt. 19 4% 131 2% $4,719,145 $692.77Educational Services 8 2% 497 8% $15,445,030 $597.63Health Care and Social Assistance 31 6% 412 7% $10,968,513 $511.97Arts, Entertainment, and Recreation 4 1% 35 1% $351,837 $193.32Accommodation and Food Services 20 4% 249 4% $2,285,801 $176.54Other Services (except Public Administration) 38 8% 186 3% $5,376,303 $555.86Public Administration 25 5% 238 4% $5,321,350 $429.97Total 500 100% 6,161 100% $220,299,801 $687.64
KINGFISHER
Number of Establishments and Employment by Size of Firm
Size ClassNumber of
EstablishmentsAverage Annual
Employment AnnualTotal Wages
Quarterly Census of Employment and Wages by Industry Division
IndustryNumber of
EstablishmentsAverage Annual
Employment AnnualTotal Wages
50

Quarterly Census of Employment and Wages (QCEW) 2008
AverageWeekly
Number Percent Number Percent Wage
0* 16 6% ND ND ND ND1--4 140 55% 319 13% $7,948,454 $479.925--9 53 21% 340 14% $7,897,759 $447.0310--19 26 10% 348 15% $9,089,579 $502.6620-49 10 4% 275 12% $6,958,875 $487.0850-99 9 3% 570 24% $15,941,161 $537.98100-249 3 1% ND ND ND ND250-499 0 0% 0 0% $0 $0.00500-999 0 0% 0 0% $0 $0.001000+ 0 0% 0 0% $0 $0.00TOTAL 255 100% 2,381 100% $63,501,110 $512.88* For the establishment which had zero employment in the third month of the quarter.
AverageWeekly
Number Percent Number Percent WageAgriculture, Forestry, Fishing and Hunting 6 2% 39 2% $1,086,955 $535.97Mining, Quarrying, and Oil and Gas Extraction 10 4% 184 8% $8,765,932 $916.17Utilities 8 3% 29 1% $1,167,653 $774.31Construction 13 5% 75 3% $1,468,687 $376.59Manufacturing 5 2% ND ND ND NDWholesale Trade 12 5% 110 5% $2,602,290 $454.95Retail Trade 34 13% 256 11% $4,696,119 $352.77Transportation and Warehousing 14 5% 68 3% $2,616,513 $739.96Information 9 4% 30 1% $872,899 $559.55Finance and Insurance 19 7% 113 5% $3,166,156 $538.83Real Estate and Rental and Leasing 6 2% 13 1% $318,995 $471.89Professional, Scientific, and Technical Services 15 6% 40 2% $898,065 $431.76Admin., Support, Waste Mgt. 7 3% ND ND ND NDEducational Services 4 2% 274 12% $8,657,117 $607.60Health Care and Social Assistance 25 10% 516 22% $12,182,360 $454.02Arts, Entertainment, and Recreation 4 2% 21 1% $505,772 $463.16Accommodation and Food Services 14 5% 100 4% $867,147 $166.76Other Services (except Public Administration) 13 5% 127 5% $2,195,807 $332.50Public Administration 39 15% 201 8% $5,606,228 $536.38Total 255 100% 2,381 100% $63,501,110 $512.88
KIOWA
Number of Establishments and Employment by Size of Firm
Size ClassNumber of
EstablishmentsAverage Annual
Employment AnnualTotal Wages
Quarterly Census of Employment and Wages by Industry Division
IndustryNumber of
EstablishmentsAverage Annual
Employment AnnualTotal Wages
51

Quarterly Census of Employment and Wages (QCEW) 2008
AverageWeekly
Number Percent Number Percent Wage
0* 20 9% 4 0% $197,650 $860.601--4 78 37% 171 4% $4,533,970 $511.395--9 47 22% 313 7% $8,708,976 $535.5110--19 29 13% 382 9% $11,752,342 $591.6420-49 23 11% 675 15% $26,595,992 $758.2850-99 7 3% 438 10% $21,677,141 $951.39100-249 8 4% 1,327 30% $50,687,720 $734.79250-499 1 0% ND ND ND ND500-999 1 0% ND ND ND ND1000+ 0 0% 0 0% $0 $0.00TOTAL 214 100% 4,431 100% $188,292,394 $817.20* For the establishment which had zero employment in the third month of the quarter.
AverageWeekly
Number Percent Number Percent WageAgriculture, Forestry, Fishing and Hunting 1 0% ND ND ND NDMining, Quarrying, and Oil and Gas Extraction 20 9% 1,308 30% $83,328,959 $1,225.14Utilities 9 4% 82 2% $4,330,685 $1,015.64Construction 21 10% 471 11% $18,925,151 $772.71Manufacturing 5 2% ND ND ND NDWholesale Trade 8 4% 69 2% $3,159,207 $880.49Retail Trade 23 11% 277 6% $4,420,507 $306.89Transportation and Warehousing 13 6% 206 5% $12,280,998 $1,146.47Information 4 2% 21 0% $402,540 $368.63Finance and Insurance 14 7% 59 1% $1,550,625 $505.42Real Estate and Rental and Leasing 5 2% 58 1% $2,447,845 $811.62Professional, Scientific, and Technical Services 14 7% 29 1% $963,657 $639.03Admin., Support, Waste Mgt. 8 4% 97 2% $4,602,567 $912.48Educational Services 8 4% 514 12% $17,160,792 $642.05Health Care and Social Assistance 20 9% 532 12% $15,050,654 $544.05Arts, Entertainment, and Recreation 3 1% 25 1% $460,889 $354.53Accommodation and Food Services 11 5% 129 3% $977,547 $145.73Other Services (except Public Administration) 5 2% 8 0% $88,114 $211.81Public Administration 24 11% 246 6% $6,704,150 $524.09Total 214 100% 4,431 100% $188,292,394 $817.20
LATIMER
Number of Establishments and Employment by Size of Firm
Size ClassNumber of
EstablishmentsAverage Annual
Employment AnnualTotal Wages
Quarterly Census of Employment and Wages by Industry Division
IndustryNumber of
EstablishmentsAverage Annual
Employment AnnualTotal Wages
52

Quarterly Census of Employment and Wages (QCEW) 2008
AverageWeekly
Number Percent Number Percent Wage
0* 81 9% 19 0% $431,062 $430.631--4 381 43% 830 6% $21,217,168 $491.895--9 175 20% 1,183 9% $27,983,355 $455.0610--19 113 13% 1,474 11% $45,587,088 $594.9620-49 77 9% 2,360 17% $60,972,701 $496.7650-99 30 3% 2,112 15% $64,494,908 $587.33100-249 12 1% 1,587 12% $58,757,917 $712.23250-499 5 1% 2,209 16% $14,129,569 $491.95500-999 2 0% ND ND ND ND1000+ 1 0% ND ND ND NDTOTAL 876 100% 13,671 100% $376,134,018 $529.10* For the establishment which had zero employment in the third month of the quarter.
AverageWeekly
Number Percent Number Percent WageAgriculture, Forestry, Fishing and Hunting 10 1% 127 1% $4,449,449 $673.75Mining, Quarrying, and Oil and Gas Extraction 51 6% 832 6% $39,857,692 $921.27Utilities 18 2% 118 1% $4,023,626 $655.74Construction 63 7% 840 6% $31,161,246 $713.40Manufacturing 39 4% 2,258 17% $66,865,124 $569.47Wholesale Trade 27 3% 197 1% $6,078,651 $593.39Retail Trade 143 16% 1,651 12% $31,279,820 $364.35Transportation and Warehousing 45 5% 281 2% $8,850,937 $605.73Information 11 1% 70 1% $2,588,847 $711.22Finance and Insurance 70 8% 386 3% $11,628,055 $579.32Real Estate and Rental and Leasing 18 2% 59 0% $1,486,654 $484.57Professional, Scientific, and Technical Services 68 8% 272 2% $11,768,681 $832.06Management of Companies and Enterprises 3 0% ND ND ND NDAdmin., Support, Waste Mgt. 45 5% 861 6% $13,003,202 $290.43Educational Services 22 3% 1,758 13% $55,754,253 $609.90Health Care and Social Assistance 80 9% 1,396 10% $33,468,816 $461.05Arts, Entertainment, and Recreation 6 1% ND ND ND NDAccommodation and Food Services 49 6% 697 5% $7,150,066 $197.28Other Services (except Public Administration) 57 7% 192 1% $4,463,261 $447.04Public Administration 52 6% 931 7% $27,191,447 $561.67Total 876 100% 13,671 100% $376,134,018 $529.10
LE FLORE
Number of Establishments and Employment by Size of Firm
Size ClassNumber of
EstablishmentsAverage Annual
Employment AnnualTotal Wages
Quarterly Census of Employment and Wages by Industry Division
IndustryNumber of
EstablishmentsAverage Annual
Employment AnnualTotal Wages
53

Quarterly Census of Employment and Wages (QCEW) 2008
AverageWeekly
Number Percent Number Percent Wage
0* 44 7% ND ND ND ND1--4 294 49% 599 8% $15,726,027 $505.305--9 114 19% 745 10% $18,932,016 $488.8610--19 71 12% 975 13% $26,652,694 $525.4720-49 47 8% 1,397 18% $38,788,141 $533.8850-99 20 3% 1,293 17% $36,320,647 $540.27100-249 12 2% 1,919 25% $67,681,147 $678.34250-499 0 0% 0 0% $0 $0.00500-999 1 0% ND ND ND ND1000+ 0 0% 0 0% $0 $0.00TOTAL 602 100% 7,704 100% $229,561,315 $573.03* For the establishment which had zero employment in the third month of the quarter.
AverageWeekly
Number Percent Number Percent WageAgriculture, Forestry, Fishing and Hunting 1 0% ND ND ND NDMining, Quarrying, and Oil and Gas Extraction 14 2% 190 2% $10,735,902 $1,086.63Utilities 3 0% 9 0% $626,807 $1,339.33Construction 98 16% 674 9% $19,515,953 $556.83Manufacturing 29 5% 653 8% $23,712,925 $698.34Wholesale Trade 28 5% 325 4% $11,581,410 $685.29Retail Trade 80 13% 735 10% $14,817,122 $387.68Transportation and Warehousing 43 7% 458 6% $17,618,401 $739.77Information 10 2% ND ND ND NDFinance and Insurance 39 6% 499 6% $22,080,247 $850.94Real Estate and Rental and Leasing 13 2% 58 1% $1,410,952 $467.82Professional, Scientific, and Technical Services 48 8% 161 2% $5,591,741 $667.91Management of Companies and Enterprises 3 0% 13 0% $647,747 $958.21Admin., Support, Waste Mgt. 18 3% 56 1% $1,269,796 $436.06Educational Services 10 2% 772 10% $23,717,045 $590.80Health Care and Social Assistance 51 8% 763 10% $17,629,403 $444.33Arts, Entertainment, and Recreation 6 1% ND ND ND NDAccommodation and Food Services 34 6% 470 6% $4,439,142 $181.63Other Services (except Public Administration) 32 5% 93 1% $2,076,763 $429.44Public Administration 43 7% 713 9% $18,670,317 $503.57Total 602 100% 7,704 100% $229,561,315 $573.03
LINCOLN
Number of Establishments and Employment by Size of Firm
Size ClassNumber of
EstablishmentsAverage Annual
Employment AnnualTotal Wages
Quarterly Census of Employment and Wages by Industry Division
IndustryNumber of
EstablishmentsAverage Annual
Employment AnnualTotal Wages
54

Quarterly Census of Employment and Wages (QCEW) 2008
AverageWeekly
Number Percent Number Percent Wage
0* 53 9% 25 0% $839,986 $637.641--4 315 50% 662 10% $17,117,336 $497.005--9 109 17% 726 11% $17,819,862 $472.0210--19 72 11% 973 14% $27,483,018 $543.0020-49 59 9% 1,694 25% $46,082,554 $523.1250-99 10 2% 683 10% $21,555,335 $607.29100-249 5 1% 870 13% $23,642,746 $522.86250-499 3 0% ND ND ND ND500-999 0 0% 0 0% $0 $0.001000+ 0 0% 0 0% $0 $0.00TOTAL 626 100% 6,854 100% $193,301,167 $542.36* For the establishment which had zero employment in the third month of the quarter.
AverageWeekly
Number Percent Number Percent WageAgriculture, Forestry, Fishing and Hunting 12 2% 121 2% $3,123,469 $496.42Mining, Quarrying, and Oil and Gas Extraction 22 4% 140 2% $6,368,198 $874.75Utilities 6 1% 29 0% $1,325,344 $878.88Construction 108 17% 499 7% $16,850,953 $649.41Manufacturing 24 4% 394 6% $15,222,612 $743.00Wholesale Trade 25 4% 144 2% $5,002,532 $668.07Retail Trade 79 13% 842 12% $19,265,054 $440.00Transportation and Warehousing 29 5% 199 3% $7,375,950 $712.79Information 6 1% 21 0% $679,852 $622.58Finance and Insurance 33 5% 231 3% $7,909,374 $658.46Real Estate and Rental and Leasing 21 3% 75 1% $1,477,647 $378.88Professional, Scientific, and Technical Services 39 6% 160 2% $4,825,273 $579.96Management of Companies and Enterprises 1 0% ND ND ND NDAdmin., Support, Waste Mgt. 36 6% 264 4% $6,768,444 $493.04Educational Services 6 1% 1,090 16% $38,824,628 $684.98Health Care and Social Assistance 45 7% 1,151 17% $30,414,996 $508.17Arts, Entertainment, and Recreation 12 2% 154 2% $2,105,875 $262.97Accommodation and Food Services 42 7% 574 8% $6,258,644 $209.68Other Services (except Public Administration) 45 7% 168 2% $4,597,642 $526.29Public Administration 35 6% 362 5% $10,706,779 $568.78Unclassified 2 0% ND ND ND NDTotal 626 100% 6,854 100% $193,301,167 $542.36
LOGAN
Number of Establishments and Employment by Size of Firm
Size ClassNumber of
EstablishmentsAverage Annual
Employment AnnualTotal Wages
Quarterly Census of Employment and Wages by Industry Division
IndustryNumber of
EstablishmentsAverage Annual
Employment AnnualTotal Wages
55

Quarterly Census of Employment and Wages (QCEW) 2008
AverageWeekly
Number Percent Number Percent Wage
0* 14 8% ND ND ND ND1--4 88 50% 181 5% $4,740,803 $504.395--9 32 18% 212 6% $5,020,904 $454.5610--19 19 11% 262 7% $6,266,014 $459.7820-49 14 8% 410 11% $9,587,917 $450.2650-99 5 3% 292 8% $7,237,475 $476.79100-249 3 2% ND ND ND ND250-499 0 0% 0 0% $0 $0.00500-999 0 0% 0 0% $0 $0.001000+ 1 1% ND ND ND NDTOTAL 176 100% 3,744 100% $98,269,841 $504.76* For the establishment which had zero employment in the third month of the quarter.
AverageWeekly
Number Percent Number Percent WageAgriculture, Forestry, Fishing and Hunting 5 3% 44 1% $1,186,200 $518.44Mining, Quarrying, and Oil and Gas Extraction 3 2% ND ND ND NDUtilities 5 3% 67 2% $2,420,037 $694.61Construction 19 11% 93 2% $3,347,674 $692.24Manufacturing 4 2% 93 2% $2,163,604 $447.40Wholesale Trade 10 6% ND ND ND NDRetail Trade 24 14% 339 9% $8,859,489 $502.58Transportation and Warehousing 9 5% 23 1% $730,317 $610.63Information 4 2% 20 1% $386,928 $372.05Finance and Insurance 14 8% 66 2% $1,619,367 $471.84Real Estate and Rental and Leasing 2 1% ND ND ND NDProfessional, Scientific, and Technical Services 16 9% 32 1% $795,838 $478.27Admin., Support, Waste Mgt. 2 1% ND ND ND NDEducational Services 5 3% 232 6% $7,037,019 $583.31Health Care and Social Assistance 11 6% 165 4% $2,984,072 $347.79Arts, Entertainment, and Recreation 3 2% ND ND ND NDAccommodation and Food Services 10 6% 161 4% $1,724,490 $205.98Other Services (except Public Administration) 9 5% 35 1% $622,168 $341.85Public Administration 22 13% 147 4% $3,949,065 $516.62Total 176 100% 3,744 100% $98,269,841 $504.76
LOVE
Number of Establishments and Employment by Size of Firm
Size ClassNumber of
EstablishmentsAverage Annual
Employment AnnualTotal Wages
Quarterly Census of Employment and Wages by Industry Division
IndustryNumber of
EstablishmentsAverage Annual
Employment AnnualTotal Wages
56

Quarterly Census of Employment and Wages (QCEW) 2008
AverageWeekly
Number Percent Number Percent Wage
0* 89 11% 30 0% $758,036 $490.001--4 402 49% 811 10% $21,970,758 $521.095--9 147 18% 969 12% $26,818,044 $532.5110--19 99 12% 1,330 17% $37,972,482 $549.1220-49 63 8% 1,903 24% $52,983,866 $535.5550-99 15 2% 978 13% $34,011,188 $668.49100-249 8 1% 1,338 17% $20,792,889 $597.70250-499 2 0% ND ND ND ND500-999 0 0% 0 0% $0 $0.001000+ 0 0% 0 0% $0 $0.00TOTAL 825 100% 7,810 100% $221,491,284 $545.41* For the establishment which had zero employment in the third month of the quarter.
AverageWeekly
Number Percent Number Percent WageAgriculture, Forestry, Fishing and Hunting 25 3% 124 2% $3,004,505 $465.96Mining, Quarrying, and Oil and Gas Extraction 25 3% 304 4% $13,940,135 $881.84Utilities 5 1% 46 1% $2,769,368 $1,157.76Construction 158 19% 1,069 14% $38,181,032 $686.86Manufacturing 25 3% 240 3% $7,625,191 $610.99Wholesale Trade 33 4% 144 2% $4,557,757 $608.67Retail Trade 109 13% 1,527 20% $33,850,684 $426.31Transportation and Warehousing 42 5% 244 3% $8,559,824 $674.64Information 8 1% 97 1% $3,278,335 $649.95Finance and Insurance 55 7% 315 4% $9,522,748 $581.36Real Estate and Rental and Leasing 25 3% 69 1% $1,722,002 $479.93Professional, Scientific, and Technical Services 79 10% 283 4% $10,156,741 $690.18Admin., Support, Waste Mgt. 37 4% 159 2% $5,229,798 $632.53Educational Services 10 1% 1,006 13% $30,909,924 $590.88Health Care and Social Assistance 48 6% 805 10% $21,668,170 $517.63Arts, Entertainment, and Recreation 8 1% 61 1% $1,197,347 $377.47Accommodation and Food Services 46 6% 726 9% $8,445,700 $223.72Other Services (except Public Administration) 49 6% 151 2% $3,453,106 $439.77Public Administration 40 5% 440 6% $13,373,419 $584.50Total 825 100% 7,810 100% $221,491,284 $545.38
McCLAIN
Number of Establishments and Employment by Size of Firm
Size ClassNumber of
EstablishmentsAverage Annual
Employment AnnualTotal Wages
Quarterly Census of Employment and Wages by Industry Division
IndustryNumber of
EstablishmentsAverage Annual
Employment AnnualTotal Wages
57

Quarterly Census of Employment and Wages (QCEW) 2008
AverageWeekly
Number Percent Number Percent Wage
0* 44 7% 94 1% $6,306,593 $1,297.121--4 283 43% 672 6% $16,451,377 $471.145--9 146 22% 973 9% $24,342,099 $481.2310--19 90 14% 1,214 12% $33,317,974 $527.7120-49 48 7% 1,406 14% $36,358,625 $497.2750-99 23 3% 1,574 15% $40,013,009 $488.95100-249 16 2% 2,455 24% $78,001,379 $611.07250-499 4 1% 1,132 11% $25,571,079 $869.07500-999 1 0% ND ND ND ND1000+ 1 0% ND ND ND NDTOTAL 654 100% 10,393 100% $305,377,535 $565.06* For the establishment which had zero employment in the third month of the quarter.
AverageWeekly
Number Percent Number Percent WageAgriculture, Forestry, Fishing and Hunting 33 5% 299 3% $12,193,252 $784.23Mining, Quarrying, and Oil and Gas Extraction 4 1% ND ND ND NDUtilities 15 2% 111 1% $3,976,629 $688.95Construction 56 9% 712 7% $25,978,615 $701.67Manufacturing 26 4% 1,994 19% $83,118,757 $801.62Wholesale Trade 32 5% 155 1% $4,871,251 $604.37Retail Trade 107 16% 1,102 11% $21,313,666 $371.94Transportation and Warehousing 39 6% 479 5% $17,662,119 $709.09Information 17 3% 135 1% $6,007,126 $855.72Finance and Insurance 39 6% 277 3% $7,066,244 $490.58Real Estate and Rental and Leasing 15 2% 71 1% $1,105,851 $299.53Professional, Scientific, and Technical Services 30 5% 375 4% $9,864,630 $505.88Admin., Support, Waste Mgt. 24 4% 333 3% $6,731,562 $388.75Educational Services 18 3% 1,157 11% $36,041,367 $599.05Health Care and Social Assistance 62 9% 1,381 13% $32,744,932 $455.98Arts, Entertainment, and Recreation 8 1% ND ND ND NDAccommodation and Food Services 34 5% 540 5% $5,661,973 $201.64Other Services (except Public Administration) 47 7% 236 2% $3,925,908 $319.91Public Administration 49 7% 668 6% $18,893,534 $543.92Total 654 100% 10,393 100% $305,377,535 $565.06
McCURTAIN
Number of Establishments and Employment by Size of Firm
Size ClassNumber of
EstablishmentsAverage Annual
Employment AnnualTotal Wages
Quarterly Census of Employment and Wages by Industry Division
IndustryNumber of
EstablishmentsAverage Annual
Employment AnnualTotal Wages
58
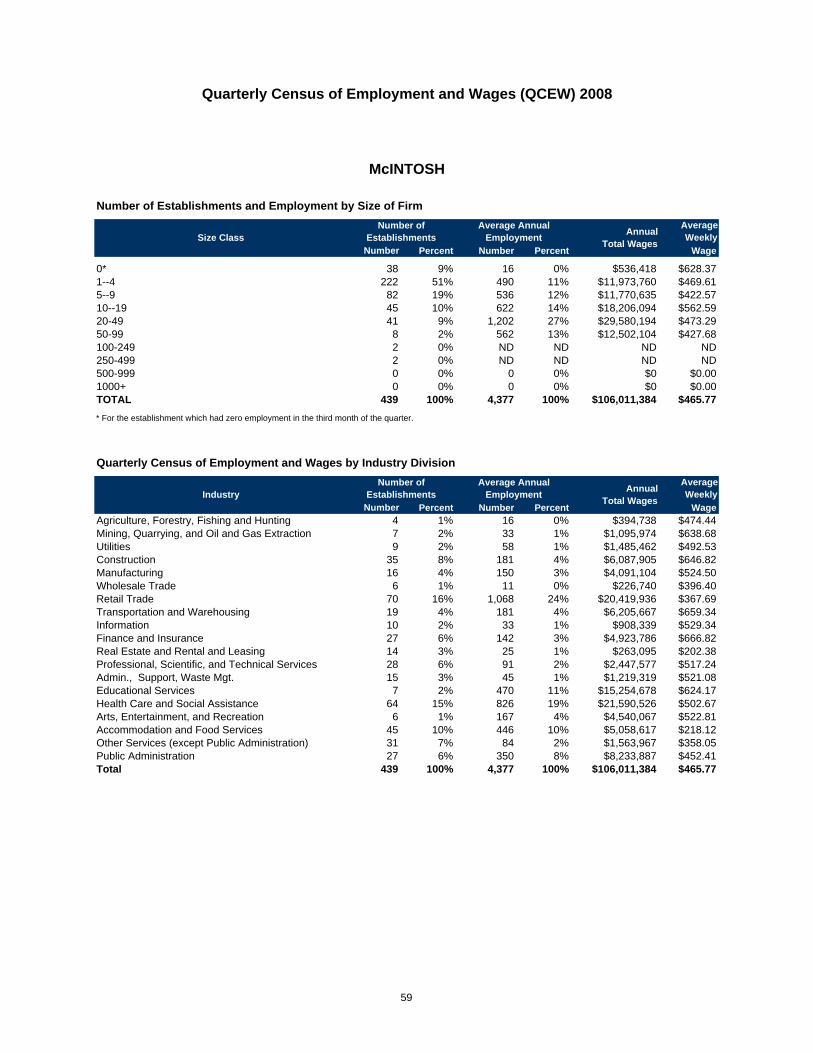
Quarterly Census of Employment and Wages (QCEW) 2008
AverageWeekly
Number Percent Number Percent Wage
0* 38 9% 16 0% $536,418 $628.371--4 222 51% 490 11% $11,973,760 $469.615--9 82 19% 536 12% $11,770,635 $422.5710--19 45 10% 622 14% $18,206,094 $562.5920-49 41 9% 1,202 27% $29,580,194 $473.2950-99 8 2% 562 13% $12,502,104 $427.68100-249 2 0% ND ND ND ND250-499 2 0% ND ND ND ND500-999 0 0% 0 0% $0 $0.001000+ 0 0% 0 0% $0 $0.00TOTAL 439 100% 4,377 100% $106,011,384 $465.77* For the establishment which had zero employment in the third month of the quarter.
AverageWeekly
Number Percent Number Percent WageAgriculture, Forestry, Fishing and Hunting 4 1% 16 0% $394,738 $474.44Mining, Quarrying, and Oil and Gas Extraction 7 2% 33 1% $1,095,974 $638.68Utilities 9 2% 58 1% $1,485,462 $492.53Construction 35 8% 181 4% $6,087,905 $646.82Manufacturing 16 4% 150 3% $4,091,104 $524.50Wholesale Trade 6 1% 11 0% $226,740 $396.40Retail Trade 70 16% 1,068 24% $20,419,936 $367.69Transportation and Warehousing 19 4% 181 4% $6,205,667 $659.34Information 10 2% 33 1% $908,339 $529.34Finance and Insurance 27 6% 142 3% $4,923,786 $666.82Real Estate and Rental and Leasing 14 3% 25 1% $263,095 $202.38Professional, Scientific, and Technical Services 28 6% 91 2% $2,447,577 $517.24Admin., Support, Waste Mgt. 15 3% 45 1% $1,219,319 $521.08Educational Services 7 2% 470 11% $15,254,678 $624.17Health Care and Social Assistance 64 15% 826 19% $21,590,526 $502.67Arts, Entertainment, and Recreation 6 1% 167 4% $4,540,067 $522.81Accommodation and Food Services 45 10% 446 10% $5,058,617 $218.12Other Services (except Public Administration) 31 7% 84 2% $1,563,967 $358.05Public Administration 27 6% 350 8% $8,233,887 $452.41Total 439 100% 4,377 100% $106,011,384 $465.77
McINTOSH
Number of Establishments and Employment by Size of Firm
Size ClassNumber of
EstablishmentsAverage Annual
Employment AnnualTotal Wages
Quarterly Census of Employment and Wages by Industry Division
IndustryNumber of
EstablishmentsAverage Annual
Employment AnnualTotal Wages
59

Quarterly Census of Employment and Wages (QCEW) 2008
AverageWeekly
Number Percent Number Percent Wage
0* 22 9% ND ND ND ND1--4 109 43% 229 9% $5,684,463 $477.375--9 52 20% 350 14% $9,876,841 $542.4310--19 46 18% 612 25% $17,847,597 $561.2020-49 19 7% 516 21% $17,187,914 $641.0950-99 6 2% 350 14% $15,122,795 $830.92100-249 3 1% ND ND ND ND250-499 0 0% 0 0% $0 $0.00500-999 0 0% 0 0% $0 $0.001000+ 0 0% 0 0% $0 $0.00TOTAL 255 100% 2,464 100% $75,639,329 $590.34* For the establishment which had zero employment in the third month of the quarter.
AverageWeekly
Number Percent Number Percent WageAgriculture, Forestry, Fishing and Hunting 6 2% ND ND ND NDMining, Quarrying, and Oil and Gas Extraction 25 10% 330 13% $17,239,721 $1,004.65Utilities 4 2% 31 1% $1,518,688 $942.11Construction 23 9% 193 8% $7,244,569 $721.86Manufacturing 11 4% 116 5% $4,418,879 $732.57Wholesale Trade 14 5% 108 4% $3,270,614 $582.37Retail Trade 33 13% 304 12% $5,512,291 $348.70Transportation and Warehousing 20 8% 103 4% $4,599,367 $858.73Information 4 2% 10 0% $253,399 $487.31Finance and Insurance 14 5% 104 4% $3,089,759 $571.33Real Estate and Rental and Leasing 6 2% 21 1% $1,263,441 $1,157.00Professional, Scientific, and Technical Services 17 7% 70 3% $2,469,140 $678.34Management of Companies and Enterprises 1 0% ND ND ND NDAdmin., Support, Waste Mgt. 12 5% 92 4% $2,274,900 $475.52Educational Services 2 1% ND ND ND NDHealth Care and Social Assistance 15 6% 302 12% $6,543,299 $416.66Arts, Entertainment, and Recreation 1 0% ND ND ND NDAccommodation and Food Services 14 5% 116 5% $1,104,550 $183.12Other Services (except Public Administration) 13 5% 37 2% $670,341 $348.41Public Administration 22 9% 146 6% $3,472,543 $457.40Total 255 100% 2,464 100% $75,639,329 $590.34
MAJOR
Number of Establishments and Employment by Size of Firm
Size ClassNumber of
EstablishmentsAverage Annual
Employment AnnualTotal Wages
Quarterly Census of Employment and Wages by Industry Division
IndustryNumber of
EstablishmentsAverage Annual
Employment AnnualTotal Wages
60

Quarterly Census of Employment and Wages (QCEW) 2008
AverageWeekly
Number Percent Number Percent Wage
0* 24 8% ND ND ND ND1--4 134 46% 286 7% $8,294,874 $557.105--9 60 20% 405 9% $10,354,123 $491.5510--19 33 11% 471 11% $10,972,234 $448.0720-49 24 8% 721 17% $17,472,126 $465.7550-99 7 2% 496 11% $18,224,945 $706.73100-249 9 3% 1,344 31% $39,921,881 $571.05250-499 2 1% ND ND ND ND500-999 0 0% 0 0% $0 $0.001000+ 0 0% 0 0% $0 $0.00TOTAL 292 100% 4,333 100% $127,427,424 $565.55* For the establishment which had zero employment in the third month of the quarter.
AverageWeekly
Number Percent Number Percent WageAgriculture, Forestry, Fishing and Hunting 4 1% 10 0% $169,187 $325.36Mining, Quarrying, and Oil and Gas Extraction 8 3% 104 2% $6,742,040 $1,246.68Utilities 4 1% 36 1% $968,694 $517.46Construction 18 6% 65 2% $1,709,750 $505.84Manufacturing 17 6% 1,228 28% $42,431,224 $664.48Wholesale Trade 12 4% 324 7% $10,263,650 $609.19Retail Trade 53 18% 462 11% $9,677,969 $402.85Transportation and Warehousing 10 3% 100 2% $3,172,369 $610.07Information 2 1% ND ND ND NDFinance and Insurance 25 9% 115 3% $3,278,289 $548.21Real Estate and Rental and Leasing 9 3% 35 1% $1,154,982 $634.61Professional, Scientific, and Technical Services 18 6% 66 2% $1,881,602 $548.25Management of Companies and Enterprises 1 0% ND ND ND NDAdmin., Support, Waste Mgt. 13 4% 39 1% $1,252,184 $617.45Educational Services 2 1% ND ND ND NDHealth Care and Social Assistance 27 9% 531 12% $15,854,025 $574.17Arts, Entertainment, and Recreation 5 2% 102 2% $1,527,792 $288.05Accommodation and Food Services 26 9% 282 7% $2,927,663 $199.65Other Services (except Public Administration) 15 5% 73 2% $1,347,775 $355.05Public Administration 24 8% 286 7% $7,488,844 $503.55Total 292 100% 4,333 100% $127,427,424 $565.55
MARSHALL
Number of Establishments and Employment by Size of Firm
Size ClassNumber of
EstablishmentsAverage Annual
Employment AnnualTotal Wages
Quarterly Census of Employment and Wages by Industry Division
IndustryNumber of
EstablishmentsAverage Annual
Employment AnnualTotal Wages
61
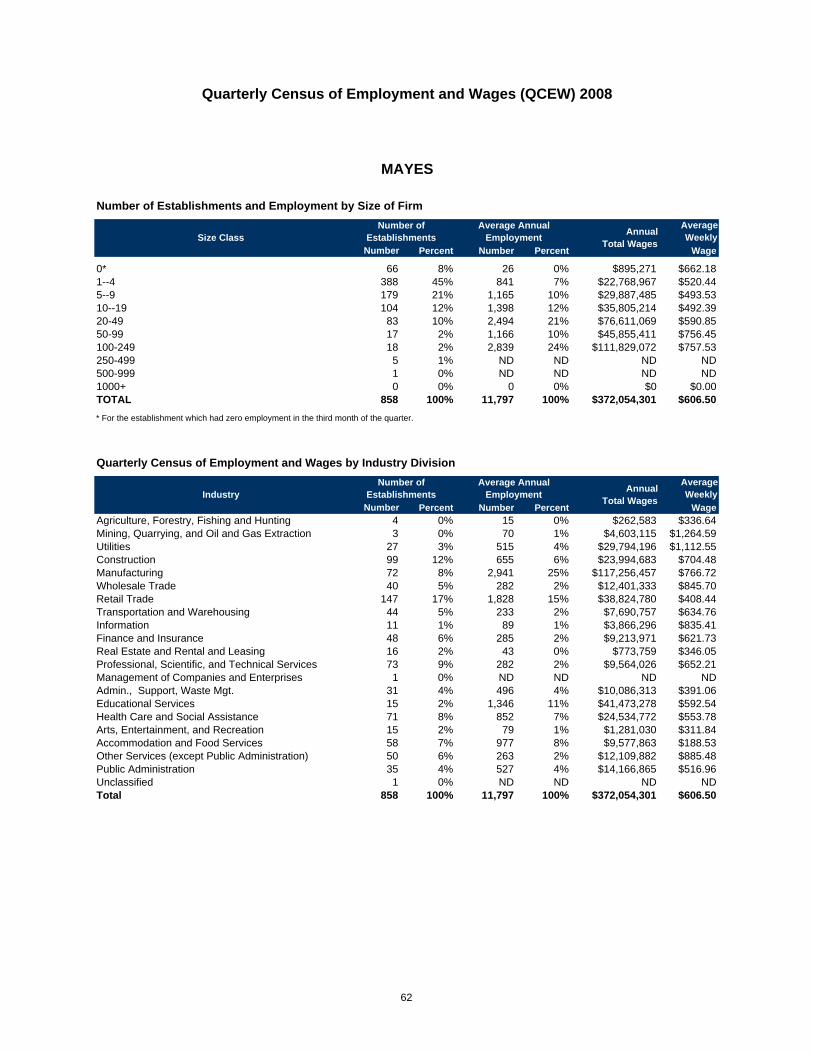
Quarterly Census of Employment and Wages (QCEW) 2008
AverageWeekly
Number Percent Number Percent Wage
0* 66 8% 26 0% $895,271 $662.181--4 388 45% 841 7% $22,768,967 $520.445--9 179 21% 1,165 10% $29,887,485 $493.5310--19 104 12% 1,398 12% $35,805,214 $492.3920-49 83 10% 2,494 21% $76,611,069 $590.8550-99 17 2% 1,166 10% $45,855,411 $756.45100-249 18 2% 2,839 24% $111,829,072 $757.53250-499 5 1% ND ND ND ND500-999 1 0% ND ND ND ND1000+ 0 0% 0 0% $0 $0.00TOTAL 858 100% 11,797 100% $372,054,301 $606.50* For the establishment which had zero employment in the third month of the quarter.
AverageWeekly
Number Percent Number Percent WageAgriculture, Forestry, Fishing and Hunting 4 0% 15 0% $262,583 $336.64Mining, Quarrying, and Oil and Gas Extraction 3 0% 70 1% $4,603,115 $1,264.59Utilities 27 3% 515 4% $29,794,196 $1,112.55Construction 99 12% 655 6% $23,994,683 $704.48Manufacturing 72 8% 2,941 25% $117,256,457 $766.72Wholesale Trade 40 5% 282 2% $12,401,333 $845.70Retail Trade 147 17% 1,828 15% $38,824,780 $408.44Transportation and Warehousing 44 5% 233 2% $7,690,757 $634.76Information 11 1% 89 1% $3,866,296 $835.41Finance and Insurance 48 6% 285 2% $9,213,971 $621.73Real Estate and Rental and Leasing 16 2% 43 0% $773,759 $346.05Professional, Scientific, and Technical Services 73 9% 282 2% $9,564,026 $652.21Management of Companies and Enterprises 1 0% ND ND ND NDAdmin., Support, Waste Mgt. 31 4% 496 4% $10,086,313 $391.06Educational Services 15 2% 1,346 11% $41,473,278 $592.54Health Care and Social Assistance 71 8% 852 7% $24,534,772 $553.78Arts, Entertainment, and Recreation 15 2% 79 1% $1,281,030 $311.84Accommodation and Food Services 58 7% 977 8% $9,577,863 $188.53Other Services (except Public Administration) 50 6% 263 2% $12,109,882 $885.48Public Administration 35 4% 527 4% $14,166,865 $516.96Unclassified 1 0% ND ND ND NDTotal 858 100% 11,797 100% $372,054,301 $606.50
MAYES
Number of Establishments and Employment by Size of Firm
Size ClassNumber of
EstablishmentsAverage Annual
Employment AnnualTotal Wages
Quarterly Census of Employment and Wages by Industry Division
IndustryNumber of
EstablishmentsAverage Annual
Employment AnnualTotal Wages
62

Quarterly Census of Employment and Wages (QCEW) 2008
AverageWeekly
Number Percent Number Percent Wage
0* 20 6% 15 0% $381,247 $494.271--4 146 48% 307 6% $7,560,090 $473.445--9 52 17% 361 7% $8,876,148 $473.3910--19 37 12% 501 9% $12,574,247 $482.3420-49 32 10% 1,006 19% $30,018,709 $574.1350-99 11 4% 805 15% $23,496,732 $561.14100-249 7 2% ND ND ND ND250-499 1 0% ND ND ND ND500-999 1 0% ND ND ND ND1000+ 0 0% 0 0% $0 $0.00TOTAL 306 100% 5,379 100% $149,936,441 $536.09* For the establishment which had zero employment in the third month of the quarter.
AverageWeekly
Number Percent Number Percent WageAgriculture, Forestry, Fishing and Hunting 10 3% 62 1% $1,240,443 $384.75Mining, Quarrying, and Oil and Gas Extraction 10 3% 235 4% $8,452,868 $691.72Utilities 4 1% ND ND ND NDConstruction 26 8% 245 5% $7,372,058 $578.65Manufacturing 11 4% 150 3% $6,149,931 $788.45Wholesale Trade 10 3% 227 4% $6,572,000 $556.76Retail Trade 50 16% 1,046 19% $24,171,057 $444.39Transportation and Warehousing 10 3% 41 1% $1,577,848 $740.08Information 7 2% ND ND ND NDFinance and Insurance 24 8% 129 2% $3,941,505 $587.58Real Estate and Rental and Leasing 8 3% 31 1% $893,396 $554.22Professional, Scientific, and Technical Services 21 7% 63 1% $1,578,541 $481.85Admin., Support, Waste Mgt. 8 3% 52 1% $1,822,246 $673.91Educational Services 3 1% 329 6% $10,095,343 $590.09Health Care and Social Assistance 33 11% 867 16% $25,121,881 $557.22Arts, Entertainment, and Recreation 8 3% 79 1% $2,663,641 $648.40Accommodation and Food Services 25 8% 1,190 22% $29,479,285 $476.39Other Services (except Public Administration) 18 6% 74 1% $1,174,962 $305.34Public Administration 23 8% 442 8% $13,113,256 $570.54Total 306 100% 5,385 100% $150,065,713 $535.91
MURRAY
Number of Establishments and Employment by Size of Firm
Size ClassNumber of
EstablishmentsAverage Annual
Employment AnnualTotal Wages
Quarterly Census of Employment and Wages by Industry Division
IndustryNumber of
EstablishmentsAverage Annual
Employment AnnualTotal Wages
63

Quarterly Census of Employment and Wages (QCEW) 2008
AverageWeekly
Number Percent Number Percent Wage
0* 115 7% 66 0% $2,013,960 $588.301--4 670 42% 1,485 5% $41,915,380 $542.685--9 315 20% 2,060 7% $57,209,378 $534.2010--19 210 13% 2,872 10% $80,695,411 $540.4120-49 167 10% 5,025 17% $148,075,372 $566.6650-99 63 4% 4,442 15% $132,931,620 $575.48100-249 33 2% 4,685 16% $163,828,267 $672.52250-499 9 1% 2,825 10% $62,912,027 $428.34500-999 6 0% ND ND ND ND1000+ 1 0% ND ND ND NDTOTAL 1,587 100% 29,297 100% $958,645,538 $629.26* For the establishment which had zero employment in the third month of the quarter.
AverageWeekly
Number Percent Number Percent WageAgriculture, Forestry, Fishing and Hunting 12 1% 147 1% $3,370,060 $440.88Mining, Quarrying, and Oil and Gas Extraction 12 1% 51 0% $1,968,933 $742.43Utilities 22 1% 431 1% $25,650,209 $1,144.49Construction 151 10% 1,506 5% $49,829,546 $636.30Manufacturing 81 5% 4,487 15% $191,074,360 $818.92Wholesale Trade 66 4% 858 3% $40,862,466 $915.87Retail Trade 258 16% 3,343 11% $72,094,505 $414.73Transportation and Warehousing 67 4% 1,021 3% $35,917,495 $676.51Information 33 2% 370 1% $13,518,450 $702.62Finance and Insurance 99 6% 611 2% $24,985,963 $786.41Real Estate and Rental and Leasing 55 3% 185 1% $4,166,140 $433.07Professional, Scientific, and Technical Services 107 7% 546 2% $18,628,651 $656.12Management of Companies and Enterprises 4 0% 31 0% $1,695,965 $1,052.09Admin., Support, Waste Mgt. 89 6% 1,692 6% $33,821,356 $384.40Educational Services 21 1% 2,516 9% $74,776,525 $571.55Health Care and Social Assistance 199 13% 5,030 17% $193,910,592 $741.36Arts, Entertainment, and Recreation 18 1% 1,306 4% $37,281,343 $548.97Accommodation and Food Services 124 8% 2,274 8% $24,985,718 $211.30Other Services (except Public Administration) 102 6% 498 2% $11,277,720 $435.50Public Administration 69 4% 2,396 8% $98,829,541 $793.23Total 1,587 100% 29,297 100% $958,645,538 $629.26
MUSKOGEE
Number of Establishments and Employment by Size of Firm
Size ClassNumber of
EstablishmentsAverage Annual
Employment AnnualTotal Wages
Quarterly Census of Employment and Wages by Industry Division
IndustryNumber of
EstablishmentsAverage Annual
Employment AnnualTotal Wages
64

Quarterly Census of Employment and Wages (QCEW) 2008
AverageWeekly
Number Percent Number Percent Wage
0* 14 6% 12 0% $187,931 $303.281--4 99 43% 215 5% $5,850,916 $523.745--9 55 24% 359 9% $7,751,270 $415.7010--19 29 13% 380 9% $10,482,349 $531.0720-49 18 8% 533 13% $12,040,346 $434.0850-99 7 3% 528 13% $15,290,352 $556.73100-249 6 2% ND ND ND ND250-499 0 0% 0 0% $0 $0.00500-999 0 0% 0 0% $0 $0.001000+ 1 0% ND ND ND NDTOTAL 228 100% 4,215 100% $148,684,080 $678.37* For the establishment which had zero employment in the third month of the quarter.
AverageWeekly
Number Percent Number Percent WageAgriculture, Forestry, Fishing and Hunting 1 0% ND ND ND NDMining, Quarrying, and Oil and Gas Extraction 7 3% 27 1% $1,219,150 $868.34Utilities 9 4% 180 4% $11,157,857 $1,192.08Construction 20 9% 94 2% $2,203,657 $450.83Manufacturing 10 4% ND ND ND NDWholesale Trade 13 6% 93 2% $2,808,365 $580.72Retail Trade 25 11% 281 7% $5,534,926 $378.79Transportation and Warehousing 15 7% 105 2% $3,895,619 $713.48Information 5 2% 18 0% $450,574 $481.38Finance and Insurance 13 6% 129 3% $4,450,774 $663.50Real Estate and Rental and Leasing 3 1% 12 0% $107,497 $172.27Professional, Scientific, and Technical Services 14 6% 45 1% $1,292,641 $552.41Admin., Support, Waste Mgt. 3 1% 13 0% $207,335 $306.71Educational Services 5 2% 346 8% $10,679,748 $593.58Health Care and Social Assistance 17 7% 348 8% $9,513,212 $525.71Arts, Entertainment, and Recreation 6 3% 341 8% $8,760,963 $494.08Accommodation and Food Services 20 9% 248 6% $2,688,746 $208.49Other Services (except Public Administration) 15 7% 50 1% $925,724 $356.05Public Administration 28 12% 410 10% $10,947,971 $513.51Total 228 100% 4,215 100% $148,684,080 $678.37
NOBLE
Number of Establishments and Employment by Size of Firm
Size ClassNumber of
EstablishmentsAverage Annual
Employment AnnualTotal Wages
Quarterly Census of Employment and Wages by Industry Division
IndustryNumber of
EstablishmentsAverage Annual
Employment AnnualTotal Wages
65

Quarterly Census of Employment and Wages (QCEW) 2008
AverageWeekly
Number Percent Number Percent Wage
0* 11 6% ND ND ND ND1--4 86 49% 191 10% $4,909,106 $493.635--9 37 21% 251 14% $5,855,999 $449.4110--19 17 10% 245 13% $4,757,678 $373.4420-49 16 9% 469 26% $11,916,708 $488.9850-99 6 3% 393 22% $12,316,949 $602.96100-249 2 1% ND ND ND ND250-499 0 0% 0 0% $0 $0.00500-999 0 0% 0 0% $0 $0.001000+ 0 0% 0 0% $0 $0.00TOTAL 175 100% 1,825 100% $47,294,331 $498.36* For the establishment which had zero employment in the third month of the quarter.
AverageWeekly
Number Percent Number Percent WageAgriculture, Forestry, Fishing and Hunting 5 3% 13 1% $307,381 $454.71Mining, Quarrying, and Oil and Gas Extraction 3 2% 14 1% $282,868 $388.55Utilities 5 3% 13 1% $423,079 $625.86Construction 16 9% 165 9% $4,565,066 $532.06Manufacturing 10 6% 323 18% $11,468,760 $682.83Wholesale Trade 8 5% 97 5% $2,037,676 $403.98Retail Trade 22 13% 118 6% $2,109,696 $343.82Transportation and Warehousing 11 6% 54 3% $2,119,174 $754.69Information 1 1% ND ND ND NDFinance and Insurance 10 6% 79 4% $2,818,504 $686.10Real Estate and Rental and Leasing 6 3% 15 1% $234,691 $300.89Professional, Scientific, and Technical Services 7 4% 22 1% $426,985 $373.24Admin., Support, Waste Mgt. 8 5% 20 1% $726,710 $698.76Educational Services 3 2% 314 17% $9,284,541 $568.63Health Care and Social Assistance 18 10% 251 14% $5,344,597 $409.48Arts, Entertainment, and Recreation 1 1% ND ND ND NDAccommodation and Food Services 9 5% 154 8% $1,103,011 $137.74Other Services (except Public Administration) 11 6% 27 1% $457,789 $326.06Public Administration 22 13% 144 8% $3,453,021 $461.14Total 175 100% 1,825 100% $47,294,331 $498.36
NOWATA
Number of Establishments and Employment by Size of Firm
Size ClassNumber of
EstablishmentsAverage Annual
Employment AnnualTotal Wages
Quarterly Census of Employment and Wages by Industry Division
IndustryNumber of
EstablishmentsAverage Annual
Employment AnnualTotal Wages
66

Quarterly Census of Employment and Wages (QCEW) 2008
AverageWeekly
Number Percent Number Percent Wage
0* 18 8% 13 1% $259,679 $381.691--4 88 42% 212 9% $5,520,434 $500.185--9 53 25% 366 16% $8,384,407 $440.7410--19 28 13% 366 16% $9,568,043 $503.4220-49 19 9% 579 25% $13,165,866 $437.1650-99 3 1% ND ND ND ND100-249 4 2% ND ND ND ND250-499 0 0% 0 0% $0 $0.00500-999 0 0% 0 0% $0 $0.001000+ 0 0% 0 0% $0 $0.00TOTAL 211 100% 2,317 100% $62,860,099 $521.73* For the establishment which had zero employment in the third month of the quarter.
AverageWeekly
Number Percent Number Percent WageAgriculture, Forestry, Fishing and Hunting 10 5% 46 2% $1,105,848 $462.31Mining, Quarrying, and Oil and Gas Extraction 9 4% 69 3% $3,563,938 $993.29Utilities 7 3% 31 1% $819,363 $508.29Construction 14 7% 86 4% $2,688,611 $601.21Manufacturing 9 4% 121 5% $2,895,582 $460.20Wholesale Trade 8 4% 28 1% $516,660 $354.85Retail Trade 27 13% 230 10% $4,183,790 $349.82Transportation and Warehousing 9 4% 39 2% $1,463,445 $721.62Information 3 1% ND ND ND NDFinance and Insurance 11 5% 73 3% $2,122,470 $559.13Real Estate and Rental and Leasing 3 1% 10 0% $216,664 $416.66Professional, Scientific, and Technical Services 6 3% 15 1% $367,194 $470.76Management of Companies and Enterprises 1 0% ND ND ND NDAdmin., Support, Waste Mgt. 5 2% 19 1% $342,705 $346.87Educational Services 7 3% 347 15% $10,771,181 $596.94Health Care and Social Assistance 41 19% 463 20% $11,929,602 $495.50Arts, Entertainment, and Recreation 4 2% 192 8% $4,215,877 $422.26Accommodation and Food Services 8 4% 94 4% $898,567 $183.83Other Services (except Public Administration) 6 3% 19 1% $279,474 $282.87Public Administration 24 11% 422 18% $13,908,426 $633.81Total 211 100% 2,317 100% $62,860,099 $521.73
OKFUSKEE
Number of Establishments and Employment by Size of Firm
Size ClassNumber of
EstablishmentsAverage Annual
Employment AnnualTotal Wages
Quarterly Census of Employment and Wages by Industry Division
IndustryNumber of
EstablishmentsAverage Annual
Employment AnnualTotal Wages
67

Quarterly Census of Employment and Wages (QCEW) 2008
AverageWeekly
Number Percent Number Percent Wage
0* 2,715 11% 939 0% $39,688,072 $813.031--4 10,605 44% 20,961 5% $848,619,026 $778.565--9 4,069 17% 26,793 6% $956,138,607 $686.2610--19 2,936 12% 40,040 9% $1,484,590,161 $713.0320-49 2,237 9% 66,951 16% $2,628,495,236 $755.0050-99 719 3% 49,283 12% $1,751,568,325 $683.48100-249 450 2% 67,943 16% $2,709,826,707 $766.99250-499 121 1% 40,875 10% $1,624,405,603 $764.25500-999 46 0% 32,486 8% $1,444,513,624 $855.121000+ 31 0% 78,208 18% $4,191,447,891 $1,030.65TOTAL 23,929 100% 424,479 100% $17,679,293,252 $800.95* For the establishment which had zero employment in the third month of the quarter.
AverageWeekly
Number Percent Number Percent WageAgriculture, Forestry, Fishing and Hunting 32 0% 236 0% $6,867,204 $559.58Mining, Quarrying, and Oil and Gas Extraction 601 3% 13,013 3% $1,629,685,315 $2,408.37Utilities 71 0% 3,403 1% $240,262,068 $1,357.75Construction 2,081 9% 19,539 5% $808,216,337 $795.47Manufacturing 955 4% 26,770 6% $1,179,511,294 $847.33Wholesale Trade 1,485 6% 19,533 5% $946,915,803 $932.26Retail Trade 2,820 12% 44,455 10% $1,132,197,312 $489.78Transportation and Warehousing 549 2% 12,382 3% $541,006,456 $840.25Information 451 2% 11,058 3% $525,094,182 $913.18Finance and Insurance 1,859 8% 18,855 4% $958,737,885 $977.84Real Estate and Rental and Leasing 1,068 4% 8,733 2% $318,005,310 $700.27Professional, Scientific, and Technical Services 3,228 13% 22,888 5% $1,231,489,352 $1,034.71Management of Companies and Enterprises 115 0% 5,550 1% $403,891,268 $1,399.48Admin., Support, Waste Mgt. 1,757 7% 35,921 8% $1,012,087,566 $541.83Educational Services 246 1% 30,798 7% $1,093,806,608 $682.99Health Care and Social Assistance 2,677 11% 56,565 13% $2,387,943,242 $811.84Arts, Entertainment, and Recreation 271 1% 6,352 1% $134,174,329 $406.21Accommodation and Food Services 1,591 7% 35,345 8% $506,252,701 $275.45Other Services (except Public Administration) 1,794 7% 11,168 3% $313,464,995 $539.77Public Administration 273 1% 41,890 10% $2,308,858,376 $1,059.95Unclassified 10 0% 27 0% $825,649 $588.07Total 23,929 100% 424,479 100% $17,679,293,252 $800.95
OKLAHOMA
Number of Establishments and Employment by Size of Firm
Size ClassNumber of
EstablishmentsAverage Annual
Employment AnnualTotal Wages
Quarterly Census of Employment and Wages by Industry Division
IndustryNumber of
EstablishmentsAverage Annual
Employment AnnualTotal Wages
68
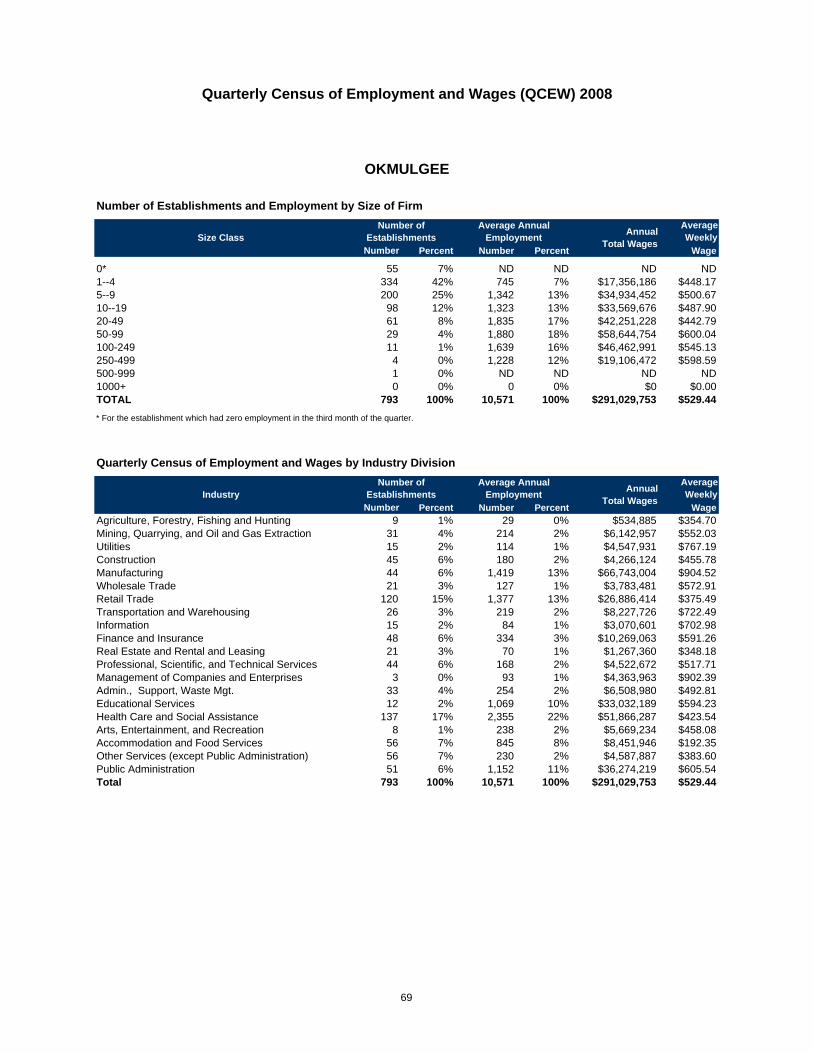
Quarterly Census of Employment and Wages (QCEW) 2008
AverageWeekly
Number Percent Number Percent Wage
0* 55 7% ND ND ND ND1--4 334 42% 745 7% $17,356,186 $448.175--9 200 25% 1,342 13% $34,934,452 $500.6710--19 98 12% 1,323 13% $33,569,676 $487.9020-49 61 8% 1,835 17% $42,251,228 $442.7950-99 29 4% 1,880 18% $58,644,754 $600.04100-249 11 1% 1,639 16% $46,462,991 $545.13250-499 4 0% 1,228 12% $19,106,472 $598.59500-999 1 0% ND ND ND ND1000+ 0 0% 0 0% $0 $0.00TOTAL 793 100% 10,571 100% $291,029,753 $529.44* For the establishment which had zero employment in the third month of the quarter.
AverageWeekly
Number Percent Number Percent WageAgriculture, Forestry, Fishing and Hunting 9 1% 29 0% $534,885 $354.70Mining, Quarrying, and Oil and Gas Extraction 31 4% 214 2% $6,142,957 $552.03Utilities 15 2% 114 1% $4,547,931 $767.19Construction 45 6% 180 2% $4,266,124 $455.78Manufacturing 44 6% 1,419 13% $66,743,004 $904.52Wholesale Trade 21 3% 127 1% $3,783,481 $572.91Retail Trade 120 15% 1,377 13% $26,886,414 $375.49Transportation and Warehousing 26 3% 219 2% $8,227,726 $722.49Information 15 2% 84 1% $3,070,601 $702.98Finance and Insurance 48 6% 334 3% $10,269,063 $591.26Real Estate and Rental and Leasing 21 3% 70 1% $1,267,360 $348.18Professional, Scientific, and Technical Services 44 6% 168 2% $4,522,672 $517.71Management of Companies and Enterprises 3 0% 93 1% $4,363,963 $902.39Admin., Support, Waste Mgt. 33 4% 254 2% $6,508,980 $492.81Educational Services 12 2% 1,069 10% $33,032,189 $594.23Health Care and Social Assistance 137 17% 2,355 22% $51,866,287 $423.54Arts, Entertainment, and Recreation 8 1% 238 2% $5,669,234 $458.08Accommodation and Food Services 56 7% 845 8% $8,451,946 $192.35Other Services (except Public Administration) 56 7% 230 2% $4,587,887 $383.60Public Administration 51 6% 1,152 11% $36,274,219 $605.54Total 793 100% 10,571 100% $291,029,753 $529.44
OKMULGEE
Number of Establishments and Employment by Size of Firm
Size ClassNumber of
EstablishmentsAverage Annual
Employment AnnualTotal Wages
Quarterly Census of Employment and Wages by Industry Division
IndustryNumber of
EstablishmentsAverage Annual
Employment AnnualTotal Wages
69

Quarterly Census of Employment and Wages (QCEW) 2008
AverageWeekly
Number Percent Number Percent Wage
0* 43 8% 28 0% $905,537 $629.431--4 270 47% 605 10% $16,968,987 $539.235--9 118 21% 768 12% $21,465,196 $537.3110--19 76 13% 1,031 16% $28,493,442 $531.5620-49 38 7% 1,146 18% $30,594,069 $513.5450-99 17 3% 1,089 17% $29,858,682 $527.32100-249 6 1% 779 12% $24,284,150 $799.66250-499 3 0% ND ND ND ND500-999 0 0% 0 0% $0 $0.001000+ 0 0% 0 0% $0 $0.00TOTAL 571 100% 6,364 100% $187,654,346 $567.05* For the establishment which had zero employment in the third month of the quarter.
AverageWeekly
Number Percent Number Percent WageAgriculture, Forestry, Fishing and Hunting 10 2% 49 1% $1,531,542 $601.08Mining, Quarrying, and Oil and Gas Extraction 62 11% 492 8% $18,407,539 $719.49Utilities 9 2% 41 1% $1,608,533 $754.47Construction 62 11% 388 6% $11,394,370 $564.75Manufacturing 33 6% 400 6% $17,774,022 $854.52Wholesale Trade 16 3% 160 3% $6,206,422 $745.96Retail Trade 71 12% 729 11% $11,538,183 $304.37Transportation and Warehousing 21 4% 69 1% $2,649,370 $738.40Information 7 1% ND ND ND NDFinance and Insurance 28 5% 143 2% $5,134,373 $690.48Real Estate and Rental and Leasing 10 2% 53 1% $1,229,571 $446.14Professional, Scientific, and Technical Services 40 7% 105 2% $4,168,480 $763.46Management of Companies and Enterprises 1 0% ND ND ND NDAdmin., Support, Waste Mgt. 24 4% 333 5% $17,539,003 $1,012.88Educational Services 18 3% 749 12% $20,601,766 $528.96Health Care and Social Assistance 40 7% 619 10% $14,783,753 $459.29Arts, Entertainment, and Recreation 12 2% 210 3% $4,549,901 $416.66Accommodation and Food Services 30 5% 391 6% $3,369,737 $165.74Other Services (except Public Administration) 23 4% 118 2% $2,684,924 $437.57Public Administration 55 10% 1,276 20% $41,067,187 $618.93Total 571 100% 6,364 100% $187,654,346 $567.05
OSAGE
Number of Establishments and Employment by Size of Firm
Size ClassNumber of
EstablishmentsAverage Annual
Employment AnnualTotal Wages
Quarterly Census of Employment and Wages by Industry Division
IndustryNumber of
EstablishmentsAverage Annual
Employment AnnualTotal Wages
70

Quarterly Census of Employment and Wages (QCEW) 2008
AverageWeekly
Number Percent Number Percent Wage
0* 63 9% 21 0% $466,325 $428.741--4 286 42% 672 6% $19,365,844 $554.275--9 137 20% 917 8% $23,304,275 $488.5910--19 93 13% 1,265 11% $33,183,038 $504.4520-49 63 9% 1,954 17% $50,857,035 $500.5650-99 24 3% 1,679 14% $46,927,357 $537.60100-249 12 2% 1,769 15% $49,466,037 $537.69250-499 8 1% 2,942 25% $88,826,120 $580.71500-999 0 0% 0 0% $0 $0.001000+ 1 0% ND ND ND NDTOTAL 687 100% 11,831 100% $326,795,763 $531.19* For the establishment which had zero employment in the third month of the quarter.
AverageWeekly
Number Percent Number Percent WageAgriculture, Forestry, Fishing and Hunting 9 1% 392 3% $8,245,525 $404.51Mining, Quarrying, and Oil and Gas Extraction 5 1% 121 1% $6,632,595 $1,054.13Utilities 10 1% 89 1% $2,591,952 $560.06Construction 64 9% 270 2% $7,191,898 $512.24Manufacturing 51 7% 1,582 13% $52,575,667 $639.11Wholesale Trade 37 5% 311 3% $9,921,738 $613.51Retail Trade 84 12% 1,175 10% $23,578,029 $385.89Transportation and Warehousing 35 5% 139 1% $5,385,723 $745.12Information 9 1% 102 1% $4,349,801 $820.10Finance and Insurance 47 7% 299 3% $9,768,147 $628.26Real Estate and Rental and Leasing 24 3% 138 1% $2,932,816 $408.70Professional, Scientific, and Technical Services 43 6% 181 2% $4,358,255 $463.05Management of Companies and Enterprises 5 1% 102 1% $3,662,155 $690.45Admin., Support, Waste Mgt. 37 5% 400 3% $9,939,414 $477.86Educational Services 10 1% 1,070 9% $33,769,011 $606.92Health Care and Social Assistance 67 10% 1,433 12% $47,284,490 $634.55Arts, Entertainment, and Recreation 18 3% 2,227 19% $53,487,575 $461.88Accommodation and Food Services 50 7% 624 5% $7,898,021 $243.41Other Services (except Public Administration) 36 5% 174 1% $3,012,438 $332.94Public Administration 48 7% 1,004 8% $30,210,513 $578.66Total 687 100% 11,831 100% $326,795,763 $531.19
OTTAWA
Number of Establishments and Employment by Size of Firm
Size ClassNumber of
EstablishmentsAverage Annual
Employment AnnualTotal Wages
Quarterly Census of Employment and Wages by Industry Division
IndustryNumber of
EstablishmentsAverage Annual
Employment AnnualTotal Wages
71

Quarterly Census of Employment and Wages (QCEW) 2008
AverageWeekly
Number Percent Number Percent Wage
0* 26 9% ND ND ND ND1--4 139 47% 306 9% $8,267,525 $520.145--9 57 19% 376 11% $10,328,184 $527.6610--19 36 12% 464 13% $12,057,325 $499.5420-49 24 8% 705 20% $20,979,023 $572.6050-99 11 4% 789 22% $25,408,124 $619.55100-249 5 2% 671 19% $13,456,368 $771.32250-499 1 0% ND ND ND ND500-999 0 0% 0 0% $0 $0.001000+ 0 0% 0 0% $0 $0.00TOTAL 299 100% 3,526 100% $111,909,680 $610.35* For the establishment which had zero employment in the third month of the quarter.
AverageWeekly
Number Percent Number Percent WageAgriculture, Forestry, Fishing and Hunting 1 0% ND ND ND NDMining, Quarrying, and Oil and Gas Extraction 24 8% 214 6% $8,851,307 $795.41Utilities 9 3% 119 3% $5,579,962 $901.74Construction 19 6% 109 3% $2,785,110 $491.37Manufacturing 18 6% 159 5% $7,250,132 $876.89Wholesale Trade 13 4% 69 2% $2,082,920 $580.52Retail Trade 42 14% 407 12% $8,306,726 $392.49Transportation and Warehousing 15 5% 54 2% $1,909,486 $680.02Information 5 2% 23 1% $504,857 $422.12Finance and Insurance 17 6% 144 4% $4,870,971 $650.50Real Estate and Rental and Leasing 8 3% 23 1% $547,223 $457.54Professional, Scientific, and Technical Services 26 9% 71 2% $1,369,165 $370.85Management of Companies and Enterprises 2 1% ND ND ND NDAdmin., Support, Waste Mgt. 11 4% ND ND ND NDEducational Services 3 1% 396 11% $11,786,987 $572.41Health Care and Social Assistance 27 9% 644 18% $17,538,126 $523.71Arts, Entertainment, and Recreation 3 1% 5 0% $87,716 $337.37Accommodation and Food Services 18 6% 212 6% $1,980,671 $179.67Other Services (except Public Administration) 13 4% 33 1% $580,033 $338.01Public Administration 26 9% 615 17% $20,580,947 $643.56Total 299 100% 3,526 100% $111,909,680 $610.35
PAWNEE
Number of Establishments and Employment by Size of Firm
Size ClassNumber of
EstablishmentsAverage Annual
Employment AnnualTotal Wages
Quarterly Census of Employment and Wages by Industry Division
IndustryNumber of
EstablishmentsAverage Annual
Employment AnnualTotal Wages
72

Quarterly Census of Employment and Wages (QCEW) 2008
AverageWeekly
Number Percent Number Percent Wage
0* 155 9% ND ND ND ND1--4 728 41% 1,579 5% $45,605,099 $555.435--9 373 21% 2,482 8% $67,310,354 $521.4910--19 244 14% 3,238 10% $84,284,342 $500.6420-49 161 9% 4,894 15% $152,096,403 $597.7150-99 61 3% 3,966 12% $112,314,927 $544.57100-249 27 2% 3,817 12% $118,366,538 $596.42250-499 5 0% 1,674 5% $45,535,137 $523.18500-999 5 0% 3,595 11% $112,639,873 $803.291000+ 1 0% ND ND ND NDTOTAL 1,758 100% 32,535 100% $1,097,657,152 $648.80* For the establishment which had zero employment in the third month of the quarter.
AverageWeekly
Number Percent Number Percent WageAgriculture, Forestry, Fishing and Hunting 9 1% 57 0% $1,548,772 $522.53Mining, Quarrying, and Oil and Gas Extraction 49 3% 1,237 4% $84,022,998 $1,306.25Utilities 13 1% 270 1% $11,896,769 $847.35Construction 185 11% 1,433 4% $48,645,125 $652.81Manufacturing 87 5% 2,863 9% $120,177,200 $807.23Wholesale Trade 77 4% 507 2% $20,180,786 $765.47Retail Trade 275 16% 3,608 11% $73,401,408 $391.23Transportation and Warehousing 44 3% 366 1% $16,939,995 $890.08Information 40 2% 326 1% $9,634,432 $568.34Finance and Insurance 102 6% 793 2% $33,173,539 $804.48Real Estate and Rental and Leasing 77 4% 432 1% $11,055,615 $492.15Professional, Scientific, and Technical Services 159 9% 876 3% $33,746,820 $740.84Management of Companies and Enterprises 5 0% 37 0% $1,472,590 $765.38Admin., Support, Waste Mgt. 89 5% 932 3% $21,548,619 $444.63Educational Services 29 2% 9,358 29% $377,517,542 $775.80Health Care and Social Assistance 158 9% 3,156 10% $104,038,861 $633.95Arts, Entertainment, and Recreation 21 1% 534 2% $8,754,998 $315.29Accommodation and Food Services 133 8% 3,368 10% $38,828,434 $221.70Other Services (except Public Administration) 159 9% 924 3% $20,815,541 $433.22Public Administration 50 3% 1,460 4% $60,257,108 $793.69Total 1,758 100% 32,535 100% $1,097,657,152 $648.80
PAYNE
Number of Establishments and Employment by Size of Firm
Size ClassNumber of
EstablishmentsAverage Annual
Employment AnnualTotal Wages
Quarterly Census of Employment and Wages by Industry Division
IndustryNumber of
EstablishmentsAverage Annual
Employment AnnualTotal Wages
73

Quarterly Census of Employment and Wages (QCEW) 2008
AverageWeekly
Number Percent Number Percent Wage
0* 70 7% ND ND ND ND1--4 413 40% 931 5% $26,924,772 $555.965--9 221 22% 1,464 8% $42,002,796 $551.6410--19 149 15% 1,948 11% $53,838,093 $531.4220-49 104 10% 3,105 17% $94,249,648 $583.7050-99 39 4% 2,622 14% $82,184,913 $602.87100-249 16 2% 2,261 12% $73,775,398 $627.38250-499 6 1% 1,965 11% $73,882,175 $723.21500-999 3 0% 2,757 15% $25,580,621 $713.731000+ 1 0% ND ND ND NDTOTAL 1,020 100% 18,426 100% $649,532,594 $677.90* For the establishment which had zero employment in the third month of the quarter.
AverageWeekly
Number Percent Number Percent WageAgriculture, Forestry, Fishing and Hunting 7 1% ND ND ND NDMining, Quarrying, and Oil and Gas Extraction 32 3% 746 4% $36,319,299 $936.26Utilities 19 2% 177 1% $9,486,990 $1,030.75Construction 73 7% 952 5% $31,317,197 $632.62Manufacturing 34 3% 2,310 13% $98,828,568 $822.75Wholesale Trade 38 4% 307 2% $11,221,904 $702.95Retail Trade 179 18% 2,123 12% $47,355,674 $428.96Transportation and Warehousing 54 5% 606 3% $28,507,217 $904.65Information 16 2% 189 1% $6,949,987 $707.16Finance and Insurance 62 6% 733 4% $35,736,090 $937.56Real Estate and Rental and Leasing 46 5% 224 1% $6,711,119 $576.16Professional, Scientific, and Technical Services 85 8% 330 2% $13,064,599 $761.34Management of Companies and Enterprises 2 0% ND ND ND NDAdmin., Support, Waste Mgt. 50 5% 1,288 7% $41,080,874 $613.37Educational Services 18 2% 1,242 7% $38,786,371 $600.56Health Care and Social Assistance 95 9% 2,499 14% $72,242,750 $555.94Arts, Entertainment, and Recreation 11 1% 312 2% $6,810,718 $419.79Accommodation and Food Services 90 9% 1,302 7% $16,815,533 $248.37Other Services (except Public Administration) 50 5% 337 2% $9,442,541 $538.83Public Administration 60 6% 2,716 15% $137,883,440 $976.29Total 1,020 100% 18,426 100% $649,532,594 $677.90
PITTSBURG
Number of Establishments and Employment by Size of Firm
Size ClassNumber of
EstablishmentsAverage Annual
Employment AnnualTotal Wages
Quarterly Census of Employment and Wages by Industry Division
IndustryNumber of
EstablishmentsAverage Annual
Employment AnnualTotal Wages
74

Quarterly Census of Employment and Wages (QCEW) 2008
AverageWeekly
Number Percent Number Percent Wage
0* 63 6% 43 0% $1,174,439 $522.201--4 423 41% 918 5% $25,568,295 $535.815--9 246 24% 1,591 9% $49,460,888 $597.6910--19 140 14% 1,858 10% $53,025,399 $548.9220-49 100 10% 3,103 17% $80,208,344 $497.1650-99 37 4% 2,427 14% $74,452,007 $590.06100-249 7 1% 1,055 6% $22,469,071 $819.14250-499 7 1% 2,620 15% $63,616,388 $466.97500-999 7 1% 4,201 23% $146,071,279 $668.631000+ 0 0% 0 0% $0 $0.00TOTAL 1,029 100% 17,914 100% $544,141,810 $584.14* For the establishment which had zero employment in the third month of the quarter.
AverageWeekly
Number Percent Number Percent WageAgriculture, Forestry, Fishing and Hunting 7 1% 48 0% $1,249,704 $500.68Mining, Quarrying, and Oil and Gas Extraction 50 5% 387 2% $17,782,438 $883.64Utilities 12 1% 197 1% $7,396,377 $722.02Construction 76 7% 603 3% $18,594,811 $593.02Manufacturing 57 6% 1,664 9% $57,174,385 $660.76Wholesale Trade 49 5% 656 4% $31,234,455 $915.64Retail Trade 151 15% 2,244 13% $49,243,416 $422.01Transportation and Warehousing 37 4% 288 2% $9,970,909 $665.79Information 13 1% 126 1% $3,608,723 $550.78Finance and Insurance 79 8% 556 3% $19,440,274 $672.39Real Estate and Rental and Leasing 40 4% 187 1% $5,749,731 $591.29Professional, Scientific, and Technical Services 84 8% 1,048 6% $31,298,428 $574.33Management of Companies and Enterprises 4 0% 46 0% $858,733 $359.00Admin., Support, Waste Mgt. 39 4% 672 4% $15,039,486 $430.39Educational Services 12 1% 1,697 9% $55,246,775 $626.07Health Care and Social Assistance 127 12% 3,134 17% $102,876,707 $631.27Arts, Entertainment, and Recreation 10 1% 537 3% $13,753,231 $492.52Accommodation and Food Services 54 5% 1,201 7% $15,124,425 $242.18Other Services (except Public Administration) 52 5% 1,035 6% $32,090,862 $596.26Public Administration 78 8% 1,581 9% $56,294,942 $684.75Total 1,029 100% 17,914 100% $544,141,810 $584.14
PONTOTOC
Number of Establishments and Employment by Size of Firm
Size ClassNumber of
EstablishmentsAverage Annual
Employment AnnualTotal Wages
Quarterly Census of Employment and Wages by Industry Division
IndustryNumber of
EstablishmentsAverage Annual
Employment AnnualTotal Wages
75

Quarterly Census of Employment and Wages (QCEW) 2008
AverageWeekly
Number Percent Number Percent Wage
0* 115 9% 46 0% $1,410,116 $592.731--4 540 42% 1,199 6% $36,019,277 $577.555--9 273 21% 1,798 8% $47,075,027 $503.5210--19 163 13% 2,180 10% $58,427,441 $515.5120-49 130 10% 3,957 18% $100,196,939 $486.9150-99 49 4% 3,302 15% $85,691,293 $499.14100-249 21 2% 3,161 15% $98,443,084 $598.87250-499 8 1% 2,953 14% $110,542,617 $719.84500-999 2 0% ND ND ND ND1000+ 1 0% ND ND ND NDTOTAL 1,299 100% 21,525 100% $623,951,125 $557.45* For the establishment which had zero employment in the third month of the quarter.
AverageWeekly
Number Percent Number Percent WageAgriculture, Forestry, Fishing and Hunting 8 1% ND ND ND NDMining, Quarrying, and Oil and Gas Extraction 29 2% 265 1% $13,509,567 $980.37Utilities 13 1% 196 1% $9,291,466 $911.64Construction 154 12% 900 4% $25,958,308 $554.66Manufacturing 74 6% 2,928 14% $129,061,335 $847.66Wholesale Trade 42 3% 355 2% $10,757,264 $582.73Retail Trade 211 16% 2,615 12% $56,151,825 $412.94Transportation and Warehousing 38 3% 331 2% $12,660,225 $735.55Information 23 2% 297 1% $8,715,116 $564.30Finance and Insurance 85 7% 532 2% $18,711,297 $676.38Real Estate and Rental and Leasing 50 4% 216 1% $6,244,061 $555.92Professional, Scientific, and Technical Services 96 7% 535 2% $20,269,637 $728.60Management of Companies and Enterprises 2 0% ND ND ND NDAdmin., Support, Waste Mgt. 70 5% 996 5% $23,638,103 $456.40Educational Services 24 2% 2,535 12% $76,520,272 $580.49Health Care and Social Assistance 132 10% 2,797 13% $84,290,222 $579.54Arts, Entertainment, and Recreation 11 1% 271 1% $6,287,346 $446.16Accommodation and Food Services 108 8% 2,251 10% $25,873,201 $221.04Other Services (except Public Administration) 78 6% 453 2% $9,351,161 $396.98Public Administration 56 4% 3,007 14% $83,191,738 $532.04Total 1,299 100% 21,525 100% $623,951,125 $557.45
POTTAWATOMIE
Number of Establishments and Employment by Size of Firm
Size ClassNumber of
EstablishmentsAverage Annual
Employment AnnualTotal Wages
Quarterly Census of Employment and Wages by Industry Division
IndustryNumber of
EstablishmentsAverage Annual
Employment AnnualTotal Wages
76

Quarterly Census of Employment and Wages (QCEW) 2008
AverageWeekly
Number Percent Number Percent Wage
0* 14 6% ND ND ND ND1--4 118 49% 241 9% $5,942,107 $474.325--9 45 19% 292 10% $6,908,785 $455.1310--19 30 12% 406 14% $10,075,051 $477.8120-49 21 9% 640 23% $15,090,012 $453.3150-99 9 4% 583 21% $17,196,339 $567.72100-249 5 2% ND ND ND ND250-499 0 0% 0 0% $0 $0.00500-999 0 0% 0 0% $0 $0.001000+ 0 0% 0 0% $0 $0.00TOTAL 241 100% 2,815 100% $73,022,307 $498.85* For the establishment which had zero employment in the third month of the quarter.
AverageWeekly
Number Percent Number Percent WageAgriculture, Forestry, Fishing and Hunting 8 3% 9 0% $510,264 $1,090.31Mining, Quarrying, and Oil and Gas Extraction 1 0% ND ND ND NDUtilities 8 3% 34 1% $885,702 $500.96Construction 13 5% 177 6% $6,392,606 $694.55Manufacturing 14 6% 230 8% $6,243,716 $522.05Wholesale Trade 5 2% 60 2% $1,756,410 $562.95Retail Trade 45 19% 364 13% $6,951,151 $367.24Transportation and Warehousing 17 7% 62 2% $2,007,752 $622.75Information 5 2% ND ND ND NDFinance and Insurance 13 5% 80 3% $2,640,424 $634.72Real Estate and Rental and Leasing 6 2% 18 1% $454,807 $485.90Professional, Scientific, and Technical Services 12 5% 58 2% $2,424,329 $803.82Admin., Support, Waste Mgt. 6 2% 7 0% $150,384 $413.14Educational Services 8 3% 423 15% $11,921,665 $541.99Health Care and Social Assistance 22 9% 691 25% $16,920,069 $470.89Arts, Entertainment, and Recreation 2 1% ND ND ND NDAccommodation and Food Services 14 6% 160 6% $1,376,210 $165.41Other Services (except Public Administration) 17 7% 74 3% $1,271,182 $330.35Public Administration 26 11% 294 10% $8,973,793 $586.98Total 241 100% 2,815 100% $73,022,307 $498.85
PUSHMATAHA
Number of Establishments and Employment by Size of Firm
Size ClassNumber of
EstablishmentsAverage Annual
Employment AnnualTotal Wages
Quarterly Census of Employment and Wages by Industry Division
IndustryNumber of
EstablishmentsAverage Annual
Employment AnnualTotal Wages
77

Quarterly Census of Employment and Wages (QCEW) 2008
AverageWeekly
Number Percent Number Percent Wage
0* 8 7% ND ND ND ND1--4 63 59% 138 17% $3,935,952 $549.825--9 18 17% 125 15% $3,753,853 $577.9010--19 9 9% 113 14% $3,225,619 $549.7620-49 4 4% 127 16% $5,783,519 $874.0450-99 5 4% ND ND ND ND100-249 0 0% 0 0% $0 $0.00250-499 0 0% 0 0% $0 $0.00500-999 0 0% 0 0% $0 $0.001000+ 0 0% 0 0% $0 $0.00TOTAL 107 100% 814 100% $27,487,986 $649.20* For the establishment which had zero employment in the third month of the quarter.
AverageWeekly
Number Percent Number Percent WageAgriculture, Forestry, Fishing and Hunting 2 2% ND ND ND NDMining, Quarrying, and Oil and Gas Extraction 11 10% 36 4% $1,093,123 $583.93Utilities 1 1% ND ND ND NDConstruction 8 7% ND ND ND NDManufacturing 2 2% 8 9% $259,394 $623.54Wholesale Trade 4 4% 6 1% $221,815 $710.95Retail Trade 13 12% 97 12% $1,786,349 $354.15Transportation and Warehousing 14 13% 137 17% $7,324,040 $1,028.08Information 4 4% 24 3% $1,143,766 $916.48Finance and Insurance 4 4% ND ND ND NDProfessional, Scientific, and Technical Services 7 7% 17 2% $772,659 $874.05Admin., Support, Waste Mgt. 1 1% ND ND ND NDEducational Services 3 3% 157 19% $4,994,939 $611.82Health Care and Social Assistance 4 4% 73 9% $1,841,516 $485.12Arts, Entertainment, and Recreation 1 1% ND ND ND NDAccommodation and Food Services 6 6% 23 3% $261,494 $218.64Other Services (except Public Administration) 4 4% 6 1% $88,087 $282.33Public Administration 18 17% 91 11% $3,109,158 $657.05Total 107 100% 814 100% $27,487,986 $649.40
ROGER MILLS
Number of Establishments and Employment by Size of Firm
Size ClassNumber of
EstablishmentsAverage Annual
Employment AnnualTotal Wages
Quarterly Census of Employment and Wages by Industry Division
IndustryNumber of
EstablishmentsAverage Annual
Employment AnnualTotal Wages
78

Quarterly Census of Employment and Wages (QCEW) 2008
AverageWeekly
Number Percent Number Percent Wage
0* 147 9% 60 0% $1,718,143 $550.691--4 721 46% 1,489 6% $44,818,135 $579.035--9 291 18% 1,897 7% $54,835,068 $555.9410--19 192 12% 2,598 10% $82,234,293 $608.7720-49 141 9% 4,251 16% $136,997,504 $619.7950-99 47 3% 3,119 12% $108,699,954 $670.30100-249 28 2% 4,021 16% $174,091,622 $832.64250-499 11 1% 3,692 14% $159,416,661 $830.31500-999 3 0% ND ND ND ND1000+ 2 0% ND ND ND NDTOTAL 1,582 100% 25,765 100% $965,959,393 $720.98* For the establishment which had zero employment in the third month of the quarter.
AverageWeekly
Number Percent Number Percent WageAgriculture, Forestry, Fishing and Hunting 12 1% 68 0% $2,017,886 $570.67Mining, Quarrying, and Oil and Gas Extraction 17 1% 306 1% $14,324,346 $900.22Utilities 23 1% 320 1% $18,548,803 $1,114.71Construction 262 17% 2,061 8% $75,175,208 $701.44Manufacturing 137 9% 5,537 21% $279,403,127 $970.41Wholesale Trade 78 5% 981 4% $50,094,229 $982.01Retail Trade 174 11% 2,500 10% $60,283,429 $463.72Transportation and Warehousing 60 4% 1,476 6% $63,406,479 $826.12Information 28 2% 152 1% $5,874,344 $743.21Finance and Insurance 87 5% 618 2% $27,964,967 $870.21Real Estate and Rental and Leasing 54 3% 226 1% $5,992,206 $509.89Professional, Scientific, and Technical Services 126 8% 549 2% $21,052,982 $737.46Admin., Support, Waste Mgt. 104 7% 1,390 5% $64,255,066 $888.97Educational Services 16 1% 2,258 9% $73,630,873 $627.09Health Care and Social Assistance 145 9% 2,179 8% $66,506,019 $586.95Arts, Entertainment, and Recreation 25 2% 1,717 7% $54,791,572 $613.68Accommodation and Food Services 91 6% 1,594 6% $17,849,794 $215.35Other Services (except Public Administration) 96 6% 409 2% $11,377,528 $534.96Public Administration 49 3% 1,420 6% $53,017,481 $718.00Total 1,582 100% 25,765 100% $965,959,393 $720.98
ROGERS
Number of Establishments and Employment by Size of Firm
Size ClassNumber of
EstablishmentsAverage Annual
Employment AnnualTotal Wages
Quarterly Census of Employment and Wages by Industry Division
IndustryNumber of
EstablishmentsAverage Annual
Employment AnnualTotal Wages
79

Quarterly Census of Employment and Wages (QCEW) 2008
AverageWeekly
Number Percent Number Percent Wage
0* 30 5% 18 0% $269,315 $285.091--4 250 45% 560 7% $14,652,958 $503.195--9 115 21% 738 9% $21,025,097 $547.6210--19 70 13% 916 11% $28,806,334 $604.9320-49 52 9% 1,498 19% $41,463,987 $532.3350-99 18 3% 1,188 15% $44,049,652 $713.05100-249 14 3% 2,339 29% $78,645,672 $646.56250-499 3 0% 824 10% $3,749,918 $349.93500-999 0 0% 0 0% $0 $0.001000+ 0 0% 0 0% $0 $0.00TOTAL 553 100% 8,045 100% $245,433,693 $586.68* For the establishment which had zero employment in the third month of the quarter.
AverageWeekly
Number Percent Number Percent WageAgriculture, Forestry, Fishing and Hunting 3 1% 10 0% $270,712 $520.60Mining, Quarrying, and Oil and Gas Extraction 55 10% 811 10% $40,907,183 $970.01Utilities 12 2% 190 2% $10,631,836 $1,076.10Construction 46 8% 357 4% $11,681,570 $629.26Manufacturing 31 6% 1,172 15% $38,275,771 $628.05Wholesale Trade 24 4% 124 2% $5,728,933 $888.48Retail Trade 72 13% 819 10% $16,702,594 $392.19Transportation and Warehousing 25 5% 258 3% $15,153,184 $1,129.49Information 10 2% 57 1% $1,496,177 $504.78Finance and Insurance 35 6% 200 2% $6,067,156 $583.38Real Estate and Rental and Leasing 14 3% 43 1% $857,449 $383.47Professional, Scientific, and Technical Services 27 5% 108 1% $2,961,044 $527.25Admin., Support, Waste Mgt. 16 3% 128 2% $3,100,376 $465.80Educational Services 13 2% 998 12% $30,356,492 $584.95Health Care and Social Assistance 50 9% 1,133 14% $26,456,870 $449.06Arts, Entertainment, and Recreation 14 3% 280 3% $5,298,473 $363.91Accommodation and Food Services 31 6% 472 6% $4,708,200 $191.83Other Services (except Public Administration) 30 5% 149 2% $3,443,885 $444.49Public Administration 47 8% 737 9% $21,335,788 $556.72Total 553 100% 8,045 100% $245,433,693 $586.68
SEMINOLE
Number of Establishments and Employment by Size of Firm
Size ClassNumber of
EstablishmentsAverage Annual
Employment AnnualTotal Wages
Quarterly Census of Employment and Wages by Industry Division
IndustryNumber of
EstablishmentsAverage Annual
Employment AnnualTotal Wages
80

Quarterly Census of Employment and Wages (QCEW) 2008
AverageWeekly
Number Percent Number Percent Wage
0* 43 7% 24 0% $450,511 $362.241--4 282 44% 652 7% $15,973,335 $471.385--9 137 21% 898 9% $20,503,258 $439.0410--19 88 14% 1,167 12% $27,395,085 $451.3720-49 64 10% 1,949 20% $48,916,152 $482.6150-99 15 2% 1,039 11% $28,481,974 $527.09100-249 10 2% 1,446 15% $42,312,632 $562.73250-499 8 1% 2,343 25% $52,935,061 $434.56500-999 0 0% 0 0% $0 $0.001000+ 0 0% 0 0% $0 $0.00TOTAL 647 100% 9,518 100% $236,968,008 $478.79* For the establishment which had zero employment in the third month of the quarter.
AverageWeekly
Number Percent Number Percent WageAgriculture, Forestry, Fishing and Hunting 8 1% 75 1% $2,133,323 $547.01Mining, Quarrying, and Oil and Gas Extraction 6 1% ND ND ND NDUtilities 11 2% 111 1% $3,414,892 $591.63Construction 60 9% 285 3% $7,260,692 $489.93Manufacturing 17 3% 549 6% $20,452,606 $716.43Wholesale Trade 19 3% 115 1% $2,518,870 $421.22Retail Trade 107 17% 1,151 12% $22,293,233 $372.47Transportation and Warehousing 29 4% 365 4% $14,733,805 $776.28Information 11 2% 64 1% $1,901,100 $571.24Finance and Insurance 54 8% 450 5% $13,797,619 $589.64Real Estate and Rental and Leasing 20 3% 48 1% $935,121 $374.65Professional, Scientific, and Technical Services 47 7% 236 2% $8,987,352 $732.35Management of Companies and Enterprises 1 0% ND ND ND NDAdmin., Support, Waste Mgt. 25 4% 147 2% $4,921,187 $643.80Educational Services 12 2% 1,270 13% $39,697,988 $601.12Health Care and Social Assistance 81 13% 2,323 24% $43,049,574 $356.38Arts, Entertainment, and Recreation 15 2% 775 8% $23,393,520 $580.48Accommodation and Food Services 60 9% 869 9% $9,312,048 $206.07Other Services (except Public Administration) 28 4% 95 1% $1,910,728 $386.79Public Administration 36 6% 497 5% $13,260,339 $513.09Total 647 100% 9,518 100% $236,968,008 $478.79
SEQUOYAH
Number of Establishments and Employment by Size of Firm
Size ClassNumber of
EstablishmentsAverage Annual
Employment AnnualTotal Wages
Quarterly Census of Employment and Wages by Industry Division
IndustryNumber of
EstablishmentsAverage Annual
Employment AnnualTotal Wages
81

Quarterly Census of Employment and Wages (QCEW) 2008
AverageWeekly
Number Percent Number Percent Wage
0* 81 7% 56 0% $2,522,654 $867.591--4 479 44% 1,096 7% $32,184,630 $564.725--9 233 21% 1,538 10% $40,355,572 $504.4610--19 153 14% 2,054 13% $62,329,515 $583.6420-49 97 9% 2,838 18% $78,640,145 $532.8250-99 34 3% 2,417 15% $79,658,864 $633.89100-249 12 1% 1,930 12% $76,642,853 $763.71250-499 5 0% 1,737 11% $97,468,556 $1,079.36500-999 2 0% ND ND ND ND1000+ 1 0% ND ND ND NDTOTAL 1,097 100% 16,079 100% $568,159,509 $679.52* For the establishment which had zero employment in the third month of the quarter.
AverageWeekly
Number Percent Number Percent WageAgriculture, Forestry, Fishing and Hunting 4 0% ND ND ND NDMining, Quarrying, and Oil and Gas Extraction 86 8% 2,210 14% $154,418,257 $1,343.70Utilities 15 1% 89 1% $4,259,828 $920.45Construction 96 9% 795 5% $23,986,030 $580.21Manufacturing 74 7% 2,627 16% $116,385,036 $851.99Wholesale Trade 48 4% 358 2% $10,518,706 $565.04Retail Trade 182 17% 2,109 13% $41,406,003 $377.56Transportation and Warehousing 29 3% 713 4% $24,284,962 $655.00Information 17 2% 140 1% $3,871,068 $531.74Finance and Insurance 72 7% 625 4% $21,796,984 $670.68Real Estate and Rental and Leasing 33 3% 141 1% $3,052,414 $416.31Professional, Scientific, and Technical Services 67 6% 302 2% $10,770,421 $685.84Management of Companies and Enterprises 3 0% ND ND ND NDAdmin., Support, Waste Mgt. 49 4% 548 3% $15,439,528 $541.81Educational Services 12 1% 1,302 8% $35,956,075 $531.08Health Care and Social Assistance 110 10% 1,897 12% $55,137,723 $558.96Arts, Entertainment, and Recreation 11 1% 149 1% $1,869,005 $241.22Accommodation and Food Services 72 7% 1,053 7% $11,773,400 $215.02Other Services (except Public Administration) 74 7% 326 2% $8,413,008 $496.28Public Administration 44 4% 674 4% $23,949,919 $683.35Total 1,097 100% 16,081 100% $568,206,723 $679.50
STEPHENS
Number of Establishments and Employment by Size of Firm
Size ClassNumber of
EstablishmentsAverage Annual
Employment AnnualTotal Wages
Quarterly Census of Employment and Wages by Industry Division
IndustryNumber of
EstablishmentsAverage Annual
Employment AnnualTotal Wages
82

Quarterly Census of Employment and Wages (QCEW) 2008
AverageWeekly
Number Percent Number Percent Wage
0* 42 8% 17 0% $378,022 $438.371--4 227 42% 518 6% $15,118,549 $561.735--9 117 21% 769 9% $23,139,945 $578.7310--19 84 15% 1,131 13% $31,271,879 $531.5320-49 54 10% 1,622 18% $50,715,994 $601.3950-99 12 2% 801 9% $28,156,859 $675.86100-249 7 1% 1,299 15% $43,233,089 $639.95250-499 1 0% ND ND ND ND500-999 0 0% 0 0% $0 $0.001000+ 1 0% ND ND ND NDTOTAL 544 100% 8,890 100% $285,925,480 $618.51* For the establishment which had zero employment in the third month of the quarter.
AverageWeekly
Number Percent Number Percent WageAgriculture, Forestry, Fishing and Hunting 31 6% 660 7% $18,042,763 $525.72Mining, Quarrying, and Oil and Gas Extraction 16 3% 270 3% $16,662,884 $1,186.82Utilities 10 2% 135 2% $8,260,332 $1,176.69Construction 61 11% 468 5% $15,078,793 $619.61Manufacturing 11 2% ND ND ND NDWholesale Trade 38 7% 321 4% $11,852,549 $710.07Retail Trade 71 13% 812 9% $15,570,183 $368.75Transportation and Warehousing 23 4% 135 2% $6,179,473 $880.27Information 9 2% 226 3% $10,159,825 $864.52Finance and Insurance 30 6% 240 3% $8,454,115 $677.41Real Estate and Rental and Leasing 9 2% 38 0% $648,044 $327.96Professional, Scientific, and Technical Services 37 7% 193 2% $9,456,975 $942.31Management of Companies and Enterprises 3 1% ND ND ND NDAdmin., Support, Waste Mgt. 26 5% 208 2% $5,770,856 $533.55Educational Services 11 2% 860 10% $24,856,309 $555.82Health Care and Social Assistance 35 6% 506 6% $15,619,036 $593.61Arts, Entertainment, and Recreation 4 1% 48 1% $640,605 $256.65Accommodation and Food Services 45 8% 617 7% $6,879,119 $214.41Other Services (except Public Administration) 39 7% 151 2% $3,886,790 $495.01Public Administration 36 7% 404 5% $13,116,710 $624.37Total 544 100% 8,890 100% $285,925,480 $618.51
TEXAS
Number of Establishments and Employment by Size of Firm
Size ClassNumber of
EstablishmentsAverage Annual
Employment AnnualTotal Wages
Quarterly Census of Employment and Wages by Industry Division
IndustryNumber of
EstablishmentsAverage Annual
Employment AnnualTotal Wages
83
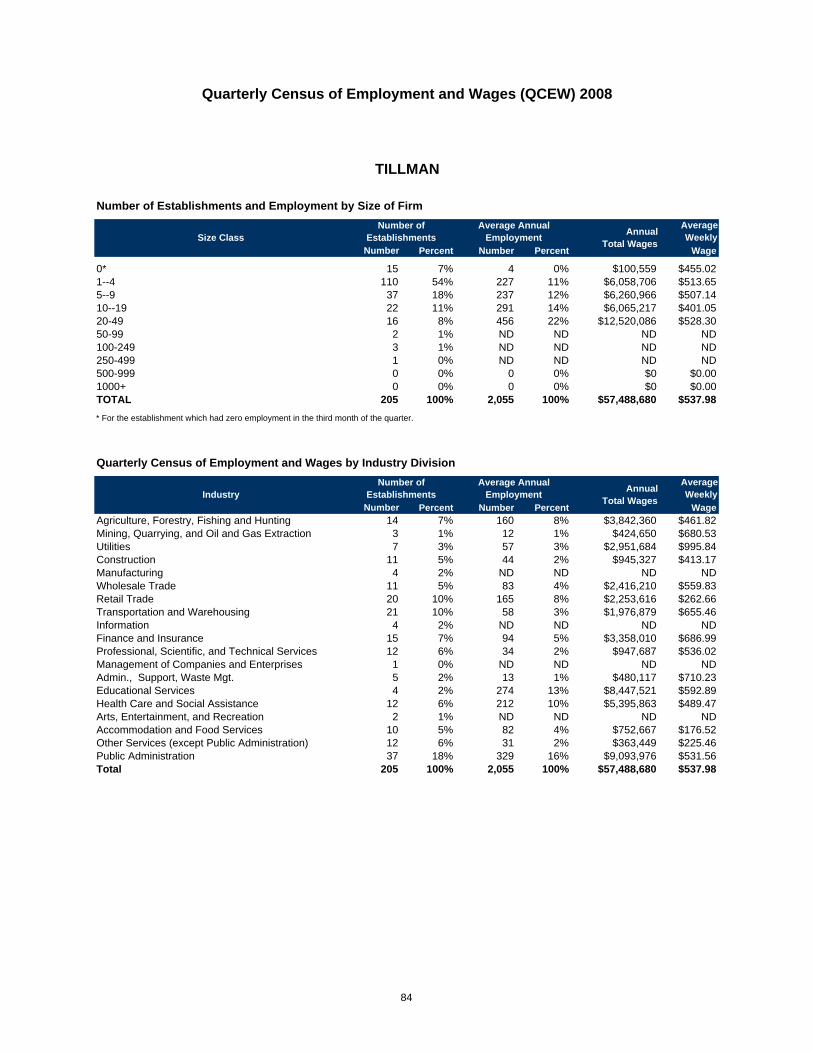
Quarterly Census of Employment and Wages (QCEW) 2008
AverageWeekly
Number Percent Number Percent Wage
0* 15 7% 4 0% $100,559 $455.021--4 110 54% 227 11% $6,058,706 $513.655--9 37 18% 237 12% $6,260,966 $507.1410--19 22 11% 291 14% $6,065,217 $401.0520-49 16 8% 456 22% $12,520,086 $528.3050-99 2 1% ND ND ND ND100-249 3 1% ND ND ND ND250-499 1 0% ND ND ND ND500-999 0 0% 0 0% $0 $0.001000+ 0 0% 0 0% $0 $0.00TOTAL 205 100% 2,055 100% $57,488,680 $537.98* For the establishment which had zero employment in the third month of the quarter.
AverageWeekly
Number Percent Number Percent WageAgriculture, Forestry, Fishing and Hunting 14 7% 160 8% $3,842,360 $461.82Mining, Quarrying, and Oil and Gas Extraction 3 1% 12 1% $424,650 $680.53Utilities 7 3% 57 3% $2,951,684 $995.84Construction 11 5% 44 2% $945,327 $413.17Manufacturing 4 2% ND ND ND NDWholesale Trade 11 5% 83 4% $2,416,210 $559.83Retail Trade 20 10% 165 8% $2,253,616 $262.66Transportation and Warehousing 21 10% 58 3% $1,976,879 $655.46Information 4 2% ND ND ND NDFinance and Insurance 15 7% 94 5% $3,358,010 $686.99Professional, Scientific, and Technical Services 12 6% 34 2% $947,687 $536.02Management of Companies and Enterprises 1 0% ND ND ND NDAdmin., Support, Waste Mgt. 5 2% 13 1% $480,117 $710.23Educational Services 4 2% 274 13% $8,447,521 $592.89Health Care and Social Assistance 12 6% 212 10% $5,395,863 $489.47Arts, Entertainment, and Recreation 2 1% ND ND ND NDAccommodation and Food Services 10 5% 82 4% $752,667 $176.52Other Services (except Public Administration) 12 6% 31 2% $363,449 $225.46Public Administration 37 18% 329 16% $9,093,976 $531.56Total 205 100% 2,055 100% $57,488,680 $537.98
TILLMAN
Number of Establishments and Employment by Size of Firm
Size ClassNumber of
EstablishmentsAverage Annual
Employment AnnualTotal Wages
Quarterly Census of Employment and Wages by Industry Division
IndustryNumber of
EstablishmentsAverage Annual
Employment AnnualTotal Wages
84

Quarterly Census of Employment and Wages (QCEW) 2008
AverageWeekly
Number Percent Number Percent Wage
0* 2,092 11% 932 0% $47,377,715 $977.321--4 8,516 44% 17,130 5% $692,272,592 $777.165--9 3,387 17% 22,283 6% $854,529,961 $737.4910--19 2,463 13% 33,376 10% $1,244,712,420 $717.1820-49 1,865 10% 55,867 16% $2,189,783,936 $753.7850-99 599 3% 40,871 12% $1,701,752,991 $800.71100-249 395 2% 58,526 17% $2,531,181,800 $831.70250-499 110 1% 37,764 11% $1,678,879,239 $854.95500-999 48 0% 32,590 9% $1,539,918,226 $908.691000+ 24 0% 50,540 14% $2,050,909,203 $780.39TOTAL 19,497 100% 349,878 100% $14,531,318,083 $798.70* For the establishment which had zero employment in the third month of the quarter.
AverageWeekly
Number Percent Number Percent WageAgriculture, Forestry, Fishing and Hunting 31 0% 428 0% $10,989,617 $493.78Mining, Quarrying, and Oil and Gas Extraction 372 2% 5,525 2% $602,511,588 $2,097.15Utilities 86 0% 3,905 1% $341,383,373 $1,681.19Construction 1,746 9% 18,645 5% $784,989,269 $809.65Manufacturing 1,171 6% 40,224 11% $1,997,640,310 $955.06Wholesale Trade 1,385 7% 15,428 4% $933,518,691 $1,163.62Retail Trade 2,256 12% 37,529 11% $935,694,104 $479.47Transportation and Warehousing 454 2% 18,177 5% $958,963,182 $1,014.56Information 397 2% 9,850 3% $502,140,501 $980.36Finance and Insurance 1,338 7% 14,379 4% $791,325,017 $1,058.33Real Estate and Rental and Leasing 903 5% 7,392 2% $286,572,158 $745.54Professional, Scientific, and Technical Services 2,645 14% 19,123 5% $1,089,094,649 $1,095.23Management of Companies and Enterprises 128 1% 5,800 2% $429,368,022 $1,423.63Admin., Support, Waste Mgt. 1,407 7% 34,685 10% $993,773,449 $550.99Educational Services 194 1% 23,359 7% $784,319,250 $645.71Health Care and Social Assistance 1,853 10% 43,125 12% $1,845,583,854 $823.00Arts, Entertainment, and Recreation 227 1% 4,403 1% $114,859,278 $501.67Accommodation and Food Services 1,286 7% 28,459 8% $403,520,609 $272.67Other Services (except Public Administration) 1,507 8% 9,619 3% $279,543,187 $558.88Public Administration 113 1% 9,821 3% $445,474,954 $872.30Total 19,497 100% 349,878 100% $14,531,318,083 $798.70
TULSA
Number of Establishments and Employment by Size of Firm
Size ClassNumber of
EstablishmentsAverage Annual
Employment AnnualTotal Wages
Quarterly Census of Employment and Wages by Industry Division
IndustryNumber of
EstablishmentsAverage Annual
Employment AnnualTotal Wages
85

Quarterly Census of Employment and Wages (QCEW) 2008
AverageWeekly
Number Percent Number Percent Wage
0* 74 10% 24 0% $491,147 $400.501--4 379 51% 788 10% $21,906,483 $534.625--9 151 20% 989 13% $27,036,046 $525.6610--19 75 10% 1,007 13% $26,756,496 $511.1420-49 41 6% 1,241 16% $34,010,047 $527.2050-99 17 2% 1,110 15% $34,165,187 $592.05100-249 5 1% 964 13% $25,585,739 $680.47250-499 5 1% 1,816 24% $34,814,239 $737.27500-999 0 0% 0 0% $0 $0.001000+ 0 0% 0 0% $0 $0.00TOTAL 746 100% 7,604 100% $235,882,623 $596.56* For the establishment which had zero employment in the third month of the quarter.
AverageWeekly
Number Percent Number Percent WageAgriculture, Forestry, Fishing and Hunting 12 2% 62 1% $1,232,985 $382.44Mining, Quarrying, and Oil and Gas Extraction 6 1% 13 0% $591,418 $874.88Utilities 9 1% 78 1% $2,251,377 $555.07Construction 144 19% 636 8% $20,806,718 $629.13Manufacturing 63 8% 1,585 21% $79,423,046 $963.64Wholesale Trade 34 5% 136 2% $6,036,191 $853.53Retail Trade 81 11% 1,049 14% $21,335,628 $391.13Transportation and Warehousing 21 3% 132 2% $5,187,260 $755.72Information 5 1% ND ND ND NDFinance and Insurance 47 6% 224 3% $6,729,507 $577.74Real Estate and Rental and Leasing 27 4% 56 1% $1,012,753 $347.79Professional, Scientific, and Technical Services 62 8% 257 3% $7,530,214 $563.47Management of Companies and Enterprises 1 0% ND ND ND NDAdmin., Support, Waste Mgt. 40 5% 236 3% $9,346,337 $761.60Educational Services 6 1% 965 13% $27,984,354 $557.68Health Care and Social Assistance 56 8% 742 10% $20,653,947 $535.30Arts, Entertainment, and Recreation 9 1% 81 1% $1,241,556 $294.77Accommodation and Food Services 45 6% 647 9% $6,382,358 $189.70Other Services (except Public Administration) 57 8% 203 3% $3,676,738 $348.31Public Administration 22 3% 491 6% $13,785,773 $539.94Total 746 100% 7,604 100% $235,882,623 $596.56
WAGONER
Number of Establishments and Employment by Size of Firm
Size ClassNumber of
EstablishmentsAverage Annual
Employment AnnualTotal Wages
Quarterly Census of Employment and Wages by Industry Division
IndustryNumber of
EstablishmentsAverage Annual
Employment AnnualTotal Wages
86

Quarterly Census of Employment and Wages (QCEW) 2008
AverageWeekly
Number Percent Number Percent Wage
0* 103 8% 50 0% $1,438,292 $549.531--4 586 45% 1,265 6% $39,416,706 $599.465--9 267 21% 1,751 8% $54,764,836 $601.3210--19 162 13% 2,141 10% $64,857,690 $582.6320-49 108 8% 3,262 16% $84,901,328 $500.5950-99 39 3% 2,643 13% $71,633,010 $521.24100-249 20 2% 2,637 13% $81,128,778 $591.68250-499 5 0% 1,647 8% $105,892,993 $1,236.62500-999 3 0% ND ND ND ND1000+ 2 0% ND ND ND NDTOTAL 1,295 100% 20,709 100% $841,093,072 $781.05* For the establishment which had zero employment in the third month of the quarter.
AverageWeekly
Number Percent Number Percent WageAgriculture, Forestry, Fishing and Hunting 7 1% ND ND ND NDMining, Quarrying, and Oil and Gas Extraction 46 4% 3,566 17% $344,658,431 $1,858.68Utilities 10 1% 256 1% $11,221,241 $842.94Construction 135 10% 699 3% $19,306,834 $531.17Manufacturing 50 4% 808 4% $30,698,099 $730.63Wholesale Trade 35 3% 260 1% $8,947,447 $661.79Retail Trade 189 15% 3,674 18% $91,028,970 $476.47Transportation and Warehousing 30 2% 220 1% $8,939,471 $781.42Information 18 1% 181 1% $6,210,779 $659.88Finance and Insurance 89 7% 735 4% $32,172,996 $841.78Real Estate and Rental and Leasing 44 3% 192 1% $5,293,353 $530.18Professional, Scientific, and Technical Services 96 7% 701 3% $28,813,364 $790.45Management of Companies and Enterprises 5 0% 95 0% $2,666,305 $539.74Admin., Support, Waste Mgt. 76 6% 1,404 7% $31,423,101 $430.41Educational Services 12 1% 1,707 8% $45,092,360 $508.00Health Care and Social Assistance 195 15% 2,784 13% $108,921,684 $752.39Arts, Entertainment, and Recreation 16 1% 478 2% $11,785,514 $474.15Accommodation and Food Services 102 8% 1,733 8% $19,267,982 $213.81Other Services (except Public Administration) 110 8% 677 3% $15,351,000 $436.06Public Administration 30 2% 519 3% $18,400,461 $681.80Unclassified 2 0% ND ND ND NDTotal 1,295 100% 20,709 100% $841,093,072 $781.05
WASHINGTON
Number of Establishments and Employment by Size of Firm
Size ClassNumber of
EstablishmentsAverage Annual
Employment AnnualTotal Wages
Quarterly Census of Employment and Wages by Industry Division
IndustryNumber of
EstablishmentsAverage Annual
Employment AnnualTotal Wages
87

Quarterly Census of Employment and Wages (QCEW) 2008
AverageWeekly
Number Percent Number Percent Wage
0* 25 10% ND ND ND ND1--4 128 50% 277 12% $7,675,329 $532.545--9 44 17% 279 12% $7,818,665 $538.4410--19 34 13% 456 20% $13,048,248 $549.8820-49 16 6% 455 20% $13,685,541 $578.3250-99 5 2% 383 17% $3,089,808 $620.57100-249 3 1% ND ND ND ND250-499 0 0% 0 0% $0 $0.00500-999 0 0% 0 0% $0 $0.001000+ 0 0% 0 0% $0 $0.00TOTAL 253 100% 2,250 100% $72,905,818 $623.13* For the establishment which had zero employment in the third month of the quarter.
AverageWeekly
Number Percent Number Percent WageAgriculture, Forestry, Fishing and Hunting 7 3% 27 1% $799,464 $569.42Mining, Quarrying, and Oil and Gas Extraction 8 3% 231 10% $15,105,738 $1,257.55Utilities 5 2% 37 2% $1,587,410 $825.06Construction 26 10% 240 11% $7,041,580 $564.23Manufacturing 9 4% 50 2% $859,912 $330.74Wholesale Trade 12 5% 101 4% $3,025,740 $576.11Retail Trade 32 13% 207 9% $3,548,433 $329.66Transportation and Warehousing 22 9% 75 3% $2,955,288 $757.77Information 10 4% 28 1% $915,679 $628.90Finance and Insurance 20 8% 111 5% $3,704,835 $641.86Real Estate and Rental and Leasing 7 3% 76 3% $2,783,845 $704.41Professional, Scientific, and Technical Services 18 7% 62 3% $3,321,185 $1,030.14Management of Companies and Enterprises 2 1% ND ND ND NDAdmin., Support, Waste Mgt. 4 2% ND ND ND NDEducational Services 6 2% 435 19% $13,417,025 $593.15Health Care and Social Assistance 8 3% 163 7% $3,741,096 $441.38Accommodation and Food Services 10 4% 80 4% $876,620 $210.73Other Services (except Public Administration) 13 5% 32 1% $708,871 $426.00Public Administration 35 14% 287 13% $8,318,079 $557.36Total 253 100% 2,250 100% $72,905,818 $623.13
WASHITA
Number of Establishments and Employment by Size of Firm
Size ClassNumber of
EstablishmentsAverage Annual
Employment AnnualTotal Wages
Quarterly Census of Employment and Wages by Industry Division
IndustryNumber of
EstablishmentsAverage Annual
Employment AnnualTotal Wages
88

Quarterly Census of Employment and Wages (QCEW) 2008
AverageWeekly
Number Percent Number Percent Wage
0* 23 7% 6 0% $82,767 $258.111--4 155 49% 327 11% $8,228,938 $484.565--9 74 23% 460 15% $11,668,741 $488.2710--19 35 11% 447 15% $12,248,714 $526.4720-49 22 7% 640 21% $14,880,878 $447.0850-99 4 1% 311 10% $3,377,946 $417.98100-249 4 1% ND ND ND ND250-499 1 0% ND ND ND ND500-999 0 0% 0 0% $0 $0.001000+ 0 0% 0 0% $0 $0.00TOTAL 317 100% 3,048 100% $77,561,483 $489.36* For the establishment which had zero employment in the third month of the quarter.
AverageWeekly
Number Percent Number Percent WageAgriculture, Forestry, Fishing and Hunting 10 3% 34 1% $1,107,332 $626.32Mining, Quarrying, and Oil and Gas Extraction 11 3% 76 2% $3,245,400 $821.20Utilities 6 2% ND ND ND NDConstruction 26 8% 145 5% $3,938,074 $522.29Manufacturing 10 3% 198 6% $3,529,496 $342.80Wholesale Trade 15 5% 104 3% $4,232,299 $782.60Retail Trade 48 15% 477 16% $9,684,705 $390.45Transportation and Warehousing 17 5% 88 3% $3,070,405 $670.98Information 7 2% 63 2% $1,421,397 $433.88Finance and Insurance 21 7% 161 5% $5,260,812 $628.38Real Estate and Rental and Leasing 8 3% 24 1% $323,166 $258.95Professional, Scientific, and Technical Services 23 7% 59 2% $1,369,107 $446.25Management of Companies and Enterprises 1 0% ND ND ND NDAdmin., Support, Waste Mgt. 12 4% 38 1% $1,415,066 $716.13Educational Services 6 2% 641 21% $19,177,664 $575.35Health Care and Social Assistance 21 7% 387 13% $9,714,693 $482.74Arts, Entertainment, and Recreation 5 2% 29 1% $225,991 $149.86Accommodation and Food Services 23 7% 226 7% $2,241,585 $190.74Other Services (except Public Administration) 21 7% 60 2% $1,241,777 $398.01Public Administration 28 9% 220 7% $5,649,168 $493.81Total 317 100% 3,048 100% $77,561,483 $489.36
WOODS
Number of Establishments and Employment by Size of Firm
Size ClassNumber of
EstablishmentsAverage Annual
Employment AnnualTotal Wages
Quarterly Census of Employment and Wages by Industry Division
IndustryNumber of
EstablishmentsAverage Annual
Employment AnnualTotal Wages
89

Quarterly Census of Employment and Wages (QCEW) 2008
AverageWeekly
Number Percent Number Percent Wage
0* 53 6% 25 0% $1,443,025 $1,132.671--4 340 41% 780 8% $24,397,764 $601.395--9 184 22% 1,214 12% $40,424,900 $640.2310--19 124 15% 1,696 16% $54,839,909 $621.9220-49 79 10% 2,302 22% $91,729,415 $766.3950-99 32 4% 1,928 19% $98,801,155 $985.57100-249 3 0% 701 7% $18,908,369 $1,038.18250-499 6 1% 1,926 19% $53,361,598 $710.57500-999 0 0% 0 0% $0 $0.001000+ 0 0% 0 0% $0 $0.00TOTAL 820 100% 10,348 100% $400,483,195 $744.26* For the establishment which had zero employment in the third month of the quarter.
AverageWeekly
Number Percent Number Percent WageAgriculture, Forestry, Fishing and Hunting 13 2% 160 2% $4,050,299 $486.81Mining, Quarrying, and Oil and Gas Extraction 96 12% 2,320 22% $141,825,911 $1,175.61Utilities 14 2% 160 2% $7,995,435 $960.99Construction 66 8% 839 8% $39,955,544 $915.82Manufacturing 26 3% 405 4% $21,388,864 $1,015.62Wholesale Trade 41 5% 319 3% $14,493,417 $873.73Retail Trade 110 13% 1,301 13% $26,221,013 $387.59Transportation and Warehousing 55 7% 466 5% $21,476,237 $886.28Information 9 1% 102 1% $3,167,527 $597.20Finance and Insurance 38 5% 321 3% $11,455,921 $686.31Real Estate and Rental and Leasing 30 4% 124 1% $4,658,206 $722.43Professional, Scientific, and Technical Services 52 6% 209 2% $7,852,202 $722.51Management of Companies and Enterprises 2 0% ND ND ND NDAdmin., Support, Waste Mgt. 27 3% 198 2% $5,330,558 $517.73Educational Services 9 1% 606 6% $18,851,227 $598.22Health Care and Social Assistance 81 10% 1,335 13% $38,047,160 $548.07Arts, Entertainment, and Recreation 8 1% ND ND ND NDAccommodation and Food Services 46 6% 740 7% $9,712,716 $252.41Other Services (except Public Administration) 62 8% 311 3% $8,787,488 $543.38Public Administration 35 4% 367 4% $12,741,930 $667.68Total 820 100% 10,348 100% $400,483,195 $744.26
Total 820 100% 10,348 100% $400,483,195 $744.26
WOODWARD
Number of Establishments and Employment by Size of Firm
Size ClassNumber of
EstablishmentsAverage Annual
Employment AnnualTotal Wages
Quarterly Census of Employment and Wages by Industry Division
IndustryNumber of
EstablishmentsAverage Annual
Employment AnnualTotal Wages
90