Oklahoma EMS Service Call Summary DATA REPORT.pdf2 Oklahoma EMS Service Call Summary 2009-2011...
63
Oklahoma State Department of Health 2009-2011 Oklahoma EMS Service Call Summary Martin Lansdale, MPH Epidemiologist
Transcript of Oklahoma EMS Service Call Summary DATA REPORT.pdf2 Oklahoma EMS Service Call Summary 2009-2011...

Oklahoma State Department of Health
2009-2011
Oklahoma EMS Service Call Summary Martin Lansdale, MPH
Epidemiologist

2
Oklahoma EMS Service Call Summary 2009-2011
Foreword
This document is the result of hard work on the part of many persons involved in pre-hospital care in Oklahoma. It is a compilation of quality data reporting along with collection and analysis which provides us with valuable information about Oklahoma’s system of pre-hospital care. Ambulance data was reported by EMS service providers to the Oklahoma EMS Information System (OKEMSIS) and an analysis was performed by EMS/Trauma Epidemiologists of the Oklahoma State Department of Health.
The purpose of collecting Ambulance data is to gain a more complete picture of pre-hospital patient care in Oklahoma in order to improve the EMS system as a whole. By analyzing this data, we can allocate resources more effectively and develop targeted strategies to improve pre-hospital care in Oklahoma. We can also identify further areas of research to help improve overall patient outcomes.
Quality data collection is the key to pre-hospital system development in Oklahoma as it enables us to continually improve our EMS system and helps us to measure improvements in pre-hospital care. Through the continued leadership of the Oklahoma State Department of Health and the work of EMS providers, emergency medical technicians (EMT’s), and the OSDH Emergency Systems staff, we can ensure that the citizens of Oklahoma continue to receive the proper level of care throughout the continuum of patient care in Oklahoma.
Dale Adkerson Director, EMS Oklahoma State Department of Health

3
Oklahoma EMS Service Call Summary 2009-2011
Executive Summary
Oklahoma saw a 10% increase in the overall number of service calls reported from 2009 to 2011 with 434,658 calls in 2009 and 483,861 calls in 2011 (Figure 1). There are several reasons for this increase which include better reporting by the service providers to the Oklahoma EMS Information System (OKEMSIS), a true increase in the number of runs, and an overall population increase in Oklahoma. Approximately 80% of the total call volume was 911 responses during the prescribed time period followed by inter-facility transfers (9.8%) and medical transports (3.8%). Seventy Five percent (75.7%) were treated and transported by EMS with patient refusals (10.4%) and cancelled calls (3.8%) coming in a distant second and third, respectively. 52% of all the EMS Service Calls between 2009 and 2011 occurred in urban areas followed by 32% from rural and 10.7% from super rural areas (Figure 25). 5.3% of the EMS service calls had unknown/bad zip codes therefore urban/rural/super rural status could not be determined. The overall state response time for 911 calls (cancelled calls excluded) stayed consistent during this time period at 7.1 minutes in 2009 to 7.6 minutes in 2011. Scene time for treated and transported patients (911 Calls only) increased from 17.4 minutes in 2009 to 18.9 minutes in 2011. Total time (Time of destination arrival - time unit dispatched) followed the same pattern as response time, staying consistent at 40.2 minutes in 2009 to 41.6 minutes in 2011.
Five agencies reported ≈49% of all the service calls between 2009 and 2011 with one agency reporting 37% of all statewide EMS calls (Table 4). Oklahoma (Region 8) and Tulsa Counties (Region 7) reported the most EMS runs followed by Muskogee, Cleveland, Comanche, and Pottawatomie Counties (Table 31). A majority of EMS service calls in Oklahoma were female (50.5%) for the specified time period with the 70 to 79 and 80+ age groups making up 35.4% of the total call volume. Most of the Oklahoma EMS service calls reported White (68.5%) as the patient’s racial category for all three years followed by Black/African Americans (9.7%) and American Indian/Alaska Natives (4.9%). Hispanics made up 2.3% of all the EMS service Calls in Oklahoma for 2009 and 2011. Black/African Americans had the highest rate of EMS service calls at 153.2/1,000 population (a 17.6% rate increase from 2009) followed by the White racial category at 119.8/1,000 population (a 14.2% rate increase from 2009) in 2011.
NOTE: *The data represented in this document was extracted from the OKEMSIS (Oklahoma EMS Information System) database and is in a constant state of maintenance therefore all information in this document is subject to change. The data represents the best information extracted at the time of this report. All rates in this document for 2009-2011 were calculated using population statistics from the US census at www.census.gov . Rates for 2009 were calculated using 2009 population estimates for Oklahoma while 2010 rates were calculated using the 2010 US census statistics. Rates for 2011 were calculated using 2011 population estimates for Oklahoma. Any cell in a table represented by an asterisk (**) is not reported due to privacy concerns. Urban/Rural analysis was calculated using zip codes for 2013 with the urban/rural/super rural designation defined by the Centers for Medicare and Medicaid Services (CMS).

4
Oklahoma EMS Service Call Summary 2009-2011
Figure 1: EMS service Calls by year, Oklahoma 2009-2011.
Geographic Distribution
Together, Oklahoma and Tulsa counties accounted for 42.0% of the total call volume for 2009 to 2011. The following map shows the distribution of EMS calls around the state of Oklahoma for 2011 (Map 1). All Regions in Oklahoma are based off Homeland Security Regions for Oklahoma (Map 5). Incident Region is defined as the location of the EMS service call based on county while Agency Region is defined as the region where the actual service provider is located.

5
Oklahoma EMS Service Call Summary 2009-2011
Map 1: EMS service Calls by County, Oklahoma 2011.
• Tulsa County reported the most service calls followed by Oklahoma, Muskogee, Cleveland, Comanche, and Pottawatomie County (Table 31).
• Oklahoma City had the most service calls followed by Tulsa, Muskogee, and Lawton (Table 1).
• EMS agencies located in Region 8 (Agency Region) reported the most service calls in 2011 followed by Region 7 (Table 2).
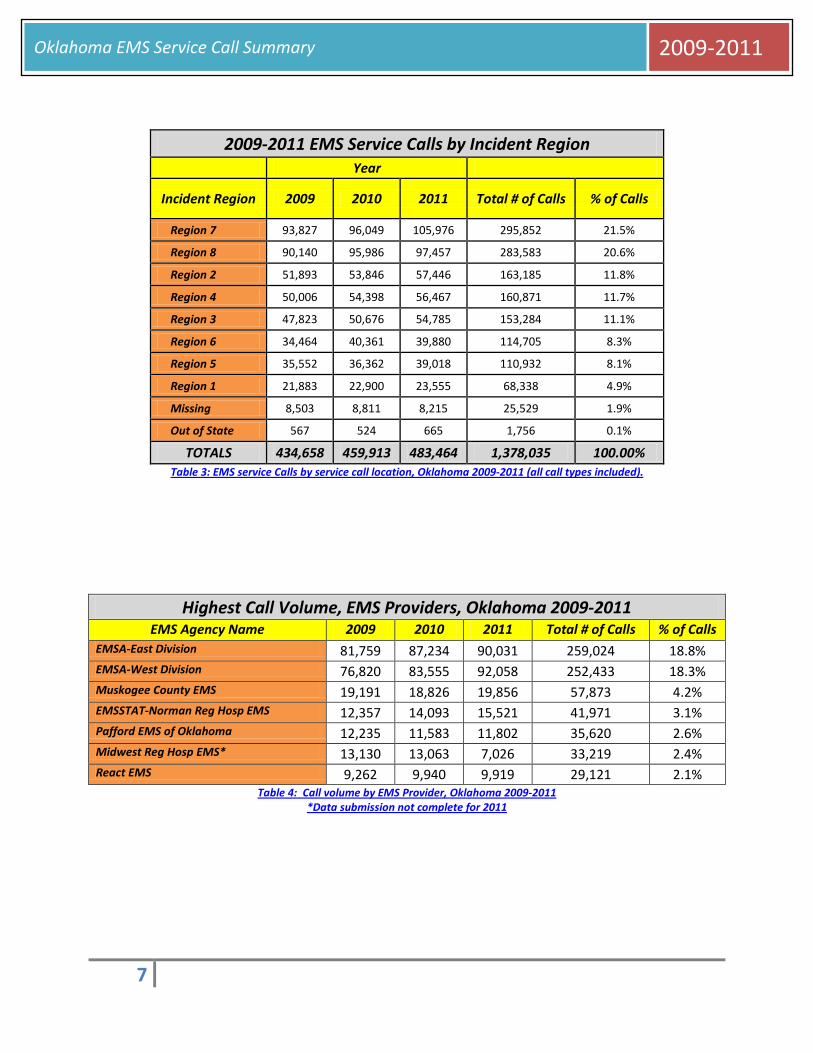
• Region 7 had the most EMS service calls (Incident Region) followed by Region 8 (Table 3).
• EMS Service calls occurred 53.7% of the time in urban areas followed by Rural (32.4%) and Super Rural (10.7%) areas (Figure 2, Map 7).
• EMSA (37.1%) had the highest call volume in Oklahoma followed by Muskogee County EMS (4.2%), EMSSTAT-Norman Regional Hospital EMS (3.1%), Pafford EMS (2.6%), Midwest Regional Hospital EMS (2.4%) and React EMS (2.1%) (Table 4).

6
Oklahoma EMS Service Call Summary 2009-2011
2009-2011 EMS Service Calls by City, Top 12 Cities Year
Incident City 2009 2010 2011 Total # of Calls % of Calls
OKLAHOMA CITY 79,448 75,604 86,691 241,743 17.5%
TULSA 2,745 72,281 85,426 160,452 11.6%
Null Values(Missing ,NA, NK) 90,655 19,839 10,496 120,990 8.8%
MUSKOGEE 10,631 11,102 14,011 35,744 2.6%
LAWTON 9,787 11,167 12,892 33,846 2.5%
NORMAN 7,664 9,021 9,984 26,669 1.9%
SHAWNEE 6,785 7,221 7,014 21,020 1.5%
TAHLEQUAH 5,358 6,124 6,295 17,777 1.3%
ENID 5,506 5,946 5,817 17,269 1.3%
OWASSO 5,146 5,748 5,421 16,315 1.2%
ARDMORE 5,079 5,304 5,746 16,129 1.2%
MIDWEST CITY 6,329 6,212 3,422 15,963 1.2%
CLAREMORE 5,432 5,102 5,129 15,663 1.1%
Table 1: EMS service Calls by incident city, Oklahoma 2009-2011 (all call types included, not all cities shown).
2009-2011 EMS Service Calls by Agency Region Year
Agency Location 2009 2010 2011 Total # of Calls % of Calls
Region 8 107,060 117,902 119,507 344,469 25.0%
Region 7 106,774 113,130 115,190 335,094 24.3%
Region 3 48,180 50,495 55,574 154,249 11.2%
Region 4 45,841 48,112 50,326 144,279 10.5%
Region 2 45,185 46,132 50,509 141,826 10.3%
Region 5 37,292 38,638 42,771 118,701 8.6%
Region 1 24,387 24,972 28,048 77,407 5.6%
Region 6 19,939 20,532 21,596 62,067 4.5%
TOTALS 434,658 459,913 483,521 1,378,092 100.00% Table 2: EMS service Calls by Agency location, Oklahoma 2009-2011 (all call types included).
7
Oklahoma EMS Service Call Summary 2009-2011
2009-2011 EMS Service Calls by Incident Region Year
Incident Region 2009 2010 2011 Total # of Calls % of Calls
Region 7 93,827 96,049 105,976 295,852 21.5%
Region 8 90,140 95,986 97,457 283,583 20.6%
Region 2 51,893 53,846 57,446 163,185 11.8%
Region 4 50,006 54,398 56,467 160,871 11.7%
Region 3 47,823 50,676 54,785 153,284 11.1%
Region 6 34,464 40,361 39,880 114,705 8.3%
Region 5 35,552 36,362 39,018 110,932 8.1%
Region 1 21,883 22,900 23,555 68,338 4.9%
Missing 8,503 8,811 8,215 25,529 1.9%
Out of State 567 524 665 1,756 0.1%
TOTALS 434,658 459,913 483,464 1,378,035 100.00% Table 3: EMS service Calls by service call location, Oklahoma 2009-2011 (all call types included).
Highest Call Volume, EMS Providers, Oklahoma 2009-2011 EMS Agency Name 2009 2010 2011 Total # of Calls % of Calls
EMSA-East Division 81,759 87,234 90,031 259,024 18.8% EMSA-West Division 76,820 83,555 92,058 252,433 18.3% Muskogee County EMS 19,191 18,826 19,856 57,873 4.2% EMSSTAT-Norman Reg Hosp EMS 12,357 14,093 15,521 41,971 3.1% Pafford EMS of Oklahoma 12,235 11,583 11,802 35,620 2.6% Midwest Reg Hosp EMS* 13,130 13,063 7,026 33,219 2.4% React EMS 9,262 9,940 9,919 29,121 2.1%
Table 4: Call volume by EMS Provider, Oklahoma 2009-2011 *Data submission not complete for 2011

8
Oklahoma EMS Service Call Summary 2009-2011
Figure 2: EMS service Calls by service Zone, Urban vs. Rural, Oklahoma 2009-2011 (all call types included).
EMS Service Calls by Type of Service Requested and Call Outcome
• The majority of EMS calls in Oklahoma for 2009 to 2011 were 911 Responses (79.8%) followed by Inter-Facility Transfers (9.8%, Table 5).
• Most patients were treated and transported by EMS (75.3%) followed by Patient Refusals (10.4%) and No Patient Found (3.9%, Table 6).
EMS Service Calls by Type of Service Requested, Oklahoma 2009-2011 Year
Type of Call 2009 2010 2011 Total # of Calls % of Calls
911 Response 345,520 369,863 384,628 1,100,011 79.8%
Inter-facility Transfer 40,344 42,887 51,592 134,823 9.8%
Missing 25,813 24,153 24,212 74,178 5.4%
Medical Transport 18,262 17,538 16,645 52,445 3.8%
Standby 3,309 4,168 5,280 12,757 0.9%
Intercept 864 736 581 2,181 0.2%
Mutual Aid 533 563 573 1,669 0.1%
Null Value (NA, NK, etc.) ** ** ** ** **
Flag Down/Walk-in Emergent ** ** ** ** **
Totals 434,658 459,913 483,521 1,378,092 100.00% Table 5: EMS service Calls by call type, Oklahoma 2009-2011.

9
Oklahoma EMS Service Call Summary 2009-2011
EMS Service Calls by Call Outcome, Oklahoma 2009-2011 Year
Call Outcome 2009 2010 2011 Total # of Calls % of Calls
Treated, Transported by EMS 332,043 348,268 363,369 1,043,680 75.7%
Patient Refused Care 43,942 47,751 51,165 142,858 10.4%
No Patient Found 12,321 17,303 23,383 53,007 3.9%
Cancelled 16,591 19,153 16,574 52,318 3.8%
No Treatment Required 8,845 10,885 12,955 32,685 2.4%
Treated and Released 6,416 6,277 6,825 19,518 1.4%
Dead at Scene 4,113 4,047 4,243 12,403 0.9%
Treated, Transferred Care 3,020 3,201 2,725 8,946 0.7%
Missing 5,162 731 671 6,564 0.5%
Null Value (NA, NK, etc.) 956 1,050 503 2,509 0.2%
Treated, Transported by Private Vehicle 699 590 547 1,836 0.1%
Treated, Transported by Law Enforcement 458 542 472 1,472 0.1%
Standby only-No Patient Contacts 89 114 89 292 0.02%
Unable to Locate Patient/Scene ** ** ** ** **
Totals 434,658 459,913 483,521 1,378,092 100.00% Table 6: EMS service Calls by call outcome, Oklahoma 2009-2011.
EMS Service Calls Weekday, Month, and Time of Day
• The months of May through August had the highest percentage of calls (34.5%) with February having the lowest percentage (7.6%, Figure 3).
• 15.6% of all EMS Service calls occurred on Friday for 2009 through 2011 followed by Thursday (14.6%).
• Sunday (12.5%) had the lowest percentage of service calls for all three years.
• Forty-Four percent of the all EMS service calls occurred on Thursday, Friday, and Saturday (Figure 4) for the specified time period.
• Approximately 51% of all calls between 2009 and 2011 occurred between 9:00am and 6:00pm (Figure 5).
• Just over 77% of all calls between 2009 and 2011 occurred between 9:00am and midnight (Figure 5).

10
Oklahoma EMS Service Call Summary 2009-2011
Figure 3: EMS service Calls by Month, Oklahoma 2009-2011.
Figure 4: EMS service Calls by Day of the Week, Oklahoma 2009-2011.

11
Oklahoma EMS Service Call Summary 2009-2011
Figure 5: EMS service Calls by Time of Day, Oklahoma 2009-2011.
EMS Service Calls by Gender, Age, and Racial Group
• Just over 50% of the EMS Service Calls for 2009 through 2011 were Female with 42.1% being Male. Gender was not recorded for 7.4% of the patients.
• Patients that were 50 and over made up 63.3% of all the EMS service calls with the 80+ age group making up 20.7%, the highest percentage of all the age groups.
• The 80+ age group also had the highest rate per 1,000 population (Figure 7) at 587.6 in 2011, 2.3 times higher than the second highest age group(70 to 79, 256/1,000 population).
• The 20 to 29 age group had the biggest rate increase from 2009 to 2011 at 62/1,000 population, a 12% increase compared to 2009(54/1,000 population).
• Call frequency was similar for Males and Females by age group except for the 60 to 69, 70 to 79, and 80+ age groups which had more females than males.
• Rates by age and gender were similar between males and females with females having higher rates than males in the 70 to 79 and 80+ age groups for all three years (Figure 8, Figure 9).
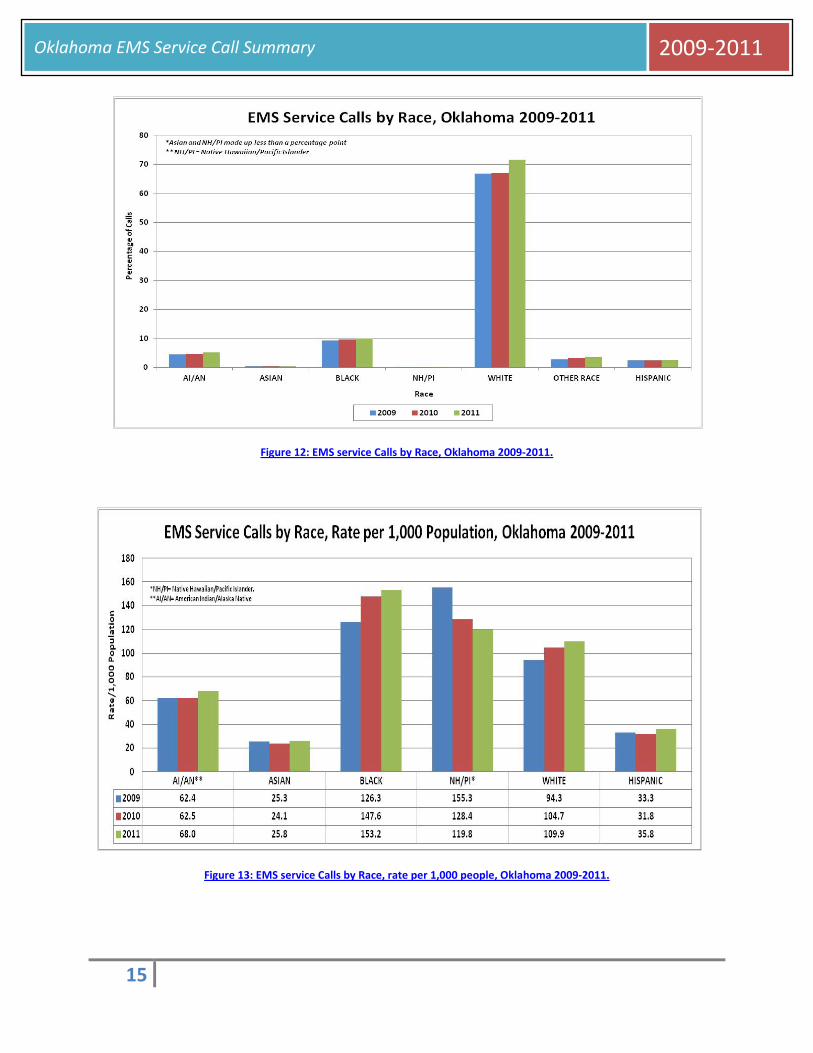
• The majority of the services calls for both years reported the patient racial group as White (68.5%) followed by Black/African American (9.7%) and American Indian/Alaska Native (4.9%, Figure 12).
• Black/African Americans (153/1,000 population) had the highest rate per 1,000 population followed by the White (109/1,000 population) racial group in 2011 (Figure 13). Pacific Islanders have a very small population percentage therefore the rate for that group may not be stable.

12
Oklahoma EMS Service Call Summary 2009-2011
Figure 6: Oklahoma Population by Age, 2009-2011, US Census.
Figure 7: EMS Service Calls by Age, rate per 1,000 population.

13
Oklahoma EMS Service Call Summary 2009-2011
Figure 8: Rate of EMS service Calls by Age Group and Gender, Males, Oklahoma 2009-2011.
Figure 9: Rate of EMS service Calls by Age Group and Gender, Females, Oklahoma 2009-2011.

14
Oklahoma EMS Service Call Summary 2009-2011
Figure 10: EMS service Calls by Age Group and Gender, Males, Oklahoma 2009-2011.
Figure 11: EMS service Calls by Age Group and Gender, Females, Oklahoma 2009-2011.
15
Oklahoma EMS Service Call Summary 2009-2011
Figure 12: EMS service Calls by Race, Oklahoma 2009-2011.
Figure 13: EMS service Calls by Race, rate per 1,000 people, Oklahoma 2009-2011.

16
Oklahoma EMS Service Call Summary 2009-2011
Run Times for EMS Service Calls in Oklahoma
Run times in Oklahoma are effected by several factors including geography, level of service, and urban areas versus rural areas. Oklahoma has all the above factors listed and the following statistics should be interpreted with these factors in mind. Response Time is defined as the time interval between the time the ambulance was dispatched and the time the ambulance arrived on scene. Scene Time is defined as the time interval between the time the ambulance arrived on scene and the time the ambulance left the scene. Total Time is defined as the time interval between the time the ambulance was dispatched and the time it reached its destination (ex. hospital, nursing home).
2011 Response Times for EMS Service Calls in Oklahoma (Cancelled Calls Excluded)
• The overall average response time for Oklahoma in 2011 was 7.6 minutes (Figure 14).
• Cotton County had the longest response time at 23.6 minutes followed by Haskell County at 15.7 minutes (Map 2).
• Custer County (5.1 minutes) had the shortest response time followed by Kay County (5.2 minutes) in 2011.
• Region 5 had the longest response time followed by Region 4 (Figure 14).
• Region 8 had the shortest response time followed by Region 7 in 2010.
2011 Scene Times for EMS Service Calls in Oklahoma (Treated and Transported Calls Only)
• The overall average scene time for Oklahoma in 2011 was 18.9 minutes (Figure 15).
• Tulsa County had the longest scene time at 23.1 minutes followed by Oklahoma County at 20.8 minutes (Map 3).
• Harmon County (10.5 minutes) had the shortest scene time followed by Tillman County (10.8 minutes) in 2011.
• Region 7 (Tulsa County) had the longest scene time followed by Region 8 (Oklahoma County, Figure 15).
• Region 3 had the shortest scene time followed by Region 1 in 2011.
2011 Total Times for EMS Service Calls in Oklahoma (Treated and Transported Calls Only)
• The overall average total time for Oklahoma in 2011 was 41.8 minutes (Figure 16).
• Roger Mills County had the longest total time at 83.1 minutes followed by Alfalfa County at 70.5 minutes (Map 4).
• Harmon County had the shortest total time at 22.4 minutes followed by Kay County at 27.2 minutes.
• Region 7 had the longest total time followed by Region 4 in 2011 (Figure 16).
• Region 1 had the shortest total time in 2011 followed by Region 3.

17
Oklahoma EMS Service Call Summary 2009-2011
Map2: Average response time by County, Oklahoma 2011.
Map3: Average scene time by County, Oklahoma 2011.

18
Oklahoma EMS Service Call Summary 2009-2011
Map 4: Average total time by County, Oklahoma 2011.
Figure 14: EMS response time for 911 calls by region, Oklahoma 2009-2011.

19
Oklahoma EMS Service Call Summary 2009-2011
Figure 15: EMS scene time for 911 calls by region, Oklahoma 2009-2011.
Figure 16: EMS total time for 911 calls by region, Oklahoma 2009-2011.
20
Oklahoma EMS Service Call Summary 2009-2011
EMS Service Calls by Region
Region 1
• Region 1 saw a 7.1% increase in the number of EMS calls from 2009 to 2011, the smallest increase of all the Oklahoma regions.
• 72.9% of all the service calls occurred in super rural areas with another 26.9% occurring in rural areas (Figure 25).
• Garfield County (27.0%) had the highest percentage of calls followed by Custer (16.7%), Beckham (9.9%), and Woodward (9.5%) counties.
• 25.3% of the service calls occurred in the City of Enid followed by Clinton (9.7%) and Woodward (8.4%).
• 95.4% of all service calls were transported by ground with 4.6% transported by an air service.
• Life EMS (26.5%) responded to the highest percentage of calls followed by Sinor EMS-Clinton (10.3%) in Region 1
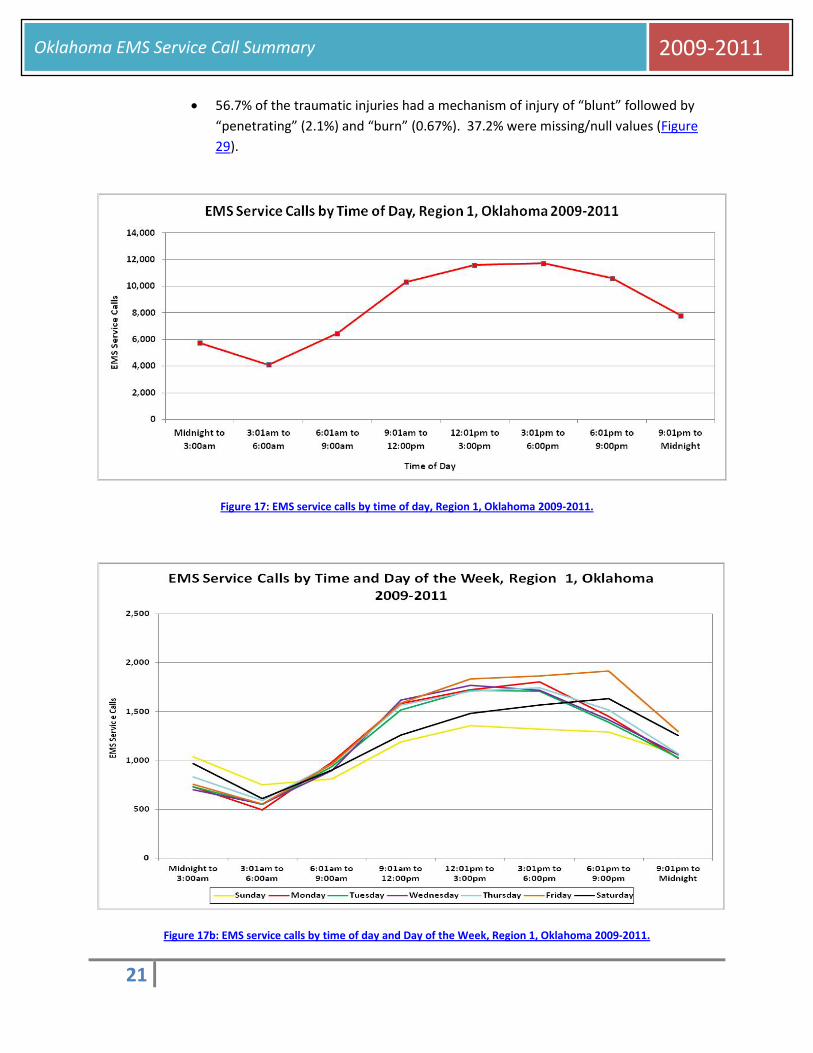
• The majority of calls occurred between 9:00am and 9:00pm (Figure 17).
• 15.6% of the service calls occurred on Friday with Sunday having the lowest percentage (12.9%).
• 69% were 911 calls followed by inter-facility transfers (14.2%).
• 74% were treated and transported followed by patient refusals (8.4%).
• 65.4% of all the service calls for Region 1 were in the 50+ age groups with the 80+ age group having the highest percentage (25.0%).
• 48.8% were female with 43.5% being male (7.7% unknown).
• 68.7% of the patients were reported as White followed by Hispanic (4.6%), American Indian/Alaska Native (3.4%) and Black/African American (2.10%, Figure 27).
• 37.7% of the treated and transported service calls had a location type of “Home/Residence” followed by “Healthcare Facility” (34.3%) and “Street or Highway” (10.9%).
• 82.5% of all Region 1 treated and transported service calls had a destination type of “hospital” followed by “nursing home” (7.7%).
• Saint Mary’s Regional Medical Center received the highest percentage of treated and transported calls followed by Integris Bass Baptist Health Center and Integris Clinton Regional Hospital (Table 9).
• “Closest facility” was the reason for choosing the destination 35.8% of the time followed by “patient choice” (26.3%) and “family choice” (6.3%) (Figure 30).
• Traumatic Injury made up 19% of the total calls in Region 1 from 2009-2011 (Figure 26).
• 29.7% of the traumatic injuries were caused by falls followed by Motor Vehicle Traffic Accidents at 19.5% (Figure 28).
21
Oklahoma EMS Service Call Summary 2009-2011
• 56.7% of the traumatic injuries had a mechanism of injury of “blunt” followed by “penetrating” (2.1%) and “burn” (0.67%). 37.2% were missing/null values (Figure 29).
Figure 17: EMS service calls by time of day, Region 1, Oklahoma 2009-2011.
Figure 17b: EMS service calls by time of day and Day of the Week, Region 1, Oklahoma 2009-2011.

22
Oklahoma EMS Service Call Summary 2009-2011
Figure 31: EMS service calls by month, Region 1, Oklahoma 2009-2011.
Top Ten Procedures Performed, Region 1, 2009-2011 Procedures Performed 2009 2010 2011 Total # of Calls % of Calls
Missing 4,526 4,203 3,577 12,306 19.2% Venous Access - Extremity 2,038 3,114 4,114 9,266 14.5% Assessment – Adult 2,504 3,026 2,889 8,419 13.1% Cardiac Monitor 2,541 2,453 1,578 6,572 10.3% Null Values (Not Applicable, etc.) 3,997 3,741 4,375 12,113 18.9% Blood Glucose Analysis 787 846 868 2,501 3.9% Pulse Oximetry 678 448 755 1,881 2.9% Stretcher 427 573 712 1,712 2.7% Spinal Immobilization 86 433 689 1,208 1.9% Venous Access-Existing Catheter/IV Monitoring 246 459 473 1,178 1.8% Spinal Immobilization-Long Back Board 448 354 188 990 1.6% Other 18 192 599 809 1.3%
Table 7: Procedures Performed, Region 1, Oklahoma 2009-2011, (Cancelled and No Patient Found calls excluded).

23
Oklahoma EMS Service Call Summary 2009-2011
Top Ten Medications Given, Region 1, 2009-2011 Medications Given 2009 2010 2011 Total # of Calls % of Calls
Missing 4,531 5,059 4,610 14,200 22.2% Null Values (Not Applicable, etc.) 8,905 8,041 9,586 26,532 41.4% Oxygen by Nasal Cannula 3,276 3,062 1,950 8,288 12.9% Oxygen 468 1,572 2,828 4,868 7.6% Oxygen (non-rebreather mask) 1,500 1,381 881 3,762 5.9% Normal Saline 334 758 1,170 2,262 3.5% Oxygen by Positive Pressure Device 213 165 62 440 0.7% Oxygen by Mask 161 107 90 358 0.6% Albuterol Sulfate 95 104 140 339 0.5% Dextrose 50% (D50) 142 97 62 301 0.5% Ondansetron (Zofran) 109 81 86 276 0.4% Morphine Sulfate 100 70 89 259 0.4%
Table 8: Medications Given, Region 1, Oklahoma 2009-2011, (Cancelled and No Patient Found calls excluded).
Top Ten Destinations, Region 1, 2009-2011 Destination Facility 2009 2010 2011 Total # of Calls % of Calls
Missing 277 2,611 5,116 8,004 15.83% Saint Mary’s Regional Medical Center Enid 2,477 1,768 761 5,006 9.90% Integris Bass Baptist Health Center 2,168 1,529 584 4,281 8.47% Integris Clinton Regional Hospital 1,263 1,262 1,354 3,879 7.67% Great Plains Regional Medical Center 954 1,103 1,187 3,244 6.42% Woodward Regional Hospital & Health Center 1,036 964 1,154 3,154 6.24% Nursing Home/Rest Home/Long Term Care 990 775 489 2,254 4.46% Weatherford Regional Hosp 563 661 772 1,996 3.95% OU Medical Center University Hospital (all) 459 478 482 1,419 2.81% Memorial Hospital of Texas County 433 481 487 1,401 2.77% Share Memorial Hospital 507 435 439 1,381 2.73%
Table 9: Top ten service call destinations, Region 1, Oklahoma 2009-2011, (Treated and Transported calls only).

24
Oklahoma EMS Service Call Summary 2009-2011
Region 2
• Region 2 saw a 9.7% increase in the number of EMS calls from 2009 to 2011.
• 69.9% of all the service calls occurred in rural areas with 20.4% occurring in urban areas followed by 9.5% in super rural areas (Figure 25).
• Osage County (16.5%) had the highest percentage of calls followed by Rogers (14.8%), Payne (13.5%), and Mayes (10.1%) counties.
• 10% of the service calls occurred in the City of Owasso followed by Claremore (9.6%) and Stillwater (8.6%).
• 96.5% of all service calls were transported by ground with 3.5% transported by an air service.
• Pafford EMS (12.9%) responded to the highest percentage of calls followed by Mercy Regional EMS (9.2%), Mayes Emergency Service Trust Authority (8.7%), and Bartlesville Ambulance Service (7.8%).
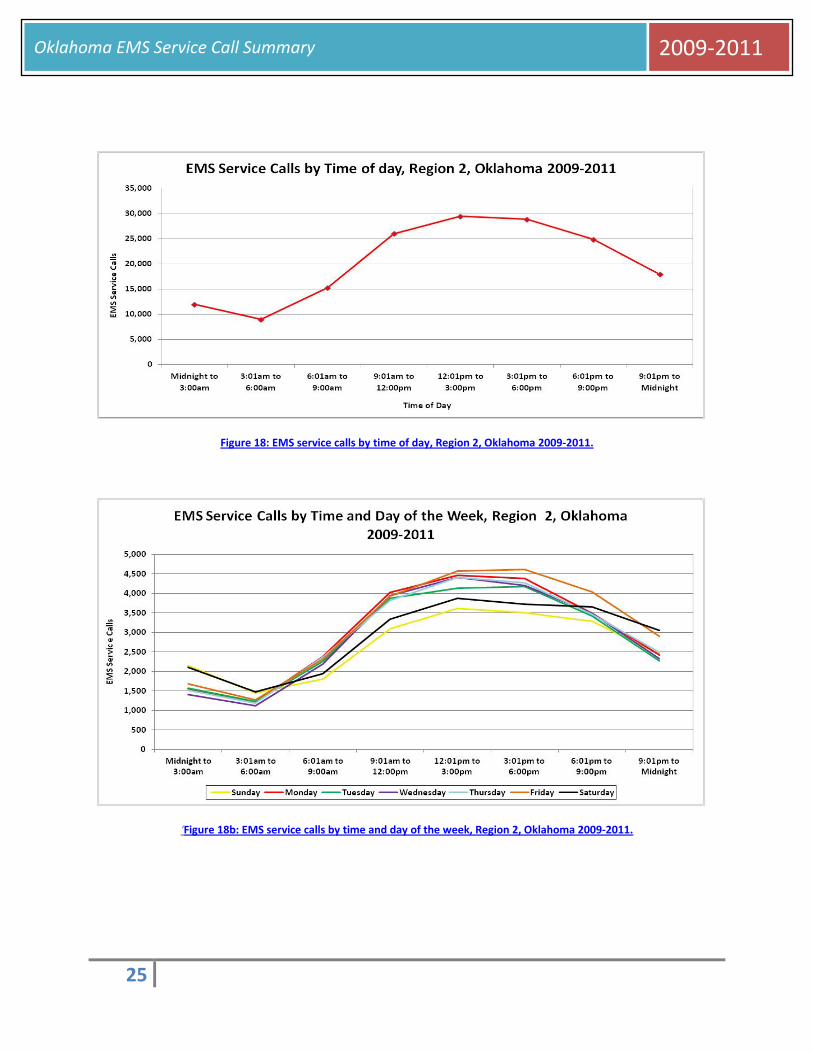
• The majority of calls occurred between 9:00am and 9:00pm (Figure 18).
• 15.5% of the service calls occurred on Friday with Sunday having the lowest percentage (13.1%).
• 73.9% were 911 calls followed by inter-facility transfers (14.9%).
• 72.5% were treated and transported followed by patient refusals (11.2%).
• 66.8% of all the service calls for Region 2 were in the 50+ age groups with the 80+ age group having the highest percentage (23.5%).
• 51.6% were female with 43.1% being male (5.3% unknown).
• 69.2% of the patients were reported as White followed by American Indian/Alaska Native (6.3%), Black/African American (2.1%), and Hispanic (1.2%, Figure 27).
• 35.2% of the treated and transported service calls had a location type of “Home/Residence” followed by “Healthcare Facility” (35%) and “Street or Highway” (13.7%).
• 83.3% of all Region 2 treated and transported service calls had a destination type of “hospital” followed by “nursing home” (7.8%).
• Saint John Medical Center received the highest percentage of treated and transported calls followed by Saint Francis Hospital and Ponca City Medical Center (Table 12).
• “Closest facility” was the reason for choosing the destination 40.8% of the time followed by “patient choice” (17.3%), “Protocol” (10.9%), and “family choice” (5.1%, Figure 30).
• Traumatic Injury made up 14.3% of the total calls in Region 2 from 2009-2011 (Figure 26).
• 25.5% of the traumatic injuries were caused by falls followed by Motor Vehicle Traffic Accidents at 19.1% (Figure 28).
• 38.9% of the traumatic injuries had a mechanism of injury of “blunt” followed by “penetrating” (2.2%) and “burn” (0.8%). 51.2% were missing/null values (Figure 29).
25
Oklahoma EMS Service Call Summary 2009-2011
Figure 18: EMS service calls by time of day, Region 2, Oklahoma 2009-2011.
‘Figure 18b: EMS service calls by time and day of the week, Region 2, Oklahoma 2009-2011.
26
Oklahoma EMS Service Call Summary 2009-2011
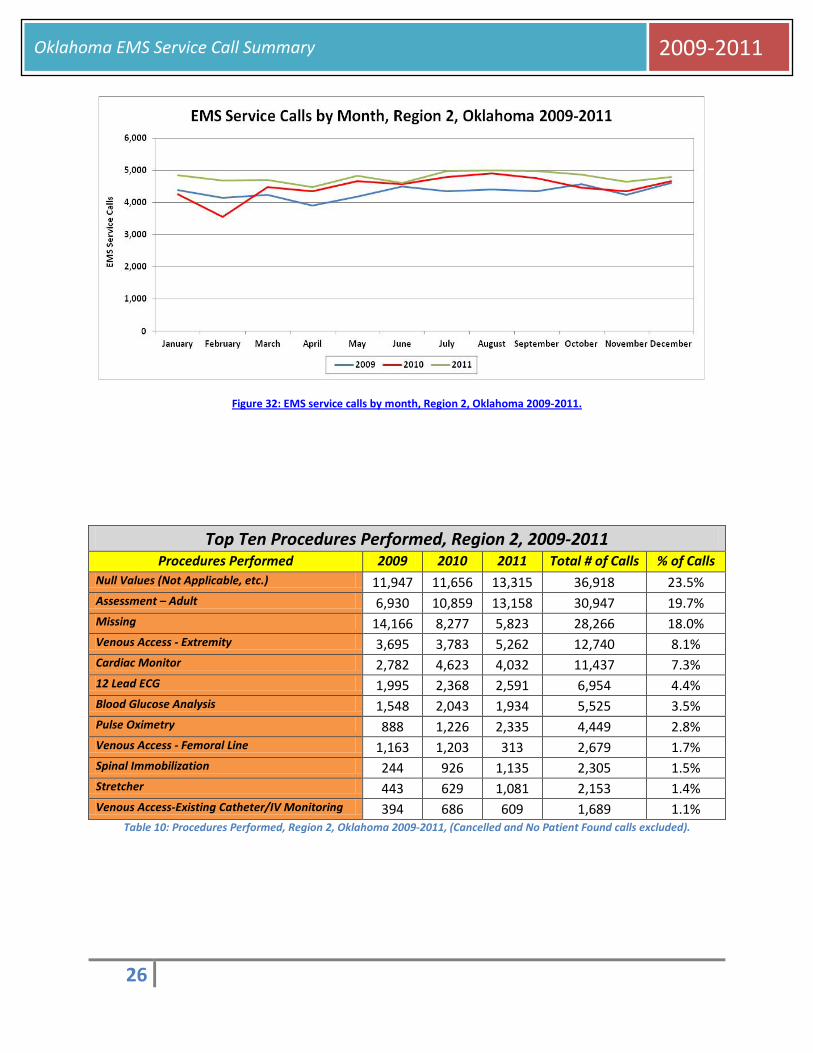
Figure 32: EMS service calls by month, Region 2, Oklahoma 2009-2011.
Top Ten Procedures Performed, Region 2, 2009-2011 Procedures Performed 2009 2010 2011 Total # of Calls % of Calls
Null Values (Not Applicable, etc.) 11,947 11,656 13,315 36,918 23.5% Assessment – Adult 6,930 10,859 13,158 30,947 19.7% Missing 14,166 8,277 5,823 28,266 18.0% Venous Access - Extremity 3,695 3,783 5,262 12,740 8.1% Cardiac Monitor 2,782 4,623 4,032 11,437 7.3% 12 Lead ECG 1,995 2,368 2,591 6,954 4.4% Blood Glucose Analysis 1,548 2,043 1,934 5,525 3.5% Pulse Oximetry 888 1,226 2,335 4,449 2.8% Venous Access - Femoral Line 1,163 1,203 313 2,679 1.7% Spinal Immobilization 244 926 1,135 2,305 1.5% Stretcher 443 629 1,081 2,153 1.4% Venous Access-Existing Catheter/IV Monitoring 394 686 609 1,689 1.1%
Table 10: Procedures Performed, Region 2, Oklahoma 2009-2011, (Cancelled and No Patient Found calls excluded).

27
Oklahoma EMS Service Call Summary 2009-2011
Top Ten Medications Given, Region 2, 2009-2011 Medications Given 2009 2010 2011 Total # of Calls % of Calls
Null Values (Not Applicable, etc.) 15,528 18,304 22,120 55,952 35.5% Missing 16,409 11,467 8,854 36,730 23.3% Oxygen 6,649 8,675 12,476 27,800 17.7% Oxygen by Nasal Cannula 5,078 6,074 4,706 15,858 10.1% Oxygen (non-rebreather mask) 1,474 1,702 1,079 4,255 2.7% Normal Saline 870 1,187 1,397 3,454 2.2% Albuterol Sulfate 467 405 337 1,209 0.8% Morphine Sulfate 400 370 349 1,119 0.7% Aspirin (ASA) 329 356 392 1,077 0.7% Dextrose 50% (D50) 300 341 382 1,023 0.7% Nitroglycerin 359 271 317 947 0.6% Fentanyl 194 288 263 745 0.5%
Table 11: Medications Given, Region 2, Oklahoma 2009-2011, (Cancelled and No Patient Found calls excluded).
Top Ten Destinations, Region 2, 2009-2011 Destination Facility 2009 2010 2011 Total # of Calls % of Calls
Jane Phillips Medical Center 4,409 2,863 4,456 11,728 9.9% Saint John Medical Center Inc 3,218 3,148 3,129 9,495 8.0% Saint Francis Hospital Inc 2,938 3,026 3,136 9,100 7.7% Ponca City Medical Center 1,733 2,590 2,722 7,045 6.0% Hillcrest Medical Center Tulsa 1,866 2,467 2,661 6,994 5.9% Stillwater Medical Center 2,535 2,783 997 6,315 5.3% Integris Baptist Regional Health Center Miami 1,911 1,871 1,961 5,743 4.9% Nursing Home/Rest Home/Long Term Care 2,119 1,844 1,528 5,491 4.6% Claremore Regional Hospital 1,708 1,747 1,847 5,302 4.5% Missing 85 789 4,061 4,935 4.2% Integris Mayes County Medical Center 1,501 1,640 1,694 4,835 4.1%
Table 12: Top ten service call destinations, Region 2, Oklahoma 2009-2011, (Treated and Transported calls only).

28
Oklahoma EMS Service Call Summary 2009-2011
Region 3
• Region 3 saw a 12.7% increase in the number of EMS calls from 2009 to 2011.
• 53.9% of all the service calls occurred in rural areas with 22.2% occurring in urban areas followed by 18.6% in super rural areas (Figure 25).
• Comanche County (25.4%) had the highest percentage of calls followed by Carter (13.2%), Pontotoc (10.3%), and Grady (9.3%) counties.
• 22.1% of the service calls occurred in the City of Lawton followed by Ardmore (10.5%) and Ada (9.5%).
• 97.2% of all service calls were transported by ground with 2.8% transported by an air service.
• Southern Oklahoma Ambulance Service (12.9%) responded to the highest percentage of calls followed by Kirk’s Emergency Service (12.0%), Comanche County Memorial Hospital EMS (9.5%), and Valley View Regional EMS (8.1%).
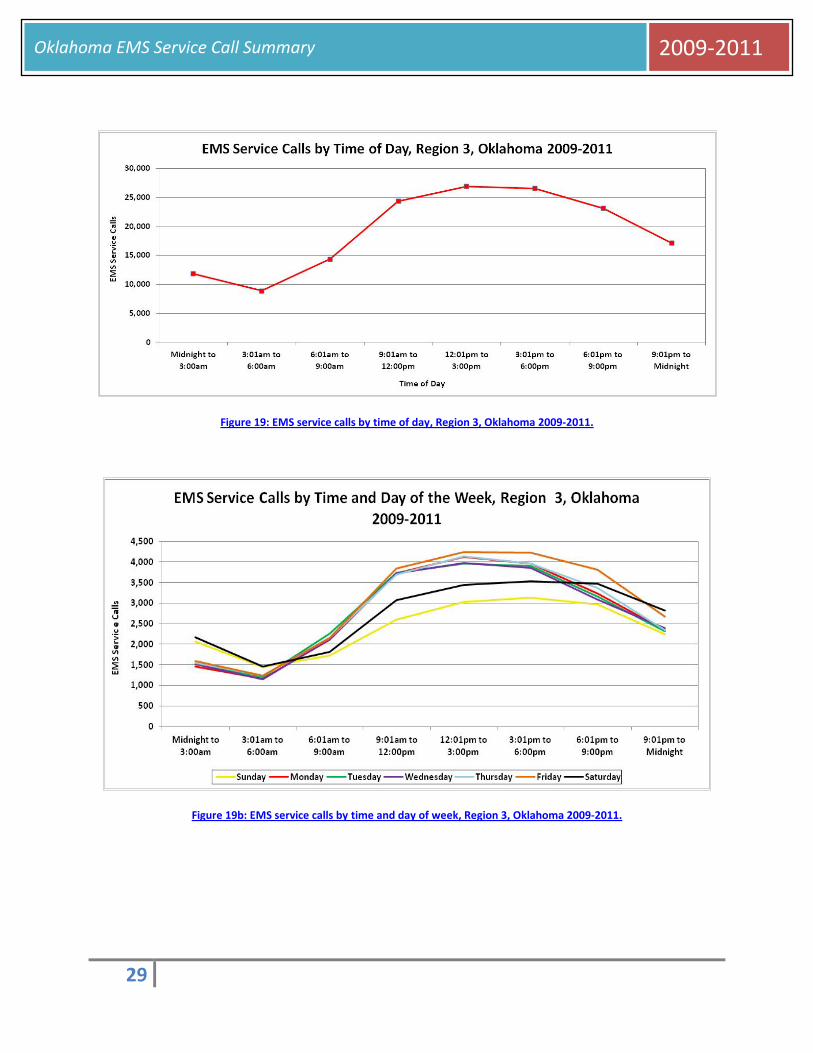
• The majority of calls occurred between 9:00am and 9:00pm (Figure 19).
• 15.5% of the service calls occurred on Friday with Sunday having the lowest percentage (12.6%).
• 75.4% were 911 calls followed by Missing (13.3%) and inter-facility transfers (5.1%).
• 71.6% were treated and transported followed by patient refusals (12.9%).
• 62.9% of all the service calls for Region 3 were in the 50+ age groups with the 80+ age group having the highest percentage (19.9%).
• 50.1% were female with 41.8% being male (8.2% unknown).
• 72.9% of the patients were reported as White followed by Black/African American (7.6%), American Indian/Alaska Native (7.5%), and Hispanic (3.4%, Figure 27).
• 44.6% of the treated and transported service calls had a location type of “Home/Residence” followed by “Healthcare Facility” (29.7%) and “Street or Highway” (10.8%).
• 81.3% of all Region 3 treated and transported service calls had a destination type of “hospital” followed by “nursing home” (2.0%).
• Comanche County Memorial Hospital received the highest percentage of treated and transported calls followed by Mercy-Ardmore and Valley View Regional (Table 15).
• “Closest facility” was the reason for choosing the destination 41.9% of the time followed by “patient choice” (22.5%), “Patient Physician Choice” (6.2%), and “Specialty Resource Center” (5.1%), Figure 30).
• Traumatic Injury made up 15.2% of the total calls in Region 2 from 2009-2011 (Figure 26).
• 26.9% of the traumatic injuries were caused by falls followed by Motor Vehicle Traffic Accidents at 23.0%. 28.7% were “Unknown” (Figure 28).
• 36.7% of the traumatic injuries had a mechanism of injury of “blunt” followed by “penetrating” (2.5%) and “burn” (0.6%). 52.5% were missing/null values (Figure 29).
29
Oklahoma EMS Service Call Summary 2009-2011
Figure 19: EMS service calls by time of day, Region 3, Oklahoma 2009-2011.
Figure 19b: EMS service calls by time and day of week, Region 3, Oklahoma 2009-2011.

30
Oklahoma EMS Service Call Summary 2009-2011
Figure 33: EMS service calls by month, Region 3, Oklahoma 2009-2011.
Top Ten Procedures Performed, Region 3, 2009-2011 Procedures Performed 2009 2010 2011 Total # of Calls % of Calls
Missing 16,938 15,496 16,021 48,455 33.4% Assessment – Adult 11,845 14,326 16,796 42,967 29.6% Venous Access - Extremity 2,866 3,279 3,417 9,562 6.6% Cardiac Monitor 2,356 2,459 2,402 7,217 5.0% Pulse Oximetry 1,986 2,573 1,793 6,352 4.4% Null Values (Not Applicable, etc.) 3,052 1,450 1,385 5,887 4.1% Blood Glucose Analysis 1,542 1,741 1,691 4,974 3.4% Airway - Cleared / Opened / or Heimlich 377 1,260 2,025 3,662 2.5% Stretcher 749 818 1,406 2,973 2.1% Assessment - Pediatric 411 477 592 1,480 1.0% Saline Lock 569 479 222 1,270 0.9% Cervical Spinal Immobilization – Rigid Collar 422 402 356 1,180 0.8%
Table 13: Procedures Performed, Region 3, Oklahoma 2009-2011, (Cancelled and No Patient Found calls excluded).

31
Oklahoma EMS Service Call Summary 2009-2011
Top Ten Medications Given, Region 3, 2009-2011 Medications Given 1 2009 2010 2011 Total # of Calls % of Calls
Missing 22,719 22,965 27,459 73,143 50.4% Null Values (Not Applicable, etc.) 7,606 8,057 7,744 23,407 16.1% Oxygen by Nasal Cannula 6,293 7,214 7,152 20,659 14.2% Normal Saline 1,946 1,879 2,159 5,984 4.1% Oxygen (non-rebreather mask) 1,806 1,957 1,725 5,488 3.8% Oxygen 1,939 1,791 1,470 5,200 3.6% Albuterol Sulfate 578 596 525 1,699 1.2% Aspirin (ASA) 454 428 400 1,282 0.9% Dextrose 50% (D50) 293 302 257 852 0.6% Morphine Sulfate 248 254 251 753 0.5% Nitroglycerin 237 200 209 646 0.5% Oxygen by Positive Pressure Device 200 236 207 643 0.4%
Table 14: Medications Given, Region 3, Oklahoma 2009-2011, (Cancelled and No Patient Found calls excluded).
Top Ten Destinations, Region 3, 2009-2011 Destination Facility 2009 2010 2011 Total # of Calls % of Calls
Comanche County Memorial Hospital 5,914 6,374 7,049 19,337 17.6% Mercy Memorial Health Center Inc Ardmore 4,165 4,344 4,652 13,161 12.0% Valley View Regional Hospital Ada 2,904 2,686 2,419 8,009 7.3% Duncan Regional Hospital Inc 2,431 2,711 1,834 6,976 6.4% Integris Baptist Medical Center Inc OKC 2,054 2,012 2,122 6,188 5.6% Grady Memorial Hospital 1,362 1,986 1,726 5,074 4.6% Nursing Home/Rest Home/Long Term Care 1,266 1,379 1,802 4,447 4.1% OU Medical Center University Hospital (all) 1,262 1,457 1,485 4,204 3.8% Southwestern Medical Center Lawton 1,273 1,456 1,438 4,167 3.8% Pauls Valley General Hospital 1,209 1,224 1,287 3,720 3.4%
Table 15: Top ten service call destinations, Region 3, Oklahoma 2009-2011, (Treated and Transported calls only).

32
Oklahoma EMS Service Call Summary 2009-2011
Region 4
• Region 4 saw an 11.4% increase in the number of EMS calls from 2009 to 2011.
• 77.2% of all the service calls occurred in rural areas with 20.3% occurring in urban areas followed by 2.4% in super rural areas (Figure 25).
• Muskogee County (32.7%) had the highest percentage of calls followed by Creek (14.0%), Cherokee (12.8%), and Okmulgee (10.8%) counties.
• 22.2% of the service calls occurred in the City of Muskogee followed by Tahlequah (11.1%) and Sapulpa (8.0%).
• 97.4% of all service calls were transported by ground with 2.6% transported by an air service.
• Muskogee County EMS (33.7%) responded to the highest percentage of calls followed by Creek County Ambulance Service (11.2%), Okmulgee County EMS (9.9%), and Pafford EMS (7.2%).
• The majority of calls occurred between 9:00am and 9:00pm (Figure 20).
• 15.8% of the service calls occurred on Friday with Sunday having the lowest percentage (12.1%).
• 74.6% were 911 calls followed by inter-facility transfers (12.5%).
• 77.0% were treated and transported followed by patient refusals (12.3%).
• 67.1% of all the service calls for Region 4 were in the 50+ age groups with the 80+ age group having the highest percentage (19.9%).
• 51.2% were female with 44.5% being male (4.3% unknown).
• 71.9% of the patients were reported as White followed by American Indian/Alaska Native (9.2%), Black/African American (7.8%), and Hispanic (1.0%, Figure 27).
• 38.6% of the treated and transported service calls had a location type of “Home/Residence” followed by “Healthcare Facility” (36.0%) and “Street or Highway” (8.2%).
• 76.3% of all Region 4 treated and transported service calls had a destination type of “hospital” followed by “nursing home” (7.9%).
• Muskogee Regional Medical Center received the highest percentage of treated and transported calls followed by St. Francis Hospital and Nursing Home/Long Term care facilities (Table 18).
• “Closest facility” was the reason for choosing the destination 26.7% of the time followed by “patient choice” (25.8%), “Other” (15.2%), and “Family Choice” (7.0%) (Figure 30).
• Traumatic Injury made up 10.4% of the total calls in Region 4 from 2009-2011 (Figure 26).
• 19.7% of the traumatic injuries were caused by falls followed by Motor Vehicle Traffic Accidents at 17.4%. 48.8% were “Unknown” (Figure 28).
• 32.1% of the traumatic injuries had a mechanism of injury of “blunt” followed by “penetrating” (1.7%) and “burn” (0.6%). 60.8% were missing/null values (Figure 29).

33
Oklahoma EMS Service Call Summary 2009-2011
Figure 20: EMS service calls by time of day, Region 4, Oklahoma 2009-2011.
Figure 20b: EMS service calls by time and day of week, Region 4, Oklahoma 2009-2011.

34
Oklahoma EMS Service Call Summary 2009-2011
Figure 34: EMS service calls by month, Region 4, Oklahoma 2009-2011.
Top Ten Procedures Performed, Region 4, 2009-2011 Procedures Performed 2009 2010 2011 Total # of Calls % of Calls
Pulse Oximetry 11,964 11,335 13,248 36,547 23.8% Null Values (Not Applicable, etc.) 8,143 8,415 8,714 25,272 16.5% Assessment – Adult 5,215 6,955 8,192 20,362 13.3% Missing 7,323 5,473 4,473 17,269 11.2% Cardiac Monitor 5,082 7,066 4,646 16,794 10.9% Venous Access - Extremity 1,866 2,432 2,872 7,170 4.7% Venous Access-Existing Catheter/IV Monitoring 1,333 1,365 1,384 4,082 2.7% Blood Glucose Analysis 1,069 1,164 1,647 3,880 2.5% Other 44 432 2,258 2,734 1.8% Spinal Immobilization-Long Back Board 981 921 703 2,605 1.7% Spinal Immobilization 223 787 1,413 2,423 1.6% Stretcher 537 483 817 1,837 1.2%
Table 16: Procedures Performed, Region 4, Oklahoma 2009-2011, (Cancelled and No Patient Found calls excluded).
35
Oklahoma EMS Service Call Summary 2009-2011
Top Ten Medications Given, Region 4, 2009-2011 Medications Given 2009 2010 2011 Total # of Calls % of Calls
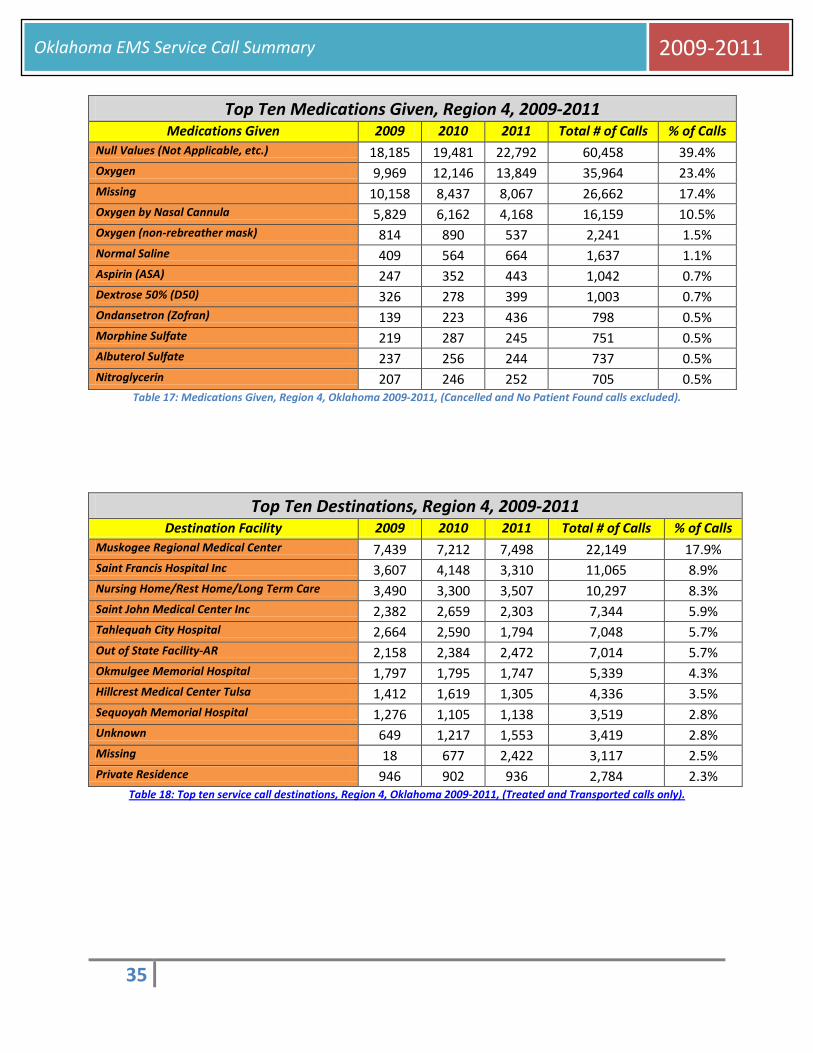
Null Values (Not Applicable, etc.) 18,185 19,481 22,792 60,458 39.4% Oxygen 9,969 12,146 13,849 35,964 23.4% Missing 10,158 8,437 8,067 26,662 17.4% Oxygen by Nasal Cannula 5,829 6,162 4,168 16,159 10.5% Oxygen (non-rebreather mask) 814 890 537 2,241 1.5% Normal Saline 409 564 664 1,637 1.1% Aspirin (ASA) 247 352 443 1,042 0.7% Dextrose 50% (D50) 326 278 399 1,003 0.7% Ondansetron (Zofran) 139 223 436 798 0.5% Morphine Sulfate 219 287 245 751 0.5% Albuterol Sulfate 237 256 244 737 0.5% Nitroglycerin 207 246 252 705 0.5%
Table 17: Medications Given, Region 4, Oklahoma 2009-2011, (Cancelled and No Patient Found calls excluded).
Top Ten Destinations, Region 4, 2009-2011 Destination Facility 2009 2010 2011 Total # of Calls % of Calls
Muskogee Regional Medical Center 7,439 7,212 7,498 22,149 17.9% Saint Francis Hospital Inc 3,607 4,148 3,310 11,065 8.9% Nursing Home/Rest Home/Long Term Care 3,490 3,300 3,507 10,297 8.3% Saint John Medical Center Inc 2,382 2,659 2,303 7,344 5.9% Tahlequah City Hospital 2,664 2,590 1,794 7,048 5.7% Out of State Facility-AR 2,158 2,384 2,472 7,014 5.7% Okmulgee Memorial Hospital 1,797 1,795 1,747 5,339 4.3% Hillcrest Medical Center Tulsa 1,412 1,619 1,305 4,336 3.5% Sequoyah Memorial Hospital 1,276 1,105 1,138 3,519 2.8% Unknown 649 1,217 1,553 3,419 2.8% Missing 18 677 2,422 3,117 2.5% Private Residence 946 902 936 2,784 2.3%
Table 18: Top ten service call destinations, Region 4, Oklahoma 2009-2011, (Treated and Transported calls only).

36
Oklahoma EMS Service Call Summary 2009-2011
Region 5
• Region 5 saw an 8.8% increase in the number of EMS calls from 2009 to 2011.
• 51.5% of all the service calls occurred in rural areas with 43.7% occurring in super rural areas followed by 4.5% in urban areas (Figure 25).
• Bryan County (17.8%) had the highest percentage of calls followed by Pittsburg (16.4%), Le Flore (13.4%), and McCurtain (11.9%) counties.
• 12.4% of the service calls occurred in the City of Durant followed by McAlester (8.7%) and Idabel (6.4%).
• 95.2% of all service calls were transported by ground with 4.8% transported by an air service.
• Bryan County EMS (14.2%) responded to the highest percentage of calls followed by EMS of Le Flore County (11.5%), McCurtain County EMS (11.3%), and Para Med EMS (6.6%).
• The majority of calls occurred between 9:00am and 9:00pm (Figure 21).
• 15.3% of the service calls occurred on Friday with Sunday having the lowest percentage (12.9%).
• 67.7% were 911 calls followed by Medical Transports (9.2%). 13.9% were missing for this element in Region 5.
• 77.5% were treated and transported followed by patient refusals (11.1%).
• 68.9% of all the service calls for Region 5 were in the 50+ age groups with the 80+ age group having the highest percentage (23.1%).
• 51.8% were female with 43.5% being male (4.7% unknown).
• 64.9% of the patients were reported as White followed by American Indian/Alaska Native (8.1%), Black/African American (4.5%), and Hispanic (1.2%, Figure 27).
• 38.4% of the treated and transported service calls had a location type of “Home/Residence” followed by “Healthcare Facility” (37.4%) and “Street or Highway” (12.4%).
• 78.6% of all Region 5 treated and transported service calls had a destination type of “hospital” followed by “nursing home” (3.4%). 15.5% were missing for this element.
• McAlester Regional Health Center (11.8%) and Medical Center of Southeastern Oklahoma (11.8%) both received the highest percentage of EMS service calls followed by McCurtain Memorial Hospital (7.4%, Table 21).
• “Closest facility” was the reason for choosing the destination 44.3% of the time followed by “patient choice” (11.8%), “Specialty Resource Center” (5.7%), and “Protocol” (5.1%). 20.6% were missing/null values in Region 5 for this element (Figure 30).
• Traumatic Injury made up 15.5% of the total calls in Region 4 from 2009-2011 (Figure 26).
• 26.4% of the traumatic injuries were caused by falls followed by Motor Vehicle Traffic Accidents at 19.2%. 38.7% were “Unknown” (Figure 28).

37
Oklahoma EMS Service Call Summary 2009-2011
• 38.6% of the traumatic injuries had a mechanism of injury of “blunt” followed by “penetrating” (2.6%) and “burn” (0.7%). 52.0% were missing/null values (Figure 29).
Figure 21: EMS service calls by time of day, Region 5, Oklahoma 2009-2011.
Figure 21b: EMS service calls by time and day of week, Region 5, Oklahoma 2009-2011.

38
Oklahoma EMS Service Call Summary 2009-2011
Figure 35: EMS service calls by month, Region 5, Oklahoma 2009-2011.
Top Ten Procedures Performed, Region 5, 2009-2011 Procedures Performed 2009 2010 2011 Total # of Calls % of Calls
Missing 16,032 14,198 12,754 42,984 40.1% Null Values (Not Applicable, etc.) 5,847 6,330 6,668 18,845 17.6% Assessment – Adult 2,389 2,729 5,151 10,269 9.6% Venous Access - Extremity 2,569 3,021 3,515 9,105 8.5% Cardiac Monitor 2,135 2,711 2,328 7,174 6.7% Blood Glucose Analysis 763 763 964 2,490 2.3% Stretcher 444 455 1,184 2,083 1.9% 12 Lead ECG 262 661 705 1,628 1.5% Saline Lock 673 333 191 1,197 1.1% Airway – Nasopharyngeal 606 518 65 1,189 1.1% Venous Access-Existing Catheter/IV Monitoring 345 299 389 1,033 1.0% Other 59 221 738 1,018 1.0%
Table 19: Procedures Performed, Region 5, Oklahoma 2009-2011, (Cancelled and No Patient Found calls excluded).

39
Oklahoma EMS Service Call Summary 2009-2011
Top Ten Medications Given, Region 5, 2009-2011 Medications Given 2009 2010 2011 Total # of Calls % of Calls
Missing 16,464 14,094 13,909 44,467 41.5% Null Values (Not Applicable, etc.) 7,758 8,630 9,263 25,651 23.9% Oxygen by Nasal Cannula 4,888 4,182 4,184 13,254 12.4% Oxygen 1,096 3,244 5,323 9,663 9.0% Normal Saline 998 1,504 1,513 4,015 3.7% Oxygen (non-rebreather mask) 1,290 730 653 2,673 2.5% Albuterol Sulfate 265 273 276 814 0.8% Aspirin (ASA) 116 218 332 666 0.6% Morphine Sulfate 176 189 179 544 0.5% Ondansetron (Zofran) 104 177 251 532 0.5% Nitroglycerin 203 137 181 521 0.5% Oxygen by Positive Pressure Device 162 163 113 438 0.4%
Table 20: Medications Given, Region 5, Oklahoma 2009-2011, (Cancelled and No Patient Found calls excluded).
Top Ten Destinations, Region 5, 2009-2011 Destination Facility 2009 2010 2011 Total # of Calls % of Calls
McAlester Regional Health Center 3,132 3,427 3,588 10,147 11.8% Medical Center of Southeastern Oklahoma 3,133 3,418 3,562 10,113 11.8% McCurtain Memorial Hospital 1,908 2,138 2,350 6,396 7.4% Nursing Home/Rest Home/Long Term Care 1,747 2,017 1,869 5,633 6.6% Choctaw Memorial Hospital 1,182 1,284 1,297 3,763 4.4% Out of State Facility-TX 1,375 1,097 1,281 3,753 4.4% Out of State Facility-AR 2,113 945 165 3,223 3.8% Missing 181 841 2,185 3,207 3.7% Seminole Medical Center 887 1,023 898 2,808 3.3% Atoka Memorial Hospital 827 819 874 2,520 2.9% Null Values (Not Applicable, etc.) 632 571 1,271 2,474 2.9% Pushmataha County Town of Antlers Hospital Auth 596 706 646 1,948 2.3%
Table 21: Top ten service call destinations, Region 5, Oklahoma 2009-2011, (Treated and Transported calls only).

40
Oklahoma EMS Service Call Summary 2009-2011
Region 6
• Region 6 saw a 13.6% increase in the number of EMS calls from 2009 to 2011, the largest increase of all 8 regions.
• 59.2% of all the service calls occurred in urban areas with 39.9% occurring in rural areas followed by 0.1% in super rural areas (Figure 25).
• Cleveland County (43.0%) had the highest percentage of calls followed by Pottawatomie (23.6%), Canadian (11.6%), and McClain (9.1%) counties.
• 23.2% of the service calls occurred in the City of Norman followed by Shawnee (18.3%) and Moore (7.8%).
• 99.0% of all service calls were transported by ground with 0.9% transported by an air service.
• EMSSTAT- Norman Regional Hospital EMS (33.5%) responded to the highest percentage of calls followed by React EMS (24.9%) and Wadley’s EMS (5.5%).
• The majority of calls occurred between 9:00am and 9:00pm (Figure 22).
• 15.7% of the service calls occurred on Friday with Sunday having the lowest percentage (12.6%).
• 77.2% were 911 calls followed by Inter-Facility Transfers (18.5%).
• 78.5% were treated and transported followed by patient refusals (10.4%).
• 62.9% of all the service calls for Region 6 were in the 50+ age groups with the 80+ age group having the highest percentage (19.7%).
• 50.0% were female with 40.9% being male (9.0% unknown).
• 77.9% of the patients were reported as White followed by Black/African American (4.2%), American Indian/Alaska Native (4.1%), and Hispanic (1.6%, Figure 27).
• 40.3% of the treated and transported service calls had a location type of “Home/Residence” followed by “Healthcare Facility” (31.5%) and “Street or Highway” (13.3%).
• 67.1% of all Region 6 treated and transported service calls had a destination type of “hospital” followed by “nursing home” (3.3%). 26.8% were missing/not recorded for this element.
• Norman Regional Hospital (27.8%) received the highest percentage of EMS service calls followed by St. Anthony Hospital- Shawnee (16.9%, Table 24).
• “Closest facility” was the reason for choosing the destination 45.8% of the time followed by “patient choice” (17.4%), “Specialty Resource Center” (9.6%), and “Protocol” (8.7%) (Figure 30).
• Traumatic Injury made up 16.9% of the total calls in Region 6 from 2009-2011 (Figure 26).
• 35.6% of the traumatic injuries were caused by falls followed by Motor Vehicle Traffic Accidents at 20.1%. 23.9% were “Unknown” (Figure 28).
• 58.0% of the traumatic injuries had a mechanism of injury of “blunt” followed by “penetrating” (3.0%) and “burn” (0.6%). 30.8% were missing/null values (Figure 29).

41
Oklahoma EMS Service Call Summary 2009-2011
Figure 22: EMS service calls by time of day, Region 6, Oklahoma 2009-2011.
Figure 22b: EMS service calls by time and day of week, Region 6, Oklahoma 2009-2011.

42
Oklahoma EMS Service Call Summary 2009-2011
Figure 36: EMS service calls by month, Region 6, Oklahoma 2009-2011.
Top Ten Procedures Performed, Region 6, 2009-2011 Procedures Performed 2009 2010 2011 Total # of Calls % of Calls
Null Values (Not Applicable, etc.) 7,570 7,928 7,313 22,811 21.2% Cardiac Monitor 5,716 7,708 7,373 20,797 19.3% Venous Access - Extremity 3,902 4,506 4,110 12,518 11.6% Pulse Oximetry 2,002 3,644 5,329 10,975 10.2% Missing 3,351 2,578 2,127 8,056 7.5% Assessment – Adult 2,224 2,289 1,900 6,413 6.0% Other 1,692 2,054 2,306 6,052 5.6% Venous Access-Existing Catheter/IV Monitoring 1,260 2,062 2,465 5,787 5.4% Spinal Immobilization 443 768 727 1,938 1.8% Blood Glucose Analysis 617 593 707 1,917 1.8% Splinting 662 628 608 1,898 1.8% Venous Access - Femoral Line 646 659 151 1,456 1.4%
Table 22: Procedures Performed, Region 6, Oklahoma 2009-2011, (Cancelled and No Patient Found calls excluded).
43
Oklahoma EMS Service Call Summary 2009-2011
Top Ten Medications Given, Region 6, 2009-2011 Medications Given 2009 2010 2011 Total # of Calls % of Calls
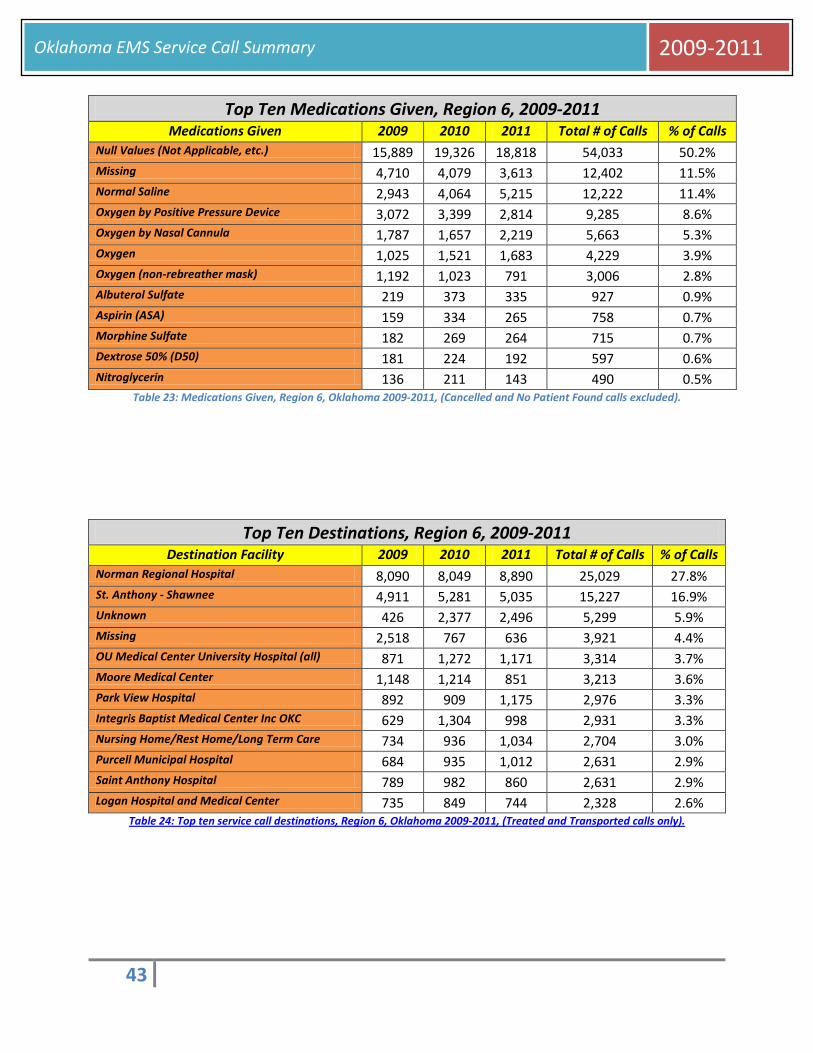
Null Values (Not Applicable, etc.) 15,889 19,326 18,818 54,033 50.2% Missing 4,710 4,079 3,613 12,402 11.5% Normal Saline 2,943 4,064 5,215 12,222 11.4% Oxygen by Positive Pressure Device 3,072 3,399 2,814 9,285 8.6% Oxygen by Nasal Cannula 1,787 1,657 2,219 5,663 5.3% Oxygen 1,025 1,521 1,683 4,229 3.9% Oxygen (non-rebreather mask) 1,192 1,023 791 3,006 2.8% Albuterol Sulfate 219 373 335 927 0.9% Aspirin (ASA) 159 334 265 758 0.7% Morphine Sulfate 182 269 264 715 0.7% Dextrose 50% (D50) 181 224 192 597 0.6% Nitroglycerin 136 211 143 490 0.5%
Table 23: Medications Given, Region 6, Oklahoma 2009-2011, (Cancelled and No Patient Found calls excluded).
Top Ten Destinations, Region 6, 2009-2011 Destination Facility 2009 2010 2011 Total # of Calls % of Calls
Norman Regional Hospital 8,090 8,049 8,890 25,029 27.8% St. Anthony - Shawnee 4,911 5,281 5,035 15,227 16.9% Unknown 426 2,377 2,496 5,299 5.9% Missing 2,518 767 636 3,921 4.4% OU Medical Center University Hospital (all) 871 1,272 1,171 3,314 3.7% Moore Medical Center 1,148 1,214 851 3,213 3.6% Park View Hospital 892 909 1,175 2,976 3.3% Integris Baptist Medical Center Inc OKC 629 1,304 998 2,931 3.3% Nursing Home/Rest Home/Long Term Care 734 936 1,034 2,704 3.0% Purcell Municipal Hospital 684 935 1,012 2,631 2.9% Saint Anthony Hospital 789 982 860 2,631 2.9% Logan Hospital and Medical Center 735 849 744 2,328 2.6%
Table 24: Top ten service call destinations, Region 6, Oklahoma 2009-2011, (Treated and Transported calls only).

44
Oklahoma EMS Service Call Summary 2009-2011
Region 7
• Region 7 saw an 11.5% increase in the number of EMS calls from 2009 to 2011.
• 92.3% of all the service calls occurred in urban areas with 7.7%% of the zip codes that were unknown/didn’t match CMS Zip Codes (Figure 25).
• Region 7 includes only Tulsa County with 21.5% of all the EMS service calls in Oklahoma.
• 54.2% of the service calls occurred in the City of Tulsa followed by Union (4.2%) and Broken Arrow (2.06%). 32.4% were missing/Null Values for incident city.
• 99.9% of all service calls were transported by ground.
• EMSA-East Division (86.1%) responded to the highest percentage of calls followed by Broken Arrow Fire Department EMS (5.5%).
• The majority of calls occurred between 9:00am and 9:00pm (Figure 23).
• 15.9% of the service calls occurred on Friday with Sunday having the lowest percentage (11.8%).
• 85.1% were 911 calls followed by Inter-Facility Transfers (8.5%).
• 74.4% were treated and transported followed by patient refusals (9.5%).
• 60.7% of all the service calls for Region 7 were in the 50+ age groups with the 80+ age group having the highest percentage (19.9%).
• 51.4% were female with 41.2% being male (7.5% unknown).
• 69.3% of the patients were reported as White followed by Black/African American (16.5%), Hispanic (2.7%) and American Indian/Alaska Native (2.4%, Figure 27).
• 44.4% of the treated and transported service calls had a location type of “Home/Residence” followed by “Healthcare Facility” (25.9%) and “Street or Highway” (11.9%).
• 84.8% of all Region 7 treated and transported service calls had a destination type of “hospital” followed by “nursing home” (9.3%).
• St. Francis Hospital (26.8%) received the highest percentage of EMS service calls followed by St. John Medical Center (23.8%) (Table 27).
• “Patient Choice” was the reason for choosing the destination 74.9% of the time followed by “Other” (14.7%), “Closest Facility” (2.3%), and “Missing” (2.3%) (Figure 30).
• Traumatic Injury made up 16.8% of the total calls in Region 7 from 2009-2011 (Figure 26).
• 36.4% of the traumatic injuries were caused by falls followed by Assaults (17.1%) and Motor Vehicle Traffic Accidents at 2.6%. 39.1% were “Unknown” (Figure 28).
• 90.9% for mechanism of injury were missing/null values making this element useless (Figure 29).

45
Oklahoma EMS Service Call Summary 2009-2011
Figure 23: EMS service calls by time of day, Region 7, Oklahoma 2009-2011.
Figure 23b: EMS service calls by time and day of week, Region 7, Oklahoma 2009-2011.
46
Oklahoma EMS Service Call Summary 2009-2011
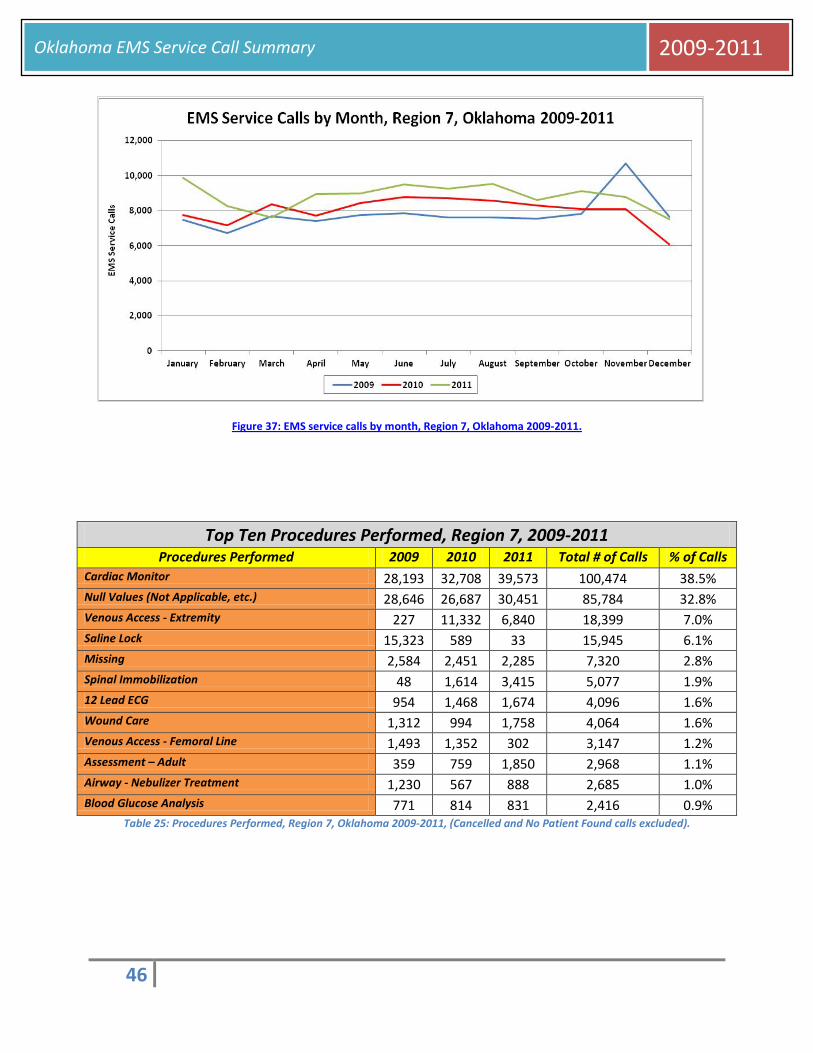
Figure 37: EMS service calls by month, Region 7, Oklahoma 2009-2011.
Top Ten Procedures Performed, Region 7, 2009-2011 Procedures Performed 2009 2010 2011 Total # of Calls % of Calls
Cardiac Monitor 28,193 32,708 39,573 100,474 38.5% Null Values (Not Applicable, etc.) 28,646 26,687 30,451 85,784 32.8% Venous Access - Extremity 227 11,332 6,840 18,399 7.0% Saline Lock 15,323 589 33 15,945 6.1% Missing 2,584 2,451 2,285 7,320 2.8% Spinal Immobilization 48 1,614 3,415 5,077 1.9% 12 Lead ECG 954 1,468 1,674 4,096 1.6% Wound Care 1,312 994 1,758 4,064 1.6% Venous Access - Femoral Line 1,493 1,352 302 3,147 1.2% Assessment – Adult 359 759 1,850 2,968 1.1% Airway - Nebulizer Treatment 1,230 567 888 2,685 1.0% Blood Glucose Analysis 771 814 831 2,416 0.9%
Table 25: Procedures Performed, Region 7, Oklahoma 2009-2011, (Cancelled and No Patient Found calls excluded).

47
Oklahoma EMS Service Call Summary 2009-2011
Top Ten Medications Given, Region 7, 2009-2011 Medications Given 2009 2010 2011 Total # of Calls % of Calls
Null Values (Not Applicable, etc.) 65,676 65,140 75,184 206,000 78.9% Oxygen 2,378 2,699 3,367 8,444 3.2% Aspirin (ASA) 2,524 2,664 2,701 7,889 3.0% Missing 2,450 2,627 2,588 7,665 2.9% Nitroglycerin 1,831 1,701 1,641 5,173 2.0% Albuterol Sulfate 1,522 1,622 1,793 4,937 1.9% Atrovent (Ipratropium Bromide) 1,036 1,115 1,151 3,302 1.3% Dextrose 50% (D50) 1,200 891 743 2,834 1.1% Naloxone (Narcan) 887 776 699 2,362 0.9% Oxygen by Nasal Cannula 842 780 547 2,169 0.8% Morphine Sulfate 1,189 630 137 1,956 0.8% Diphenhydramine (Benadryl) 762 510 258 1,530 0.6%
Table 26: Medications Given, Region 7, Oklahoma 2009-2011, (Cancelled and No Patient Found calls excluded).
Top Ten Destinations, Region 7, 2009-2011 Destination Facility 2009 2010 2011 Total # of Calls % of Calls
Saint Francis Hospital Inc 19,417 19,330 20,307 59,054 26.8% Saint John Medical Center Inc 16,985 17,015 18,363 52,363 23.8% Hillcrest Medical Center Tulsa 10,391 10,571 12,064 33,026 15.0% Nursing Home/Rest Home/Long Term Care 6,971 6,637 7,234 20,842 9.5% OSU Medical Center 4,650 4,702 5,244 14,596 6.6% SouthCrest Hospital 3,871 3,673 3,415 10,959 5.0% Null Values (Not Applicable, etc.) 3,545 2,180 2,078 7,803 3.5% Saint Francis South - Tulsa 1,460 1,777 1,733 4,970 2.3% Missing 442 1,671 2,062 4,175 1.9% Private Residence 343 404 635 1,382 0.6% Saint Johns-Owasso 404 400 470 1,274 0.6% Out of State Facility Not Listed 200 215 830 1,245 0.6%
Table 27: Top ten service call destinations, Region 7, Oklahoma 2009-2011, (Treated and Transported calls only).
48
Oklahoma EMS Service Call Summary 2009-2011
Region 8
• Region 8 saw a 7.5% increase in the number of EMS calls from 2009 to 2011.
• 91.8% of all the service calls occurred in urban areas with 8.2%% of the zip codes that were unknown/didn’t match CMS Zip Codes (Figure 25).
• Region 8 includes only Oklahoma County with 20.6% of all the EMS service calls in Oklahoma.
• 85.2% of the service calls occurred in Oklahoma City followed by Midwest City (5.7%) and Edmond (2.7%).
• 99.8% of all service calls were transported by ground.
• EMSA-West Division (86.4%) responded to the highest percentage of calls followed by Midwest Regional Hospital EMS (9.5%).
• The majority of calls occurred between 9:00am and 9:00pm (Figure 24).
• 15.3% of the service calls occurred on Friday with Sunday having the lowest percentage (12.8%).
• 92.4% were 911 calls followed by Inter-Facility Transfers (4.0%).
• 79.7% were treated and transported followed by patient refusals (9.0%).
• 59.3% of all the service calls for Region 8 were in the 50+ age groups with the 80+ age group having the highest percentage (18.7%).
• 51.3% were female with 41.9% being male (6.8% unknown).
• 60.8% of the patients were reported as White followed by Black/African American (16.3%), Hispanic (4.1%) and American Indian/Alaska Native (1.6%, Figure 27).
• 49.9% of the treated and transported service calls had a location type of “Home/Residence” followed by “Healthcare Facility” (17.8%) and “Street or Highway” (9.2%).
• 95.4% of all Region 8 treated and transported service calls had a destination type of “hospital” followed by “Missing” (9.3%, null value).
• OU Medical Center (16.2%) received the highest percentage of EMS service calls followed by Integris Baptist Medical Center (15.4%) and Integris Southwest Medical Center (13.6%) (Table 30).
• “Patient Choice” was the reason for choosing the destination 85.8% of the time followed by “Other” (6.1%), “Missing” (2.8%), and “Patients Physicians Choice” (1.4%) (Figure 30).
• Traumatic Injury made up 18.5% of the total calls in Region 8 from 2009-2011 (Figure 26).
• 40.6% of the traumatic injuries were caused by falls followed by Assaults (16.0%) and Motor Vehicle Traffic Accidents at 1.8%. 38.1% were “Unknown” (Figure 28).
• 92.9% for mechanism of injury were missing/null values making this element useless (Figure 29).

49
Oklahoma EMS Service Call Summary 2009-2011
Figure 24: EMS service calls by time of day, Region 8, Oklahoma 2009-2011.
Figure 24b: EMS service calls by time and day of week, Region 8, Oklahoma 2009-2011.

50
Oklahoma EMS Service Call Summary 2009-2011
Figure 38: EMS service calls by month, Region 8, Oklahoma 2009-2011.
Top Ten Procedures Performed, Region 8, 2009-2011 Procedures Performed 2009 2010 2011 Total # of Calls % of Calls
Cardiac Monitor 29,546 36,578 44,144 110,268 42.0% Null Values (Not Applicable, etc.) 17,559 19,082 18,910 55,551 21.2% Venous Access - Extremity 3,886 19,849 10,454 34,189 13.0% Missing 7,276 6,521 4,521 18,318 7.0% Saline Lock 18,280 16 2 18,298 7.0% Spinal Immobilization 125 3,023 4,199 7,347 2.8% Wound Care 1,299 1,505 1,593 4,397 1.7% Airway - Nebulizer Treatment 1,151 816 786 2,753 1.1% Spinal Immobilization-Standing Take-Down 2,098 2 . 2,100 0.8% Splinting 591 591 797 1,979 0.8% 12 Lead ECG 272 331 206 809 0.3% Airway - Positive Pressure Ventilation / BVM 192 206 149 547 0.2%
Table 28: Procedures Performed, Region 8, Oklahoma 2009-2011, (Cancelled and No Patient Found calls excluded).

51
Oklahoma EMS Service Call Summary 2009-2011
Top Ten Medications Given, Region 8, 2009-2011 Medications Given 2009 2010 2011 Total # of Calls % of Calls
Null Values (Not Applicable, etc.) 57,523 63,669 66,719 187,911 71.6% Missing 9,677 9,641 6,385 25,703 9.8% Aspirin (ASA) 3,152 3,412 3,191 9,755 3.7% Albuterol Sulfate 2,316 2,620 2,555 7,491 2.9% Nitroglycerin 2,110 2,008 1,624 5,742 2.2% Dextrose 50% (D50) 1,394 1,301 1,081 3,776 1.4% Atrovent (Ipratropium Bromide) 851 1,277 1,391 3,519 1.3% Naloxone (Narcan) 1,052 1,260 1,070 3,382 1.3% Normal Saline 1,045 1,175 745 2,965 1.1% Morphine Sulfate 1,615 935 253 2,803 1.1% Epinephrine 1:1000 497 556 612 1,665 0.6% Diphenhydramine (Benadryl) 410 302 207 919 0.4%
Table 29: Medications Given, Region 8, Oklahoma 2009-2011, (Cancelled and No Patient Found calls excluded).
Top Ten Destinations, Region 8, 2009-2011 Destination Facility 2009 2010 2011 Total # of Calls % of Calls
OU Medical Center University Hospital 12,099 13,078 11,494 36,671 16.2% Integris Baptist Medical Center Inc OKC 11,157 11,539 12,194 34,890 15.4% Integris Southwest Medical Center 9,307 10,686 10,755 30,748 13.6% Mercy Health Center Inc Oklahoma City 6,980 7,660 7,737 22,377 9.9% Saint Anthony Hospital 2,741 8,607 10,021 21,369 9.5% Midwest Regional Medical Center 7,291 7,339 4,602 19,232 8.5% Deaconess Hospital 5,545 5,679 5,560 16,784 7.4% Nursing Home/Rest Home/Long Term Care 7,400 1,946 616 9,962 4.4% Oklahoma Heart Hospital - OKC North 2,485 2,439 2,479 7,403 3.3% OU-Edmond 1,844 1,901 2,112 5,857 2.6%
Table 30: Top ten service call destinations, Region 8, Oklahoma 2009-2011, (Treated and Transported calls only).

52
Oklahoma EMS Service Call Summary 2009-2011
Data Quality Issues with EMS Data
Submitting data into OKEMSIS in a timely manner is important and required but another issue for EMS data is data quality. Complete and accurate data is required for meaningful analyses of Oklahoma’s system of pre-hospital care. The following list includes some of the major data quality issues we have found during analysis of OKEMSIS data. Improvements in these areas of data collection will allow a more detailed analysis of Oklahoma’s system of pre-hospital care.
• The overuse of “Other”- Several required variables in OKEMSIS had a high percentage of “Other” as the chosen response. Unfortunately, the non-specific nature of ‘other’ hinders further analyses of that variable. One example of variables with “other” chosen at a high percentage are provider first and second impression (20.7% “other”, 18.9% “unknown” for first impression). Recently we have updated the list of choices for these fields to accommodate better responses.
• The Inappropriate use of Null Values- Several variables in OKEMSIS had a high percentage of Not Applicable, Not Known, Not Recorded and Not Available when a specific response was required. Some examples include the Mechanism of Injury variable (Figure 29) and Condition Codes (54% of the responses were “Not Applicable”). Unfortunately, the non-specific nature of null values hinders further analyses of that variable or makes that variable unusable.
• “Missing” data- Another data quality issue is missing data for some required data elements. Some variables were either blank (no response) or had a high percentage of missing values. All variables described in the OKEMSIS data dictionary are required. Analysis cannot be performed if there is no data. One example includes the transferring facility for Inter-Facility Transfers. A majority of that variable was blank, not available, or not applicable (71.6%).
• Data Submission- If data is not submitted by the required time interval it can skew the results for data analysis causing inaccurate conclusions or delayed analysis. EMS data is due by the last business day of the following month (for example, January data is due by the end of February) in Oklahoma according to EMS regulations (EMS
Rules and Regulations, pg. 64, OAC 310:641-3-160, part (b)). Failure to submit data in this time frame will result in an agency being non-compliant unless the EMS service has written the State EMS Director stating reasons for the delay.
All the required variables and instructions for those variables can be found in the OKEMSIS Data Dictionary and OKEMSIS Patient Care Report Instruction Manual. Both documents can be found at the following link: http://www.ok.gov/health/Protective_Health/Emergency_Medical_Services/OKEMSIS_-_OK_EMS_Data_System__/index.html

53
Oklahoma EMS Service Call Summary 2009-2011
Contacts
• Martin Lansdale, MPH, Epidemiologist, Emergency Systems E-Mail: [email protected] Phone: (405)271-4027
• Kenneth Stewart, PhD, Emergency Systems E-Mail: [email protected] Phone: (405)271-4027
• Dale Adkerson, EMS Director, Emergency Systems E-Mail: [email protected] Phone: (405)271-4027
• OKEMSIS Website https://okemsis.health.ok.gov
Miscellaneous Maps and Tables
2009-2011 EMS Service Calls by County Year
Incident County 2009 2010 2011 Total # of Calls % of Calls
TULSA 93,827 96,049 105,976 295,852 21.5% OKLAHOMA 90,140 95,986 97,457 283,583 20.6% MUSKOGEE 17,307 17,164 18,168 52,639 3.8% CLEVELAND 15,267 16,925 17,123 49,315 3.6% COMANCHE 11,189 12,667 15,063 38,919 2.8% POTTAWATOMIE 8,662 9,221 9,162 27,045 1.9% OSAGE 9,260 9,061 8,644 26,965 1.9% ROGERS 7,422 8,303 8,357 24,082 1.8% Null Values(Missing ,NA,NK) 8,328 8,542 5,963 22,833 1.7% CREEK 7,113 7,830 7,625 22,568 1.6% PAYNE 6,910 7,708 7,382 22,000 1.6% CHEROKEE 6,151 7,062 7,424 20,637 1.5% CARTER 6,323 6,604 7,302 20,229 1.5% BRYAN 6,372 6,590 6,814 19,776 1.4%

54
Oklahoma EMS Service Call Summary 2009-2011
GARFIELD 5,806 6,361 6,292 18,459 1.3% PITTSBURG 5,782 5,932 6,460 18,174 1.3% OKMULGEE 5,682 5,904 5,813 17,399 1.3% MAYES 4,868 5,595 5,981 16,444 1.2% OTTAWA 5,235 5,341 5,394 15,970 1.2% PONTOTOC 5,255 5,221 5,296 15,772 1.1% LE FLORE 5,548 4,311 4,958 14,817 1.1% GRADY 4,339 4,917 5,008 14,264 1.0% KAY 3,694 4,973 5,506 14,173 1.0% WAGONER 3,465 4,972 5,351 13,788 1.0% DELAWARE 4,261 4,359 5,017 13,637 0.9% CANADIAN 2,470 5,917 4,892 13,279 0.9% MCCURTAIN 4,128 4,479 4,662 13,269 0.9% WASHINGTON 5,051 2,882 5,125 13,058 0.9% SEQUOYAH 4,485 4,190 4,303 12,978 0.9% STEPHENS 3,704 4,057 3,655 11,416 0.8% CUSTER 3,622 3,909 3,845 11,376 0.8% GARVIN 3,472 3,496 3,839 10,807 0.8% MCCLAIN 3,445 3,407 3,596 10,448 0.8% SEMINOLE 2,672 3,167 3,213 9,052 0.7% MCINTOSH 2,709 3,073 3,210 8,992 0.7% CADDO 2,951 3,132 2,775 8,858 0.6% LINCOLN 2,474 2,858 2,935 8,267 0.6% ADAIR 1,873 2,868 3,359 8,100 0.6% CHOCTAW 2,436 2,643 2,627 7,706 0.6% JACKSON 2,711 2,257 2,658 7,626 0.6% BECKHAM 2,259 2,139 2,360 6,758 0.5% WOODWARD 2,172 2,102 2,231 6,505 0.5% LOGAN 2,146 2,033 2,172 6,351 0.5% ATOKA 1,923 1,979 2,046 5,948 0.4% MURRAY 1,818 1,787 2,114 5,719 0.4% CRAIG 1,633 1,959 2,108 5,700 0.4% PAWNEE 1,682 1,836 2,005 5,523 0.4% OKFUSKEE 1,426 1,740 2,129 5,295 0.4% HUGHES 1,236 1,617 1,760 4,613 0.3% LOVE 1,359 1,548 1,609 4,516 0.3% KIOWA 1,324 1,410 1,309 4,043 0.3% MARSHALL 1,249 1,196 1,527 3,972 0.3%
55
Oklahoma EMS Service Call Summary 2009-2011
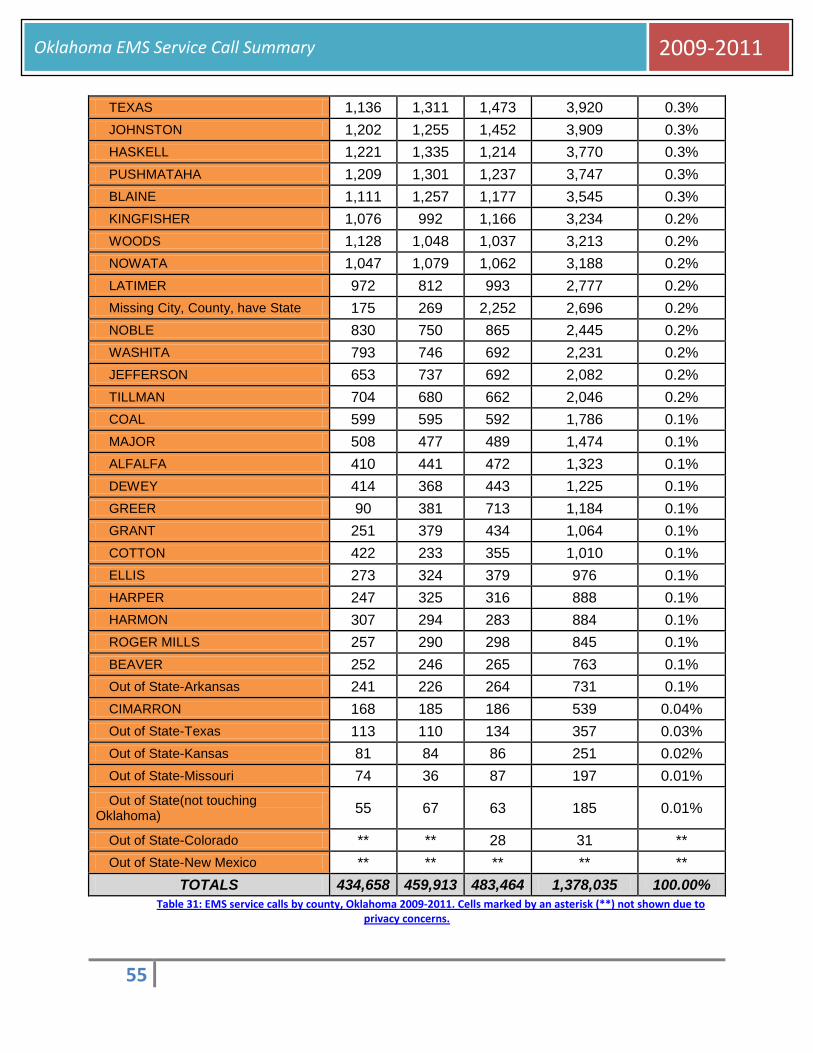
TEXAS 1,136 1,311 1,473 3,920 0.3% JOHNSTON 1,202 1,255 1,452 3,909 0.3% HASKELL 1,221 1,335 1,214 3,770 0.3% PUSHMATAHA 1,209 1,301 1,237 3,747 0.3% BLAINE 1,111 1,257 1,177 3,545 0.3% KINGFISHER 1,076 992 1,166 3,234 0.2% WOODS 1,128 1,048 1,037 3,213 0.2% NOWATA 1,047 1,079 1,062 3,188 0.2% LATIMER 972 812 993 2,777 0.2% Missing City, County, have State 175 269 2,252 2,696 0.2% NOBLE 830 750 865 2,445 0.2% WASHITA 793 746 692 2,231 0.2% JEFFERSON 653 737 692 2,082 0.2% TILLMAN 704 680 662 2,046 0.2% COAL 599 595 592 1,786 0.1% MAJOR 508 477 489 1,474 0.1% ALFALFA 410 441 472 1,323 0.1% DEWEY 414 368 443 1,225 0.1% GREER 90 381 713 1,184 0.1% GRANT 251 379 434 1,064 0.1% COTTON 422 233 355 1,010 0.1% ELLIS 273 324 379 976 0.1% HARPER 247 325 316 888 0.1% HARMON 307 294 283 884 0.1% ROGER MILLS 257 290 298 845 0.1% BEAVER 252 246 265 763 0.1% Out of State-Arkansas 241 226 264 731 0.1% CIMARRON 168 185 186 539 0.04% Out of State-Texas 113 110 134 357 0.03% Out of State-Kansas 81 84 86 251 0.02% Out of State-Missouri 74 36 87 197 0.01% Out of State(not touching
Oklahoma) 55 67 63 185 0.01%
Out of State-Colorado ** ** 28 31 ** Out of State-New Mexico ** ** ** ** **
TOTALS 434,658 459,913 483,464 1,378,035 100.00% Table 31: EMS service calls by county, Oklahoma 2009-2011. Cells marked by an asterisk (**) not shown due to
privacy concerns.

56
Oklahoma EMS Service Call Summary 2009-2011
Map 5: Oklahoma Homeland Security Regions.
Map 6: EMS Service Calls by County, Oklahoma 2010.

57
Oklahoma EMS Service Call Summary 2009-2011
Map 7: Urban and Rural Zip Codes, Oklahoma 2013.

58
Oklahoma EMS Service Call Summary 2009-2011
Miscellaneous: Response Time Maps
Map 8: EMS Service Calls by Response Time, Oklahoma 2009.
Map 9: EMS Service Calls by Response Time, Oklahoma 2010.

59
Oklahoma EMS Service Call Summary 2009-2011
Miscellaneous: Scene Time Maps
Map 10: EMS Service Calls by Scene Time, Oklahoma 2009.
Map 11: EMS Service Calls by Scene Time, Oklahoma 2010.

60
Oklahoma EMS Service Call Summary 2009-2011
Miscellaneous: Total Time Maps
Map 12: EMS Service Calls by Total Time, Oklahoma 2009.
Map 13: EMS Service Calls by Total Time, Oklahoma 2010.

61
Oklahoma EMS Service Call Summary 2009-2011
Miscellaneous Regional Figures/Graphs
Figure 25: EMS service calls by Zone, Urban vs. Rural, Oklahoma 2009-2011.
Figure 26: EMS service calls by Provider Impression, Traumatic Injury, Oklahoma 2009-2011.

62
Oklahoma EMS Service Call Summary 2009-2011
Figure 27: EMS service calls by Region, Race, Oklahoma 2009-2011.
Figure 28: EMS service calls by Region, Cause of Injury, Oklahoma 2009-2011.

63
Oklahoma EMS Service Call Summary 2009-2011
Figure 29: EMS service calls by Region, Mechanism of Injury, Oklahoma 2009-2011.
Figure 30: EMS service calls by Region, Destination Reason, Oklahoma 2009-2011.