Oklahoma Department of Informatics Assessment Report · PDF fileOklahoma State Department of...
57
Oklahoma State Department of Health Informatics Needs Assessment Report of Findings and Recommendations Prepared by Jennifer Han, Ph.D., Health Care Information Rebecca Moore, M.S., Health Care Information Miriam McGaugh, Ph.D., Community Development Service Katy Rich, M.A., Health Care Information Lisa Caton B.S.N., R.N., Screening and Special Services January 2010
Transcript of Oklahoma Department of Informatics Assessment Report · PDF fileOklahoma State Department of...

Oklahoma State Department of Health Informatics Needs Assessment
Report of Findings and Recommendations
Prepared by
Jennifer Han, Ph.D., Health Care Information Rebecca Moore, M.S., Health Care Information
Miriam McGaugh, Ph.D., Community Development Service Katy Rich, M.A., Health Care Information
Lisa Caton B.S.N., R.N., Screening and Special Services
January 2010

Suggested Citation: Han JL, Moore RK, McGaugh MJ, Rich KM, Caton LR. Oklahoma State Department of Health Informatics Needs Assessment: Report of Findings and Recommendations . Health Informatics Council, Oklahoma State Department of Health, 2010. All material in this document is in the public domain and may be reproduced or copied without permission. Citation is appreciated.
ACKNOWLEDGEMENTS
Health Informatics Council
Data Integration and Enhancement Committee
Kelly Baker, M.P.H., Center for Health Statistics
Anne Bliss, M.P.H., Chronic Disease Service


TABLE OF CONTENTS
List of Tables
List of Figures
Executive Summary
1. Project Background
2. Purpose
3. Methodology
3.1 Survey Design
3.2 Interview Structure
3.3 Data Collection
3.4 Analysis
4. Results and Discussion
4.1 Informants
4.2 Current Information
4.3 Desired Information
4.4 Data Integration and Enhancement
4.5 Software
5. Recommendations
6. References
Appendix A. Survey Instrument
Appendix B. Description of Data Warehouse
Appendix C. Presentation
i
ii
iv
1
2
2
3
3
4
4
4
4
7
14
18
20
26
27
29
35
38

i
LIST OF TABLES Table 1. OSDH Programs and External Organization that Participated in the Interviews.
Table 2. Self‐Identified Role(s) of Informants in Their Organization.
Table 3. Media by Which Data Were Received According to Role of the Informant.
Table 4. Timeframes fo r Retrieving and Using Data by Role of the Informant.
Table 5. Format in Which Informants Received Data, by Role.
Table 6. Of the Informants Who Received Aggregated Data Without Summary Text, the
Percentage Who Received Specific Formats.
Table 7. Of Informants Who Received Summary Reports, the Percentage Who Received Specific
Formats.
Table 8. Desired Information Category by Location and Role of Informant.
Table 9. Desired Information Keywords by Category.
Table 10. Informants Interested in Receiving Data Linked Across Programs and Stored in the
Data Warehouse.
Table 11. Informants Interested in Submitting Data Linked Across Programs and Stored in the
Data Warehouse.
Table 12. Software Currently Used for Data Analysis/Interpretation or Report Linkage.
Table 13. Software Preferred by Informants for Use in Manipulating/Analyzing Data.
Table 14. Number of Informants Who Conducted Data Matching Listed by Software Used.
Table 15. Descriptions of Software Functionality Needed by OSDH Staff.
Table 16. Software for Which Informants Had Received Training.
Table 17. Software Training Needs.
5
6
7
8
10
12
12
14
16
18
19
21
22
23
24
25
26
ii
LIST OF FIGURES Figure 1. How Often Informants Retrieved and Used Data.
Figure 2. Percentage of Informants Who Purchased Data or Analytical Services, by Role.
Figure 3. Of the Informants Who Received Raw Data, the Percentage, by Role, Who Used Each
Format.
Figure 4. Of the Informants Who Used Online Queryable Sites, the Percentage Who Used Each
Site.
Figure 5. Desired Information Categories by Location and Role of Informant.
Figure 6. Preferred Method of Receiving Data by Role and Location of Informant.
Figure 7. Willingness to Purchase Data or Analytical Services.
Figure 8. Top 10 Software Used.
Figure 9. Need for Additional Software Training.
8
9
11
13
15
17
17
21
25

iii
iv
EXECUTIVE SUMMARY There is a growing need for more efficient and effective informatics within the Oklahoma State Department of Health (OSDH). The effort to promote and use quality data to create a state of health is being led by the Health Informatics Council (HIC). To determine the next steps in moving OSDH forward in the evolution of information, and before developing a proposal to invest in business intelligence software, the HIC elected to conduct a needs assessment. The intent of the needs assessment was to determine currently used and needed data, including type and format, as well as currently used and needed software and software training. The needs assessment also provided information about internal data systems and data uses among internal data users and external partners. The results of the needs assessment will provide baseline information to guide the next steps for OSDH to support and encourage enterprise‐level data sharing and enhancement. One hundred sixty OSDH employees representing most of the central office programs and 22 county health departments, along with 48 individuals representing multiple state agencies and other external organizations, were interviewed. During the interview session informants were also educated about integrating and enhancing data through a master person index and data warehouse, and their thoughts regarding these processes were obtained. The key findings from these interviews are summarized below. Current Information
• Informants received current information or data (hereafter, referred to as “data”) through
multiple media sources. o Data were most often obtained from the web (87%), in an electronic format (85%), or in
an email (81%; as an attachment or in the body of text). • Informants viewed or retrieved data at various times throughout the year, depending on the
dataset in question, though most informants (63%) indicated retrieving data on a daily basis. o Informants who self‐identified as data users more often than informants in other roles
retrieved data daily. • Informants also used data at various times throughout the year, though most informants (67%)
indicated retrieving data on a daily basis. o Informants who self‐identified as data users more often than informants in other roles
used data daily. • Twenty‐one percent of informants had purchased data and 20% had purchased analytical
services. o External partners more commonly purchased data than internal informants (33% versus
22%, respectively). o External partners more commonly purchased analytical services than internal
informants (35% versus 18%, respectively). • Self‐identified data users used data in a variety of formats: raw, aggregated without summary
text, in summary reports, and from queryable sites. Informants not self‐identified as data users more commonly used aggregated data and data in summary reports.
o Excel and text formats were the most common formats for receiving raw data. o Tables were the most common format for receiving aggregated data. o Text and tables were the most common formats for receiving summary reports. o The Census web site and OK2SHARE were the most commonly queried web sites.
v
• Data cubes were infrequently used (6%). o Seventy‐four percent of informants were unfamiliar with a data cube and did not know
if they had ever used one. o After the data cube demonstration, 98% of informants indicated they would use data in
the format of a cube, and almost all said a data cube would or may enhance their data needs.
Desired Information
• Ninety‐three percent of informants provided at least one response when asked if there were any data that they did not receive but would like to have; 60% indicated at least 3 datasets or types of data.
o Most desired data (43%) were data not currently available in a centralized manner, i.e., were new or innovative. Of these, emergency department data were most commonly desired.
o Birth, death, and hospital discharge data were most commonly desired among the OSDH datasets.
• Medicaid data were most commonly desired among the external datasets. Informants indicated wanting to receive their specified desired data on a real‐time or as‐needed basis, and primarily in an electronic or web‐based format.
• Informants indicated wanting to receive their specified desired data in some combination of formats (i.e., raw and aggregate, aggregate and summary, etc.) or as raw data.
Data Integration and Enhancement
• Ninety‐two percent of informants were interested in receiving data linked across programs and stored in the data warehouse.
• Seventy‐eight percent of informants were interested in submitting data to the data warehouse. o Some did not have data to submit or were restricted by tribal or federal regulations.
• Of thoughts and concerns discussed by informants regarding data sharing and the master person index, most related to confidentiality and security.
• Thoughts and concerns discussed by informants regarding the data warehouse varied, including the data warehouse was a good idea, accuracy and accessibility of data was a concern, funding and management of the warehouse needed to be addressed, and other issues.
Software
• Microsoft Excel (90%) and Word (89%) were the most commonly used software for data analysis and reporting.
• Microsoft Excel, SAS, and Microsoft Access were the most commonly preferred software for data manipulation and analysis.
• Seventeen percent of internal informants performed data matching, with Link Plus and SAS being the most commonly used software for matching.
• Twenty‐three percent of internal informants had a need for additional software, mainly SAS or additional SAS functionality, and several informants did not know what specific software could meet their needs.
vi
• Thirty‐nine percent of internal informants had attended Microsoft Excel training, and Microsoft Access, SAS, Microsoft PowerPoint, and ArcGIS were other trainings commonly attended by informants.
• Fifty‐five percent of internal informants indicated needing additional software training, mainly in SAS (21%).
Recommendations
• Primary recommendations include new and additional software training, continued development of the Master Person Index and Data Warehouse, and testing of security measures once the Master Person Index and Data Warehouse have been developed.

vii
1. Project Background Information has been an integral part of public health since Dr. John Snow traced the source of cholera in 1854. Over time, an abundance of data have been collected and used to improve public health but have not always been managed well. The management of public health information has only recently become an area of interest and a focus within public health agencies around the world. Management of information encompasses all facets of public health data, from collection to storage to dissemination. As a result of the need for information management, a new discipline has emerged that addresses the management of information: Public health informatics is defined as “systematic application of information and computer science and technology to public health practice, research, and learning” (Anderson, Rice, & Kominski, 2007). This emerging discipline combines the knowledge domains of information, computer, and management science with public health. To address the current health needs in the population, public health agencies are under more pressure than ever to manage information and information assets effectively and efficiently. The information management framework is an essential component to meet the challenges presented today. Before OSDH can move forward in improving the information management framework, it is important to determine if staff understands the need to make changes and to review the existing framework. According to the authors of Information Revolution, a book about using information management strategy to create sustainable growth and produced by the SAS Institute (Davis, Miller & Russell, 2006), the management of information is a function of four dimensions: infrastructure, process, people, and culture. A five‐level evolutionary path describes how an organization can mature in those four dimensions. The evolutionary path moves from Level 1 to Level 5 with each level indicating an organization’s maturity in the four dimensions. Level 1 indicates an operational level, characterized by individual data ownership and control. Level 5 is an innovation level where information management is based on projects and ideas less than three years old and growth is fueled by ongoing creativity and renewal. To address the growing need for efficient and effective informatics within OSDH, in September 2006 the Commissioner formed the Health Informatics Council (HIC) with the vision of promoting and using quality data to create a State of Health. Members of the HIC include representatives from each Deputy area and the Commissioner’s office. Reporting to the HIC are various subcommittees that address the agency’s Geographic Information System (GIS) activities; data security and confidentiality; data release standards; and data integration and enhancement. In 2008 the HIC conducted an Information Evolution Model Assessment (Davis et al., 2006) to determine staff perception of the existing state of public health information within OSDH. The results of the Information Evolution Model Assessment indicated that the majority of data users and management within OSDH perceived that the agency was at Level 2 of the Information Evolution Model. At Level 2, a consolidation level, programs or service areas drive the decisions; there are independent islands of information; data consolidation and access are at the program or service area level; business measures are inconsistent across the enterprise; and, there are multiple interfaces and extracts against the same data.
1

Based on the results of the assessment and national trends, OSDH needs to move to the next level in the Information Evolution Model to make more efficient and effective use of information within the agency. At Level 3 enterprise‐wide information would be used for making decisions, driving the governance process and designing data frameworks; information management concepts would be applied and accepted, and there would be an institutional awareness of data quality. Enterprise‐wide information would include data integrated across service areas to provide leadership and other data users with information about the complete health of the population rather than isolated snapshots of information. Software purchases would be consolidated to address the needs of the agency rather than each service area, and data systems would be designed based on the needs of the agency rather than individual programs. The move to Level 3 would address various components of the OSDH strategic plan by improving the ability to have data‐driven policies and promoting compatible health data systems. The move to Level 3 would reduce the burden on Information Technology (IT) services as well as on programs attempting to integrate data on an ad‐hoc basis rather than at the enterprise level. In addition, as programs and county health departments move through the accreditation process, enterprise‐wide information will aid in the needs assessments, quality improvements projects, strategic planning, and evaluation. Some activities have been undertaken to provide OSDH with a means to move along the information evolutionary path with guidance from the Health Informatics Council. These activities include consolidating GIS practices and software; completing a data inventory; and developing uniform confidentiality policies. The GIS Advisory Committee has supported the standardization of GIS data and map templates, centralization of the mapping software and the development of an enterprise‐level geodatabase. The data inventory has produced metadata about existing population‐based health datasets within OSDH including descriptions, variables within the datasets, and formats in which the data are stored. The confidentiality policy has been accepted as a policy within the Administrative Procedures Manual and provides guidance for sharing protected health information. While these activities have started the process of moving OSDH closer to having enterprise‐level information, much more is required before that process is complete.
2. Purpose Moving OSDH forward along the information evolutionary path will provide a means to integrate and enhance data vital to public health. To determine what steps should be taken to continue to move OSDH forward in the evolution of information and before developing a proposal to invest in business intelligence software, the HIC elected to conduct a needs assessment. The intent of the needs assessment was to determine currently used and needed data including type and format as well as currently used and needed software and software training. The needs assessment would also provide information about internal data systems, data uses among internal data users, and external partners. The results of the needs assessment would provide the baseline information to guide the next steps for OSDH to support and encourage enterprise‐level data sharing and enhancement.
3. Methodology
The methodology for the needs assessment was based on the GIS Needs Assessment conducted by the GIS Coordinator in 2007 (Rich, 2008). The GIS Needs Assessment and subsequent GIS
2
consolidation activities were a success due, in part, to the design of and results from the assessment. Using lessons learned from the GIS Needs Assessment project, the Informatics Needs Assessment was designed to be a key‐informant interview with educational information included in the interview. The educational information was incorporated into the interview in the form of a presentation and multi‐dimensional data system demonstration to ensure all informants could respond to questions with equal knowledge about proposed activities related to the Analytical Master Person Index (AMPI) and the Data Warehouse. 3.1 Survey Design The Informatics Needs Assessment survey was designed to gain information about current public health data uses, needed public health data, and software uses and needs. In addition, there were questions about the use of proposed interfaces for accessing data, as well as thoughts or concerns about proposed activities related to the AMPI and Data Warehouse. The survey questions were of two types: multiple‐choice and open‐ended. The multiple‐choice questions had an “other” option for additional responses and multiple answers could be selected. The survey instrument and a two‐page data warehouse description were developed over a period of several months with input from members of the Health Informatics Council, the Data Integration and Enhancement Committee, and the Needs Assessment Workgroup. The instrument was tested during two mock interviews with members of the Needs Assessment workgroup and pilot tested with two interview groups. The mock interviews consisted of two team members (the interview team) interviewing the rest of the team (the respondent team). The interview team consisted of one person asking questions and one taking notes. As a result of the mock interviews, modifications were made to the order and content of the questions. Following the mock interviews, the first pilot interview was conducted with the WIC program. The survey instrument, data demonstration, and the two‐page data warehouse description were used to conduct the interview. Based on feedback from the WIC informants, the instrument was modified and an educational presentation on the data warehouse, rather than a two‐page description, was developed to improve the flow of the interview, clarify the questions, and simplify the educational component. A second pilot was conducted with staff from the HIV/STD service area and the educational presentation was tested. As a result of the feedback, the instrument and presentation were amended to improve the flow of the survey and presentation. The final survey instrument (Appendix A) and presentation (Appendix B) were presented to and approved by the Data Integration and Enhancement Committee on May 8, 2009.
3.2 Interview Structure
The interview team consisted of five data users: Lisa Caton, Screening, Special Services; Jennifer Han, Becki Moore and Katy Rich, Health Care Information; and Miriam McGaugh, Community Development Service. Due to the group setting for the interviews, each interview was conducted by two team members; one team member conducted the interview and the other took notes. The interviews were conducted in group settings with a maximum limit of 10 people per group. Invitations were sent to groups of data users from each service area; members of Senior Leadership; selected County Health Department personnel and their
3
community partners; and other external partners. Each person interviewed was given the opportunity to individually answer each question to ensure the responses were from the individuals rather than the entire group.
3.3 Data Collection
Hand‐written notes were taken during the interviews using a data collection tool that was developed and tested during the mock and pilot interviews. In addition, the note taker used a voice recorder to provide backup for the hand‐written notes if clarification was needed. To expedite data entry, a tool was developed using Survey Monkey and tested by each team member following the mock interviews and the pilot interview with WIC. Following each interview, data for each respondent were entered into a web‐based form via the Survey Monkey tool. Interviewing began on May 14, 2009 and was completed on November 6, 2009.
3.4 Analysis
For the purpose of analyses, informants were put into one of three role categories: Data User Only, Other Role, or Data User plus Other Role. An informant was placed into the Data User Only category if they did not indicate any role other than Data User. Informants were placed into the Other Role category if they indicated they had a Leadership, Management, IT or Other role but were not Data Users. If an informant indicated they were a Data User and had some other role (Leadership, Management, IT or Other), they were placed in the Data User plus Other Role category. Four of the interview team members were assigned a section of the survey to analyze. Analyses included calculated proportions for all informants, separately for internal and external informants, and by role category within the internal and external groups. Responses to closed‐ended survey questions were analyzed by calculating the percentage of responses among the total responses to the question within a group. Responses to open‐ended survey questions were analyzed by first searching for common words or keywords. Once common words or keywords were identified, responses were placed into categories and proportions were calculated.
4. Results and Discussion
4.1 Informants
A total of 208 individuals were interviewed during 53 interviews. The majority of informants were interviewed in groups, though a few informants were interviewed alone. One hundred sixty employees of the Oklahoma State Department of Health were interviewed, including 30 staff representing 22 counties across the state. Forty‐eight individuals representing multiple state agencies and other external organizations were also interviewed (see Table 1).
4
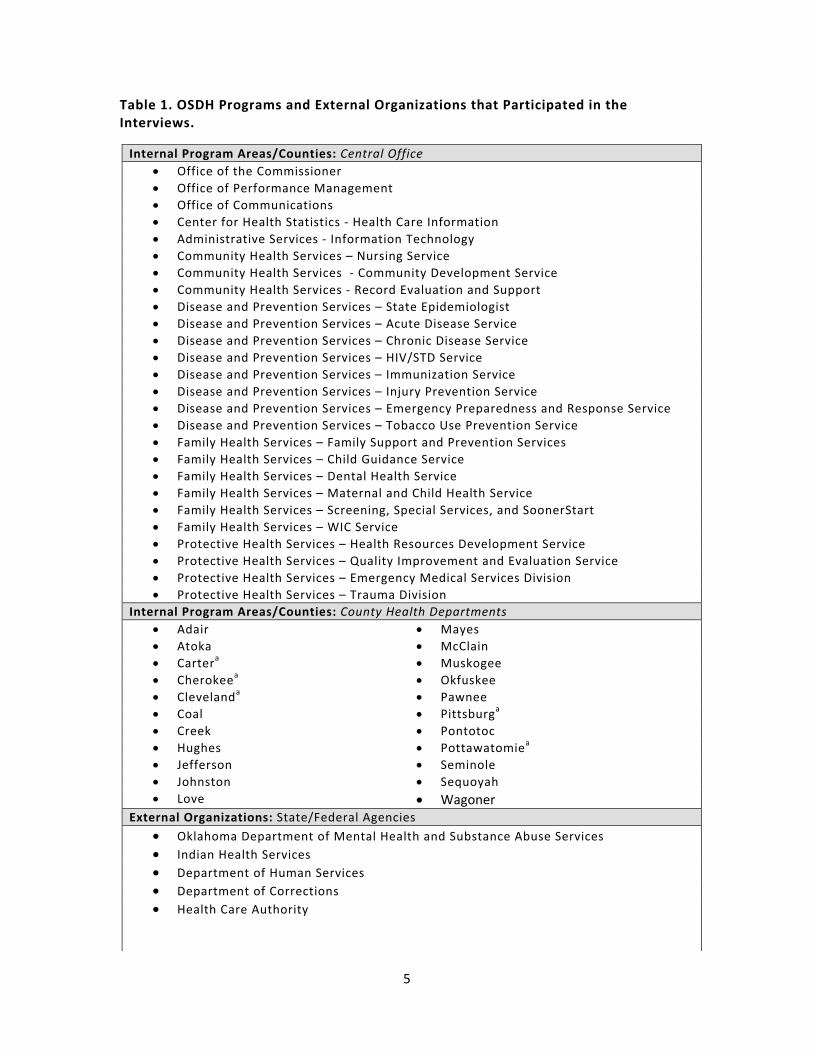
Table 1. OSDH Programs and External Organizations that Participated in the Interviews.
Internal Program Areas/Counties: Central Office• Office of the Commissioner • Office of Performance Management • Office of Communications • Center for Health Statistics ‐ Health Care Information • Administrative Services ‐ Information Technology • Community Health Services – Nursing Service • Community Health Services ‐ Community Development Service • Community Health Services ‐ Record Evaluation and Support • Disease and Prevention Services – State Epidemiologist • Disease and Prevention Services – Acute Disease Service • Disease and Prevention Services – Chronic Disease Service • Disease and Prevention Services – HIV/STD Service • Disease and Prevention Services – Immunization Service • Disease and Prevention Services – Injury Prevention Service • Disease and Prevention Services – Emergency Preparedness and Response Service • Disease and Prevention Services – Tobacco Use Prevention Service • Family Health Services – Family Support and Prevention Services • Family Health Services – Child Guidance Service • Family Health Services – Dental Health Service • Family Health Services – Maternal and Child Health Service • Family Health Services – Screening, Special Services, and SoonerStart • Family Health Services – WIC Service • Protective Health Services – Health Resources Development Service • Protective Health Services – Quality Improvement and Evaluation Service • Protective Health Services – Emergency Medical Services Division • Protective Health Services – Trauma Division
Internal Program Areas/Counties: County Health Departments• Adair • Mayes • Atoka • McClain • Cartera • Muskogee • Cherokeea • Okfuskee • Clevelanda • Pawnee • Coal • Pittsburga • Creek • Pontotoc • Hughes • Pottawatomiea • Jefferson • Seminole • Johnston • Sequoyah • Love • Wagoner
External Organizations: State/Federal Agencies• Oklahoma Department of Mental Health and Substance Abuse Services • Indian Health Services • Department of Human Services• Department of Corrections• Health Care Authority
5
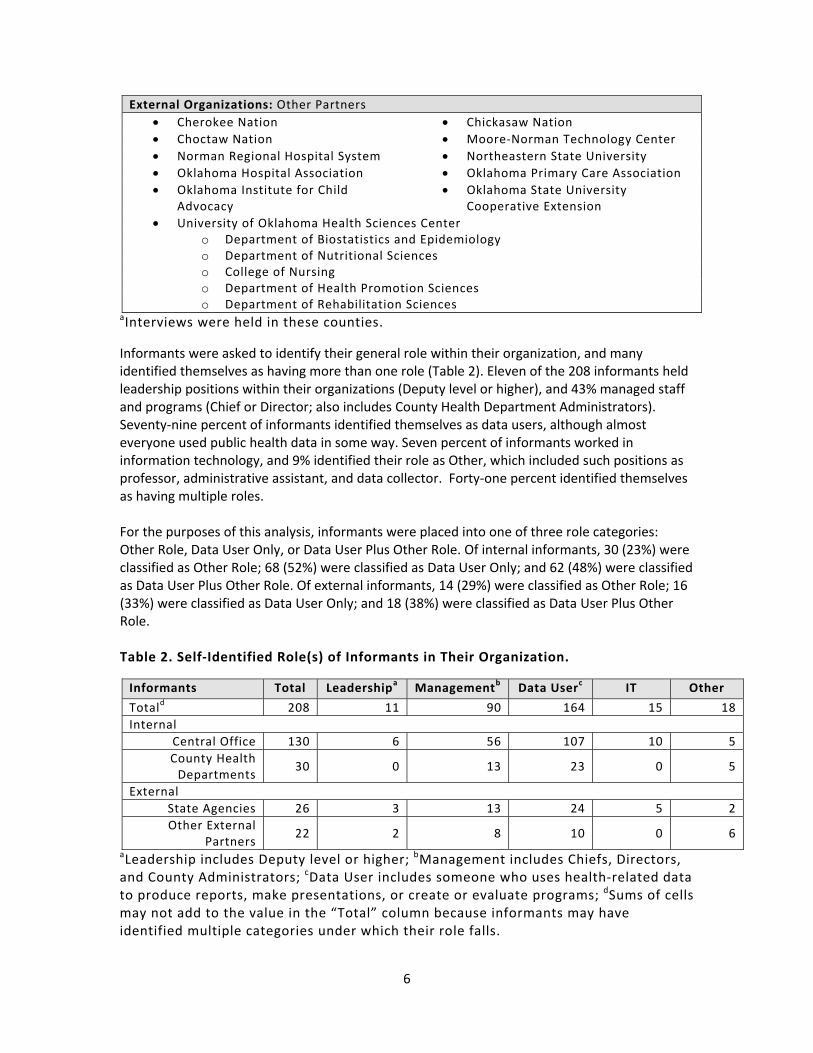
External Organizations: Other Partners• Cherokee Nation • Chickasaw Nation • Choctaw Nation • Moore‐Norman Technology Center • Norman Regional Hospital System • Northeastern State University • Oklahoma Hospital Association • Oklahoma Primary Care Association • Oklahoma Institute for Child
Advocacy • Oklahoma State University
Cooperative Extension • University of Oklahoma Health Sciences Center
o Department of Biostatistics and Epidemiologyo Department of Nutritional Scienceso College of Nursingo Department of Health Promotion Scienceso Department of Rehabilitation Sciences
aInterviews were held in these counties.
Informants were asked to identify their general role within their organization, and many identified themselves as having more than one role (Table 2). Eleven of the 208 informants held leadership positions within their organizations (Deputy level or higher), and 43% managed staff and programs (Chief or Director; also includes County Health Department Administrators). Seventy‐nine percent of informants identified themselves as data users, although almost everyone used public health data in some way. Seven percent of informants worked in information technology, and 9% identified their role as Other, which included such positions as professor, administrative assistant, and data collector. Forty‐one percent identified themselves as having multiple roles. For the purposes of this analysis, informants were placed into one of three role categories: Other Role, Data User Only, or Data User Plus Other Role. Of internal informants, 30 (23%) were classified as Other Role; 68 (52%) were classified as Data User Only; and 62 (48%) were classified as Data User Plus Other Role. Of external informants, 14 (29%) were classified as Other Role; 16 (33%) were classified as Data User Only; and 18 (38%) were classified as Data User Plus Other Role. Table 2. Self‐Identified Role(s) of Informants in Their Organization.
Informants Total Leadershipa Managementb Data Userc IT Other
Totald 208 11 90 164 15 18Internal
Central Office 130 6 56 107 10 5County Health Departments
30 0 13 23 0 5
External State Agencies 26 3 13 24 5 2Other External
Partners 22 2 8 10 0 6
aLeadership includes Deputy level or higher; bManagement includes Chiefs, Directors, and County Administrators; cData User includes someone who uses health‐related data to produce reports, make presentations, or create or evaluate programs; dSums of cells may not add to the value in the “Total” column because informants may have identified multiple categories under which their role falls.
6
4.2 Current Information
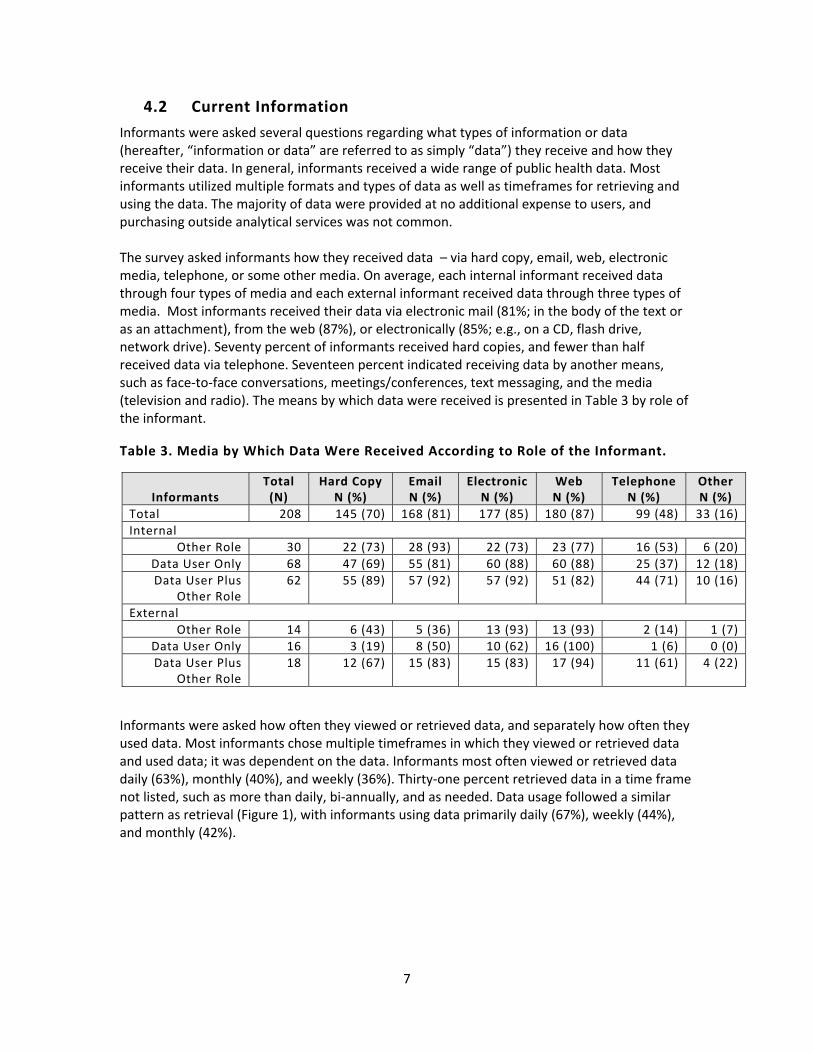
Informants were asked several questions regarding what types of information or data (hereafter, “information or data” are referred to as simply “data”) they receive and how they receive their data. In general, informants received a wide range of public health data. Most informants utilized multiple formats and types of data as well as timeframes for retrieving and using the data. The majority of data were provided at no additional expense to users, and purchasing outside analytical services was not common. The survey asked informants how they received data – via hard copy, email, web, electronic media, telephone, or some other media. On average, each internal informant received data through four types of media and each external informant received data through three types of media. Most informants received their data via electronic mail (81%; in the body of the text or as an attachment), from the web (87%), or electronically (85%; e.g., on a CD, flash drive, network drive). Seventy percent of informants received hard copies, and fewer than half received data via telephone. Seventeen percent indicated receiving data by another means, such as face‐to‐face conversations, meetings/conferences, text messaging, and the media (television and radio). The means by which data were received is presented in Table 3 by role of the informant. Table 3. Media by Which Data Were Received According to Role of the Informant.
Informants Total (N)
Hard Copy N (%)
Email N (%)
ElectronicN (%)
Web N (%)
Telephone N (%)
Other N (%)
Total 208 145 (70) 168 (81) 177 (85) 180 (87) 99 (48) 33 (16)Internal
Other Role 30 22 (73) 28 (93) 22 (73) 23 (77) 16 (53) 6 (20) Data User Only 68 47 (69) 55 (81) 60 (88) 60 (88) 25 (37) 12 (18)Data User Plus
Other Role 62 55 (89) 57 (92) 57 (92) 51 (82) 44 (71) 10 (16)
External Other Role 14 6 (43) 5 (36) 13 (93) 13 (93) 2 (14) 1 (7)
Data User Only 16 3 (19) 8 (50) 10 (62) 16 (100) 1 (6) 0 (0)Data User Plus
Other Role 18 12 (67) 15 (83) 15 (83) 17 (94) 11 (61) 4 (22)
Informants were asked how often they viewed or retrieved data, and separately how often they used data. Most informants chose multiple timeframes in which they viewed or retrieved data and used data; it was dependent on the data. Informants most often viewed or retrieved data daily (63%), monthly (40%), and weekly (36%). Thirty‐one percent retrieved data in a time frame not listed, such as more than daily, bi‐annually, and as needed. Data usage followed a similar pattern as retrieval (Figure 1), with informants using data primarily daily (67%), weekly (44%), and monthly (42%).
7
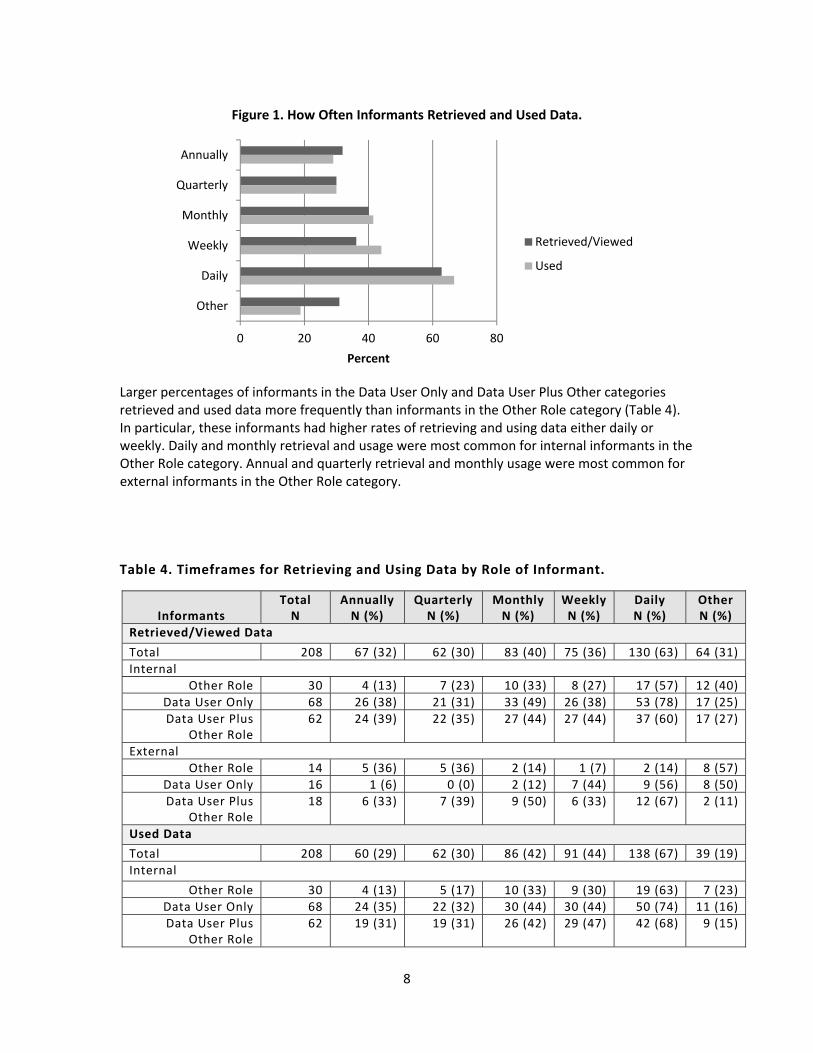
Larger percentages of informants in the Data User Only and Data User Plus Other categories retrieved and used data more frequently than informants in the Other Role category (Table 4). In particular, these informants had higher rates of retrieving and using data either daily or weekly. Daily and monthly retrieval and usage were most common for internal informants in the Other Role category. Annual and quarterly retrieval and monthly usage were most common for external informants in the Other Role category.
0 20 40 60 80
Annually
Quarterly
Monthly
Weekly
Daily
Other
Percent
Figure 1. How Often Informants Retrieved and Used Data.
Retrieved/Viewed
Used
Table 4. Timeframes for Retrieving and Using Data by Role of Informant.
Informants Total N
Annually N (%)
Quarterly N (%)
Monthly N (%)
Weekly N (%)
Daily N (%)
Other N (%)
Retrieved/Viewed Data
Total 208 67 (32) 62 (30) 83 (40) 75 (36) 130 (63) 64 (31)Internal
Other Role 30 4 (13) 7 (23) 10 (33) 8 (27) 17 (57) 12 (40) Data User Only 68 26 (38) 21 (31) 33 (49) 26 (38) 53 (78) 17 (25)Data User Plus
Other Role 62 24 (39) 22 (35) 27 (44) 27 (44) 37 (60) 17 (27)
External Other Role 14 5 (36) 5 (36) 2 (14) 1 (7) 2 (14) 8 (57)
Data User Only 16 1 (6) 0 (0) 2 (12) 7 (44) 9 (56) 8 (50)Data User Plus
Other Role 18 6 (33) 7 (39) 9 (50) 6 (33) 12 (67) 2 (11)
Used Data
Total 208 60 (29) 62 (30) 86 (42) 91 (44) 138 (67) 39 (19)Internal
Other Role 30 4 (13) 5 (17) 10 (33) 9 (30) 19 (63) 7 (23) Data User Only 68 24 (35) 22 (32) 30 (44) 30 (44) 50 (74) 11 (16)Data User Plus
Other Role 62 19 (31) 19 (31) 26 (42) 29 (47) 42 (68) 9 (15)
8
Total Annually Quarterly Monthly Weekly Daily Other Informants N N (%) N (%) N (%) N (%) N (%) N (%)
External
Other Role 14 2 (14) 6 (43) 9 (64) 3 (21) 3 (21) 5 (36)Data User Only 16 5 (31) 4 (25) 4 (25) 10 (62) 12 (75) 4 (25)Data User Plus
Other Role 18 6 (33) 6 (33) 7 (39) 10 (56) 12 (67) 3 (17)
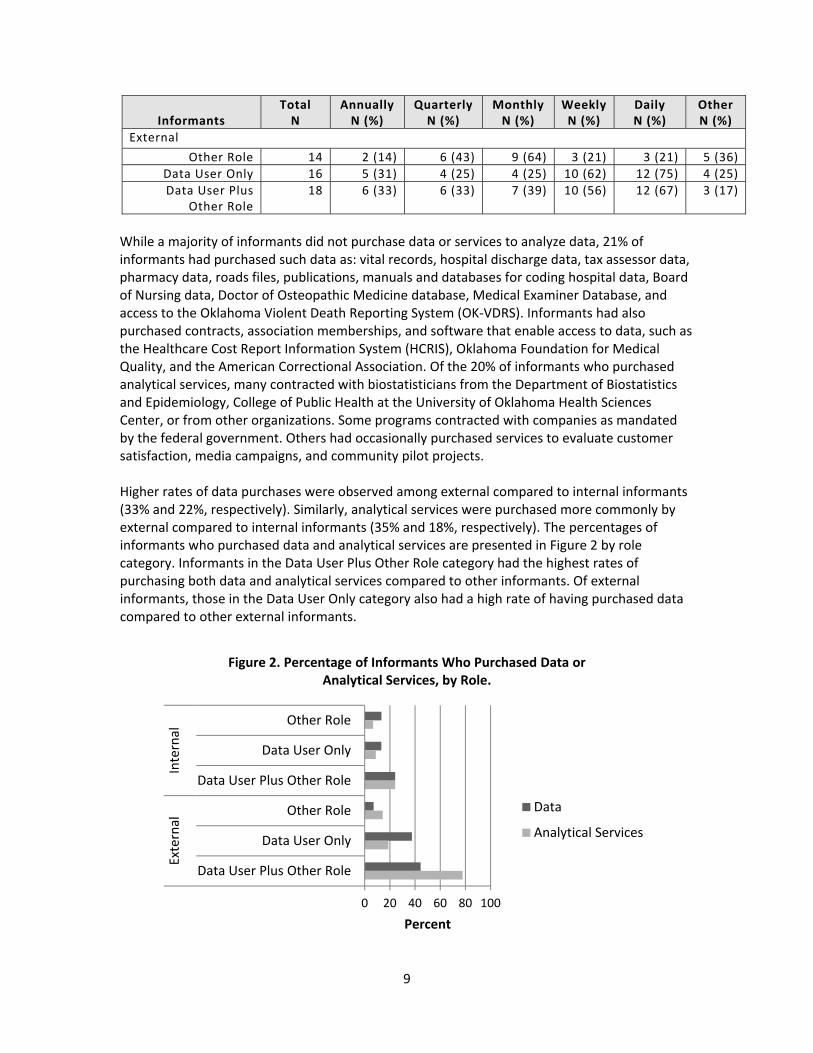
While a majority of informants did not purchase data or services to analyze data, 21% of informants had purchased such data as: vital records, hospital discharge data, tax assessor data, pharmacy data, roads files, publications, manuals and databases for coding hospital data, Board of Nursing data, Doctor of Osteopathic Medicine database, Medical Examiner Database, and access to the Oklahoma Violent Death Reporting System (OK‐VDRS). Informants had also purchased contracts, association memberships, and software that enable access to data, such as the Healthcare Cost Report Information System (HCRIS), Oklahoma Foundation for Medical Quality, and the American Correctional Association. Of the 20% of informants who purchased analytical services, many contracted with biostatisticians from the Department of Biostatistics and Epidemiology, College of Public Health at the University of Oklahoma Health Sciences Center, or from other organizations. Some programs contracted with companies as mandated by the federal government. Others had occasionally purchased services to evaluate customer satisfaction, media campaigns, and community pilot projects. Higher rates of data purchases were observed among external compared to internal informants (33% and 22%, respectively). Similarly, analytical services were purchased more commonly by external compared to internal informants (35% and 18%, respectively). The percentages of informants who purchased data and analytical services are presented in Figure 2 by role category. Informants in the Data User Plus Other Role category had the highest rates of purchasing both data and analytical services compared to other informants. Of external informants, those in the Data User Only category also had a high rate of having purchased data compared to other external informants.
0 20 40 60 80 100
Other Role
Data User Only
Data User Plus Other Role
Other Role
Data User Only
Data User Plus Other Role
Internal
External
Percent
Figure 2. Percentage of Informants Who Purchased Data or Analytical Services, by Role.
Data
Analytical Services
9
Informants were asked about the format in which they received their data and if they received their data from online queryable sites and data cubes; these data are shown in Table 5. Informants in the Other Role category more often received data in aggregate form, including from online queryable sites, either with or without summaries. Informants in the Data User Only category received data raw, aggregated, or in summary reports. Very few informants used data cubes. While several informants indicated receiving data in other formats, those other formats mentioned were primarily the media through which data were received and thus could be categorized into one of the aforementioned formats. Table 5. Format in Which Informants Received Data, by Role.
Informants Total N
Raw N (%)
Aggregate N (%)
Summary Reports N (%)
Queryable Sites N (%)
Data Cube N (%)
Other N (%)
Total 208 162 (78) 176 (85) 174 (84) 170 (82) 8 (6) 17 (8)Internal
Other Role 30 15 (50) 25 (83) 25 (83) 18 (60) 0 (0) 0 (0) Data User Only 68 59 (87) 50 (74) 50 (74) 56 (82) 2 (3) 4 (6)Data User Plus
Other Role 62 52 (84) 57 (92) 58 (94) 52 (84) 6 (10) 10 (16)
External Other Role 14 8 (57) 14 (100) 10 (71) 13 (93) 0 (0) 0 (0)
Data User Only 16 13 (81) 15 (94) 15 (94) 14 (88) 2 (12) 0 (0)Data User Plus
Other Role 18 15 (83) 15 (83) 16 (89) 17 (94) 2 (11) 3 (17)
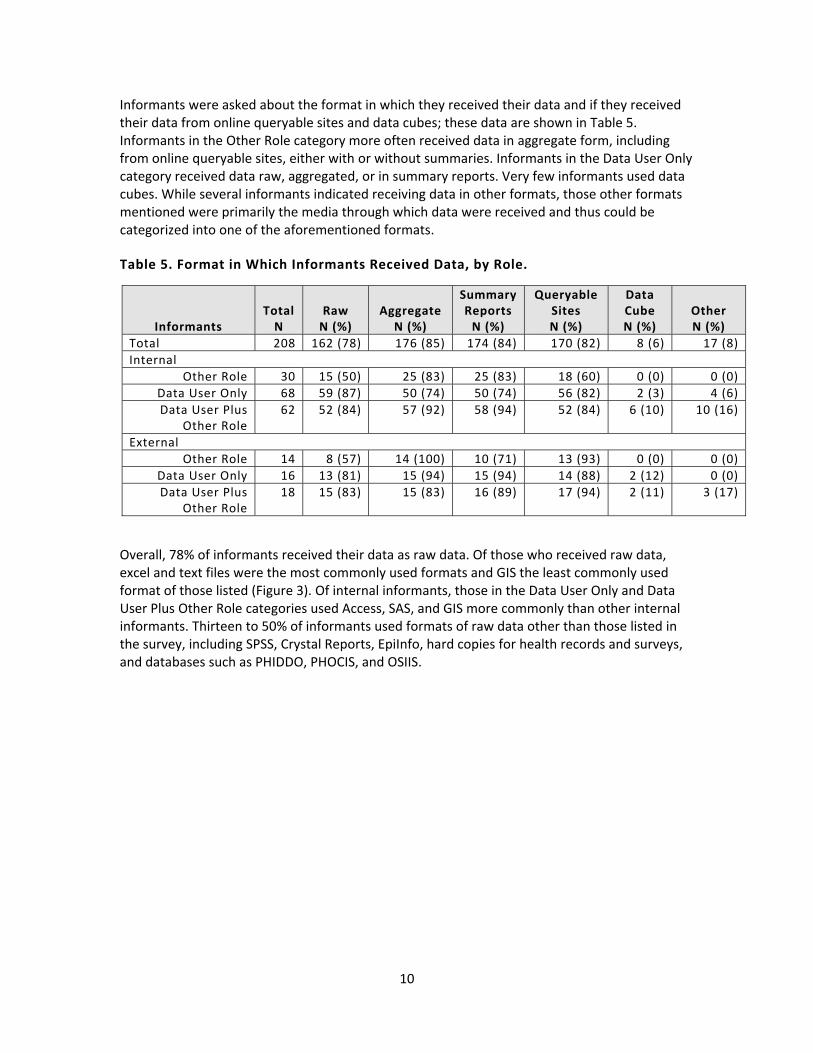
Overall, 78% of informants received their data as raw data. Of those who received raw data, excel and text files were the most commonly used formats and GIS the least commonly used format of those listed (Figure 3). Of internal informants, those in the Data User Only and Data User Plus Other Role categories used Access, SAS, and GIS more commonly than other internal informants. Thirteen to 50% of informants used formats of raw data other than those listed in the survey, including SPSS, Crystal Reports, EpiInfo, hard copies for health records and surveys, and databases such as PHIDDO, PHOCIS, and OSIIS.
10
0 20 40 60 80 100
Excel
Access
SAS
SQL
Text
GIS
Other
Percent
Figure 3. Of the Informants Who Received Raw Data, the Percentage, by Role, Who Used Each Format.
Internal Other Role
Internal Data User Only
Internal Data User Plus Other RoleExternal Other Role
External Data User Only
External Data User Plus Other Role
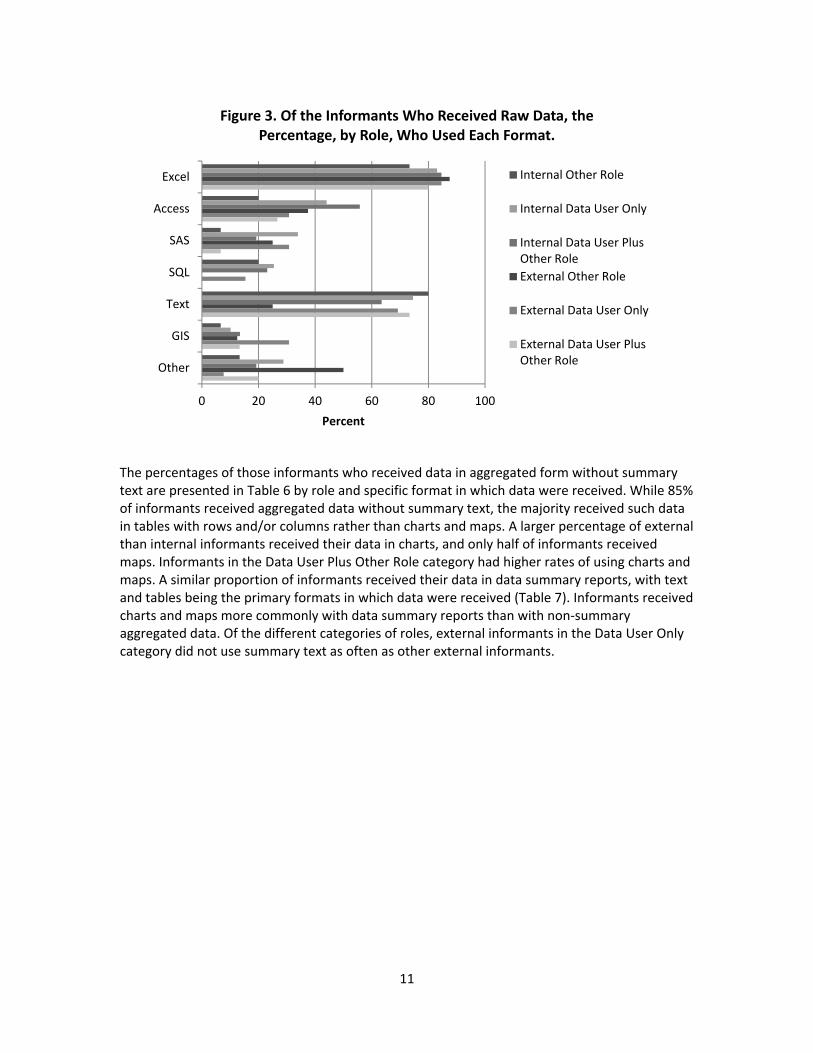
The percentages of those informants who received data in aggregated form without summary text are presented in Table 6 by role and specific format in which data were received. While 85% of informants received aggregated data without summary text, the majority received such data in tables with rows and/or columns rather than charts and maps. A larger percentage of external than internal informants received their data in charts, and only half of informants received maps. Informants in the Data User Plus Other Role category had higher rates of using charts and maps. A similar proportion of informants received their data in data summary reports, with text and tables being the primary formats in which data were received (Table 7). Informants received charts and maps more commonly with data summary reports than with non‐summary aggregated data. Of the different categories of roles, external informants in the Data User Only category did not use summary text as often as other external informants.
11
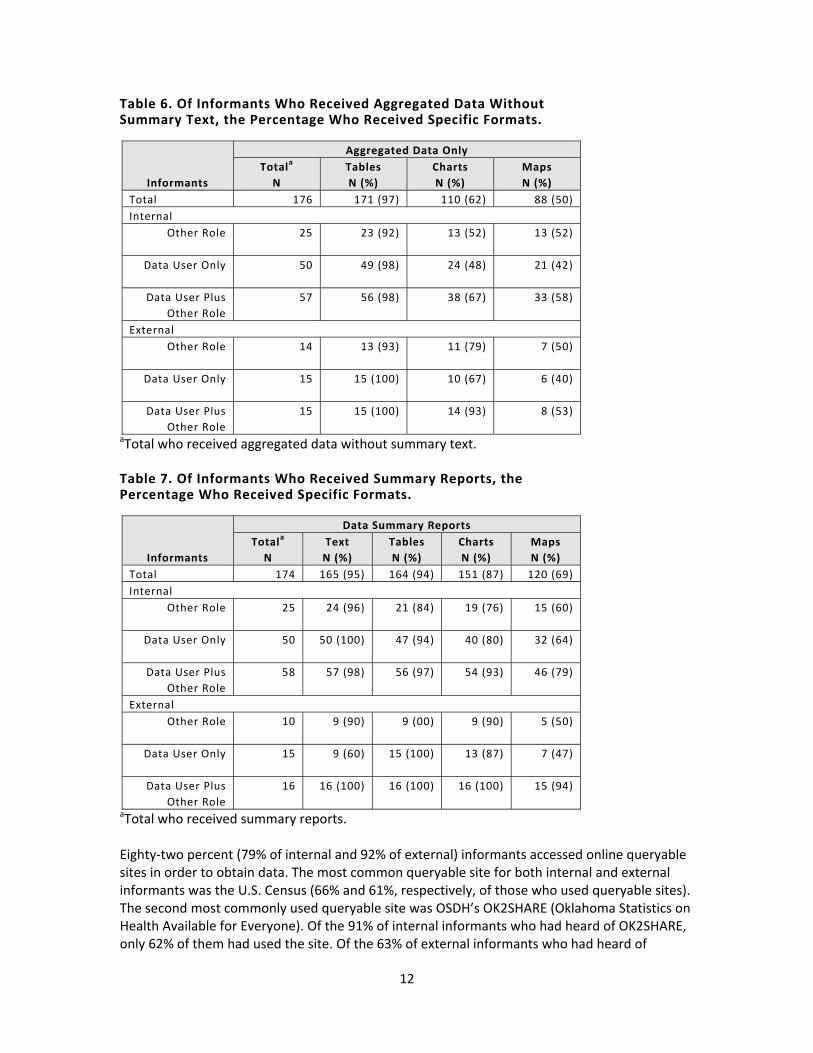
Table 6. Of Informants Who Received Aggregated Data Without Summary Text, the Percentage Who Received Specific Formats.
Informants
Aggregated Data Only Totala
N Tables N (%)
Charts N (%)
Maps N (%)
Total 176 171 (97) 110 (62) 88 (50) Internal
Other Role 25 23 (92) 13 (52) 13 (52)
Data User Only 50 49 (98) 24 (48) 21 (42)
Data User Plus Other Role
57 56 (98) 38 (67) 33 (58)
External Other Role 14 13 (93) 11 (79) 7 (50)
Data User Only 15 15 (100) 10 (67) 6 (40)
Data User Plus Other Role
15 15 (100) 14 (93) 8 (53)
aTotal who received aggregated data without summary text. Table 7. Of Informants Who Received Summary Reports, the Percentage Who Received Specific Formats.
Informants
Data Summary Reports Totala
N Text N (%)
Tables N (%)
Charts N (%)
Maps N (%)
Total 174 165 (95) 164 (94) 151 (87) 120 (69) Internal
Other Role 25 24 (96) 21 (84) 19 (76) 15 (60)
Data User Only 50 50 (100) 47 (94) 40 (80) 32 (64)
Data User Plus Other Role
58 57 (98) 56 (97) 54 (93) 46 (79)
External Other Role 10 9 (90) 9 (00) 9 (90) 5 (50)
Data User Only 15 9 (60) 15 (100) 13 (87) 7 (47)
Data User Plus Other Role
16 16 (100) 16 (100) 16 (100) 15 (94)
aTotal who received summary reports. Eighty‐two percent (79% of internal and 92% of external) informants accessed online queryable sites in order to obtain data. The most common queryable site for both internal and external informants was the U.S. Census (66% and 61%, respectively, of those who used queryable sites). The second most commonly used queryable site was OSDH’s OK2SHARE (Oklahoma Statistics on Health Available for Everyone). Of the 91% of internal informants who had heard of OK2SHARE, only 62% of them had used the site. Of the 63% of external informants who had heard of
12
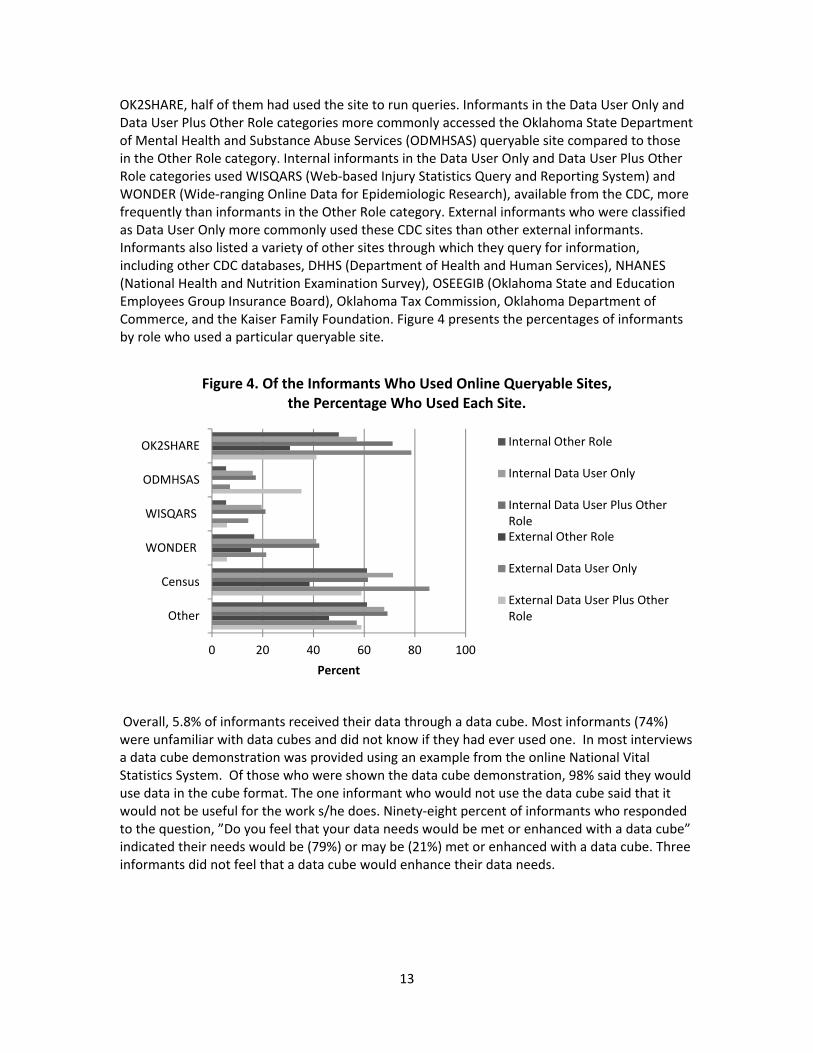
OK2SHARE, half of them had used the site to run queries. Informants in the Data User Only and Data User Plus Other Role categories more commonly accessed the Oklahoma State Department of Mental Health and Substance Abuse Services (ODMHSAS) queryable site compared to those in the Other Role category. Internal informants in the Data User Only and Data User Plus Other Role categories used WISQARS (Web‐based Injury Statistics Query and Reporting System) and WONDER (Wide‐ranging Online Data for Epidemiologic Research), available from the CDC, more frequently than informants in the Other Role category. External informants who were classified as Data User Only more commonly used these CDC sites than other external informants. Informants also listed a variety of other sites through which they query for information, including other CDC databases, DHHS (Department of Health and Human Services), NHANES (National Health and Nutrition Examination Survey), OSEEGIB (Oklahoma State and Education Employees Group Insurance Board), Oklahoma Tax Commission, Oklahoma Department of Commerce, and the Kaiser Family Foundation. Figure 4 presents the percentages of informants by role who used a particular queryable site.
0 20 40 60 80 100
OK2SHARE
ODMHSAS
WISQARS
WONDER
Census
Other
Percent
Figure 4. Of the Informants Who Used Online Queryable Sites, the Percentage Who Used Each Site.
Internal Other Role
Internal Data User Only
Internal Data User Plus Other RoleExternal Other Role
External Data User Only
External Data User Plus Other Role
Overall, 5.8% of informants received their data through a data cube. Most informants (74%) were unfamiliar with data cubes and did not know if they had ever used one. In most interviews a data cube demonstration was provided using an example from the online National Vital Statistics System. Of those who were shown the data cube demonstration, 98% said they would use data in the cube format. The one informant who would not use the data cube said that it would not be useful for the work s/he does. Ninety‐eight percent of informants who responded to the question, ”Do you feel that your data needs would be met or enhanced with a data cube” indicated their needs would be (79%) or may be (21%) met or enhanced with a data cube. Three informants did not feel that a data cube would enhance their data needs.
13

4.3 Desired Information
In an effort to determine if all data needs were being met by current systems and efforts and to develop strategic directions for future data enhancements, participants were asked about data they do not receive currently but would like to (desired information). This question encompassed data that was internal to OSDH, external to OSDH, or not currently being collected in a systematic, state‐wide manner. All responses were compiled together and coded into the three categories (internal, external, and other) and then divided into four additional combinations of those categories to better represent the true nature of the desired information. Data was categorized as Internal‐External if the desired information could come from sources within and outside of the agency. Internal‐Other data represented information that is found within OSDH but is requested, used, analyzed, or presented in a new way. External‐Other is the same concept only representing data external to OSDH. Internal‐External‐Other represents information that is collected by OSDH and one or more other agencies but was requested to presented in a different format such as linked data. Of the 208 informants, 93% provided at least one response when asked about desired information. Over half of the informants (60%) gave at least three answers, while 5 informants gave the maximum of 15 responses. There were a total of 767 responses to the desired information question (Table 8). The Other desired information category accounted for the largest percentage overall (43%), indicating a clear desire for new or innovative information. This trend was sustained for both internal and external informants. Table 8. Desired Information Category by Location and Role of Informant
Location/ Role of Informant
Desired Information Total Internal External Other N N % N % N %
Total 767 156 20% 280 37% 331 43% Internal 621 127 20% 237 38% 257 41%
Other Role 80 16 20% 29 36% 35 44% Data User Only 288 54 19% 116 40% 118 41%
Date User Plus Other Role 253 57 23% 92 36% 104 41% External 146 29 20% 43 29% 74 51%
Other Role 44 11 25% 9 20% 24 55% Data User Only 39 12 31% 7 18% 20 51%
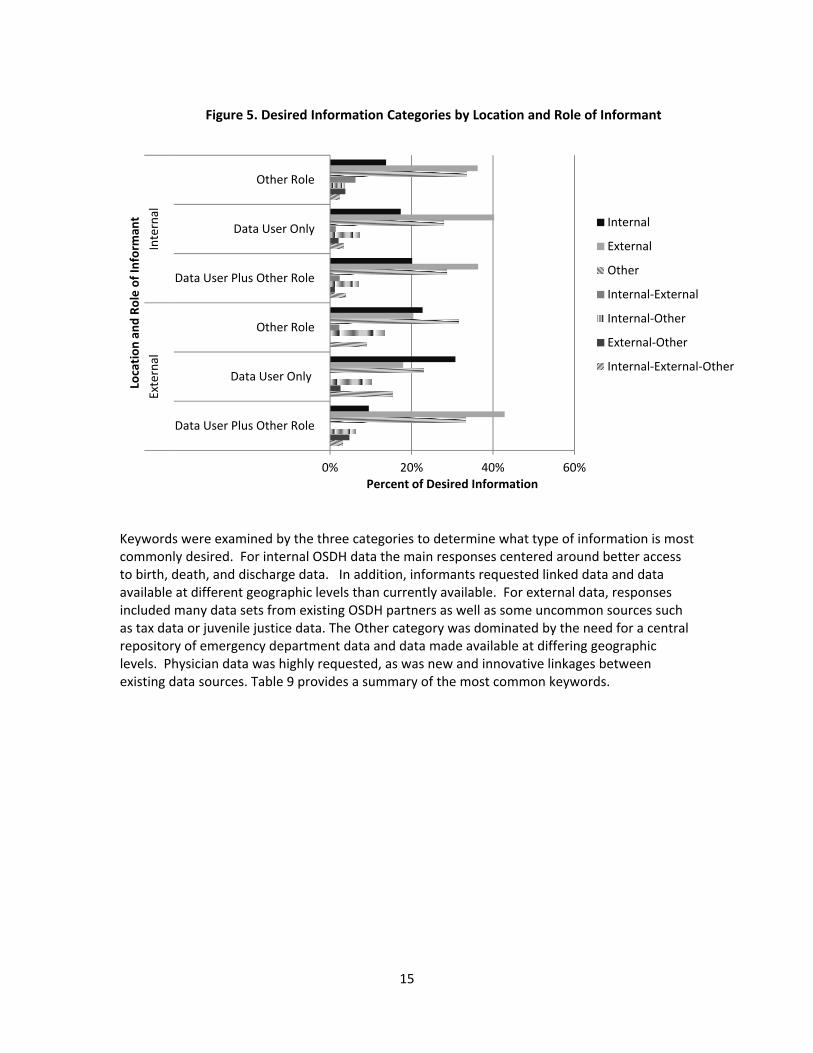
Date User Plus Other Role 63 6 10% 27 43% 30 48% Figure 5 displays the distribution of expanded desired information categories by location and role of informant. With the categories further broken down, external information became the largest desired category at 37% overall. As expected, a larger percentage of internal informants wanted external data compared to external informants (38% and 29%, respectively). However, the percentage of informants who desired OSDH information (internal information) was about equal for both internal and external informants (18% and 19%, respectively).
14
0% 20% 40% 60%
Data User Plus Other Role
Data User Only
Other Role
Data User Plus Other Role
Data User Only
Other Role
External
Internal
Percent of Desired Information
Location
and
Role of In
form
ant
Figure 5. Desired Information Categories by Location and Role of Informant
Internal
External
Other
Internal‐External
Internal‐Other
External‐Other
Internal‐External‐Other
Keywords were examined by the three categories to determine what type of information is most commonly desired. For internal OSDH data the main responses centered around better access to birth, death, and discharge data. In addition, informants requested linked data and data available at different geographic levels than currently available. For external data, responses included many data sets from existing OSDH partners as well as some uncommon sources such as tax data or juvenile justice data. The Other category was dominated by the need for a central repository of emergency department data and data made available at differing geographic levels. Physician data was highly requested, as was new and innovative linkages between existing data sources. Table 9 provides a summary of the most common keywords.
15
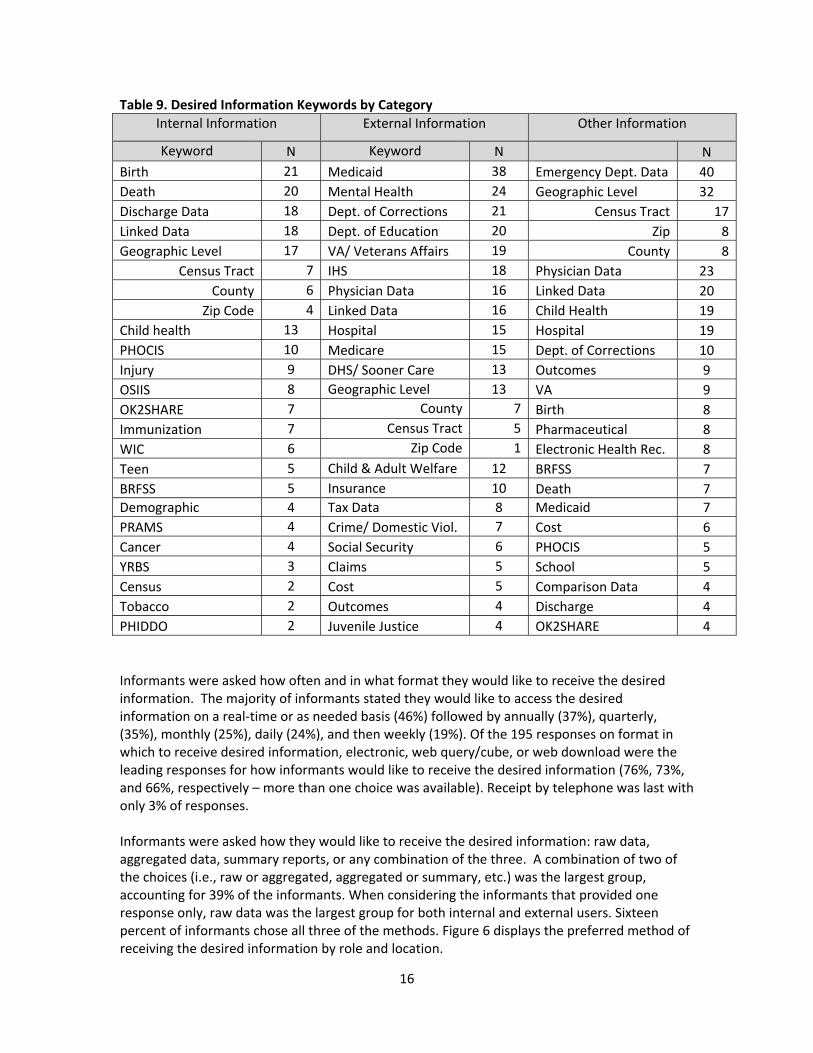
Table 9. Desired Information Keywords by Category Internal Information External Information Other Information
Keyword N Keyword N N Birth 21 Medicaid 38 Emergency Dept. Data 40 Death 20 Mental Health 24 Geographic Level 32 Discharge Data 18 Dept. of Corrections 21 Census Tract 17Linked Data 18 Dept. of Education 20 Zip 8Geographic Level 17 VA/ Veterans Affairs 19 County 8
Census Tract 7 IHS 18 Physician Data 23 County 6 Physician Data 16 Linked Data 20
Zip Code 4 Linked Data 16 Child Health 19 Child health 13 Hospital 15 Hospital 19 PHOCIS 10 Medicare 15 Dept. of Corrections 10 Injury 9 DHS/ Sooner Care 13 Outcomes 9 OSIIS 8 Geographic Level 13 VA 9 OK2SHARE 7 County 7 Birth 8 Immunization 7 Census Tract 5 Pharmaceutical 8 WIC 6 Zip Code 1 Electronic Health Rec. 8 Teen 5 Child & Adult Welfare 12 BRFSS 7 BRFSS 5 Insurance 10 Death 7 Demographic 4 Tax Data 8 Medicaid 7 PRAMS 4 Crime/ Domestic Viol. 7 Cost 6 Cancer 4 Social Security 6 PHOCIS 5 YRBS 3 Claims 5 School 5 Census 2 Cost 5 Comparison Data 4 Tobacco 2 Outcomes 4 Discharge 4 PHIDDO 2 Juvenile Justice 4 OK2SHARE 4 Informants were asked how often and in what format they would like to receive the desired information. The majority of informants stated they would like to access the desired information on a real‐time or as needed basis (46%) followed by annually (37%), quarterly, (35%), monthly (25%), daily (24%), and then weekly (19%). Of the 195 responses on format in which to receive desired information, electronic, web query/cube, or web download were the leading responses for how informants would like to receive the desired information (76%, 73%, and 66%, respectively – more than one choice was available). Receipt by telephone was last with only 3% of responses. Informants were asked how they would like to receive the desired information: raw data, aggregated data, summary reports, or any combination of the three. A combination of two of the choices (i.e., raw or aggregated, aggregated or summary, etc.) was the largest group, accounting for 39% of the informants. When considering the informants that provided one response only, raw data was the largest group for both internal and external users. Sixteen percent of informants chose all three of the methods. Figure 6 displays the preferred method of receiving the desired information by role and location.
16

Figure 6. Preferred Method of Receiving Data by Role and Location of Informant
0% 10% 20% 30% 40% 50% 60% 70%
Data User Plus Other Role
Data User Only
Other Role
Data User Plus Other Role
Data User Only
Other Role
External
Internal
Any Method
Raw
Summary
Aggregated
Combination
Informants were also asked about willingness to purchase the desired information or analytical services for the information (Figure 7). Forty‐one percent of informants stated they would purchase the data, but many others stated it would depend on funding. In regards to analytics, 55% of the informants stated they would not usually purchase analytical services because they have staff available to meet that need.
Figure 7. Willingness to Purchase Data or Analytical Services
Yes41%
No30%Maybe/
Don't Know29%
Purchase Data
Yes31%
No55%
Maybe/ Don't Know14%
Purchase Analytical Services
17
4.4 Data Integration and Enhancement
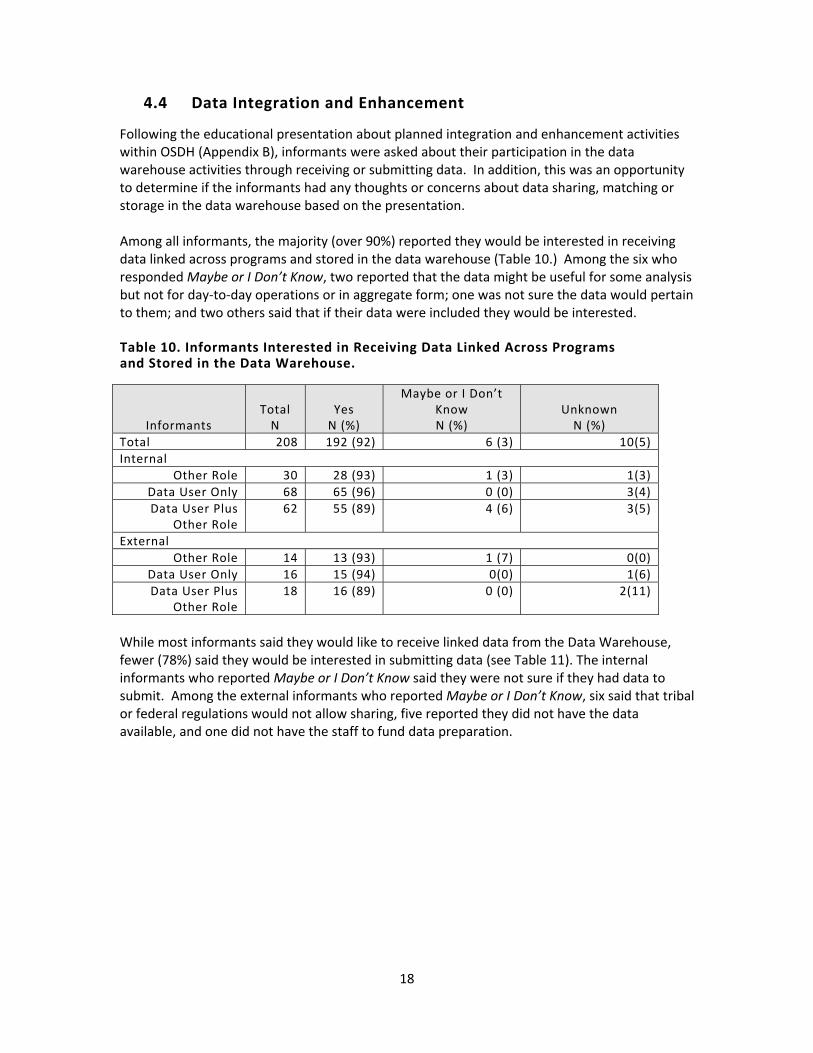
Following the educational presentation about planned integration and enhancement activities within OSDH (Appendix B), informants were asked about their participation in the data warehouse activities through receiving or submitting data. In addition, this was an opportunity to determine if the informants had any thoughts or concerns about data sharing, matching or storage in the data warehouse based on the presentation. Among all informants, the majority (over 90%) reported they would be interested in receiving data linked across programs and stored in the data warehouse (Table 10.) Among the six who responded Maybe or I Don’t Know, two reported that the data might be useful for some analysis but not for day‐to‐day operations or in aggregate form; one was not sure the data would pertain to them; and two others said that if their data were included they would be interested. Table 10. Informants Interested in Receiving Data Linked Across Programs and Stored in the Data Warehouse.
Informants Total N
Yes N (%)
Maybe or I Don’t Know N (%)
Unknown N (%)
Total 208 192 (92) 6 (3) 10(5) Internal
Other Role 30 28 (93) 1 (3) 1(3) Data User Only 68 65 (96) 0 (0) 3(4) Data User Plus
Other Role 62 55 (89) 4 (6) 3(5)
External Other Role 14 13 (93) 1 (7) 0(0)
Data User Only 16 15 (94) 0(0) 1(6) Data User Plus
Other Role 18 16 (89) 0 (0) 2(11)
While most informants said they would like to receive linked data from the Data Warehouse, fewer (78%) said they would be interested in submitting data (see Table 11). The internal informants who reported Maybe or I Don’t Know said they were not sure if they had data to submit. Among the external informants who reported Maybe or I Don’t Know, six said that tribal or federal regulations would not allow sharing, five reported they did not have the data available, and one did not have the staff to fund data preparation.
18

Table 11. Informants Interested in Submitting Data to Be Linked Across Programs and Stored in the Data Warehouse.
Informants Total N
Yes N (%)
Maybe or I Don’t Know N (%)
Not Applicable N (%)
Unknown N (%)
Total 208 163 (78) 16(8) 19 10(5)Internal
Other Role 30 24 (80) 0 (0) 5(17) 1(3) Data User Only 68 64 (94) 1 (1) 0(0) 3(4)Data User Plus
Other Role 62 56 (90) 3 (5) 1(2) 2(3)
External Other Role 14 2 (14) 3 (21) 8(57) 1(7)
Data User Only 16 6 (38) 8(50) 1(6) 1(6)Data User Plus
Other Role 18 11 (61) 1 (6) 4(22) 2(11)
Finally, informants were asked if they had any thoughts or concerns about data sharing, the analytical master person index, or the data warehouse. Regarding data sharing, 75% of the 208 informants had no thoughts or concerns. Among the 51 who did, over half (59%) were concerned about confidentiality of the data, followed by 20% who were concerned about security and 39% who had variety of other concerns with some having multiple concerns. Almost three‐fourths (73%) of the 160 internal informants did not express any thoughts or concerns about data sharing. Among the 43 internal informants with thoughts or concerns about data sharing, the majority (62%) were concerned about confidentiality, followed by security and other concerns. The other concerns included access to the data, internal and external barriers, appropriate data usage, and potential barriers. There was some variation among the different types of internal informant regarding thoughts or concerns about data sharing. Those with stated concerns were data users and served in another role (37%), followed by the informants who were not data users (33%) and data users only (13%). The type of concerns did not vary across the internal informant groups. The majority (83%) of the external informants had no thoughts or concerns about data sharing. Among the eight who did have thoughts or concerns, their comments included concerns about security, privacy, legal issues, cost and outside interest from parties who might use the data for unintended purposes such as insurance companies. When asked about thoughts or concerns regarding the Analytical Master Person Index (AMPI), 85% of the informants had no thoughts or concerns. Among the 29 who had concerns about the AMPI, 12 had concerns about confidentiality, 7 about security and 16 about other issues such as data matching, cost, access to the data and the Clinical Master Person Index (CMPI). Among the 24 (15%) internal informants who had concerns about the AMPI, almost half had concerns about confidentiality and other issues and 25% had concerns about security. More than half of the external informants (71%) had concerns other than security or confidentiality such as data matching, access to the data, and competing resources. Three external informants had concerns about security or confidentiality.
19
The majority of informants (68%) did not have thoughts and concerns about the Data Warehouse (DW). Among the 66 informants who did have thoughts or concerns about the data warehouse, only 2% were concerned about security, none were concerned about privacy and the remaining 98% had a variety of other thoughts or concerns. Among those, 16 informants said the data warehouse would be useful and 50 had concerns such as access to the data, accuracy and appropriate use of the data, funding, staffing, legality, management, and timeliness of the data. Among the 160 internal informants, 47 (29%) had thoughts or concerns about the data warehouse. Among those, 49% were in the Data User plus Other Role category, followed by 28% in the Data User Only category and 23% in the Other Role category. Informants in all role categories had similar concerns about competing resources, appropriate use of data, access, funding and other statewide activities related to data warehousing. External informants had similar responses with 19 (40%) expressing thoughts or concerns about the data warehouse. Among those, 37% were in the Data User plus Other Role category followed by 32% in the Other Role category and 26% in the Data User Only category. Concerns among the external informants included data accuracy, federal standards, access to the data warehouse, frequency of data updates to the data warehouse, and staffing. Among the 19 external informants, 37% stated they thought the data warehouse would be useful.
4.5 Software
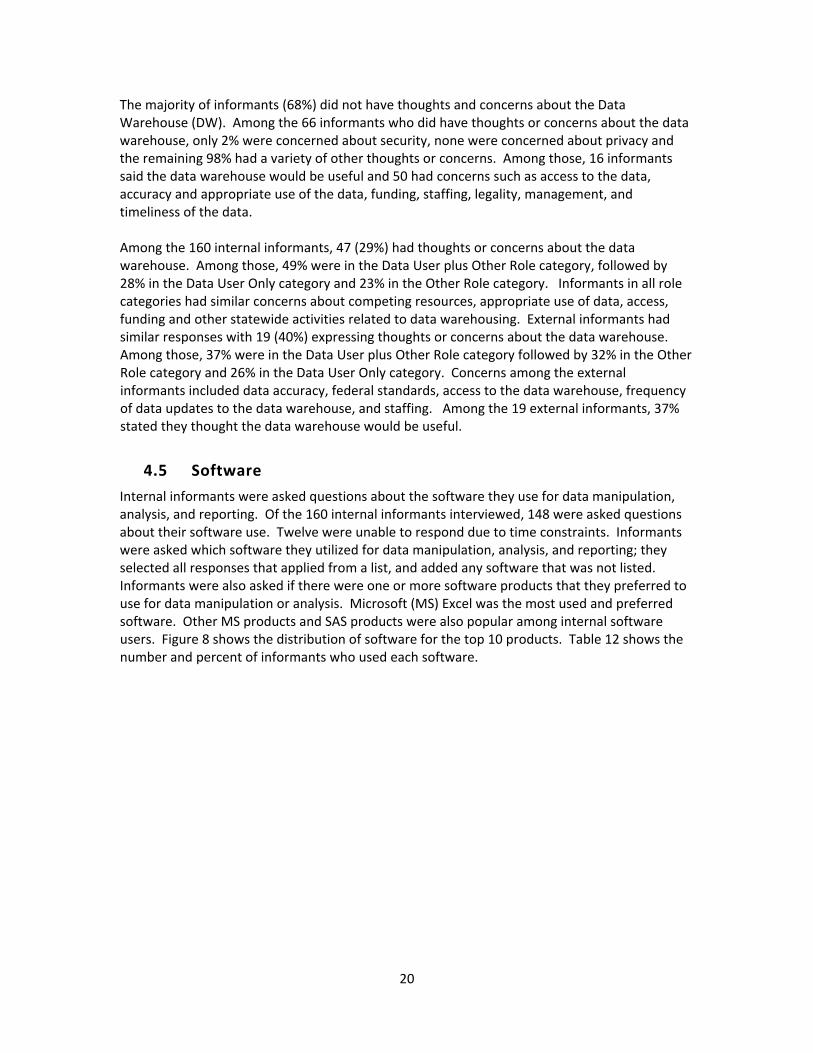
Internal informants were asked questions about the software they use for data manipulation, analysis, and reporting. Of the 160 internal informants interviewed, 148 were asked questions about their software use. Twelve were unable to respond due to time constraints. Informants were asked which software they utilized for data manipulation, analysis, and reporting; they selected all responses that applied from a list, and added any software that was not listed. Informants were also asked if there were one or more software products that they preferred to use for data manipulation or analysis. Microsoft (MS) Excel was the most used and preferred software. Other MS products and SAS products were also popular among internal software users. Figure 8 shows the distribution of software for the top 10 products. Table 12 shows the number and percent of informants who used each software.
20
0%
10%
20%
30%
40%
50%
60%
70%
80%
90%
100%
Figure 8: Top 10 Software Used
Table 12. Software Currently Used for Data Analysis/Interpretation or Report Development.
Software Number of Usersa Percent of Informants
MS Excel ‐ Spreadsheet 140 90
MS Word 138 89
MS PowerPoint 115 74
Adobe Acrobat 88 56
MS Access 83 53
MS Publisher 56 36
SAS ‐ SAS/STAT 40 26
ESRI ArcGIS 35 22
MS SQL 34 22
Crystal Reports 26 17
Epi Info 24 15
MS Excel ‐ Pivot Table 18 12
SAS ‐ Enterprise Guide 18 12
MS Visio 15 10
SPSS 11 7
Ultra Edit 7 5
SAS ‐ CDC Version 4 3
FoxPro 4 3
Dreamweaver 4 3
21

Number of Usersa Software Percent of Informants
SUDAAN 3 2
SAS ‐ JMP 1 1
SAS ‐ GIS 1 1 a Informants could choose more than one software for their responses.
Most informants had more than one preferred software that they used. MS Excel, SAS, and MS Access were the top three preferred software for data analysis and manipulation. Twenty‐five internal informants were not asked this question and forty informants had no software preferences. Table 13 shows how these and other preferred software were ranked. Table 13. Software Preferred by Informants for Use in Manipulating/Analyzing Data. Software Number of Users that list this
software as one of their preferred a Percent of Informants
MS Excel 62 40
SAS 29 19
MS Access 18 12
SPSS 6 4
MS Word 6 4
Epi Info 6 4
UltraEdit 6 4
MS SQL 6 4
MS PowerPoint 3 2
Stat Transfer 2 1
VBA 1 1
ESRI ArcGIS 1 1
Rocky Mountain 1 1
SUDAAN 1 1
R 1 1
Remedy Magic 1 1
No Preference 40 26
Not Asked 25 11 a Informants could choose more than one software for their responses.
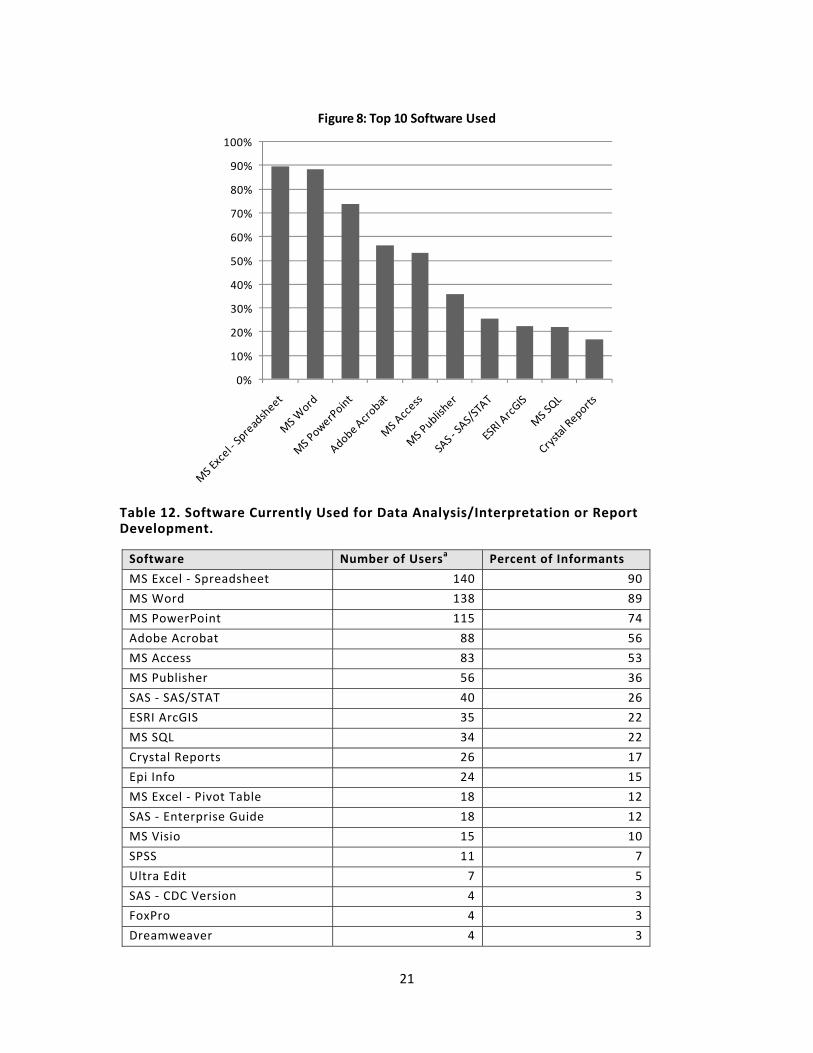
Internal informants were also asked if they conducted data matching to identify unique records. If they said yes, they were asked to indicate what software or method they use to do the data matching. They could choose from a list of three prominent data matching software (Link Plus, Link Pro or The Link King) or select other and provide the name of other software that they use. The vast majority (82.7%) of informants did not conduct any data matching. Of those who did, 15.4% used a software other than the three listed, with SAS and SPSS being the most commonly used, and 7.7% used one of the three listed software choices. Table 14 shows the number of informants who conducted data matching by the software that they used.
22
Table 14. Number of Informants Who Conducted Data Matching Listed by Software Used. Software Number of Users a Percent of Informants
No Matching 129 83
Link Plus 7 5
Link Pro 3 2
Link King 2 1
Other: 24 15
SAS 6 4
SPSS 4 3
Manually 4 3
MS Access 3 2
MS SQL 2 1
PHIDDO 1 1a Informants could choose more than one software for their responses. Following the data matching question, internal informants were asked if they had a need for analytical or database software that they did not currently have access to and, if so, what software would they like. Thirty‐six informants (23.1%) stated they had a need for additional software, 67.9% did not have a need, and 9% did not respond. For those informants who needed additional software, a variety of software types were listed. Seven of the 36 informants who needed additional software requested to have SAS or additional SAS functionality such as business intelligence or the full CDC SAS licensed components. Other requested software included: SUDAAN, SPSS or MiniTab, data cube, Visio, Crystal Reports, and Adobe Professional. Some informants had an idea of what kind of functionality they needed but not what specific software would provide it. Table 15 includes some of the functionality responses given.
23
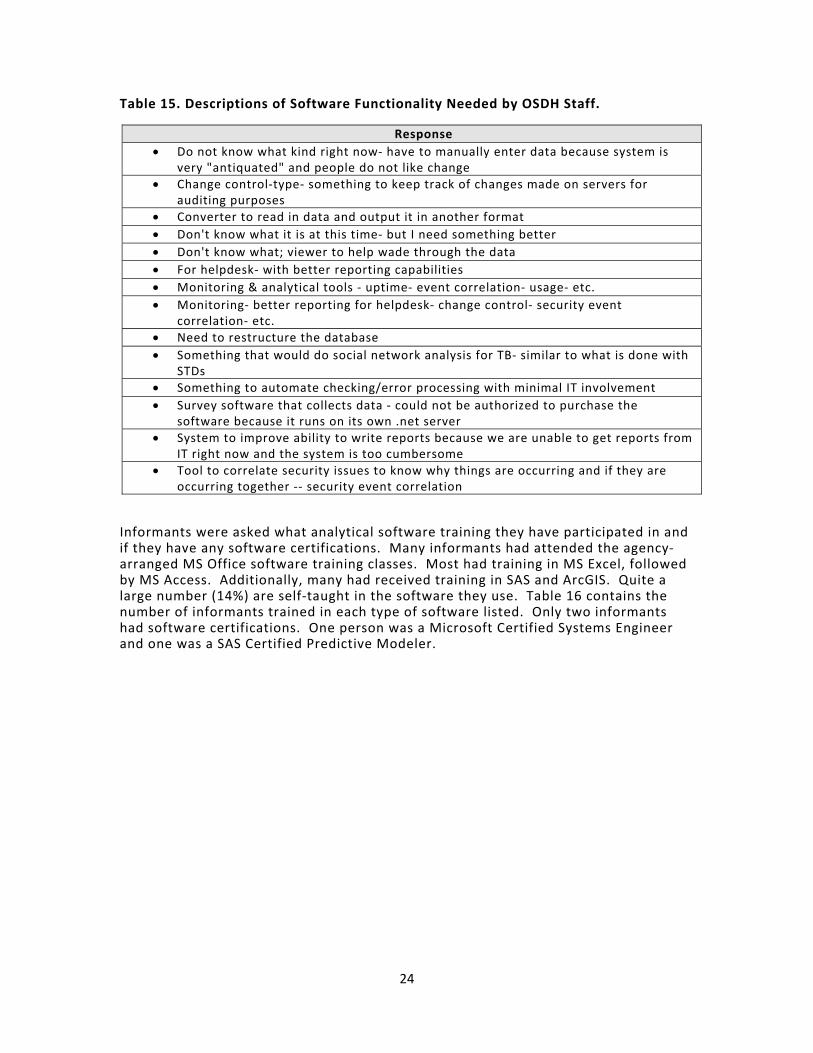
Table 15. Descriptions of Software Functionality Needed by OSDH Staff.
Response • Do not know what kind right now‐ have to manually enter data because system is
very "antiquated" and people do not like change• Change control‐type‐ something to keep track of changes made on servers for
auditing purposes • Converter to read in data and output it in another format • Don't know what it is at this time‐ but I need something better • Don't know what; viewer to help wade through the data • For helpdesk‐ with better reporting capabilities • Monitoring & analytical tools ‐ uptime‐ event correlation‐ usage‐ etc. • Monitoring‐ better reporting for helpdesk‐ change control‐ security event
correlation‐ etc. • Need to restructure the database • Something that would do social network analysis for TB‐ similar to what is done with
STDs • Something to automate checking/error processing with minimal IT involvement • Survey software that collects data ‐ could not be authorized to purchase the
software because it runs on its own .net server• System to improve ability to write reports because we are unable to get reports from
IT right now and the system is too cumbersome• Tool to correlate security issues to know why things are occurring and if they are
occurring together ‐‐ security event correlation
Informants were asked what analytical software training they have participated in and if they have any software certifications. Many informants had attended the agency‐arranged MS Office software training classes. Most had training in MS Excel, followed by MS Access. Additionally, many had received training in SAS and ArcGIS. Quite a large number (14%) are self‐taught in the software they use. Table 16 contains the number of informants trained in each type of software listed. Only two informants had software certifications. One person was a Microsoft Certified Systems Engineer and one was a SAS Certified Predictive Modeler.
24
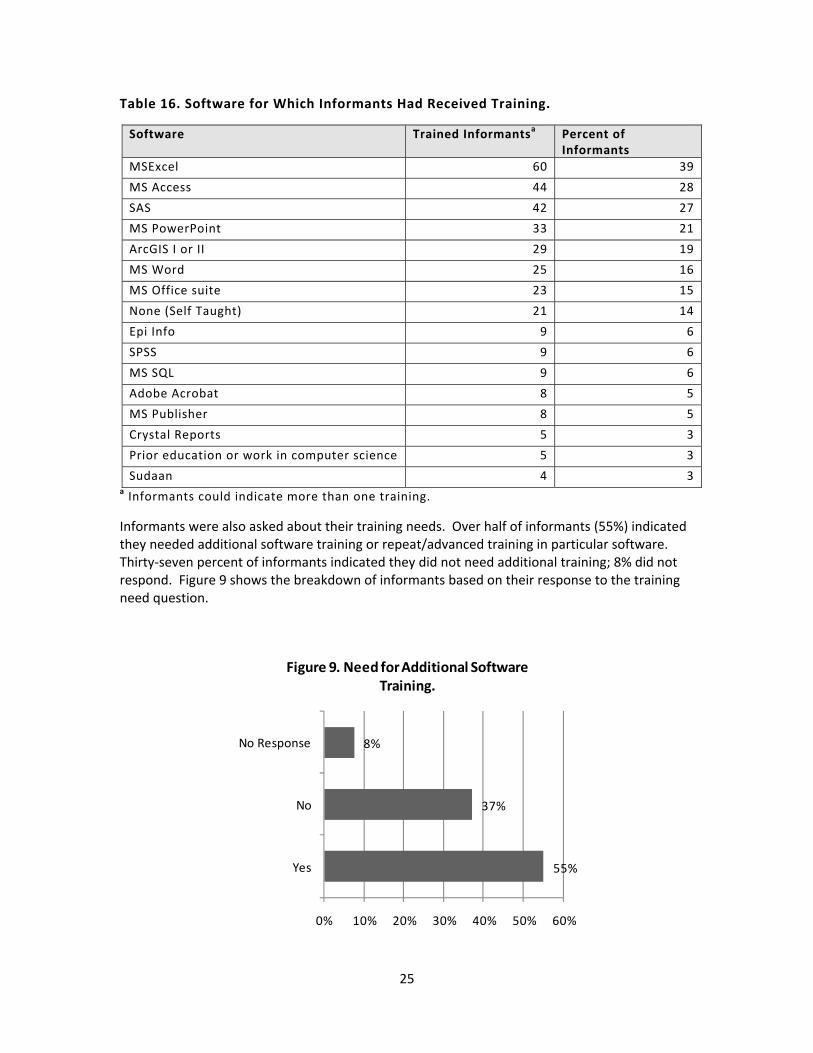
Table 16. Software for Which Informants Had Received Training.
Software Trained Informantsa Percent of Informants
MSExcel 60 39
MS Access 44 28
SAS 42 27
MS PowerPoint 33 21
ArcGIS I or II 29 19
MS Word 25 16
MS Office suite 23 15
None (Self Taught) 21 14
Epi Info 9 6
SPSS 9 6
MS SQL 9 6
Adobe Acrobat 8 5
MS Publisher 8 5
Crystal Reports 5 3
Prior education or work in computer science 5 3
Sudaan 4 3a Informants could indicate more than one training.
Informants were also asked about their training needs. Over half of informants (55%) indicated they needed additional software training or repeat/advanced training in particular software. Thirty‐seven percent of informants indicated they did not need additional training; 8% did not respond. Figure 9 shows the breakdown of informants based on their response to the training need question.
55%
37%
8%
Yes
No
No Response
0% 10% 20% 30% 40% 50% 60%
Figure 9. Need for Additional Software Training.
25

Of the software training needed by informants, SAS emerged as the number one requested software training. GIS training and Microsoft Office training were also popular requests. Table 17 shows the software that was requested by name and the number of informants that listed that software as one for which they need training. Table 17. Software Training Needs.
Software Number of Informantsa Percent of Informants SAS 33 21 ArcGIS 16 10 MS Excel 15 10 MS SQL 15 10 MS Access 13 8 MS Office 2007 11 7 Any Available 6 4 Sudaan 5 3 Crystal Reports 4 3 Adobe Acrobat 4 3 SPSS 3 2 EpiInfo 2 1 Dreamweaver 1 1 a Informants could choose more than one software for their responses.
5. Recommendations
Based on results from the Informatics Needs Assessment, recommendations include new and additional training, continuing with the development of the AMPI and Data Warehouse, and testing the security once the AMPI and Data Warehouse have been developed. There are a number of staff in need of software training and there are various reasons for the lack of training; the training is unavailable, unable to get supervisor’s authorization, and lack of time. It is the recommendation of the Informatics Needs Assessment Workgroup that software training within OSDH be a priority. It is further recommended that alternatives for training be explored. For example, instructors at local universities may be able to provide SAS training at a fraction of the cost of training through the SAS Institute. One of the purposes for conducting the Informatics Needs Assessment was to determine if there is a need for business intelligence software at this time. Although some of the informants mentioned the need for business intelligence software, that is not recommended at this time. There appears to be a greater need to determine the number and type of SAS licenses and to ensure the users have the appropriate training to use the software currently owned. It is recommended that future software purchases be accompanied by appropriate training for all potential users. Responses to the questions about data sharing, the AMPI, and Data Warehouse led the team to recommend continuation with the development of the AMPI and Data Warehouse. While
26
numerous people thought the projects would be useful, there were concerns about confidentiality and security. Therefore, external testing of the system is recommended once the systems are developed. This could be accomplished via collaboration with a local university or partner.
6. References
Anderson, R. M., Rice, T. H., & Kominski, G. F. (2007). Changing the U.S. Health Care System: Key Issues in Health Services Policy and Management, 3rd Edition. San Francisco, CA: Jossey‐Bass. Davis, J., Miller, G. J., & Russell, A. (2006). Information Revolution: Using the Information Evolution Model to Grow your Business. Hoboken, NJ: John Wiley & Sons. Rich, K. M., (2008). Oklahoma State Department of Health Geographic Information Systems (GIS) Needs Assessment and Requirements Analysis: Report of Findings and Recommendations. Health Care Information, Center for Health Statistics, Oklahoma State Department of Health.
27

28
Appendix A. Survey Instrument
Introductions: Thank you for coming today. My name is _(name)_ and I am a(n) _(title)_ in _(dept)_. Before we begin the interview, let’s take a moment to introduce ourselves and state our position and program area. Purpose of Interview: The purpose of the Informatics Needs Assessment is to assess data and information uses and needs both internal and external to OSDH. The Health Informatics Council (HIC) will use this information to determine the need for enterprise level software and to develop methods for sharing non‐confidential public health data. Your responses will help guide the development of a data warehouse within OSDH. Structure of Interview: The interview is structured as a key informant interview and your comments will be recorded for the development of the report. The survey consists of both open‐ended and multiple‐choice questions. We’ll go around the room to provide each person the opportunity to answer each question. We emailed the survey and a description of the data warehouse to each of you last week, so you can follow along with the survey as we go. Please refer to the survey for answers to the multiple‐choice questions. The interview will take approximately 1.5 to 2 hours, and we will take a short break towards the end of the survey. For the purposes of this interview, all questions about information/data are referring to information or data related to public health. Do you have any questions about the purpose or structure of this interview? Are you ready to begin?
Questions for Internal and External Informants
1. What is your role within the organization? a. Leadership – Deputy level or higher b. Management – Chief or Director c. Data User – someone who uses health‐related data to produce reports, make
presentations, or create or evaluate programs d. External Partner – someone outside of OSDH
Organization: ____________________________ Role: ___________________________________
e. IT f. Other _______________________________
2. Please think about the business you do as an individual while at work. What type of
information do you use to determine your business decisions?
I would like to ask you some questions about when and how you receive data. The first few questions are multiple choice. Please refer to this sheet for your answers.
29
3. Current Information/Data a. How do you receive your current information/data? (select all that apply)
i. Hard copy (paper, fax) ii. Email (in the body of the email) iii. Electronic (e.g., CD, flash drive, network drive, file attached to email) iv. Web (downloads, query sites) v. Telephone vi. Other__________
b. How often do you view or retrieve your information/data? (select all that apply) i. Annually ii. Quarterly iii. Monthly iv. Weekly v. Daily vi. Other__________
c. How often do you use information/data in your position? (select all that apply) i. Annually ii. Quarterly iii. Monthly iv. Weekly v. Daily vi. Other__________
d. Do you have to purchase your data? If yes, what type of data do you purchase? e. Do you have to purchase external analytical services?
The next few questions ask about the format in which you receive your data.
f. Do you receive your current information/data as raw data, which are data that are non‐aggregated and have not been manipulated into a report of any kind? If yes, in what formats do you receive the raw data?
i. Excel ii. Access iii. SAS iv. SQL v. Text vi. GIS formats vii. Other__________________
30

g. Do you receive your current information/data in a format containing aggregated data without summary text? If yes, in what format?
i. Tables with rows and/or columns ii. Charts iii. Maps
h. Do you receive your current information/data in data summary reports? If yes, what is included in the reports?
i. Text ii. Charts iii. Tables iv. Maps
i. Do you receive your current information/data from online queryable databases? If
yes, from what databases do you get your data? i. OK2SHARE ii. ODMHSAS iii. WISQARS (CDC injury) iv. WONDER (CDC) v. Census vi. Other___________________
j. Do you receive your current information/data from data cubes? k. Do you receive your current information/data in another format? Please specify.
_____________________
We’ve talked about how you receive your data. There are some new ways that data are being made available to users, including web‐based data query systems and multidimensional data cubes.
4. [refer to answer sheet ‐ if not OK2SHARE in j.] Have you heard of OSDH’s web‐based data
query system called OK2SHARE? 5. [refer to answer sheet ‐ if not data cube or multidimensional data in k.] Have you heard of
multidimensional data or data cubes? 6. [if NO in 5, show demo of data cube: http://cdc.gov/nchs] With the appropriate training,
would you use data in this format? 7. Do you feel that your data needs would be met with a data cube?
The next few questions address data or information that you do not currently receive but would like to. Please think about information internal to OSDH (e.g., deaths, PHOCIS), external to OSDH (e.g., Medicare, Medicaid, mental health), and information that is not currently reported (e.g. emergency dept., medical records from Dept. of Corrections, physician visits, urgent care).
31
8. Desired Information/Data a. What information/data would you like to receive to enhance your business? And
from what programs/organizations? The next few questions are multiple choice. Please refer to this sheet for your answers.
b. How often would you like to receive this desired information/data? (select all that apply)
i. Annually ii. Quarterly iii. Monthly iv. Weekly v. Daily vi. Other__________
c. How would you like to receive this desired information/data? (select all that apply)
i. Hard copy ii. Email iii. Electronic iv. Web Download v. Web Query/Cube vi. Telephone vii. Other__________
d. Would you be willing to purchase this desired information/data? e. Would you be willing to purchase analytical services for this data?
f. What is your preferred method for receiving data?
i. Raw data (data that is not aggregated and has not been manipulated into a report)
ii. Aggregated data (without summary text) iii. Summary reports iv. Other__________________
We’ve talked about how you receive data and what types of data you do not receive but would like to. Much of the analyses we would like to do involves data that we cannot access and data that are not linked. I would like to take a few minutes now to describe what a data warehouse is, how it can enhance our ability to access and analyze data, and how the analytical master person index ties in with the data warehouse. [Give presentation].
9. Would you be interested in receiving analytical information/data that are linked across programs and stored in the data warehouse?
10. Would you or your program be interested in submitting information/data to the data
warehouse?
32
11. Do you have any thoughts or concerns about the following? If so, can you please describe those thoughts or concerns?
a. Data sharing b. Analytical Master Person Index
c. Data warehouse
12. Are there any other health or population data that we have not talked about that you would
like to receive?
33
For Internal Informants Only
13. What pre‐packaged software do you currently use to analyze or interpret data or develop reports?
a. Word b. Adobe c. PowerPoint d. Excel
i. Spreadsheet ii. Pivot Table
e. Access f. Publisher g. SAS (CDC license or OSDH license)
i. JMP for menu driven analysis ii. SAS/STAT for PROC statements to conduct analysis iii. Enterprise Guide iv. GIS for map development through SAS
h. Crystal Reports i. Epi Info j. SQL k. FoxPro l. SPSS m. Sudaan n. ESRI ArcGIS products o. Visio p. Dreamweaver q. Other _______________________________________________
14. Is there software that you prefer to use to manipulate and analyze your data? 15. Do you conduct data matching to identify unique records? If yes, what software do you use?
a. Link Plus b. Link King c. LinkPro d. Other________________________________________________
16. Do you have a need for analytical or database software that you don’t currently have?
What kind of software?
17. Training Information. The next questions refer to analytical or database software. a. What software training classes have you participated in? b. Do you have any software certifications (e.g., MCSE, SAS certified professional)? c. Do you need additional software training? If so, in what software?
18. Is there anything else that you would like to tell us about software training needs? 19. Is there anything else related to what we’ve asked about that you would like to comment
on?
34
Appendix B. Description of Data Warehouse The OSDH data warehouse will be designed as an analytical database containing data linked across multiple programs within OSDH and other state agencies as well as other data collected from a variety of sources. The data warehouse will provide enhanced data for a variety of uses including:
• standardized data from outside sources (census) • detailed facility information and crosswalks • program evaluation • planning • quality assurance • policy development • research • historic and trend evaluation • morbidity/mortality rates.
Data from outside sources will also be stored in the data warehouse. These will include data collected by various programs on a regular basis that can be stored in one location in a standard format. For example, census data will be downloaded on a regular basis and stored in a standardized format and organized in a way to relate to the geo‐database. A facility index will be maintained within the data warehouse that will provide a crosswalk for facility identifiers across programs and updated information about the facilities. In addition to data from other sources, dimension tables will be stored and maintained to provide a variety of categories for data elements. Similar to OK2SHARE, the data warehouse will contain modules specific to a topic. The following are examples of modules that may be contained within the data warehouse.
• Maternal/Infant Outcomes o Link: Births, Deaths, Inpatient Hospital Discharges, PRAMS, Stillbirths, HIV, STD,
Censes o Result: Infant Deaths, Maternal Mortality
• Surgery Outcome o Link: Outpatient Surgery, Ambulatory Surgery, Inpatient Discharge, Death o Result: Quality of care issues, readmission rates, mortality outcomes, infection
rates • HIV Outcomes
o Link: HIV, Inpatient Discharge, Outpatient Surgery, Ambulatory Surgery, Deaths o Result: Hospitalization demographics, Co‐morbidity, Procedures performed,
Outcomes, Diagnoses, Cost/charges As additional data become available, additional modules may include the following:
• Chronic Disease o Link: EMS, ER, Inpatient Discharge, Outpatient Surgery, Ambulatory Surgery,
Deaths, Medicaid, Payors o Result: Determine effectiveness/timeliness of preventative treatments provided
in early stages of cardiac events (EMS, ER) on outcomes related to inpatient
35
36
stays, future surgical needs, length/quality of life, disparities in treatment provision, effectiveness of care provider, etc.
• Social Services/Safety Net Population o Link: Medicaid, Abuse & Neglect, Food Stamps, Foster Care, EMS, Inpatient
Discharge, Outpatient Surgery, Ambulatory Surgery, TANF, ER, Corrections, Juvenile Justice, Births, Education
o Result: Compare outcomes and usage patterns of various services by safety net in comparison to general population. Prevalence of hypertension, diabetes and LBW infants among safety net population. Impact of outcomes on education.
• Long‐term Care o Link: ER, Nursing Homes, Inpatient Discharge, Medicare coverage, Hospice,
Home Health, Deaths o Result: Quality of care issues, admission rates between hospitals and nursing
homes, factors preceding health care service utilization, disparities, mortality rates
As programs continue to collect detailed data related to that program, the data warehouse will contain derived or summarized data as a result of data linked across the programs. The linked data will be submitted as the data are compiled, usually on an annual basis. The data warehouse will not contain client identifiers but may contain a derived identifier based on previous matching if person‐centric records are needed for the analysis. The linked data will be derived from matching activities that occur within the Analytical Master Person Index (MPI). Programs that wish to include data for linking or de‐duplication will submit specific data elements to the Analytical MPI. After the data are de‐duplicated or matched, the program ID and a new unique ID will be returned to the submitting program. If the programs wish to have data included in an analytical module within the data warehouse, data sharing agreements will be developed for that purpose and programs will submit the data needed for the analysis. The data warehouse modules will be accessed through a website in a format that will provide a means to automatically sort, count, and total the data stored, to quickly create cross tabs, and allow the user to set up and change the summary’s structure by dragging and dropping fields.
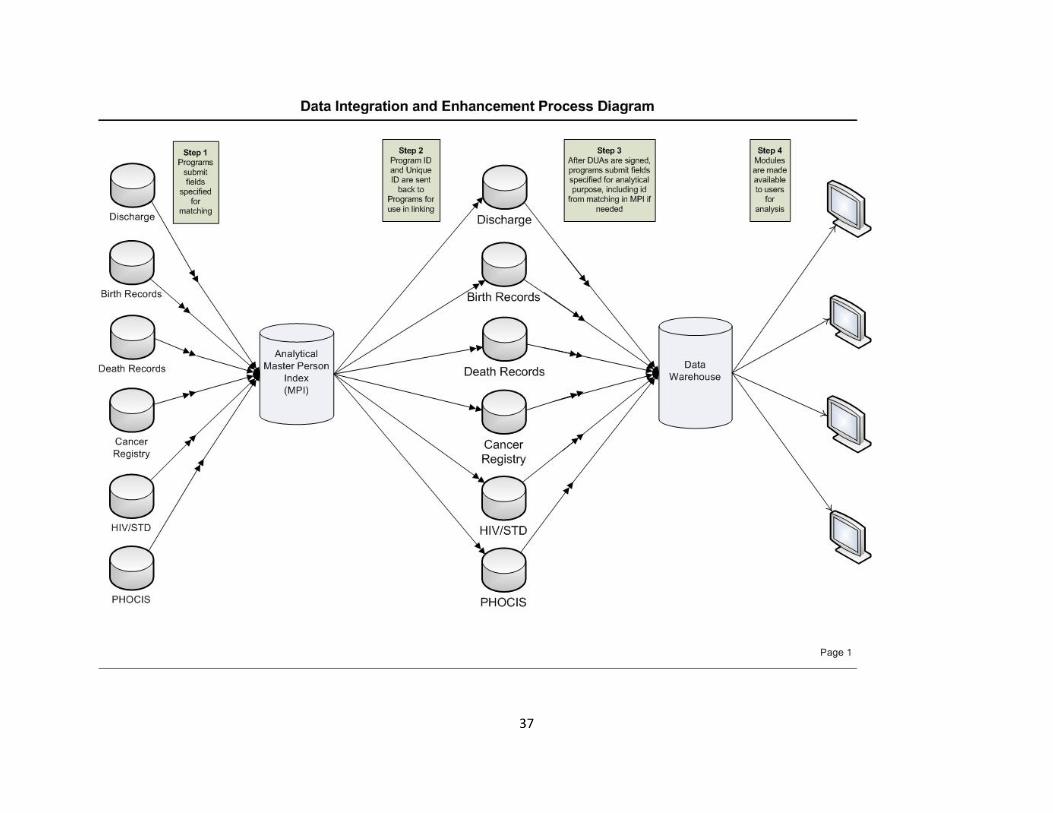
37
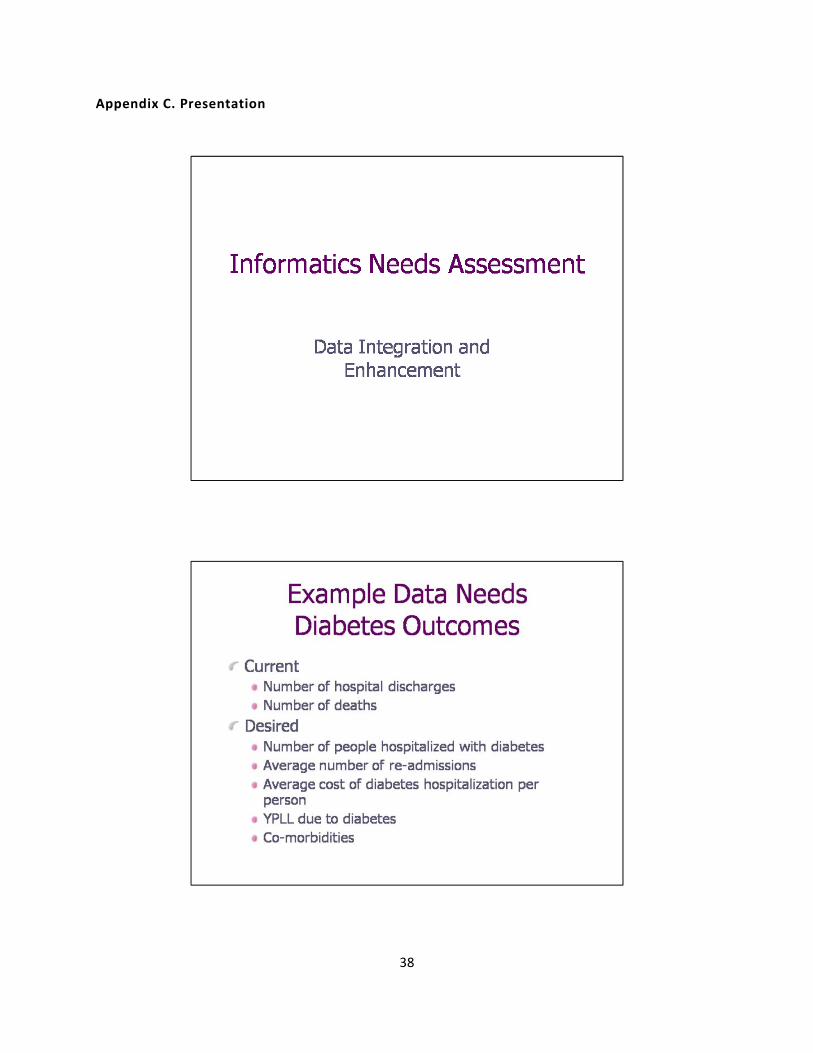
Appendix C. Presentation
38
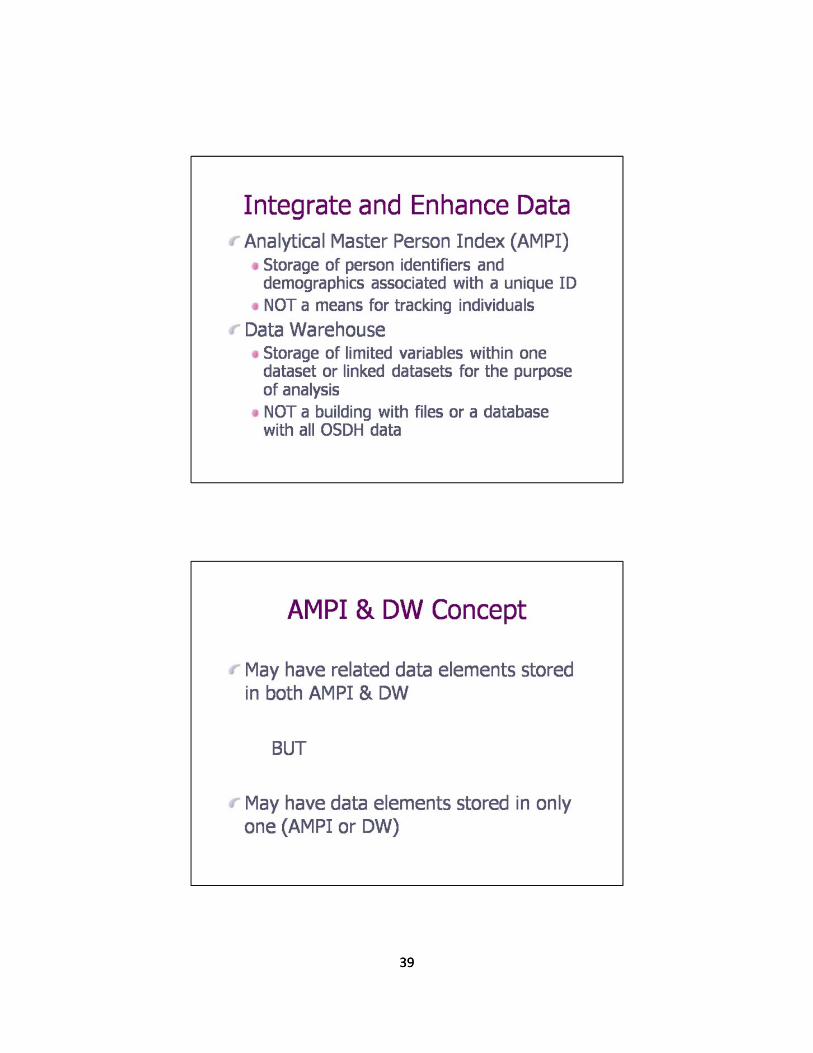
39
39
40
40

41
41
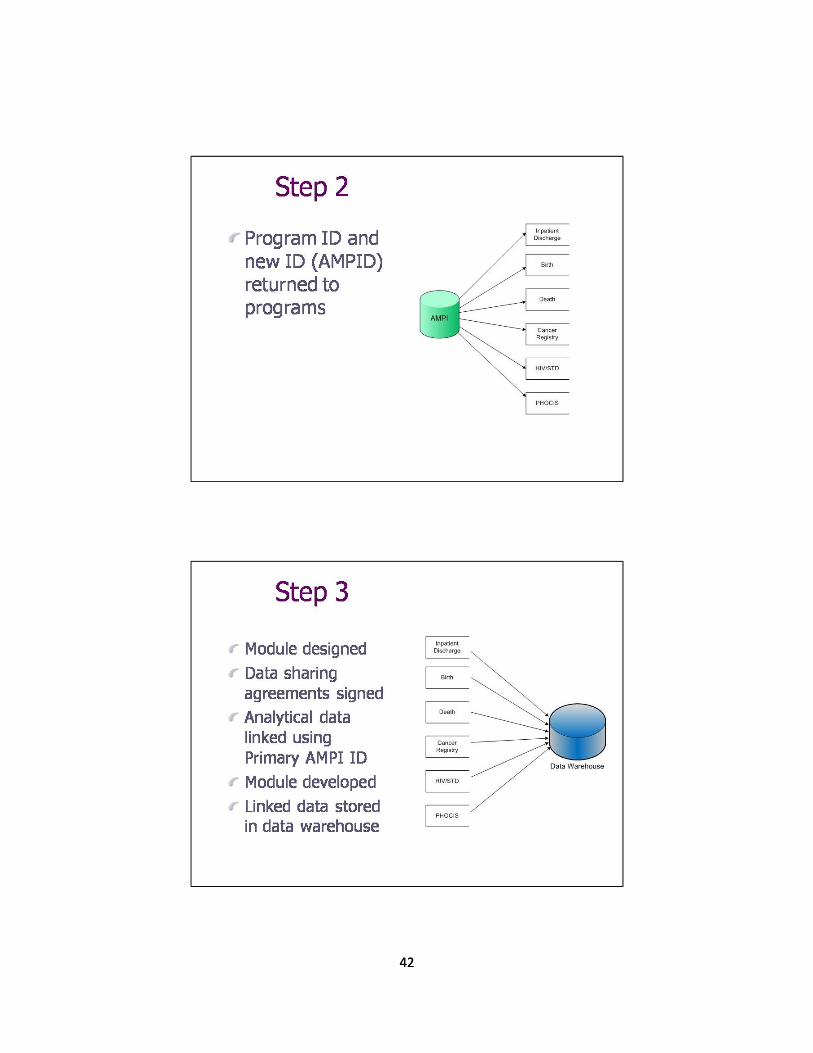
42
42

43
43
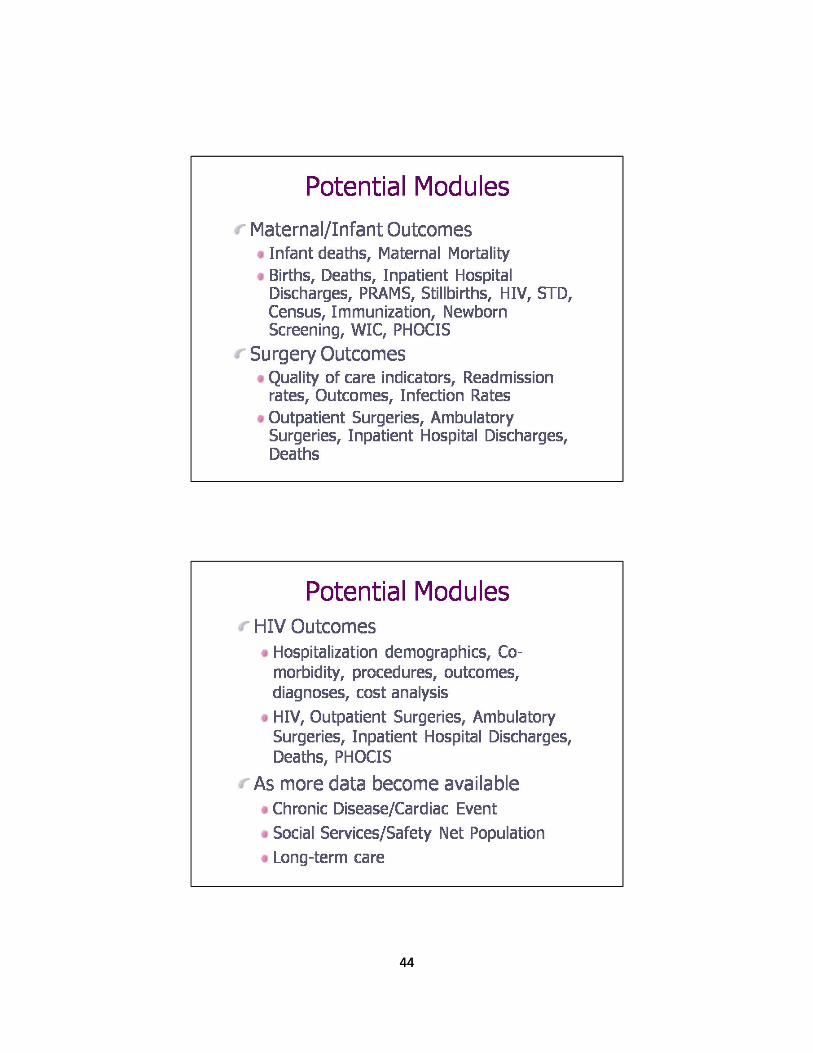
44
44
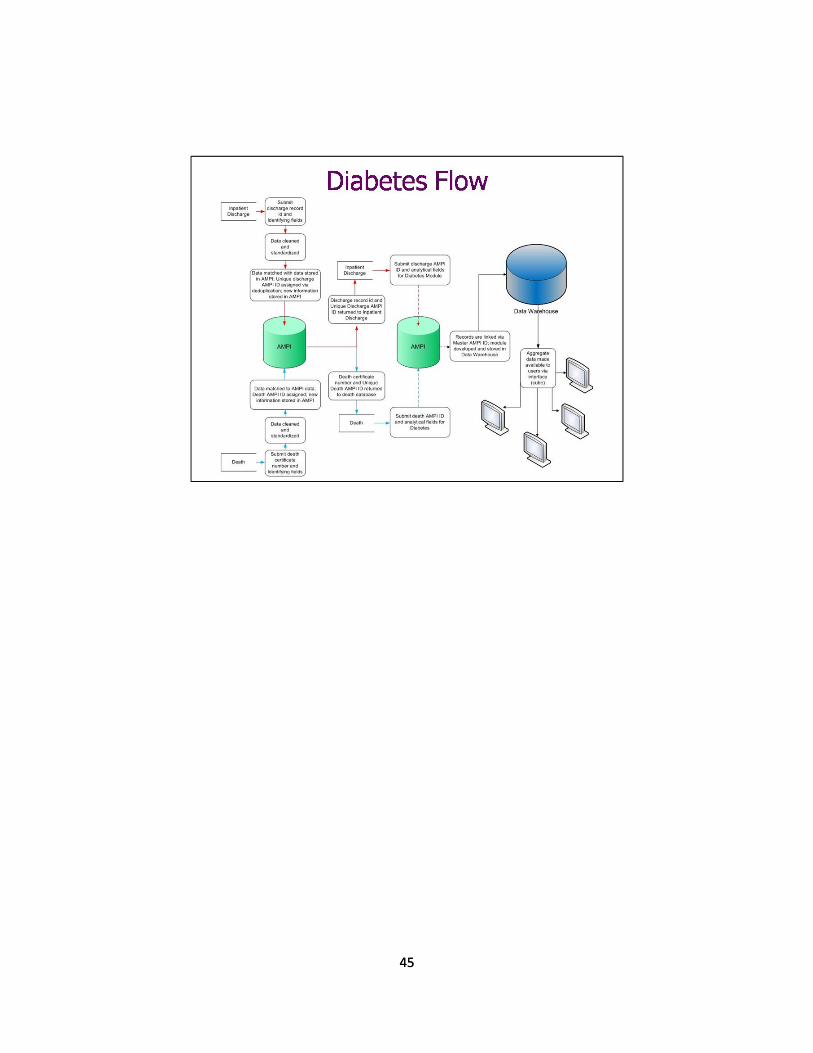
45
45