OISD-GDN-224 - oilweb.oilindia.in standard_old/GDN-224.pdf · 2 oisd-gdn-224 november 2006 for...
32
-
Upload
duongquynh -
Category
Documents
-
view
536 -
download
65
Transcript of OISD-GDN-224 - oilweb.oilindia.in standard_old/GDN-224.pdf · 2 oisd-gdn-224 november 2006 for...
2
OISD-GDN-224
November 2006
FOR RESTRICTED CIRCULATION ONLY
MONITORING & CONTROL
OF
VOLATILE ORGANIC COMPOUNDS EMISSION
Prepared by:
COMMITTEE ON
“MONITORING AND CONTROL OF
VOLATILE ORGANIC COMPOUNDS EMISSION”
OIL INDUSTRY SAFETY DIRECTORATE
7th FLOOR, “NEW DELHI HOUSE”,
27, BARAKHAMBA ROAD,
NEW DELHI – 110 001
3
N O T E
Oil Industry Safety Directorate (OISD) publications are prepared for use
in the Oil and Gas Industry under the Ministry of Petroleum and Natural
Gas. These are the property of Ministry of Petroleum and Natural Gas
and shall not be reproduced or copied or loaned or exhibited to others
without written consent from OISD.
Though every effort has been made to ensure the accuracy and reliability
of data contained in these documents, OISD hereby expressly disclaims
any liability or responsibility for loss or damage resulting from their use.
These documents are intended only to supplement rather than replace
the prevailing statutory requirements.
- (ii) -
4
FOREWORD
The Oil Industry in India is about 100 years old. As such, a variety of practices have been in vogue because of collaboration/association with different foreign companies and governments. Standardisation in design philosophies, operating and maintenance practices was hardly in existence at a national level. This, coupled with feedback from some serious accidents that occurred in the recent past in India and abroad, emphasised the need for the industry to review the existing state-of-the-art in designing, operating and maintaining oil and gas installations.
With this in view, the Ministry of Petroleum and Natural Gas in 1986 constituted Safety Council assisted by the Oil Industry Safety Directorate (OISD) for formulating and implementing a series of self-regulatory measures aimed at removing obsolescence, standardising and upgrading the existing standards to ensure safer operations & also develop standards in new area identified. Accordingly OISD constituted a number of functional committees comprising of experts nominated from the industry to draw up standards and guidelines on various subjects.
At every stage of production, processing, handling, transfer and distribution of hydrocarbon based products, there is potential for losses to the environment. Volatile Organic Compounds (VOCs) being high in vapour pressures significantly vapourise and participate in atmospheric photochemical reactions with oxides of nitrogen and sunlight to form ozone. Ground level ozone affects normal function of the lung in healthy humans. For this reason controlling of VOCs is an effective method of minimizing ground level ozone.
The present document “Monitoring and Control of Volatile Organic Compounds (VOCs) Emission ” was prepared by the Functional Committee on “VOC Emission control”. This document was prepared based on the accumulated experience and knowledge of industry members and various national & international codes and practices.
This document will be reviewed periodically for improvement based on the new experiences and better understanding. Suggestions may be addressed to:
The Coordinator
Committee on "Monitoring and Control of Volatile Organic Compounds (VOCs) Emission”
Oil Industry Safety Directorate
7th Floor, New Delhi House
27, Barakhamba Road,
NEW DELHI - 110 001.
-------------------------------------------------------------------------------------------------------------------------------------------------------------
- III -
5
FUNCTIONAL COMMITTEE
NAME ORGANISATION
LEADER
Shri M.K.Dutta Centre for High Technology, New Delhi
MEMBERS
Shri A.K. Sharma GAIL (India) Limited, Pata
Dr.P.S.Viswanathan Kochi Refineries Limited, Kochi
Shri D.V.Dixit Engineers India Limited, New Delhi.
Shri A.D. Vyawhare Bharat Petroleum Corporation Limited. Mumbai
Dr. M.S.R. Swami Chennai Petroleum Corporation Limited, Chennai
Shri P. Sitarama Rao Hindustan Petroleum Corporation Limited, Vizag
Shri Harendra Singh Oil & Natural Gas Corporation Limited, Mumbai
Shri S.Dasgupta Indian Oil corporation Limited, New Delhi
MEMBER COORDINATOR
Shri P. Kulshreshtha Oil Industry Safety Directorate, New Delhi.
In addition to above, several other experts from industry contributed in the preparation, review
and finalisation of this document.
-(iv)-
6
INDEX
SECTION DESCRIPTION PAGE NO.
1.0 Introduction 1
2.0 Scope 1
3.0 Definitions 2
4.0 Sources of Emissions 3
5.0 Estimation of Emissions 6
7.0 Prevention & Control of Emissions 7
7.0 Control of Emissions – By LDAR 8
8.0 Emission Prevention through In-built Features 11
9.0 Recommended Practices 12
10.0 References 13
ANNEXURES
I Estimation of emission from fixed roof tank 14
II Estimation of emission from floating roof tank 17
III Steps in Brief on US EPA Method 21 for monitoring fugitive emissions
19
IV Sample Calculation for Fugitive Emission Monitoring using Emission Rate Correlation Equation
21
V A Brief on Vapour Recovery systems 22
VI Sample calculation for emissions from loading operations
25
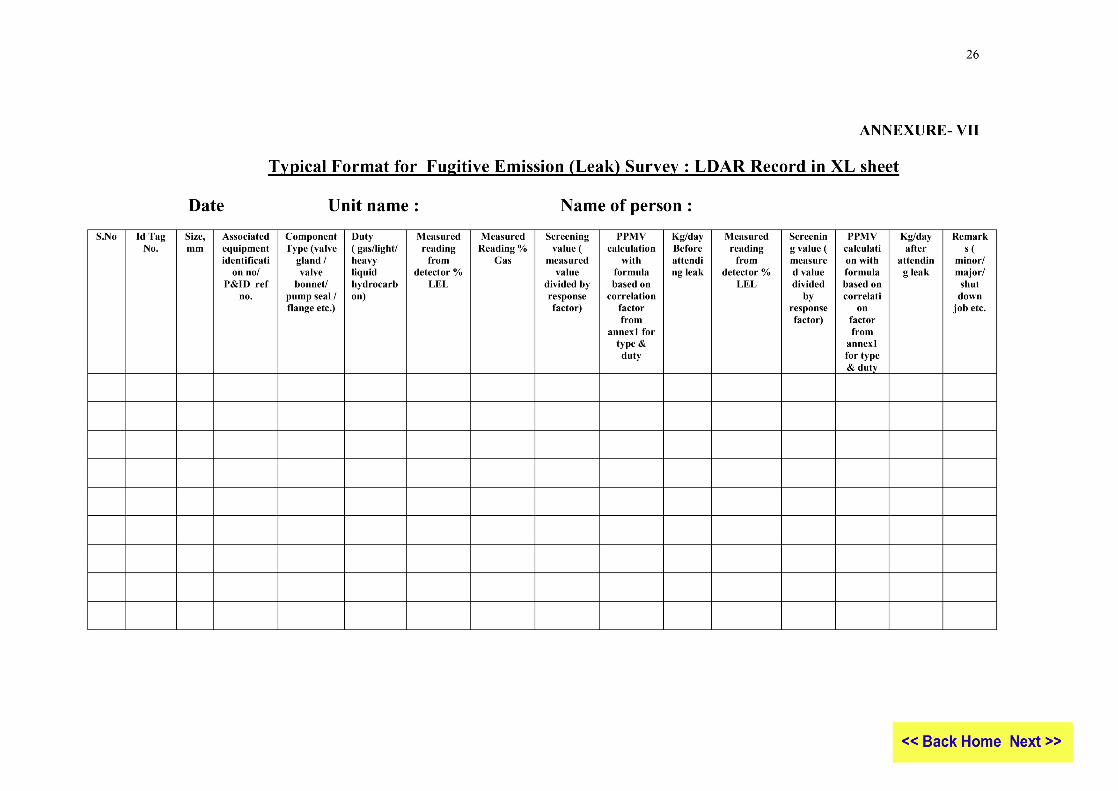
VII Typical Format for Fugitive Emission (Leak) Survey 26
_____________________________________________________________________
-v-
OISD-GDN-224 1
_______________________________________________________________________
“OISD hereby expressly disclaims any liability or responsibility for loss or damage resulting from the use of the OISD Standards/Guidelines/Recommended Practices”
Monitoring and Control of
Volatile Organic Compounds Emission
1.0 INTRODUCTION
Emission of Volatile Organic
Compounds (VOC) is an area of
significant concern. Refineries & gas
processing plants are major
contributors. Apart from causing
production loss, VOCs are partly
responsible for ground-level ozone,
which may affect normal functioning
of lungs. Many VOCs are toxic,
causing illnesses such as cancer,
neurological and respiratory diseases.
VOCs are present in crude oil and the
produced petroleum fractions viz.
LPG, motor spirit, kerosene, naphtha,
benzene, hexane, cyclohexane, fuel
gas etc. Volatile hydrocarbon vapours
get released to atmosphere from
storage, pumping, loading / unloading
and processing of crude & petroleum
products. However, fugitive emission
(leakage to atmosphere) of VOCs
usually occurs through seals of
equipment, wastewater collection &
treatment facilities, cold vents,
leakages etc. Actions taken in recent
years have shown substantial
reduction in VOC emission.
These guidelines include
identification of fugitive emission
sources alongwith quantification and
control techniques through design
measures, inspection, repair &
maintenance schedules,
administrative actions, reporting and
record keeping in a systematic
manner.
2.0 SCOPE
This document lays down guidelines
applicable for refineries and gas
processing plants, for identification
and control of fugitive VOC
emissions.

2
3.0 DEFINITIONS
3.1 VOLATILE ORGANIC COMPOUNDS
(VOC):
These are the organic compounds
whose vapour pressure at 20oC
exceeds 1.0 kPa (0.145 psi). As a
result, these can easily become
vapour or gas from the solid or liquid
state.
3.2 COMPONENT:
Equipment or accessories which
include pump seals, compressor seals,
seal oil degassing vents, flanges of
heat exchangers, pipeline valves,
flanges and other connections,
pressure relief devices, process
drains, open-ended pipes, sampling
connections etc. that could potentially
leak to emit VOCs into the
atmosphere.
3.3 FUGITIVE EMISSIONS:
Also known as “equipment leaks”,
the fugitive emissions are the result
of leaks of volatile organic
compounds from components as
above including the hydrocarbon
transfer lines and associated
equipment. Valves are usually the
single largest source of fugitive
emissions.
3.4 BACKGROUND CONCENTRATION
LEVEL:
It is the concentration of VOC
measured through the portable
hydrocarbon detection instrument
which is taken upwind (atleast three
metres) from any component to be
inspected (e.g. pump or compressor)
so that it is unaffected by any specific
emission point.
3.5 ESSENTIAL EQUIPMENT:
Any equipment in the process whose
outage from service will cause cut in
unit throughput by > 33%.
3.6 LEAK:
Gaseous hydrocarbon emission found
to be in excess of 10,000 ppm above
background concentration level,
when measured by a portable
hydrocarbon detector at a distance of
one (1) centimeter from the surface of
potential source with the instrument
calibrated with methane. However, in
case of Benzene, which is highly
carcinogenic, the leak is defined as
the emission value measured in

3
excess of 3000 ppm above the
background concentration level.
Regardless of concentration, a leak is
also identified by sight, sound or
smell at a component caused by
liquid dripping or vapour leak, which
is sometimes visible through bubbles
in presence of soap solution. The
dripping of liquid VOCs at a rate of
more than three (3) drops per minutes
can be construed as leak.
3.7 REFERENCE COMPOUND :
This is VOC used for instrument
calibration.
3.8 EMISSION CONTROL SYSTEM:
It is a combination of capture
system(s) and control equipment used
to recover, reduce, remove or control
the release of VOC to atmosphere.
Such equipment includes vapour
recovery system, compressor,
incineration system, flare system,
process heaters etc.
3.9 LEAK DETECTION AND REPAIR
(LDAR) :
It is a tracking programme to ensure
that all components are monitored on
regular basis and repaired in timely
manner to reduce/eliminate VOC
emissions from leaking components.
3.10 RESPONSE FACTORS (RF):
Response factor is required to provide
an accurate relationship while using
an analyzer calibrated for one gas to
measure leaks of other compounds.
The response factor is defined as
Concentration in actual = RF x
Concentration measured. A
response factor of 1.0 means the
instrument reads out identical to
actual concentration of chemical in
the gas sample.
3.11 EMISSIONS:
“VOC Emissions” shall hereinafter
be expressed as “Emissions” in this
document.
4.0 SOURCES OF EMISSIONS:
In oil and gas installations, probable
sources of emissions are as follows:
1. Process Vents, which are mostly
controlled.
2. Fugitive releases of hydrocarbon
vapour caused by leaks in process
equipment or evaporation from
open areas. These are the major
source of emission,which include:

4
a. Evaporative emission
sources viz hydrocarbon
storage & transfer facility
(loading/ unloading),
wastewater transfer &
treatment facility, cooling
tower, waste management
area e.g. oily sludge
lagoons, sludge pits, etc.
b. Process Equipment
Emission Sources viz
pumps, valves (from gland,
bonnets etc.), compressors,
pressure relief valves,
connectors and flanges,
agitators, open ended lines,
sampling connections.
4.1 EMISSIONS FROM STORAGE TANKS:
Emissions from fixed roof storage
tank include standing losses and
working losses. Standing losses occur
due to variation in ambient
temperature (thermal breathing).
Working losses occur during filling
operation.
Emissions from floating roof tanks
include standing losses and
withdrawal losses. The standing
losses occur from roof rim seals, deck
fittings, deck seams, still wells etc.
The withdrawal losses pertain to
evaporation loss of liquid stock that
clings to the shell, guide pole etc
while the stock is being pumped out.
Emissions from Pressurised storage
tanks (e.g. dome roof tanks or
nitrogen blanketed fixed roof tanks)
occur when their safety valves /
controlled vents discharge to
atmosphere. Similarly, emissions
from the other pressurized storages
(e.g. spheres & bullets) occur when
their safety valves/ controlled vents
discharge to atmosphere. In order to
minimize these discharges to
atmosphere, safety valves / vents of
horton spheres and bullets should
normally be connected to flare
header.
4.2 EMISSIONS FROM LOADING
FACILITIES:
Emission is significant during filling
of road tankers and rail wagons in
case of lighter products like
naphtha/gasoline.
4.3 EMISSIONS FROM EFFLUENT
TREATMENT FACILITIES:
Drainage routing from process units,
storage tanks, loading areas etc. to the
Effluent Treatment Plant (ETP)

5
through Oily Water Sewer (OWS)
involve considerable emission from
the open inlet chamber of ETP, API
oil separator, other open storages etc.
depending upon the oil content in the
influent streams and the temperature.
Recommended system for reduction
of emission from wastewater
treatment is to have a closed system
for contaminated and odorous
wastewater stream with provision of
water seals on sewers & drains and
gas tight covers on junction boxes.
4.4 EMISSIONS FROM COOLING
TOWERS:
Cooling towers, under normal
circumstances, do not contribute to
emissions. However, leakages in the
water cooled exchangers can lead to
hydrocarbon carryover to cooling
towers resulting in emissions.
Hydrocarbon detectors should be
provided at cooling tower return
stream from units.
4.5 EMISSIONS FROM OILY SLUDGE:
The main sources of generation of
oily sludge are tank cleaning, ETP,
oil catchers, API separators, and
spillages from bitumen plant, crude
oil and product storage tanks. For
API separators and oil catchers, oil
content and temperature have major
effect on emission. Sludge removed
from these sources and stored in open
pits, contributes to emissions in
significant quantity. Oil should be
removed from the oily sludge before
disposal. The residual sludge should
not have hydrocarbon content more
than 10% v/v.
4.6 EMISSIONS FROM PROCESS UNITS:
In process units, VOC emissions can
occur through leaks, vents, drains,
flanged joints, instrument
connections, PSVs open to
atmosphere, pump seals, compressor
seals, valve gland/ bonnet, sample
connections etc. These should be
minimised through an effective
LDAR programme. Significant
amount of emission can also occur
while preparing the equipment /
vessels for handing over to
maintenance for repairs or during
start up/ emergency shut down of the
unit. Such emissions should be
minimised by adopting standard
operational practices of emptying out
6
the equipment/vessel completely into
close blowdown system for
reprocessing instead of routing to
ETP via Oily Water Sewer.
5.0 ESTIMATION OF
EMISSIONS
Estimation of emissions from storage
tanks, loading facility and equipment
leaks can be done as described below:
5.1 ESTIMATION OF EMISSIONS FROM
STORAGE
Fixed Roof Tanks: Working losses
for the fixed roof tanks are
estimated on the basis of tank filling
rate. Standing losses from the fixed
roof tanks are estimated based on
thermal breathing from the tank.
See Annexure-I for guideline to
estimate annual average emission
loss of VOCs from a fixed roof
tank.
Floating Roof Tanks: The method
to determine annual average
emission loss of VOCs from
internal/ external floating roof tanks
is provided at Annexure-II.
Pressurised storage tanks and
vessels: Annual average emission
loss of VOCs for low-pressure
storage tanks (upto 2.5 psig) can be
estimated based on method
provided at Annexure-I. For high-
pressure storage tanks (2.5 to 15
psig) and vessels, the atmospheric
emissions are considered
insignificant with proper
maintenance measures in place.
5.2 ESTIMATION OF EMISSIONS FROM
LOADING FACILITIES:
Estimation of emissions from loading
gantries is done on the basis of
loading flow rates and the
concentration of the vapours emitted
from the vent nozzle of the tanker/
wagons. Typical parameters, which
should be collected for estimating
emissions from loading gantries,
include Product information (i.e.
name, vapour pressure, density,
composition, molecular weight of
vapour), number of loading points,
flow rate per loading point and
concentration of vapour being
emitted to atmosphere.
Emission rate from loading gantry
can be estimated using the following

7
equation (valid for bottom loading /
top submerged loading):
· Emissions from loading operation of Petroleum Liquids : (Reference AP-42 of EPA Chapter 5.2 )
LL = 12.46 SPM / T Where,
LL = Loading loss, lb per
1000 gal of liquid loaded
S = A saturation factor
P = True vapour pressure
of liquid loaded in psia
M = Molecular weight of
vapours , lb/lb-mole
T = Temperature of bulk
liquid loaded, 0R ( 0F + 460).
· Sample calculation is given in annexure VI.
5.3 ESTIMATION OF EMISSIONS FROM
EQUIPMENT LEAK
Emissions due to equipment leak (i.e.
valves, flanges, other connections,
pumps, compressors etc) should be
estimated using US EPA Method 21.
Procedural steps in brief alongwith a
typical example calculation are
illustrated in Annexure-III and
Annexure-IV respectively. The
instrument used for detection of VOC
leakage should be able to detect VOC
concentrations in parts per million
volume (ppmv) and % LEL in line
with leak definition concentration.
The instrument must be intrinsically
safe for use in the hazardous area of
the process units. Typical
specification of the instrument as per
EPA Reference method 21 are given
at Annexure-III.
6.0 PREVENTION & CONTROL
OF EMISSIONS
Two primary techniques of equipment
leak emission control are:
a. Equipment modification for
Emission Prevention (on case to
case basis, such as replacing
standard valve with seal less
type).
b. Implementing a regular and
structured leak detection and
repair programme (LDAR) for
Emission Control.
Equipment reliability improvement
is recommended on following lines:
i) Valves: Use of better quality of
packing, proper engineering
8
specifications, use of special
type of valves e.g. bellow type.
ii) Flanges: minimization of flange
connections in number, proper
rating & gasket material.
iii) Pumps: Provision of double
mechanical seals, other high
performance seals etc.
Compressors: Connecting the
packing vent of reciprocating
compressor preferably to the
flare system. Use of seals
permitting minimum gas
leakage, other high performance
seals, collection and safe routing
to Emission Control system.
iv) Safety Valves: Connecting to
flare.
v) Wastewater Treatment: Covered
processing and storage, pre-
treatment for toxics.
vi) Storage: Proper type of storage
and Seals, inclusion of Vapour
recovery system for fixed roof
tanks.
vii) Loading: Installing vapour
recovery system (See
Annexure-V for information on
typical VRS).
viii) Route the flushing from
sampling points preferably to
Closed Blowdown system.
7.0 CONTROL OF EMISSIONS
- BY LDAR
LDAR programme should be
implemented in three phases:
Components identification to
determine which of them requires to
be monitored, the same to be tagged
by using weatherproof tags.
Components may be identified from
P&ids and Unit inspection. Process
streams should be followed in logical
order to identify all potential leak
sources.
7.1 Monitoring potential fugitive
emission sources for leaks and
tagging the detected leaking
components.
7.2 Repair or replacement of leaking
component—first attempt at repair of
component within 5 days of leak
detection and final repair within 15
days. If the leaking component is
essentially required for sustaining the
process operations and cannot be
repaired within 15 days after

9
detection, one of the following
actions should follow:
i. Replace the leaking component and
inspect for leaks within 5 days after
detection.
ii. Vent out emissions to vapour
recovery system operating at 95%
efficiency (min) or to a flare.
iii. Plan for repair/replacement of the
essential component in the next
shutdown of the process unit but
within a reasonable time as per
management’s decision( say, one
year from the date of the original
leak). It should be accordingly
marked/tagged distinctly. Similarly,
a component which is not getting
isolated for repair, should be tagged
and short-listed for action in next
shutdown.
iv. After repair is done, the component
should be re-tested within 15 days
for the residual leak assessment.
A cost effective LDAR programme
should be developed by focusing
attention to locate very high leaking
points and repair them on priority.
Any deviations from schedule and
procedure should be identified and
corrected on monthly basis. Each leak
not detected remains unrepaired and
results in a lost opportunity to reduce
emissions from the installation. In
facilities, where contractors are
involved in implementation of LDAR
programme and test of leak including
first attempt at repair, internal quality
control should be ensured through
accountability for the LDAR
programme.
7.3 PROCEDURE FOR MONITORING
· The VOC analyzer should be
assembled and started in open and
clean atmosphere.
· The instrument should be
calibrated before use.
· Concentration of VOCs emitted
by the leaking component should
be checked at the surface interface
(e.g. at the interface between a
valve stem and packing).
· The probe inlet should be placed
at the surface of the component
interface where leakage could
10
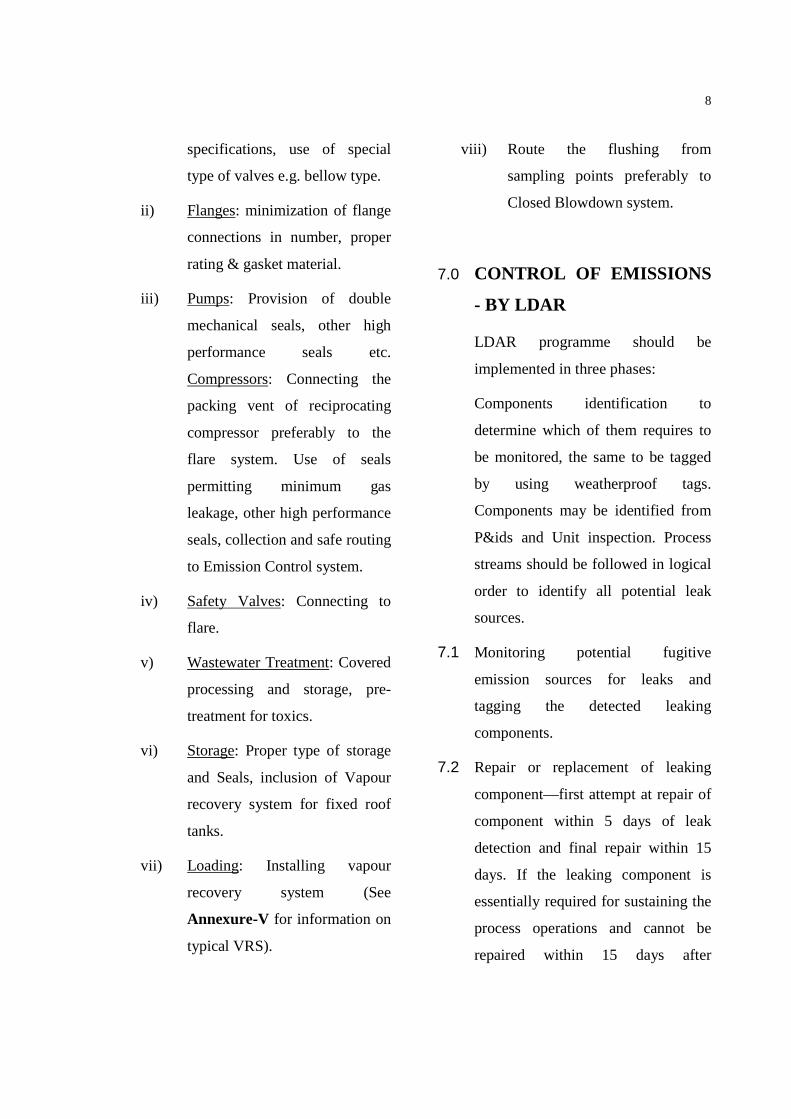
occur. It should then be moved
along the periphery while
observing the instrument readings.
The interface where leakage is
indicated should be sampled
slowly until the maximum meter
reading is obtained. Retain the
probe at this maximum observed
meter reading location for about
two times the instrument response
time. If the maximum observed
meter reading is greater than
the leak definition , record and
report the result.
Arrow shows location of monitoring
· Precautions :
o The probe of instrument should be about 1 cm from leaking interface.
o Tip of the probe should not touch greasy areas. It should always remain clean and through.
o Monitoring activities may be avoided during rain to protect the analyzer from bad weather.
o Well trained LDAR inspection personnel should be deployed.
o Target planning should be made with regard to number of components to be checked for leaks in a day or shift, based on the response time of the instrument.
· Calibration:
o Calibration frequency for the instrument should be as specified by the supplier.
· Frequency:
o Pumps seals, pipeline valves in liquid service, process drains should be monitored once in six months.
o Compressor seals, pipeline valves in gas service, pressure relief in gas service should be monitored quarterly (four times per year).
o Whenever liquid is observed dripping from a pump seal, the seal shall be checked immediately with portable

11
detector to determine if there is a leak of VOC taking place.
· Reporting :
Leak Survey Report should be
compiled in a structured format as
given in the Annexure-VI and
should be circulated to the
concerned sections viz.
Mechanical maintenance,
Operations/Process unit,
Instrument maintenance within
one working day of detection.
Reporting and regular follow up
will be done by responsible
personnel. The leaks which cannot
be repaired during operation, must
be tagged separately to attend
them during next shutdown of the
facility.
· Review and action
1. Follow up with concerned
plant officers
2. Ensure repeat survey after
attending the leaks
3. Review the record again and
communicate
4. Generate report for internal
circulation
5. Ensure co-ordination with
operating and maintenance
crew
The individual installation should
initiate LDAR programme with
collection of baseline data as the first
step forward. Further improvement
should be achieved through target
setting on continuous basis.
8.0 EMISSION PREVENTION
THROUGH IN-BUILT
FEATURES
8.1 RECOMMENDED FEATURES FOR
STORAGE TANK AREA
Emission should be reduced by
preferably using floating roof tanks.
8.1.1 For floating roof tanks reduction of
VOC emissions can be achieved by
following measures:
· Provide double rim seals,
primary as well as secondary,
for new tanks storing lighter
hydrocarbons e.g. MS, naphtha,
crude oil etc. Old tanks with
single seal should be provided
with secondary seal based on
engineering feasibility.

12
· Providing still well sleeve to
minimize emissions from still
well slots.
· Regular maintenance of rim
seal.
8.1.2 In case of fixed roof tanks, reduction
of VOC emissions can be achieved
by following measures:
· Convert existing fixed roof
tanks storing VOCs to floating
roof / fixed cum floating roof
tanks based on engineering
feasibility.
· Provide pressure vacuum relief
valve for small capacity tanks.
· Provide vapour balancing line,
where a group of tanks storing
same products exists.
· Provide tank vapour recovery
systems.
8.2 RECOMMENDED FEATURES FOR
LOADING / UNLOADING FACILITIES
The recommended measures include.
· Provide vapour balancing line to
storage tanks, if it is fixed roof
type.
· Providing vapour recovery
systems.
· Bottom loading of truck and top
submerged loading of rail
wagons, to reduces evaporation
losses.
8.3 VAPOUR RECOVERY SYSTEMS
Three types of vapour recovery units
(VRU) are normally in use with
minor variations. These are
Adsorption/ Absorption system,
Membrane Systems and Chiller
Systems. VRU is a part of vapour
recovery system which comprises of
vapour recovery arms (in case of
trucks/ tank wagons), piping, VRU,
safety instrumentation. On a case to
case basis, the vapour recovery
system may also include a knock out
drum and a blower. Typical sketch of
a vapour recovery system is included
at Annexure-V alongwith a brief
description.
9.0 RECOMMENDED
PRACTICES
1. Chronic or very high leaking
components should receive
appropriate attention through more
frequent surveys & repair.
Significant emissions reduction
13
could be achieved through repair at
appropriate periodicity.
2. Following LDAR programme,
loading arms/ valves/ hoses should
be checked with portable analysers.
3. Technological advancements
should be explored at reasonable
cost for quick detection of large
leaks.
4. Covered separation basins should be
adopted for Waste water treatment.
5. For storage of volatile products,
floating root tanks are used. Actual
Seal gaps for new and in-service
tanks should be monitored and
corrected within acceptable values
by regular maintenance to get the
best results. These are crucial for
actual VOC emissions from tanks.
6. The accuracy of leak detection
depends considerably on Operators’
skill, background concentration
level, response to different
chemicals and instrument accuracy/
calibration. Administrative initiative
should be taken to develop the
required proficiency for making
LDAR an effective and purposeful
programme on regular basis.
7. Water sealing should be ensured for
emergency drains of floating roof
tank.
10.0 REFERENCES:
1. API Publication Number 4612 on
Refinery Fugitive Emissions from
Equipment Leaks).
2. US EPA’s reference Method-21
regarding Determination of
Volatile Organic Compound
Leaks, CFR40, Part 60
3. US EPA-453, the Protocol for
Equipment Leak Emission
Estimates.
4. Charter on Corporate
Responsibility for Environmental
Protection from the Central
Pollution Control Board.
5. AP-42 of US Environmental
Protection Agency
6. Information on “VOC Emission &
LDAR Programme” available
from internet including TANKS-
4.0 software package developed
by US EPA.
14
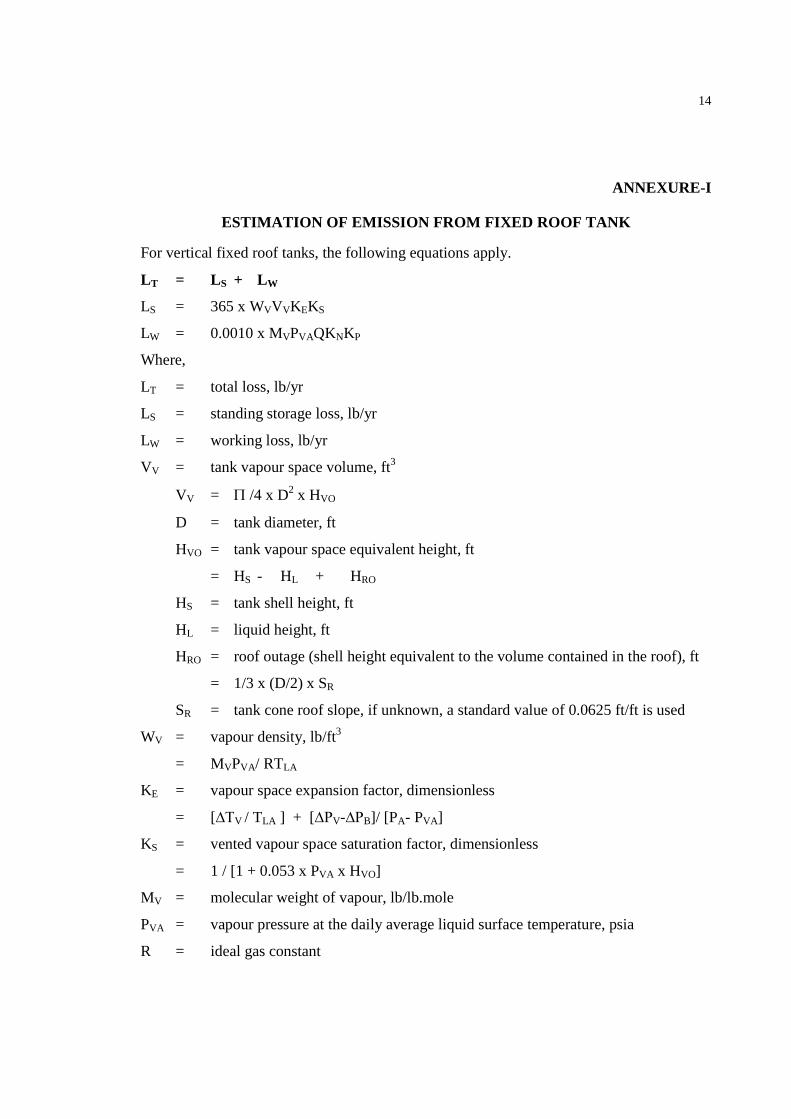
ANNEXURE-I
ESTIMATION OF EMISSION FROM FIXED ROOF TANK
For vertical fixed roof tanks, the following equations apply.
LT = LS + LW
LS = 365 x WVVVKEKS
LW = 0.0010 x MVPVAQKNKP
Where,
LT = total loss, lb/yr
LS = standing storage loss, lb/yr
LW = working loss, lb/yr
VV = tank vapour space volume, ft3
VV = P /4 x D2 x HVO
D = tank diameter, ft
HVO = tank vapour space equivalent height, ft
= HS - HL + HRO
HS = tank shell height, ft
HL = liquid height, ft
HRO = roof outage (shell height equivalent to the volume contained in the roof), ft
= 1/3 x (D/2) x SR
SR = tank cone roof slope, if unknown, a standard value of 0.0625 ft/ft is used
WV = vapour density, lb/ft3
= MVPVA/ RTLA
KE = vapour space expansion factor, dimensionless
= [∆TV / TLA ] + [∆PV-∆PB]/ [PA- PVA]
KS = vented vapour space saturation factor, dimensionless
= 1 / [1 + 0.053 x PVA x HVO]
MV = molecular weight of vapour, lb/lb.mole
PVA = vapour pressure at the daily average liquid surface temperature, psia
R = ideal gas constant
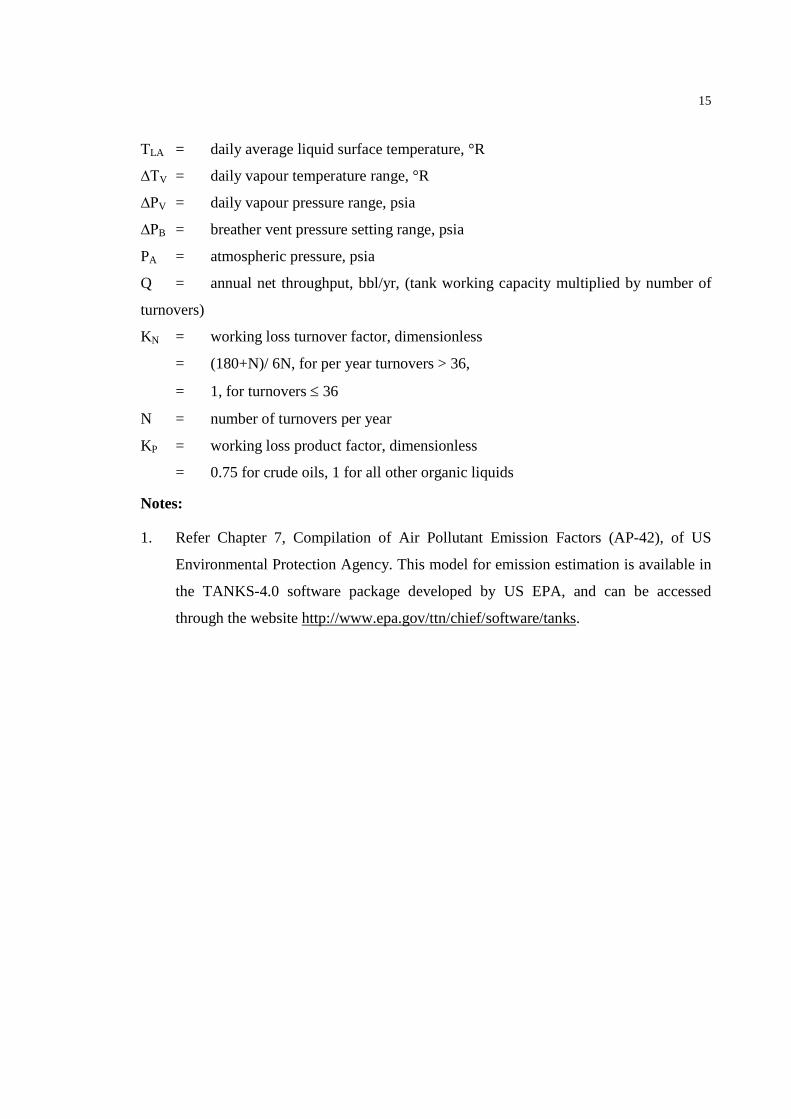
15
TLA = daily average liquid surface temperature, °R
∆TV = daily vapour temperature range, °R
∆PV = daily vapour pressure range, psia
∆PB = breather vent pressure setting range, psia
PA = atmospheric pressure, psia
Q = annual net throughput, bbl/yr, (tank working capacity multiplied by number of
turnovers)
KN = working loss turnover factor, dimensionless
= (180+N)/ 6N, for per year turnovers > 36,
= 1, for turnovers £ 36
N = number of turnovers per year
KP = working loss product factor, dimensionless
= 0.75 for crude oils, 1 for all other organic liquids
Notes:
1. Refer Chapter 7, Compilation of Air Pollutant Emission Factors (AP-42), of US
Environmental Protection Agency. This model for emission estimation is available in
the TANKS-4.0 software package developed by US EPA, and can be accessed
through the website http://www.epa.gov/ttn/chief/software/tanks.
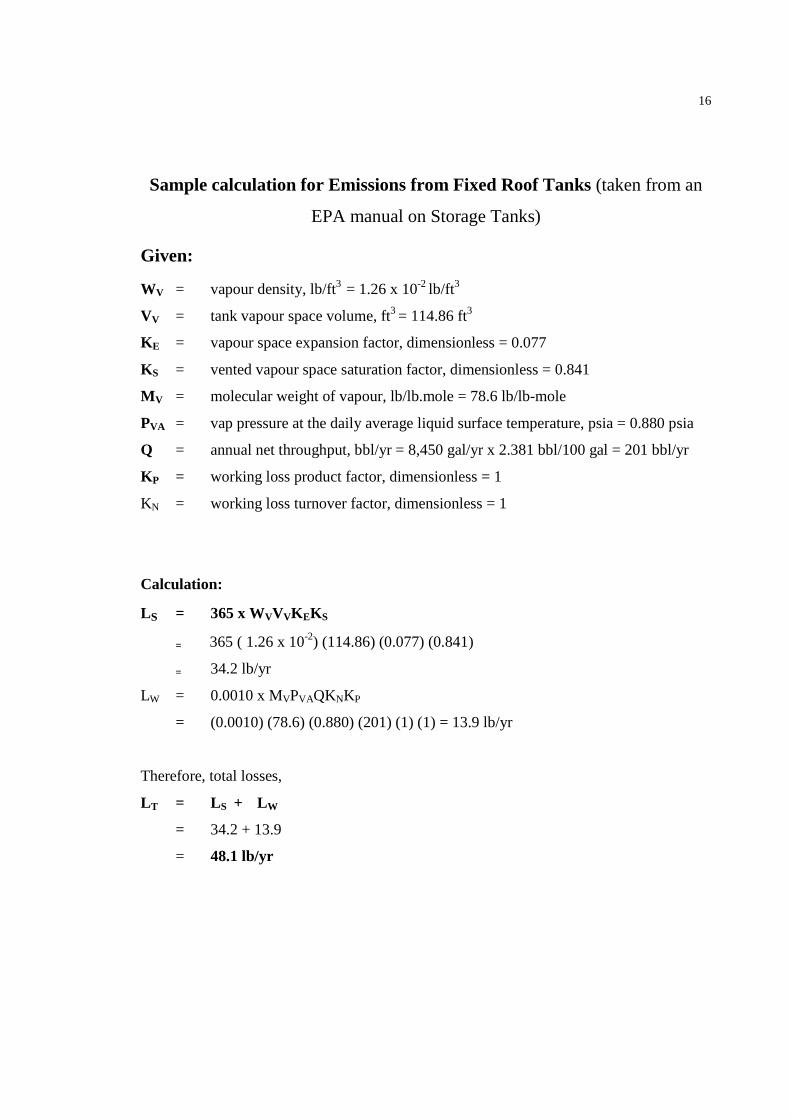
16
Sample calculation for Emissions from Fixed Roof Tanks (taken from an
EPA manual on Storage Tanks)
Given:
WV = vapour density, lb/ft3 = 1.26 x 10⁻² lb/ft3
VV = tank vapour space volume, ft3 = 114.86 ft3
KE = vapour space expansion factor, dimensionless = 0.077
KS = vented vapour space saturation factor, dimensionless = 0.841
MV = molecular weight of vapour, lb/lb.mole = 78.6 lb/lb-mole
PVA = vap pressure at the daily average liquid surface temperature, psia = 0.880 psia
Q = annual net throughput, bbl/yr = 8,450 gal/yr x 2.381 bbl/100 gal = 201 bbl/yr
KP = working loss product factor, dimensionless = 1
KN = working loss turnover factor, dimensionless = 1
Calculation:
LS = 365 x WVVVKEKS
= 365 ( 1.26 x 10⁻²) (114.86) (0.077) (0.841)
= 34.2 lb/yr
LW = 0.0010 x MVPVAQKNKP
= (0.0010) (78.6) (0.880) (201) (1) (1) = 13.9 lb/yr
Therefore, total losses,
LT = LS + LW
= 34.2 + 13.9
= 48.1 lb/yr
17
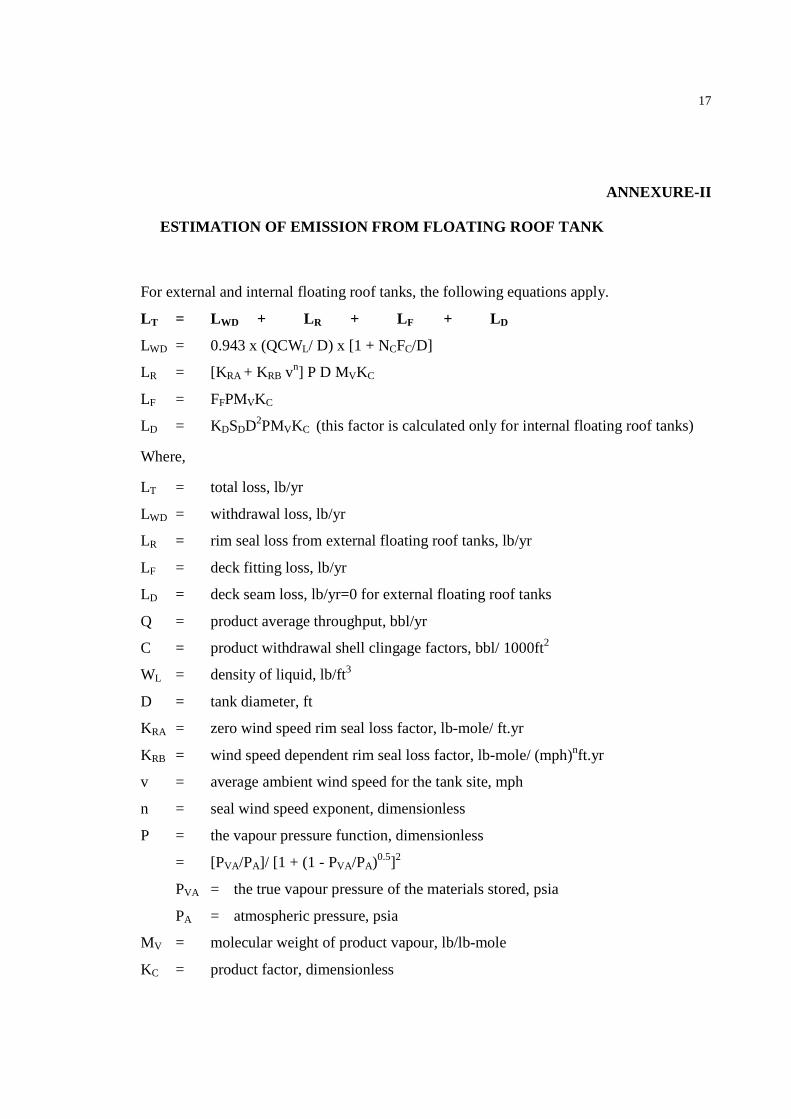
ANNEXURE-II
ESTIMATION OF EMISSION FROM FLOATING ROOF TANK
For external and internal floating roof tanks, the following equations apply.
LT = LWD + LR + LF + LD
LWD = 0.943 x (QCWL/ D) x [1 + NCFC/D]
LR = [KRA + KRB vn] P D MVKC
LF = FFPMVKC
LD = KDSDD2PMVKC (this factor is calculated only for internal floating roof tanks)
Where,
LT = total loss, lb/yr
LWD = withdrawal loss, lb/yr
LR = rim seal loss from external floating roof tanks, lb/yr
LF = deck fitting loss, lb/yr
LD = deck seam loss, lb/yr=0 for external floating roof tanks
Q = product average throughput, bbl/yr
C = product withdrawal shell clingage factors, bbl/ 1000ft2
WL = density of liquid, lb/ft3
D = tank diameter, ft
KRA = zero wind speed rim seal loss factor, lb-mole/ ft.yr
KRB = wind speed dependent rim seal loss factor, lb-mole/ (mph)nft.yr
v = average ambient wind speed for the tank site, mph
n = seal wind speed exponent, dimensionless
P = the vapour pressure function, dimensionless
= [PVA/PA]/ [1 + (1 - PVA/PA)0.5]2
PVA = the true vapour pressure of the materials stored, psia
PA = atmospheric pressure, psia
MV = molecular weight of product vapour, lb/lb-mole
KC = product factor, dimensionless

18
= 0.4 for crude oils; = 1 for all other organic liquids
FF = the total deck fitting loss factor, lb-mole/yr
= Si=1 to nf [NFiKFi]
NFi = number of fittings of a particular type for the specific tank under consideration
See Note-2 at the bottom of Annexure.
KFi = deck fitting loss factor for a particular type of fitting, lb-mole/yr. See Note-2 at
bottom of Annexure.
nf = number of different types of fittings
KD = deck seam loss per unit seam length factor, lb-mole/ft/yr
SD = deck seam length factor, ft/ft2
NC = number of fixed roof support columns (= 0 for self supporting fixed roof or
external floating roof)
FC = effective column diameter, ft (perimeter/ p)
Notes:
· Refer Chapter 7, Compilation of Air Pollutant Emission Factors (AP-42), of US
Environmental Protection Agency. This model for emission estimation is available in
the TANKS-4.0 software package developed by US EPA and can be accessed
through the website http://www.epa.gov/ttn/chief/software/tanks.
· For determination of various factors such as FF, C, KRA, KRB, KD, SD etc. refer tables /
values provided in the reference given at Note-1.

19
ANNEXURE-III
US EPA METHOD – 21 : STEPS IN BRIEF
1. This is the currently accepted regulatory method for monitoring of fugitive emissions.
2. Available emission-estimating co-relations were developed based on this method.
3. This technique is commonly called “sniffing”.
4. For non-moving components e.g. valves, flanges, connectors, readings are obtained by
placing the instrument probe at the surface of interface where the leakage could occur.
5. For moving components e.g. pumps, compressors etc., the probe is placed within one
centimeter of the interface. Probe should be perpendicular and tangential to the leak
interface. Probe should be moved along the entire leak interface to find the maximum
reading. It should be moved more slowly along those areas where leakage is indicated.
6. The probe inlet should be left at the location of the maximum reading for approx. two
times the instrument response time.
7. The “leak rate screening value” is the maximum concentration recorded by the
instrument.
8. Prior to commencing to monitor, the leak detector should be tested and calibrated
according to manufacturer’s instructions.
9. Initial calibration usually consists of setting the zero value and calibration gas value.
10. The calibration gas should be in the range of expected field instrument.
11. In cases where maximum exceeds instrument range, dilution probe adaptor may be used
to extend the range of instrument. The instrument should re-calibrated with dilution probe
using a reference gas.
20
Typical Specifications for the monitoring instrument ( as per EPA Reference method 21
given in API Publication Number 4612 on Refinery Fugitive Emissions from Equipment
Leaks):
· Analyzer response factor less than 10
· Analyzer response time less than, equal to 30 seconds
· Calibration precision less than, equal to 10% of calibration gas value
· Internal pump capable to pulling point 0.1 to 3.0 liters per minute
· Intrinsically safe
· Single hole probe with maximum ¼ inch outer diameter
· Both, the linear response range and the measurable range of the instrument are in line
with the leak definition
· Instrument should be readable to +/- 2.5% of specified leak definition concentration –
e.g. 0-10,000 ppmv)
· No detectable emission value defined as + / - 2.5 % of leak definition (i.e. +/- 500
ppm)
· It should be able to respond to the compounds being processed.

21
ANNEXURE-IV
Sample Calculation for Fugitive Emission Monitoring
Using Emission Rate Correlation Equation
Based on industry experience, certain correlations have been developed for calculation of the
emissions utilizing meter readings of the portable gas detector, calibrated on methane gas.
These correlations (a list given in the table below) depend on the services (such as vapour, light
liquid etc.) and the type of the component tested (e.g. flange, open-end drain, pump seal, valve
gland etc.).
COMPONENT TYPE
SERVICE CORRELATION #
Valve Light liquid ( vap pr. > 0.3 kPa (3.84 x 10⁻⁵) x (ppmv)0.74
Valves Gas/ Vapour (9.81 x 10⁻⁷) x (ppmv)1.14 Valves Hydrogen (1.77 x 10⁻⁶) x (ppmv)0.98 Pumps Light Liquid (2.22 x 10⁻⁴) x (ppmv)0.77 Pumps Heavy Liquid (3.13 x 10⁻⁵) x (ppmv)0.97 Compressors Hydrocarbon (2.28 x 10⁻⁴) x (ppm)0.77 Compressors Hyd-rogen (1.77 x 10⁻⁶) x (ppmv)0.98 Safety relief Valves All (2.28 x 10⁻⁴) x (ppmv)0.77 Flanges All (1.7 x 10⁻⁵) x (ppmv)0.82 Drains All (1.43 x 10⁻⁴) x (ppmv)1.02 # Reference US EPA
1. Assumption: A flange leak
2. Instrument calibration basis: 1% LEL = 500 ppmv ( based on methane)
3. Instrument Reading assumed: indicating 20% LEL value on instrument
4. Equivalent LEL in ppmv: 500 ppmv x 20 = 10,000 ppmv
5. Calculation using correlation for flange leak: (from the above table)
Emission , kg/hr/source = (1.7 x 10⁻⁵) x (measured in ppmv x R.F.)0.82
= (1.7 x 10-5) x (10,000)0.82 (R.F. factor assumed 1.0)
= 0.0324 kg/hr = 0.77 kg/day
22
ANNEXURE-V
A BRIEF ON VAPOUR RECOVERY SYSTEMS
A vapour recovery system (VRS) comprises vapour collection piping, which is routed to
a vapour recovery unit (VRU). The VRU can be of various types, viz. Adsorption/
Absorption system, membrane system, vent condenser system or combination of these
technologies. A VRS may necessitate a blower for pushing the vapours to the VRU or an
intermediate vessel depending on case to case. A brief description of the VRU
technologies is given below.
Adsorption/ Absorption system
In this process, the air vapour mixture from which hydrocarbons are to be recovered is
passed through activated carbon bed. HC vapours from the mixture are adsorbed in the
bed, whereas remaining gases (mostly O2 and N2) are vented to atmosphere. Normally,
two beds are provided. One of the beds is in adsorption mode while the other is in
regeneration mode. Regeneration of carbon bed is accomplished with a combination of
high vacuum (about 90 % vacuum) and purge air/ steam stripping. Vacuum is pulled
using Liquid Ring Vacuum Pump (LRVP). Some of hydrocarbon vapours which get
desorbed due to reduction of pressure, condense in the vacuum pump itself. The multi-
phase mixture from the vacuum pump is routed to a three phase separator where three
phases (uncondensed vapours, seal fluid of the LRVP and the condensed hydrocarbon)
are separated. Non-condensed vapours are then passed through an absorption tower
where they are absorbed in a stream of cold absorbent. Normally, the same hydrocarbon
liquid whose vapour is being recovered is used as an absorbent at lower temperatures.
The recovered hydrocarbons are recycled as slop oil for further processing. Monitoring
is done at vent.

23
Membrane system
In this process, the air vapour mixture is drawn into the system using a compressor. The
type of compressor is normally a Liquid Ring Compressor. A part of the hydrocarbons
are condensed inside the compressor. The multi-phase mixture at the compressor outlet
is routed to a scrubber. Inside the scrubber, vapours are separated from liquid and are
further absorbed in cold absorbent liquid which is sprayed from the top. Vapours from
the scrubber are then routed to the membrane separation unit. A vacuum is maintained
on the other side of the membrane. This creates a pressure difference across the
membrane causing the hydrocarbon vapours to preferentially pass through the
membrane. The permeate stream rich with HC is recycled back to the suction of inlet
compressor and is recovered in the scrubber. The clean residual stream(offgas) with
negligible amount of hydrocarbons is released to atmosphere. With this process, the
hydrocarbon concentration in offgas can be reduced to 2-3 gm/m3. In case, the pollutant
content in the emissions is to be reduced further, this stream can be routed to a PSA
system.
Vent condensers with chiller unit
In this process, the air plus vapour mixture is initially cooled to about 2 to –10°C in
pre-coolers. At this temperature, bulk of moisture and a small amount of VOCs
condense and is separated out. Uncondensed vapours are further cooled to –30 to –
37°C. At this temperature about 85 to 95 % of the vapours condense and are separated
out. Remaining non-condensable gases, which mostly contain air and a small amount
of hydrocarbons are either incinerated or routed to an engine generator to generate
power. A chiller package is provided with the system, which provides required
refrigeration duty to the coolers.
Certain variation of these three technologies alongwith supplementary processes are
also being offered by specialized vendors.. Simplified sketch of a vapour recovery
system is as follows:

24
TRUCK TANKER
VOCs
V
SDV
TO ATM.
VAPOUR RECOVERY SYSTEM
RAIL WAGONS RECOVERED
LIQUID TO TANK
VENT GASES
TYPICAL VOC RECOVERY SCHEME FOR LOADING GANTRY

25
ANNEXURE-VI
Sample calculation for Emissions from the Loading Operations
Loading losses (LL) from a gasoline tank truck in dedicated vapor balance service and practicing vapor recovery would be calculated as follows, using Equation 1:
Design basis –
Tank truck volume is 8000 gal
Gasoline Reid vapor pressure (RVP) is 9 psia
Product temperature is 800 F
Vapor recovery efficiency is 95 percent
Vapor collection efficiency is 90 percent (for vessels passing annual leak test)
Loading loss equation –
LL = 12.46 (SPM / T) (1-eff)/100
Where :
S = saturation factor ( refer table in AP 42 chapter 5.2) = 1.0
P = true vapor pressure of gasoline (see Figure 7.1-6) = 6.6 psia
M= molecular weight of gasoline vapors (see Table 7.1-2) =66
T = temperature of gasoline = 5400 R
EFF = overall reduction efficiency (95 percent control x 90 percent collection ) = 85 percent
LL = 12.46 (1.00) (6.6) (66)/540 1 – 85 / 100
= 1.5 lb /103 gal
Total loading losses are :
(1.5 lb/103 gal (8.0 x 10³ gal ) = 12 lb