OILSEEDS and PROTEIN CROPS market situation · OILSEEDS and PROTEIN CROPS market situation...
36
OILSEEDS and PROTEIN CROPS market situation Committee for the Common Organisation of Agricultural Markets 25 October 2017
Transcript of OILSEEDS and PROTEIN CROPS market situation · OILSEEDS and PROTEIN CROPS market situation...

OILSEEDS and PROTEIN CROPS market situation
Committee for the Common Organisation
of Agricultural Markets
25 October 2017

World Oilseeds Production
EU oilseeds & protein crops areas & production (2017/18)
ANNEX
EU oilseeds balance sheets (seeds, meals & oils)
Content

World Oilseeds Market

World oilseeds - production
Source: USDA
476
573577
0
100
200
300
400
500
600
700
0
50
100
150
200
250
300
350
400
2012/13 2013/14 2014/15 2015/16 2016/17(est)
2017/18(fcst)
ALL
(mili
ion
to
nn
es)
Sun
, ra
pe
& s
oy
(mill
ion
to
nn
es)
Sunflower Rapeseed Soybeans All (7 crops)
m/m forecast changes
Oilseeds ↓
Soybeans ↓
Rapeseed ↓
Sunflower ↓

0.00
50.00
100.00
150.00
200.00
250.00
300.00
350.00
400.00
Soybean Rapeseed Sunflowerseed Cottonseed Peanut Other
Mill
ion t
onnes
2012/13 2013/14 2014/15 2015/16 2016/17 2017/18Source : USDA (October 2017)
Oilseeds world production million
tonnes
5 years
averagelast MY
current
forecast
previous
forecast
% vs
average
% vs
last MY
% vs
last
forecast
Copra 5.5 5.4 5.5 5.5 1.6 2.4 0.0
Cottonseed 42.1 39.0 44.3 44.1 5.2 13.5 0.4
Palm kernel 16.1 16.8 18.0 18.0 12.3 7.4 0.0
Peanut 41.2 42.6 43.0 42.9 4.2 0.9 0.2
Rapeseed 69.5 70.3 71.9 72.1 3.4 2.2 -0.4
Soybean 307.2 351.3 347.9 348.4 13.2 -1.0 -0.2
Sunflowerseed 40.7 47.6 46.3 47.4 13.8 -2.6 -2.2
Oilseeds 522.3 573.1 577.0 578.6 10.5 0.7 -0.3

0
20
40
60
80
100
120
140
USA Brazil Argentina China India Paraguay Canada
Mill
ion
tonn
es
2013/ 14 2014/15 2015/16 2016/17 2017/ 18Source : USDA (October 2017)
Soybeans world production by country
million
tonnes
5 years
averagelast MY
current
forecast
previous
forecast
% vs
last
forecast
% vs
last MY
% vs
average
USA 101.0 116.9 120.6 120.6 0.0 3.1 19.4
Brazil 95.3 114.1 107.0 107.0 0.0 -6.2 12.3
Argentina 55.7 57.8 57.0 57.0 0.0 -1.4 2.3
China 12.4 12.9 14.2 14.0 1.4 10.1 14.9
India 9.8 11.5 10.0 10.0 0.0 -13.0 2.5
Paraguay 8.9 10.7 9.4 9.4 0.0 -11.9 5.8
Canada 5.9 6.5 8.2 8.2 0.0 26.9 39.8
World 323.1 347.9 347.9 348.4 -0.2 0.0 7.7

Rapeseed world production by country
0.000
5.000
10.000
15.000
20.000
25.000
EU28 Canada China India Australia
Mill
ion
tonn
es
2013/14 2014/15 2015/16 2016/17 2017/18 (fcast)Source : USDA (October 2017)
million
tonnes
5 years
averagelast MY
current
forecast
previous
forecast
% vs
last
forecast
% vs
last MY
% vs
average
EU 28 21.6 20.5 22.0 22.0 0.2 7.1 1.9
Canada 17.4 19.6 19.9 19.9 0.0 1.5 14.6
China 14.3 13.5 13.1 13.1 0.0 -3.0 -8.6
India 6.3 7.1 7.2 7.2 0.0 1.5 14.0
Australia 3.7 4.1 3.0 3.0 0.0 -27.4 -18.6
World 69.5 70.3 71.9 72.1 -0.4 2.2 3.5

Sunflowerseed world production by country
0.000
2.000
4.000
6.000
8.000
10.000
12.000
14.000
16.000
Ukraine Russia EU28 Argentina China
Mill
ion
tonn
es
2013/14 2014/15 2015/16 2016/17 2017/18 (fcast)Source : USDA (October 2017)
million
tonnes
5 years
averagelast MY
current
forecast
previous
forecast
% vs
last
forecast
% vs
last MY
% vs
average
Ukraine 11.6 15.2 13.5 14.0 -3.6 -11.2 16.6
Russia 9.1 10.9 11.0 11.5 -4.3 1.3 20.2
EU28 8.3 8.6 8.5 8.5 0.0 -0.9 2.6
Argentina 2.9 3.4 4.0 4.0 0.0 17.6 38.6
China 2.5 2.8 2.9 2.8 1.8 1.8 11.9
World 40.7 47.6 46.3 47.4 -2.2 -2.6 13.8

43
60
70
5457
62
78 78
95 96
4 4 6 5 4 35 5
812
212
261 264
240
269
283
320
314
351348
221
238
252
258
261275
302
314
330
344
40
95
150
206
261
316
0
25
50
75
100
125
2008 2009 2010 2011 2012 2013 2014 2015 2016est.
2017proj.
mill
ion to
nne
s
mill
ion to
nne
s
World… of which US World Production World Consumption
Source: USDA October
Soybeans world production, consumption and stocks

Soybeans production forecast by country
-10
10
30
50
70
90
110
130
2012/13 2013/14 2014/15 2015/16 2016/17 2017/18May 2017
2017/18June 2017
2017/18July 2017
2017/18Aug 2017
2017/18Sept 2017
2017/18October 2017
'mill
ion
to
nn
es
USA
Brazil
Argentina
China
CAN - Paraguay - India
2017/18

Rapeseed production forecast by country
4.135
3.000
0
5
10
15
20
25
30
2011/12 2012/13 2013/14 2014/15 2015/16 2016/17 2017/18May 2017
2017/18June 2017
2017/18July 2017
2017/18Aug 2017
2017/18Sept 2017
2017/18October 2018
mill
ion
to
nn
es
EU 28
Canada
China
India
2017/18

Sunflowerseed production forecast by country
0
2
4
6
8
10
12
14
16
2012/13 2013/14 2014/15 2015/16 2016/17 2017/18May 2017
2017/18June 2017
2017/18July 2017
2017/18August 2017
2017/18Sept 2017
2017/18Oct 2017
mill
ion
to
nn
es
EU 28
Russia
Argentina
Ukraine
2017/18
China

Global oilseeds production: key messages
Total oilseeds
Slightly revised down (-2m t m/m); still record production forecast (577m t; +11% vs 5 year average).
Soyabeans
• Forecast slightly adjusted m/m; second highest production (348m t; +8% vs 5 year average)
• US production at record level (121m t; harvest ongoing)
• Production in South America lower y/y (plantings ongoing)
Rapeseed
• Slightly revised down but still record level production (72m t; +5% vs 5 year average)
• No change m/m for the main producing countries
Sunflower
• Decrease of 1m t m/m; global production close to record (47m t; +14% vs 5 year average)
• Decrease in UKR and RU (-4% m/m) but production still higher than average (+17% and +20%)

World oilseeds – export prices (fob)
377
426
386
340
380
420
460
Oct-16 Jan-17 Apr-17 Jul-17 Oct-17
$/t Oilseeds- monthly average
Soy (US) Rape (EU) Sun (EU)
€/t $/t €/t $/t €/t $/t Argentina - Up River 323 380 2% 1% -8% -2%
Brazil - Paranagua 331 389 3% 1% -13% -7%
US Gulf 323 380 2% 0% -8% -2%
Ukraine 305 359 4% 3% -12% -6%
Australia 382 449 -2% -3% -6% 0%
Canada 358 421 0% -2% -2% 5%
EU (Rouen) 361 425 -1% -3% -10% -3%
Ukraine 364 428 2% 0% 3% 1%
EU (Bordeaux) 328 385 0% -2% -11% -4%
Ukraine 315 370 2% 0% -12% -5%
Export prices FOB17 Oct 2017 m/m variation y/y variation
soybeans
sunflower
rapeseed

Futures prices
320
330
340
350
360
370
380
0
100
200
300
400
500
600
Daily
tra
ded v
olu
me (
1000 c
ontr
acts
of 136 t
$/t
Soybeans CME (60 days - $/t) Rapeseed MATIF (60 days - EUR/t)
330
335
340
345
350
355
360
365
370
375
380
0
4
8
12
16
20
24
28
€/t
Daily
tra
ded v
olu
me (
1000 c
ontr
acts
of 50 t)
IGC
AUG'17: 364
NOV'17: 365
AUG'18: 368
AUG'17: 368
MAY'18: 375
AUG'18: 357

Oilseeds / cereals price ratio
1.0
1.6
2.2
2.8
3.4
4.0
01/01/08 01/01/09 01/01/10 01/01/11 01/01/12 01/01/13 01/01/14 01/01/15 01/01/16 01/01/17
US soybean - maize price ratio (CBOT)18/10/2017: 2.82
EU rapeseed - wheat price ratio (MATIF)18/10/2017: 2.26

Global oilseeds prices: key messages
Moderate volitility over the last month for the three oilseeds
Pressure on prices:
Ample world supplies
Confortable stocks level (even if US stock decreased to 11.2m t)
Support on prices:
Strong world demand
Weather concerns - uncertainties about plantings in South America
(ARG – too wet; BZ: too dry)
y/y price evolution : soy and sunflower cheaper & rapeseed stable (however more expensive in Canada)

Oilseeds and protein crops
at EU level

EU Oilseeds EU OILSEEDS AREA
AVG 5 yrs 2016/17 2017/18 2017/18 %change %change
Million ha trimmed September 2017 October 2017 2016/17 5yrs trimmed
Rapeseed 6.6 6.5 6.81 6.78 3.6 3.2
Sunflower 4.3 4.2 4.35 4.30 3.7 1.1
Soja 0.6 0.8 0.93 0.92 11.2 48.5
Linseed 0.1 0.1 0.07 0.07 -19.9 4.2
TOTAL 11.5 11.6 12.16 12.07 4.0 4.8
Sources : DG AGRI G.4
EU OILSEEDS PRODUCTION
AVG 5 yrs 2016/17 2017/18 2017/18 %change %change
Million tonnes trimmed September 2017 October 2017 2016/17 5yrs trimmed
Rapeseed 21.0 20.1 22.3 22.3 10.9 6.3
Sunflower 8.5 8.5 9.2 9.0 6.4 5.5
Soja 1.8 2.5 2.7 2.7 7.9 48.6
Linseed 0.1 0.1 0.1 0.1 1.8 7.4
TOTAL 31.4 31.2 34.3 34.1 9.4 8.5
Sources : DG AGRI G.4

EU Rapeseed

EU Rapeseed RapeseedProduction AVG 5 yrs 2016/17 2017/18 2017/18 %change %change
Million tonnes trimmed September 2017 October 2017 2016/17 5yrs trimmed
TOTAL EU 20.96 20.10 22.29 22.29 10.9 6.3
France 5.18 4.74 5.48 5.51 16.3 6.5
Germany 5.21 4.58 4.71 4.71 2.8 -9.6
Poland 2.53 2.22 2.66 2.66 19.9 5.1
UK 2.38 1.78 1.89 1.89 6.6 -20.4
Czech Republic 1.35 1.36 1.25 1.25 -8.0 -7.6
Romania 0.88 1.34 1.58 1.68 26.1 91.0
Others 3.44 4.09 4.71 4.58 12.1 33.4
Sources : DG AGRI G.4

EU Sunflower

EU Sunflower
SunflowerProduction AVG 5 yrs 2016/17 2017/18 2017/18 %change %change
Million tonnes trimmed September 2017 October 2017 2016/17 5yrs trimmed
TOTAL EU 8.54 8.46 9.16 9.00 6.4 5.5
Romania 1.96 1.95 2.41 2.25 15.1 14.7
Bulgaria 1.82 1.80 1.90 1.90 5.3 3.9
Spain 0.81 0.71 0.77 0.77 7.5 -5.5
France 1.44 1.08 1.25 1.30 20.4 -10.0
Hungary 1.55 1.89 1.93 1.87 -1.2 21.0
Others 0.95 1.03 0.91 0.93 -9.7 -2.8
Sources : DG AGRI G.4

EU Soybeans

EU Soybeans SoyaProduction AVG 5 yrs 2016/17 2017/18 2017/18 %change %change
Million tonnes trimmed September 2017 October 2017 2016/17 5yrs trimmed
TOTAL EU 1.81 2.49 2.70 2.69 7.9 48.6
Italy 0.88 1.08 1.08 1.08 0.2 23.2
Romania 0.20 0.26 0.42 0.42 61.6 106.6
France 0.22 0.36 0.40 0.40 12.6 81.2
Croatia 0.15 0.24 0.21 0.21 -10.1 46.7
Hungary 0.11 0.18 0.19 0.16 -10.7 42.7
Austria 0.12 0.15 0.17 0.17 9.8 40.2
Others 0.12 0.21 0.21 0.23 8.2 92.2
Sources : DG AGRI G.4

Key messages - oilseeds
2017/18 production of oilseeds at high level
m/m : slight revision down at 34.1m t (reduction for rapeseed, soya and sunflower)
y/y : +9% (better yields and higher area) five year average: +9%
Crops
Rapeseed at 22.3m t (+11% y/y) – second highest level
m/m: FR, RO ↗ HU, SE ↘
Sunflower at 9.0m t (+6 % y/y) – close to record level
m/m: FR ↗ HU, RO ↘
Soyabeans at 2.7m t (+8% y/y) – record level m/m: RO ↗ HU ↘

EU Protein crops EU PROTEIN CROPS AREA
AVG 5 yrs 2016/17 2017/18 2017/18 %change %change
Million ha trimmed September 2017 October 2017 2016/17 5yrs trimmed
Field peas 0.6 0.9 1.0 1.0 10.1 68.6
Broad beans 0.5 0.7 0.7 0.7 2.3 46.1
Sweet lupins 0.1 0.2 0.2 0.2 1.2 38.3
TOTAL 1.2 1.8 1.9 1.9 6.2 56.6
Sources : DG AGRI G.4
EU PROTEIN CROPS PRODUCTION
AVG 5 yrs 2016/17 2017/18 2017/18 %change %change
Million tonnes trimmed September 2017 October 2017 2016/17 5yrs trimmed
Field peas 1.6 2.3 2.8 2.9 27.2 81.8
Broad beans 1.4 1.9 2.1 2.1 10.6 51.1
Sweet lupins 0.2 0.3 0.3 0.3 1.5 35.3
TOTAL 3.2 4.4 5.2 5.3 18.5 65.3
Sources : DG AGRI G.4

EU Protein crops

Key messages – protein crops
Since 2013
Protein crops : + 114 %
Soybeans : + 121 %
Four crops: + 116 % (Max in 1998 – 8 mt)
6.4
5.3
1.12.7
7.58.0 7.9
0
1
2
3
4
5
6
7
8
9
Mill
ion
to
nn
es
EU Protein crops & soybeans production
soyabeans
peas, beans, lupins
ALL

EU prices for
oilseeds and protein crops ?

EU prices
361 EUR/t
328 EUR/t
300
320
340
360
380
400
420
440
460
EUR
/ t
EU (France) Rapeseed and Sunflower export prices (fob)
Rapeseed
Sunflower
source: IGCsource: IGC

EU 28 S&D balance sheets
seeds/beans, oils and meals
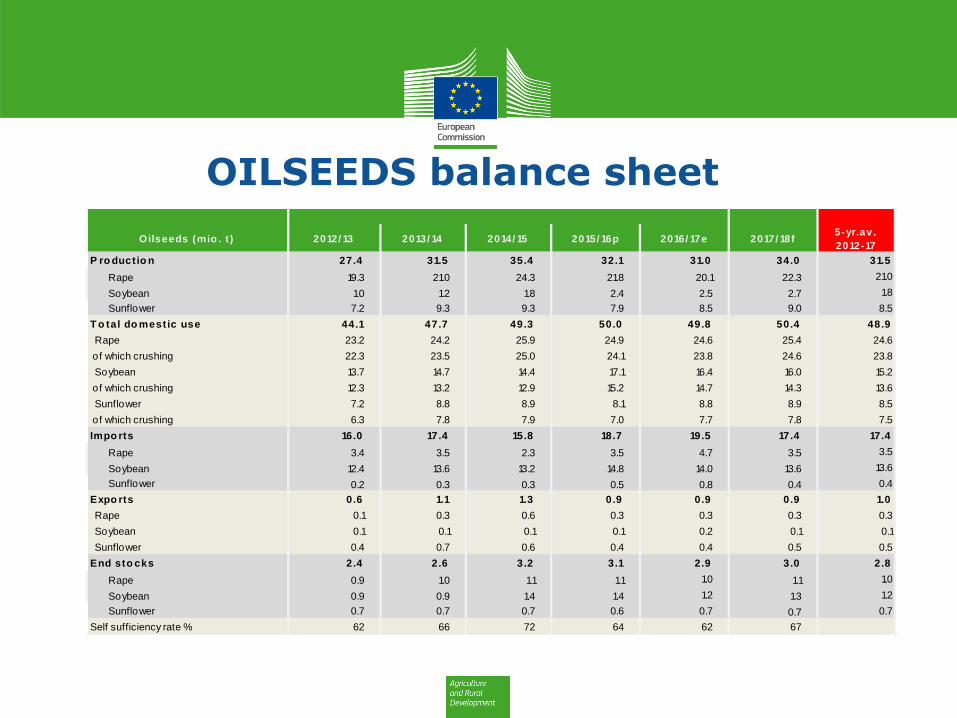
OILSEEDS balance sheet
Oilseeds (mio . t ) 2012/ 13 2013/ 14 2014/ 15 2015/ 16p 2016/ 17e 2017/ 18f5-yr.av.
2012-17
P ro ductio n 27.4 31.5 35.4 32.1 31.0 34.0 31.5
Rape 19.3 21.0 24.3 21.8 20.1 22.3 21.0
Soybean 1.0 1.2 1.8 2.4 2.5 2.7 1.8
Sunflower 7.2 9.3 9.3 7.9 8.5 9.0 8.5
T o tal do mestic use 44.1 47.7 49.3 50.0 49.8 50.4 48.9
Rape 23.2 24.2 25.9 24.9 24.6 25.4 24.6
of which crushing 22.3 23.5 25.0 24.1 23.8 24.6 23.8
Soybean 13.7 14.7 14.4 17.1 16.4 16.0 15.2
of which crushing 12.3 13.2 12.9 15.2 14.7 14.3 13.6
Sunflower 7.2 8.8 8.9 8.1 8.8 8.9 8.5
of which crushing 6.3 7.8 7.9 7.0 7.7 7.8 7.5
Impo rts 16.0 17.4 15.8 18.7 19.5 17.4 17.4
Rape 3.4 3.5 2.3 3.5 4.7 3.5 3.5
Soybean 12.4 13.6 13.2 14.8 14.0 13.6 13.6
Sunflower 0.2 0.3 0.3 0.5 0.8 0.4 0.4
Expo rts 0.6 1.1 1.3 0.9 0.9 0.9 1.0
Rape 0.1 0.3 0.6 0.3 0.3 0.3 0.3
Soybean 0.1 0.1 0.1 0.1 0.2 0.1 0.1
Sunflower 0.4 0.7 0.6 0.4 0.4 0.5 0.5
End sto cks 2.4 2.6 3.2 3.1 2.9 3.0 2.8
Rape 0.9 1.0 1.1 1.1 1.0 1.1 1.0
Soybean 0.9 0.9 1.4 1.4 1.2 1.3 1.2
Sunflower 0.7 0.7 0.7 0.6 0.7 0.7 0.7
Self sufficiency rate % 62 66 72 64 62 67

OILSEEDS MEALS balance sheet
M eals (mio . t ) 2012/ 13 2013/ 14 2014/ 15 2015/ 16p 2016/ 17e 2017/ 18f5-yr.av.
2012-17
P ro ductio n 25.9 28.1 28.8 29.6 29.4 29.6 28.8
Rape 12.7 13.4 14.3 13.7 13.6 14.0 13.6
Soybean 9.7 10.4 10.2 12.0 11.6 11.3 10.7
Sunflower 3.4 4.3 4.4 3.9 4.3 4.3 4.1
T o tal do mestic use 45.9 49.4 50.0 52.4 50.6 50.9 50.0
Rape 12.8 13.5 14.3 13.7 13.3 14.0 13.5
Soybean 26.0 28.7 28.4 31.9 29.7 29.4 28.9
Sunflower 7.1 7.2 7.3 6.9 7.6 7.5 7.2
Impo rts 21.1 22.0 22.3 23.8 22.2 22.3 22.2
Rape 0.4 0.5 0.5 0.4 0.2 0.4 0.4
Soybean 17.0 18.5 18.6 20.2 18.3 18.5 18.5
Sunflower 3.7 3.1 3.2 3.2 3.7 3.4 3.4
Expo rts 1.1 0.9 1.0 1.0 1.1 1.0 1.0
Rape 0.3 0.4 0.4 0.5 0.5 0.4 0.4
Soybean 0.7 0.3 0.3 0.3 0.3 0.3 0.3
Sunflower 0.1 0.2 0.3 0.2 0.3 0.2 0.2
End sto cks 0.6 0.5 0.5 0.5 0.5 0.5 0.5
Rape 0.1 0.1 0.1 0.1 0.1 0.1 0.1
Soybean 0.5 0.3 0.4 0.4 0.3 0.3 0.3
Sunflower 0.1 0.1 0.1 0.1 0.1 0.1 0.1
Self suff iciency rate % 56 57 58 56 58 58

VEGETABLE OILS balance sheet
Vegetable o ils (mio . t ) 2012/ 13 2013/ 14 2014/ 15 2015/ 16p 2016/ 17e 2017/ 18f5-yr.av.
2012-17
P ro ductio n 14.2 15.5 16.2 15.9 15.9 16.2 15.8
Rape 9.1 9.6 10.3 9.9 9.8 10.1 9.8
Soybean 2.5 2.6 2.6 3.0 2.9 2.9 2.7
Sunflower 2.6 3.3 3.3 3.0 3.2 3.3 3.2
Palm 0.0 0.0 0.0 0.0 0.0 0.0 0.0
T o tal do mestic use 20.0 22.0 22.8 23.1 22.7 22.9 22.5
Rape 8.9 9.4 10.2 9.8 9.5 10.0 9.6
Soybean 1.7 2.1 1.9 2.4 2.3 2.2 2.1
Sunflower 3.5 3.7 3.9 4.0 4.3 4.1 3.9
Palm 6.0 6.7 6.7 7.0 6.6 6.7 6.7
Impo rts 7.6 8.4 8.5 9.0 8.7 8.5 8.5
Rape 0.2 0.3 0.3 0.2 0.2 0.2 0.2
Soybean 0.3 0.4 0.3 0.3 0.3 0.3 0.3
Sunflower 1.1 0.9 1.0 1.4 1.6 1.1 1.1
Palm 6.1 6.9 6.9 7.1 6.7 6.8 6.8
Expo rts 1.8 1.6 1.9 1.8 1.9 1.8 1.8
Rape 0.5 0.3 0.4 0.4 0.3 0.4 0.4
Soybean 1.0 0.8 0.9 1.0 0.9 0.9 0.9
Sunflower 0.2 0.3 0.4 0.4 0.5 0.4 0.4
Palm 0.1 0.1 0.2 0.1 0.2 0.1 0.1
End sto cks 1.2 1.6 1.6 1.5 1.5 1.5 1.5
Rape 0.4 0.6 0.6 0.6 0.6 0.6 0.6
Soybean 0.2 0.2 0.2 0.2 0.2 0.2 0.2
Sunflower 0.3 0.3 0.3 0.3 0.3 0.3 0.3
Palm 0.4 0.4 0.5 0.5 0.5 0.5 0.5
Self sufficiency rate % 71 71 71 69 70 71

Thank you for your attention!
Presentations & Balance sheets
available at:
http://ec.europa.eu/agriculture/cereals/index_en.htm