OILCROPS - fao.org · OILCROPS Contact: Peter.Thoenes@fao ... 200 250 300 2014/15 2012/13 2013/14...
16
Market summaries 5 FOOD OUTLOOK MAY 2015 The latest forecasts for the 2014/15 season point towards a further easing of the global supply and demand balance for oilseeds products. Driven by bumper soybean crops in the United States and South American countries, global oilseed production is expected to expand significantly for the third consecutive season. Such an increase, together with sizeable opening stocks, will facilitate a strong expansion in global supplies of oils/fats and even more so of meals/cakes. On the demand side, growth in oils/fats consumption could slow in 2014/15, largely due to a subdued demand from the biodiesel sector, while global meal consumption is seen expanding at an about-average rate. As production of oilseed products is anticipated to exceed utilization by an ample margin, especially in the case of meals, a sharp rise in global inventories appears likely. Year-on-year, carry-out stocks are currently projected to increase by 11 percent for oils/fats and by a stunning 34 percent for meals/cakes, mainly due to soy/ meal. Responding to the positive supply and demand prospects, international prices for most oilseeds and oilseed products eased during the first half of 2014/15. In April 2015, FAO’s price indices for the oilseed complex not only ranged 20–30 percent below their corresponding 2014 values, they also Southern Hemisphere and the first planting indications for next season in the Northern Hemisphere, suggest that international prices could remain under pressure for the next few months. With regard to international trade, current forecasts indicate a deceleration in the volume of transactions in both oilseeds and oilseed products – despite the recent slide in prices. Incomplete and highly tentative forecasts for 2015/16 suggest that, after three consecutive rises, global oilseed production could contract in the coming season, with the largest dip seen for soybeans. Nonetheless, considering the current season’s prospective record-high carry-out stocks, a production decrease would not necessarily lead to tightness in global markets. OILCROPS Contact: [email protected] FAO - Trade and Markets Division Food Outlook May 2015
Transcript of OILCROPS - fao.org · OILCROPS Contact: Peter.Thoenes@fao ... 200 250 300 2014/15 2012/13 2013/14...
Market sum
maries
5FOOD OUTLOOKMAY 2015
The latest forecasts for the 2014/15 season point towards a
further easing of the global supply and demand balance for
oilseeds products. Driven by bumper soybean crops in the
United States and South American countries, global oilseed
production is expected to expand significantly for the third
consecutive season. Such an increase, together with sizeable
opening stocks, will facilitate a strong expansion in global
supplies of oils/fats and even more so of meals/cakes.
On the demand side, growth in oils/fats consumption
could slow in 2014/15, largely due to a subdued demand from
the biodiesel sector, while global meal consumption is seen
expanding at an about-average rate. As production of oilseed
products is anticipated to exceed utilization by an ample
margin, especially in the case of meals, a sharp rise in global
inventories appears likely. Year-on-year, carry-out stocks are
currently projected to increase by 11 percent for oils/fats and
by a stunning 34 percent for meals/cakes, mainly due to soy/
meal.
Responding to the positive supply and demand prospects,
international prices for most oilseeds and oilseed products
eased during the first half of 2014/15. In April 2015, FAO’s
price indices for the oilseed complex not only ranged 20–30
percent below their corresponding 2014 values, they also
Southern Hemisphere and the first planting indications for next
season in the Northern Hemisphere, suggest that international
prices could remain under pressure for the next few months.
With regard to international trade, current forecasts
indicate a deceleration in the volume of transactions in both
oilseeds and oilseed products – despite the recent slide in
prices.
Incomplete and highly tentative forecasts for 2015/16
suggest that, after three consecutive rises, global oilseed
production could contract in the coming season, with the
largest dip seen for soybeans. Nonetheless, considering the
current season’s prospective record-high carry-out stocks, a
production decrease would not necessarily lead to tightness in
global markets.
OILCROPS
Contact:[email protected]
FAO - Trade and Markets DivisionFood Outlook May 2015

Ma
rke
t a
sse
ssm
en
ts
34 FOOD OUTLOOKMAY 2015
Major Oilseed Exporters and Importers
Major ExportersMajor Importers
Figure 1. FAO monthly international price indices for oilseeds, vegetable oils and meals/cakes (2002-2004=100)
100
150
200
250
300
20152014201320122011201020092008
Meals/cakesVegetable oils
Oilseeds
OILCROPS, OILS AND MEALS4
PRICES5
Prices in the oilseed complex at multi-year lowsDuring the 2013/14 (October/September) season,
international prices for oilseeds and oilseed products
embarked on a downward trend, driven by large export
availabilities, a temporary slowdown in import demand and
a general build-up in inventories. Forecasts for 2014/15
suggest a further easing of the global supply and demand
balance. In particular, the coincidence of bumper soybean
crops in the United States and South American countries
point towards a sizeable supply surplus for oils/fats and
even more so for meals/cakes with a consequential boost
in inventories – a setting suggesting further downward
pressure on prices.
Indeed, international oilseed and product quotations
weakened considerably during the first half of 2014/15,
5 For details on prices and corresponding indices, see appendix Table 24.
as reflected by FAO’s price indices, which, in April 2015,
showed a year-on-year decline of 24 percent for both
oilseeds and oils, and of 32 percent for meals. Seen from
a historic perspective, the indices for oilseeds and meals
plunged to 5-year lows, while the oils index tumbled to a
6-year low.
Developments in other commodity markets also played
a role: abundant global availabilities of feedgrains started
impinging on global demand for oilmeals, thus adding
downward price pressure on the latter. On the oils/fats
4 Almost the entire volume of oilcrops harvested worldwide is crushed to obtain oils and fats for human nutrition or industrial purposes, and to obtain cakes and meals which are used as feed ingredients. Therefore, rather than referring to oilseeds, the analysis of the market situation is mainly undertaken in terms of oils/fats and cakes/meals. Please note that data on trade in and stocks of oils (meals) refer to the sum of trade in and stocks of oils or meals plus the oil (meal) equivalent of oilseed trade and stocks. Trade in oilseed trade (including situations where oilseeds are produced in one country but crushed in another) is fully reflected in national oil/meal consumption statistics. Furthermore, production data for oils and meals are derived from domestic production of the relevant oilseeds in a given year, i.e. they do not reflect the outcome of actual oilseed crushing in a given country and period.

35FOOD OUTLOOKMAY 2015
OILC
RO
PS, O
ILS AN
D M
EA
LS
Figure 5. CBOT soybean futures for SeptemberFigure 2. FAO monthly price index for oilseeds (2002-2004=100)
Figure 3. FAO monthly price index for vegetable oils (2002-2004=100)
Figure 4. FAO monthly price index for oilmeals/cakes (2002-2004=100)
130
170
210
250
2014/15
2012/13
2013/14
Note: With regard to the sudden drops in the price index for oilseedsin May 2013 and March 2014, please note the clarification provided inappendix table 24
SAJJMAMFJDNO
130
160
190
220
2012/13
2014/15
2013/14
SAJJMAMFJDNO
150
200
250
300
2014/15
2012/13
2013/14
SAJJMAMFJDNO
300
350
400
450
500
550
USD per tonne
S O N D J F M A
2013 values 2014 values 2015 values
side, the sudden slump in international mineral oil prices
compromised the competitiveness of vegetable oil-based
biofuels, thus cutting into global demand for vegetable
oils (especially palm oil) and accentuating the slide in world
vegetable oil prices.
Latest reports about South America’s on-going soybean
harvest confirm the bright outlook for production in
2014/15. This, together with first indications that soybean
plantings for the 2015/16 season in the United States could
match the 2014/15 record-high, suggest that international
prices for oilseeds and oilseed products could remain
depressed in the next few months. The persistent weakness
in Chicago Board of Trade futures prices for soybeans,
which currently stand at more than USD 100 per tonne
below their corresponding values of the past two years,
point to the same direction.
OILSEEDS
Expansion in global oilseed production to continue in 2014/15Possibly topping 542 million tonnes, global oilseed
production is forecast to expand strongly for the third
consecutive season. The projected year-on-year rise
of 5.7 percent almost matches the rates recorded in
2012/13 and 2013/14. Higher area and improved yields
both contribute to the expansion. Growth will again be
led by soybeans, the production of which is forecast to
surge by 11 percent or 31 million tonnes. In the Northern
Hemisphere, where 2014/15 crops were harvested last
year, aggregate output bounced up by about 14 percent,
under the lead of the United States. The United States’
soy area climbed to unprecedented levels (at the expense
of grains), as did average yields, which, thanks to near-ideal

Ma
rke
t a
sse
ssm
en
ts
36 FOOD OUTLOOKMAY 2015
Note: The split years bring together northern hemisphere annual crops harvested in the latter part of the first year shown, with southern hemisphere annual crops harvested in the early part of the second year shown. For tree crops, which areproduced throughout the year, calendar year production for the second year shown is used.
2012/13 2013/14estim.
2014/15 f’cast
Change 2014/15
over 2013/14
million tonnes %
Soybeans 267.2 283.7 314.5 10.9
Rapeseed 64.3 71.3 70.9 -0.6
Cottonseed 45.8 45.0 45.6 1.4
Groundnuts (unshelled) 37.9 38.9 37.9 -2.4
Sunflower seed 36.2 42.3 40.7 -3.9
Palm kernels 13.9 14.6 15.3 4.5
Copra 5.9 5.6 5.7 0.7
Total 471.2 501.4 530.6 5.8
Table 1. World production of major oilcrops
growing conditions, reached an all-time high of 3.2 tonnes
per hectare. Larger plantings also lifted Canada’s output.
Similarly, Ukraine and the Russian Federation, where
soy production expanded strongly in recent years, reported
further gains based on additional expansion in area. In
China, production improved thanks to better yields. By
contrast, India’s output dropped on both lower plantings
and reduced productivity. In South America, the 2014/15
soybean harvest is currently in full swing. Thanks to further
growth in area and generally favourable growing conditions
in key producing regions, South America’s total output
could climb to an all-time high, despite recent downward
corrections due to periods of adverse weather. The largest
production gains are reported by Brazil, followed by Argentina. Paraguay’s output could fall compared with
last season, based on lower plantings and productivity
losses, while, in Uruguay, area gains should compensate
for lower yields.
Global rapeseed, sunflowerseed and groundnut
production in 2014/15 are expected to fall short of last
season’s record levels. Rapeseed output is forecast slightly
below last season, with drops in Canada, India and
Australia only partly offset by a bumper EU crop. While
good weather has benefited production in both Canada
and the EU, in Canada, yields trailed behind last season’s
top level. India’s crop suffered from poor weather that
hindered yields and reduced the area harvested. Global
sunflowerseed and groundnut productions are projected
to drop by 4 percent and 2 percent respectively from last
year, still reaching their second highest levels on record.
For sunflowerseed, production drops in Ukraine and the
Russian Federation are expected to be partly offset by
gains in Argentina. Favourable weather conditions should
also lift Argentina’s groundnut output, which should help
compensate production falls in India and the United States.
With regard to cottonseed, a rebound in global
production should be possible as larger crops in the United States and Pakistan are expected to more than offset
reduced harvests in Australia, Brazil and China. A small
recovery is also expected in copra production, although
global output is set to trail behind recent records. Global
palmkernel output should keep rising, mainly reflecting
continued expansion in mature oil palm area in Southeast
Asia.
OILS AND FATS6
Global oils/fats supplies to rise furtherCurrent crop forecasts for 2014/15 translate into an
increase in global oils/fats production of only 3 percent,
about half the rate recorded in 2013/14. Last season’s rise
was made possible by record outturns of high oil-yielding
crops, whereas this season, the lower oil-yielding soybeans
will play a dominant role. Rapeseed, sunflowerseed,
groundnut, olive and fish oil outputs are all projected to
fall, while global soy oil output should surge by 12 percent.
Palm oil production is expected to expand, although
less than in recent years, due to unfavourable weather
in Indonesia and Malaysia that affected oil palms last
year and during the first months of this year. While in
Malaysia production is forecast to increase by no more
than 110 000 tonnes (or 0.6 percent), Indonesia’s output
could still rise by 2 million tonnes (or 6.5 percent) thanks
to further growth in mature oil palm area. This compares
with an average growth rate (for the last five years) of
2.3 percent in Malaysia and 8 percent in Indonesia.
Global oils/fats supplies (comprising 2014/15 production
and 2013/14 ending stocks) are forecast to grow by an
about-average rate of 4 percent. Thanks to record crops,
robust gains in domestic availabilities are expected in several
major producers, notably Indonesia, United States, EU,
Brazil and Argentina. In the three latter countries, large
carry-in stocks will contribute to the gains. By contrast, only
marginal supply increases are forecast for Malaysia and
China, while year-on-year falls in oils/fats supplies – mostly
due to modest crop outturns – are forecast for Canada,
India, the Russian Federation, Ukraine and Australia.
In Canada and India, the presence of large carry-in stocks is
expected to attenuate the drop in supplies.
6 This section refers to oils from all origins, which – in addition to products derived from the oil crops discussed under the section on oilseeds – include palm oil, marine oils as well as animal fats.

37FOOD OUTLOOKMAY 2015
OILC
RO
PS, O
ILS AN
D M
EA
LS
1 Refer to footnote 4 on page 34 for overall definitions and methodology.2 Includes oils and fats of vegetable, animal and marine origin.3 Production plus opening stocks.4 Residual of the balance.5 Trade data refer to exports based on a common October/September
marketing season.6 Major exporters include Argentina, Brazil, Canada, Indonesia, Malaysia,
Ukraine and the United States.7 All meal figures are expressed in protein equivalent; meals include all meals
and cakes derived from oilcrops as well as meals of marine and animal origin.8 Major exporters include Argentina, Brazil, Canada, India, Indonesia, Malaysia,
Paraguay, Ukraine and the United States.
Table 2. World oilcrops and product market ata glance1
2012/13 2013/14 estim.
2014/15 f’cast
Change: 2014/15
over 2013/14
million tonnes %
TOTAL OILCROPS
Production 482.9 513.0 542.3 5.7
OILS AND FATS 2
Production 189.9 202.7 209.6 3.4
Supply 3 222.2 234.7 244.3 4.1
Utilization 4 189.7 199.0 203.9 2.5
Trade 5 101.9 107.3 109.0 1.6
Global stock-to-use ratio (%) 16.9 17.5 18.9
Major exporters stock-to-disappearance ratio (%) 6
9.6 9.8 12.0
MEALS AND CAKES 7
Production 120.0 128.9 139.2 8.0
Supply 3 137.6 146.9 160.6 9.3
Utilization 4 118.5 125.2 131.2 4.8
Trade 5 73.6 81.3 84.2 3.6
Global stock-to-use ratio (%) 15.2 17.1 21.8
Major exporters stock-to-disappearance ratio (%) 8
7.6 9.3 14.8
FAO PRICE INDICES (Oct/Sept) (2002-2004=100)
2012/13 2013/14 2014/15 Oct-Apr
Change: Oct-Apr 2014/15
overOct-Apr 2013/14
%
Oilseeds 213 194 159 -22.4
Oilmeals/cakes 255 253 205 -22.7
Vegetable oils 193 189 158 -19.6
Subdued demand from biodiesel producers to dampen growth in global oils/fats utilizationIn 2014/15, global consumption of oils/fats is projected
to rise by no more than 5 million tonnes, which implies a
below-average growth rate of 2.5 percent. With regard to
individual oils, the strongest contribution to overall growth
comes from soyoil, whose consumption should leap by
about 3.5 million tonnes or over 7 percent. By contrast,
palm oil utilization is estimated to expand by no more than
0.9 million tonnes, or 1.5 percent, by far the lowest rate
recorded in the last 15 years.
In most developing countries, utilization for food and
traditional industrial uses should continue to expand,
sustained by rising populations and income growth, but
also by more attractive prices. One important exception,
however, is China, where a dimmer economic outlook is
expected to temper demand growth for vegetable oils.
The key reason for the anticipated slowdown in global
consumption concerns fuel use. In 2014/15, demand
from the biofuel sector – one of the main drivers of
consumption growth in the last few years – could suffer
its first setback. In the EU and the United States, the
world’s leading producers and consumers of biodiesel,
the freeze in domestic biodiesel consumption mandates
and increasing uncertainty about future biofuel policies
have curbed the industry’s enthusiasm for biodiesel. In
addition, policies to encourage the use of alternative
feedstock, for example waste vegetable oil, are under
implementation in several countries. In those countries
where biofuel demand is less policy-driven and, hence,
more price elastic, the recent plunge in world mineral oil
prices depressed biodiesel production – and thus demand
for the main feedstock, i.e. vegetable oils and animal
fats. This is because rising discounts for mineral oil quickly
eroded the competitiveness of biodiesel. Countries strongly
affected by this development include Indonesia, Malaysia
and Argentina. In an effort to safeguard demand for
domestically produced oils/fats, some governments decided
to strengthen their policies in favour of biodiesel. New
support measures and ambitious biodiesel consumption
targets have been announced in Indonesia, Malaysia,
Argentina, Brazil and India, with similar initiatives
under consideration in the Philippines and the Republic of Korea. However, it should be noted that, in recent
years, the implementation of such policies has often been
hampered by regulatory problems, logistical difficulties and/
or inadequate domestic feedstock supplies.
Higher inventory levels and stock-to-use ratios expected in 2014/15Based on the above supply and demand forecasts, global
2014/15 closing stocks (which comprise oils/fats inventories
plus the oil contained in stored oilseeds) should increase
strongly for the second consecutive season. As total
production is projected to surpass total consumption by
about 5.7 million tonnes, global oils/fats inventories could
top 38 million tonnes, with soyoil accounting for most
of the rise. At country level, a marked build-up in stocks
is envisaged in the United States, while more modest
gains are expected in Brazil, Argentina, Indonesia, EU
and China. By contrast, Canada and India may witness
a sizeable contraction in stocks. China is estimated to

Ma
rke
t a
sse
ssm
en
ts
38 FOOD OUTLOOKMAY 2015
Figure 7. World stocks and ratios of oils/fats (including the oil contained in seeds stored)
0
10
20
30
40
2014/152013/142012/132011/122010/110
5
10
15
20
Million tonnes Percent
Major Exporters Rest of the World
World Stock-to-use ratioStock-to-disappearance ratio of Major Exporters
estim. f’cast
Figure 6. Global production and utilizationof oils/fats
-6
-3
0
3
6
170
180
190
200
210
2014/152013/142012/132011/122010/11
Million tonnes Million tonnes
estim. f’cast
Balance (production minus utilization, right axis)
Production (left axis) Utilization (left axis)
continue holding the largest oils/fats stockpile, mainly in the
form of whole soybeans.
Based on current projections, the global stock-to-use
ratio and the stock-to-disappearance ratio for the major
exporters7 are poised to rise to 19 percent and 12 percent,
respectively – marking a second consecutive rise for both
indicators.
Growth in oils/fats trade to slow down considerablyAlthough international prices for oils/fats softened
considerably over the last three seasons and currently stand
at 6-year lows, world trade in oils/fats – including the oil
contained in traded oilseeds – is projected to expand by
7 Argentina, Brazil, Canada, Indonesia, Malaysia, Ukraine and the United States.
only 2 percent in 2014/15, well below the pace observed in
recent years. The slowdown mainly reflects ample domestic
supplies in key importing countries. For several of them,
the current strength of the US dollar (the main currency
for such trade) has also made purchases more expensive,
tempering import demand.
Reflecting developments in seed production, global
soyoil transactions should climb to a new record, while
the volumes of trade in sunflower and rapeseed oil may
contract somewhat. Trade in palm oil, the most widely
traded vegetable oil, could recover from last season’s
exceptional fall.
Exports by Indonesia, the world’s top supplier of
vegetable oil, are expected to post another strong increase.
This forecast assumes that the planned uptake in internal
demand – for the local oleo-chemical and biodiesel
industry – will require more time than originally envisaged.
By contrast, a contraction in palm oil shipments is expected
in Malaysia for the second consecutive year. Similar to
last year, the country’s overseas sales could be constrained
by both weak production growth and rising domestic
consumption. The boost in global soyoil exports should
be driven by the United States and Argentina. Brazil’s shipments are set to remain close to last season’s level
mainly reflecting the introduction of higher consumption
mandates for biodiesel. Canada expects to sell record
volumes of rapeseed (which in part stem from last season’s
bumper crop), now that bottlenecks in domestic shipments
have been overcome. Ukraine, the Russian Federation
and Australia are anticipated to export less.
Regarding imports, the expansion in China’s oil/fat
purchases could come to a halt in 2014/15, in line with
the anticipated slowdown of domestic consumption and
Figure 8. Oil/fat exports by major exporters (including the oil contained in seed exports)
0
10
20
30
2013/14 estimate
2014/15 forecast
Million tonnes
UnitedStates
IndonesiaCanada MalaysiaArgentina Brazil

39FOOD OUTLOOKMAY 2015
OILC
RO
PS, O
ILS AN
D M
EA
LS
Figure 9. Oil/fat imports by region or major country (including the oil contained in seed imports)
0
10
20
30
40
2014/152012/132010/112008/092006/07
Latin America
Asia excl. China (total) Europe
China (total)
Million tonnes
United States & Canada Africa
f’cast
because the country maintains record-high inventories.
Other countries in Asia could expand their imports further,
with India likely to maintain its position as the world’s
top importer. Lower domestic supplies and steadily rising
demand are projected to drive up India’s imports (mainly
palm oil) by at least 1 million tonnes, or 10 percent. Based
on this forecast, some 58 percent of India’s consumption
would be met by imports, which compares with 47 percent
four years ago. By contrast, large domestic supplies should
allow the EU and the United States to scale down their
purchases.
MEALS AND CAKES8
Global meal supplies to expand sharply in 2014/15Based on the current crop forecasts, global production of
meals/cakes in 2014/15 would expand strongly for the third
consecutive year. As in the past two seasons, growth will
be driven entirely by soy, with incremental world soymeal
output estimated at close to 11 million tonnes (expressed
in protein equivalent), while outputs of all the other meals
are expected to shrink, except for a small rise in palmkernel
meal and stable cottonseed meal.
Global supplies, which comprise 2014/15 production
and 2013/14 carry-out stocks, could increase by 9 percent
to 160 million tonnes. In China, the world’s top consumer,
meal supplies are unlikely to recover from last season’s low
8 This section refers to meals from all origins. In addition to products derived from the oil crops discussed under the section on oilseeds, this also includes fish meal and meals of animal origin.
level, while, in India, they could drop to a multi-year low.
In the United States, Brazil and Argentina, the three
leading soymeal producers, supplies are expected to rise
sharply, buoyed by record domestic harvests. In the case of
Argentina, large opening stocks contribute to the surge.
Overall, the increases in the three countries could add up to
almost 14 million tonnes. Also in the EU, Ukraine and the
Russian Federation, meal supplies should climb, thanks to
both good crops and large opening stocks.
Global meal consumption to continue expanding in 2014/15World meal/cake consumption is projected to reach a
record 131 million tonnes (expressed in protein equivalent),
up 5 percent from last season, underpinned by falling
prices of meals/cakes and economic growth in several
countries. The expansion is expected to fall short of the
6 percent registered last year, as large oilmeal supplies will
coincide with ample availabilities of grain-based feeds in
2014/15, which should trim demand for meals/cakes.
Soymeal will occupy a dominant position in overall
consumption growth, considering that only slightly higher
or stagnating demand is expected for all other meals. As in
previous years, developing nations will contribute strongly
to overall consumption growth. Countries in Asia continue
to play a central role, with demand growth expected to
accelerate in India and several other countries in the region,
albeit with China as one important exception. In the world’s
top meal consumer, feed demand could expand at a slower
pace than in recent years reflecting a slowdown in meat
production growth, especially in the avian influenza-hit
poultry sector. In Brazil, slower economic growth might
Figure 10. Global production and utilization of meals/cakes (in protein equivalent)
-8
-4
0
4
8
100
110
120
130
140
2014/152013/142012/132011/122010/11
Million tonnes Million tonnes
estim. f’cast
Balance (production minus utilization, right axis)
Production (left axis) Utilization (left axis)

Ma
rke
t a
sse
ssm
en
ts
40 FOOD OUTLOOKMAY 2015
Figure 11. World stocks and ratios of meals/cakes (in protein equivalent and including the meal contained in seeds stored)
0
10
20
30
2014/152013/142012/132011/122010/110
10
20
30
Million tonnes Percent
Major Exporters Rest of the World
World Stock-to-use ratioStock-to-disappearance ratio of Major Exporters
estim. f’cast
Figure 12. Meal/cake imports by region or major country (in protein equivalent and including the meal contained in seed imports)
0
8
16
24
32
2014/152012/132010/112008/092006/07
Latin America Asia excl. China (total) Europe
China (total)
Million tonnes
United States & Canada Africa
f’cast
affect meat consumption, possibly trimming demand for
oilseed meals. In the EU, the world’s second largest meal
consumer, oilmeal use is likely to be negatively affected
by the high availability of attractively priced feed wheat.
By contrast, in the United States, meal consumption may
increase faster than last season, as, compared to recent
years, the livestock sector has been less affected by disease
problems and adverse weather conditions.
Strong build-up of meal inventories anticipated in 2014/15Based on current 2014/15 forecasts, global meal production
will exceed consumption by almost 8 million tonnes
(expressed in protein equivalent). Such a large production
surplus will foster a surge of inventories, chiefly of soymeal.
Total meal stocks are set to reach 28.6 million tonnes
(including the meal contained in stored oilseeds), one-third
above last season’s level. The extraordinary stock build-up
should be concentrated in the United States, Argentina
and Brazil. In the United States, where the 2013/14 season
closed with exceptionally low carry-out stocks due to a
brisk export pace, the current season’s bumper crop and
less buoyant export sales should bring about a massive
replenishment in inventories, possibly lifting the United
States’ reserves to an 8-year high. It is estimated that up
to 7.5 million tonnes of soybeans – i.e. nearly half of this
season’s incremental production – could be earmarked for
stock rebuilding by the country. In Argentina and Brazil,
inventories could climb to all-time highs, given record soy
harvests and, in the case of Brazil, a sharp slowdown in
exports growth. In Argentina, the anticipated stock build-
up should occur mostly on-farm as farmers are expected to
hold their crops as a means of hedging against domestic
price inflation. Among other countries, a moderate increase
in inventories is expected in the EU, while stocks may be
trimmed in China, India and Canada.
The current forecasts lead to a sharp rise in the
2014/15 stock-to-use ratios. Estimated at, respectively,
22 percent and 15 percent, the global stock-to-use ratio
and the stock-to-disappearance ratio for major exporters9
would hit multi-year highs, indicating there is considerable
scope for world meal prices to slide further.
Global meal trade to slow down in 2014/15After expanding briskly in 2013/14, world trade in meals/
cakes, which includes the meal contained in traded
oilseeds, is projected to grow by only 3–4 percent in the
current season. Commodity-wise, record volumes of trade
in soybean meal are anticipated to offset smaller flows of
most other meals, in particular of rapeseed.
Regarding imports, countries in Asia will continue to
dominate demand, with China alone accounting for one-
third of global purchases. China’s imports (mostly in the form
of whole soybeans) should keep expanding, but at a lower
pace than last season, in line with the projected slowdown
of domestic demand. Purchases by other Asian countries,
in particular Turkey, Vietnam, Thailand, Indonesia and
Pakistan are anticipated to expand further. In the EU, the
world’s second largest buyer, imports should remain about
unchanged as incremental demand can be met by higher
domestic supplies of both oilmeals and feedgrains. Imports by
9 Argentina, Brazil, Canada, India, Indonesia, Malaysia, Paraguay, Ukraine and the United States.
41FOOD OUTLOOKMAY 2015
OILC
RO
PS, O
ILS AN
D M
EA
LS
Figure 13. Meal/cake exports by major exporters (in protein equivalent and including the meal contained in seed exports)
0
5
10
15
20
252013/14 estimate
2014/15 forecast
Million tonnes
UnitedStates
Canada India ParaguayArgentina Brazil
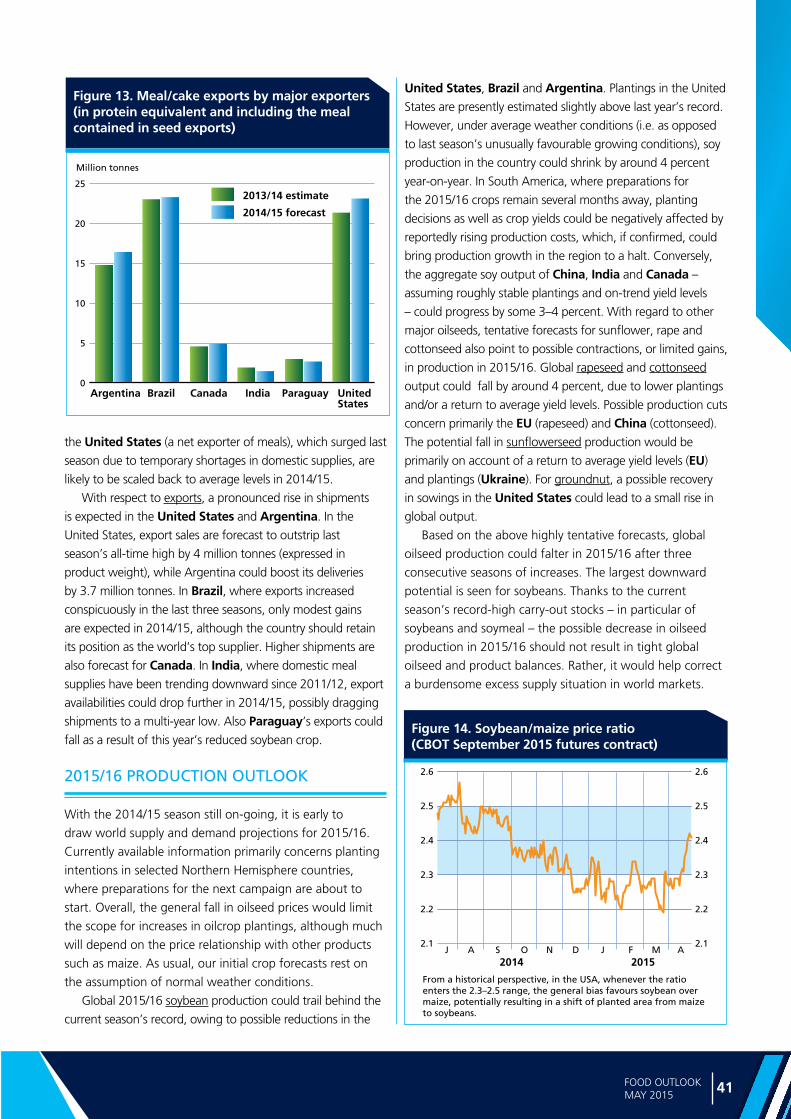
Figure 14. Soybean/maize price ratio (CBOT September 2015 futures contract)
2.1
2.2
2.3
2.4
2.5
2.6
2.1
2.2
2.3
2.4
2.5
2.6
J A OS N D J F M A2014 2015
From a historical perspective, in the USA, whenever the ratioenters the 2.3–2.5 range, the general bias favours soybean overmaize, potentially resulting in a shift of planted area from maizeto soybeans.
the United States (a net exporter of meals), which surged last
season due to temporary shortages in domestic supplies, are
likely to be scaled back to average levels in 2014/15.
With respect to exports, a pronounced rise in shipments
is expected in the United States and Argentina. In the
United States, export sales are forecast to outstrip last
season’s all-time high by 4 million tonnes (expressed in
product weight), while Argentina could boost its deliveries
by 3.7 million tonnes. In Brazil, where exports increased
conspicuously in the last three seasons, only modest gains
are expected in 2014/15, although the country should retain
its position as the world’s top supplier. Higher shipments are
also forecast for Canada. In India, where domestic meal
supplies have been trending downward since 2011/12, export
availabilities could drop further in 2014/15, possibly dragging
shipments to a multi-year low. Also Paraguay’s exports could
fall as a result of this year’s reduced soybean crop.
2015/16 PRODUCTION OUTLOOK
With the 2014/15 season still on-going, it is early to
draw world supply and demand projections for 2015/16.
Currently available information primarily concerns planting
intentions in selected Northern Hemisphere countries,
where preparations for the next campaign are about to
start. Overall, the general fall in oilseed prices would limit
the scope for increases in oilcrop plantings, although much
will depend on the price relationship with other products
such as maize. As usual, our initial crop forecasts rest on
the assumption of normal weather conditions.
Global 2015/16 soybean production could trail behind the
current season’s record, owing to possible reductions in the
United States, Brazil and Argentina. Plantings in the United
States are presently estimated slightly above last year’s record.
However, under average weather conditions (i.e. as opposed
to last season’s unusually favourable growing conditions), soy
production in the country could shrink by around 4 percent
year-on-year. In South America, where preparations for
the 2015/16 crops remain several months away, planting
decisions as well as crop yields could be negatively affected by
reportedly rising production costs, which, if confirmed, could
bring production growth in the region to a halt. Conversely,
the aggregate soy output of China, India and Canada –
assuming roughly stable plantings and on-trend yield levels
– could progress by some 3–4 percent. With regard to other
major oilseeds, tentative forecasts for sunflower, rape and
cottonseed also point to possible contractions, or limited gains,
in production in 2015/16. Global rapeseed and cottonseed
output could fall by around 4 percent, due to lower plantings
and/or a return to average yield levels. Possible production cuts
concern primarily the EU (rapeseed) and China (cottonseed).
The potential fall in sunflowerseed production would be
primarily on account of a return to average yield levels (EU)
and plantings (Ukraine). For groundnut, a possible recovery
in sowings in the United States could lead to a small rise in
global output.
Based on the above highly tentative forecasts, global
oilseed production could falter in 2015/16 after three
consecutive seasons of increases. The largest downward
potential is seen for soybeans. Thanks to the current
season’s record-high carry-out stocks – in particular of
soybeans and soymeal – the possible decrease in oilseed
production in 2015/16 should not result in tight global
oilseed and product balances. Rather, it would help correct
a burdensome excess supply situation in world markets.

Ma
jor
po
licy
de
velo
pm
en
ts
82 83FOOD OUTLOOKMAY 2015
OIL
CRO
PS:
MA
JOR
POLI
CY D
EVEL
OPM
ENTS
: OCT
OBE
R 20
14 T
O M
ID-A
PRIL
201
5 *
CO
UN
TRY
PRO
DU
CT
DA
TEPO
LIC
Y C
ATE
GO
RY
/INST
RU
MEN
TD
ESC
RIP
TIO
N
Arg
enti
na
Soyb
ean
sD
ec-1
4 to
Fe
b-1
5M
arke
t re
gu
lati
on
Lim
ited
acc
ess
of
farm
ers
ho
ldin
g s
oyb
ean
sto
cks
to p
ub
lic p
rod
uct
ion
loan
s, a
nd
intr
od
uce
d f
orm
al
rep
ort
ing
req
uir
emen
ts f
or
the
sale
of
silo
-bag
s (u
sed
fo
r o
n-f
arm
sto
rag
e), i
n a
bid
to
en
cou
rag
e fa
rmer
s to
rel
ease
so
ybea
ns
into
th
e m
arke
t.
Oils
eed
s, g
rain
sM
ar-1
5A
gri
cult
ura
l po
licy
Esta
blis
hed
a f
un
d t
o s
up
po
rt s
mal
l an
d m
ediu
m-s
ized
gra
in/o
ilsee
d p
rod
uce
rs, w
ith
th
e sp
ecifi
c o
bje
ctiv
e o
f re
du
cin
g t
he
exp
ort
tax
bu
rden
th
ey f
aced
.
Bra
zil
Soyb
ean
sN
ov-
14En
viro
nm
enta
l po
licy
End
ors
ed t
he
exte
nsi
on
– u
nti
l May
201
6 –
of
the
ind
ust
ry’s
vo
lun
tary
mo
rato
riu
m o
n t
rad
ing
an
d
fin
anci
ng
so
ybea
ns
gro
wn
on
ille
gal
ly c
lear
ed la
nd
in t
he
Am
azo
n r
egio
n.
Bio
die
sel
No
v-14
Ren
ewab
le e
ner
gy
po
licy
Exem
pte
d s
elle
rs o
f ve
get
al-o
rig
in f
eed
sto
ck t
o b
iod
iese
l man
ufa
ctu
rers
fro
m p
ayin
g s
elec
ted
tax
es,
wit
h a
vie
w t
o s
tim
ula
te d
om
esti
c b
iod
iese
l pro
du
ctio
n.
Cam
ero
on
Oil
pal
mJa
n-1
5Se
cto
r d
evel
op
men
t G
ran
ted
pu
blic
fu
nd
ing
to
incr
ease
th
e p
rod
uct
ion
an
d f
ree
dis
trib
uti
on
of
cert
ified
pla
nti
ng
mat
eria
l to
far
mer
s, in
an
eff
ort
to
sti
mu
late
do
mes
tic
pal
m o
il p
rod
uct
ion
.
Can
ada
Rap
esee
d o
ilO
ct-1
4B
ilate
ral t
rad
e ag
reem
ent
Co
mp
lete
d n
ego
tiat
ion
of
the
Co
mp
reh
ensi
ve E
con
om
ic a
nd
Tra
de
Ag
reem
ent
(CET
A)
wit
h t
he
EU,
wh
ich
incl
ud
es e
limin
atio
n o
f EU
tar
iffs
on
Can
adia
n im
po
rts
of
rap
esee
d o
il as
wel
l as
pro
visi
on
s to
re
du
ce b
iote
ch-r
elat
ed t
rad
e h
urd
les.
Rap
esee
d, r
apes
eed
oil
Oct
-14
Bila
tera
l tra
de
Ob
tain
ed r
emo
val o
f ta
riff
s o
n r
apes
eed
exp
ort
s to
th
e R
epu
blic
of
Ko
rea,
as
wel
l as
a g
rad
ual
ph
asin
g-
ou
t o
f ta
riff
s o
n c
rud
e an
d r
efin
ed r
apes
eed
oil.
Gra
ins,
oils
eed
sD
ec-1
4M
arke
t re
gu
lati
on
Exte
nd
ed m
easu
res
reg
ula
tin
g n
atio
nal
gra
in t
ran
spo
rtat
ion
un
til M
arch
201
5, in
ord
er t
o a
dd
ress
lo
gis
tica
l bo
ttle
nec
ks a
ffec
tin
g t
he
mo
vem
ent
of
gra
ins/
oils
eed
s to
po
rts.
Cam
elin
a sa
tiva
mea
lJa
n-1
5 M
arke
t re
gu
lati
on
A
pp
rove
d t
he
feed
ing
of
cam
elin
a sa
tiva
mea
l to
bro
iler
chic
ken
s.
Rap
esee
d, s
oyb
ean
sJa
n-1
5Se
cto
r d
evel
op
men
t Fu
nd
ed R
&D
act
ivit
ies
mea
nt
to e
nh
ance
th
e co
mp
etit
iven
ess
and
su
stai
nab
ility
of
the
cou
ntr
y's
rap
esee
d a
nd
so
ybea
n in
du
stri
es.
Bio
die
sel
Mar
-15
Ren
ewab
le e
ner
gy
po
licy
Sup
po
rted
res
earc
h o
n r
aw g
lyce
rol (
a b
y-p
rod
uct
of
veg
etab
le o
il-b
ased
die
sel p
rod
uct
ion
) w
ith
a v
iew
to
en
han
ce v
alu
e ad
dit
ion
in t
he
bio
die
sel s
ecto
r.
Ch
ina
Soyb
ean
sN
ov
to
Dec
-14
GM
O p
olic
yA
uth
ori
zed
imp
ort
atio
n o
f tw
o n
ew g
enet
ical
ly m
od
ified
so
ybea
n v
arie
ties
, bu
t su
spen
ded
th
e ap
pro
val
pro
cess
fo
r an
oth
er G
M s
oy
stra
in.
Bio
die
sel
Feb
-15
Ren
ewab
le e
ner
gy
po
licy
Pub
lish
ed n
ew p
olic
y g
uid
elin
es f
or
the
dev
elo
pm
ent
of
the
cou
ntr
y's
bio
die
sel i
nd
ust
ry, w
ith
th
e o
vera
ll o
bje
ctiv
e o
f p
rom
oti
ng
do
mes
tic
bio
die
sel c
on
sum
pti
on
wh
ile p
rote
ctin
g lo
cal r
eso
urc
es.
Euro
pea
n U
nio
n
Rap
esee
d o
ilO
ct-1
4B
ilate
ral t
rad
e ag
reem
ent
Co
mp
lete
d n
ego
tiat
ion
of
the
Co
mp
reh
ensi
ve E
con
om
ic a
nd
Tra
de
Ag
reem
ent
(CET
A)
wit
h C
anad
a,
wh
ich
incl
ud
es t
he
elim
inat
ion
of
EU t
arif
fs o
n C
anad
ian
imp
ort
s o
f ra
pes
eed
oil
and
pro
visi
on
s to
re
du
ce b
iote
ch-r
elat
ed t
rad
e h
urd
les.
Edib
le o
ilsO
ct-1
4Fo
od
lab
ellin
gO
pen
ed in
frin
gem
ent
pro
ceed
ing
s ag
ain
st t
he
Un
ited
Kin
gd
om
ove
r it
s vo
lun
tary
nu
trit
ion
al la
bel
ling
sc
hem
e.
Palm
oil
Feb
-15
Trad
e p
olic
yR
equ
este
d e
stab
lish
men
t o
f a
WTO
dis
pu
te s
ettl
emen
t p
anel
to
rev
iew
th
e R
uss
ian
Fed
erat
ion
’s im
po
rt
du
ties
on
th
e se
lect
ed p
rod
uct
s, in
clu
din
g p
alm
oil.
GM
cro
ps
Mar
-15
GM
O p
olic
yA
do
pte
d a
new
reg
ula
tio
n a
llow
ing
ind
ivid
ual
mem
ber
sta
tes
to r
estr
ict
or
ban
GM
O c
ult
ivat
ion
on
th
eir
ow
n t
erri
tory
.

Ma
jor p
olicy d
eve
lop
me
nts
82 83FOOD OUTLOOKMAY 2015
CO
UN
TRY
PRO
DU
CT
DA
TEPO
LIC
Y C
ATE
GO
RY
/INST
RU
MEN
TD
ESC
RIP
TIO
N
Fran
ce
Bio
die
sel
Jan
-15
Ren
ewab
le e
ner
gy
po
licy
Rai
sed
max
imu
m le
vel o
f b
iod
iese
l per
mit
ted
in t
ran
spo
rtat
ion
fu
el f
rom
7 t
o 8
per
cen
t.
Oliv
e o
ilM
ar-1
5Se
cto
r su
pp
ort
Off
ered
fin
anci
al a
ssis
tan
ce a
nd
oth
er s
up
po
rt m
easu
res
to o
live
oil
pro
du
cers
aff
ecte
d b
y p
est
ou
tbre
aks
and
bad
wea
ther
.
Oliv
e tr
eeA
pr-
15Ph
yto
-san
itar
y m
easu
reA
nn
ou
nce
d r
estr
icti
on
s o
n im
po
rt f
rom
Ital
y o
f p
lan
t m
ater
ial s
usc
epti
ble
to
infe
ctio
n w
ith
xyl
ella
fa
stid
iosa
, a b
acte
riu
m h
itti
ng
oliv
e tr
ees
in It
aly’
s A
pu
lia r
egio
n.
Ind
ia
Sele
cted
oils
eed
sO
ct -
Dec
-14
Pro
du
cer
sup
po
rtR
aise
d m
inim
um
su
pp
ort
pri
ces
for
rap
esee
d, m
ust
ard
seed
, saf
flo
wer
seed
an
d c
op
ra.
Sun
flo
wer
see
dN
ov-
14Se
cto
r d
evel
op
men
t La
un
ched
pro
gra
mm
e to
sti
mu
late
cu
ltiv
atio
n o
f su
nfl
ow
erse
ed a
nd
oth
er o
ilcro
ps
in P
un
jab
Sta
te, w
ith
a
view
to
rai
se lo
cal e
dib
le o
il p
rod
uct
ion
an
d r
edu
ce im
po
rts.
Veg
etab
le o
ilsD
ec-1
4Im
po
rt p
olic
yR
aise
d im
po
rt t
arif
f fo
r b
oth
cru
de
and
refi
ned
ed
ible
oils
, wit
h a
vie
w t
o p
rote
ct lo
cal r
efin
ers
as w
ell
as f
arm
ers
fro
m p
rice
dro
ps
cau
sed
by
risi
ng
imp
ort
s.
Veg
etab
le o
ilsFe
b-1
5Ex
po
rt p
olic
yLo
wer
ed t
he
min
imu
m e
xpo
rt p
rice
fo
r p
acka
ged
an
d b
ran
ded
ed
ible
oil.
Bio
die
sel
Mar
-15
Ren
ewab
le e
ner
gy
po
licy
Allo
wed
man
ufa
ctu
rers
to
sel
l bio
die
sel d
irec
tly
to e
nd
use
rs (
esp
ecia
lly b
ulk
co
nsu
mer
s su
ch a
s ra
il co
mp
anie
s), i
n a
n a
ttem
pt
to f
ost
er d
om
esti
c b
iod
iese
l pro
du
ctio
n a
nd
usa
ge.
Co
con
ut
oil
Ap
r-15
Foo
d s
afet
yB
ann
ed n
ine
bra
nd
s o
f co
con
ut
oil
in K
eral
a St
ate,
fo
llow
ing
det
ecti
on
of
seve
re a
du
lter
atio
n.
Ind
on
esia
Palm
oil
Oct
-14
Exp
ort
tax
Tem
po
rari
ly s
usp
end
ed a
var
iab
le t
ax o
n c
rud
e p
alm
oil
ship
men
ts, w
ith
a v
iew
to
sti
mu
late
exp
ort
s,
bri
ng
do
wn
do
mes
tic
inve
nto
ries
, an
d c
on
tain
dec
lines
in p
rice
s.
Oil
pal
mO
ct-1
4A
gri
cult
ura
l po
licy
Intr
od
uce
d n
ew le
gis
lati
on
reg
ula
tin
g p
lan
tati
on
ow
ner
ship
, wit
h a
vie
w t
o m
axim
ize
lan
d u
sag
e w
hile
en
suri
ng
ad
equ
ate
par
tici
pat
ion
of
smal
lho
lder
s in
th
e p
lan
tati
on
sec
tor.
Oil
pal
mO
ct-1
4En
viro
nm
enta
l po
licy
La
un
ched
th
e Su
stai
nab
le P
alm
Oil
Init
iati
ve (
SPO
I), a
nat
ion
al p
latf
orm
mea
nt
to h
elp
sm
all l
ow
-in
com
e g
row
ers
incr
ease
th
eir
pro
du
ctiv
ity
wh
ile a
do
pti
ng
en
viro
nm
enta
lly s
ou
nd
pra
ctic
es.
Palm
oil,
pal
mke
rnel
o
ilJa
n-1
5Tr
ade
po
licy
Intr
od
uce
d m
and
ato
ry le
tter
s o
f cr
edit
fo
r co
mm
od
ity
exp
ort
s, in
an
eff
ort
to
hel
p p
ub
lic e
nti
ties
gat
her
ac
cura
te r
eco
rds
of
fore
ign
exc
han
ge
flo
ws.
Bio
die
sel
Feb
-15
Ren
ewab
le e
ner
gy
po
licy
Rev
ised
th
e m
eth
od
use
d t
o s
et d
om
esti
c re
tail
pri
ces
for
bio
die
sel (
usi
ng
cru
de
pal
m o
il p
rice
s as
a
refe
ren
ce r
ath
er t
han
th
e p
rice
of
con
ven
tio
nal
die
sel)
.
Bio
die
sel
Mar
-15
Ren
ewab
le e
ner
gy
po
licy
An
no
un
ced
a r
ise
in m
and
ato
ry b
len
din
g o
f p
alm
oil-
bas
ed b
iod
iese
l in
to t
ran
spo
rt d
iese
l fu
el f
rom
10
per
cen
t to
15
per
cen
t.
Ital
yO
live
oil
Oct
-14
Mar
ket
reg
ula
tio
n
Pass
ed le
gis
lati
on
reg
ula
tin
g q
ual
ity
and
tra
nsp
aren
cy in
th
e vi
rgin
oliv
e o
il ch
ain
, in
lin
e w
ith
a n
ew E
U
dir
ecti
ve.
Ken
yaC
oco
nu
tFe
b-1
5Se
cto
r d
evel
op
men
t Es
tab
lish
ed a
new
bo
dy
wit
hin
th
e co
un
try’
s A
gri
cult
ure
, Fis
her
ies
and
Fo
od
Au
tho
rity
to
ove
rsee
th
e d
evel
op
men
t o
f th
e co
con
ut
ind
ust
ry in
co
asta
l reg
ion
s.
Rep
ub
lic o
f K
ore
a
Rap
esee
d, r
apes
eed
oil
Oct
-14
Bila
tera
l tra
de
Exem
pte
d C
anad
ian
rap
esee
d im
po
rts
fro
m p
ayin
g im
po
rt d
uti
es, a
nd
ag
reed
to
gra
du
ally
ph
ase
ou
t ta
riff
s o
n c
rud
e an
d r
efin
ed r
apes
eed
oil.
Soyb
ean
s, s
oyc
ake,
co
tto
nse
edca
ke,
veg
etab
le/a
nim
al f
at
Feb
-15
Imp
ort
po
licy
An
no
un
ced
tar
iff
po
licy
chan
ges
mea
nt
to s
tab
ilize
do
mes
tic
con
sum
er p
rice
s, i
ncl
ud
ing
th
e in
tro
du
ctio
n o
f vo
lun
tary
tar
iff-
rate
qu
ota
s fo
r so
ybea
ns,
an
imal
/veg
etab
le f
at f
or
anim
al f
eed
, so
ycak
e an
d c
ott
on
seed
cake
fo
r fe
ed. .

Ma
jor
po
licy
de
velo
pm
en
ts
84 85FOOD OUTLOOKMAY 2015
* A
col
lect
ion
of m
ajor
pol
icy
deve
lopm
ents
sta
rtin
g in
Jan
uary
201
1 is
ava
ilabl
e at
: htt
p://w
ww
.fao
.org
/eco
nom
ic/e
st/e
st-c
omm
oditi
es/c
omm
odity
-pol
icy-
arch
ive/
en/?
grou
pAN
Dco
mm
odity
=O
ilsee
ds,%
20oi
ls%
20an
d%20
mea
ls
CO
UN
TRY
PRO
DU
CT
DA
TEPO
LIC
Y C
ATE
GO
RY
/INST
RU
MEN
TD
ESC
RIP
TIO
N
Mal
aysi
a
Palm
oil
Oct
-14
to
Mar
-15
Exp
ort
tax
Susp
end
ed v
aria
ble
tax
on
cru
de
pal
m o
il ex
po
rts,
wit
h a
vie
w t
o s
tim
ula
te e
xpo
rts,
bri
ng
do
wn
d
om
esti
c in
ven
tori
es, a
nd
co
nta
in d
eclin
es in
pri
ces.
Palm
oil
Ap
r-15
Exp
ort
tax
Rea
ctiv
ated
th
e sl
idin
g e
xpo
rt t
ax r
egim
e fo
r cr
ud
e p
alm
oil,
wit
h a
vie
w t
o h
elp
sec
ure
ad
equ
ate
sup
plie
s fo
r th
e d
om
esti
c p
alm
oil
refi
nin
g in
du
stry
.
Paki
stan
Soyb
ean
sN
ov-
14Se
cto
r d
evel
op
men
t La
un
ched
a p
rog
ram
me
to p
rom
ote
do
mes
tic
soyb
ean
cu
ltiv
atio
n, w
ith
a v
iew
to
hel
p m
eet
mea
l d
eman
d b
y th
e d
om
esti
c p
ou
ltry
an
d a
qu
acu
ltu
re s
ecto
rs.
Veg
etab
le o
ilsJa
n-1
5Im
po
rt p
olic
yA
dd
ed a
ll m
ajo
r ed
ible
oils
(cr
ud
e an
d r
efin
ed)
to t
he
list
of
pro
du
cts
that
mu
st m
eet
Paki
stan
's q
ual
ity
stan
dar
ds
at t
he
imp
ort
sta
ge.
Phili
pp
ines
Co
con
ut
No
v-14
Sect
or
sup
po
rt
Pro
vid
ed s
tate
fu
nd
ing
to
reh
abili
tate
dam
aged
co
con
ut
tree
s in
are
as a
ffec
ted
by
typ
ho
on
Bo
ph
a in
la
te 2
012.
Co
con
ut
Dec
-14
Sect
or
dev
elo
pm
ent
Ap
pro
ved
su
pp
lem
enta
ry f
un
din
g f
or
the
Co
con
ut
Au
tho
rity
's a
ctiv
itie
s in
su
pp
ort
of
coco
nu
t fa
rmin
g.
Thai
lan
dPa
lm o
il Ja
n-1
5M
arke
t re
gu
lati
on
Ap
pro
ved
an
incr
ease
in p
alm
oil
reta
il p
rice
s, w
ith
a v
iew
to
sti
mu
late
th
e sa
le o
f ed
ible
oils
by
loca
l m
anu
fact
ure
rs.
Un
ited
Sta
tes
Oils
eed
sO
ct-1
4A
gri
cult
ura
l po
licy
Info
rmed
th
at (
as p
art
of
the
2014
Far
m B
ill)
a p
rog
ram
me
pro
vid
ing
rel
ief
to f
arm
ers
affe
cted
by
seve
re w
eath
er w
ou
ld b
e im
ple
men
ted
fro
m 2
015,
so
as
to o
ffer
bet
ter
risk
co
vera
ge
to f
arm
ers.
Soyb
ean
sO
ct-1
4M
arke
t re
gu
lati
on
Tem
po
rari
ly a
llow
ed, i
n Io
wa
Stat
e, c
ircu
lati
on
of
ove
rwei
gh
t tr
uck
load
s o
f ce
rtai
n p
rod
uct
s (i
ncl
ud
ing
so
ybea
ns)
, in
an
eff
ort
to
red
uce
pre
ssu
re o
n t
he
stat
e’s
ove
r-b
urd
ened
riv
er f
reig
ht
syst
em.
Bio
die
sel
No
v-14
Ren
ewab
le e
ner
gy
po
licy
Gra
nte
d f
eder
al s
up
po
rt f
or
the
pro
du
ctio
n o
f “
adva
nce
d b
iofu
els”
(fu
els
pro
du
ced
fro
m r
enew
able
b
iom
ass
oth
er t
han
mai
ze k
ern
el s
tarc
h);
elig
ible
fee
dst
ock
incl
ud
es v
eget
able
oils
an
d a
nim
al f
ats.
Bio
die
sel
Dec
-14
Ren
ewab
le e
ner
gy
po
licy
Ret
roac
tive
ly r
ein
stat
ed, f
or
cale
nd
ar y
ear
2014
, th
e b
iod
iese
l tax
ince
nti
ve t
hat
exp
ired
in J
anu
ary
2014
.
Bio
die
sel
Jan
-15
Ren
ewab
le e
ner
gy
po
licy
Allo
wed
Arg
enti
ne
bio
die
sel p
rod
uce
rs t
o a
pp
ly a
n a
lter
nat
ive
met
ho
d f
or
pro
vin
g t
hat
fee
dst
ock
use
d
to p
rod
uce
bio
die
sel w
as n
ot
gro
wn
on
def
ore
sted
lan
d, t
hu
s p
erm
itti
ng
bio
die
sel o
f A
rgen
tin
e o
rig
in
to b
enefi
t fr
om
US
bio
fuel
su
pp
ort
mea
sure
s.
Bio
die
sel
Feb
-15
Bio
die
sel p
olic
yG
ran
ted
, in
Iow
a St
ate,
a t
ax b
reak
on
sal
es o
f fu
el b
len
ds
con
tain
ing
at
leas
t 11
.per
cen
t o
f so
y-b
ased
b
iod
iese
l, w
ith
a v
iew
to
sp
ur
loca
l bio
die
sel u
sag
e.
Zam
bia
Edib
le o
ilsM
ar-1
5Im
po
rt p
olic
ySu
spen
ded
th
e is
suan
ce o
f lic
ense
s fo
r ed
ible
oil
imp
ort
s w
hile
car
ryin
g o
ut
inve
stig
atio
ns
abo
ut
po
ssib
le a
dve
rse
effe
cts
of
such
imp
ort
s o
n t
he
do
mes
tic
mar
ket.

Statistica
l ap
pe
nd
ix
104 105FOOD OUTLOOKMAY 2015
APPENDIX TABLE 10: TOTAL OILCROPS STATISTICS (million tonnes)
Production1 Imports Exports
10/11-12/13 2013/14 2014/15
10/11-12/132013/14 2014/15
10/11-12/13 2013/14 2014/15
average average average estim. f’cast estim. f’cast estim. f’cast
ASIA 133.4 136.0 134.5 82.8 99.6 105.7 2.5 2.7 2.5 China 60.1 59.9 59.8 62.7 77.8 82.0 1.2 1.1 1.0 of which Taiwan Prov. 0.1 0.1 0.1 2.3 2.3 2.4 - - - India 37.9 38.3 35.8 0.2 0.3 0.4 0.8 0.8 0.8 Indonesia 9.8 11.1 11.9 2.0 2.5 2.6 0.1 0.1 0.1 Iran, Islamic Republic of 0.7 0.7 0.7 0.5 0.4 0.5 - - - Japan 0.3 0.3 0.3 5.6 5.6 5.8 - - - Korea, Republic of 0.2 0.2 0.2 1.6 1.5 1.4 - - - Malaysia 4.9 5.0 5.1 0.7 0.7 0.7 - 0.1 0.1 Pakistan 5.2 5.4 5.7 1.2 1.4 1.5 - - - Thailand 0.7 0.8 0.9 2.0 2.0 2.1 - - - Turkey 2.6 3.3 3.1 2.2 2.6 3.3 0.1 0.1 0.1
AFRICA 17.0 17.1 17.7 3.2 3.5 3.7 0.9 0.7 0.7 Nigeria 4.8 4.9 5.0 - - - 0.2 0.1 0.1
CENTRAL AMERICA 1.5 1.6 1.8 6.1 6.3 6.5 0.2 0.2 0.2 Mexico 1.0 1.1 1.3 5.5 5.6 5.8 - - -
SOUTH AMERICA 142.5 164.2 175.2 1.3 1.6 1.7 52.6 64.3 63.6 Argentina 51.0 57.0 61.6 0.1 0.1 - 8.8 8.4 9.0 Brazil 78.1 89.8 97.7 0.2 0.5 0.5 36.2 47.0 46.9 Paraguay 7.2 9.3 8.4 - - - 4.7 5.0 4.0
NORTH AMERICA 115.6 124.4 141.0 2.2 4.1 2.6 50.9 60.2 64.8 Canada 19.7 24.8 23.1 0.6 0.6 0.7 11.8 13.5 14.6 United States of America 95.9 99.6 117.9 1.6 3.5 1.9 39.1 46.7 50.2
EUROPE 54.1 64.1 67.5 19.2 22.1 20.6 4.4 6.0 6.5 European Union 29.1 31.9 35.3 17.7 19.4 18.4 0.9 1.4 1.4 Russian Federation 10.6 13.5 13.6 1.0 2.3 1.8 0.3 0.5 0.5 Ukraine 12.4 16.1 16.3 - - - 2.9 3.5 4.0
OCEANIA 5.4 5.6 4.7 0.1 - 0.1 3.2 3.4 2.7 Australia 5.0 5.2 4.3 - - - 3.1 3.3 2.6
WORLD 469.4 513.0 542.3 114.8 137.3 140.9 114.7 137.4 140.8 Developing countries 289.0 313.1 323.1 86.9 104.5 111.0 56.0 67.5 66.6 Developed countries 180.4 200.0 219.2 27.9 32.8 29.8 58.7 69.8 74.2 LIFDCs 126.0 126.5 124.4 63.5 79.0 83.8 3.2 3.3 3.0 LDCs 10.9 10.9 10.9 0.5 0.6 0.7 0.5 0.4 0.4
1 The split years bring together northern hemisphere annual crops harvested in the latter part of the first year shown, with southern hemisphere annual crops harvested in the early part of the second year shown; for tree crops which are produced throughout the year, calendar year production for the second year shown is used.

Sta
tist
ica
l a
pp
en
dix
106 107FOOD OUTLOOKMAY 2015
APPENDIX TABLE 11: TOTAL OILS AND FATS STATISTICS 1 (million tonnes)
Imports Exports Utilization
10/11-12/13 2013/14 2014/15
10/11-12/132013/14 2014/15
10/11-12/13 2013/14 2014/15
average average average estim. f’cast estim. f’cast estim. f’cast
ASIA 41.1 43.2 44.7 45.7 48.2 49.1 92.7 103.3 106.3 Bangladesh 1.5 1.7 1.8 - - - 1.8 2.0 2.1 China 11.3 11.2 10.4 0.6 0.6 0.6 34.1 37.2 37.4 of which Taiwan Prov. 0.4 0.4 0.4 - - - 0.8 0.8 0.8 India 10.0 11.8 12.9 0.5 0.5 0.3 19.6 21.3 22.5 Indonesia 0.1 0.1 0.1 21.4 24.4 25.9 8.5 11.0 11.4 Iran 1.7 1.4 1.6 0.2 0.1 0.2 1.9 2.0 2.0 Japan 1.2 1.3 1.3 - - - 3.1 3.2 3.2 Korea, Republic of 1.0 1.1 1.1 - - - 1.4 1.4 1.5 Malaysia 2.4 1.0 1.5 19.3 18.8 18.4 3.9 4.2 4.7 Pakistan 2.4 2.7 2.8 0.2 0.1 0.1 4.0 4.5 4.6 Philippines 0.6 0.7 0.6 1.0 0.9 0.9 1.4 1.6 1.6 Singapore 0.9 0.8 0.8 0.2 0.2 0.2 0.7 0.7 0.6 Turkey 1.5 1.8 1.9 0.5 0.8 0.8 2.5 2.9 3.0
AFRICA 8.5 9.4 9.3 1.6 1.5 1.6 14.3 15.4 15.7 Algeria 0.6 0.5 0.6 - 0.1 - 0.7 0.7 0.7 Egypt 1.8 2.1 1.8 0.4 0.4 0.3 1.9 2.2 2.2 Nigeria 1.0 1.1 1.2 0.1 0.1 0.1 2.8 3.0 3.0 South Africa 0.9 0.9 0.8 0.1 0.1 0.1 1.2 1.4 1.4
CENTRAL AMERICA 2.5 2.5 2.6 0.8 1.0 1.0 4.8 5.0 5.1 Mexico 1.3 1.4 1.4 0.1 - - 3.2 3.3 3.4
SOUTH AMERICA 2.8 3.2 3.3 8.7 8.5 9.3 15.2 16.9 18.1 Argentina 0.1 - - 5.4 5.0 5.7 3.3 4.1 4.1Brazil 0.6 0.7 0.7 1.9 1.5 1.6 7.7 8.1 9.2
NORTH AMERICA 4.6 4.9 4.9 6.9 6.4 6.5 18.8 19.6 19.6 Canada 0.6 0.5 0.6 3.2 3.2 3.2 1.2 1.3 1.4 United States of America 4.1 4.4 4.4 3.6 3.2 3.3 17.6 18.3 18.3
EUROPE 13.2 14.0 13.7 7.7 10.5 9.8 36.4 37.5 37.7 European Union 10.8 11.5 11.1 2.9 3.0 3.1 30.1 31.2 31.2 Russian Federation 1.1 1.1 1.2 1.3 2.5 2.2 4.0 4.2 4.3 Ukraine 0.3 0.3 0.3 3.2 4.4 4.0 1.0 0.9 0.9
OCEANIA 0.6 0.7 0.7 1.8 1.8 1.9 1.1 1.3 1.3 Australia 0.5 0.6 0.6 0.7 0.7 0.7 0.7 0.9 1.0
WORLD 73.3 78.0 79.3 73.3 77.9 79.3 183.3 199.0 203.9 Developing countries 52.4 55.6 57.3 57.4 59.7 61.7 121.7 135.0 139.5 Developed countries 21.0 22.4 21.9 15.9 18.2 17.6 61.6 64.0 64.3 LIFDCs 31.9 35.2 35.9 4.1 4.2 4.0 73.0 79.8 81.6 LDCs 5.2 6.0 6.2 0.4 0.4 0.5 8.3 9.1 9.3
1 Includes oils and fats of vegetable, marine and animal origin.

Statistica
l ap
pe
nd
ix
106 107FOOD OUTLOOKMAY 2015
APPENDIX TABLE 12: TOTAL MEALS AND CAKES STATISTICS 1 (million tonnes)
Imports Exports Utilization
10/11-12/13 2013/14 2014/15
10/11-12/132013/14 2014/15
10/11-12/13 2013/14 2014/15
average average average estim. f’cast estim. f’cast estim. f’cast
ASIA 31.4 34.8 35.9 15.5 16.0 14.7 131.2 144.4 151.7 China 3.2 2.9 2.7 1.4 2.4 2.0 71.4 79.6 83.1 of which Taiwan Prov. 0.5 0.5 0.6 - - - 2.4 2.4 2.4 India 0.2 0.2 0.3 5.7 4.3 3.1 12.0 12.4 13.1 Indonesia 3.5 4.3 4.4 3.4 4.1 4.3 5.3 6.4 6.8 Japan 2.6 2.6 2.4 - - - 6.7 6.5 6.5 Korea, Republic of 3.5 4.0 4.0 0.1 0.2 0.2 4.7 5.0 5.1 Malaysia 1.2 1.4 1.5 2.5 2.6 2.6 1.9 2.1 2.2 Pakistan 0.7 0.8 1.1 0.2 0.2 0.3 3.3 3.7 3.9 Philippines 2.0 2.4 2.5 0.5 0.5 0.5 2.4 2.8 2.9 Saudi Arabia 0.7 0.8 0.9 - - - 0.7 0.9 0.9 Thailand 3.2 3.2 3.5 0.1 0.2 0.1 5.4 5.6 5.7 Turkey 1.7 2.3 2.5 0.2 0.2 0.1 3.9 5.0 5.7 Viet Nam 3.5 3.7 4.0 0.1 0.2 0.2 4.3 4.8 5.3
AFRICA 4.7 5.5 6.2 0.9 1.0 1.0 11.1 12.3 12.9 Egypt 1.0 1.1 1.3 - - - 2.5 2.7 2.9 South Africa 1.2 1.1 1.2 0.1 0.1 0.1 1.9 2.2 2.2
CENTRAL AMERICA 3.4 3.4 3.7 0.2 0.2 0.2 8.2 8.4 8.6 Mexico 1.8 1.7 2.0 0.1 0.1 0.1 6.1 6.2 6.3
SOUTH AMERICA 4.9 5.3 5.5 45.1 45.9 49.9 23.6 26.2 28.0 Argentina - - - 27.0 26.2 29.5 2.5 3.8 5.0 Bolivia - - - 1.4 1.8 1.8 0.1 0.1 0.2 Brazil 0.2 - - 14.0 14.0 14.6 14.6 15.4 15.7 Chile 1.0 1.2 1.3 0.3 0.3 0.3 1.4 1.6 1.7 Paraguay - - - 1.1 2.5 2.6 0.4 0.4 0.4 Peru 0.9 0.9 0.9 1.2 1.0 1.0 1.0 1.1 1.1 Venezuela 1.3 1.4 1.5 - - - 1.4 1.5 1.6
NORTH AMERICA 4.2 5.0 4.9 13.6 15.4 16.4 34.9 35.0 36.1 Canada 1.2 1.1 1.1 4.1 4.6 4.5 2.3 2.3 2.0 United States of America 3.1 3.9 3.8 9.6 10.9 11.9 32.7 32.7 34.1
EUROPE 31.2 30.0 30.9 6.6 8.0 7.7 61.5 64.7 67.1 European Union 28.5 27.3 28.1 1.4 1.1 1.2 54.0 56.0 57.5 Russian Federation 0.6 0.6 0.7 1.6 2.6 2.5 4.2 5.0 5.6 Ukraine - - - 3.1 3.9 3.5 0.9 1.3 1.6
OCEANIA 2.4 2.9 3.2 0.2 0.2 0.2 3.1 3.7 4.0 Australia 0.8 0.9 1.2 0.1 0.1 0.1 1.3 1.7 1.9
WORLD 82.2 86.8 90.2 82.2 86.8 90.2 273.6 294.7 308.5 Developing countries 40.0 44.7 47.2 61.5 63.0 65.7 163.6 180.6 190.6 Developed countries 42.2 42.1 43.0 20.7 23.8 24.5 110.0 114.1 118.0 LIFDCs 8.8 9.6 10.1 9.0 8.7 7.3 96.0 105.7 111.0 LDCs 0.6 0.7 0.8 0.4 0.5 0.5 3.8 4.0 4.1
1 Expressed in product weight; includes meals and cakes derived from oilcrops as well as fish meal and other meals from animal origin.

Sta
tist
ica
l a
pp
en
dix
118 119FOOD OUTLOOKMAY 2015
APPENDIX TABLE 24: SELECTED INTERNATIONAL PRICES FOR OILCROP PRODUCTS
International prices1 FAO indices
Period Soybeans 2 Soybean oil 3 Palm oil 4 Soybean
cake 5
Rapeseed
meal 6
Oilseeds Vegetable oils Oilcakes/
meals
.............................................. (USD per tonne) .............................................. ................... (2002-2004=100) ................
Annual (Oct/Sept)
2004/05 275 545 419 212 130 104 103 101
2005/06 259 572 451 202 130 100 107 96
2006/07 335 772 684 264 184 129 150 128
2007/08 549 1325 1050 445 296 216 246 214
2008/09 422 826 627 385 196 157 146 179
2009/10 429 924 806 388 220 162 177 183
2010/11 549 1308 1147 418 279 214 259 200
2011/12 562 1235 1051 461 295 214 232 219
2012/13 563 1099 835 539 345 213 193 255
2013/14 521 949 867 534 324 194 189 253
Monthly
2013 - October 544 989 866 555 318 202 188 262
2013 - November 556 992 921 541 316 206 199 257
2013 - December 568 979 907 548 336 210 196 260
2014 - January 566 935 871 539 337 208 189 256
2014 - February 594 991 911 571 361 219 198 271
2014 - March 501 1001 959 582 396 193 205 278
2014 - April 516 1005 911 563 375 198 199 269
2014 - May 522 973 896 552 340 197 195 263
2014 - June 514 933 859 531 304 192 189 251
2014 - July 480 886 839 477 272 178 181 226
2014 - August 457 855 755 485 265 170 167 229
2014 - September 433 850 714 463 265 162 162 219
2014 - October 430 835 724 463 258 161 164 218
2014 - November 447 827 728 485 265 167 165 228
2014 - December 446 816 694 449 278 168 161 213
2015 - January 421 789 681 431 279 159 156 206
2015 - February 407 775 693 412 273 154 157 197
2015 - March 402 748 673 392 262 152 152 188
2015 - April 396 753 657 380 263 151 150 183
1 Spot prices for nearest forward shipment 2 Soybeans: US, No.2 yellow, c.i.f. Rotterdam.3 Soybean oil: Dutch, fob ex-mill.4 Palm oil: Crude, c.i.f. Northwest Europe.5 Soybean cake: Pellets, 44/45 percent, Argentina, c.i.f. Rotterdam.6 Rapeseed meal: 34 percent, Hamburg, f.o.b. ex-mill. Notes:- The sudden drop in the FAO price index for oilseeds in March 2014 is due to a structural break in the underlying price series for soybeans (US no.2 yellow, c.i.f.
Rotterdam), the component with the highest weight. A look at alternative reference prices for soybeans reveals that, during March and April 2014, international soybean values have actually appreciated further rather than falling. For a detailed explanation of the anomalous trend in the soybean reference price, please refer to issue no. 58 of the Oilcrops Monthly Price and Policy Update (MPPU), which can be downloaded through the following link.
http://www.fao.org/fileadmin/templates/est/COMM_MARKETS_MONITORING/Oilcrops/Documents/MPPU_April_14.pdf - The FAO indices are based on the international prices of five selected seeds, ten selected oils and five selected cakes and meals.
Sources: FAO and Oil World.