Oil Shocks and their Impact on Energy Related Stocks in China · SEEDS SURREY Surrey Energy...
36
SEEDS SURREY Surrey Energy Economics ENERGY Discussion paper Series ECONOMICS CENTRE Oil Shocks and their Impact on Energy Related Stocks in China David C. Broadstock, Hong Cao and Dayong Zhang June 2012 SEEDS 137 School of Economics ISSN 1749-8384 University of Surrey
Transcript of Oil Shocks and their Impact on Energy Related Stocks in China · SEEDS SURREY Surrey Energy...
SEEDS SURREY
Surrey Energy Economics ENERGY
Discussion paper Series ECONOMICS
CENTRE
Oil Shocks and their Impact on
Energy Related Stocks in China
David C. Broadstock, Hong Cao and Dayong Zhang
June 2012
SEEDS 137 School of Economics ISSN 1749-8384 University of Surrey

The Surrey Energy Economics Centre (SEEC) consists of members of the School of Economics who work on energy economics, environmental economics and regulation. The School of Economics has a long-standing tradition of energy economics research from its early origins under the leadership of Professor Colin Robinson. This was consolidated in 1983 when the University established SEEC, with Colin as the Director; to study the economics of energy and energy markets.
SEEC undertakes original energy economics research and since being established it has conducted research across the whole spectrum of energy economics, including the international oil market, North Sea oil & gas, UK & international coal, gas privatisation & regulation, electricity privatisation & regulation, measurement of efficiency in energy industries, energy & development, energy demand modelling & forecasting, and energy & the environment.
SEEC research output includes SEEDS - Surrey Energy Economic Discussion paper Series (details at www.seec.surrey.ac.uk/Research/SEEDS.htm) as well as a range of other academic papers, books and monographs. SEEC also runs workshops and conferences that bring together academics and practitioners to explore and discuss the important energy issues of the day.
SEEC also attracts a large proportion of the School’s PhD students and oversees the MSc in Energy Economics & Policy. Many students have successfully completed their MSc and/or PhD in energy economics and gone on to very interesting and rewarding careers, both in academia and the energy industry.
Enquiries:
Director of SEEC and Editor of SEEDS: Lester C Hunt SEEC, School of Economics, University of Surrey, Guildford GU2 7XH, UK. Tel: +44 (0)1483 686956 Fax: +44 (0)1483 689548 Email: [email protected] www.seec.surrey.ac.uk
i
___________________________________________________________
Surrey Energy Economics Centre (SEEC)
School of Economics University of Surrey
SEEDS 137 ISSN 1749-8384
___________________________________________________________
OIL SHOCKS AND THEIR IMPACT ON ENERGY RELATED STOCKS IN CHINA
David C. Broadstock, Hong Cao and Dayong Zhang
June 2012
___________________________________________________________
This paper may not be quoted or reproduced without permission.

ii
ABSTRACT
This paper contributes to the current literature by adopting dynamic conditional correlation and asset pricing models to discover how the dynamics of international oil prices affect energy related stock returns in China. After conditioning for structural instability, the results show a much stronger relation following the 2008 financial crisis. We argue that this reflects the fact that investors in the Chinese stock market, especially for energy related stocks, are more sensitive to the shocks in international crude oil market. JEL Classifications: G12; G15. Key Words: Oil Prices; Energy Related Stocks; DCC; Asset Pricing; Structural Break.

Oil Shocks and their Impact on Energy Related Stocks in China Page 1 of 29
Oil Shocks and their Impact on
Energy Related Stocks in China
David C. Broadstock, Hong Cao and Dayong Zhang
1. Introduction
The relationship between oil prices and stock market returns has attracted enormous attention
in recent years. Different methods and alternative data sources have been used in various
studies, though it is generally agreed within the literature that international oil prices have a
significant and negative impact on stock market returns (for example: Jones and Kaul, 1996,
Sadorsky, 1999). The mechanism by which this effect is transmitted can be summarized as
follows: higher oil prices increase the cost of production for companies that directly or
indirectly require oil as an input; assuming that firms will not fully transfer rising costs onto
their customers/investors, profits will inevitably shrink hence reducing expected returns.
Therefore, the consequence of an oil shock upon the stock market will in general be negative.
Another indirect mechanism by which oil prices affect stock values comes from the stylized
fact that an increase of oil prices pushes up overall inflation. This can cause central banks to
respond by raising the interest rate, which will in turn affect stock prices.
Early studies on the relationship between oil prices and stock market returns mainly
concentrated on advanced economies. Following the internationalization of global capital
Acknowledgements The authors are grateful for discussion and comments received at the Surrey Energy Economics Centre (SEEC), University of Surrey, January 2011 and School of Contemporary Chinese Studies, University of Nottingham, January 2012, which helped to improve the paper. The authors are, of course, responsible for all errors and omissions.
David C Broadstock and Dayong Zhang are Associate Professors at the Research Institute of Economics and Management, Chengdu China, where Cao Hong is currently taking her PhD. David is also an associate member of the Surrey Energy Economics Centre (SEEC). All correspondence should be directed to Dayong Zhang at [email protected].

Oil Shocks and their Impact on Energy Related Stocks in China Page 2 of 29
markets, and the increasingly important role that emerging markets are playing in the world,
scholars have recently begun to investigate how international oil price affect stock markets in
emerging economies. Basher and Sadorsky (2006) provide one of the first comprehensive
studies of the impact of oil prices on emerging stock markets. They concluded that a strong
link exists between oil price risk (e.g. price volatility) and stock returns within emerging
markets. Our paper follows this direction of research and concentrates particularly on one of
the biggest emerging stock markets, China.
Despite the fact that China has surpassed Japan in 2003 to become second largest oil
consumer in the world (BP Statistical Review of World Energy, June 2004), only limited
work can be found in the literature investigating the relationship between international oil
price and stock market behavior in China. China has maintained a persistent high speed of
economic growth over the last two-three decades. This high speed growth and its associated
dramatic energy demand have had a significant impact on the world energy and financial
markets and have attracted a substantial amount of international attention. With the increased
energy dependence attached to China’s growth, there is a possibility that the Chinese financial
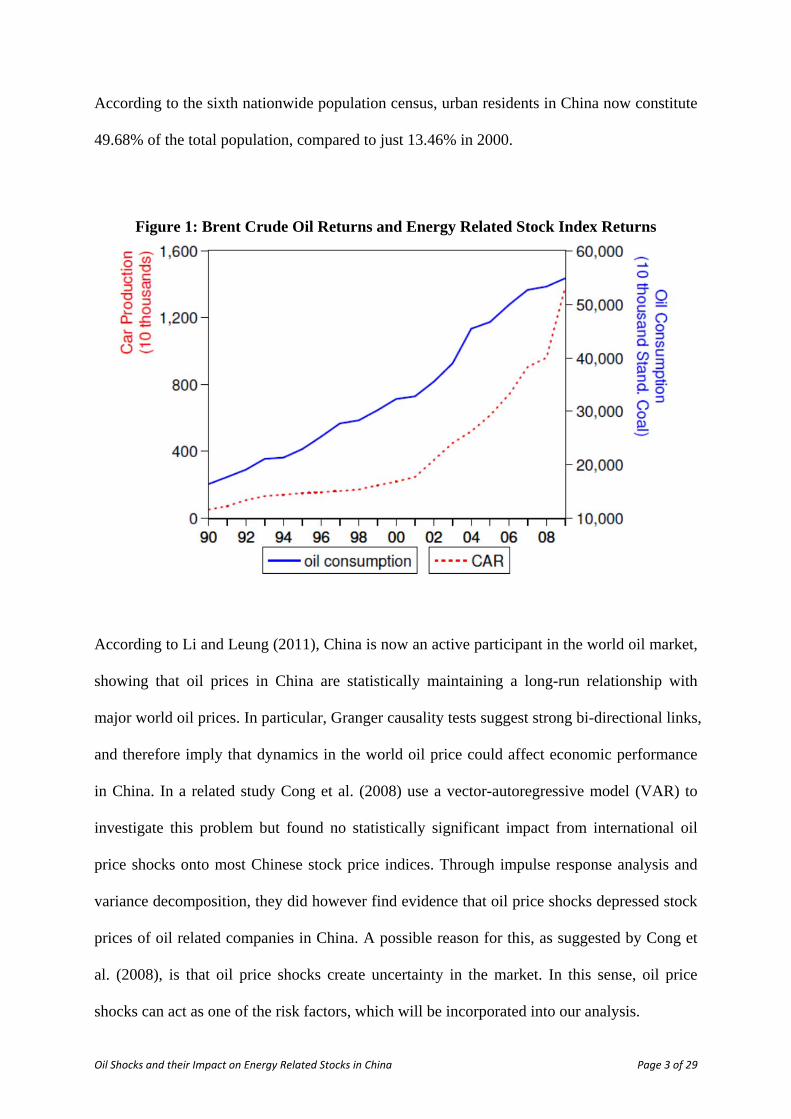
markets are more susceptible to global energy prices. This is highlighted in Figure (1) which
shows total oil consumption in China between 1990-2009 (on the secondary axis), and reveals
that oil consumption has increased consistently over the last two decades.
Taking the automobile industry as an example to show how the energy demand from China
may change, figure 1 also shows car production in China (on the primary axis) over the last
two decades. Total car production in the year 2000 was around 2.18 million; by the end of
2009 this figure had risen to about 13.83 million. Much of this growth is due to increased
income, but rapid urbanization in China is also speeding up growth in energy demand.
Oil Shocks and their Impact on Energy Related Stocks in China Page 3 of 29
According to the sixth nationwide population census, urban residents in China now constitute
49.68% of the total population, compared to just 13.46% in 2000.
Figure 1: Brent Crude Oil Returns and Energy Related Stock Index Returns
According to Li and Leung (2011), China is now an active participant in the world oil market,
showing that oil prices in China are statistically maintaining a long-run relationship with
major world oil prices. In particular, Granger causality tests suggest strong bi-directional links,
and therefore imply that dynamics in the world oil price could affect economic performance
in China. In a related study Cong et al. (2008) use a vector-autoregressive model (VAR) to
investigate this problem but found no statistically significant impact from international oil
price shocks onto most Chinese stock price indices. Through impulse response analysis and
variance decomposition, they did however find evidence that oil price shocks depressed stock
prices of oil related companies in China. A possible reason for this, as suggested by Cong et
al. (2008), is that oil price shocks create uncertainty in the market. In this sense, oil price
shocks can act as one of the risk factors, which will be incorporated into our analysis.

Oil Shocks and their Impact on Energy Related Stocks in China Page 4 of 29
Understanding how international oil prices may impact on oil related companies is an
interesting question and may further be extended to all energy related industries. In line with
the rapid growth of energy demand, the number of energy related firms in China has
expanded significantly as well in the last decades. For example, in our data set, there are only
11 listed firms in 2000 directly related to the oil and natural gas industry rising to 31 firms in
2011, for total energy related firms these numbers change from 58 to 122;1 accordingly their
market capitalization has also expanded significantly. In this paper, we therefore test the
relationship between international oil prices and stock market returns in China with a
particular focus on energy related companies. In addition to a composite energy index, three
sub-indices are also constructed2 for oil & natural gas, coal & electricity and new energy
sector.
This study extends the previous literature in three regards: Firstly, we explore the question
using weekly data. Most previous research either uses monthly data or daily data on the
premise that lower frequency data can average out too much important information while
higher frequency data (e.g. daily) can contain much more noise (e.g. day of week trading
effects etc). Using weekly data to investigate the relationship between oil price dynamics and
stock markets has also recently been done by Arouri (2011) and Fan and Xu (2011). Secondly,
Engle's (2002) Dynamic Conditional Correlation (DCC hereinafter) method is adopted to
acknowledge the time varying nature of the oil and stock market relationship, and which has
been used in recent related literature (for example, Filis et al. (2011)). We establish a Capital
Asset Pricing Model (CAPM)/Fama-French Three Factor Model, as opposed to the pure
1 Firms are selected according to China Securities Regulation Committee (CSRC) classification and Sina Finance http://finance.sina.com.cn/stock/, accessed on 11/11/2011).
2 We would like to thank an anonymous referee for her/his kind advice to further divide the full sample into three sub-sectors.

Oil Shocks and their Impact on Energy Related Stocks in China Page 5 of 29
econometric framework used in Cong et al. (2008). Furthermore, to incorporate the impact of
the international financial tsunami in 2008, structural changes are included in our model. We
conclude that international oil price shocks can be considered a systematic risk factor towards
energy related stock performance.
The paper is structured as follows: the next section reviews the relevant literature. Section 3
explains how we construct our energy related stock index and details the sources of data.
Section 4 explains the methodology used in the paper and discusses the empirical results. The
last section concludes.
2. Literature Review
Early studies investigating the financial implications of oil shocks focused on the economy
rather than the stock market. Hamilton (1983), the seminal paper looking at the relationship
between Gross National Product (GNP) and oil prices, used Granger causality tests to
examine the impact of oil price shocks on the US economy between 1949 and 1972 finding a
strong relationship between oil price and GNP growth in the US. Following this initial work,
Helliwell et al. (1986), Mork (1989), Lee, Ni and Ratti (1995), Lee and Ni (2002), Hamilton
(2003) and Zhang (2008) extended the analysis in various ways. As alluded to, these initial
works and many which followed mainly focused on the impact of oil shocks upon
macroeconomic indicators. Kilian (2008) provides a recent review of related literature.
People first started to look at the role of oil shocks upon stock market performance soon after
the seminal paper of Hamilton (1983). For example, Chen, Roll and Ross (1986) found that
US oil price changes are not priced within the stock market; Kaneko and Lee (1995) use oil
prices as a risk factor to explain Japanese equity market performance; and Jones and Kaul

Oil Shocks and their Impact on Energy Related Stocks in China Page 6 of 29
(1996) investigate the effects of changes in oil prices on stock prices. Jones and Kaul (1996)
estimate how oil shocks affect stock prices during the postwar period for four countries,
namely the US, Canada, Japan and the UK. The authors try to establish whether oil price
shocks affect international stock markets through changes in current and future expected cash
flows and confirmed so for the case of the US and Canada, whereas the impact on the UK and
Japan exceeds what a rational model can explain. In their paper, the percentage of changes in
oil price are explicitly incorporated into a regression that explains stock returns.
In much of the related literature vector autoregressive models (VAR) or vector error
correction models (VECM) are often applied. Huang et al. (1996) use a VAR model and
Granger Causality to test the relationship between daily returns of oil futures and U.S stock
returns. They show that during the 1980's oil futures affect individual oil companies but not
the broad index such as S&P 500. Sadorsky (1999) uses a VAR with monthly US data
between January 1947 and April 1996 to investigate how oil price changes affect real stock
returns. The results suggest both oil price and its volatility play important roles and the
explanatory power of oil price information increases after 1986 (following the 1985/1986 oil
counter shock). Ciner (2001) examines the causality between oil prices and stock return in the
US again, but allows for nonlinearity in the relationship, proving that a significant nonlinear
correlation exists. Using an unrestricted VAR model, Park and Ratti (2008) estimate the
effects of oil price shocks on real stock returns for the US and also 13 European countries.
They also allow for linear and nonlinear specifications in their model and found a significant
impact in the same month or within one month i.e. that the effect might be lagged. It is also
found that Norway, as an oil exporter, is shown to have significant positive response to oil
price shock unlike other oil importing countries. Apergis and Miller (2009) investigate this
problem using a sample of eight advanced economies, showing a significant though relatively
small impact from oil to the stock market exists. Miller and Ratti (2009) established a clear
Oil Shocks and their Impact on Energy Related Stocks in China Page 7 of 29
long-run relationship between crude oil price and international stock markets for six OECD
countries before 1999: stock market indices respond negatively to the oil shock in the long-
run, but this negative relationship disintegrated after September 1999. Their results suggest
existence of structural breaks in this relationship.
A number of studies diverge from country level investigation, looking instead at the
relationship between oil prices and the performance of specific industries. Faff and Brailsford
(1999) find that oil prices have a positive impact on energy related industries and a negative
impact on paper, packaging and transportation industries in Australia. Sadorsky (2001, 2003)
investigates the impact of oil prices using industry level data in Canada and the US
respectively. He finds a significant impact from oil to stock price returns in the oil and gas
industry for Canada; and for the US case, he reports a link between oil price shocks and
technology stock prices using monthly data from 1986 to 1999. El-Sharif et al. (2005)
conclude that rising oil prices increase the UK oil and gas sector equity index significantly.
Henriques and Sadorsky (2008) build a four variable VAR model that include alternative
energy stock prices, technology stock prices, oil prices and interest rates. Based on weekly
data from January 2001 to May 2007, they report that oil prices Granger cause the stock
prices of alternative energy companies. Some recent works by Gogineni (2010) and Arouri
and Nguyen (2010) suggest the response to an oil price shock differs by industry both in the
US and Europe.
In contrast to the rich literature associated with developed markets, the interactions between
international energy prices and emerging stock markets have not received as much attention
until recently, and perhaps unsurprisingly the conclusions are generally mixed. Maghyereh
(2004) uses a VAR model to study the relationship in 22 emerging economies. His results,
using daily data from January 1998 to April 2004, imply no significant impact on stock index

Oil Shocks and their Impact on Energy Related Stocks in China Page 8 of 29
returns. Hammoudeh and Eleisa (2004) investigate this issue for five members of the Gulf
Cooperation Council (Bahrain, Kuwait, Oman, Saudi Arabia and the United Arab Emirates)
and show the link only exists for the Saudi Arabian stock market. Basher and Sadorsky (2006)
show strong evidence of oil price as a risk factor influencing stock returns in a large set of
emerging stock markets. Hammoudeh and Li (2008) found that `important' events such as the
1997 Asian financial crisis, the collapse of oil prices in 1998 and the adoption of the price
band mechanism by OPEC in 2000 had consistent impacts on the Gulf area Arab stock
markets. Masih et al. (2011) estimate a VECM model for Korea and find that oil price and its
volatility have a significant impact on the stock market.
With respect to China specific studies, although many studies (Henriques and Sadorsky, 2008;
Masih et al., 2011 and Filis et al., 2011) have pointed out the importance of the booming
demand of oil in China, only limited work has been done to understand the link between
global energy prices and domestic market performance. Fan et al. (2007) simulate the impact
of international crude oil prices on the Chinese economy with a computable general
equilibrium model and show a generally negative influence on GDP, investment,
consumption, imports and exports. The aforementioned Cong et al. (2008) study explicitly
considers how international oil prices affect the performance of the Chinese stock market.
This remains an under-researched area of the literature.
In terms of methodological considerations, the dynamic conditional correlation (DCC) model
by Engle (2002) deals with time varying correlations and this method has only very recently
been applied to investigate oil and stock market relationships. Choi and Hammoudeh (2010)
apply the DCC model to investigate relationships between commodity prices including oil,
copper, gold and silver with the S&P 500 index and show evidence of increasing correlations
between all commodities since 2003 but decreasing correlations with the stock index. Chang

Oil Shocks and their Impact on Energy Related Stocks in China Page 9 of 29
et al. (2010) show that, in the US, conditional correlations between crude oil prices and stock
returns are not constant. Filis et al. (2011) separate oil importing and exporting countries in
their analysis and using a dynamic conditional correlation generalized autoregressive
conditionally heteroskedastic model show that oil prices have a negative effect on all stock
markets with only one exception during the 2008 financial tsunami period.
There are alternative approaches, for example Chang et al. (2011) examine the performance of
several multivariate volatility models using crude oil spot and future returns including the
DCC model. They showed that the diagonal BEKK method provided the highest `hedge
effectiveness' (noting the context of the paper being on portfolio hedging), whereas the DCC
model only marginally under-performs against the BEKK results. There are debates on how to
discriminate between different multivariate GARCH models, for example, Caporin and
McAleer (2008) found that the BEKK and DCC model are very similar; from a theoretical
perspective Caporin and McAleer (2011) provide very useful discussion over competing
models, tending to favor BEKK over DCC. Sadorsky (2012) uses four multivariate GARCH
models (BEKK, Diagonal, CCC and DCC) to investigate the correlations and volatility
spillovers between oil prices, stock prices of clean energy companies and technology stock
prices. He concludes that the DCC MGARCH model is preferred over the other models and
the dynamic conditional correlations for each pair of series reached to the highest level in
2008.
3. Data
The data used in this paper are weekly frequency time series data covering the period January
7, 2000 to May 27, 2011. For the crude oil prices, following Cong et al. (2008), the European

Oil Shocks and their Impact on Energy Related Stocks in China Page 10 of 29
Brent crude oil fixed order book (FOB) price, in Dollars per Barrel from the US Energy
Information Administration (EIA) are used.
Table 1: Information on the energy related indices
Sectors Number of companies
Description
Overall Energy Related 58 to 122 All companies included in the sub-sectors
Oil and Gas 11 to 31 Oil and natural gas related, Petrochemical
Coal and Electricity 46 to 90 Coal (mining, production & supply) & Electricity
industry
New Energy 11 to 15 New energy, alternative energy
Note: The number of companies in each sector increases over time; therefore, we report the range. Some companies operate across several sectors; we select the companies according to their main business.
Figure 2: Brent Crude Oil Returns and Energy Related Stock Index Returns

Oil Shocks and their Impact on Energy Related Stocks in China Page 11 of 29
Chinese stock market data are collected from the financial database RESSET. 3 The energy
related stock price index covers stocks in the electricity, coal, new energy, oil and natural gas
sectors. The number of stocks in this portfolio varies over time, increasing from 58 stocks in
2000 to 122 stocks in 2011 (see Table 1). An equal weighted index4 is then constructed and
the returns are plotted alongside with the Brent crude oil returns in Figure (2), and the returns
of the three sub-indices are plotted in Figure (3), also against the Brent crude oil returns.
Table 2: Descriptive statistics
tO teR , toR , tcR , tnR , tmR , tSMB tHML
Mean 0.0025 0.003 0.0029 0.0031 0.0028 0.0005 -0.0008 -0.0001
Median 0.0069 0.0022 0.0026 0.0018 0.0028 0.0003 -0.0001 0
Maximum 0.2002 0.1891 0.1881 0.2036 0.1624 0.0992 0.0212 0.0188
Minimum -0.2316 -0.1705 -0.1994 -0.2067 -0.2033 -0.0631 -0.0289 -0.0242
Std. Dev 0.0453 0.0438 0.0437 0.0465 0.044 0.0159 0.0064 0.0051
Skewness -0.6547 -0.2794 -0.399 -0.1367 -0.4364 0.2367 -1.0885 -0.3894
Kurtosis 5.0831 5.4108 5.6473 5.2146 6.48 6.7919 6.1071 5.149
ARCH(1) 7.4733*** 6.7998*** 5.8033** 7.1960*** 5.4403** 0.2475 2.9798* 1.4556
ARCH(4) 29.5361*** 35.4764*** 28.6467*** 39.1026*** 38.3590*** 39.7435*** 5.956 18.3147***
Note: The ARCH(p) LM test is to test the null hypothesis of no ARCH effects at order p. The superscript *, ** and *** represents significant level at 10%, 5% and 1% respectively.
3 http://www.resset.cn/en/
4 A value weighted index is also available. However, given the stock market reform in China in which non-tradable stocks were allowed to be reclassified as tradable, it is possible that using value weighted index may have undesirable effects. Nevertheless, the results using value weighted are also available on request, with no substantial differences.

Oil Shocks and their Impact on Energy Related Stocks in China Page 12 of 29
Figure 3: Brent Crude Oil returns and Returns of Sub-indices.

Oil Shocks and their Impact on Energy Related Stocks in China Page 13 of 29
The Fama-French three factors, namely, HML (High Minus Low Book-to-Market ratio), SMB
(Small Minus Big according to market capitalization) and RM (Return on the Market) are also
collected from the RESSET database. These variables are constructed by the database using
standard industry definitions. Some descriptive statistics are given in Table (2). The variables
are defined using the following notations throughout the remainder of this paper:
tO : Percentage changes of European Brent Oil Price
tSMB : SMB factor
tHML : HML factor
tmR , : Market return factor
teR , : Energy related index returns
toR , : Oil and Natural Gas index returns
tcR , : Coal and Electricity index returns
tnR , : New energy index returns
The kurtosis of all variables is generally over 3 suggesting a potential `fat-tail' problem.
ARCH-LM tests on each return series also confirms the existence of heteroscedasticity and
motives the use of a GARCH specification of the residual process in the empirical analyses to
be described later in the paper.

Oil Shocks and their Impact on Energy Related Stocks in China Page 14 of 29
Figure 4: Rolling Windows Estimation of Correlations
To begin to establish how returns in the international oil market relate to the performance of
our energy related stock portfolios, we first estimate the correlations between oil price and
energy related stocks using a rolling windows regression. We choose window sizes of (i) one
fifth and (ii) one third of the total observations, which correspond to window sample sizes of
114 and 190 observations. The results provide strong evidence that correlations are time
varying (see Figure 4), and increase dramatically during the middle of 2008.
4. Methodology and Empirical Results
This section describes the main methodological framework, and presents the empirical results.
Firstly given the rolling window regression in the previous section, a further perspective on

Oil Shocks and their Impact on Energy Related Stocks in China Page 15 of 29
the correlation between oil prices and energy related stock returns is given by more formally
considering whether it evolves over time. After demonstrating a complex inter-temporal
dependence, we then consider how to evaluate the dependence of returns on oil prices in the
widely used CAPM/Fama-French three factor framework. Finally structural breaks are
introduced, after which the dynamic conditional correlation is reasonably well approximated
using more conventional GARCH methods for the residuals of the returns function.
Dynamic Conditional Correlation (DCC)
Engle (2002) proposed the DCC as a method to describe the time varying nature of
conditional correlations among variables. In this model, a series of data (in this case market
returns tr ) are assumed to follow a conditionally normal distribution:
),0(~| 1 ttt N HIr (1)
where 1tI is the information set at time t-1, tttt DRDH is the conditional covariance
matrix and tD is given by:
tt diag HD (2)
ht is the conditional variance estimated from a univariate GARCH model, as follows:
l
kltili
p
kktikiiit hh
1,,
1,, (3)
The main distinction of the DCC model compared to standard GARCH processes comes in
terms of the time varying correlation matrix tR :
2/12/1 )()( tttt diagdiag QQQR (4)
Where the symmetric positive definite covariance matrix tQ is computed using:
111 )()1( tttt baba QzzsQ (5)

Oil Shocks and their Impact on Energy Related Stocks in China Page 16 of 29
In which ttt rDz 1 are the standardized residuals, a and b are constant parameters and s is
the unconditional correlation matrix of tz .
The estimated dynamic conditional correlations between oil prices and energy related stock
returns are plotted in Figure (5).5 We can conclude from the results that the relationship is
indeed time-varying; thus, using constant correlations will not adequately reflect the true
underlying dynamics. The conditional correlations between international oil price changes
and energy related stock returns in China are generally low before the year 2008, even taking
negative values during some very short periods.
Figure 5: DCC between Oil prices and Energy Related Returns
5 The estimates (standard errors in parentheses) for the a and b terms in the DCC models are as follow: a=0.0117(0.0104), b=0.9716 (0.03298).

Oil Shocks and their Impact on Energy Related Stocks in China Page 17 of 29
Consistent with the preliminary rolling windows estimation, the strength of correlation is
demonstrably larger in the period following the financial tsunami with correlations rising
above 0.2 in the post-crisis period. One possible explanation for this phenomenon can be
inferred from domestic development policies: The underlying macroeconomic policy in China
is to maintain a high speed of economic growth and has successfully achieved this during
recent years. Ensuring persistent growth rates even while the global economy is experiencing
unprecedented recession has required innovative measures in order to avoid being exposed by
traditionally high export levels. To counterbalance losses incurred within exporting
manufacturing industries, policy has sought to rapidly increase the rate of urbanization, in
addition policy has helped to stimulate the automobile industry, and improve domestic high
speed rail infrastructure. For example, in 2009, the Chinese government halved the purchase
tax for cars with engine size less than 1.6 liters. These policy changes speed up growth in
energy demand in China, consequently investors in China are increasingly exposed to
international oil price dynamics.
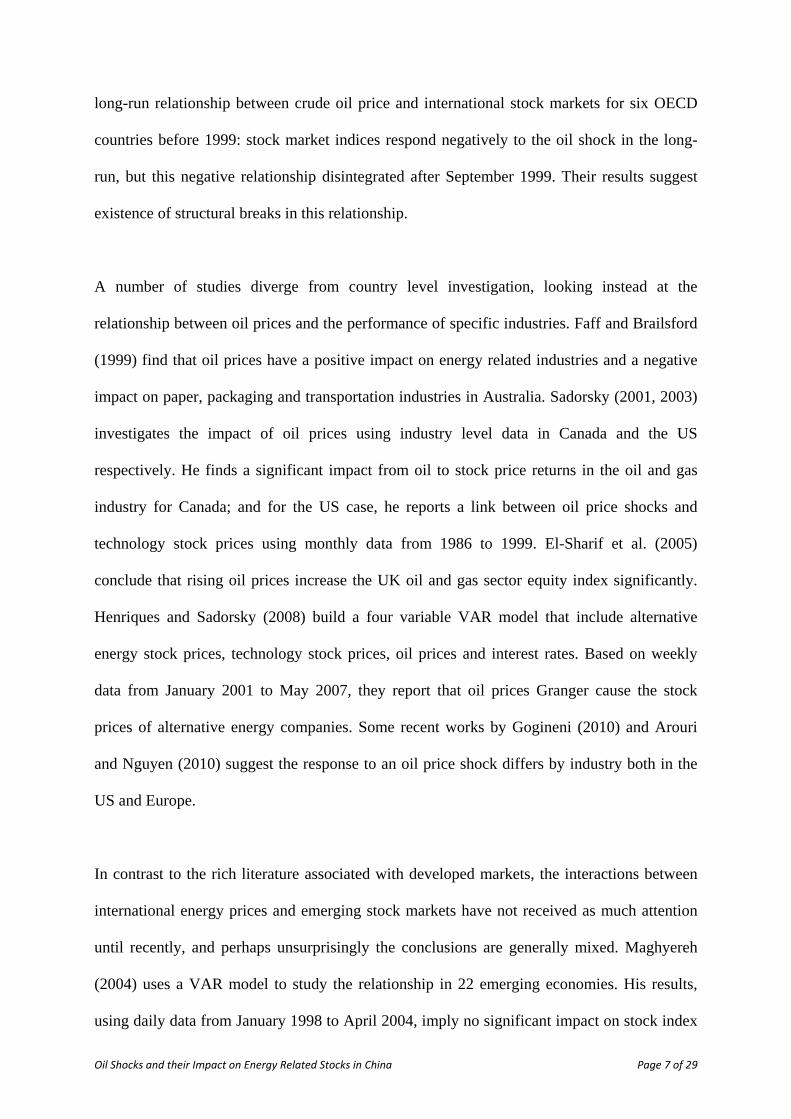
Further exploring the dynamic conditional correlations between oil return and the three sub-
indices, we can see they are roughly following similar patterns (see Figure 6).6 The dynamics
of correlations of oil & natural gas and coal & electricity are almost identical, though new
energy sector behaves a little differently exhibiting similar trends, but with differing orders of
magnitude.
6 The estimates (standard errors in parentheses) for the $a$ and $b$ terms in the DCC models for sub-indices are as follow: Oil & Natural Gas: a=0.0151 (0.0113), b=0.9652 (0.0342); Coal & Electricity: a=0.0117 (0.0092), b=0.9755 (0.0260); New Energy: a=0.0057 (0.0121), b=0.9708 (0.0848).
Oil Shocks and their Impact on Energy Related Stocks in China Page 18 of 29
Figure 6: DCC between Oil prices and Returns of Sub-indices
CAPM and Three-Factor Model
The next question is to what extent the international energy price dynamics can be used to
explain returns of the energy related stocks in China. In this subsection, we use the market
model and the Fama-French three factor model to investigate this problem. Here we first
specify three models:
Model 1, a simple linear relationship between percentage of oil price changes and the return
of energy related stock returns:
ttte OR . (6)

Oil Shocks and their Impact on Energy Related Stocks in China Page 19 of 29
Model 2, the market model, in which the percentage rate of oil price changes is included as an
additional factor. The systematic risk in this model is then controlled by the CAPM beta
coefficient:
ttmtte ROR .1. (7)
Model 3, the Fama-French three-factor model, which further includes the SMB and HML
factors described previously:
ttttmtte HMLSMBROR 32.1. (8)
Given the evidence of dynamic conditional correlation, it is necessary to consider that the
residuals t may follow an autoregressive conditionally heteroskedastic (ARCH) process.
Taking Model 1 as an example, the residual ARCH(1) LM test statistic is 4.426 and it is
significant at the 5% level thus we are able to reject the null hypothesis of no ARCH(1)
effects; higher order tests are also statistically significant further suggesting existence of the
ARCH effect. Therefore, each model is re-estimated assuming a GARCH(1,1) process in the
residuals. A `G' is added to each model to denote the GARCH augmented regression. The
results are reported in Table (3).
Model 1 and 1.G have very low explanatory power in terms of R-squared, although we find a
statistically significant positive coefficient on the oil returns, it disappears after we account
for the GARCH(1,1) effects. Under initial inspection it would seem that the positive
relationship between oil returns and the returns of energy related stocks in China is due to
mis-specification of the residual process.

Oil Shocks and their Impact on Energy Related Stocks in China Page 20 of 29
Table 3. Market model and the three-factor model Model 1 Model 1.G Model 2 Model 2.G Model 3 Model 3.G
Constant 0.0027 0.0008 0.0021 0.001 0.0035** 0.0021
(0.0018) (0.0014) (0.0016) (0.0014) (0.0016) (0.0014)
Oil Returns 0.1199*** 0.0529* 0.1212*** 0.0556* 0.1204*** 0.0639**
(0.0394) (0.0319) (0.0357) (0.0305) (0.0345) (0.0303)
Market Returns 1.1630*** 1.0990*** 1.0301*** 1.0075***
(0.102) (0.082) (0.1022) (0.081)
HML -0.1674 -0.0571
(0.316) (0.2409)
SMB 1.6747*** 1.1575***
(0.258) (0.2134)
R2 0.0154 0.0083 0.1926 0.1866 0.2525 0.2417
Note: Model *.G are estimated assuming a GARCH(1,1) process in the residuals, whereas the mean equation are the same as Model *s. The GARCH estimates are not reported. The superscript *, ** and *** represents significant level at 10%, 5% and 1% respectively. Standard errors are in parenthesis.
Allowing for Structural Break
Motivated by the results of the DCC estimation and in line with previous related literature, the
financial tsunami is believed to impose a significant amount of influence in this relationship.
Therefore, it is further appropriate to test whether there is evidence of clear structural break in
the previous regressions.
The classical test for structural change is the Chow (1960) test, which splits the sample into
two sub-periods, and tests equality of the estimated parameters in the two sub-samples with a
standard F-statistic. Quandt (1960) proposed an alternative method to evaluate the Chow test
over all possible break dates and then use the largest value to identify the break point.
Andrews (1993), Andrews and Ploberger (1994) and Hansen (1997) propose that using
FSup _ , nFExp_ and nFAve_ statistics are an appropriate means of formally evaluating

Oil Shocks and their Impact on Energy Related Stocks in China Page 21 of 29
the Quandt (1960) test, also providing the relevant critical values and methods to calculate p-
values.
Suppose nF is the Chow statistic of the hypothesis without structural change, the statistics are
defined as:
)(sup_21
kFFSup nkkkn (9)
2
1
)(2
1exp
1
1ln_
12
k
ktnn kF
kkFExp (10)
2
1
)(1
1_
12
k
ktnn kF
kkFAve (11)
In which 1k and 2k are the trimming points for the start and end of the time series and k is the
period being tested for the break.7 The tests are applied to full structural breaks where all
coefficients are affected as well as possible partial breaks where only some of the coefficients
alter. The results reveal evidence of a partial break and that the only variable which proved to
be unstable in the regression was the international oil price. The results are given in Table (4):
Given the significant evidence of a structural break, we further divide the sample into two
parts and estimate the models for each of the sub-samples. The breaking point is taken as
March 21, 2008 according to the test results for Model 3. The selection is also quite consistent
with a recent study by Fan and Xu (2011), who report three stages of international oil market
7 Specifically, the initial 1,...,k1 and final k2,...,T observations are excluded from the test. The trimming values are usually set to exclude the initial 15% and final 15% of observations.

Oil Shocks and their Impact on Energy Related Stocks in China Page 22 of 29
fluctuations. They suggest a break point of June 13, 2008 separates Bubble accumulation and
the Global economic crisis. The results of sub samples are given in Table (5). Model 1/1.G is
omitted given its very low explanatory power in previous estimation results.
Table 4: Structural stability tests Model 1 Model 2 Model 3
Sup_F Statistic 12.1754 12.0479 15.158
P-value 0.0095 0.0101 0.0023
Break point 8/1/2008 8/31/2007 3/21/2008
Exp_F Statistic 3.3568 3.8272 5.0873
P-value 0.0094 0.0046 0.0004
Ave_F Statistic 4.7512 5.5812 7.0649
P-value 0.0097 0.0042 0.0005
Note: We assume a partial structural break of the coefficient on oil returns and the p values are calculated using Hansen’s (1997) method.
Table 5. Sub-sample analysis Sub-sample I Sub-sample II
Model 2 Model 2.G Model 3 Model 3.G Model 2 Model 2.G Model 3 Model 3.G
Constant 0.0033** 0.0011 0.0049*** 0.0024 -0.0004 0.0008 0.0007 0.0019
(0.0017) (0.0015) (0.0016) (0.0016) (0.0038) (0.0033) (0.0038) (0.0032)
Oil returns 0.0361 0.0131 0.025 0.0176 0.2747*** 0.2998*** 0.2895*** 0.3194***
(0.0393) (0.033) (0.0375) (0.034) (0.0743) (0.0847) (0.0726) (0.0787)
Market
returns 1.1619*** 1.0763*** 0.9988*** 0.9762*** 1.1580*** 1.0716*** 1.0561*** 0.9358***
(0.1228) (0.0924) (0.1225) (0.0921) (0.1857) (0.0041) (0.1871) (0.1943)
HML -0.0763 -0.0222 -0.4855 1.0104
(0.3347) (0.2917) (0.7419) (0.6124)
SMB 1.8168*** 1.2885*** 1.4684*** 1.8668***
(0.2789) (0.2563) (0.5802) (0.5167)
R2 0.1746 0.1693 0.2517 0.2416 0.2469 0.2449 0.2946 0.2751
Note: The model specification is the same as the full sample regressions. We divide the sample at 3/21/2008. The
superscript *, ** and *** represents significant level at 10%, 5% and 1% respectively. Standard errors are in parenthesis.

Oil Shocks and their Impact on Energy Related Stocks in China Page 23 of 29
The evidence clearly demonstrates that international oil returns and the returns of energy
related stocks in China are not related to each other in the first sub-sample. However, oil
returns and energy stock returns in China are positively connected in the second sub-sample
with a high degree of statistical confidence. These results remain consistent whether GARCH
effects are controlled for or not. The implication is therefore that a 1% change in the
international oil price will trigger around 0.3% change in the same direction in the energy
related portfolio. This result is very consistent with Sadorsky's (2001) empirical findings for
Canada. The conclusion is also intuitive given that oil related companies in china may enjoy
higher returns owing to higher prices, while alternative energy stocks may benefit from
increased investment activity as the incentive to find alternatives to oil increases with price
rises.
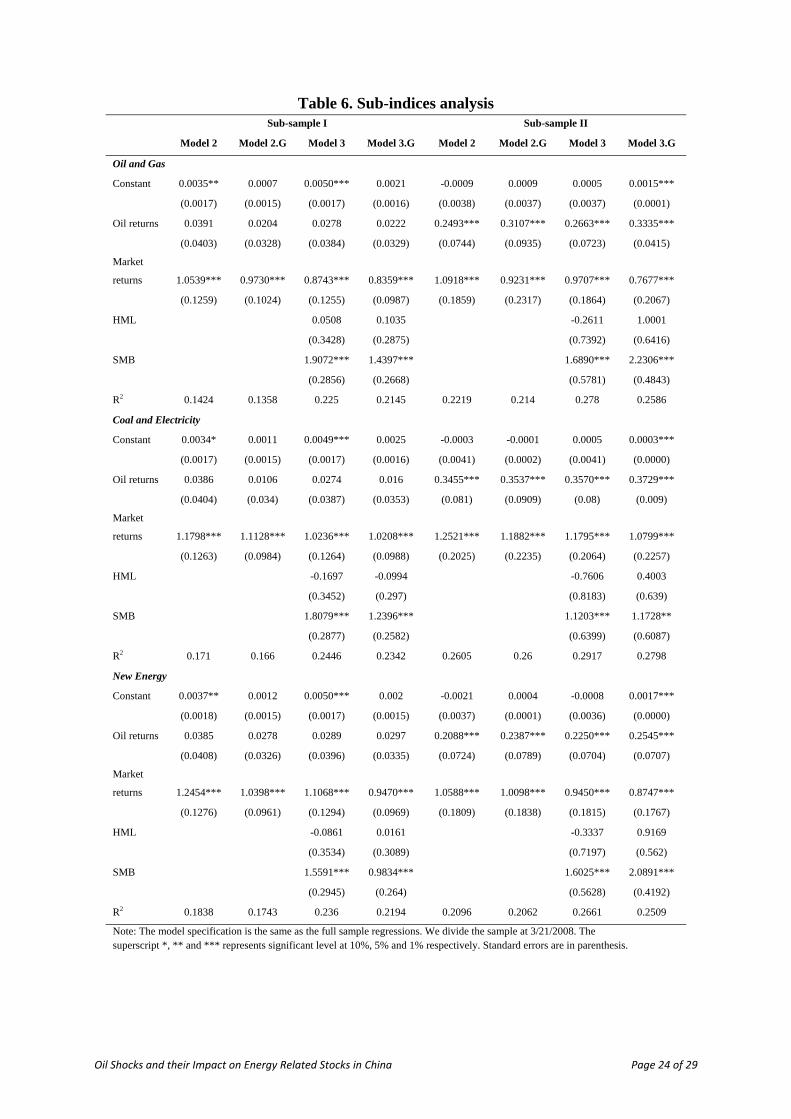
Sub-indices analyses
The same empirical framework used above is also applied to the three aforementioned sub-
indices. Regression results are reported in Table (6) for the two sub-sample periods. For all
sub-indices, the international oil returns proved to be insignificant in general for all models
and all sub sectors in the first sub-sample. However, the impacts are statistically significantly
positive for the second sub-sample, which is the period after the financial crisis. There are no
discernible differences between Oil & Natural Gas, Coal & Electricity and the main energy
related index. However, the sensitivity of the new energy sector returns to international oil
shocks are seemingly much smaller. This is consistent with the behavior exhibited by the
DCC analysis, which revealed broadly similar trends but with differing orders of magnitude.
Oil Shocks and their Impact on Energy Related Stocks in China Page 24 of 29
Table 6. Sub-indices analysis Sub-sample I Sub-sample II
Model 2 Model 2.G Model 3 Model 3.G Model 2 Model 2.G Model 3 Model 3.G
Oil and Gas
Constant 0.0035** 0.0007 0.0050*** 0.0021 -0.0009 0.0009 0.0005 0.0015***
(0.0017) (0.0015) (0.0017) (0.0016) (0.0038) (0.0037) (0.0037) (0.0001)
Oil returns 0.0391 0.0204 0.0278 0.0222 0.2493*** 0.3107*** 0.2663*** 0.3335***
(0.0403) (0.0328) (0.0384) (0.0329) (0.0744) (0.0935) (0.0723) (0.0415)
Market
returns 1.0539*** 0.9730*** 0.8743*** 0.8359*** 1.0918*** 0.9231*** 0.9707*** 0.7677***
(0.1259) (0.1024) (0.1255) (0.0987) (0.1859) (0.2317) (0.1864) (0.2067)
HML 0.0508 0.1035 -0.2611 1.0001
(0.3428) (0.2875) (0.7392) (0.6416)
SMB 1.9072*** 1.4397*** 1.6890*** 2.2306***
(0.2856) (0.2668) (0.5781) (0.4843)
R2 0.1424 0.1358 0.225 0.2145 0.2219 0.214 0.278 0.2586
Coal and Electricity
Constant 0.0034* 0.0011 0.0049*** 0.0025 -0.0003 -0.0001 0.0005 0.0003***
(0.0017) (0.0015) (0.0017) (0.0016) (0.0041) (0.0002) (0.0041) (0.0000)
Oil returns 0.0386 0.0106 0.0274 0.016 0.3455*** 0.3537*** 0.3570*** 0.3729***
(0.0404) (0.034) (0.0387) (0.0353) (0.081) (0.0909) (0.08) (0.009)
Market
returns 1.1798*** 1.1128*** 1.0236*** 1.0208*** 1.2521*** 1.1882*** 1.1795*** 1.0799***
(0.1263) (0.0984) (0.1264) (0.0988) (0.2025) (0.2235) (0.2064) (0.2257)
HML -0.1697 -0.0994 -0.7606 0.4003
(0.3452) (0.297) (0.8183) (0.639)
SMB 1.8079*** 1.2396*** 1.1203*** 1.1728**
(0.2877) (0.2582) (0.6399) (0.6087)
R2 0.171 0.166 0.2446 0.2342 0.2605 0.26 0.2917 0.2798
New Energy
Constant 0.0037** 0.0012 0.0050*** 0.002 -0.0021 0.0004 -0.0008 0.0017***
(0.0018) (0.0015) (0.0017) (0.0015) (0.0037) (0.0001) (0.0036) (0.0000)
Oil returns 0.0385 0.0278 0.0289 0.0297 0.2088*** 0.2387*** 0.2250*** 0.2545***
(0.0408) (0.0326) (0.0396) (0.0335) (0.0724) (0.0789) (0.0704) (0.0707)
Market
returns 1.2454*** 1.0398*** 1.1068*** 0.9470*** 1.0588*** 1.0098*** 0.9450*** 0.8747***
(0.1276) (0.0961) (0.1294) (0.0969) (0.1809) (0.1838) (0.1815) (0.1767)
HML -0.0861 0.0161 -0.3337 0.9169
(0.3534) (0.3089) (0.7197) (0.562)
SMB 1.5591*** 0.9834*** 1.6025*** 2.0891***
(0.2945) (0.264) (0.5628) (0.4192)
R2 0.1838 0.1743 0.236 0.2194 0.2096 0.2062 0.2661 0.2509
Note: The model specification is the same as the full sample regressions. We divide the sample at 3/21/2008. The superscript *, ** and *** represents significant level at 10%, 5% and 1% respectively. Standard errors are in parenthesis.

Oil Shocks and their Impact on Energy Related Stocks in China Page 25 of 29
5. Conclusions
In this paper we have investigated the relationship between international oil prices and energy
related stocks in China. Being the second biggest economy and also the second largest stock
market in the world, there is more and more interest in investigating such economic behavior
in China. The financial tsunami which occurred in 2008 shocked the world and illustrated
how fragile the international financial system could be, and more importantly, how rapidly the
international balance of globalization can change. International dependencies are not just
limited to international trade, but also link to financial markets, natural resources and
government policy choices.
Using the Engle (2002) dynamic conditional correlation model, and which has recently been
introduced and used to analyze the relationship between oil prices and stock markets, our
empirical results demonstrated that international oil price changes are correlated with energy
related stock returns in the context of China, but in a time varying way. There is a clear sharp
increase in the conditional correlation after mid 2008, which corresponds to the onset of the
financial tsunami. We believe that this significant change in the correlation reflects the fact
that investors in the Chinese stock market, especially for energy related stocks, are more
sensitive to price volatility in international crude oil market. Sudden increases in oil prices
will boost returns in energy related investment and a consequence of the financial crisis was
that oil markets became more volatile, hence higher returns.
A higher return in energy related stocks may reflect that the market requires compensation for
increased risk, therefore, we test the hypothesis that oil price changes are one type of
systematic risk. A general market model and also the Fama-French three factor model are
borrowed from the finance literature to investigate this hypothesis. When a structural break is
incorporated and GARCH errors are controlled for, sub-sample analysis shows that oil prices

Oil Shocks and their Impact on Energy Related Stocks in China Page 26 of 29
are only important in the period following the financial crisis. These results persisted for three
sub-indices, and it was further shown that new-energy stocks are more resilient to oil price
shocks than other energy sub-indices.

Oil Shocks and their Impact on Energy Related Stocks in China Page 27 of 29
References Andrews D.W.K., 1993. Test for parameter instability and structural change with unknown change point. Econometrica 61, 821-856. Andrews D.W. K. and Ploberger W., 1994. Optimal tests when a Nuisance Parameter is present only under the alternative. Econometrica 62(6), 1383-1414. Apergis N., Miller S.M., 2009. Do structural oil-market shocks affect stock prices? Energy Economics 31, 569-575. Arouri, M.E.H., 2011. Does crude oil move stock markets in Europe? A sector investigation. Economic Modelling 28, 1716-1725. Arouri M.E.H. and Nguyen D.K., 2010. Oil prices, stock markets and portfolio investment: Evidence from sector analysis in Europe over the last decade. Energy Policy 38, 4528-4539. Basher S.A., and Sardosky P., 2006. Oil price risk and emerging stock markets. Global Finance Journal 17, 224-251. Caporin, Massimiliano and Michael McAleer, 2008. Scalar BEKK and indirect DCC. Journal of Forecasting 27, 537-549. Caporin, Massimiliano and Michael McAleer, 2011. Do we really need both BEKK and DCC? a tale of two covariance models. Journal of Economic Surveys, DOI: 10.1111/j.1467-6419.2011.00683.x Chang C.L., McAleer M. and Tansuchat R., 2010, Conditional correlations and volatility spillovers between crude oil and stock index returns. Discussion Paper, Kyoto Institute of Economic Research, KIER Discussion Paper Series 715. Chang C.L., McAleer M., and Tansuchat R., 2011. Crude oil hedging strategies using dynamic multivariate GARCH, Energy Economics 33, 912-923. Chen N.F., Roll R. and Ross S.A., 1986. Economic forces and the stock market. Journal of Business 56, 383-403. Choi K., Hammoudeh S., 2010. Volatility behavior of oil, industrial commodity and stock markets in a regime-switching environment. Energy Policy 38, 4388-4399. Chow G.C., 1960. Tests of equality between sets of coefficients in two linear regressions. Econometrica 28(3), 591-605. Ciner C., 2001. Energy shocks and financial markets: nonlinear linkages. Studies in Nonlinear Dynamics & Econometrics 5, 203-212. Cong R.G., Wei Y.M., Jiao J.L. and Fan Y., 2008. Relationships between oil price shocks and stock market: an empirical analysis from China. Energy Policy 36, 3544-3553. El-Sharif, Brown D., Burton B., Nixon B. and Russell A., 2005. Evidence on the nature and extent of the relationship between oil prices and equity values in the UK. Energy Economics 27, 819-830.

Oil Shocks and their Impact on Energy Related Stocks in China Page 28 of 29
Engle F.R., 2002. Dynamic conditional correlation: a simple class of multivariate GARCH models. Journal of Business and Economic Statistics 20, 339?350. Fan, Ying, Jiao, J.L., Liang, Q.M., Han, Z.Y., 2007. The impact of rising international crude oil price on China's economy: an empirical analysis with CGE model. International Journal of Global Energy Issues 27, 404-424. Fan, Ying and Jin-Hua Xu, 2011. What has driven oil prices since 2000? A structural change perspective. Energy Economics 33, 1082-1094. Faff R.W., Brailsford T.J., 2009. Oil price risk and the Australian stock market. Journal of Energy Finance & Development 4(1), 69-87. Filis G., Degiannakis S., and Floros C., 2011. Dynamic correlation between stock market and oil prices: The case of oil-importing and oil-exporting countries. International Review of Financial Analysis 20, 152-164. Gogineni S., 2010. Oil and the stock market: an industry level analysis. Financial Review 45, 995-1010. Hamilton J.D., 1983. Oil and the macroeconomy since World War II. Journal of Political Economy 91, 228-248. Hamilton J.D., 2003. What is an oil shock? Journal of Econometrics 113, 363-398. Hammoudeh S. and Eleisa E., 2004. Links and volatility transmission between NYMEX oil futures and the GCC stock market indices. Contemporary Economic Policy 22(2), 250-269. Hammoudeh S., Li H.M, 2008. Sudden changes in volatility in emerging markets: The case of Gulf Arab stock markets. International Review of Financial Analysis 17(1), 47-63. Hansen B.E., 1997. Approximate asymptotic p values for structural-change tests. Journal of Business & Economic Statistics 15(1), 60-67. Huang R.D, Masulis R.W. and Stoll H.R., 1996. Energy shocks and financial markets. Journal of Futures Markets 16, 1-27. Helliwell J., Sturm P., Jarrett P., and Salou G., 1986. The supply side in the OECD's macroeconomic model. OECD Economic Studies, 75-131. Henriques I. and Sadorsky P., 2008. Oil prices and the stock prices of alternative energy companies. Energy Economics 30, 998-1010. Jones C.M., Kaul G., 1996. Oil and the stock markets. The Journal of Finance 51, 463-491. Kaneko T., Lee B.S., 1995. Relative importance of economic factors in the US and Japanese stock markets. Journal of the Japanese and International Economies 9, 290-307.

Oil Shocks and their Impact on Energy Related Stocks in China Page 29 of 29
Kilian L., 2008. The economic effects of energy price shocks. Journal of Economic Literature 46(4), 871-909. Lee K., Ni S., 2002. On the dynamic effects of oil shocks: A study using industry level data. Journal of Monetary Economics 49, 823-852. Lee K., Ni S., and R.A. Ratti, 1995. Oil shocks and the macroeconomy: The role of price variability. Energy Journal 16, 39-56. Li Raymond, Leung Guy C.K., 2011. The integration of China into the world crude oil market since 1998. Energy Policy 39, 5159-5166. Maghyereh A., 2004. Oil price shocks and emerging stock markets: A generalized VAR approach. International Journal of Applied Econometrics and Quantitative Studies 1, 27-40. Masih R., Peters S. and Mello L.D., 2011. Oil price volatility and stock price fluctuations in an emerging market: Evidence from South Korea. Energy Economics 33, 975-986. Miller J. I., Ratti R.A., 2009. Crude oil and stock markets: Stability, instability, and bubbles. Energy Economics 31, 559-568. Mork K. A., 1989. Oil and the macroeconomy when prices go up and down: An extension of Hamilton's results. Journal of Political Economy, 91, 740-744. Park J.W., Ratti R.A., 2008. Oil price shocks and stock markets in the US and 13 European countries. Energy Economics 30(5), 2587-2608. Quandt R.E., 1960. Tests of the hypothesis that a linear regression system obeys two separate regimes. Journal of American Statistical Association 55, 324-330. Sadorsky P., 1999. Oil price shocks and stock market activity. Energy Economics 21, 449-469. Sadorsky P., 2001. Risk factors in stock returns of Canadian oil and gas companies. Energy Economics 23, 17-28. Sadorsky, P., 2003. The macroeconomic determinants of technology stock price volatility. Review of Financial Economics 12(2), 191-205. Sadorsky, P., 2012. Correlations and volatility spillovers between oil prices and the stock prices of clean energy and technology companies. Energy Economics 34, 248-255. Zhang, D., 2008. Oil shock and economic growth in Japan: A nonlinear approach. Energy Economics 30(5), 2374-2390.


Note:
This paper may not be quoted or reproduced without permission
Surrey Energy Economics Centre (SEEC)
School of Economics
University of Surrey
Guildford
Surrey GU2 7XH

SURREY
ENERGY
ECONOMICS
DISCUSSION PAPER
SERIES
For further information about SEEC please go to:
www.seec.surrey.ac.uk