OIL PRIMER BROCHURE
17
Understanding Today’s Crude Oil and Product Markets
Transcript of OIL PRIMER BROCHURE

UnderstandingToday’s Crude Oil and Product Markets

Overview 1
International Crude Oil Market 3
Table of Contents
Physical Markets and Oil Prices 5
Financial Markets and Crude Oil Prices 13
U.S. Refining Sector 17
Distribution and Marketing 21
Summary 25
Credits 27
UnderstandingToday’s Crude Oil and Product Markets

To properly address these questions, we need to understand
three important points:
◆ First, crude oil and petroleum products are global
commodities and, as such, their prices are determined
by supply and demand factors on a worldwide basis
(Figure 1).
◆ Second, the price of crude oil is the most significant
factor determining the price paid for petroleum products.
Consequently, the price of gasoline is largely determined
by the worldwide demand for and supply of crude oil.
◆ Third, prices reflect the interactions of thousands of buyers
and sellers, each bringing forth their respective knowledge
and expectations of the demand for and supply of crude
oil and petroleum products. These interactions occur in
the physical as well as futures markets, with the attendant
prices reflecting both current and future expected supply
and demand conditions.
So how do these points relate to the current prices for
gasoline, heating oil, and other petroleum products? These
products represent a critical source of fuel for the world’s
economy, which recently sustained a period of stronger-than-
expected growth. This economic growth gave rise to stronger-
than-anticipated global demand for these fuels, which
reduced available excess production capacity as well as the
quality of the barrels of crude available to
the marketplace. These changes in
global supply and demand were
compounded by the unexpected
losses in both crude oil produc-
tion and refining capacity in
the United States from hurricanes
Katrina and Rita in 2005. These
changes have been reflected in
prices for crude oil and petroleum
products. Specifically, oil prices have risen,
particularly for better quality crude oils, in
order to bring supply and demand
into balance. The impact of the
strength of global economic
growth was felt across
many commodities,
such as the steel,
aluminum, concrete,
and shipping
industries.
1Major Flows of Crude OilSource: BP Statistical Review of World Energy, 2005
Why?First, let’s start with the facts.
How is it that over the past few years, consumers have
realized a sustained increase in the prices they pay for
petroleum products that are critical to their economic
well-being? What is it that has caused the price of crude oil
to push past $70 per barrel? And how does this affect the cost
of gasoline and other petroleum products?
American consumers have found themselves facing higher
prices for gasoline, heating oil, and other petroleum products.
The question policymakers, as well as consumers, seek to
answer is:
Overview
1 2
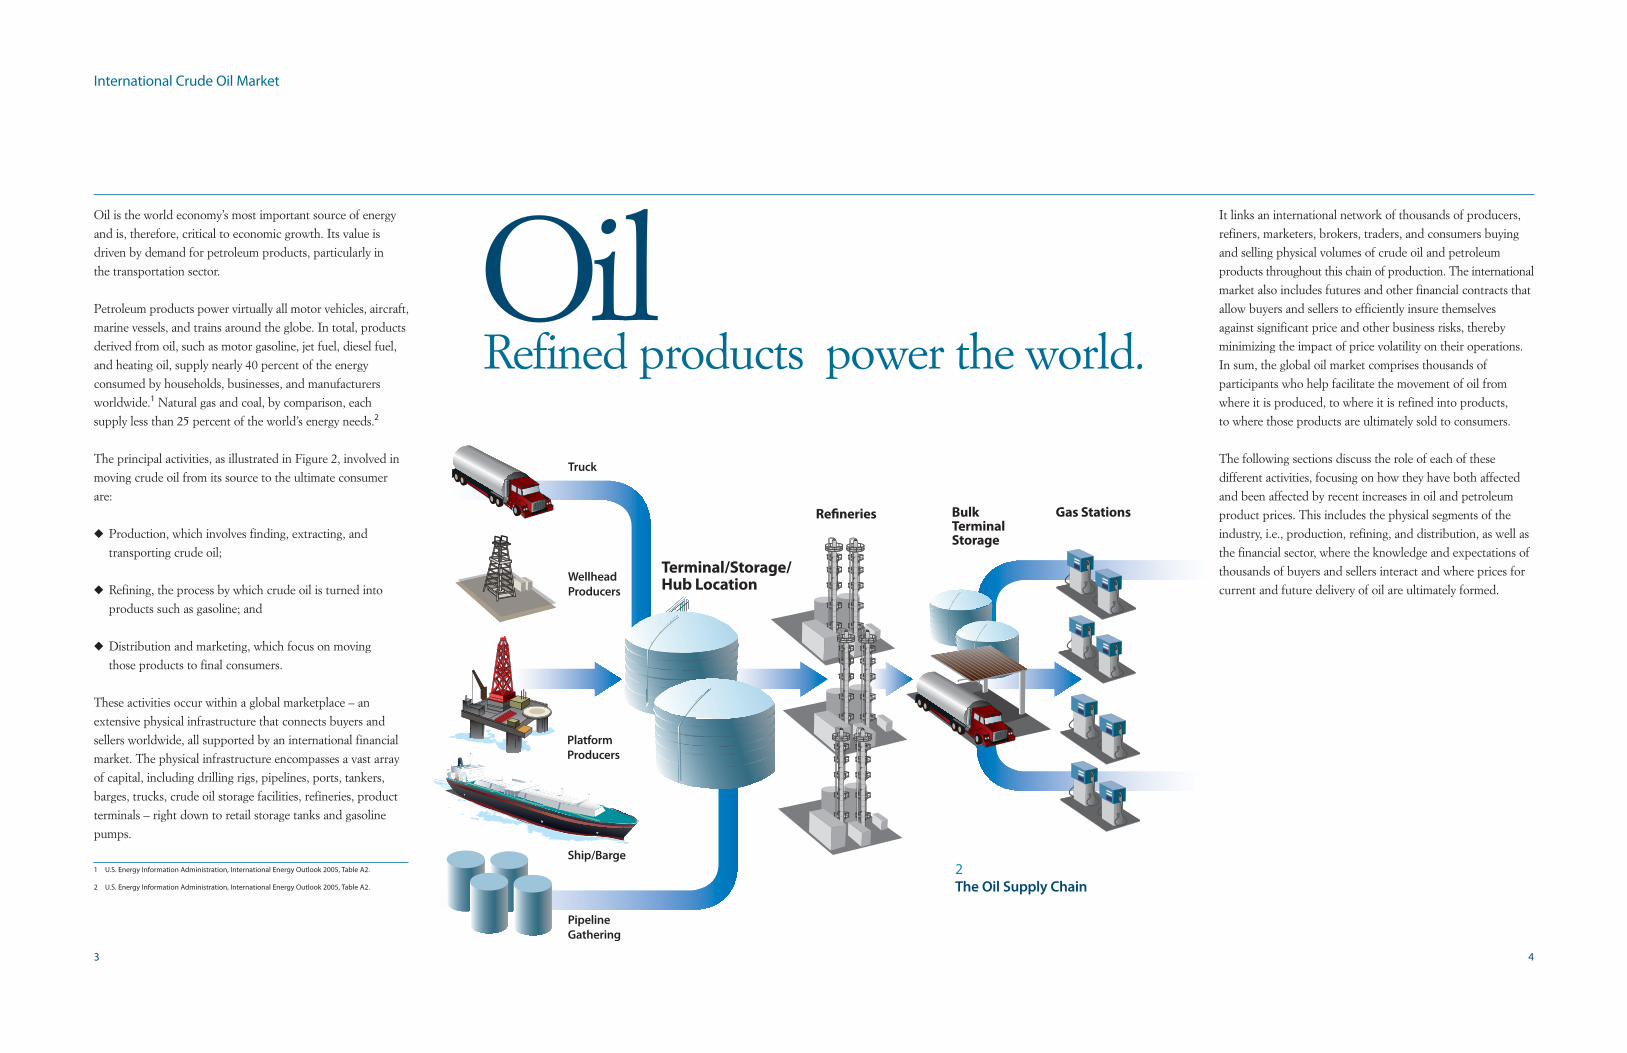
OilRefined products power the world.
Oil is the world economy’s most important source of energy
and is, therefore, critical to economic growth. Its value is
driven by demand for petroleum products, particularly in
the transportation sector.
Petroleum products power virtually all motor vehicles, aircraft,
marine vessels, and trains around the globe. In total, products
derived from oil, such as motor gasoline, jet fuel, diesel fuel,
and heating oil, supply nearly 40 percent of the energy
consumed by households, businesses, and manufacturers
worldwide.1 Natural gas and coal, by comparison, each
supply less than 25 percent of the world’s energy needs.2
The principal activities, as illustrated in Figure 2, involved in
moving crude oil from its source to the ultimate consumer
are:
◆ Production, which involves finding, extracting, and
transporting crude oil;
◆ Refining, the process by which crude oil is turned into
products such as gasoline; and
◆ Distribution and marketing, which focus on moving
those products to final consumers.
These activities occur within a global marketplace – an
extensive physical infrastructure that connects buyers and
sellers worldwide, all supported by an international financial
market. The physical infrastructure encompasses a vast array
of capital, including drilling rigs, pipelines, ports, tankers,
barges, trucks, crude oil storage facilities, refineries, product
terminals – right down to retail storage tanks and gasoline
pumps.
1 U.S. Energy Information Administration, International Energy Outlook 2005, Table A2.
2 U.S. Energy Information Administration, International Energy Outlook 2005, Table A2.
International Crude Oil Market
It links an international network of thousands of producers,
refiners, marketers, brokers, traders, and consumers buying
and selling physical volumes of crude oil and petroleum
products throughout this chain of production. The international
market also includes futures and other financial contracts that
allow buyers and sellers to efficiently insure themselves
against significant price and other business risks, thereby
minimizing the impact of price volatility on their operations.
In sum, the global oil market comprises thousands of
participants who help facilitate the movement of oil from
where it is produced, to where it is refined into products,
to where those products are ultimately sold to consumers.
The following sections discuss the role of each of these
different activities, focusing on how they have both affected
and been affected by recent increases in oil and petroleum
product prices. This includes the physical segments of the
industry, i.e., production, refining, and distribution, as well as
the financial sector, where the knowledge and expectations of
thousands of buyers and sellers interact and where prices for
current and future delivery of oil are ultimately formed.
3 4
2The Oil Supply Chain
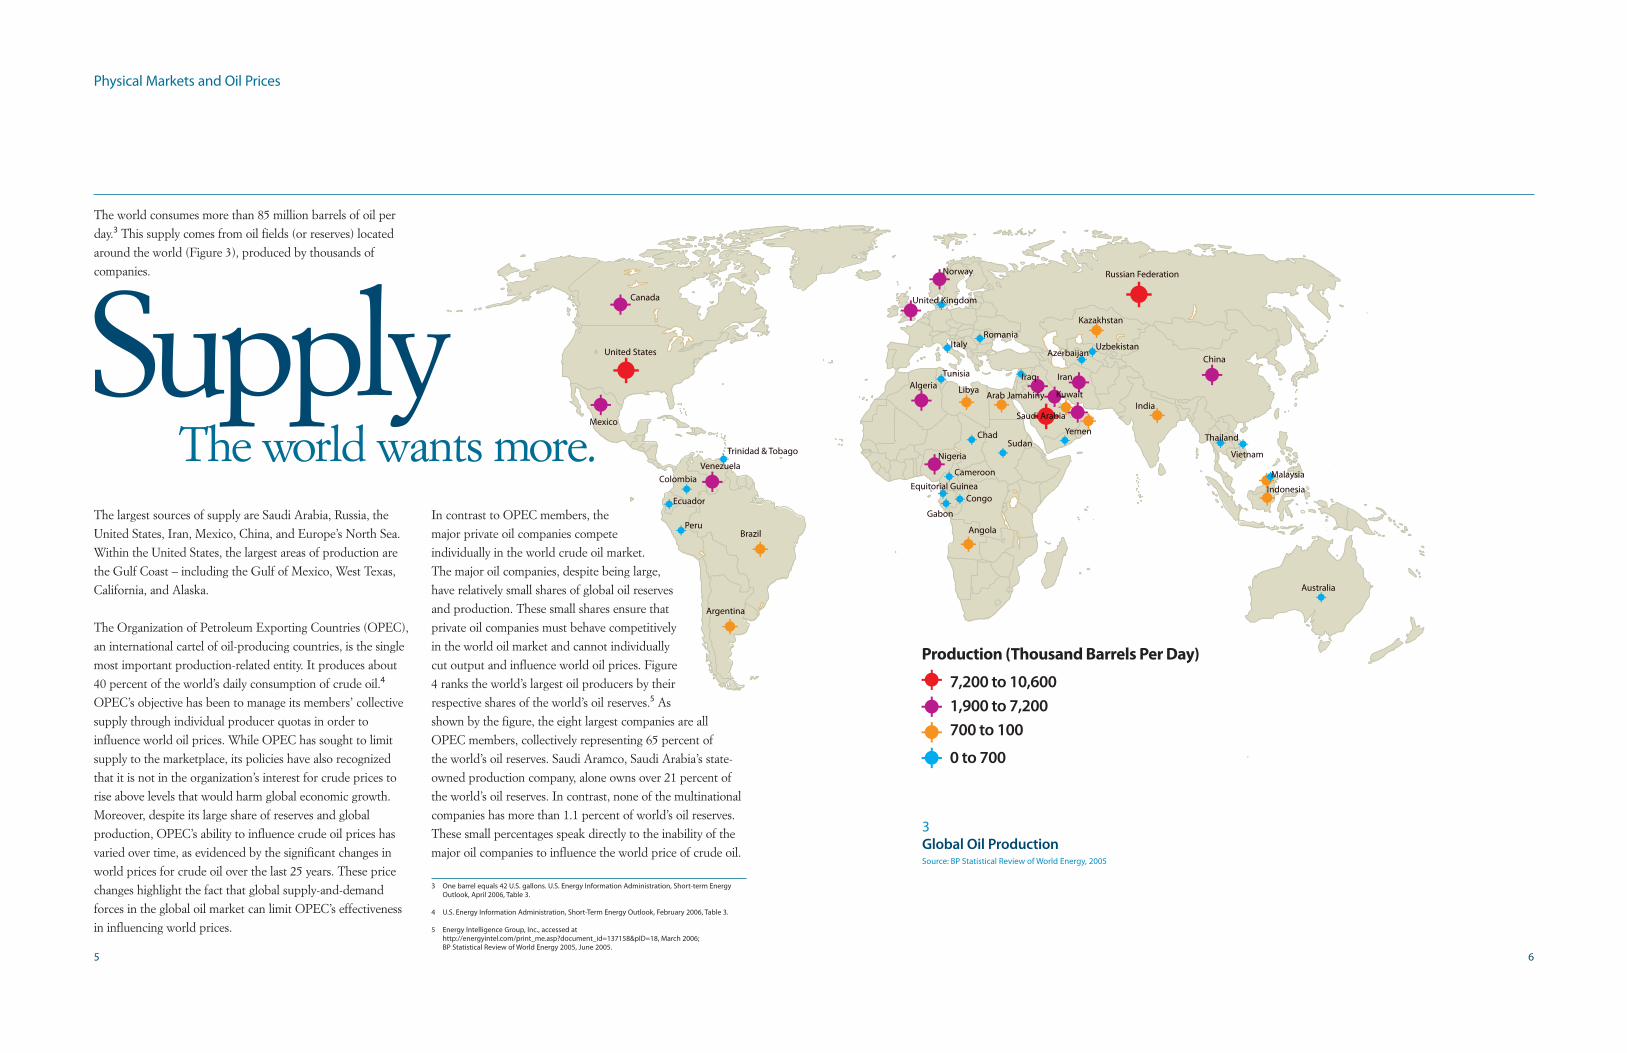
SupplyThe largest sources of supply are Saudi Arabia, Russia, the
United States, Iran, Mexico, China, and Europe’s North Sea.
Within the United States, the largest areas of production are
the Gulf Coast – including the Gulf of Mexico, West Texas,
California, and Alaska.
The Organization of Petroleum Exporting Countries (OPEC),
an international cartel of oil-producing countries, is the single
most important production-related entity. It produces about
40 percent of the world’s daily consumption of crude oil.4
OPEC’s objective has been to manage its members’ collective
supply through individual producer quotas in order to
influence world oil prices. While OPEC has sought to limit
supply to the marketplace, its policies have also recognized
that it is not in the organization’s interest for crude prices to
rise above levels that would harm global economic growth.
Moreover, despite its large share of reserves and global
production, OPEC’s ability to influence crude oil prices has
varied over time, as evidenced by the significant changes in
world prices for crude oil over the last 25 years. These price
changes highlight the fact that global supply-and-demand
forces in the global oil market can limit OPEC’s effectiveness
in influencing world prices.
The world consumes more than 85 million barrels of oil per
day.3 This supply comes from oil fields (or reserves) located
around the world (Figure 3), produced by thousands of
companies.
Physical Markets and Oil Prices
The world wants more.
3 One barrel equals 42 U.S. gallons. U.S. Energy Information Administration, Short-term Energy Outlook, April 2006, Table 3.
4 U.S. Energy Information Administration, Short-Term Energy Outlook, February 2006, Table 3.
5 Energy Intelligence Group, Inc., accessed at http://energyintel.com/print_me.asp?document_id=137158&pID=18, March 2006; BP Statistical Review of World Energy 2005, June 2005.
5 6
3Global Oil ProductionSource: BP Statistical Review of World Energy, 2005
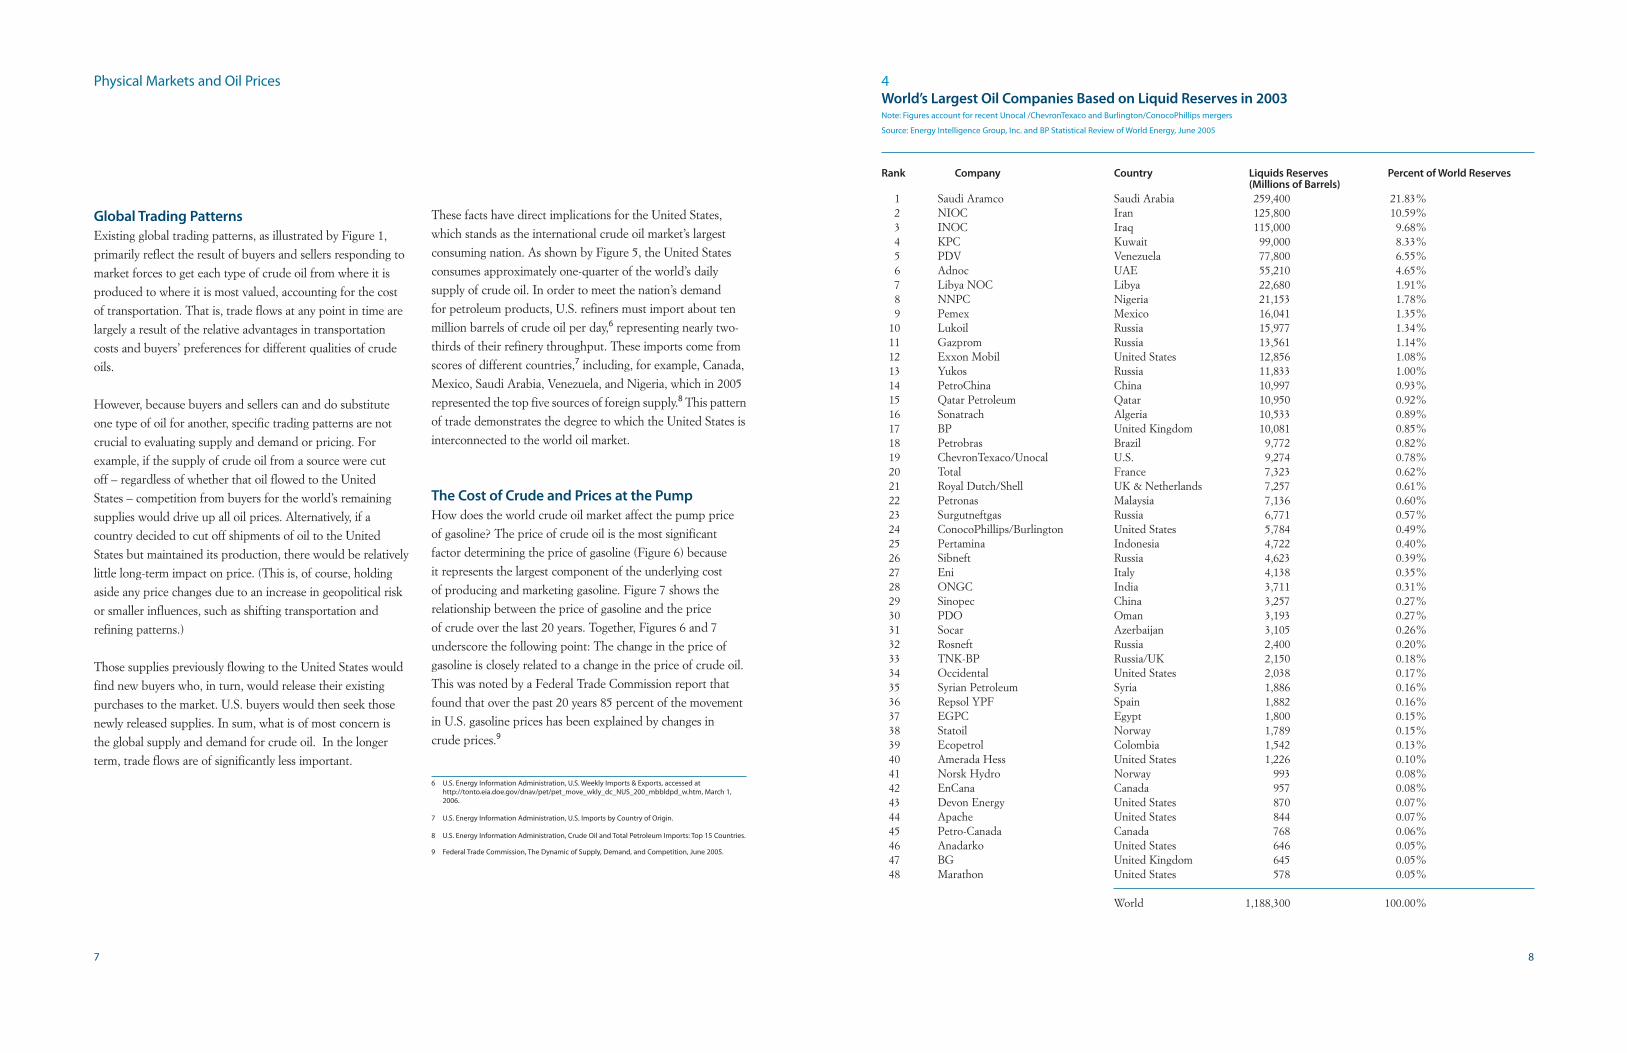
In contrast to OPEC members, the
major private oil companies compete
individually in the world crude oil market.
The major oil companies, despite being large,
have relatively small shares of global oil reserves
and production. These small shares ensure that
private oil companies must behave competitively
in the world oil market and cannot individually
cut output and influence world oil prices. Figure
4 ranks the world’s largest oil producers by their
respective shares of the world’s oil reserves.5 As
shown by the figure, the eight largest companies are all
OPEC members, collectively representing 65 percent of
the world’s oil reserves. Saudi Aramco, Saudi Arabia’s state-
owned production company, alone owns over 21 percent of
the world’s oil reserves. In contrast, none of the multinational
companies has more than 1.1 percent of world’s oil reserves.
These small percentages speak directly to the inability of the
major oil companies to influence the world price of crude oil.
Global Trading Patterns
Existing global trading patterns, as illustrated by Figure 1,
primarily reflect the result of buyers and sellers responding to
market forces to get each type of crude oil from where it is
produced to where it is most valued, accounting for the cost
of transportation. That is, trade flows at any point in time are
largely a result of the relative advantages in transportation
costs and buyers’ preferences for different qualities of crude
oils.
However, because buyers and sellers can and do substitute
one type of oil for another, specific trading patterns are not
crucial to evaluating supply and demand or pricing. For
example, if the supply of crude oil from a source were cut
off – regardless of whether that oil flowed to the United
States – competition from buyers for the world’s remaining
supplies would drive up all oil prices. Alternatively, if a
country decided to cut off shipments of oil to the United
States but maintained its production, there would be relatively
little long-term impact on price. (This is, of course, holding
aside any price changes due to an increase in geopolitical risk
or smaller influences, such as shifting transportation and
refining patterns.)
Those supplies previously flowing to the United States would
find new buyers who, in turn, would release their existing
purchases to the market. U.S. buyers would then seek those
newly released supplies. In sum, what is of most concern is
the global supply and demand for crude oil. In the longer
term, trade flows are of significantly less important.
These facts have direct implications for the United States,
which stands as the international crude oil market’s largest
consuming nation. As shown by Figure 5, the United States
consumes approximately one-quarter of the world’s daily
supply of crude oil. In order to meet the nation’s demand
for petroleum products, U.S. refiners must import about ten
million barrels of crude oil per day,6 representing nearly two-
thirds of their refinery throughput. These imports come from
scores of different countries,7 including, for example, Canada,
Mexico, Saudi Arabia, Venezuela, and Nigeria, which in 2005
represented the top five sources of foreign supply.8 This pattern
of trade demonstrates the degree to which the United States is
interconnected to the world oil market.
The Cost of Crude and Prices at the Pump
How does the world crude oil market affect the pump price
of gasoline? The price of crude oil is the most significant
factor determining the price of gasoline (Figure 6) because
it represents the largest component of the underlying cost
of producing and marketing gasoline. Figure 7 shows the
relationship between the price of gasoline and the price
of crude over the last 20 years. Together, Figures 6 and 7
underscore the following point: The change in the price of
gasoline is closely related to a change in the price of crude oil.
This was noted by a Federal Trade Commission report that
found that over the past 20 years 85 percent of the movement
in U.S. gasoline prices has been explained by changes in
crude prices.9
6 U.S. Energy Information Administration, U.S. Weekly Imports & Exports, accessed at http://tonto.eia.doe.gov/dnav/pet/pet_move_wkly_dc_NUS_200_mbbldpd_w.htm, March 1, 2006.
7 U.S. Energy Information Administration, U.S. Imports by Country of Origin.
8 U.S. Energy Information Administration, Crude Oil and Total Petroleum Imports: Top 15 Countries.
9 Federal Trade Commission, The Dynamic of Supply, Demand, and Competition, June 2005.
7
Physical Markets and Oil Prices
Rank Company Country Liquids Reserves Percent of World Reserves(Millions of Barrels)
1 Saudi Aramco Saudi Arabia 259,400 21.83%2 NIOC Iran 125,800 10.59%3 INOC Iraq 115,000 9.68%4 KPC Kuwait 99,000 8.33%5 PDV Venezuela 77,800 6.55%6 Adnoc UAE 55,210 4.65%7 Libya NOC Libya 22,680 1.91%8 NNPC Nigeria 21,153 1.78%9 Pemex Mexico 16,041 1.35%
10 Lukoil Russia 15,977 1.34%11 Gazprom Russia 13,561 1.14%12 Exxon Mobil United States 12,856 1.08%13 Yukos Russia 11,833 1.00%14 PetroChina China 10,997 0.93%15 Qatar Petroleum Qatar 10,950 0.92%16 Sonatrach Algeria 10,533 0.89%17 BP United Kingdom 10,081 0.85%18 Petrobras Brazil 9,772 0.82%19 ChevronTexaco/Unocal U.S. 9,274 0.78%20 Total France 7,323 0.62%21 Royal Dutch/Shell UK & Netherlands 7,257 0.61%22 Petronas Malaysia 7,136 0.60%23 Surgutneftgas Russia 6,771 0.57%24 ConocoPhillips/Burlington United States 5,784 0.49%25 Pertamina Indonesia 4,722 0.40%26 Sibneft Russia 4,623 0.39%27 Eni Italy 4,138 0.35%28 ONGC India 3,711 0.31%29 Sinopec China 3,257 0.27%30 PDO Oman 3,193 0.27%31 Socar Azerbaijan 3,105 0.26%32 Rosneft Russia 2,400 0.20%33 TNK-BP Russia/UK 2,150 0.18%34 Occidental United States 2,038 0.17%35 Syrian Petroleum Syria 1,886 0.16%36 Repsol YPF Spain 1,882 0.16%37 EGPC Egypt 1,800 0.15%38 Statoil Norway 1,789 0.15%39 Ecopetrol Colombia 1,542 0.13%40 Amerada Hess United States 1,226 0.10%41 Norsk Hydro Norway 993 0.08%42 EnCana Canada 957 0.08%43 Devon Energy United States 870 0.07%44 Apache United States 844 0.07%45 Petro-Canada Canada 768 0.06%46 Anadarko United States 646 0.05%47 BG United Kingdom 645 0.05%48 Marathon United States 578 0.05%
World 1,188,300 100.00%
4World’s Largest Oil Companies Based on Liquid Reserves in 2003Note: Figures account for recent Unocal /ChevronTexaco and Burlington/ConocoPhillips mergers
Source: Energy Intelligence Group, Inc. and BP Statistical Review of World Energy, June 2005
8

52004 Crude OilConsumption byRegionSource: BP Statistical Review of World Energy, June 2005
Why the Sustained Rise in Oil Prices Over the
Past Few Years?
The price of crude oil increased because worldwide demand
has increased in response to global economic growth – and
supply has not fully kept pace. This growth has included both
developed countries, such as the United States, and emerging
countries, such as China.10 Figure 8 shows the rapid increase
in global demand, particularly since 2003. It highlights the
impact of the largely unanticipated growth in the Chinese
economy on worldwide demand for petroleum products.
These changes in the consumption and consequent reduction
in spare capacity have been compounded by the rise in political
and, hence, supply uncertainty confronting the world oil
market. Examples of the uncertainty due to geopolitical
events include the loss of supplies as a consequence of the
war in Iraq, civil unrest in Nigeria and Venezuela, as well as
ongoing uncertainty concerning the availability of exports
from Iran.
This uncertainty of supply impacts prices in the following
manner: In periods of relatively little excess production
capacity, there exists less ability on the part of the market
to absorb the loss of supply because disruption results in a
shortage that cannot be made up by other sources. Buyers are,
therefore, more willing to bid up prices to shore up existing
supplies.
It is also uncertain that there will be a return to the historical
levels of excess capacity that characterized world oil markets
prior to 2003.
Finally, prices not only reflect the overall supply and demand
of crude but also the quality of the crude oil. Not surprisingly,
desirable crude oils are produced first because, as discussed
in greater detail below, they can be sold for more than the
less-desirable crude oils. Thus, the excess production capacity
that remains is largely for heavier, less desirable crude oils.
These are less capable of producing the products consumers
want and are less well-matched to available refining capacity
than lighter, sweeter crude oils.
As a result of the aforementioned factors, the world crude oil
market is very tight and prices reflect that tightness. Stated
alternatively, the price of oil has risen in order to balance
available supplies with existing demand. This is particularly
the case for the prices of lighter, sweeter crude oils, which
are the prices that are typically reported in the press. And
because the prices of petroleum products closely track the
price of crude oil, the prices of products like gasoline and
heating oil have also risen significantly over the last few years
as the underlying prices for crude oil have increased.
A substantial portion of this increase in demand appears to
have been met by the world’s existing unused production
capacity. Because of the time it takes to bring significant
new production on to the market, the rise in global demand
resulted in a reduction of the world’s spare capacity. This is
illustrated by Figure 9, which shows the significant reduction
in the world’s spare production capacity from roughly 5.6
million barrels per day in 2002 to less than 2 million barrels
per day in 2003 and thereafter. This reduction corresponds
closely to the largely unforeseen spike in global demand over
this same time period.
10 For changes in individual countries’ consumption of crude oil, see, for example, the BP Statistical Review of World Energy 2005, June 2005.
9 10
Physical Markets and Oil Prices

6Components of RetailGasoline PricesSource: Energy Information Administration
7Inflation-AdjustedPrice of West TexasIntermediate CrudeOil and UnleadedGasolineNote: Inflation-Adjusted January 2006 Dollars
Source: Energy Information Agency and Bureau of Labor Statistics
8Year-to-Year Changein World Demand forOilSource: Energy Information Administration
9World Spare OilProduction CapacitySource: Energy Information Administration
11 12
West Texas Intermediate
Motor Gasoline
Physical Markets and Oil Prices

ChangesA market structure formerly based on rigid long-term,
commercial arrangements has been replaced by a more
efficient one that allows buyers and sellers greater flexibility
in establishing commercial relationships that better meet their
respective needs.
Over the last 25 years, the global oil industry has seen a
transformation in the contractual structures used to purchase
and sell crude oil.
Market structures are transforming.
Financial Markets and Crude Oil Prices
Spot Markets versus Futures Transactions
The term “spot markets” is used to describe transactions
which involve the near-term purchase and sale of a commodity,
such as crude oil and refined products. In the crude oil
market, “spot” contracts typically involve delivery of crude
over the coming month, e.g., a contract signed in June for
delivery in July. Spot markets are often referred to as the
“physical market” since they entail the buying and selling of
physical volumes. These markets consist of many buyers and
sellers, including refiners, traders, producers, and transporters,
transacting throughout the chain of supply – from the oil
well right through to the refinery. These markets provide
the benefit of allowing buyers and sellers, e.g., refiners and
marketers, to more easily adjust their crude supplies to reflect
near-term supply and demand conditions in both the product
markets and the crude oil markets.
A futures contract, in contrast to a spot transaction, concerns
the future purchase or sale of crude oil or petroleum products.*
Specifically, it is a contract that carries the obligation for
delivery of a given quantity of crude in the future. The contract
specifies the volume, type or grade of crude oil, the price,
the future time in which the crude is bought or sold, and
the particular location to which it is to be delivered. The
buying and selling of futures contracts occurs on organized
exchanges. Since the vast majority of traders “close out” their
positions (i.e., cancel out a contract prior to the time it would
require the trader to actually deliver or take delivery of the
crude oil), futures transactions rarely entail the actual delivery.
As a result, the futures market is often referred to as the
“financial market.”
The crudes underlying futures contracts are often called
“marker” or “benchmark” crudes. A common example of
a marker crude is West Texas Intermediate, which is the
principal crude underlying the futures contract traded on
the New York Mercantile Exchange, or NYMEX. These
organized exchanges allow for the competitive interaction of
thousands of independent traders, including both commercial
as well as financial institutions. These interactions, in turn,
give rise to publicly reported futures prices that reflect the
market’s best estimate today of what future supply and
demand conditions and, hence, prices will be.
Prices of futures contracts are connected to prices in the
physical market because futures positions that are not closed
out will lead to either delivery or receipt. Thus, the closing
“futures” price for any given month must equal the “physical”
price at the time trading in the futures contract ends. With
delivery, the futures price effectively becomes a physical price
at the time the futures contract matures. So, for example,
the closing “futures” price for delivery in June must equal
the “spot” price for oil in June. If the prices differed, a
trader would buy in the market in which the price is lower
and immediately sell it into the market where the price is
higher and earn a profit. No one wants to leave such profit
opportunities on the table.
The prices in the spot market transactions described above
are often tied to prices for crude oil on organized exchanges
(e.g., NYMEX) with, for example, price adjustments to
account for differences in the quality of the crude oil being
traded and the location of the spot market transaction. In fact,
even OPEC countries often base their prices on the prices
determined on organized exchanges, with appropriate quality
and other differentials. The benefit of these arrangements is
that the price of the physical crude oil will be set at the
market level at the time of delivery. This protects buyers from
dramatic price fluctuations that could occur while crude oil
was in transit to its final markets.
* There are many other types of contractual structures and financial instruments used by the oil industry, as well. These include forwards (an agreement today to sell at an agreed-upon future date), swaps (an agreement to trade or “swap” commodities of different qualities or at different locations or at different times), options (an agreement that provides the right, i.e., the “option,”to buy or sell a commodity), and swaptions (an agreement combining a swap and an option). Prices of futures contracts are the most commonly reported by the trade press and most watched by the public.
13 14
Whereas “spot” and “futures” markets have been long-
established institutional structures for many commodities,
they are relatively new to the oil industry. Their uses, however,
have grown rapidly and are now a well-developed part of the
market. Today it is from the spot and futures markets that the
global oil market – producers, refiners, marketers, traders,
consumers, investment banks, hedge funds, and so forth –
receives competitively determined market signals that inform
buyers and sellers on current and future supply and demand
conditions. In sum, the interactions of well-informed traders
on spot and futures markets assure that the global price of
crude properly reflects its market value.

Benefits of Futures Markets
Futures markets bring a number of benefits to the global oil
market. First, crude oil futures markets provide information
about future expectations regarding supply and demand
conditions. Second, these expectations are made transparent,
i.e., known to the market, in the form of a series of futures
prices for crude to be delivered at different dates in the
future. Finally, crude oil producers, marketers, refiners,
and others are able to use the financial contracts on the
exchanges to manage risk, facilitated, in part, by the increasing
participation of the number of investors without a commercial
interest in the petroleum industry (i.e., no capacity to produce,
refine, store, or sell physical volumes of crude or petroleum
products).
Of course, actual prices for crude in the future may be different
than those implied by today’s future prices. Because it is the
market’s best estimation today that oil will be $65 per barrel
in three months does not necessarily imply that oil will, in
three months, be $65 per barrel. As expectations about future
supply and demand conditions change, e.g., due to colder
than expected weather or unforeseen political events that
could cause temporary supply disruptions, so too will current
and future expected prices.
This trading process, i.e., the competition between various
market players in the futures markets, is beneficial because
it provides transparent price information to those who can
respond to this information by, for example, putting additional
oil in storage or taking steps to reduce their consumption in
the future. To illustrate, when prices of futures contracts with
early delivery dates exceed those with later delivery dates,
the market consensus is for prices to fall in the future.** This
provides an economic incentive to draw down inventory
today – thereby softening prices today. On the other hand,
when prices of futures contracts with early delivery dates
are lower than those with later delivery dates, the market
consensus is for prices to rise in the future.◆ This provides the
economic incentive to build inventories if the higher futures
prices will cover the cost of storage. This saves supply for the
future when prices say it is most needed. In short, futures
market prices provide information about expected future
supply and demand conditions that producers and consumers
can act on today. The effect of these actions is to shift the
supply of crude oil from periods of relatively lower prices to
periods where crude oil prices are expected to be higher.
These actions, in turn, tend to ameliorate price swings.
Finally, futures markets permit industry participants to manage
the significant risks they bear in the production, refining, and
transacting in crude oil and petroleum products.❖ They do so
by making it possible, for example, for an oil producer to lock
in prices for its future production on the futures market or to
use other instruments to limit the price fluctuations it will
realize. The fact that these financial markets are highly liquid,
with thousands of traders, allows users to shed risk at the least
possible cost and at prices that reflect all of the information
brought to the market by those trading. Consumers benefit
because holding down producers’ risks encourages investment
in future supplies.
❖ These risks include market risk, i.e., risk due to the change in oil prices; credit default risk, i.e., the counter-party may fail to meet the financial terms of the contract; liquidity risk; i.e., risk arising from the inability to sell an asset; basis risk, i.e., prices for the types of crudes or products owned by the participant do not perfectly track changes in the benchmark product; operational risk; and political risk, e.g., expropriation.
** The futures market is commonly said to be “backwardated” under these conditions.
◆ The futures market, under these conditions, is commonly termed “in contango.”
15 16
As described above, futures markets bring together valuable
information about the market’s expectations about future
supply and demand conditions in the physical market –
conditions that will ultimately determine the price for oil. If,
for example, the price today of an oil futures contract for the
delivery of oil three months from now is $65 per barrel, that
“futures” price represents thousands of buyers’ and sellers’
best estimate of what the price of oil will be for physical
delivery three months hence. And, if in this hypothetical
situation, the current (spot) price were $60 per barrel, the
futures market would then be revealing the fact that it is
the market’s current expectation that prices are expected
to increase over the near future. That is, based on the
information of thousands of commercial participants and
sophisticated financial institutions, futures prices are telling
producers and consumers alike that the crude oil market is
likely to remain tight for the foreseeable future.
Financial Markets and Crude Oil Prices
ComplexityThe first stage for all refineries focuses on the initial distillation
in which the barrel of crude oil is heated and broken down
into its component parts. Subsequent processes, often
Crude oil needs to be refined in order to produce the gasoline
and other products demanded by consumers. Refining a
barrel of crude oil involves a series of complex processes.
Meeting consumer demand isn’t easy.
U.S. Refining Sector
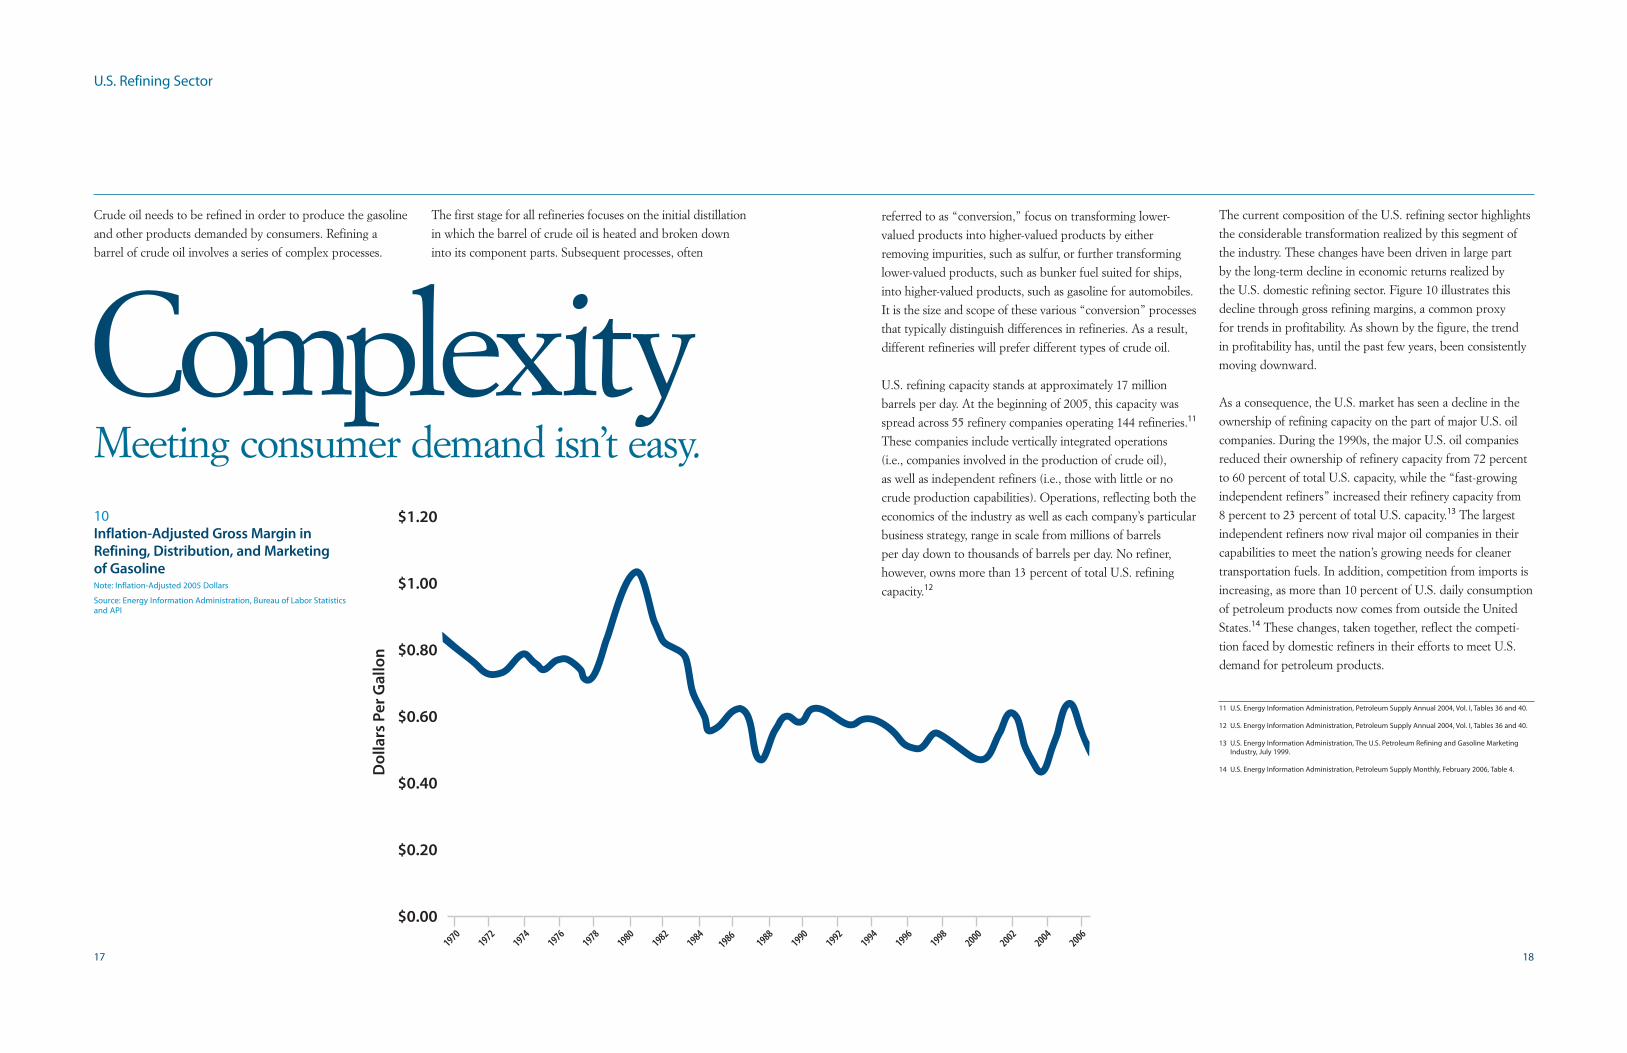
10Inflation-Adjusted Gross Margin inRefining, Distribution, and Marketing of GasolineNote: Inflation-Adjusted 2005 Dollars
Source: Energy Information Administration, Bureau of Labor Statistics and API
referred to as “conversion,” focus on transforming lower-
valued products into higher-valued products by either
removing impurities, such as sulfur, or further transforming
lower-valued products, such as bunker fuel suited for ships,
into higher-valued products, such as gasoline for automobiles.
It is the size and scope of these various “conversion” processes
that typically distinguish differences in refineries. As a result,
different refineries will prefer different types of crude oil.
U.S. refining capacity stands at approximately 17 million
barrels per day. At the beginning of 2005, this capacity was
spread across 55 refinery companies operating 144 refineries.11
These companies include vertically integrated operations
(i.e., companies involved in the production of crude oil),
as well as independent refiners (i.e., those with little or no
crude production capabilities). Operations, reflecting both the
economics of the industry as well as each company’s particular
business strategy, range in scale from millions of barrels
per day down to thousands of barrels per day. No refiner,
however, owns more than 13 percent of total U.S. refining
capacity.12
11 U.S. Energy Information Administration, Petroleum Supply Annual 2004, Vol. I, Tables 36 and 40.
12 U.S. Energy Information Administration, Petroleum Supply Annual 2004, Vol. I, Tables 36 and 40.
13 U.S. Energy Information Administration, The U.S. Petroleum Refining and Gasoline Marketing Industry, July 1999.
14 U.S. Energy Information Administration, Petroleum Supply Monthly, February 2006, Table 4.
17 18
The current composition of the U.S. refining sector highlights
the considerable transformation realized by this segment of
the industry. These changes have been driven in large part
by the long-term decline in economic returns realized by
the U.S. domestic refining sector. Figure 10 illustrates this
decline through gross refining margins, a common proxy
for trends in profitability. As shown by the figure, the trend
in profitability has, until the past few years, been consistently
moving downward.
As a consequence, the U.S. market has seen a decline in the
ownership of refining capacity on the part of major U.S. oil
companies. During the 1990s, the major U.S. oil companies
reduced their ownership of refinery capacity from 72 percent
to 60 percent of total U.S. capacity, while the “fast-growing
independent refiners” increased their refinery capacity from
8 percent to 23 percent of total U.S. capacity.13 The largest
independent refiners now rival major oil companies in their
capabilities to meet the nation’s growing needs for cleaner
transportation fuels. In addition, competition from imports is
increasing, as more than 10 percent of U.S. daily consumption
of petroleum products now comes from outside the United
States.14 These changes, taken together, reflect the competi-
tion faced by domestic refiners in their efforts to meet U.S.
demand for petroleum products.

How Has the Refining Sector Been Affected by
Today’s Crude Market?
The growth in demand for petroleum products has affected
the refining sector and this, in turn, has significantly affected
the global crude oil market. As expected, the utilization rate
of the world’s refineries increased significantly during the
2000-2004 period.15 In the United States, utilization rates
exceeded 90 percent even as the capacity to refine crude
continued to expand over the period.16 Once the required
downtime to perform routine maintenance is taken into
account, refinery utilization rates are extremely high.
Moreover, as the demand for petroleum products increased,
so too did the demand for conversion capacity noted above,
i.e., capacity capable of producing relatively more valuable
products from heavier crude oils. These changes reflected
not only the increasing demand for higher-value products,
such as gasoline and diesel fuel, but ongoing changes in fuel
specifications, as well, which increase demand for such
conversion capacity.
The reduction in spare refining capacity, in turn, has affected
the international crude oil market. As noted above, there
are many different types of crude oil, e.g., West Texas
Intermediate, West Texas Sour, Arab Heavy, Bonny Light, to
name just a few. While there are many characteristics to any
given crude, the two most common distinctions relate to its
viscosity, i.e., how “light” or “heavy” a crude is, and the
amount of impurities contained within the oil, of which
sulfur is the most commonly identified. These characteristics
indicate the amount of processing required to convert the
crude oil into saleable petroleum products.15 BP Statistical Review of World Energy 2005, June 2005.
16 U.S. Energy Information Administration, U.S. Percent of Utilization of Refinery Operable Capacity, accessed at http://tonto.eia.doe.gov/dnav/pet/hist/mopueur2m.htm, February 23, 2006.
Generally speaking, lighter crudes require less processing to
produce a relatively more valuable slate of petroleum products,
such as gasoline, diesel, and jet fuel, than heavier crudes. The
more sulfur contained in a crude oil, the more “sour” it is
said to be and the more processing required before resulting
petroleum products can be sold into the marketplace. Thus,
“sour” crudes require more processing than “sweet” crudes.
As spare refining capacity has diminished, particularly the
capacity to turn heavy, more sour crude oil into high-valued
products, the refining sector has placed a relatively higher
value on lighter, sweeter (“light sweet”) crudes than on heav-
ier, more sour (“heavy sour”) crudes. This is because light
sweet crudes require less processing to produce a given
volume of higher-valued products.
Refining margins currently reflect these changes. Holding
aside any temporary impacts resulting from Hurricanes
Katrina and Rita, those refiners that can produce more
valuable products from the heavier, more sour crudes have
tended to earn higher margins relative to those refiners who
have not yet invested in this equipment. Of course, the former
refiners typically have faced higher costs due to the additional
equipment required to process heavy, sour crudes, but these
costs have tended to be outweighed by the relative differences
in prices of heavy sour and light sweet crudes. This outcome
can be properly interpreted as the market providing an
economic incentive for additional investment to process
those heavier, more sour crudes.
Refined Petroleum Product Markets
Conceptually, the market for refined petroleum products is
very similar to the crude oil market in that there is widespread
buying, selling, and trading of products in both the physical
market (e.g., spot market) and the futures market. And just
as with crude oil, there are significant international flows of
refined products. The United States, for example, imports
approximately 3.5 million and exports approximately one
million barrels per day of refined products.17
Trade in petroleum products reflects the international
market’s efforts to match what is produced (supply) with
what consumers prefer (demand). In the United States, for
example, the majority of exports tend to involve products for
which there is little or no domestic demand. This would
include commodities produced as by-products of the refining
process and that are no longer consumed domestically, such
as petroleum coke; products for which there is little seasonal
demand, such as heating oil sent to the Southern Hemisphere
during our summer season; and products for which there is
no domestic market due to environmental specifications,
such as residual fuel and gasoline that fails regional fuel
specifications. Imports, in contrast, reflect domestic demand
for products such as gasoline and winter heating oil, i.e.,
products demanded by U.S. consumers that cannot otherwise
be met by domestic refiners. In sum, these flows highlight
the fact that the United States is in the position of having to
compete on international markets to satisfy demand for those
products most desired by U.S. consumers.
In addition, petroleum products and futures are also traded
on organized exchanges, such as NYMEX and the Chicago
Mercantile Exchange, just like crude oil. Thus, the interactions
of traders on organized exchanges establish transparent prices
for petroleum products, as well as crude oil. Petroleum product
deliveries in particular areas will often be at prices based on
those determined on an organized exchange, with adjustments
for differences in location and the precise type of petroleum
product being traded.
As noted above, crude oil is the single largest input cost
associated with the manufacturing of petroleum products.
Consequently, changes in crude oil prices have a significant
effect on petroleum product prices and changes in expectations
about future crude oil prices can lead to changes in both
current and future prices of gasoline and other petroleum
products through the building up or drawing down of
inventory. However, prices for petroleum products can also
change due to supply-and-demand factors unrelated to the
crude market. Such factors would include, for example, an
unexpected hurricane that interferes with refinery operations,
or colder-than-normal weather in the Northern Hemisphere,
or environmental mandates and regulatory requirements.
These events can cause the price paid for product to be
delivered today or months from now to rise or fall independent
of crude oil price changes.
As with the crude oil market, there exists a dynamic relationship
between current prices and prices for petroleum products to
be delivered in the future. A change in the price of gasoline or
heating oil to be delivered some months in the future can lead
to a similar change in the futures price paid for product to be
delivered next month. That, in turn, can have implications
for prices of products throughout the chain of distribution.
A change in “futures” prices, for example, can affect the
prices being paid today on the spot market. As discussed
above, these price changes provide market participants with
signals about whether they should be building up or drawing
down inventories, thereby affecting the supply of product
currently on the market. Thus, the change in the spot price
could, in turn, lead to a similar change in the wholesale or
“rack” price paid for gasoline by retailers and, in turn, in the
prices paid by motorists at the pump.
17 U.S. Energy Information Administration, Petroleum Supply Monthly, February 2006, Tables 36 and 48.
19 20
U.S. Refining Sector

MovementDistribution and marketing of petroleum products represent
the third segment of the petroleum supply chain.
The forces of supply and demand at work.
Distribution and Marketing
❏ The majority of finished product is transported from the refinery through pipelines to the product terminal. This is true of domestically produced crude oil, as well, as pipelines represent the most efficient method of moving large quantities of liquids. Pipeline rates are regulated by the Federal Energy Regulatory Commission (FERC).
21 22
They involve the movement of refined products – gasoline,
diesel, heating oil, kerosene, and jet fuel – from the refinery to
the end consumer (Figure 11).
Like crude oil, petroleum products are bought and sold
throughout the chain of distribution.❏ Distribution and
marketing, however, represent a relatively small share of the
price paid by consumers. For example, the marketing and
distribution of gasoline typically represent less than 15
percent of the pump price paid by the average motorist.
11Gasoline Distribution Systemand Valuation Flows

Of course, actual retail pricing decisions are much more
complicated due, in part, to the multiple pricing-related
factors noted above. What cannot be lost, however, is the fact
retail marketing is a very competitive segment of the industry
and, consequently, retail prices are forced to respond to that
competition. The price changes arising as a consequence of
the damage caused in 2005 by Hurricanes Katrina and Rita
illustrate this point. Shortly after the storms, prices for all
petroleum products, including gasoline, rose as a consequence
of the damage suffered by Gulf Coast refineries. The expectation
that the supply of products would be less readily available
(which turned out to be true) gave rise to higher prices. As
imports started arriving from foreign refineries and domestic
refineries came back on line, prices once again declined.
Any retailer’s pump price, however, must be competitive with
local retail stations to attract customers. That is, retail pricing
behavior ultimately is limited by the fact that pump prices
are transparent and, therefore, readily known by motorists.
Stations that set prices that are not competitive quickly lose
business as motorists change their buying patterns.
There is a common, often implicit, belief that retail prices
are or should be based on what the dealer has paid for
the gasoline in his storage tanks. This misconstrues how
competitive markets work. As noted above, prices for
petroleum products, including gasoline, are a function
of current as well as expected future supply and demand
conditions, not historical costs. This is true even at the local
level. If a retailer, for example, has relatively full tanks but
other stations are forced to raise their prices due to increasing
wholesale prices, the retailer will have an incentive to raise
prices even before the retailer’s own actual costs have
increased based on the expectation that the retailer’s future
replacement costs will be higher. That is, the market is
telling the retailer that the cost of gasoline has increased
and, therefore, so has the retailer’s cost of replacing existing
inventory. (This is sometimes referred to as the retailer’s
opportunity cost: the retailer must replace whatever inventory
is sold with higher-cost supply.) In contrast, however, when
wholesale prices are falling and other retailers are lowering
their prices, the same retailer faces the following stark choice:
either lower retail prices (and, thereby, lower margins on
existing inventory) or accept lower sales.
Competition in the retail sector is intense. The overwhelming
trend has been the increasing efficiency with which gasoline is
delivered to the consumer. The rapid entry of hypermarketers,
such as Wal-Mart® and Costco,® into the retail gasoline sector
is the most current evidence of the level of competition found
within this segment of the industry. Prices, of course, can
and do vary among stations for a host of reasons, including
location advantages (e.g., with respect to the flow of traffic or
proximity to locations like shopping malls that attract large
number of motorists); cost differences among stations (e.g.,
rent, insurance, wages); and the commercial arrangements
under which the station is supplied with product – again, to
list just a few.
18 U.S. Energy Information Administration, Where Does My Gasoline Come From?, June 2005.
■ In the wholesale gasoline market, there are generally several different prices quoted, depending on the relationship between the supplier and retailer and on the terms, if any, of their contractualrelationship. Thus, the wholesale price paid by different retailers can differ depending on such factors as whether there is a long-term supply agreement or whether the retailer has the right to use the supplier’s brand.
Gasoline, which represents nearly 45 percent of the domestic
production of all refined products, is the petroleum product
most demanded by U.S. consumers.18 There are almost
169,000 retail gasoline outlets in the United States, selling 17
different formulations of gasoline designed to meet different
air quality standards around the country. While, as discussed
above, the cost of crude oil is the largest single component of
the retail price of gasoline, gasoline prices ultimately are
established by the forces of supply and demand, with retail
prices reflecting local, state, and federal taxes and the value
added to the distribution of gasoline as it moves from the
refinery to the ultimate consumer. Of course, for any particular
retailer, a number of factors go into determining the pump
price, including the location of the station, delivery costs, the
commercial arrangements with the station’s supplier, whether
the station sells branded or unbranded gasoline, the size of
the station, and taxes – to name just a few.■
Distribution and Marketing
2423
GrowthWorldwide growth gave rise to stronger-than-expected
demand for petroleum products critical to the global
economy that, in turn, gave rise to stronger-than-expected
demand for crude oil – demand that outpaced the near-term
ability of the market to bring forth commensurate additional
supplies. The resulting tightness in the global crude oil market
caused prices for crude oil to increase. Specifically, prices for
crude oil in both the spot and futures markets rose in order
to bring the global supply of and demand for crude oil into
balance.
The prices faced by U.S. consumers for petroleum products
are largely a consequence of the world economy’s stronger-
than-anticipated growth, in the face of diminished excess
capacity and increased supply uncertainty.
The markets determine the price.
Summary
The impacts arising from the increase in demand for crude
oil have been felt throughout the chain of production. As
demand for products increased, for example, so too did the
demand for the refinery capacity necessary to turn crude oil
into saleable products. As the utilization of the world’s
refineries increased, demand for those crudes more easily
refined into the petroleum products desired by the world’s
economy (i.e., lighter, sweeter crudes) increased relative to
those crudes more difficult to refine (i.e., heavier, more sour
crudes). These changes have been reflected in the margins
earned by refiners, providing the economic incentive to
expand global refining capacity.
Moreover, and perhaps of most consequence, these changes
in global supply and demand have increased the wholesale
prices paid by retailers and, ultimately, the prices paid by
consumers. Of course, any given individual retailer’s prices
will reflect the particular economic circumstances confronting
that particular retailer, e.g., the station’s location, commercial
arrangements under which the station is supplied with products,
and operating costs such as rent, insurance, and wages. What
cannot be avoided, however, is the economic reality that U.S.
retail prices are fundamentally determined by the world oil
market.2625
Principal Authors
Kenneth Grant
David Ownby
Steven R. Peterson
Research Assistance
Todor Stavrev
Undertaken for API
Copyright 2006 - API. All rights reserved. Wal-Mart is aregistered trademark of Wal-Mart Stores, Inc. Costco is aregistered trademark of Costco Wholesale Corporation.
A Policy Analysis Study by Lexecon, an FTI Company
27

2006-038 | 05.06 | 2M