Oil & Natural Gas Technology...2013/12/31 · associated with the injection of a mixture of CO2 and...
35
1 Oil & Natural Gas Technology DOE Award No.: ESD12-011 Topical Report Properties of Hydrate-Bearing Sediments Subjected to Changing Gas Compositions Submitted by: Timothy Kneafsey, Project PI Lawrence Berkeley National Laboratory 1 Cyclotron Road Berkeley, CA 94720 Prepared for: United States Department of Energy National Energy Technology Laboratory Office of Fossil Energy
Transcript of Oil & Natural Gas Technology...2013/12/31 · associated with the injection of a mixture of CO2 and...

1
Oil & Natural Gas Technology
DOE Award No.: ESD12-011
Topical Report
Properties of Hydrate-Bearing Sediments
Subjected to Changing Gas Compositions
Submitted by:
Timothy Kneafsey, Project PI
Lawrence Berkeley National Laboratory
1 Cyclotron Road
Berkeley, CA 94720
Prepared for:
United States Department of Energy
National Energy Technology Laboratory
Submitted: 2/5/2013
August 7, 2012
Office of Fossil Energy

2
Behavior of methane hydrate when exposed to a 23% carbon dioxide -77% nitrogen gas
under conditions similar to the ConocoPhillips 2012 Iġnik Sikumi Gas Hydrate Field Trial
Topical Report
Timothy J. Kneafsey
Seiji Nakagawa
Sharon E. Borglin
February 5, 2013
ESD12-011
Tasks 2.0 and 3.0
Lawrence Berkeley National Laboratory
1 Cyclotron Road
Berkeley, CA 94720

3
DISCLAIMER* -- The Disclaimer must follow the title page, and must contain the
following paragraph:
“This report was prepared as an account of work sponsored by an agency
of the United States Government. Neither the United States Government
nor any agency thereof, nor any of their employees, makes any warranty,
express or implied, or assumes any legal liability or responsibility for the
accuracy, completeness, or usefulness of any information, apparatus,
product, or process disclosed, or represents that its use would not
infringe privately owned rights. Reference herein to any specific
commercial product, process, or service by trade name, trademark,
manufacturer, or otherwise does not necessarily constitute or imply its
endorsement, recommendation, or favoring by the United States
Government or any agency thereof. The views and opinions of authors
expressed herein do not necessarily state or reflect those of the United
States Government or any agency thereof.”

4
Executive Summary
We have performed a series of carefully controlled laboratory tests in which we monitor
changes in methane hydrate-bearing samples when a nitrogen/carbon dioxide gas mixture
is flowed through. This was done to provide additional background information for a
field test that was performed in which the same mixture of carbon dioxide and nitrogen
was injected into a methane hydrate-bearing unit beneath the north slope of the Brooks
Range in northern Alaska (ConocoPhillips 2012 Iġnik Sikumi gas hydrate field trial).
In the tests we report on here, we have measured the kinetic gas exchange rate for
different hydrate saturations and different test configurations to provide an estimate for
comparison to numerical models. In our tests, the exchange rate decreased over the
course of time during the tests as methane was depleted from the system. Following the
passing of the methane front, the exchange rate ranged from 3.8 x 10⁻⁷
moles
methane/(mole water*s) to 5 x 10⁻⁸
moles methane/(mole water*s). In these rates, the
moles of water refers to water originally held in the hydrate.
We monitored permeability, or permeability proxy to monitor changes due to gas
exchange. We observed permeability increases and decreases as the gas exchange occurs.
Using our Split Hopkinson Resonant Bar apparatus, we observed changes in the physical
strength of the hydrate-bearing sand during exposure to the mixed gas. Upon introduction
of the mixed gas, the sample became less stiff and wave attenuation increased, indicating
the presence of liquid water between mineral grains and hydrate. Slow dissociation of the
hydrate showed a range of hydrate stability conditions as the gas composition changed
from dissociation and dilution of the previously injected nitrogen.

5
Goals and Objectives The objective of this work is to measure physical, chemical, mechanical, and hydrologic
property changes in methane hydrate bearing sediments subjected to injection of carbon
dioxide and nitrogen. Because the replacement of methane by carbon dioxide and
nitrogen is thermodynamically favored in some cases, these gases are considered to
enhance the extraction of methane from hydrate, and to simultaneously sequester carbon
dioxide. DOE has participated in a field test in Alaska in which nitrogen and carbon
dioxide were introduced into a methane hydrate-bearing reservoir, and then gas was
extracted. Analysis and modeling of the data and processes observed are expected to be
performed for some time resulting in questions that can be efficiently answered in the
laboratory. We will make measurements that support these investigations. We will share
our results with those analyzing the field test, and the scientific community, and
communicate with those analyzing the field test to ensure our tests are on target to answer
their questions.

6
Technical Highlights, Results, and Discussion
Abstract
We have performed a series of carefully controlled laboratory tests in which we monitor
changes in methane hydrate-bearing samples when a nitrogen/carbon dioxide gas mixture
is flowed through. This was done to provide additional background information about a
field test that was performed in which a mixture of carbon dioxide and nitrogen was
injected into a methane hydrate bearing unit beneath the north slope of the Brooks Range
in northern Alaska (ConocoPhillips 2012 Iġnik Sikumi gas hydrate field trial). We have
measured the kinetic gas exchange rate for our tests, providing an estimate for
comparison to numerical models. In our tests, the exchange rate decreased over the
course of the tests as methane was depleted from the system, but following the passing of
the methane front, the exchange rate ranged from 3.8 x 10⁻⁷
moles methane/(mole
water*s) to 5 x 10⁻⁸
moles methane/(mole water*s). In these rates, the moles of water
refers to water originally held in the hydrate. We observed permeability increases and
decreases as the gas exchange occurs. Using our Split Hopkinson Resonant Bar
apparatus, we have observed changes in the physical strength of the hydrate-bearing sand
during exposure to the mixed gas. Slow dissociation of the hydrate showed a range of
hydrate stability conditions as the gas composition changed from dissociation and
dilution of the injected nitrogen.

7
Table of Contents
Abstract 6
Knowledge of State of the Art 8
Experimental setup 9 Flow-through tests ..................................................................................................................... 9
Flow-through test with geophysical and X-ray CT monitoring .......................................... 10
Results 13 Flow-through tests ................................................................................................................... 13
Permeability Changes ........................................................................................................... 15
Flow-through test with geophysical and X-ray CT monitoring .......................................... 16
Hydrate Formation ................................................................................................................ 16
Gas Exchange ....................................................................................................................... 18
Dissociation .......................................................................................................................... 21
Discussion 27
Risk Analysis 29
Milestone Status 30
Schedule Status 30
Cost Status 30
Conclusions 31
References 33

8
Knowledge of State of the Art
A number so studies have been carried out investigating the impact of injecting carbon
dioxide (CO2) and CO2-nitrogen (N2) mixtures into methane hydrate for the purposed of
sequestering CO2 and releasing methane (CH4) (Adisasmito et al., 1991; Anderson et al.,
2003; Lee et al., 2003; Linga et al., 2007; Lu et al., 2007; Ota et al., 2005a; Ota et al.,
2005b; Ota et al., 2007; Park et al., 2006; Seo et al., 2001), and review articles have been
published summarizing the literature (Goel, 2006; Nago and Nieto, 2011; Zhao et al.,
2012). Most of the studies that have been performed have investigated the fundamental
physical/chemical nature of the exchange of CO2 and/or N2 with CH4 in the clathrate.
These studies have been beneficial in identifying the limits to the effectiveness of CO2
injection into CH4 hydrate for the purposes of CH4 production, and CO2 sequestration.
CO2 is thought to replace CH4 from the large cages of the hydrate structure, but because
of its size, is less well suited to replace the CH4 from the small cages. This limits CH4
replacement to 64% (Lee et al., 2003; Lee and Collett, 2005; Park et al., 2006).
Coinjection of CO2 (20 mole %) with N2 increases CH4 replacement to 85%, as the
nitrogen can occupy the small cages of the hydrate cell. Park et al., (2006) point out that
using the nitrogen implies that CO2 from flue gas from a power plant would not have to
be separated out prior to injection. These studies have used NMR and Raman
spectroscopy to understand both the location of the guest molecules (CO2, CH4, N2) in
the hydrate, and to examine the kinetics of replacement. Regarding the kinetics, the
replacement of CH4 in hydrate appears to be rapid (timescale of minutes) for powdered
hydrate in well-mixed systems, however the replacement rate declines with time
indicating that chemical kinetics may be much faster than mass transfer limitations within
solid hydrate.
Few studies have examined the hydrologic and physical/mechanical property changes
that occur during a hydrate composition change (eg. Nakagawa and Kneafsey
unpublished data 2009, Stevens et al., 2008). Nakagawa and Kneafsey observed
resonance properties of CH4 hydrate bearing sand when CO2 was introduced. In spite of
the CH4 hydrate reaction appearing to be complete prior to CO2 introduction, the sample
became significantly stiffer immediately after the CO2 was injected indicating additional
hydrate was formed providing additional cementation in their unsaturated sample. They
did not measure hydrologic properties in this test, and quantification of the effluent gas
was crude. Stevens et al. (2008) measured the permeability of CH4 hydrate bearing
sandstone when CO2 was flowed through, finding that the permeability was not
significantly changed over the limited number of conditions tested. In spite of the obvious
value of these studies, they were performed over a limited range of conditions (mostly
dry hydrate) and fail to address important reservoir issues such as pressure increase upon
injection and effect of gas composition change in a varying composition system.
In FY 12, a mixture of N2 and CO2 were injected into a wet CH4 hydrate-bearing
reservoir in Alaska to field-test the concept of enhanced gas production and CO2
sequestration. Modeling studies and laboratory studies have been performed to predict the
effectiveness of this injection and subsequent withdrawal of gas. Following the test,

9
analysis of the data and occurrences are occurring. Here, we investigated processes
associated with the injection of a mixture of CO2 and N2 gases into CH4 hydrate bearing
porous media under flow-through conditions. We measured effluent gas compositions
using gas chromatography. We quantified the exchange kinetics of the N2 and CO2
replacement into CH4 hydrate using flow through reactors and breakthrough curve
analysis. Permeability was measured to detect changes, and geophysical property changes
were measured using the Split Hopkinson Resonant Bar apparatus.
Experimental setup
Flow-through tests
For the tests reported here, fine-grain silica sand (F110 U.S. Silica, grain size <110 m)
was uniformly moistened with distilled, de-ionized water to either 20% or 40% water
saturation and compacted to 0.41 porosity in a cylindrical, stainless steel column with
inner diameter of 1 cm and length of 25 cm (Figure 1). The cylinder was sealed and
placed in a water bath at 4°C and pressurized to 4.83 MPa (700 psi) with CH4.
Temperature and pressure of the system, as well as pressure differential across the length
of the column were recorded every 20 seconds. Hydrate was allowed to form for at least
24 hrs at 4.83 MPa and 4°C. Prior to starting flow of mixed gas, a permeability test was
completed by flowing CH4 through the column at rates ranging from 0 to 10 ml/min and
recording change in differential pressure.
To perform flow-through gas exchange tests, the pressure in the system was increased
with CH4 to 9.66 MPa (1400 psi). This gas was then replaced at the column inlet by a
mixture of 77% N2 and 23% CO2. This gas mix was set to flow through the column at a
constant rate of 0.1 mL/min. Pressure and flow were maintained using high-pressure
ISCO syringe pumps at the inlet and outlet of the system. Once flow commenced, gas
composition was monitored by sampling and analyzing outlet gas. To allow for gas
sampling, a 0.2 mL sampling tube was added to the effluent tubing. This sampling tube
was manually actuated. First, the tube and expansion chamber were evacuated, followed
by sampling 0.2 ml from the effluent line, expanding the 0.2 ml of gas into an evacuated
1-2 ml volume having a septum allowing sampling. Gas analysis was performed using a
Shimadzu 8A gas chromatograph with a thermal conductivity detector. Both externally
procured and laboratory-made standards were used for calibration.

10
Figure 1. Experimental setup for flow-through tests. Picture (a) is a close up of the column
containing the hydrate, (b) shows the outlet syringe pump and data acquisition system.
Flow-through test with geophysical and X-ray CT monitoring
Fine-grain silica sand (F110 U.S. Silica, average grain size ~110 m) was uniformly
moistened with distilled, de-ionized water and compacted to 0.39 porosity in a
cylindrical, 0.5 mm-thick PVC jacket. The resulting sample [7.67 cm long and 3.81 cm
diameter with a water saturation of 0.19 (fraction of porespace filled with water)] was
installed in the Split Hopkinson Resonance Bar (SHRB) apparatus (Figure 2). It was
desired to create a sample in which the hydrate cemented the mineral grains together, yet
was present in a limited quantity such that small changes to the hydrate would be
indicated by the geophysics. This sacrificed some of the ability to extract information
from the test using X-ray CT, and increased the difficulties in obtaining mass balance.
A 14.5 MPa (2100 psi) absolute pressure isotropic confining stress was applied to the
sample using compressed N2 gas and the sample was cooled to about 4°C, to allow CH4
hydrate formation by pressurizing the porespace using pure CH4 gas to 9.66 MPa (1400
psi). The gas consumption and temperature of the pump barrel were recorded over time to
allow quantification of the hydrate formed. After the start of hydrate formation was
confirmed by resonance frequency and attenuation changes, hydrate formation was left to
continue for about 3 days. After three days, flow of CH4 gas was attempted through the
sample. No flow was possible even under extreme conditions (6 MPa pressure
differential), so the pressure at the sample outlet was reduced slowly to a value beneath
the hydrate stability point until flow was established. Upon establishing flow, the pore
pressure was reset to 9.66 MPa, and the system was allowed to equilibrate for 15 hours
and it remained permeable.
Because the Split Hopkinson Resonance Bar apparatus (SHRB) internally uses extended
lengths of coiled narrow tubing to minimize impacts on resonance, exact quantification of
permeability is difficult. It is possible, however, to monitor changes in permeability by
measuring the pressure differential across the sample and tubing while flow occurs. To
that end, differential pressure was monitored using a Rosemount 3051 pressure
transmitter.
As in the flow-through tests described above, to allow for gas sampling, a 0.2 mL
sampling tube was added to the effluent tubing. This sampling tube was manually
actuated, by first evacuating the tube and expansion chamber, then sampling 0.2 ml from
the effluent line and expanding the 0.2 ml of pressurized gas into an evacuated 1-2 ml
volume having a septum allowing sampling. Gas analysis was performed using a
Shimadzu 8A gas chromatograph with a thermal conductivity detector. Both externally
procured and laboratory-made standards were used for calibration.
Following hydrate formation and equilibration, a mixture of CO2 (23%) and N2 (77%)
was introduced and flowed through the hydrate-bearing sand. The flow rate was 30

11
ml/hour, roughly 1 (0.88) pore volumes per hour. After three days of flow, the inlet to the
sample was closed, and the hydrate sample was slowly dissociated by increasing
temperature at constant pressure.
In addition to monitoring pressure, temperature, and gas composition, sample resonance
properties (frequency and attenuation) were monitored, and spatially-resolved sample
density was intermittently monitored using X-ray computed tomography.
a. Experiment schematic showing Split Hopkinson Resonant Bar.
b. Gas confining cell (top right) and a suspension cage (front) housing the sample-bar assembly
c. Jacketed sample core placed between steel extension rods
Jacketed rock
/sediment core
Temperature sensor (RTD)

12
d. Source and receiver units attached to the ends of the bars. Note that these units were potted
with high-strength epoxy for protection later.
Figure 2. SHRB system setup.
Resonance frequencies and attenuations of extension and torsion mode vibrations of the
sample were measured during the experiment using a modified resonant bar technique
(Nakagawa, 2011)(See Figure 3). From these measurements and the sample geometry
and density, P and S-wave velocities and attenuations are determined. This technique
allows use of a small cylindrical core for seismic property measurements at frequencies
which would require meter-long samples if a conventional resonant bar technique was
used.
Before the experiments with hydrate were started, the packed moist-sand sample was
isotropically compressed in the pressure vessel twice up to 14.5 MPa (2,100 psi) to
minimize the compaction-induced changes in the mechanical properties during the
experiment. The changes in the measured resonance frequencies during hydrate
formation, replacement, and dissociation experiments were between 600 Hz and 1.6 kHz
for the extension mode, and 400 Hz and 1.05 kHz for the torsion mode. Increases in the
resonance frequencies were caused primarily by the cementation of sand grains by CH4
hydrate. Concurrent CT scans were conducted to examine formation, dissociation, and
heterogeneity of hydrate in the sample.

13
Figure 3. Experimental setup
Results
Flow-through tests
In this sequence of experiments the column was packed with sand at either 20 or 40%
initial water saturation and placed under CH4 hydrate-forming conditions, 4°C and 4.83
MPa (700 psi). After hydrate formation, pressure was increased to 9.66 (1400 psi) using
CH4 gas, which was then exchanged for a 77% N2/23% CO2 mixture at a flow rate of 0.1
ml/min.
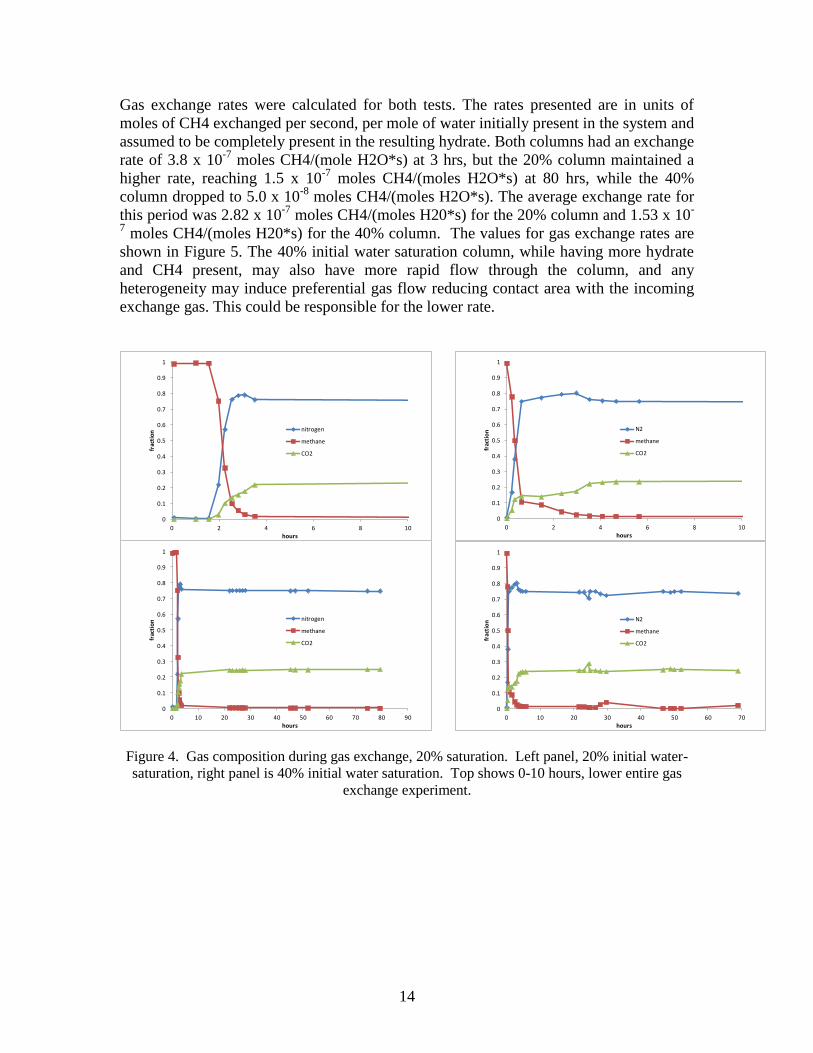
Gas measurements for the 20% initial water saturation test (Figure 4) show close to 100%
CH4 in the effluent for 2 hrs, after which CH4 concentration decreased sharply until the
experiment was stopped due to low CH4 detection after 80 hours (60 pore volumes). N2
and CO2 concentrations approached the inlet gas composition, with the CO2
concentration lagging a bit behind the N2 concentration presumably due to interaction or
exchange with the hydrate. Gas measurements for the 40% saturated column also show
close to 100% CH4 in the effluent at the beginning of the test but begin to decrease
immediately, and as in the 20% saturated column the N2 and CO2 concentrations
approached the inlet gas composition. The more sudden decrease in CH4 concentration
is likely due to the smaller gas volume in the sample from the higher initial water
saturation.
14
Gas exchange rates were calculated for both tests. The rates presented are in units of
moles of CH4 exchanged per second, per mole of water initially present in the system and
assumed to be completely present in the resulting hydrate. Both columns had an exchange
rate of 3.8 x 10⁻⁷
moles CH4/(mole H2O*s) at 3 hrs, but the 20% column maintained a
higher rate, reaching 1.5 x 10⁻⁷
moles CH4/(moles H2O*s) at 80 hrs, while the 40%
column dropped to 5.0 x 10⁻⁸
moles CH4/(moles H2O*s). The average exchange rate for
this period was 2.82 x 10⁻⁷
moles CH4/(moles H20*s) for the 20% column and 1.53 x 10-
7 moles CH4/(moles H20*s) for the 40% column. The values for gas exchange rates are
shown in Figure 5. The 40% initial water saturation column, while having more hydrate
and CH4 present, may also have more rapid flow through the column, and any
heterogeneity may induce preferential gas flow reducing contact area with the incoming
exchange gas. This could be responsible for the lower rate.
0
0.1
0.2
0.3
0.4
0.5
0.6
0.7
0.8
0.9
1
0 10 20 30 40 50 60 70 80 90
frac
tio
n
hours
nitrogen
methane
CO2
0
0.1
0.2
0.3
0.4
0.5
0.6
0.7
0.8
0.9
1
0 2 4 6 8 10
frac
tio
n
hours
nitrogen
methane
CO2
0
0.1
0.2
0.3
0.4
0.5
0.6
0.7
0.8
0.9
1
0 2 4 6 8 10
frac
tio
n
hours
N2
methane
CO2
0
0.1
0.2
0.3
0.4
0.5
0.6
0.7
0.8
0.9
1
0 10 20 30 40 50 60 70
frac
tio
n
hours
N2
methane
CO2
Figure 4. Gas composition during gas exchange, 20% saturation. Left panel, 20% initial water-
saturation, right panel is 40% initial water saturation. Top shows 0-10 hours, lower entire gas
exchange experiment.

15
0.0E+00
2.0E-07
4.0E-07
6.0E-07
8.0E-07
1.0E-06
0 10 20 30 40 50 60 70 80
Kin
eti
c ra
te (
mo
lCH
4/m
olH
2O
*s)
hr
20%
40%
Figure 5. Gas exchange rates between CH4 hydrate and N2/CO2 gas mixture, 1400 psig, 20%
and 40% initial water saturation sand.
Permeability Changes
Column permeability was measured before and after gas exchange and is shown below in
Figure 6. Permeability was measured by varying flow rate and monitoring the
differential pressure across the column. Before the gas exchange test permeability was
measured at 4.83 MPa (700 psig), after the gas exchange test the permeability was
measured at 9.66 MPa (1400 psig). The increase in slope of the line increased indicates
the permeability of the column decreased as a result of the gas exchange test.
Permeability calculations (adjusted for differences in pressure) for before and after gas
exchange for both the 20% and 40% are shown in Figure 6 relative to flow rate through
the column. Average permeability changes from 5.73 x10⁻¹¹
m2 to 2.23 x10
-11 m
2 for the
20% column and 1.00 x10⁻¹⁰
m2 to 1.29 x10
-11 m
2 for the 40% column. No water was
produced in these tests.
0.0
0.5
1.0
1.5
2.0
2.5
3.0
3.5
4.0
0 2 4 6 8 10
de
lta
P (
psi
)
flow (mL/min)
before gas exchange
after gas exchange

16
0
1
2
3
4
5
6
0 2 4 6 8 10
de
lta
P (
psi
)
flow (mL/min)
before gas exchange
after gas exchange
Figure 6. Permeability changes due to the gas exchange test. Top is 20% initial water-saturation
sand column, lower 40% initial water saturation.
Flow-through test with geophysical and X-ray CT monitoring
The experimental results will be presented in three sub sections corresponding to the
three experiments – hydrate formation, gas exchange, and hydrate dissociation. No water
was produced in these tests.
Hydrate Formation
Pressure, Temperature, Differential Pressure
CH4 hydrate was formed using a chilled sample at constant pressure. Upon pressurization
(red arrow in Figure 7), the sample temperature increased in response to the increase in
pressure. The temperature declined over the next several hours, and the hydrate formation
did not show a strong temperature signal. Although the circulating bath temperature was
well-controlled, sample temperature variations occurred in response to strong room
temperature fluctuations (blue arrow in Figure 7). One indication that hydrate formed is
the differential pressure response to room temperature. A hydrate plug at some location in
the sample or line formed, resulting in wildly sweeping pressure differentials across the
sample (yellow arrow in Figure 7). Conductivity was reestablished by depressurization of
the downstream side to immediately below the hydrate stability pressure at the prevailing
temperature and waiting for the pressure to equalize. Upon equalization, the sample was
repressurized and allowed to equilibrate for 15 hours.
Because of the narrow tubing used in the SHRB, the measured pressure differential
provides an indication of the permeability with lower differential pressure indicating
higher permeability. A flowrate of 0.5 mL/min induced a pressure differential of 1.1 psi
in the CH4 hydrate-bearing sample.

17
Figure 7. Physical conditions during CH4 hydrate formation.
Gas Composition
No data are presented here because only CH4 was used in this portion of the test.
Seismic Properties
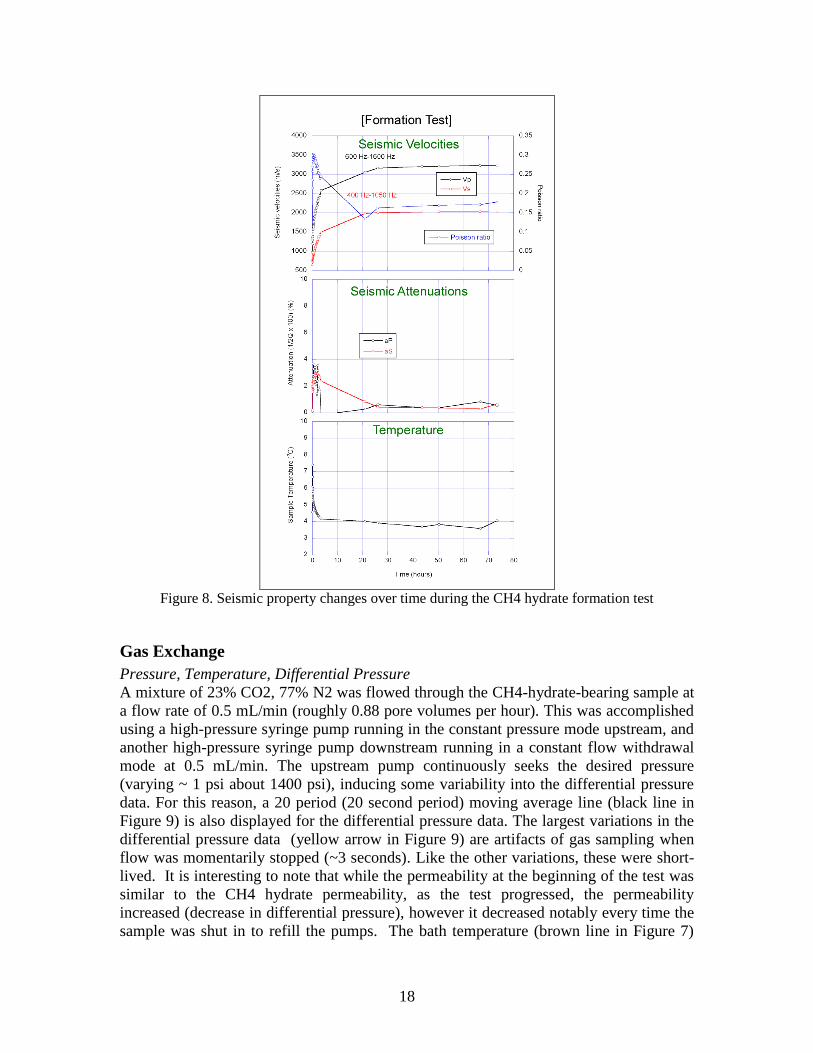
A summary of the seismic measurements for the CH4 hydrate formation are shown in
Figure 8. The initial P and S-wave velocities (VP, VS) of the sample (without hydrate) at
an effective confining stress of 700 psi were 976 m/s and 658 m/s, and attenuations (aP,
aS) 0.09% and 0.21%, respectively. The Poisson ratio from the velocity ratio was 0.085.
Introducing CH4 gas in the sample immediately resulted in increases in both velocities
and attenuations, indicating the formation of CH4 hydrate at the grain contacts. The
attenuations reached a peak one to two hours after the start of hydrate formation, at about
2.5%. The Poisson ratio also reached its peak value of ~0.3 at the same time. Most of the
hydrate formation occurred within the first 24 hours of the experiment. However, small
increases in the velocities were observed at up to 72 hours after the hydrate replacement
test was started. The velocities, attenuations, and the Poisson ratio at the final state were
VP=3,236 m/s, VS=2026 m/s, aP=0.54%, aS=0.64, and =0.18.
18
Figure 8. Seismic property changes over time during the CH4 hydrate formation test
Gas Exchange
Pressure, Temperature, Differential Pressure
A mixture of 23% CO2, 77% N2 was flowed through the CH4-hydrate-bearing sample at
a flow rate of 0.5 mL/min (roughly 0.88 pore volumes per hour). This was accomplished
using a high-pressure syringe pump running in the constant pressure mode upstream, and
another high-pressure syringe pump downstream running in a constant flow withdrawal
mode at 0.5 mL/min. The upstream pump continuously seeks the desired pressure
(varying ~ 1 psi about 1400 psi), inducing some variability into the differential pressure
data. For this reason, a 20 period (20 second period) moving average line (black line in
Figure 9) is also displayed for the differential pressure data. The largest variations in the
differential pressure data (yellow arrow in Figure 9) are artifacts of gas sampling when
flow was momentarily stopped (~3 seconds). Like the other variations, these were short-
lived. It is interesting to note that while the permeability at the beginning of the test was
similar to the CH4 hydrate permeability, as the test progressed, the permeability
increased (decrease in differential pressure), however it decreased notably every time the
sample was shut in to refill the pumps. The bath temperature (brown line in Figure 7)

19
was relatively constant, yet the sample temperature responded in a buffered fashion to the
room temperature. There was no obvious temperature response to the change in influent
gas chemistry. At one point (brown arrow in Figure 9), we lowered the bath temperature
to check the hypothesis that these mild temperature variations were causing large
variations in sample resonance (more below).
Figure 9. Physical conditions during gas exchange
Gas Composition As expected and similar to the tests reported above, the effluent gas stream initially was
composed purely of CH4 as the CH4 was flushed from the sample. Although
simultaneous gas exchange with hydrate was occurring (see resonance section below) it
could not be detected chemically until the gas reached the sample point. The N2 and CO2
concentrations increased over time with declining CH4 concentration. After several pore
volumes of the mixed gas were flowed, a spike in CH4 concentration occurred (from
3.6% to 9.4% over 40 minutes). This was concurrent with a gradual temperature increase
in the sample (3.6C to 4.3C over several hours). This temperature shift corresponds with
room temperature changes, but further deconvolution of the data may show a gas-
exchange related temperature change. Other temperature increases and decreases
occurred as well without drastic gas composition changes. The next most significant
temperature increase (3.8C to 4.2C on the following day) resulted in a CH4 concentration
increase from 0.2% to 0.4%.
The volumes of gas injected and recovered did not match each other (Figure 10, brown
and blue lines). This could mean 1) the volume indicators are inaccurate, 2) a leak from
the confining N2 is present, and/or 3) a change in gas chemistry has occurred. The
accuracy of the volume indicators is being verified. A leak from the confining N2 would

20
have become evident during other parts of the test, as the sample was shut in many times
and no obvious pressure increase was recorded. The molar densities of the gases at 18C
are: CH4 (1414 psia) 4.8 mol/L, N2 (1414 psia*0.77 = 1089 psi) 3.12 mol/L, and CO2
(1414 psia*0.23 = 322 psi) 1.07mol/L. The summed N2 and CO2 densities are 4.19
mol/L, which is significantly lower than the CH4 density. (This assumes ideal gas
properties, which induce an error into the calculations.) The collected gas would be richer
in CH4, thus lower volume. Further analysis is needed to verify these alternative
explanations.
The rate of gas exchange once the initial CH4 peak had passed through the system,
declined with time as the CH4 was exchanged out. The average rate following the yellow
arrow in Figure 10 ranged from 3.5 to 0.8 x 10⁻⁷
moles CH4/(mole water*s), and the
average value was 2.7 x 10⁻⁷
moles CH4/(mole water*s).
Figure 10. Effluent gas composition during gas exchange.
Seismic properties
Immediately after the CH4 hydrate formation test, the CH4-hydrate to CO2-hydrate
replacement test was conducted (Figure 11). Upon introducing the mixed N2 (77%)-CO2
(23%) gas was introduced in the sample, large decreases in seismic velocities and large
increases in attenuations were observed. A slight increase in the Poisson ratio was also
observed (from 0.18 to 0.2) but the change was very small. The decreases in velocities
were up to ~330 m/s for the P wave and ~240 m/s for the S wave, about 10% of the
original velocities. Attenuations increased up to the same level as during the CH4-hydrate
formation test.

21
Note that during this experiment as mentioned above, there were rather large sample
temperature fluctuations, mostly due to large room temperature changes in the laboratory
(see Figure 9). The behavior of the sample seemed to be related to the temperature
variation. During a large temperature increase (as indicated in pink in the figure), the set
temperature of the temperature control bath was decreased to counteract the effect. This
resulted in some recoveries in the seismic velocities and decreases in attenuation.
Figure 11. Seismic property changes during the CH4-hydrate to CO2-hydrate
replacement test
Dissociation
Pressure, Temperature, Differential Pressure
Hydrate dissociation was accomplished by increasing the sample temperature by stepwise
increasing the bath temperature (Figure 12). This resulted in a fairly constant rate of
sample temperature increase. Differential pressure spikes shown in Figure 12 are the
result of gas sampling. Elevated differential pressure resulting from rapid hydrate
dissociation was not observed.

22
Figure 12. Temperature, pressure, and differential pressures during dissociation.
Gas Composition
The volume of gas produced and its composition are shown in Figure 13. Initially, the
sample contained the mixed hydrate presumably in equilibrium with the inlet 23% CO2
77% N2 gas. As dissociation occurred releasing CH4 and CO2, the N2 concentration
decreased. CO2 was released preferentially to the CH4 over the course of the
dissociation. Whether that is the result of equilibrium processes for a uniform hydrate, or
mass transfer limitations where a CO2-rich hydrate layer overlies a CH4-rich hydrate
requires additional analysis. Ultimately, the produced gas fractions were 69% N2, 24%
CO2, and 7% CH4.
The dissociation was thermally induced, and the total pressure was held constant.
Because N2 is presumably not significantly held in the hydrate phase, dissociation of the
hydrate - containing CH4 and CO2 - will dilute the N2 and enrich the fraction (partial
pressure) of the hydrate formers. If the hydrate were CO2 hydrate in the CO2/N2 mixed
gas, as the CO2 becomes enriched (N2 concentration becomes more dilute), the stability
temperature increases (see Figure 14a). In our test, the N2 was diluted by dissociation,
thus the hydrate formers were enriched in the sample. This increased the hydrate stability
temperature as the dissociation continued. This is compared to the N2/CO2 system in
Figure 14b.

23
Figure 13. Volume of gas produced and gas composition. top: first 20 hours, bottom: whole test.

24
a. b. Figure 14. a. CO2 stability curve showing N2 composition for the 23% CO2/77% N2 mixture at
1400 psi. b. Comparison of extracted CO2 hydrate equilibrium curve from a. to the observed
temperature and gas chemistry.
Seismic properties
Dissociation of the mixed CH4-CO2 hydrate was conducted by increasing the sample
temperature at a rate of approximately 0.5ºC/hour (Figure 12). During the test, the
seismic velocities decreased continuously until they reached the original velocities of the
moist sand pack (Figure 15). In contrast, extremely large attenuations were observed,
which peaked at 5–6 hours after the start of the test. The maximum attenuations were ~8–
10% for the P wave and ~6.5% for the S wave. The Poisson ratio exhibited a small
increase which peaked when the maximum attenuation occurred, and then decreased to
the level for the original sand pack.

25
Figure 15. Seismic property changes over time during the mix-hydrate dissociation test
X-ray computed tomography
X-ray computed tomography was used to monitor the spatial density distribution over the
range of experiments. Scanning was performed while the sample was moist sand, after
CH4 hydrate formed, after gas exchange, and at intervals during dissociation. An
example is shown in Figure 16 showing the density distribution for the moist sand case.
Changes during the different stages of the experiment were typically relatively small
(Figure 17, in Hounsfield Units) but within the expected ranges of values.

26
Figure 16. Density distribution for the moist sand sample. Upper left is a cross section in the
center of the sample, upper right and lower left are perpendicular cross sections along the axis,
and the lower right image shows the color bar.

27
Figure 17. Density changes from the moist case. In a linear calibration, 1000 Hounsfield units is 1
g/cm3.
Discussion
Of the tests performed under this task, three are reported on here. Two of these tests were
performed in long narrow columns (25:1 aspect ratio) and one in a short column (2:1
aspect ratio). Two tests were performed with an initial water saturation of 20%, and one
with an initial water saturation of 40%. One test has a large suite of measurements made,
while the others had a limited suite of measurements. The key observations from the tests
were:
1) Permeability increased in some tests, and decreased in another. The permeability
changed over the course of a set of measurements indicating physical changes in
the porespace in the hydrate-bearing sands.
2) The gas exchange rates following the CH4 peaks ranged from about 3.8 x 10⁻⁷
moles CH4/(mole water*s) to 5 x 10⁻⁸
moles CH4/(mole water*s), where the
moles water refers to the water held in hydrate.
3) The CH4 hydrate, when exposed to the 77% N2 23% CO2 gas experienced
dissociation and physical property changes.
In both of our tests not having the geophysical measurements, permeability decreased
because of gas exchange. This was not the case for the test undergoing the suite of
geophysical measurements which showed increasing permeability indications. In this test,
several constrictions were present making true permeability measurements very difficult.

28
The permeability varied over the course of the test, with short shut-in times during which
pumps were refilled causing permeability increases.
Gas exchange rates were computed for times following the CH4 peak passing through the
system. Additional information may be present in the breakthrough curves which may be
brought forward during additional analysis. The rates were similar for all the tests, and
declined over time. The rate reduction as time progressed would be expected as the
amount of CH4 in the sample would decrease over time. It should be pointed out that the
rates presented here are subject to mass transfer limitations and flow preferential paths as
would also be expected in a field test.
The sudden decreases in seismic velocities and particularly the increases in attenuations
during the hydrate replacement test indicate that the CH4-hydrate in the pore space was
dissociating, and liquid water was being produced at the grain contacts. However, the
small increases in the sample temperature, although it never exceeded the theoretical
temperature for the stability of CO2 hydrate, may have some impact on the dissociation.
To gain a better understanding of the process occurring within the sample, seismic
velocities are plotted against the temperature (Figure 18). In this figure, velocities during
the hydrate replacement test are shown as the path 1→2→3, and the dissociation test as
3→4→. Initially, the velocities decreased rapidly over a 0.5ºC increase in the temperature
of the sample (1→2). When the sample temperature was forced to decrease, some of the
lost velocities were recovered (2→3). Interestingly, several small excursion loops due to
fluctuating sample temperature and resulting changes in velocities all appear to collapse
on single temperature-velocity curves. Further, for the early part of the dissociation test
(3→4), the observed temperature-velocity behavior is in very good agreement with these
curves. These results indicate that there is a phase boundary between the mixed hydrate
and the mixed gas with the composition used in the experiment. Along this boundary, the
effects of the mixed hydrate formation and dissociation seem to be reversible.
During hydrate dissociation, a range of stable states was encountered. As the temperature
increased, the gas composition adjusted itself so that a new equilibrium state was
obtained. This resulted in temperatures from over 4 to about 9 having some stable
hydrate, and strongly buffered dissociation.

29
Figure 18. Seismic velicities during the gas exchange test plotted against sample temperature.
Risk Analysis
Risks associated with FWP task execution include safety risks, personnel availability
risks, risks of equipment failure, facility risks, and technical uncertainties. Each will be
addressed separately.
The proposed studies require the use of compressed gases and the use of flammable
gases. LBNL has worked safely on similar projects in the past, and has a good track
record for safety. Safety risks are minimized by using appropriately sized and rated
pressure vessels and lines, small volumes when possible, carefully considered techniques,
and appropriate safety oversight and monitoring. The consequences of the safety risks
include personal injury, equipment damage, and schedule delays. To date, these risks
have been managed well causing no injuries or delays.
Personnel who will be working on this project are committed to providing a best effort to
perform project tasks and meet the project schedule. None of the personnel working on
this project are solely funded by this project, however, and consequently are required to
meet schedule and availability requirements of other projects that are not always known
at project inception. Additionally, factors such as illness and jury duty can impact project

30
schedule. Planning and communication among project personnel is underway to
minimize the impact of scheduling conflicts.
Some of the equipment used in this research is expensive, specialized, and/or one-of-a-
kind. Although not anticipated, equipment can fail and repair/replacement can be
expensive and time consuming. Currently, all needed equipment is functioning properly,
and is scheduled to be available.
Facility risks include facilities not being available to allow performance of the work.
During the performance period of this FWP, the laboratories and offices of project
participants will move to a newly remodeled building. This entails shutting down and
dismantling systems, moving, reassembling systems in the new laboratory, and testing,
restarting and recalibrating the equipment. Additionally, since most safety documentation
at LBNL is location dependent, modification and approval of the new documentation will
be required. Planning is underway to minimize the facility risks. Significant delays
occurred due to a changing laboratory move schedule. These occurred because move
preparations occurred, resulting in idling equipment, reestablishing function and permits,
and restarting test sequences over a range of projects.
Technical uncertainties result from research tasks because often the results of a research
step are unexpected requiring changes in subsequent research steps. Although these
unexpected results often result in changes in the schedule and budget, the lessons learned
from the results are often valuable. Several of these occurred during preliminary tests
resulting in improved techniques.
Milestone Status
This report is the second of two milestone reports. The first milestone report was planned
to be submitted on July 31, 2012 and was submitted on August 7, 2012. The original
planned submission date for this report date was October 31, 2012, however this date was
later modified to be January 31, 2013. This date slipped due to laboratory move related
issues including deactivation and reactivation and repermitting of the X-ray CT scanner.
Schedule Status
As reported above, this milestone report was submitted after the planned submission date.
The final results of this project will be presented in March 2013 at a meeting in Houston
TX. Further data analysis is required to prepare the work for presentation and publication,
and budget is available for this work.
Cost Status
Through December 31, 2013, $45K of the funding awarded for this work has been spent.
This was augmented at the beginning of the project with $8K carryover funding from
previous DOE/NETL gas hydrate work, therefore total expenses on this project have been
$53K. This is less than the $99K spending anticipated to occur prior to December 31,

31
2012, but anticipated because of schedule delays. Expenditures in the current quarter to
date are $27K, resulting in $80K spent on the project to date. The remaining funds will be
used to to attend the meeting in Houston to discuss the ConocoPhillips project which this
supplies data for, further data analysis, and for publication.
Cost Plan/Status
Baseline Reporting Quarter
Year 1 Start: End: Year 2 Start: End:
Q1 Q2 Q3 Q4 Q1 Q2* Q3 Q4
Baseline Cost Plan
Federal Share
Task1 3 3 3 1
Task2 14 14 14
Task3 12 20 16
Non-FederalShare 0 0 0 0
Total Planned Cost 29 37 33 1
Federal and Non-Federal 29 37 33 1
Cumulative Baseline Cost 29 66 99 100
Actual Incurred Costs
Federal Share
Task1 1 3 3 3
Task2 0 34 10 7
Task3 0 2 1 36
Non-FederalShare
Total Planned Cost 29 37 33 1
Federal and Non-Federal
Cumulative Incurred Cost 1 40 54 100
Variance
Federal Share
Task1 -2 0 0 2
Task2 -14 20 -4 7
Task3 -12 -18 -15 36
Non-FederalShare
Total Planned Cost
Federal and Non-Federal
Cumulative Variance -28 -26 -45 0
Table 1. Cost plan and status. * indicates current quarter estimated expenses.
Conclusions
The introduction of a 77%N2/23%CO2 gas into methane hydrate at 4C and 1400
psig results in hydrate dissociation and water formation. This was indicated by
geophysical monitoring of our sample, and both Vp and Vs decreased and
attenuation increased dramatically. The full impacts of this sample softening are
unclear because the wave speeds did not decrease to the initial moist sand
condition.

32
The rate of gas exchange decreases over time as methane is exchanged out of the
hydrate, and/or becomes occluded from the gas flow by converted hydrate. Rates
of gas exchange were on the order of 10-7
moles CH4/(mole water*s).
Slow hydrate dissociation occurred over a wide range of stability conditions
resulting from the concentration of the hydrate forming gases.

33
References
Adisasmito, S., Frank, R.J. and Sloan, E.D., 1991. Hydrates of carbon dioxide and
methane mixtures. Journal of Chemical & Engineering Data, 36(1): 68-71.
Anderson, R., Llamedo, M., Tohidi, B. and Burgass, R.W., 2003. Experimental
Measurement of Methane and Carbon Dioxide Clathrate Hydrate Equilibria in
Mesoporous Silica. The Journal of Physical Chemistry B, 107(15): 3507-3514.
Goel, N., 2006. In situ methane hydrate dissociation with carbon dioxide sequestration:
Current knowledge and issues. Journal of Petroleum Science and Engineering,
51(3–4): 169-184.
Lee, H., Seo, Y., Seo, Y.-T., Moudrakovski, I.L. and Ripmeester, J.A., 2003. Recovering
Methane from Solid Methane Hydrate with Carbon Dioxide. Angewandte Chemie
International Edition, 42(41): 5048-5051.
Lee, M.W. and Collett, T.S., 2005. Controls on the physical properties of gas hydrate-
bearing sediments because of the interaction between gas hydrate and porous
media, Fifth International Conference on Gas Hydrates, Trondheim, Norway, pp.
2014.
Linga, P., Kumar, R. and Englezos, P., 2007. Gas hydrate formation from
hydrogen/carbon dioxide and nitrogen/carbon dioxide gas mixtures. Chemical
Engineering Science, 62(16): 4268-4276.
Lu, H., Tsuji, Y. and Ripmeester, J.A., 2007. Stabilization of methane hydrate by
pressurization with He or N2 gas. Journal of Physical Chemistry B, 111: 14163-
14168.
Nago, A. and Nieto, A., 2011. Natural Gas Production from Methane Hydrate Deposits
Using CO2 Clathrate Sequestration: State-of-the-Art Review and New Technical
Approaches. Journal of Geological Research, 2011.
Nakagawa, S., 2011. Split Hopkinson resonant bar test for sonic-frequency acoustic
velocity and attenuation measurements of small, isotropic geological samples.
Review of Scientific Instruments, 82(4): 044901-13.
Ota, M., Abe, Y., Watanabe, M., Smith Jr, R.L. and Inomata, H., 2005a. Methane
recovery from methane hydrate using pressurized CO2. Fluid Phase Equilibria,
228–229(0): 553-559.
Ota, M. et al., 2005b. Replacement of CH4 in the hydrate by use of liquid CO2. Energy
Conversion and Management, 46(11–12): 1680-1691.
Ota, M. et al., 2007. Macro and microscopic CH4–CO2 replacement in CH4 hydrate
under pressurized CO2. AIChE Journal, 53(10): 2715-2721.

34
Park, Y. et al., 2006. Sequestering carbon dioxide into complex structures of naturally
occurring gas hydrates. PNAS, 103(34): 12690–12694.
Seo, Y.-T., Lee, H. and Yoon, J.-H., 2001. Hydrate Phase Equilibria of the Carbon
Dioxide, Methane, and Water System. Journal of Chemical & Engineering Data,
46(2): 381-384.
Stevens, J.C. et al., 2008. Experimental hydrate formation and gas production scenarios
based on CO2 sequestration, 6th International Conference on Gas Hydrates
(ICGH 2008), Vancouver, British Columbia, CANADA.
Zhao, J. et al., 2012. A Review on Research on Replacement of CH4 in Natural Gas
Hydrates by Use of CO2. Energies, 5(2): 399-419.

35
National Energy Technology Laboratory
626 Cochrans Mill Road
P.O. Box 10940
Pittsburgh, PA 15236-0940
3610 Collins Ferry Road
P.O. Box 880
Morgantown, WV 26507-0880
13131 Dairy Ashford Road, Suite 225
Sugar Land, TX 77478
1450 Queen Avenue SW Albany, OR 97321-2198
Arctic Energy Office
420 L Street, Suite 305
Anchorage, AK 99501
Visit the NETL website at:
www.netl.doe.gov
Customer Service Line:
1-800-553-7681
![Hydrate equilibrium data for the CO2 + N2 system with the ... · ionic liquids [4], [8]. 1.2 Hydrate promoters Hydrate promotion is a rather new field of study, less than 15 years](https://static.fdocuments.us/doc/165x107/6041ce6b87956406bb6fe171/hydrate-equilibrium-data-for-the-co2-n2-system-with-the-ionic-liquids-4.jpg)