Oil Crops Outlook - Cornell University
17
USDA raised its forecast of the 2012/13 soybean crush by 10 million bushels this month to 1.57 billion, as lower prices helped to strengthen export outlooks for soybean meal and soybean oil. USDA’s price forecast for soybeans in 2012/13 is lowered 35 cents to $13.55-$15.55 per bushel. Export forecasts for 2012/13 were raised this month for both soybean meal (up 300,000 short tons to 8.2 million) and soybean oil (up 600 million pounds to 1.8 billion). Global sunflowerseed production for 2012/13 is estimated at 35.7 million metric tons— up 930,000 tons from last month. The sunflowerseed crop in Russia was raised 800,000 tons this month to 7.5 million based on reports of better than expected yields. These gains were partly offset by trimming 200,000 tons from the forecast of Argentine sunflowerseed production (to 3.4 million) on account of wetness-related losses in sown area. 0 500 1,000 1,500 2,000 Oct 4 Oct 11 Oct 18 Oct 25 Nov 1 Nov 8 Nov 15 Nov 22 Nov 29 Million pounds Source: USDA, Foreign Agricultural Service, U.S. Export Sales. Figure 1 U.S. export commitments for new-crop soybean oil are up sharply to date 2009/10 2010/11 2011/12 2012/13 Oil Crops Outlook Mark Ash [email protected] Lower Prices Buoy U.S. Export Prospects for Soybean Products OCS-12l Dec. 12, 2012 Contents Domestic Outlook Intl. Outlook Contacts & Links Tables Soybean S&D Soybean Meal Soybean Oil Cottonseed Cottonseed Meal Cottonseed Oil Peanuts Oilseed Prices Veg. Oil Prices Oilseed Meal Prices Web Sites WASDE Oilseed Circular Soybeans & Oil Crops Topic Page ------------- The next release is January 15, 2013. -------------- Approved by the World Agricultural Outlook Board.
Transcript of Oil Crops Outlook - Cornell University

USDA raised its forecast of the 2012/13 soybean crush by 10 million bushels this month to 1.57 billion, as lower prices helped to strengthen export outlooks for soybean meal and soybean oil. USDA’s price forecast for soybeans in 2012/13 is lowered 35 cents to $13.55-$15.55 per bushel. Export forecasts for 2012/13 were raised this month for both soybean meal (up 300,000 short tons to 8.2 million) and soybean oil (up 600 million pounds to 1.8 billion). Global sunflowerseed production for 2012/13 is estimated at 35.7 million metric tons—up 930,000 tons from last month. The sunflowerseed crop in Russia was raised 800,000 tons this month to 7.5 million based on reports of better than expected yields. These gains were partly offset by trimming 200,000 tons from the forecast of Argentine sunflowerseed production (to 3.4 million) on account of wetness-related losses in sown area.
0
500
1,000
1,500
2,000
Oct 4 Oct 11 Oct 18 Oct 25 Nov 1 Nov 8 Nov 15 Nov 22 Nov 29
Million pounds
Source: USDA, Foreign Agricultural Service, U.S. Export Sales.
Figure 1U.S. export commitments for new-crop soybean oil are up sharply to date
2009/10
2010/11
2011/12
2012/13
Oil Crops Outlook Mark Ash [email protected] Lower Prices Buoy U.S. Export Prospects for Soybean Products
OCS-12l Dec. 12, 2012
Contents Domestic Outlook Intl. Outlook Contacts & Links Tables Soybean S&D Soybean Meal Soybean Oil Cottonseed Cottonseed Meal Cottonseed Oil Peanuts Oilseed Prices Veg. Oil Prices Oilseed Meal Prices Web Sites WASDE Oilseed Circular Soybeans & Oil Crops Topic Page ------------- The next release is January 15, 2013. -------------- Approved by the World Agricultural Outlook Board.

Domestic Outlook
2 Oil Crops Outlook/OCS-12l/December 12, 2012
Economic Research Service, USDA
Domestic Soybean Crushing Boosted by Solid Export Sales of Soybean Meal and Soybean Oil This month, USDA raised its forecast of the 2012/13 soybean crush by 10 million bushels to 1.57 billion. Since the summer, processor margins have been supported by a sharp decline in the cost of soybeans. The soybean prices paid in November by central Illinois processors fell to $14.64 per bushel from $15.49 in October and $16.95 in September. Their competitors in Brazil and Argentina are slowing crush rates due to the scarcity of remaining soybean stocks there. At least for the next few months, these factors will make U.S. processors more competitive exporters of soybean meal and soybean oil. U.S. export inspections of soybeans through December 6 totaled 648 million bushels—an all-time high for this date. The record pace is unlikely to continue very long as exports should start slowing with a steep decline in new sales. It is likely that an uncommonly high percentage of soybean exports will be shipped in the first half of this marketing year. Even so, the soybean sales already booked for 2012/13 may be large enough to reach the current export forecast, which was left unchanged this month at 1.345 billion bushels. The expectation this month of a higher soybean crush then lowers the forecast of season-ending stocks to 130 million bushels from 140 million last month. Despite a tighter outlook for soybean stocks, declining prices this fall are anticipated to trim back the U.S. season-average farm price. USDA’s price forecast for 2012/13 is lowered to $13.55-$15.55 per bushel, which would still be an all-time high but down from $13.90-$15.90 last month. Strong November Sales Lead to Surge in Soybean Oil Exports In November, unusually large export sales of soybean oil have suddenly boosted U.S. trade prospects for the commodity. Importers in China were particularly active buyers this fall in the U.S. soybean oil market. Shipments to China for October-November already totaled 243 million pounds—more than for all of last year. As a consequence, USDA raised its 2012/13 export forecast for soybean oil this month by 600 million pounds to 1.8 billion. Despite the early surge in exports, current production of soybean oil has also been quite strong and stocks are still rising. Soybean oil output for 2012/13 is forecast up 460 million pounds this month to 18.3 billion pounds due to higher expected rates for both the crush and oil yield. Above-average oil content is often associated with soybean pods that fill out during an extended period of hot weather (like last summer). If realized, the soybean oil extraction rate forecast for 2012/13 would be at an all-time high. In November, central Illinois soybean oil prices fell 3 cents per pound from October to a monthly average price of 46.3 cents. The decline in soybean oil values led USDA to lower its forecast of the 2012/13 average price by 2 cents per pound this month to 49-53 cents per pound. Ample global supplies of palm oil and moderate costs for crude petroleum are also maintaining pressure on soybean oil prices. By next spring, however, a reversal of the trends in U.S. soybean oil supply and

3 Oil Crops Outlook/OCS-12l/December 12, 2012
Economic Research Service, USDA
demand (hastened by robust export shipments) could set up a moderate price rally. Stocks of soybean oil could be declining rapidly by that time once the crush slows and domestic use strengthens. Season-ending stocks of soybean oil are forecast down 40 million pounds this month to 1.48 billion as higher export demand offsets the additional production. The current increase in soybean processing is also weighing on soybean meal prices, which dropped to a November average of $466 per short ton compared to $488 in October. In response, USDA lowered its forecast of the 2012/13 average price for soybean meal to $440-$470 per short ton from $455-$485 last month. These lower costs for soybean meal have stimulated more export sales this fall, particularly for the Philippines, EU-27, and Turkey. A brighter sales outlook encouraged USDA to raise its 2012/13 forecast of soybean meal exports this month by 300,000 tons to 8.2 million. On the other hand, domestic disappearance of soybean meal is trimmed another 100,000 tons to 29.4 million, in line with a lower U.S. production forecast for hogs over the next 9 months.
International Outlook
4 Oil Crops Outlook/OCS-12l/December 12, 2012
Economic Research Service, USDA
0
1
2
3
0
1
2
3
4
5
2006/07 2007/08 2008/09 2009/10 2010/11 2011/12 2012/13
Million hectaresMillion metric tons
Source: USDA, Foreign Agricultural Service, PS&D Online.
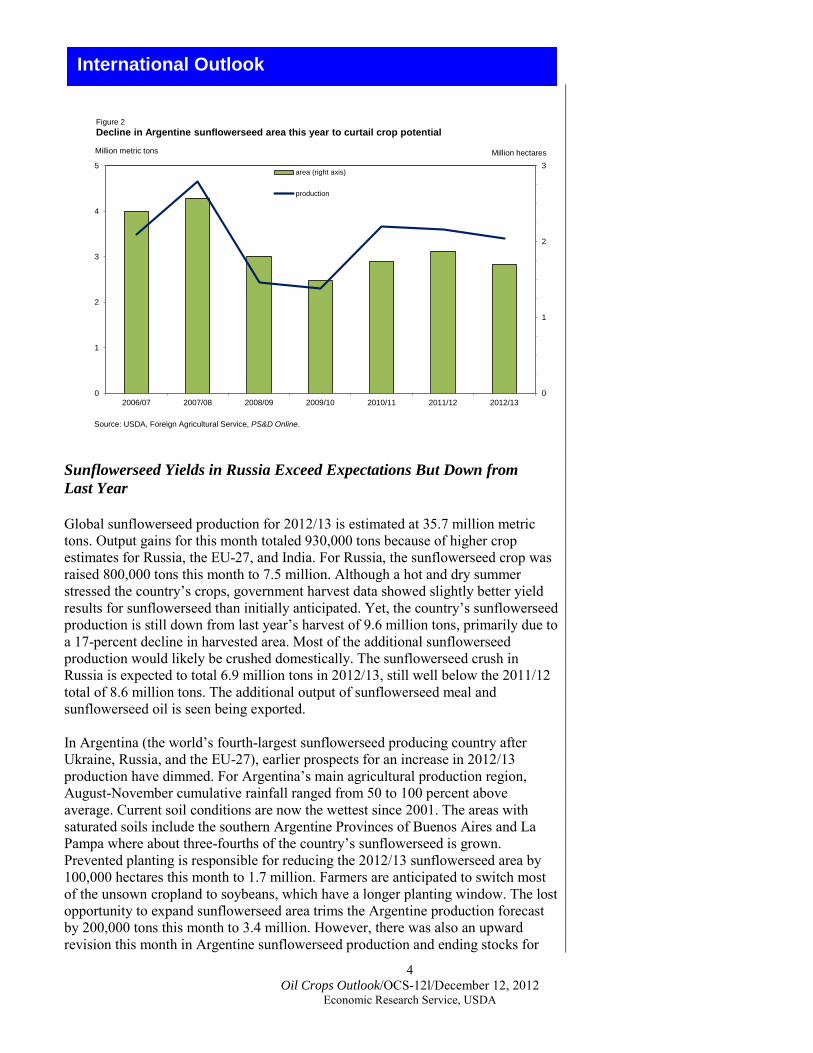
Figure 2Decline in Argentine sunflowerseed area this year to curtail crop potential
area (right axis)
production
Sunflowerseed Yields in Russia Exceed Expectations But Down from Last Year Global sunflowerseed production for 2012/13 is estimated at 35.7 million metric tons. Output gains for this month totaled 930,000 tons because of higher crop estimates for Russia, the EU-27, and India. For Russia, the sunflowerseed crop was raised 800,000 tons this month to 7.5 million. Although a hot and dry summer stressed the country’s crops, government harvest data showed slightly better yield results for sunflowerseed than initially anticipated. Yet, the country’s sunflowerseed production is still down from last year’s harvest of 9.6 million tons, primarily due to a 17-percent decline in harvested area. Most of the additional sunflowerseed production would likely be crushed domestically. The sunflowerseed crush in Russia is expected to total 6.9 million tons in 2012/13, still well below the 2011/12 total of 8.6 million tons. The additional output of sunflowerseed meal and sunflowerseed oil is seen being exported. In Argentina (the world’s fourth-largest sunflowerseed producing country after Ukraine, Russia, and the EU-27), earlier prospects for an increase in 2012/13 production have dimmed. For Argentina’s main agricultural production region, August-November cumulative rainfall ranged from 50 to 100 percent above average. Current soil conditions are now the wettest since 2001. The areas with saturated soils include the southern Argentine Provinces of Buenos Aires and La Pampa where about three-fourths of the country’s sunflowerseed is grown. Prevented planting is responsible for reducing the 2012/13 sunflowerseed area by 100,000 hectares this month to 1.7 million. Farmers are anticipated to switch most of the unsown cropland to soybeans, which have a longer planting window. The lost opportunity to expand sunflowerseed area trims the Argentine production forecast by 200,000 tons this month to 3.4 million. However, there was also an upward revision this month in Argentine sunflowerseed production and ending stocks for

5 Oil Crops Outlook/OCS-12l/December 12, 2012
Economic Research Service, USDA
2011/12, so 2012/13 forecasts of domestic use, exports, and ending stocks are virtually unchanged. Record Acreage for Canola in Canada Countered by Disappointing Yields The 2012/13 forecast of global rapeseed production—at 59.3 million metric tons—declined slightly this month as crop reductions for Canada and the EU-27 were offset by an increase for Russia. For Canada, canola production was shaved 90,000 tons this month to 13.31 million. Despite a government report indicating a larger harvested area of 8.6 million hectares, canola yields were pegged down from earlier estimates. The impact of that reduction in the canola crop on this year’s total supplies in Canada is largely negated by higher beginning stocks, which stemmed from an upward revision in last year’s production. Nevertheless, the reduced supply situation for 2012/13 still portends very tight season-ending stocks. That outcome is also conditioned on a firm outlook for canola demand. Forecasts of new-crop canola exports and domestic crush for Canada were unchanged this month at 7.3 million and 6.75 million tons, respectively

USDA is an equal opportunity provider and employer. USDA is an equal opportunity provider and employer.
February 21-22, 2013Crystal Gateway Marriott HotelArlington, Virginia
February 21-22, 2013Crystal Gateway Marriott HotelArlington, Virginia
www.usda.gov/oce/forum

Contacts and Links
Contact Information Mark Ash (soybeans, vegetable oils), (202) 694-5289, [email protected] Verna Daniels (web publishing), (202) 694-5301, [email protected]
Subscription Information Subscribe to ERS’ e-mail notification service at http://www.ers.usda.gov/subscribe-to-
ers-e-newsletters.aspx to receive timely notification of newsletter availability. Printed copies can be purchased from USDA Order desk by calling 1-800-999-6779 (specify the issue number).
To order printed copies of the five-field crop newsletters—cotton and wool, feed, rice, oil crops, and wheat—as a series, specify series SUB-COR-4043.
Data
Monthly tables from Oil Crops Outlook are available in Excel (.xls) spreadsheets at http://www.ers.usda.gov/publications/ocs-oil-crops-outlook/. These tables contain the latest data on the production, use, imports, exports, prices, and textile trade of cotton and other fibers.
Recent Reports
Estimating the Substitution of Distillers’ Grains for Corn and Soybean Meal in the U.S. Feed Complex http://www.ers.usda.gov/media/236568/fds11i01_2_.pdf.
Corn-based dry-mill ethanol production and that of its coproducts—notably distillers’dried grains with soluble (DDGS)—has surged in the past several years. The U.S. feed industry has focused on the size of this new feed source and its impact on the U.S. feed market, particularly the degree that DDGS substitute for corn and soybean meal in livestock/poultry diets and reduce ethanol’s impact on the feed market. This study develops a method to estimate the potential use of U.S. DDGS and its substitutability for corn and soybean meal in U.S. feed rations.
Related Websites
Oil Crops Outlook, http://usda.mannlib.cornell.edu/MannUsda/viewDocumentInfo.do?documentID=1288 WASDE, http://usda.mannlib.cornell.edu/MannUsda/viewDocumentInfo.do?documentID=1194 Oilseed Circular, http://www.fas.usda.gov/oilseeds_arc.asp Soybeans and Oil Crops Topic, http://www.ers.usda.gov/topics/crops/soybeans-oil-crops.aspx
E-mail Notification Readers of ERS outlook reports have two ways they can receive an e-mail notice about release of reports and associated data. • Receive timely notification (soon after the report is posted on the web) via USDA’s Economics, Statistics and Market Information System (which is housed at Cornell University’s Mann Library). Go to http://usda.mannlib.cornell.edu/Ma nnUsda/aboutEmailService.do and follow the instructions to receive e- mail notices about ERS, Agricultural Marketing Service, National Agricultural Statistics Service, and World Agricultural Outlook Board products. • Receive weekly notification (on Friday afternoon) via the ERS website. Go to http://www.ers.usda.gov/subscribe- to-ers-e-newsletters.aspx and follow the instructions to receive notices about ERS outlook reports, Amber Waves magazine, and other reports and data products on specific topics. ERS also offers RSS (really simple syndication) feeds for all ERS products. Go to http://www.ers.usda.gov/rss to get started.
The U.S. Department of Agriculture (USDA) prohibits discrimination in all its programs and activities on the basis of race, color, national origin, age, disability, and, where applicable, sex, marital status, familial status, parental status, religion, sexual orientation, genetic information, political beliefs, reprisal, or because all or a part of an individual’s income is derived from any public assistance program. (Not all prohibited bases apply to all programs.) Persons with disabilities who require alternative means for communication of program information (Braille, large print, audiotape, etc.) should contact USDA’s TARGET Center at (202) 720-2600 (voice and TDD). To file a complaint of discrimination write to USDA, Director, Office of Civil Rights, 1400 Independence Avenue, S.W., Washington, D.C. 20250-9410 or call (800) 795-3272 (voice) or (202) 720-6382 (TDD). USDA is an equal opportunity provider and employer.
7 Oil Crops Outlook/OCS-12l/December 12, 2012
Economic Research Service, USDA

8 Oil Crops Outlook/OCS-12l/December 12, 2012
Economic Research Service, USDA
Table 1--Soybeans: Annual U.S. supply and disappearanceYield
Year beginning Planted Harvested Beginning Crush Seed, feed EndingSeptember 1 stocks Production Imports Total & residual Exports Total stocks
Bu./acre --------------------------------------------------Million bushels--------------------------------------------------2010/11 77.4 76.6 43.5 151 3,329 14 3,495 1,648 130 1,501 3,280 215 2011/121 75.0 73.8 41.9 215 3,094 16 3,325 1,703 90 1,362 3,155 169 2012/132 77.2 75.7 39.3 169 2,971 20 3,160 1,570 115 1,345 3,030 130
Soybeans: Quarterly U.S. supply and disappearance
Beginning Crush, seed Endingstocks Production Imports Total & residual Exports Total stocks
2010/11 September-November 150.9 3,329.2 3.7 3,483.8 587.7 618.0 1,205.7 2,278.1 December-February 2,278.1 --- 4.9 2,283.0 481.2 553.0 1,034.2 1,248.8 March-May 1,248.8 --- 2.9 1,251.7 408.0 224.5 632.5 619.3 June-August 619.3 --- 2.9 622.2 301.3 105.8 407.2 215.0 Total 3,329.2 14.4 3,494.5 1,778.2 1,501.3 3,279.5
2011/12 September-November 215.0 3,093.5 2.8 3,311.4 516.6 424.9 941.5 2,369.9 December-February 2,369.9 --- 3.1 2,373.0 524.0 474.5 998.5 1,374.5 March-May 1,374.5 --- 5.3 1,379.8 453.9 258.5 712.4 667.5 June-August 667.5 --- 4.8 672.3 298.9 204.0 502.9 169.4 Total 3,093.5 16.1 3,324.7 1,793.4 1,361.8 3,155.3
1 Estimated. 2 Forecast. Sources: USDA, National Agricultural Statistics Service, Crop Production and Grain Stocks and U.S. Department of Commerce, U.S. Census Bureau,Foreign Trade Statistics.
Million acres
Area
Supply
Supply Use
Use

9 Oil Crops Outlook/OCS-12l/December 12, 2012
Economic Research Service, USDA
Table 2--Soybean meal: U.S. supply and disappearance
Year beginning Beginning Ending October 1 stocks Production Imports Total Domestic Exports Total stocks
2010/11 302 39,251 179 39,731 30,278 9,104 39,381 3502011/121 350 41,025 216 41,591 31,550 9,741 41,291 3002012/132 300 37,350 250 37,900 29,400 8,200 37,600 300
1 Estimated. 2 Forecast. Source: USDA, World Agricultural Outlook Board, World Agricultural Supply and Demand Estimates.
Disappearance
1,000 short tons
Supply

10 Oil Crops Outlook/OCS-12l/December 12, 2012
Economic Research Service, USDA
Table 3--Soybean oil: U.S. supply and disappearance
Year beginning Beginning Production Imports Total Exports Total Ending October 1 stocks Total Biodiesel Food stocks
2010/11 3,406 18,888 159 22,452 16,794 2,737 14,057 3,233 20,027 2,4252011/121 2,425 19,740 149 22,315 18,310 4,900 13,410 1,464 19,775 2,5402012/132 2,540 18,290 350 21,180 17,900 4,900 13,000 1,800 19,700 1,480
1 Estimated. 2 Forecast.Source: USDA, World Agricultural Outlook Board, World Agricultural Supply and Demand Estimates.
Million pounds
Supply DisappearanceDomestic
11 Oil Crops Outlook/OCS-12l/December 12, 2012
Economic Research Service, USDA
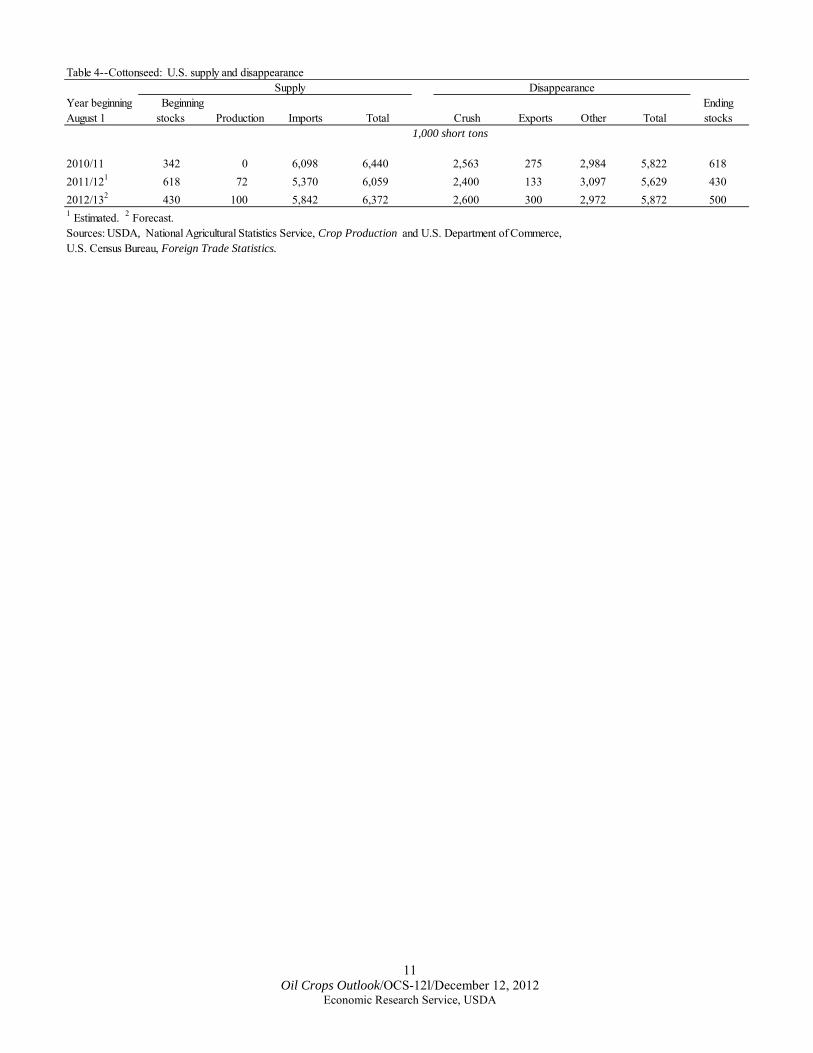
Table 4--Cottonseed: U.S. supply and disappearance
Year beginning Beginning Ending August 1 stocks Production Imports Total Crush Exports Other Total stocks
2010/11 342 0 6,098 6,440 2,563 275 2,984 5,822 6182011/121 618 72 5,370 6,059 2,400 133 3,097 5,629 4302012/132 430 100 5,842 6,372 2,600 300 2,972 5,872 5001 Estimated. 2 Forecast.Sources: USDA, National Agricultural Statistics Service, Crop Production and U.S. Department of Commerce,U.S. Census Bureau, Foreign Trade Statistics.
Disappearance Supply
1,000 short tons

12 Oil Crops Outlook/OCS-12l/December 12, 2012
Economic Research Service, USDA
Table 5--Cottonseed meal: U.S. supply and disappearance
Year beginning Beginning Ending October 1 stocks Production Imports Total Domestic Exports Total stocks
2010/11 54 1,163 0 1,217 1,080 93 1,172 452011/121 45 1,090 0 1,135 982 103 1,085 502012/132 50 1,170 0 1,220 1,085 85 1,170 501 Estimated. 2 Forecast.Source: USDA, Foreign Agricultural Service, PS&D Online.
Disappearance Supply
1,000 short tons

13 Oil Crops Outlook/OCS-12l/December 12, 2012
Economic Research Service, USDA
Table 6--Cottonseed oil: U.S. supply and disappearance
Year beginning Beginning Ending October 1 stocks Production Imports Total Domestic Exports Total stocks
2010/11 93 835 0 928 599 164 763 1652011/121 165 755 10 930 571 259 830 1002012/132 100 830 0 930 700 130 830 1001 Estimated. 2 Forecast.Source: USDA, Foreign Agricultural Service, PS&D Online.
Supply Disappearance
Million pounds

14 Oil Crops Outlook/OCS-12l/December 12, 2012
Economic Research Service, USDA
Table 7--Peanuts: U.S. supply and disappearanceYield
Year beginnin Planted Harvested Beginning Domestic Seed & Ending August 1 stocks Production Imports Total food Crush residual Exports Total stocks
Pounds/acre
2010/11 1,288 1,255 3,312 1,829 4,157 65 6,050 2,840 587 502 606 4,534 1,5162011/121 1,141 1,098 3,333 1,516 3,659 254 5,429 2,805 604 472 545 4,425 1,0032012/132 1,636 1,594 4,058 1,003 6,469 70 7,542 3,004 663 588 800 5,055 2,4871 Estimated. 2 Forecast.Sources: USDA, National Agricultural Statistics Service, Crop Production and Peanut Stocks and Processing, and U.S. Department of Commerce,U.S. Census Bureau, Foreign Trade Statistics.
Area
1,000 acres Million pounds
Supply Disappearance

15 Oil Crops Outlook/OCS-12l/December 12, 2012
Economic Research Service, USDA
Table 8--Oilseed prices received by U.S. farmersMarketing Soybeans2 Cottonseed3 Sunflowerseed2 Canola4 Peanuts3 Flaxseed4
year$/bushel $/short ton $/cwt. $/cwt. Cents/pound $/bushel
2001/02 4.38 90.50 9.62 8.77 23.40 4.292002/03 5.53 101.00 12.10 10.60 18.20 5.772003/04 7.34 117.00 12.10 10.60 19.30 5.882004/05 5.74 107.00 13.70 10.70 18.90 8.072005/06 5.66 96.00 12.10 9.62 17.30 5.942006/07 6.43 111.00 14.50 11.90 17.70 5.802007/08 10.10 162.00 21.70 18.30 20.50 13.002008/09 9.97 223.00 21.80 18.70 23.00 12.702009/10 9.59 158.00 15.10 16.20 21.70 8.152010/11 11.30 161.00 23.30 19.30 22.50 12.202011/12 12.50 260.00 29.10 24.00 31.80 13.902012/131 13.55-15.55 245-275 25.35-28.65 24.65-27.95 27.85-31.15 12.55-14.55
2011/12 September 12.20 245.00 32.50 23.10 23.50 13.60 October 11.80 245.00 29.60 22.80 28.90 13.90 November 11.70 268.00 29.00 23.30 33.20 13.90 December 11.50 264.00 29.60 23.00 30.80 13.50 January 11.90 281.00 28.90 23.40 33.70 13.70 February 12.20 276.00 29.50 24.80 32.90 13.20 March 13.00 NA 28.80 27.10 34.80 13.30 April 13.80 NA 28.40 27.80 35.10 14.10 May 14.00 NA 27.80 27.70 33.80 14.80 June 13.90 NA 27.20 27.40 34.40 12.90 July 15.40 NA 27.00 26.60 34.50 13.30 August 16.20 235.00 28.80 25.30 30.40 13.30
2012/13 September 14.30 254.00 28.80 27.00 35.20 13.30 October 14.20 257.00 25.90 26.60 33.80 13.50 November1 13.80 257.00 25.50 25.90 33.00 14.001 Preliminary. 2 September-August. 3August-July. 4 July-June.NA = Not available. cwt.=hundredweight.Source: USDA, National Agricultural Statistics Service, Agricultural Prices.

16 Oil Crops Outlook/OCS-12l/December 12, 2012
Economic Research Service, USDA
Table 9--U.S. vegetable oil and fats pricesMarketing Soybean Cottonseed Sunflowerseed Canola Peanut Corn Lard 6 Edible year oil 2 oil 3 oil 4 oil 4 oil 5 oil 6 tallow 6
2001/02 16.46 17.98 23.25 23.45 32.23 19.14 13.55 13.872002/03 22.04 37.75 33.13 29.75 46.70 28.17 18.13 17.802003/04 29.97 31.21 33.42 33.76 60.84 28.43 26.13 22.372004/05 23.01 28.01 43.71 30.78 53.63 27.86 21.80 18.482005/06 23.41 29.47 40.64 31.00 44.48 25.18 21.74 18.162006/07 31.02 35.70 58.03 40.57 52.99 31.80 28.43 27.322007/08 52.03 73.56 91.15 65.64 94.53 69.40 40.85 41.682008/09 32.16 37.10 50.24 39.54 78.49 32.75 26.72 25.472009/10 35.95 40.27 52.80 42.88 59.62 39.29 31.99 32.262010/11 53.20 54.50 86.12 58.68 77.24 60.76 51.52 51.342011/12 51.90 53.22 83.20 57.19 100.15 56.09 48.11 50.332012/131 49.0-53.0 51.0-55.0 75.0-79.0 58.0-62.0 99.0-103.0 54.5-58.5 56.0-60.0 41.0-45.0
2011/12October 51.73 51.56 92.50 56.81 97.00 54.24 61.10 52.09November 51.44 50.50 91.00 56.13 98.75 53.98 48.86 45.51December 50.17 51.10 91.00 55.40 96.10 53.36 48.71 50.78January 50.99 52.19 88.75 55.06 95.81 54.00 NA 51.10February 52.36 54.56 86.00 56.94 95.00 56.30 52.55 53.17March 53.43 55.95 82.00 59.10 96.60 59.31 54.60 52.24April 54.96 56.88 79.00 60.94 102.38 60.75 52.59 49.00May 50.69 52.00 80.00 55.88 106.13 58.05 54.82 55.48June 48.65 50.05 80.20 54.10 111.00 52.90 54.83 49.88July 51.96 53.75 78.00 57.44 110.00 54.76 53.00 49.13August 52.65 54.65 75.00 58.75 110.00 57.26 NA 48.36September 53.81 55.50 75.00 59.75 104.50 58.21 NA 47.19
2012/13October 49.31 51.31 74.00 57.50 103.00 54.75 51.60 42.27November1 46.27 49.05 70.30 58.20 99.90 51.93 57.00 37.151 Preliminary. 2 Decatur, IL. 3 PBSY Greenwood, MS. 4 Midwest. 5 Southeast mills. 6 Chicago.NA = Not available.Sources: USDA, Agricultural Marketing Service, Monthly Feedstuff Prices and Milling and Baking News.
Cents/pound
17 Oil Crops Outlook/OCS-12l/December 12, 2012
Economic Research Service, USDA
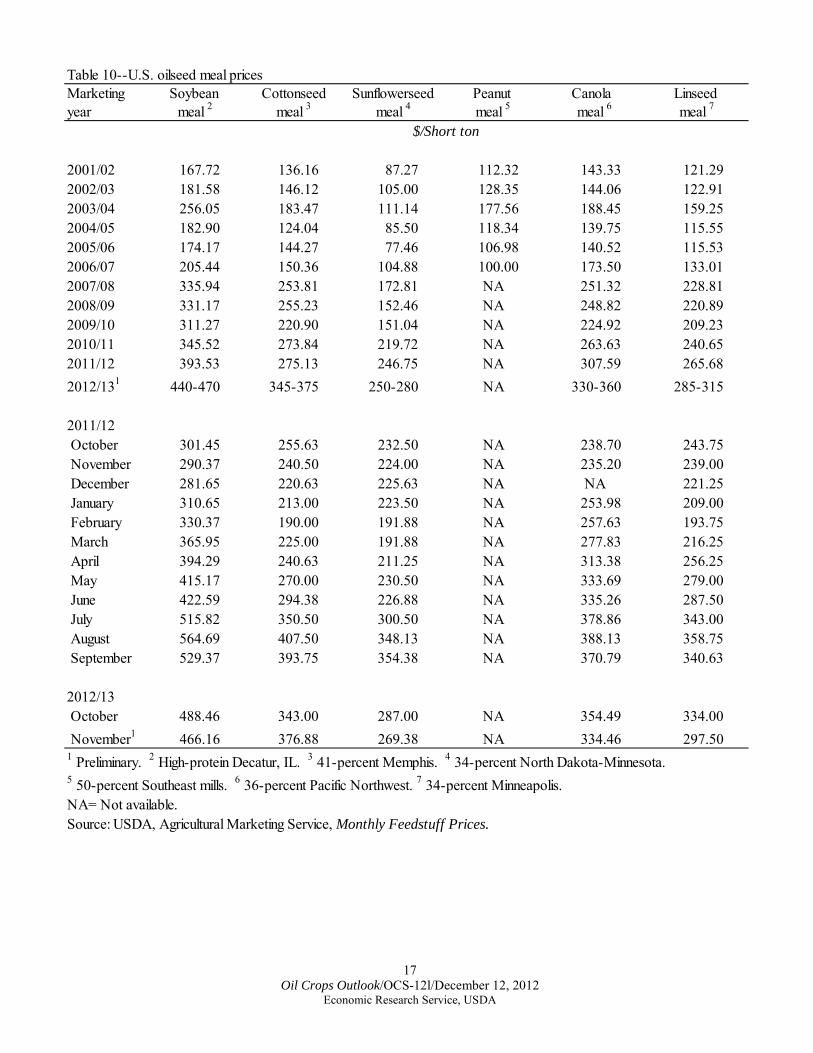
Table 10--U.S. oilseed meal prices Marketing Soybean Cottonseed Sunflowerseed Peanut Canola Linseed year meal 2 meal 3 meal 4 meal 5 meal 6 meal 7
2001/02 167.72 136.16 87.27 112.32 143.33 121.292002/03 181.58 146.12 105.00 128.35 144.06 122.912003/04 256.05 183.47 111.14 177.56 188.45 159.252004/05 182.90 124.04 85.50 118.34 139.75 115.552005/06 174.17 144.27 77.46 106.98 140.52 115.532006/07 205.44 150.36 104.88 100.00 173.50 133.012007/08 335.94 253.81 172.81 NA 251.32 228.812008/09 331.17 255.23 152.46 NA 248.82 220.892009/10 311.27 220.90 151.04 NA 224.92 209.232010/11 345.52 273.84 219.72 NA 263.63 240.652011/12 393.53 275.13 246.75 NA 307.59 265.682012/131 440-470 345-375 250-280 NA 330-360 285-315
2011/12 October 301.45 255.63 232.50 NA 238.70 243.75 November 290.37 240.50 224.00 NA 235.20 239.00 December 281.65 220.63 225.63 NA NA 221.25 January 310.65 213.00 223.50 NA 253.98 209.00 February 330.37 190.00 191.88 NA 257.63 193.75 March 365.95 225.00 191.88 NA 277.83 216.25 April 394.29 240.63 211.25 NA 313.38 256.25 May 415.17 270.00 230.50 NA 333.69 279.00 June 422.59 294.38 226.88 NA 335.26 287.50 July 515.82 350.50 300.50 NA 378.86 343.00 August 564.69 407.50 348.13 NA 388.13 358.75 September 529.37 393.75 354.38 NA 370.79 340.63
2012/13 October 488.46 343.00 287.00 NA 354.49 334.00 November1 466.16 376.88 269.38 NA 334.46 297.501 Preliminary. 2 High-protein Decatur, IL. 3 41-percent Memphis. 4 34-percent North Dakota-Minnesota.5 50-percent Southeast mills. 6 36-percent Pacific Northwest. 7 34-percent Minneapolis. NA= Not available.Source: USDA, Agricultural Marketing Service, Monthly Feedstuff Prices.
$/Short ton