OIL AND GAS UPSTREAM WASTE MANAGEMENT
125
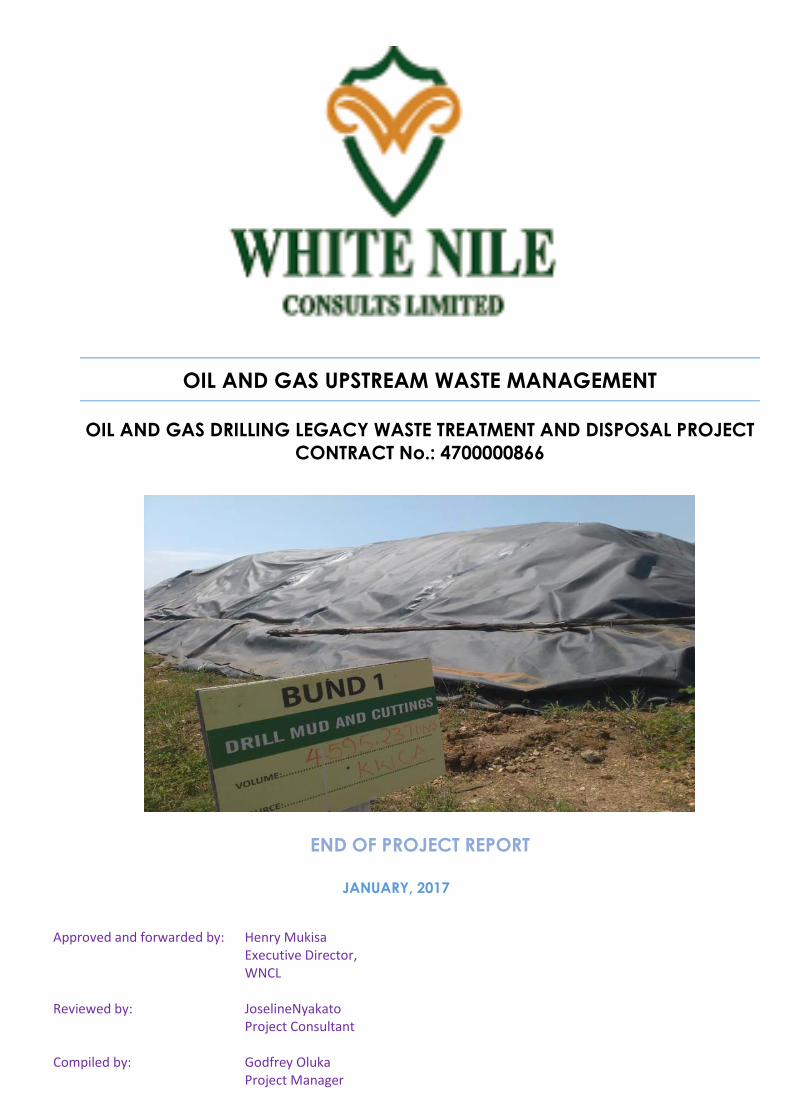
OIL AND GAS UPSTREAM WASTE MANAGEMENT OIL AND GAS DRILLING LEGACY WASTE TREATMENT AND DISPOSAL PROJECT CONTRACT No.: 4700000866 END OF PROJECT REPORT JANUARY, 2017 Approved and forwarded by: Henry Mukisa Executive Director, WNCL Reviewed by: JoselineNyakato Project Consultant Compiled by: Godfrey Oluka Project Manager
Transcript of OIL AND GAS UPSTREAM WASTE MANAGEMENT
OIL AND GAS UPSTREAM WASTE MANAGEMENT
OIL AND GAS DRILLING LEGACY WASTE TREATMENT AND DISPOSAL PROJECT
CONTRACT No.: 4700000866
END OF PROJECT REPORT
JANUARY, 2017
Approved and forwarded by: Henry Mukisa Executive Director, WNCL
Reviewed by: JoselineNyakato Project Consultant
Compiled by: Godfrey Oluka Project Manager

SOLID WASTE TREATMENT AND DISPOSAL REPORT, MAY-DECEMBER, 2016
END OF PROJECT REPORT SIGN-OFF
WNCL SIGN-OFF
Name:
Title:
Signed:
Date:
Name:
Title:
Signed:
Date:
Name:
Title:
Signed:
Date:

WASTE TREATMENT AND DISPOSAL END OF PROJECT REPORT,
JANUARY 2017
i
Executive Summary
This report presents an account of the Treatment and Disposal of Legacy
Drilling Waste Project which was implemented by White Nile Consults Limited
(WNCL{ XE "WNCL:White Nile Consults Limited" }) in partnership with TEDA
Landoo Oilfield Services Co. Ltd (TLOSCL), on behalf of Tullow Uganda
Operations Pty Ltd (TUOP{ XE "TUOP:Tullow Uganda Operations Pty Ltd" }),
under Contract Number 4700000866.
The overall aim of the project was to ensure environmentally proper, safe and
cost effective management of legacy drilling waste generated from the oil
and gas exploration activities undertaken by (TUOP). Meeting this aim
required the implementing parties (WNCL and TLOSCL) to safely evacuate
the drilling waste from the Waste Consolidation Area in Kisinja (KWCA),
transfer the waste to its treatment and disposal facility in Hohwa, and
undertake waste management activities aimed at changing the
characteristics of the waste from its hazardous nature to a non-hazardous
state so as to make it safer for disposal.
In implementing the project therefore, WNCL provided services and
undertook activities that entailed transportation of the waste and treatment
and disposal of the waste, while ensuring quality management and socio-
environmental protection through continuous monitoring of the waste
management facility and processes, and management of social and
environmental risks.
The waste transportation process was undertaken over a period of five
months (Sept 2015-Feb 2016), using appropriate leak-proof equipment to
move the liquid, solid and decommissioning waste from the KWCA to the
waste treatment and disposal facility in Hohwa. The transported waste
consisted of:
1,841m3 of liquid waste consisting of drilling fluids;
13,473 tons of solid waste consisting of rock cuttings; and
8,384tons of decommissioning waste consisting of concrete, rubble,
HDPE liners, sisal bags and other materials.
A record of the transported waste was made and kept both at the point of
removal in the KWCA and at the point of receipt in the treatment and
WASTE TREATMENT AND DISPOSAL END OF PROJECT REPORT,
JANUARY 2017
ii
disposal plant. The waste was received and contained in facilities that were
specially designed with required safeguards for safely containing the
respective streams of waste transported, thereby limiting the migration of the
waste materials and contaminants into the surrounding environment. The
liquid waste was contained in specially built pits while the drilling solid waste
was contained in specially constructed surface bunds where it was covered
with HDPE material so as to protect it from possible impact by weather
elements.
Treatment of the liquid waste was done by flocculation, with the aim of
reducing the amount of solid content in the fluids and obtaining clear liquid
with lower content of heavy metals, which would be safer for re-use in the
facility’s waste treatment operations. As a result of rains falling into the pits,
the quantity of liquid waste treated rose to a total of 1999.37m3and with the
addition of96m3of process water; the total quantity of liquid handled was
2095.37m3.
Of this quantity, 30% was separated as solid sediment, giving 628.5m3 of slurry
and 1466.759m3 of clear treated liquid which was all disposed of by re-use in
the drilling solid waste treatment process. The generated slurry was handled
as and was treated along with the other drilling solids.
Treatment of the drilling solids (rock cuttings and slurry) was done through two
methods namely i) bioremediation and ii) stabilization and solidification.
Similarly, disposal of the treated solid material was done through two routes
involving re-use for making bricks and landfilling in a sealing-type landfill.
Treatment by bioremediation involved the use of naturally occurring
microorganisms to remove organic and heavy-metal contaminants
contained in the solid waste.
A total of 5,403 tons of the solid waste was treated through bioremediation,
making up40.11 % of the total quantity of solid waste transported from waste
consolidation area. The bioremediation treatment process took 73 days
which included 13 days for blending the solid waste with manure and peat
soil; and 60 days of composting on the bio-platform. The bio-degradation
process produced 5,479.6 tons of compost of which 100tons were disposed of
byre-use and solidification in brick-making. In this process, the compost was
mixed with stone dust, cement, and sand in the ratio 3:2:1:1respectively, to
produce 2,060 bricks which were made over a period of 11 days. As guided
WASTE TREATMENT AND DISPOSAL END OF PROJECT REPORT,
JANUARY 2017
iii
by the regulators, as per the letter of no objection issued by NEMA on 10th
August 2016 in approving the waste treatment and disposal methodologies,
the bricks are to be used only within the facility.
Treatment of the solid waste by stabilization and solidification involved the
use of a binding agent in the form of portland cement to immobilize the
waste material and the contaminants it contained. A total of 14296.9 tons of
solid waste were treated by stabilization and solidification, including 8,917.8
tons that were not put through the bioremediation process and 5,379 tons of
compost that was bio-treated but was not used to make bricks. The solid
material that was treated by stabilization and solidification disposed of by
landfilling. The transition from treatment of the solids by bioremediation to
treatment by stabilization and solidification followed guidance from NEMA
and discussions and subsequent agreement with TUOP to hasten the waste
treatment and disposal process, since bio-treatment and disposal of the
product by brick-making would have taken a much longer period of time to
accomplish than the project time that was available.
The findings obtained from both external and internal laboratory analyses
conducted on both the treated liquid and solid waste materials revealed
significant changes in the physical, chemical and biological characteristics of
the waste, thereby generally indicating successful conversion of the originally
hazardous drilling waste into non-hazardous materials that were safe for
disposal.
To ensure strict observance of and compliance of the project with
requirements for environmental and social safeguards, an effective system
was put in place consisting of a complete set of policies, strategies, plans and
tools for assessing, managing and monitoring environmental and social risks
and impacts, and for monitoring the quality of the processes undertaken
during project implementation.
The cost of implementing the project was USD 5,395,793.38.The major
challenges faced during the project included initial low awareness of local
communities about the nature of the materials that were being handled and
the processes through which this was done, which fuelled fears; huge
demands for employment opportunities which overrode the company’s
capacity to provide job opportunities; stoppages due to suspension of
activities by the client; safety stand-downs imposed by the client and those
WASTE TREATMENT AND DISPOSAL END OF PROJECT REPORT,
JANUARY 2017
iv
caused by weather-related hindrances; and delays in issuance of work orders
by the client.
The opportunities and benefits created by the project for the population of
Uganda on the other hand included the provision of employment
opportunities, development of capacity for working in the oil and gas sector
and creation of awareness and appreciation among various stakeholders of
the fact that oil and gas production and associated activities can be
conducted very safely in the region, without necessarily endangering the
environment and people within the region and elsewhere in the country.
Thus with the successful conclusion of the waste treatment and disposal
activities on 22nd December 2016, the project was declared complete on
schedule, a head of the 31st December 2016 deadline.
WASTE TREATMENT AND DISPOSAL END OF PROJECT REPORT, JANUARY
2017
v
Contents Executive Summary .............................................................................................................................. i
Contents ............................................................................................................................................... v
List of Tables ....................................................................................................................................... viii
List of Figures ........................................................................................................................................ ix
List of Acronyms ................................................................................................................................... x
1.0 INTRODUCTION............................................................................................................................... 1
1.1 Background to the project ......................................................................................... 1
1.2 Aims of the Project ....................................................................................................... 2
1.2.1 Project Objectives.................................................................................................. 3
1.3 Project Milestones ........................................................................................................ 3
1.4 Project KPIs .................................................................................................................... 4
1.5 Project Timeline ............................................................................................................. 4
1.5.1 Project Work Plan ................................................................................................... 4
1.5.2 Key dates................................................................................................................. 4
1.5.3 Time lags .................................................................................................................. 5
1.6 Project Cost ................................................................................................................... 6
1.7 Project stakeholders ..................................................................................................... 6
1.8Project performance evaluation ................................................................................ 7
2.0WASTE HANDLING, TREATMENT AND DISPOSAL ............................................................................ 9
2.1 WASTE TRANSPORTATION ............................................................................................ 9
2.1.1 Activities undertaken during transportation: ..................................................... 9
2.1.2 Types and quantities of waste transported ..................................................... 10
2.1.3 Transportation timeframe ................................................................................... 10
2.1.4Equipment used for waste transportation ......................................................... 11
2.1.5 Reception and containment of the transported waste ................................ 11
2.1.6 Overall Outcomes from waste transportation activities ................................ 13
2.2 Evaluation and monitoring of TUOP legacy waste ............................................... 13
2.2.1 Testing and Monitoring Plan ............................................................................... 13

WASTE TREATMENT AND DISPOSAL END OF PROJECT REPORT, JANUARY
2017
vi
2.2.2 Analysis of the liquid waste ................................................................................. 14
2.2.3 Analysis of the solid waste .................................................................................. 16
2.3 WASTE TREATMENT AND DISPOSAL ........................................................................... 19
2.3.1 Treatment and Disposal of Decommissioning Waste ..................................... 20
2.3.2 Treatment and Disposal of the Drilling Fluids ................................................... 24
2.3.3Overalloutcomes from liquid waste treatment and disposal ........................ 37
2.3.3Treatment and Disposal of the Drilling Solid Waste ............................................. 38
2.3.3.1 Treatment of the drilling solid waste by Bioremediation ............................. 38
2.3.3.2Treatment of the drilling solid waste by stabilisation and solidification, and
disposal by landfilling .................................................................................................... 53
2.3.4Overalloutcomes from the solid waste treatment and disposal processes 76
2.3.5 Post waste treatment and disposal site restoration activities ....................... 76
3.0MONITORING AND MANAGEMENT OF ENVIRONMENTAL AND SOCIAL ASPECTS ................... 79
3.1 Environmental and Social Safeguards implemented during waste treatment
and disposal ...................................................................................................................... 79
3.2The Environment, Health and Safety (EHS) aspect of the project ....................... 79
3.2.1 EHS Strategies implemented during the project ............................................. 79
3.2.2 Record of incidents ............................................................................................. 82
3.1.2 Leading and lagging EHS indicators ................................................................. 84
3.2 The Social Performance of the project ................................................................... 87
3.2.1 Obligations under social performance ............................................................ 87
4.2.2 Meeting the social performance obligations .................................................. 87
3.2.3 Avenues used to ensure continuous community engagement and high
social performance during the project ..................................................................... 88
3.3 The Local Content Aspect of the project .............................................................. 90
3.3.1 Obligations under the local content aspect ................................................... 90
3.3.2Performance of the project in relation to labour requirements .................... 90
3.3.3Performance of the project in relation to the procurement of materials and
services............................................................................................................................ 93
3.3.4 Summary of data related to the local content aspect of the project ....... 94
WASTE TREATMENT AND DISPOSAL END OF PROJECT REPORT, JANUARY
2017
vii
3.4 Site monitoring aspect of project implementation .............................................. 95
3.4.1 Environmental and social monitoring ............................................................... 95
3.4.3 Process Monitoring and control ....................................................................... 102
3.4.4 Post treatment and disposal monitoring ........................................................ 104
3.5 Project Human Resources ....................................................................................... 104
3.5.1 Project Team ....................................................................................................... 104
3.6 Demobilisation .......................................................................................................... 104
4.0 CHALLENGES, LESSONS LEARNED AND CONCLUSIONS .......................................................... 106
4.1 Challenges and lessons learned ............................................................................ 106
4.1.1 Challenges .......................................................................................................... 106
4.1.2 Lessons learned and recommendations ........................................................ 108
4.2 Conclusions ............................................................................................................... 109
BIBLIOGRAPHY ................................................................................................................................. 111
APPENDICES ..................................................................................................................................... 112

WASTE TREATMENT AND DISPOSAL END OF PROJECT REPORT, JANUARY
2017
viii
List of Tables TABLE 1: PROJECT MILESTONES ......................................................................................................................................3
TABLE 2: KEY DATES IN THE IMPLEMENTATION OF THE PROJECT ...........................................................................................5
TABLE 3: LIST OF THE MAJOR STAKEHOLDERS IN THE PROJECT .............................................................................................7
TABLE 4: VOLUMES OF WASTE TRANSPORTED ................................................................................................................ 10
TABLE 5: WASTE TESTING AND SAMPLING PROGRAM ..................................................................................................... 14
TABLE 6: WASTE WATER CHARACTERISATION AS OF JANUARY 2016 ............................................................................... 15
TABLE 7: ANALYSIS OF SOLID WASTE IN TEMPORARY STORAGE AT WNCL-JAN 2016 ...................................................... 17
TABLE 8: ANALYSIS OF SOLID WASTE CONSOLIDATED AT KWCA .................................................................................... 18
TABLE 9: SUMMARY OF THE MAJOR CHANGES MADE TO THE WASTE TREATMENT AND DISPOSAL PROCESSES ....................... 20
TABLE 10: LIQUID WASTE TREATMENT AND DISPOSAL PROCESS STAGES AND ACTIVITY FRAMEWORK ................................... 25
TABLE 11: DAILY TREATMENT RECORDS ......................................................................................................................... 28
TABLE 12: FIELD BASED ANALYTICAL CHECKS ON TREATED WATER (PIT 2) ....................................................................... 29
TABLE 13: FIELD BASED ANALYTICAL CHECKS ON TREATED WATER (PIT 1) ....................................................................... 30
TABLE 14: TREATED WATER CHARACTERISATION BASED ON EXTERNAL TESTING RESULTS ..................................................... 31
TABLE 15: DAILY TREATED WATER RE-USE RECORDS ....................................................................................................... 33
TABLE 16: SOLIDS GENERATED DAILY DISPOSAL RECORDS .............................................................................................. 33
TABLE 17: BIOREMEDIATION PROCESS STAGES .............................................................................................................. 39
TABLE 18: FEED MATERIALS CONSUMPTION DURING TREATMENT ..................................................................................... 44
TABLE 19: DAILY MIXING/BIO-TREATMENT RECORDS ...................................................................................................... 46
TABLE 20: ANALYSIS RESULTS OF COMPOST BASED ON EXTERNAL LAB TESTS ..................................................................... 47
TABLE 21: DAILY FEED MATERIALS CONSUMPTION DURING COMPOST DISPOSAL .............................................................. 48
TABLE 22: DAILY COMPOST LANDFILLING AND BRICK MAKING RECORDS ........................................................................ 49
TABLE 23: PROCESS STAGES AND ACTIVITY FRAMEWORK ............................................................................................... 62
TABLE 24: DAILY SOLIDIFICATION/STABILISATION RECORDS ............................................................................................ 68
TABLE 25: LANDFILLED MATERIAL EXTERNAL LAB ANALYSIS .............................................................................................. 71
TABLE 26: DAILY LANDFILLING AND RECYCLABLE DISPOSAL RECORDS ............................................................................ 72
TABLE 27: RECORD OF INCIDENTS ................................................................................................................................ 85
TABLE 28: SUMMARY OF EHS STATISTICS ...................................................................................................................... 89
TABLE 29: LOCAL CONTENT MONITORING REPORT FOR THE PROJECT ............................................................................. 98
TABLE 30: WORK PLAN FOR EXTERNAL ENVIRONMENTAL AND SOCIAL MONITORING CONDUCTED BY KAM INTERNATIONAL
....................................................................................................................................................................... 101

WASTE TREATMENT AND DISPOSAL END OF PROJECT REPORT, JANUARY
2017
ix
List of Figures
FIGURE 1: WASTE DELIVERY AND CONTAINMENT AT THE TREATMENT AND DISPOSAL FACILITY ............................................ 12
FIGURE 2: TAP PROCESS DEVELOPMENT OBSERVATIONS FROM LABORATORY DE-WATERING EXPERIMENT .......................... 16
FIGURE 3: DECOMMISSIONING WASTE TREATMENT AND RE-USE PROCESS ........................................................................ 21
FIGURE 4: PICTORIAL OF THE TREATMENT AND DISPOSAL OF DECOMMISSIONING WASTE .................................................. 22
FIGURE 5: MAIN EQUIPMENT USED IN THE LIQUID WASTE TREATMENT AND DISPOSAL PROCESS ........................................... 26
FIGURE 6: CHEMICAL STORAGE ................................................................................................................................... 27
FIGURE 7: PICTORIAL OF THE LIQUID WASTE TREATMENT PROCESS ................................................................................... 34
FIGURE 8: CROSS SECTION THROUGH A SELF-CONTAINED BIO-PLATFORM ....................................................................... 42
FIGURE 9: MAIN EQUIPMENT USED IN IMPLEMENTING THE BIOREMEDIATION PROCESS ....................................................... 43
FIGURE 10: MANURE SUPPLY FARM LOCATIONS ............................................................................................................ 45
FIGURE 11: PICTORIAL OF THE BIOREMEDIATION TREATMENT PROCESS ............................................................................ 50
FIGURE 12: CROSS SECTION THROUGH WNCL SEALING TYPE LANDFILL .......................................................................... 56
FIGURE 13: PICTORIAL OF THE LANDFILL DESIGN AND CONSTRUCTION PROCESS .............................................................. 58
FIGURE 14: CONSTRUCTION OF THE LEACHATE COLLECTION CHAMBER AND INSPECTION CHAMBER ................................. 61
FIGURE 15: MAIN EQUIPMENT USED DURING STABILISATION/SOLIDIFICATION ................................................................... 63
FIGURE 16: DELIVERY OF CEMENT TO WNCL STORES .................................................................................................... 64
FIGURE 17: SAMPLE OF CEMENT ISSUING TALLY SHEETS USED DURING TREATMENT ............................................................ 65
FIGURE 18: SAMPLE OF WASTE TRANSFER TALLY SHEETS USED DURING TREATMENT ............................................................ 66
FIGURE 19: SAMPLE OF LANDFILL PH MONITORING REPORT USED ................................................................................... 69
FIGURE 20: SAMPLE OF LAND FILL MOISTURE CONTENT MONITORING REPORT USED ......................................................... 69
FIGURE 21: SAMPLE OF LAND FILL EC MONITORING REPORT USED .................................................................................. 70
FIGURE 22: DAILY RATE OF HARDENING IN THE LANDFILL ................................................................................................ 70
FIGURE 23: PICTORIAL OF THE STABILISATION/SOLIDIFICATION AND LANDFILLING PROCESS .............................................. 73
FIGURE 24: REPAIRING OF THE PERIMETER FENCE ........................................................................................................... 81
FIGURE 25: EHS TRAINING .......................................................................................................................................... 86
FIGURE 26: (LEFT) A STAND DOWN JOINTLY FACILITATED BY TUOP AND WNCL PERSONNEL TO ADDRESS MATTERS RELATED
TO HEALTH AND SAFETY DURING WORK. (RIGHT) AN OPERATIONS AND EHS MEETING BEING HELD WITH ALL STAFF ..... 87
FIGURE 27: COMMUNITY ENGAGEMENT THROUGH COMMUNITY MEETINGS .................................................................... 93
FIGURE 28: MAIN SOURCES OF LABOUR USED IN THE PROJECT ....................................................................................... 95
FIGURE 29: LABOUR DISTRIBUTION BY ROLE DURING TREATMENT ..................................................................................... 96
FIGURE 30: LABOUR DISTRIBUTION BY GENDER DURING WASTE TREATMENT AND DISPOSAL OPERATIONS ............................. 96
FIGURE 31: SOURCES OF MATERIALS USED DURING PROJECT IMPLEMENTATION ............................................................... 97
FIGURE 32: REGULATORY AND COMPLIANCE MONITORING OF THE FACILITY AND PROCESSES ........................................ 102

WASTE TREATMENT AND DISPOSAL END OF PROJECT REPORT, JANUARY
2017
x
FIGURE 33: MONITORING OF THE FACILITY AND OPERATIONS BY TUOP ........................................................................ 103
FIGURE 34: EXPERIMENTS CONDUCTED IN THE INTERNAL LAB TO MONITOR AND GUIDE CONTROL OF WASTE TREATMENT
ACTIVITIES ......................................................................................................................................................... 106
FIGURE 35: WNCL LAB PERSONNEL TAKING SOIL SAMPLES FROM AREAS AROUND THE FACILITY ..................................... 107
FIGURE 36: PROJECT STAFFING STRUCTURE ................................................................................................................. 109
List of Acronyms
Acronym Meaning
BOD Biological Oxygen Demand
COD Chemical Oxygen Demand
CSR Corporate Social Responsibility
DWRM Directorate of Water Resources Management
EC Electrical Conductivity
EHS Environment, Health and Safety
EIA Environment Impact Assessment
EMMP Environment Management and Monitoring Plans
ESIA Environment and Social Impact Assessment
KPI Key Performance Indicator
KWCA
WCA
Kisinja Waste Consolidation Area
Waste Consolidation Area
GNL Global Network Limited
NEMA National Environment Management Authority
NPA National Planning Authority
PEPD Petroleum Exploration and Production Department
PPE Personal Protective Equipment
QEHS Quality, Environment, Health and Safety
SOCA Safety Observations and Corrective Actions
SS
(S/S)
Stabilisation-Solidification
WASTE TREATMENT AND DISPOSAL END OF PROJECT REPORT, JANUARY
2017
xi
TLOSCL TEDA Landoo Oilfield Services Co. Ltd
TUOP Tullow Uganda Operations Pty Limited
UK WAC United Kingdom Waste Acceptance Criteria
WNCL White Nile Company Limited

WASTE TREATMENT AND DISPOSAL END OF PROJECT REPORT,
JANUARY 2017
1
1.0 INTRODUCTION
This report presents an overview of the oil and gas drilling waste treatment
and disposal project implemented by White Nile Consults Ltd (WNCL) and
TEDA Landoo Oilfield Services Co. Ltd (TLOSCL) on behalf of Tullow Uganda
Operations Pty Ltd (TUOP). The report commences with background
information which provides brief facts that are essential to understanding the
project, before detailing the activities, processes and technologies which
were applied in delivering on the general service areas of the handling;
transportation; treatment and disposal of the legacy waste; and monitoring
of the site and its activities, as well as the management of associated
environmental and social risks throughout the life of the project. The report
majorly provides a factual account of the activities that were undertaken in
implementing the project, with only brief and basic descriptions of the
scientific and theoretical bases. The detailed descriptions and analyses of the
scientific and theoretical bases underlying the processes that were
implemented were presented in respective Technical Action Plans which
were submitted to and approved by both TUOP and regulators (NEMA). It is
therefore recommended the report is read alongside and with reference to
the appended Technical Action Plans (Appendix R- Item 1).
1.1 Background to the project White Nile Consults Limited is a legitimate local company which to maintains
a keen focus on valuing the customer, observing statutory requirements of
laws and regulations, and offering systematic waste management solutions
that match the waste management hierarchy.
WNCL owns a 159-acre piece of land in Hohwa village, Kaseeta Sub County,
Hoima district. Of this, 11 acres were approved by NEMA for the construction
a drilling waste treatment and disposal facility. The company is thus validly
licensed to own and operate a drilling waste management facility under
License No.: WD/HW/036/2016 (and earlier WD/HW/074/2015).
The facility provides services to oil companies with regard to treatment,
recovery and disposal of drilling mud, drilling cuttings, drilling waste water,
and other oil field drilling waste.

WASTE TREATMENT AND DISPOSAL END OF PROJECT REPORT,
JANUARY 2017
2
The facility is capable of adopting different technologies and equipment in
suit the handling of a given quantity and type of drilling waste, of both
hazardous and non-hazardous nature. The facility’s primary focus is on
prioritizing the recovery of resources from what would be waste and their
subsequent re-use and recycling, thereby considering disposal only as a last
resort.
In the context of the facility’s operations, drilling waste treatment refers to
changing the physical and chemical characteristics of drilling waste to make
it non-hazardous or decreasing the quantity of generated harmful waste or
decreasing or eliminating the hazardous substances. Drilling waste disposal
on the other hand refers to the laying of the drilling waste in a place that
meets internationally recognized requirements of environmental protection.
The objective of treatment and disposal technology is to minimize the harm
of drilling waste to human health and environment.
WNCL entered into a partnership with TLOSCL to go through a competitive
bidding process through a contract was acquired to undertake a project to
treat and dispose of legacy waste generated from oil and gas exploration
drilling activities conducted by TUOP in Block EA-2 South. In this partnership,
WNCL was the lead project implementer, while TLOSCL supported
technology transfer to WNCL by providing and installing equipment for the
treatment of the fluids, and- based on their vast experience and expertise in
the oil and gas sector, training the local (Ugandan) WNCL personnel to
operate the equipment and conduct waste treatment activities.
The treatment and disposal of all of the said waste has been successfully
completed through processes that are detailed in the second section of this
report.
1.2 Aims of the Project The overall aim of the project was to ensure the cost effective, efficiency and
timely management of legacy oil and gas drilling waste in a manner that
prevented or controlled risk to natural and social systems.
WASTE TREATMENT AND DISPOSAL END OF PROJECT REPORT,
JANUARY 2017
3
1.2.1 Project Objectives
The objectives of the project were to:
i) Remove and safely transport all drilling waste from the WCA in Kisinjato
the waste treatment and disposal facility in Hohwa.
ii) Treat and dispose of 100% of the received waste by 31st December
2016.
All of the project objectives have been met. A full account of the ways in
which the project objectives were achieved is presented in the “Waste
Handling, Treatment and Disposal” section of the report.
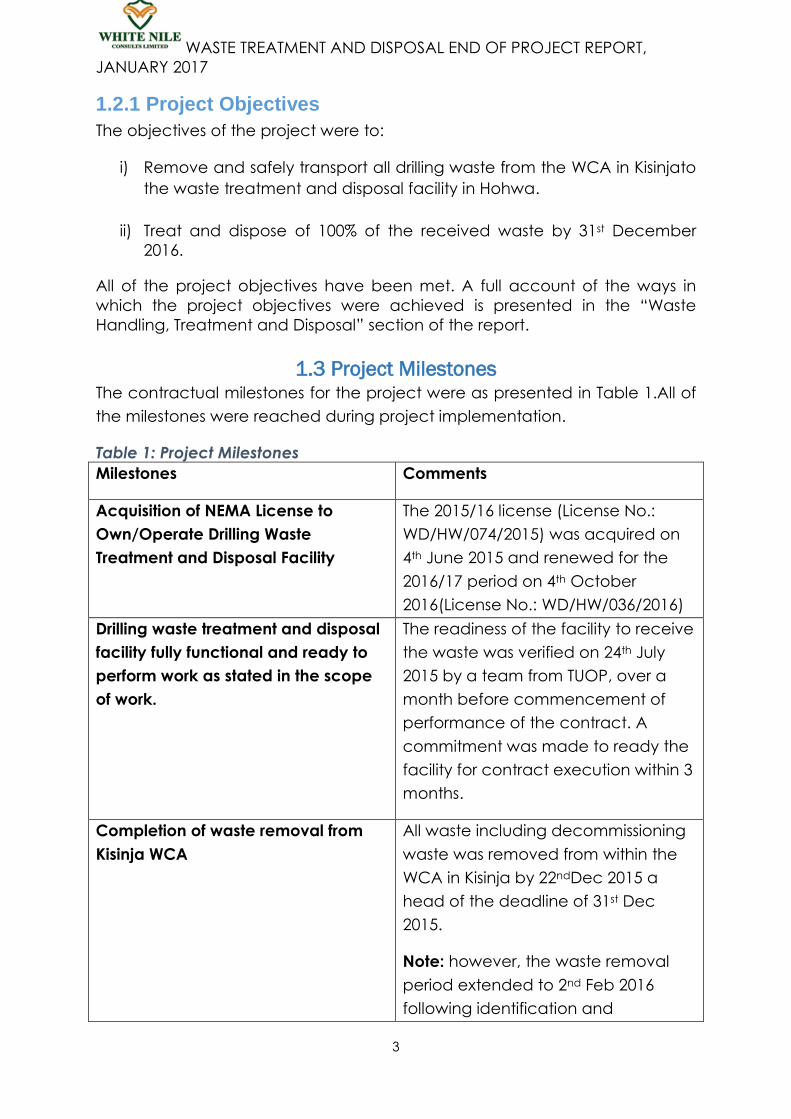
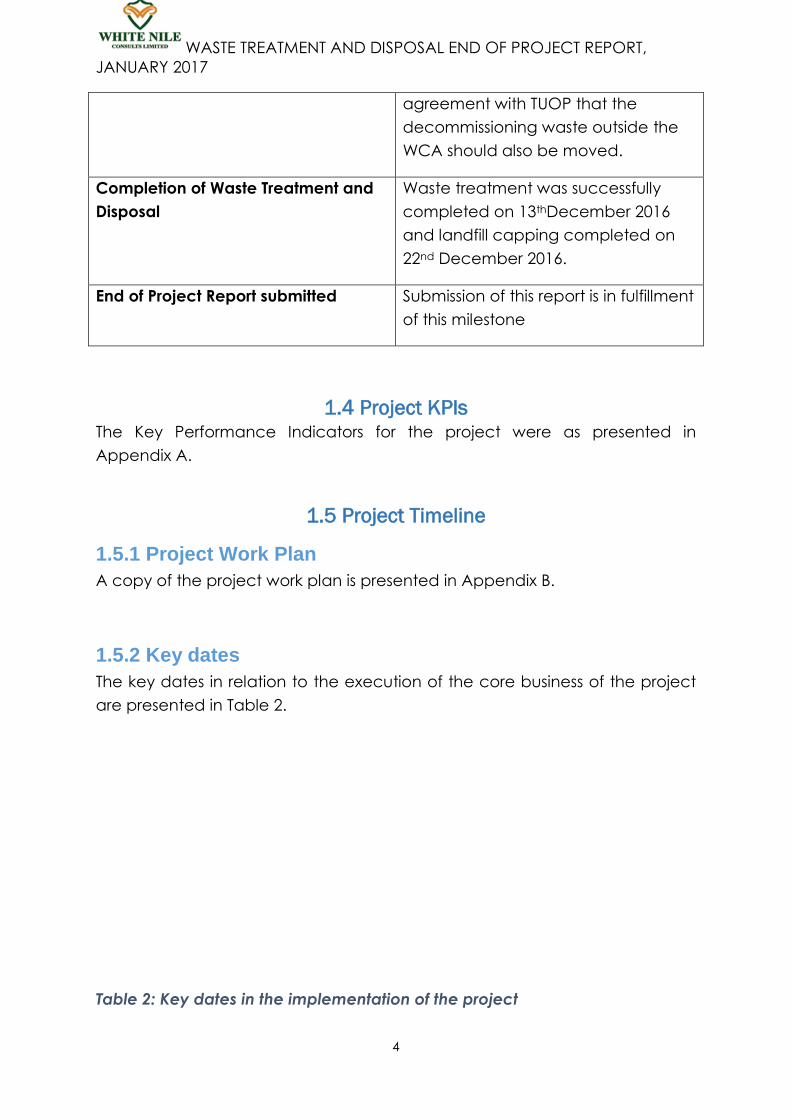
1.3 Project Milestones The contractual milestones for the project were as presented in Table 1.All of
the milestones were reached during project implementation.
Table 1: Project Milestones
Milestones Comments
Acquisition of NEMA License to
Own/Operate Drilling Waste
Treatment and Disposal Facility
The 2015/16 license (License No.:
WD/HW/074/2015) was acquired on
4th June 2015 and renewed for the
2016/17 period on 4th October
2016(License No.: WD/HW/036/2016)
Drilling waste treatment and disposal
facility fully functional and ready to
perform work as stated in the scope
of work.
The readiness of the facility to receive
the waste was verified on 24th July
2015 by a team from TUOP, over a
month before commencement of
performance of the contract. A
commitment was made to ready the
facility for contract execution within 3
months.
Completion of waste removal from
Kisinja WCA
All waste including decommissioning
waste was removed from within the
WCA in Kisinja by 22ndDec 2015 a
head of the deadline of 31st Dec
2015.
Note: however, the waste removal
period extended to 2nd Feb 2016
following identification and
WASTE TREATMENT AND DISPOSAL END OF PROJECT REPORT,
JANUARY 2017
4
agreement with TUOP that the
decommissioning waste outside the
WCA should also be moved.
Completion of Waste Treatment and
Disposal
Waste treatment was successfully
completed on 13thDecember 2016
and landfill capping completed on
22nd December 2016.
End of Project Report submitted Submission of this report is in fulfillment
of this milestone
1.4 Project KPIs The Key Performance Indicators for the project were as presented in
Appendix A.
1.5 Project Timeline
1.5.1 Project Work Plan
A copy of the project work plan is presented in Appendix B.
1.5.2 Key dates
The key dates in relation to the execution of the core business of the project
are presented in Table 2.
Table 2: Key dates in the implementation of the project

WASTE TREATMENT AND DISPOSAL END OF PROJECT REPORT,
JANUARY 2017
5
Activity Start date End date
Waste Transportation 19thSeptember 2015 2ndFebruary 2016
Treatment of liquid waste 15th August 2016 2nd September 2016
Disposal of treated liquid
(re-use in treatment of the
solids )
4th September 2016
8th September 2016
Treatment of solid waste
1. Treatment by
bioremediation
2. Treatment by
stabilization-
solidification
4th September 2016
15th November 2016
17th November 2016
22nd December 2016
Disposal of treated solids
1. Disposal of
stabilized-solidified
solids by landfilling
2. Disposal of bio-
treated solids by
reuse to make
bricks
15th November 2016
4th December 2016
10th December 2016
16th December 2016
1.5.3 Time lags
A number of lags in project time were recorded, which led to delays in the
execution of project activities. These were mainly caused by:
i) Suspension of the project imposed by the client over the period
between 3rd June 2016 and 14th July 2016, as detailed in section 4.0
of this report on “Challenges, Lessons Learned and Conclusions”.
ii) Safety stand-downs
Two safety stand-downs were recorded during the transportation phase of
the project, the first one occurring as result of an incident caused a third
party (another contractor of TUOP’s) which prompted TUOP to halt WNCL’s
operations as well for the period between 17th and 23rd November 2015; and
the second stand-down occurring in the period between 15th and 17th
November 2015 as a result of occurrence of a spill on the site following heavy
rains.

WASTE TREATMENT AND DISPOSAL END OF PROJECT REPORT,
JANUARY 2017
6
iii) Hindrances created by weather conditions.
These were halts to work that were recorded during transportation and
treatment and disposal activities which occurred in the rainy seasons dueto a
weather related spill in October –November 2015, and difficulties imposed on
the mobility of equipment in and around the waste treatment areas of the
facility in October –November 2016.
1.6 Project Cost The cost of implementing the project was as presented in the summary
below:
Work stream Expenditure (USD)
Mobilisation and demobilisation 128,400.00
Transportation of waste 1,327,731.18
Waste treatment and disposal 3, 939,662.20
Total 5,395,793.38
The detailed project cost report is laid out in Appendix C.
1.7 Project stakeholders The major stakeholders for the project were as listed in Table 3.
WASTE TREATMENT AND DISPOSAL END OF PROJECT REPORT,
JANUARY 2017
7
Table 3: List of the major stakeholders in the project
Party Role
WNCL and TLOSCL Project implementers
TUOP Client (project originator)
monitoring
Local communities Project affected party
beneficiaries
NEMA Lead agency; Licenser; Regulator
PEPD Lead agency
Hoima District Local Government
(district authorities, Sub County
authorities, Local Council 1 authorities)
Lead agency; regulators
Contractors Commodity and service providers
Pollution control committee Assessments for licensing; monitoring
Ministerial committee on environment
and natural resources (consisting of
various agencies under the Ministry of
Water and Environment )
monitoring
UWA Monitoring for potential impact on the
game reserve located near the waste
management facility
1.8Project performance evaluation With a view to ensuring that to ensuring that project efforts delivered the
required outcomes and met the performance standards and to facilitate
improvement in the contract, the project was evaluated through two
contract performance reviews conducted by TUOP on 8th June 2016 and 2nd
November 2016. These mainly focused on the performance of the project in
the technical and operational; EHS; commercial; Local Content; compliance;
and social performance aspects. Copies of the contract performance review
reports are contained in Appendix R (Item 2).

WASTE TREATMENT AND DISPOSAL END OF PROJECT REPORT,
JANUARY 2017
8
Continual evaluation of the project was also done based on a Performance
Improvement Plan (PIP) that was developed following the suspension of the
project (see Appendix R- Item 3). The performance of the project in relation
to the PIP was evaluated on a monthly basis.
WASTE TREATMENT AND DISPOSAL END OF PROJECT REPORT,
JANUARY 2017
9
2.0WASTE HANDLING, TREATMENT AND DISPOSAL
2.1 WASTE TRANSPORTATION The first area of service provided by WNCL was the handling and
transportation of solid and liquid waste from TUOP WCA in Kisinja, to the
treatment and disposal facility in Hohwa.
In compliance with the regulatory requirement for the drilling waste to be
transported by a separate NEMA-licensed entity, the aspect of transferring
the waste from the TUOP’s waste consolidation area to WNCL’s facility was
subcontracted to Global Networks Limited (GNL), a transport and logistics
company which was licensed by NEMA to transport hazardous materials.
Details of the transportation processes and rates are presented in the End of
Transportation report attached in Appendix R (Item 4).
2.1.1 Activities undertaken during transportation:
The activities undertaken during the waste transportation phase of the
project were:
a) Removal of solid and liquid waste from the bunds and pits in which
they were stored at Kisinja. This involved uncovering the pits to remove
the waste from the pits using specialized equipment and uncovering
and removal of the waste contained in the bunds.
b) Movement of the waste from the waste consolidation area to the
treatment and disposal facility in Hohwa. The waste was loaded onto
specialized equipment which was used to transfer the liquid and solid
waste from the consolidation areas to the waste treatment and
disposal site.
c) Decommissioning of waste pits and bunds through the removal of all
unnatural materials from the pits after all the waste had been removed
and transported to the treatment and disposal facility.
d) Removal of decommissioning waste from decommissioned waste pits
and Social Investment activities by TUOP in the Kaiso-Tonya area. The
decommissioning waste was transferred from the consolidation areas
for treatment and disposal at WNCL’s facility in Hohwa.
WASTE TREATMENT AND DISPOSAL END OF PROJECT REPORT,
JANUARY 2017
10
All these activities were accomplished safely, without any spillage, accidents
or other kind of incidents.
2.1.2 Types and quantities of waste transported
The types of waste moved during the transportation phase of the project
comprised of 3 categories of materials, namely
(i) drilling fluids from Water Based Mud;
(ii) solids/rock cuttings mixed with Water Based Mud; and
(iii) decommissioning waste consisting of concrete, rubble, HDPE, sisal
bags, among other materials.
In compliance with regulatory and contractual requirements, the quantities
of waste handled were recorded and reported using a type of Waste Transfer
Notes that was agreed upon between WNCL and TUOP, and both at the
point of removal from the WCA and at the point of receipt at the treatment
and disposal facility. The total volumes of waste that were transported from
the WCAs to the treatment and disposal site were recorded as indicated in
Table 4.
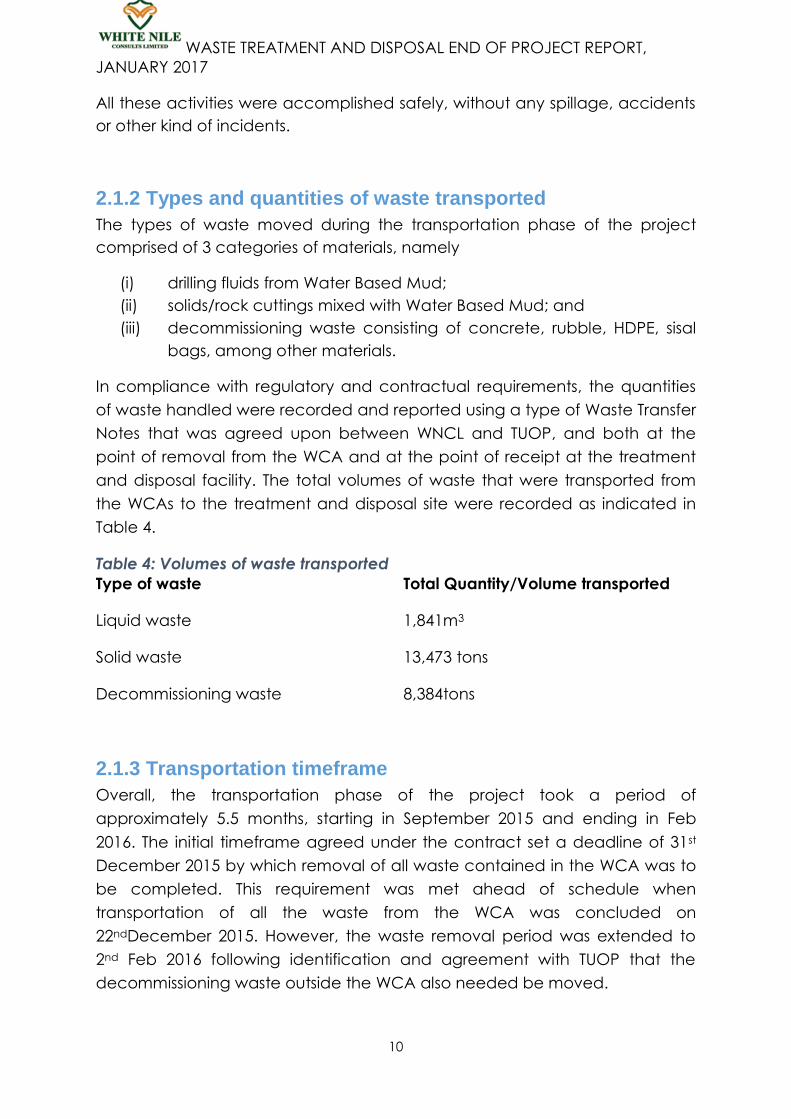
Table 4: Volumes of waste transported
Type of waste Total Quantity/Volume transported
Liquid waste 1,841m3
Solid waste 13,473 tons
Decommissioning waste 8,384tons
2.1.3 Transportation timeframe
Overall, the transportation phase of the project took a period of
approximately 5.5 months, starting in September 2015 and ending in Feb
2016. The initial timeframe agreed under the contract set a deadline of 31st
December 2015 by which removal of all waste contained in the WCA was to
be completed. This requirement was met ahead of schedule when
transportation of all the waste from the WCA was concluded on
22ndDecember 2015. However, the waste removal period was extended to
2nd Feb 2016 following identification and agreement with TUOP that the
decommissioning waste outside the WCA also needed be moved.
WASTE TREATMENT AND DISPOSAL END OF PROJECT REPORT,
JANUARY 2017
11
Transportation of liquid waste was completed within 1 month(13th Nov -20th
Dec 2015), while the transportation of solid waste was done over a period of
3 months (19th Sept- 16th Dec 2015), while decommissioning waste was
transported over a period of 1.5 months (17th December 2015 – 2nd Feb 2016).
Refer to the “End of Transportation Report” in Appendix R (Item 4) for the
transportation rates.
2.1.4Equipment used for waste transportation
Drilling fluids
Liquid waste was removed from the pits in Kisinja, transported, delivered and
offloaded into pits in WNCL’s facility using vacuum trucks. 2 vacuum trucks
were used, each with a capacity of 30m³.
Solids
The solid waste, which comprised of drilling mud and cuttings and
decommissioning waste, was delivered using leak proof dumper trucks with
modified tail gates. 11 dumping trucks were deployed, each with a capacity
20 metric tons. However, as a safeguard, each truck was loaded with only
16metric tons of waste per trip.
The other equipment used included 2 excavators, 140-metric ton mobile
weighbridge, 1 sludge pump, 2 escort pickups equipped with mobile spill
response equipment, and 1 service van.
The key human resources used during the waste transportation process
included: 1 EHS supervisor, 1 Site Fleet In-charge, 11 drivers, 8 casual
labourers, 2 security personnel, and 1 Site Mechanic among others.
2.1.5 Reception and containment of the transported waste
Upon arrival at the waste treatment and disposal facility, the
quantities/volumes of waste received were determined and recorded before
the waste was offloaded for containment in pits and bunds. The liquid waste
was received and contained in two double lined open pits which were built
with concrete that had HDPE liner beneath, with capacity to hold (1,035m3)
each. The pits were both barricaded with reptile fences.
The solid waste was received and contained in facilities comprising of two
above-ground, bunds and one concrete pit. The bunds were built out of
earth placed on a layer ofdouble liner containing HDPE membranes (1.00mm

WASTE TREATMENT AND DISPOSAL END OF PROJECT REPORT,
JANUARY 2017
12
thick). The solid waste that was contained on the bunds was covered with
HDPE membranes so as to prevent its exposure to adverse environmental
conditions and/or minimise potential risks to human health, environment,
safety, and property. The areas around both the pit and the bunds were well
contained with a drainage system leading and ending in to a retention pit.
During the 8 months for which the waste was contained at the facility, both
the liquid and solid waste materials were regularly sampled and monitored to
assess for any changes in the physical, chemical and biological
characteristics of the waste that could have occurred with time, as a result of
exposure to prevailing environmental conditions namely direct sunshine,
heavy rains, strong winds and temperature. These conditions could cause
turbulent mixing of the liquid waste or various spontaneous biochemical
reactions in the solid waste, and could thereby alter the properties of the
respective waste streams.
The characteristics of the liquid waste were periodically monitored against
the National Environment (Standards for Discharge of Effluent into Water or
on Land) Regulations (1999) as required in the scope of work, while that of
the solid waste was monitored against the UK, Waste Acceptance Criteria
(UK WAC) and Uganda’s standards and regulations (1999).
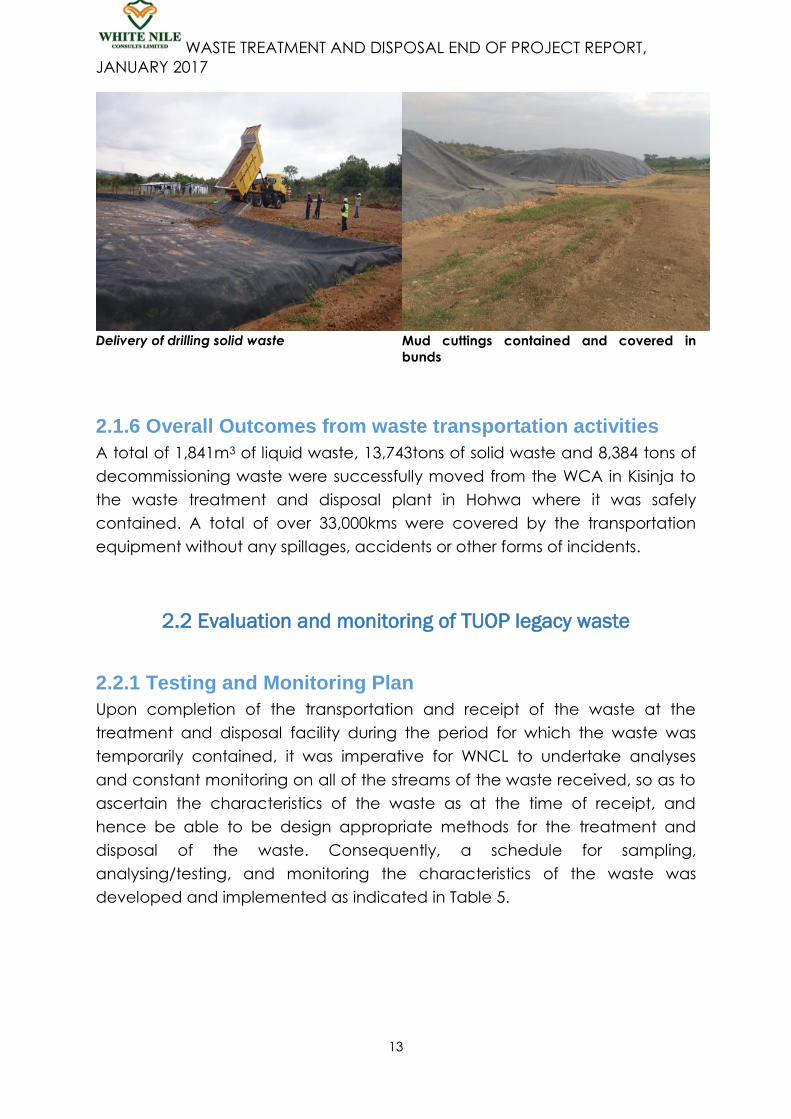
Figure 1: Waste delivery and containment at the treatment and disposal
facility
Liquid Waste delivery Waste water contained in HDPE lined open
pits
WASTE TREATMENT AND DISPOSAL END OF PROJECT REPORT,
JANUARY 2017
13
Delivery of drilling solid waste
Mud cuttings contained and covered in
bunds
2.1.6 Overall Outcomes from waste transportation activities
A total of 1,841m3 of liquid waste, 13,743tons of solid waste and 8,384 tons of
decommissioning waste were successfully moved from the WCA in Kisinja to
the waste treatment and disposal plant in Hohwa where it was safely
contained. A total of over 33,000kms were covered by the transportation
equipment without any spillages, accidents or other forms of incidents.
2.2 Evaluation and monitoring of TUOP legacy waste
2.2.1 Testing and Monitoring Plan
Upon completion of the transportation and receipt of the waste at the
treatment and disposal facility during the period for which the waste was
temporarily contained, it was imperative for WNCL to undertake analyses
and constant monitoring on all of the streams of the waste received, so as to
ascertain the characteristics of the waste as at the time of receipt, and
hence be able to be design appropriate methods for the treatment and
disposal of the waste. Consequently, a schedule for sampling,
analysing/testing, and monitoring the characteristics of the waste was
developed and implemented as indicated in Table 5.

WASTE TREATMENT AND DISPOSAL END OF PROJECT REPORT,
JANUARY 2017
14
Table 5: Waste Testing and sampling program
S/N ANALYSIS
FRAMEWORK QUALITY CHECKS DONE STATUS REMARKS
Liq
uid
wa
ste
Pre-treatment
Waste water was analysed prior to
treatment, for all contaminant levels
as required by the regulator and the
client. Initial concentrations were
established and characterisation of
waste water was made.
CLOSED
Waste water
characterisation guided
treatment process
During treatment
At this point ,physical parameters such
as pH, color ,turbidity and chemical
characteristic such as Chlorides were
monitored
CLOSED
Determination of
physical properties
guided the chemical
dosing rates
Post Treatment
After treatment, the sample was taken
to external lab for analysis and
parameters for effluent discharge as
per NEMA scope of work were
analysed.
CLOSED
Post treatment analysis
ascertained readiness of
waste water for
discharge/re-use
So
lid
wa
ste
Pre-treatment
Solid waste was analysed prior to
treatment while at KCWA and also
upon delivery to WNCL facility, for all
contaminant levels as required by the
regulator and the client. Initial
concentrations were determined.
CLOSED
Solid waste
characterisation guided
treatment and disposal
processes
During treatment
Physical parameters were monitored
which included PH, EC, Temperature,
and moisture content
(bioremediation) and EC, MC, and
pH(Solidification/stabilisation)on a
daily basis
CLOSED
Monitoring and
troubleshooting guided
the treatment and
disposal processes
Post Treatment
Treated samples were submitted to
an external laboratory for analysis and
parameters for disposal as per NEMA
scope of work and UK WAC were
analysed and compared to these
standards
CLOSED
Post treatment analysis
ascertained readiness of
treated waste for
disposal
2.2.2 Analysis of the liquid waste
An initial analysis of the liquid waste was conducted and the parameters of
concern identified as: Zn, SO42-
, Cd, COD, BOD, and Benzene. These
parameters were identified as parameters of concern because the
laboratory tests indicated their concentrations to be above the limits as
prescribed by national regulations. The findings were as indicated in Table 6.

WASTE TREATMENT AND DISPOSAL END OF PROJECT REPORT,
JANUARY 2017
15
Table 6: Waste water characterisation as of January 2016
S/N PARAMETERS UNIT NEMA STATUS PIT 1 STATUS PIT 2 STATUS
ORGANIC CONSTITUENTS ANALYSIS
1 1,1,1,trichloroethane mg/l 3 TESTED 1.22 PASSED 1 PASSED
2 1,1,2 trichloroethane mg/l 0.2 TESTED trace PASSED trace PASSED
3 1,1,2,trichloroethene mg/l 1.06 TESTED trace PASSED trace PASSED
4 1,3 dichloropropene mg/l 0.2 TESTED trace PASSED trace PASSED
5 Benzene mg/l 0.2 TESTED 2.33 Fail
6 Dichloromethane mg/l 0.2 TESTED 0.11 PASSED 0.09 PASSED
7 Tetrachloroethylene mg/l 0.1 TESTED trace PASSED trace PASSED
8 Tetrachloro
methane mg/l 0.02 TESTED trace PASSED trace PASSED
9 Trichloro ethylene mg/l 0.3 TESTED trace PASSED trace PASSED
10 1,2-Dichloroethane mg/l 0.04 TESTED trace PASSED trace PASSED
INORGANIC CONSTITUENTS ANALYSIS
1 Lead mg/l 0.1 TESTED 0 PASSED 0 PASSED
2 Aluminium mg/l 0.5 TESTED 0 PASSED 0 PASSED
3 SulpHate mg/l 500 TESTED 312.5 PASSED 564.2 Fail
4 Arsenic mg/l 0.2 TESTED 0.012 PASSED 0.03 PASSED
5 Cadmium mg/l 0.1 TESTED 0.04 PASSED 0.15 Fail
6 Iron mg/l 10 TESTED 12.9 Fail 8.1 PASSED
7 Silver mg/l 0.5 TESTED 0.08 PASSED 0.16 PASSED
8 Zinc mg/l 5 TESTED 45.6 Fail 22.3 Fail
9 Chromium (total) mg/l 1 TESTED 0.34 PASSED 0.52 PASSED
10 Nitrogen total mg/l 10 TESTED 113 Fail 102.5 Fail
PHYSICAL PROPERTIES
1 pH mg/l 6.0-
8.0 TESTED 9.5 Fail 9 Fail
2 BOD 5 mg/l 50 TESTED 396 Fail 512 Fail
3 COD mg/l 100 TESTED 1900 Fail 2100 Fail
4 TSS mg/l 100 TESTED 0.62 Pass 3.65 PASSED
5 E. Conductivity µScm-
1
- TESTED 12000 -
16000 -
These findings guided the design of the drilling fluids treatment and disposal
methods and processes, which focused on a de-watering based process and
re-use respectively, as laid out in the Technical Action Plan (TAP) presented
on Appendix R (Item 1).
Comments: The parameters that did not meet the discharge standards were considered
contaminants of concern.

WASTE TREATMENT AND DISPOSAL END OF PROJECT REPORT,
JANUARY 2017
16
Figure 2: TAP process development observations from laboratory de-watering
experiment
2.2.3 Analysis of the solid waste
Laboratory analyses were done on the solid waste material to assess the
physical/chemical characteristics of the waste in order to obtain a guiding
basis for the selection of the most effective and efficient treatment and
disposal technology to be used (See Table 7: analysis of TUOP solid waste
from WNC containments in relation to waste consolidated at KWCA in Table
8)
WASTE TREATMENT AND DISPOSAL END OF PROJECT REPORT,
JANUARY 2017
17
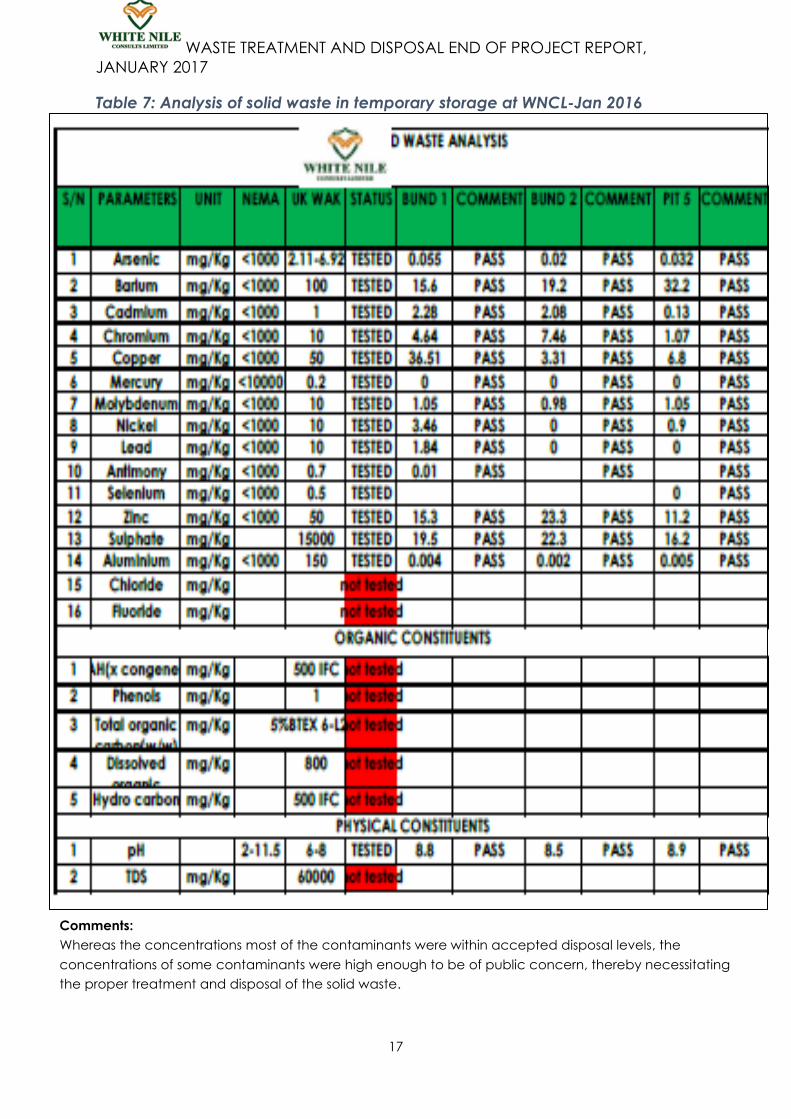
Table 7: Analysis of solid waste in temporary storage at WNCL-Jan 2016
Comments:
Whereas the concentrations most of the contaminants were within accepted disposal levels, the
concentrations of some contaminants were high enough to be of public concern, thereby necessitating
the proper treatment and disposal of the solid waste.

WASTE TREATMENT AND DISPOSAL END OF PROJECT REPORT,
JANUARY 2017
18
Table 8: Analysis of solid waste consolidated at KWCA
WASTE TREATMENT AND DISPOSAL END OF PROJECT REPORT,
JANUARY 2017
19
2.3 WASTE TREATMENT AND DISPOSAL The processes that were implemented in treating and disposing of the drilling
fluids and solid waste streams were all based on technical action plans,
which detailed the methods that were used, and that were approved by
both TUOP and NEMA prior to implementation. The methods that were
adopted ensured that the waste was all treated and disposed of in ways that
complied with TUOP’s policies and existing local and international regulatory
requirements. Where changes to the methods or constituent processes were
made, proper steps were taken to ensure the proper management of the
change processes, as presented in the Management of Change Forms which
are attached to this report as Appendix N.
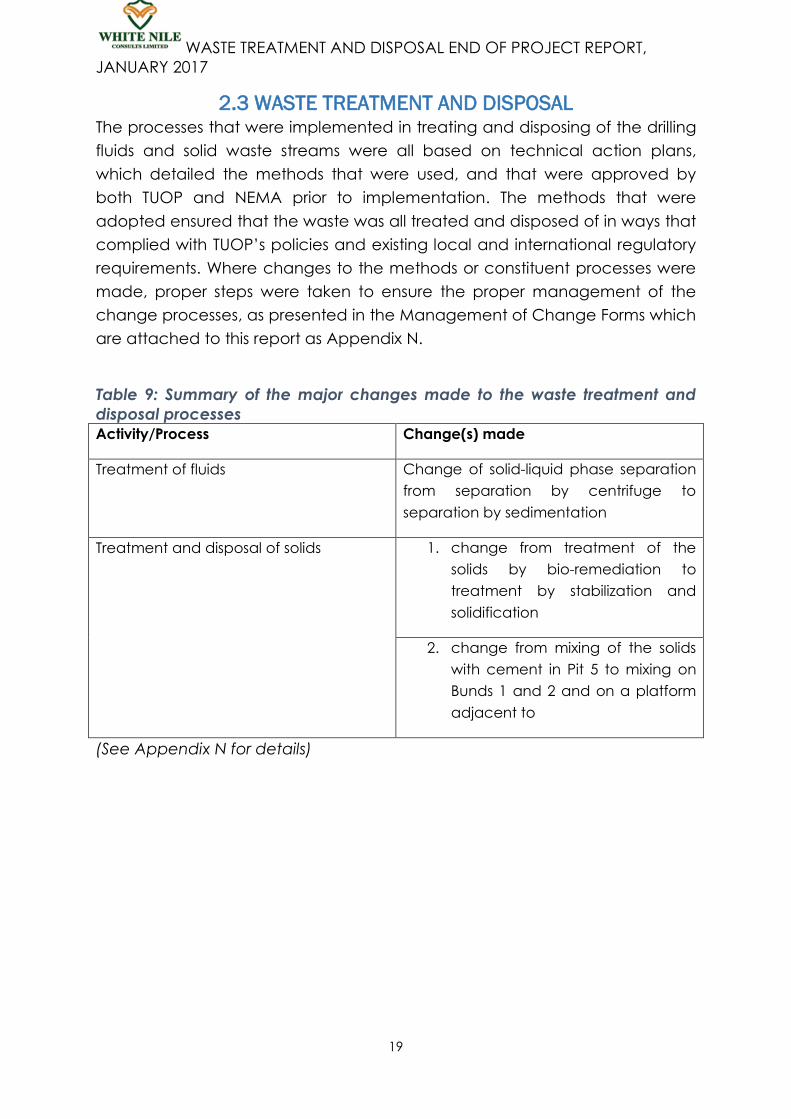
Table 9: Summary of the major changes made to the waste treatment and
disposal processes
Activity/Process Change(s) made
Treatment of fluids Change of solid-liquid phase separation
from separation by centrifuge to
separation by sedimentation
Treatment and disposal of solids 1. change from treatment of the
solids by bio-remediation to
treatment by stabilization and
solidification
2. change from mixing of the solids
with cement in Pit 5 to mixing on
Bunds 1 and 2 and on a platform
adjacent to
(See Appendix N for details)
WASTE TREATMENT AND DISPOSAL END OF PROJECT REPORT,
JANUARY 2017
20
2.3.1 Treatment and Disposal of Decommissioning Waste
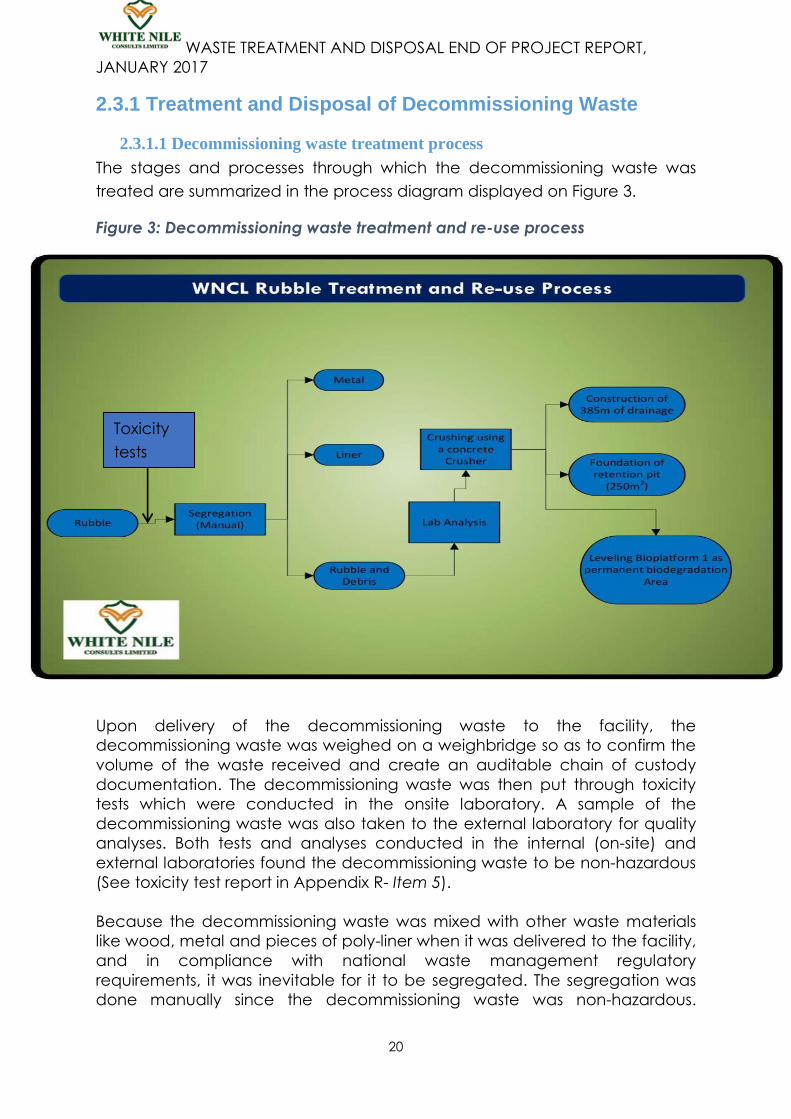
2.3.1.1 Decommissioning waste treatment process
The stages and processes through which the decommissioning waste was
treated are summarized in the process diagram displayed on Figure 3.
Figure 3: Decommissioning waste treatment and re-use process
Upon delivery of the decommissioning waste to the facility, the
decommissioning waste was weighed on a weighbridge so as to confirm the
volume of the waste received and create an auditable chain of custody
documentation. The decommissioning waste was then put through toxicity
tests which were conducted in the onsite laboratory. A sample of the
decommissioning waste was also taken to the external laboratory for quality
analyses. Both tests and analyses conducted in the internal (on-site) and
external laboratories found the decommissioning waste to be non-hazardous
(See toxicity test report in Appendix R- Item 5).
Because the decommissioning waste was mixed with other waste materials
like wood, metal and pieces of poly-liner when it was delivered to the facility,
and in compliance with national waste management regulatory
requirements, it was inevitable for it to be segregated. The segregation was
done manually since the decommissioning waste was non-hazardous.
Toxicity
tests
WASTE TREATMENT AND DISPOSAL END OF PROJECT REPORT,
JANUARY 2017
21
Appropriate and adequate PPE was provided to all persons who were
involved in the segregation.
2.3.1.2 Disposal of decommissioning waste by re-use
Given that the decommissioning waste was non-hazardous and based on
the waste management hierarchy, a decision was made to re-use all of the
decommissioning waste within the facility. The decommissioning waste was
thus re-used in the following ways:
Reuse in the construction of the foundation of the Bio-platform and retention
pit
A portion of the segregated decommissioning waste was used to fill and level
a foundation pad to an approximate height 1.6 metres, to provide a firm
base for the bio-platform that was used to contain solid waste during
biodegradation. This would ordinarily have required over 10,000tons of
murram to backfill and level. The decommissioning waste was picked with the
aid of an excavator and then crushed and compacted using a roller. A thin
layer (1.5mm) of murram was then applied to create a smooth surface for the
Bio-platform. In A similar way, a portion of the decommissioning waste was
used in the construction of the foundation of the storm water retention pit.
Reuse in the construction of drainage channels
The other portion of the segregated decommissioning waste was crushed
using a pneumatic hammer to create stone dust. Using a mixer, the stone
dust was mixed with stone aggregates and cement in ratios of 3:4:1
respectively, to make concrete that was used in the construction of drainage
channels in the facility.
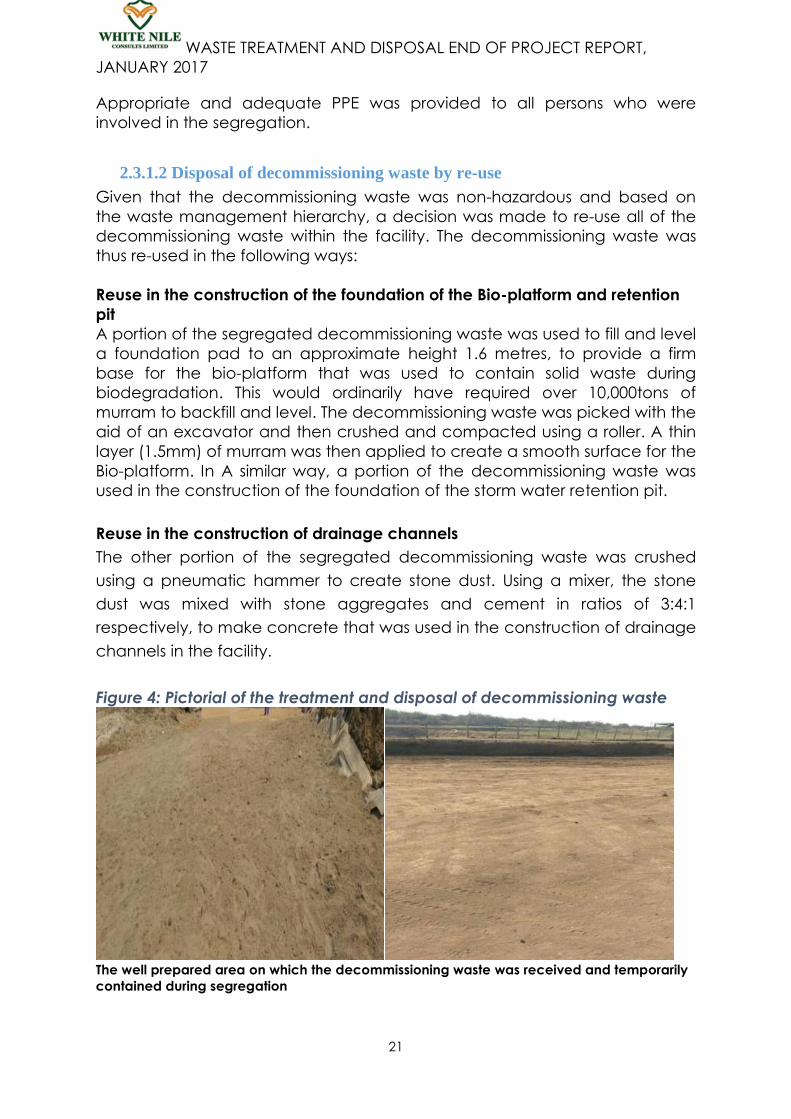
Figure 4: Pictorial of the treatment and disposal of decommissioning waste
The well prepared area on which the decommissioning waste was received and temporarily
contained during segregation

WASTE TREATMENT AND DISPOSAL END OF PROJECT REPORT,
JANUARY 2017
22
Segregation of the decommissioning waste prior to disposal by re-use
Decommissioning waste being moved for re-use in the bioremediation area
Decommissioning waste re-used in leveling the bio-remediation platform and in the retention
pit

WASTE TREATMENT AND DISPOSAL END OF PROJECT REPORT,
JANUARY 2017
23
Drainage channels constructed out of re-used decommissioningwaste
2.3.1.3 Overall outcomes from the treatment and disposal of decommissioning
waste
8,384 tons of decommissioning waste were successfully segregated and
safely re-used within the facility.
The re-use of the decommissioning waste in the construction of the bio-
platform, retention pit and drainage channels in the facility significantly
reduced the facility’s demand for murram and sand, which thereby reduced
the need to extract these resources from the environment, hence
contributing to the minimisation of the alteration and possible degradation of
the natural environment from the creation or expansion of borrow areas and
sand mines.
WASTE TREATMENT AND DISPOSAL END OF PROJECT REPORT,
JANUARY 2017
24
2.3.2 Treatment and Disposal of the Drilling Fluids
2.3.2.1 Liquid waste treatment process
The stages and processes through which the liquid waste was treated are
summarized in Table 10.
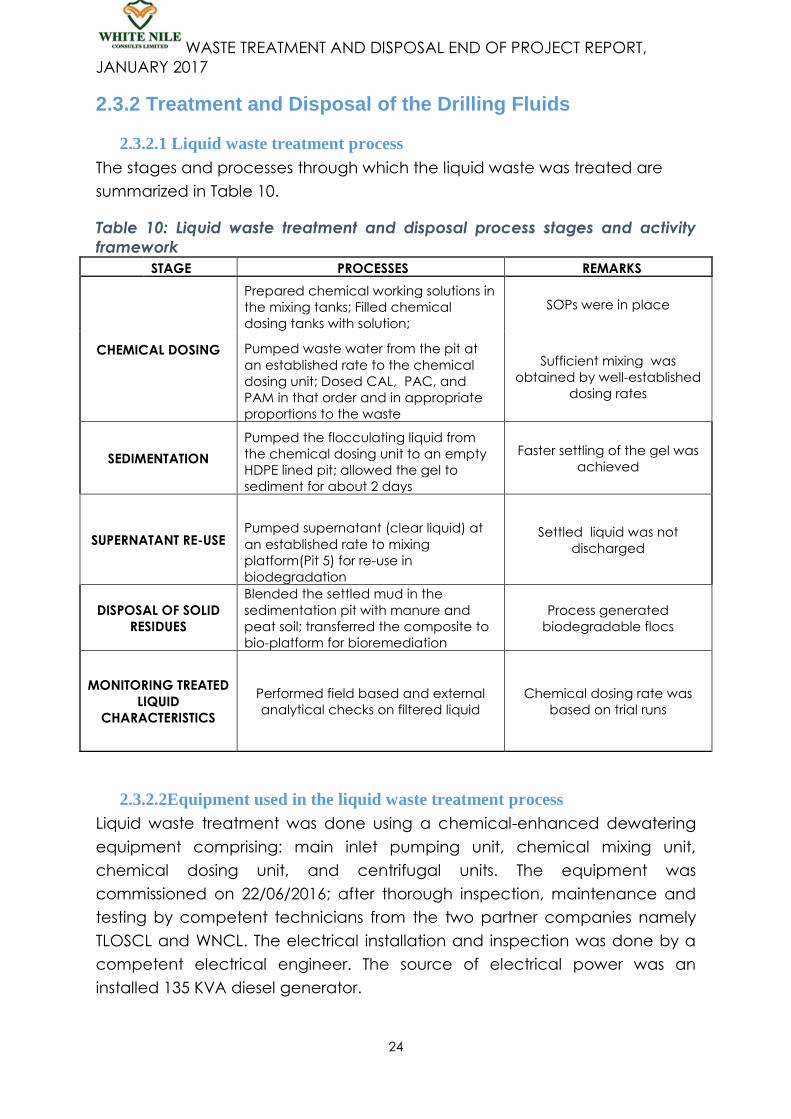
Table 10: Liquid waste treatment and disposal process stages and activity
framework
STAGE PROCESSES REMARKS
CHEMICAL DOSING
Prepared chemical working solutions in
the mixing tanks; Filled chemical
dosing tanks with solution;
SOPs were in place
Pumped waste water from the pit at
an established rate to the chemical
dosing unit; Dosed CAL, PAC, and
PAM in that order and in appropriate
proportions to the waste
Sufficient mixing was
obtained by well-established
dosing rates
SEDIMENTATION
Pumped the flocculating liquid from
the chemical dosing unit to an empty
HDPE lined pit; allowed the gel to
sediment for about 2 days
Faster settling of the gel was
achieved
SUPERNATANT RE-USE Pumped supernatant (clear liquid) at
an established rate to mixing
platform(Pit 5) for re-use in
biodegradation
Settled liquid was not
discharged
DISPOSAL OF SOLID
RESIDUES
Blended the settled mud in the
sedimentation pit with manure and
peat soil; transferred the composite to
bio-platform for bioremediation
Process generated
biodegradable flocs
MONITORING TREATED
LIQUID
CHARACTERISTICS
Performed field based and external
analytical checks on filtered liquid
Chemical dosing rate was
based on trial runs
2.3.2.2Equipment used in the liquid waste treatment process
Liquid waste treatment was done using a chemical-enhanced dewatering
equipment comprising: main inlet pumping unit, chemical mixing unit,
chemical dosing unit, and centrifugal units. The equipment was
commissioned on 22/06/2016; after thorough inspection, maintenance and
testing by competent technicians from the two partner companies namely
TLOSCL and WNCL. The electrical installation and inspection was done by a
competent electrical engineer. The source of electrical power was an
installed 135 KVA diesel generator.
WASTE TREATMENT AND DISPOSAL END OF PROJECT REPORT,
JANUARY 2017
25
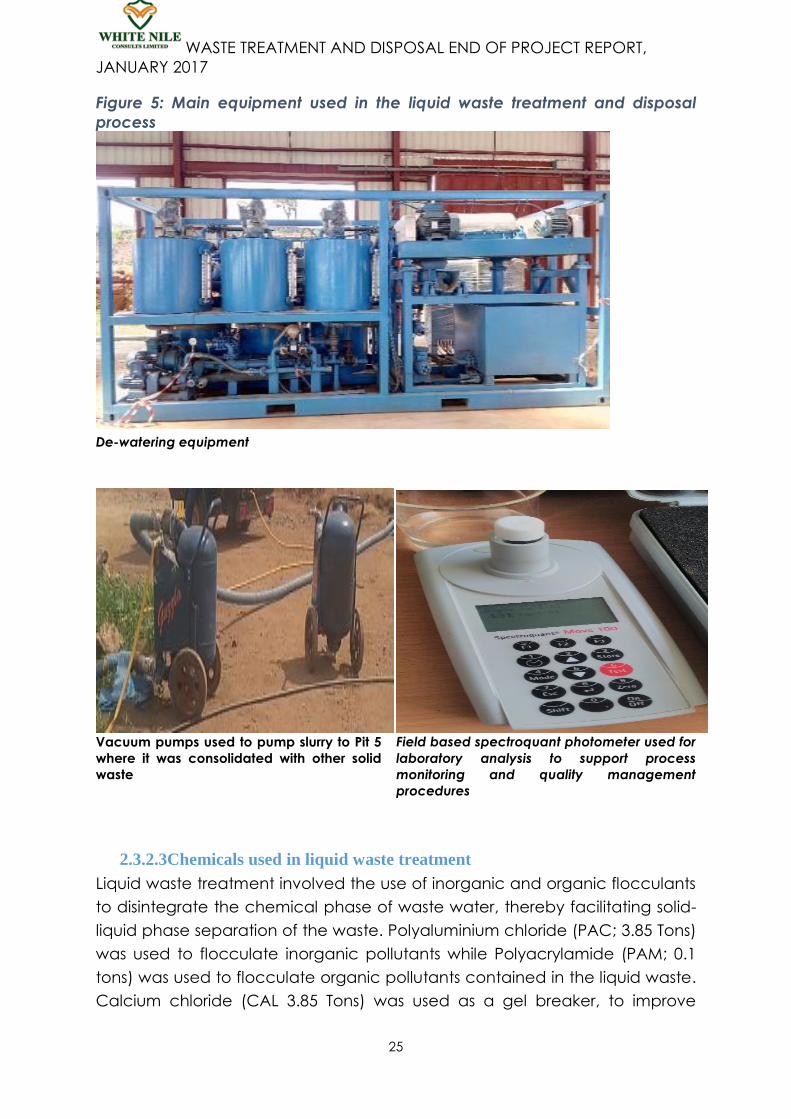
Figure 5: Main equipment used in the liquid waste treatment and disposal
process
De-watering equipment
Vacuum pumps used to pump slurry to Pit 5
where it was consolidated with other solid
waste
Field based spectroquant photometer used for
laboratory analysis to support process
monitoring and quality management
procedures
2.3.2.3Chemicals used in liquid waste treatment
Liquid waste treatment involved the use of inorganic and organic flocculants
to disintegrate the chemical phase of waste water, thereby facilitating solid-
liquid phase separation of the waste. Polyaluminium chloride (PAC; 3.85 Tons)
was used to flocculate inorganic pollutants while Polyacrylamide (PAM; 0.1
tons) was used to flocculate organic pollutants contained in the liquid waste.
Calcium chloride (CAL 3.85 Tons) was used as a gel breaker, to improve
WASTE TREATMENT AND DISPOSAL END OF PROJECT REPORT,
JANUARY 2017
26
solubility of chemicals. Chemical working solutions (96m3) were prepared in
the chemical mixing tanks in the dewatering unit using rain water (free from
chemical impurities), before being dosed into the liquid waste. Pit 4 was used
partly as a rain water reservoir pit before the water was pumped into a tank
(10m3) that was installed on a raised platform with a gentle slope so as to
provide a gravitational flow of water to the chemical mixing tanks. 10% w/v
PAC, 10% w/v CAL, and 0.5% w/v PAM working solutions were prepared
during treatment.
The choice of the chemicals (flocculants and gel breaker used) was directly
based on the characteristics of TUOP liquid waste as found from the initial
laboratory analysis which were conducted upon receipt of the waste at the
WNCL facility.
The decision to use an inorganic flocculant [PolyaluminiumChloride; general
formula: AlnCl(3n-m)(OH)m] was based on the fact that the liquid waste
contained ions of inorganic elements (Cu, Cr, Mn, Ag, Ni, Fe, Zn, and As)
whose salts and hydroxides required to be precipitated by ion exchange for
which PAC found to be very effective. The use of organic flocculant (PAM)
was necessitated by the presence of trace organic compounds
(1,1,1trichloroethane; trichloroethane; tetrachloroethane; 1,1,2
trichloromethane; 1,3 dichloromethane; 1,3 dichloropropene; 1,2
dichloroethane; 1,4 dichloroethane; BTEX; and PAHs), which required to be
flocculated by steric hindrance for which PAM was found to be very
effective.
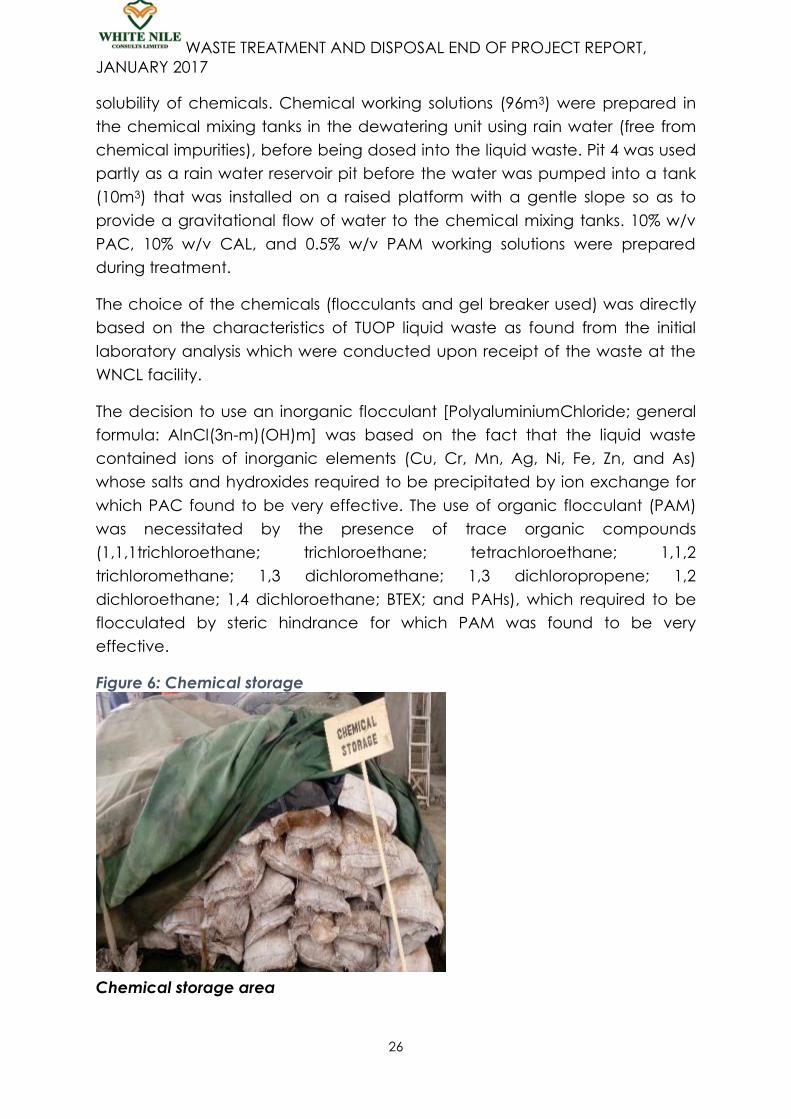
Figure 6: Chemical storage
Chemical storage area
WASTE TREATMENT AND DISPOSAL END OF PROJECT REPORT,
JANUARY 2017
27
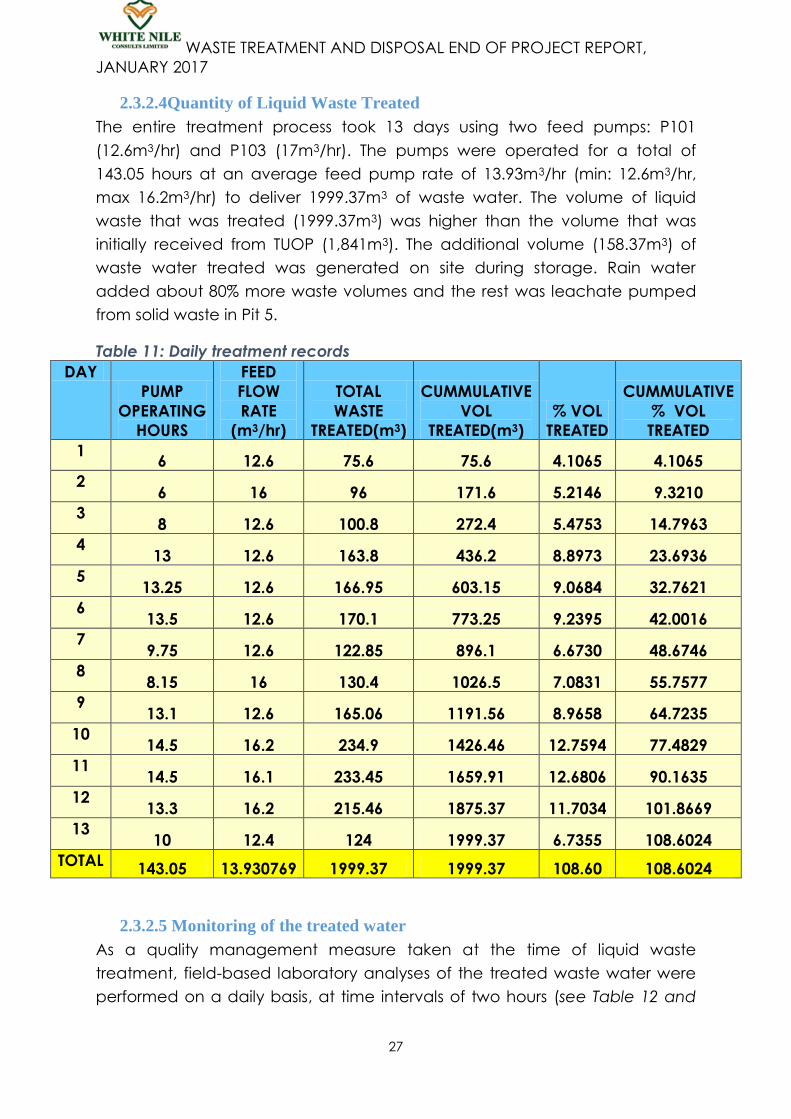
2.3.2.4Quantity of Liquid Waste Treated
The entire treatment process took 13 days using two feed pumps: P101
(12.6m3/hr) and P103 (17m3/hr). The pumps were operated for a total of
143.05 hours at an average feed pump rate of 13.93m3/hr (min: 12.6m3/hr,
max 16.2m3/hr) to deliver 1999.37m3 of waste water. The volume of liquid
waste that was treated (1999.37m3) was higher than the volume that was
initially received from TUOP (1,841m3). The additional volume (158.37m3) of
waste water treated was generated on site during storage. Rain water
added about 80% more waste volumes and the rest was leachate pumped
from solid waste in Pit 5.
Table 11: Daily treatment records
DAY
PUMP
OPERATING
HOURS
FEED
FLOW
RATE
(m3/hr)
TOTAL
WASTE
TREATED(m3)
CUMMULATIVE
VOL
TREATED(m3)
% VOL
TREATED
CUMMULATIVE
% VOL
TREATED
1 6 12.6 75.6 75.6 4.1065 4.1065
2 6 16 96 171.6 5.2146 9.3210
3 8 12.6 100.8 272.4 5.4753 14.7963
4 13 12.6 163.8 436.2 8.8973 23.6936
5 13.25 12.6 166.95 603.15 9.0684 32.7621
6 13.5 12.6 170.1 773.25 9.2395 42.0016
7 9.75 12.6 122.85 896.1 6.6730 48.6746
8 8.15 16 130.4 1026.5 7.0831 55.7577
9 13.1 12.6 165.06 1191.56 8.9658 64.7235
10 14.5 16.2 234.9 1426.46 12.7594 77.4829
11 14.5 16.1 233.45 1659.91 12.6806 90.1635
12 13.3 16.2 215.46 1875.37 11.7034 101.8669
13 10 12.4 124 1999.37 6.7355 108.6024
TOTAL 143.05 13.930769 1999.37 1999.37 108.60 108.6024
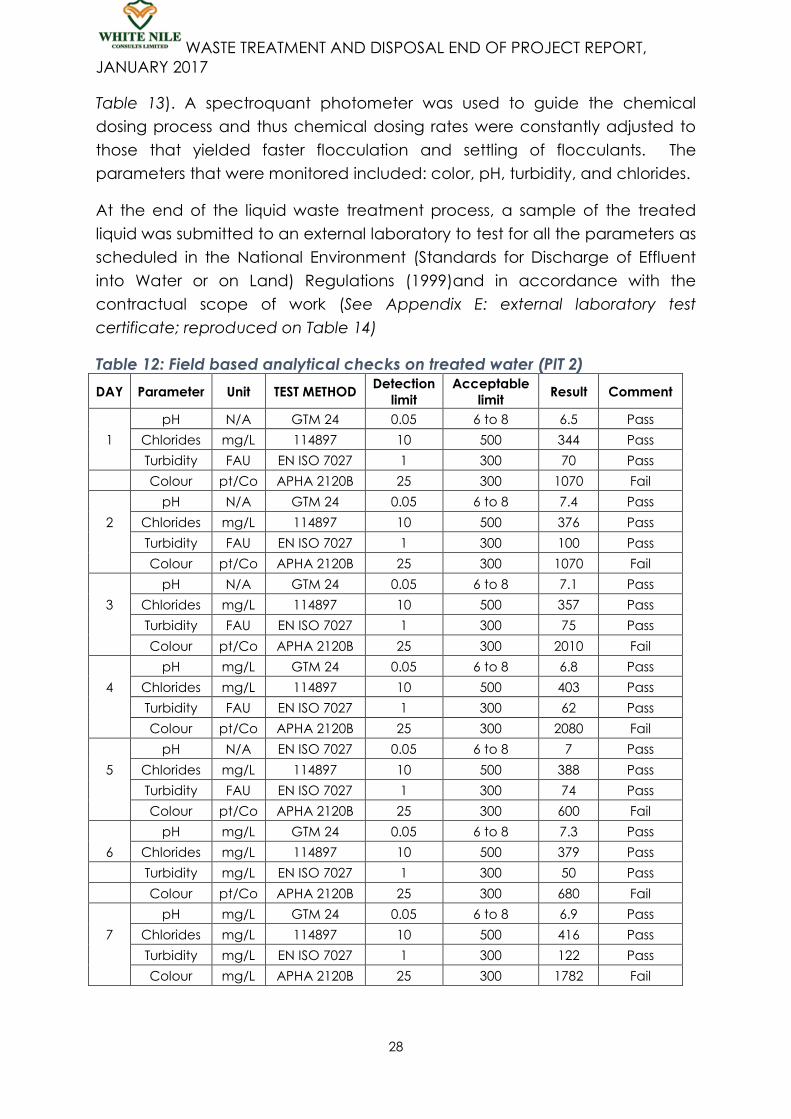
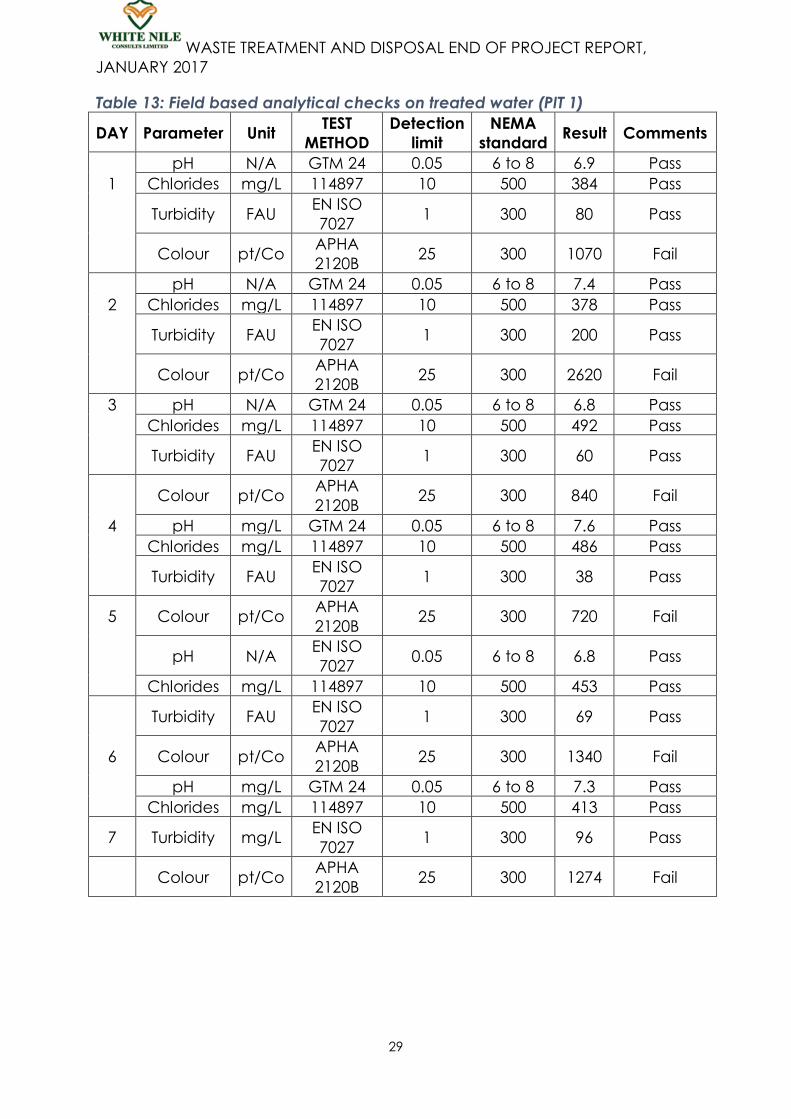
2.3.2.5 Monitoring of the treated water
As a quality management measure taken at the time of liquid waste
treatment, field-based laboratory analyses of the treated waste water were
performed on a daily basis, at time intervals of two hours (see Table 12 and
WASTE TREATMENT AND DISPOSAL END OF PROJECT REPORT,
JANUARY 2017
28
Table 13). A spectroquant photometer was used to guide the chemical
dosing process and thus chemical dosing rates were constantly adjusted to
those that yielded faster flocculation and settling of flocculants. The
parameters that were monitored included: color, pH, turbidity, and chlorides.
At the end of the liquid waste treatment process, a sample of the treated
liquid was submitted to an external laboratory to test for all the parameters as
scheduled in the National Environment (Standards for Discharge of Effluent
into Water or on Land) Regulations (1999)and in accordance with the
contractual scope of work (See Appendix E: external laboratory test
certificate; reproduced on Table 14)
Table 12: Field based analytical checks on treated water (PIT 2)
DAY Parameter Unit TEST METHOD Detection
limit
Acceptable
limit Result Comment
pH N/A GTM 24 0.05 6 to 8 6.5 Pass
1 Chlorides mg/L 114897 10 500 344 Pass
Turbidity FAU EN ISO 7027 1 300 70 Pass
Colour pt/Co APHA 2120B 25 300 1070 Fail
pH N/A GTM 24 0.05 6 to 8 7.4 Pass
2 Chlorides mg/L 114897 10 500 376 Pass
Turbidity FAU EN ISO 7027 1 300 100 Pass
Colour pt/Co APHA 2120B 25 300 1070 Fail
pH N/A GTM 24 0.05 6 to 8 7.1 Pass
3 Chlorides mg/L 114897 10 500 357 Pass
Turbidity FAU EN ISO 7027 1 300 75 Pass
Colour pt/Co APHA 2120B 25 300 2010 Fail
pH mg/L GTM 24 0.05 6 to 8 6.8 Pass
4 Chlorides mg/L 114897 10 500 403 Pass
Turbidity FAU EN ISO 7027 1 300 62 Pass
Colour pt/Co APHA 2120B 25 300 2080 Fail
pH N/A EN ISO 7027 0.05 6 to 8 7 Pass
5 Chlorides mg/L 114897 10 500 388 Pass
Turbidity FAU EN ISO 7027 1 300 74 Pass
Colour pt/Co APHA 2120B 25 300 600 Fail
pH mg/L GTM 24 0.05 6 to 8 7.3 Pass
6 Chlorides mg/L 114897 10 500 379 Pass
Turbidity mg/L EN ISO 7027 1 300 50 Pass
Colour pt/Co APHA 2120B 25 300 680 Fail
pH mg/L GTM 24 0.05 6 to 8 6.9 Pass
7 Chlorides mg/L 114897 10 500 416 Pass
Turbidity mg/L EN ISO 7027 1 300 122 Pass
Colour mg/L APHA 2120B 25 300 1782 Fail
WASTE TREATMENT AND DISPOSAL END OF PROJECT REPORT,
JANUARY 2017
29
Table 13: Field based analytical checks on treated water (PIT 1)
DAY Parameter Unit TEST
METHOD
Detection
limit
NEMA
standard Result Comments
pH N/A GTM 24 0.05 6 to 8 6.9 Pass
1 Chlorides mg/L 114897 10 500 384 Pass
Turbidity FAU EN ISO
7027 1 300 80 Pass
Colour pt/Co APHA
2120B 25 300 1070 Fail
pH N/A GTM 24 0.05 6 to 8 7.4 Pass
2 Chlorides mg/L 114897 10 500 378 Pass
Turbidity FAU EN ISO
7027 1 300 200 Pass
Colour pt/Co APHA
2120B 25 300 2620 Fail
3 pH N/A GTM 24 0.05 6 to 8 6.8 Pass
Chlorides mg/L 114897 10 500 492 Pass
Turbidity FAU EN ISO
7027 1 300 60 Pass
Colour pt/Co APHA
2120B 25 300 840 Fail
4 pH mg/L GTM 24 0.05 6 to 8 7.6 Pass
Chlorides mg/L 114897 10 500 486 Pass
Turbidity FAU EN ISO
7027 1 300 38 Pass
5 Colour pt/Co APHA
2120B 25 300 720 Fail
pH N/A EN ISO
7027 0.05 6 to 8 6.8 Pass
Chlorides mg/L 114897 10 500 453 Pass
Turbidity FAU EN ISO
7027 1 300 69 Pass
6 Colour pt/Co APHA
2120B 25 300 1340 Fail
pH mg/L GTM 24 0.05 6 to 8 7.3 Pass
Chlorides mg/L 114897 10 500 413 Pass
7 Turbidity mg/L EN ISO
7027 1 300 96 Pass
Colour pt/Co APHA
2120B 25 300 1274 Fail

WASTE TREATMENT AND DISPOSAL END OF PROJECT REPORT,
JANUARY 2017
30
Table 14: Treated water characterisation based on external testing results
DATE OF TESTING 21/09/2016
S/N PARAMETERS UNIT NEMA UNFILTERED STATUS
ORGANIC CONSTITUENTS ANALYSIS
1 1,1,1,trichloroethane mg/l 3 0.09 PASS
2 1,1,2 trichloroethane mg/l 0.2 0.05 PASS
3 1,1,2,trichloroethane mg/l 1.06 nil PASS
4 1,3 dichloropropene mg/l 0.2 nil PASS
5 Benzene mg/l 0.2 0.11 PASS
6 Dichloromethane mg/l 0.2 nil PASS
7 Tetrachloroethylene mg/l 0.1 nil PASS
8 Tetrachloro methane mg/l 0.02 nil PASS
9 Trichloro ethylene mg/l 0.3 0.11 PASS
10 1,2-Dichloroethane mg/l 0.04 0.15 PASS
11 0il and grease mg/l 10 1.01 PASS
12 Phenols mg/l 0.2 nil PASS
INORGANIC CONSTITUENTS ANALYSIS
1 Lead mg/l 0.1 0.05 PASS
2 Aluminium mg/l 0.5 0.39 PASS
3 SulpHate mg/l 500 440 PASS
4 Arsenic mg/l 0.2 0.02 PASS
5 Cadmium mg/l 0.1 0.01 PASS
6 Iron mg/l 10 1.22 PASS
7 Silver mg/l 0.5 0.01 PASS
8 Zinc mg/l 5 0.201 PASS
9 Chromium (total) mg/l 1 0.251 PASS
10 Nitrogen total mg/l 10 1.32 PASS
11 Cyanide mg/l 0.1 0.08 PASS
12 Selenium mg/l 1 0.044 PASS
13 Chloride mg/l 500 450 PASS
14 Ammonium nitrogen mg/l 10 0.05 PASS
15 Barium mg/l 10 3.22 PASS
16 Boron mg/l 5 0.003 PASS
17 Calcium mg/l 100 4.21 PASS
18 Nickel mg/l 1 0.11 PASS
19 Chromium (VI) mg/l 0.05 0.02 PASS
20 Magnesium mg/l 100 0.99 PASS
21 Nitrite N (Total) mg/l 20 0.22 PASS
22 Copper mg/l 1 0.21 PASS
23 PHospHate soluble mg/l 10 5.9 PASS
24 PHospHate total mg/l 10 11.2 FAIL
25 Mercury mg/l 0.1 <0.03 PASS
26 Cobalt mg/l - 0 PASS
27 Tin mg/l 5 0.11 PASS
28 Detergents mg/l 10 0.55 PASS
WASTE TREATMENT AND DISPOSAL END OF PROJECT REPORT,
JANUARY 2017
31
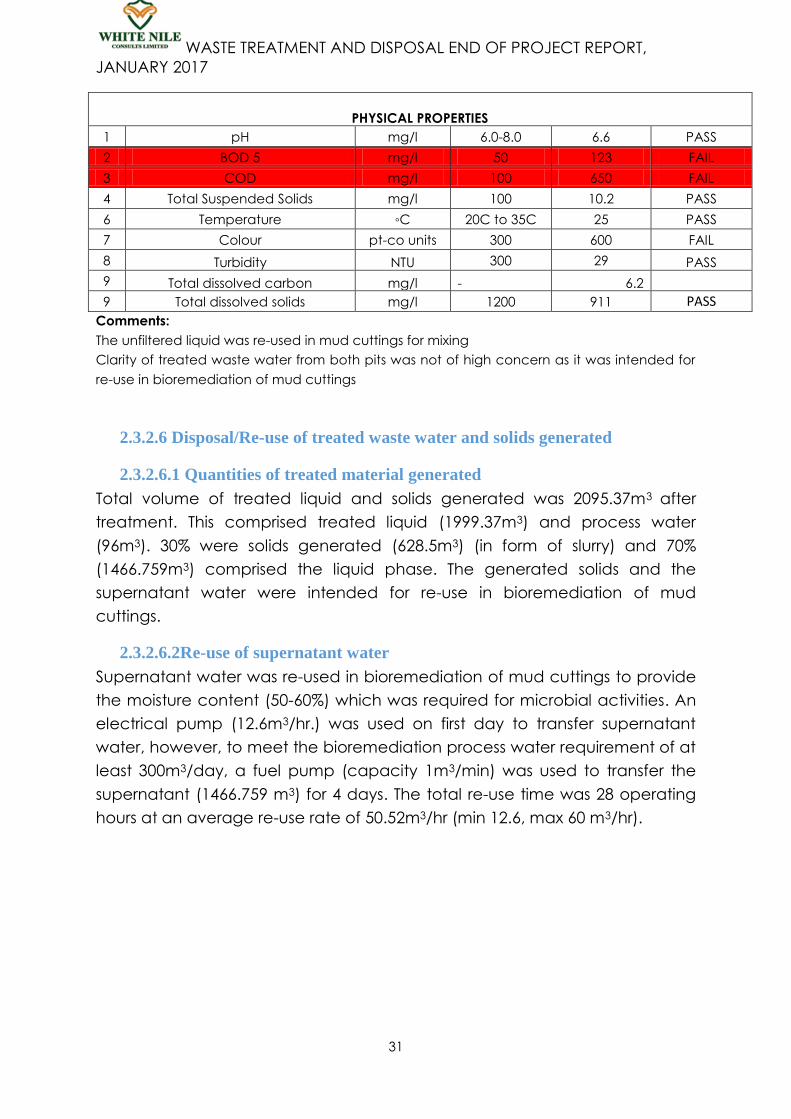
PHYSICAL PROPERTIES
1 pH mg/l 6.0-8.0 6.6 PASS
2 BOD 5 mg/l 50 123 FAIL
3 COD mg/l 100 650 FAIL
4 Total Suspended Solids mg/l 100 10.2 PASS
6 Temperature ◦C 20C to 35C 25 PASS
7 Colour pt-co units 300 600 FAIL
8 Turbidity NTU 300 29 PASS
9 Total dissolved carbon mg/l - 6.2
9 Total dissolved solids mg/l 1200 911 PASS Comments:
The unfiltered liquid was re-used in mud cuttings for mixing
Clarity of treated waste water from both pits was not of high concern as it was intended for
re-use in bioremediation of mud cuttings
2.3.2.6 Disposal/Re-use of treated waste water and solids generated
2.3.2.6.1 Quantities of treated material generated
Total volume of treated liquid and solids generated was 2095.37m3 after
treatment. This comprised treated liquid (1999.37m3) and process water
(96m3). 30% were solids generated (628.5m3) (in form of slurry) and 70%
(1466.759m3) comprised the liquid phase. The generated solids and the
supernatant water were intended for re-use in bioremediation of mud
cuttings.
2.3.2.6.2Re-use of supernatant water
Supernatant water was re-used in bioremediation of mud cuttings to provide
the moisture content (50-60%) which was required for microbial activities. An
electrical pump (12.6m3/hr.) was used on first day to transfer supernatant
water, however, to meet the bioremediation process water requirement of at
least 300m3/day, a fuel pump (capacity 1m3/min) was used to transfer the
supernatant (1466.759 m3) for 4 days. The total re-use time was 28 operating
hours at an average re-use rate of 50.52m3/hr (min 12.6, max 60 m3/hr).

WASTE TREATMENT AND DISPOSAL END OF PROJECT REPORT,
JANUARY 2017
32
Table 15: Daily treated water re-use records
DAY
PUMP
OPERATING
HOURS
PUMP RATE
(m3/hr)
VOL RE-USED
(m3)
CUMM VOL
RE-USED (m3) % RE-USED
CUMM % RE-
USED
1 4 12.6 50.4 50.4 2.40530312 2.40530312
2 7 60 420 470.4 20.0441926 22.4494957
3 7 60 420 890.4 20.0441926 42.4936884
4 7 60 420 1310.4 20.0441926 62.5378811
5 3 60 180 1490.4 8.59036828 71.1282494
TOT 28 50.52 1490.4 1490.4 71.12824943 71.12824943
2.3.2.6.3Disposal of generated solids
Flocs (611m3) settled at the bottom of the sedimentation pits. The slurry was
mixed with peat soil (14m3) to lower its fluidity. The composite material(625m3)
was transferred in two days to the mixing platform using a vacuum pump at a
rate of 50m3/hr. The total disposal time was 12.5 operating hours.
Table 16: Solids generated daily disposal records
DAY DISPOSAL
TIME(HR.) PUMP
RATE(m3/HR.) VOL
DISPOSED(m3)
CUMM
VOL
DISPOSED %DISPOSED
%CUMM
DISPOSED
1 7 50 350 350 16.70349389 16.70349389
2 6 50 300 650 14.31728048 31.02077437
TOTAL 13 100 650 650 31.02077437 31.02077437
2.3.2.7 Cleaning of pits
The liquid waste treatment and disposal process ended with the cleaning out
of the pits that were used for receiving and containing the liquid waste (Pit 1
and Pit 2) and the pits that were used to sediment and temporarily store the
treated water (Pit 3 and Pit 4). The cleaning process involved the removal of
all waste material from the pits, removal of liners and accessories like reptile
fences. Cleaning activities also included removal and clearance of all
equipment and materials that were used during the treatment process from
the liquid waste treatment area.

WASTE TREATMENT AND DISPOSAL END OF PROJECT REPORT,
JANUARY 2017
33
Figure 7: Pictorial of the liquid waste treatment process
1. Mixing of chemicals to be used in treating the liquid waste
WNCL technicians mixing chemicals to be introduced into the waste to facilitate the flocculation process which
was implemented for treating the drilling liquid waste. The chemicals were mixed to concentrations that had been
predetermined through laboratory tests to be optimum for achieving optimum flocculation of solids from the liquid
waste.
2. Dosing of chemicals into the liquid waste
WNCL technicians operating the dosing the units of the de-watering plant which were used to introduce the
flocculants into the liquid waste. The technicians filled the dosing tanks with premixed chemicals and adjusted the
tanks’ valves to regulate the rates of dosing as/when guided by findings from laboratory monitoring analyses.

WASTE TREATMENT AND DISPOSAL END OF PROJECT REPORT,
JANUARY 2017
34
3. Process monitoring for safeguards and quality assurance and management
Left: Laboratory experiments/analysis conducted on the sampled liquid that had been dosed with flocculants.
Right: Joint inspection of the process by TUOP field staff and WNCL facility managers. These routine activities
together formed the process monitoring procedures which were meant to verify that the liquid treatment process
was implemented as required, that the process was as effective as desired, and that the relevant safeguards were
implemented.
4. Sedimentation of the flocculant-dosed liquid waste
Left and centre: Liquid waste dosed with flocculant chemicals being pumped into sedimentation pits after
undergoing treatment with flocculants in the dosing units of the de-watering plant. Right: the liquid waste left to
sediment in the pit; in this process, precipitated and suspended and coagulated solids settled at the bottom of the
pit, leaving a clearer liquid at the surface.

WASTE TREATMENT AND DISPOSAL END OF PROJECT REPORT,
JANUARY 2017
35
5. Removal and transfer of the clear treated liquid from sedimentation pit to Pit 5 for re-use
Left: pipes drawing the treated waste water from the sedimentation pit. Centre: A pump and piping used to transfer
the treated waste water to for re-use in Pit 5. Right: A pipe pouring the treated waste water into Pit 5 in which mixing
of solid waste with feed materials was done. A total of 1466.759 m3 of supernatant water was obtained and pumped
into Pit 5 for re-use.
6. Re-use of the treated liquid
Treated waste water being re-used in Pit 5 for the mixing of solid waste with feed materials

WASTE TREATMENT AND DISPOSAL END OF PROJECT REPORT,
JANUARY 2017
36
7. Removal and transfer of generated solid sediment (slurry) from the sedimentation pits to Pit 5
where it was consolidated with other drilling solid waste materials
Left: sediment (in form of slurry) left in the pit after removal of the supernatant waste water. Center: a pipe drawing
the slurry from the pit during its transfer to Pit 5 to be consolidated with other solid waste. Right: A pipe pouring the
slurry into Pit 5 where it was consolidated and treated along with the drilling mud and cuttings.
8. Cleaning up of the pits
Pits that were used for containing and sedimenting liquid waste being cleaned after the removal of treated water
and slurry. Cleaning of the pits involved the removal of all materials from the within and out of the pits, including
poly-liners and reptile fences. This activity marked the end of the liquid waste treatment and disposal process.
Left: TUOP and WNCL personnel jointly observing pit-clean out activities to ensure the required safeguards were
implemented during the process. Right: A cleaned out pit awaiting rehabilitation during post-project activities. The
pits will be rehabilitated for use in the facility’s future operations.

WASTE TREATMENT AND DISPOSAL END OF PROJECT REPORT,
JANUARY 2017
37
2.3.3Overalloutcomes from liquid waste treatment and disposal
All of the liquid waste that was transported to WNCL facility was successfully
treated and re-used in bioremediation of mud cuttings. TUOP and WNCL EHS
policies were followed, and social performance and local content
obligations were observed.
Based on the results of the laboratory analyses performed on the treated
liquid by the external laboratory (See Table 14), all, except four parameters
namely Phosphate (total), BOD5, COD and colour, were found to meet the
specified discharge/disposal requirement as per the national standards for
discharge of effluent or waste water, stipulated in the National Environment
(Standards for Discharge of Effluent into Water or on Land) Regulations (1999).
The treatment process had thus been effective in changing the physical,
chemical and biological characteristics of the liquid to make it non-
hazardous and safe for disposal. The slightly above-limit content of
Phosphate(total), BOD5, COD and colour (in relation to the national
effluent/wastewater discharge standards) was not of major concern since
the treated liquid would neither be discharged into to the open environment
nor significantly inhibit the treatment processes of the drilling solid waste, in
which the treated liquid was re-used.
The re-use of the treated water in the bioremediation process significantly
reduced the facility’s demand for water at the time of blending the drilling
solid waste with feed materials as it provided a significant portion of the
water that was needed for the process. This consequently reduced to need
for the facility to abstract water from ground and surface sources, thereby
helping to minimise the potential impact that the offset water abstraction
activities would have impacted on the quantity and quality of ground and
surface water at the points from which the water would have been
abstracted.
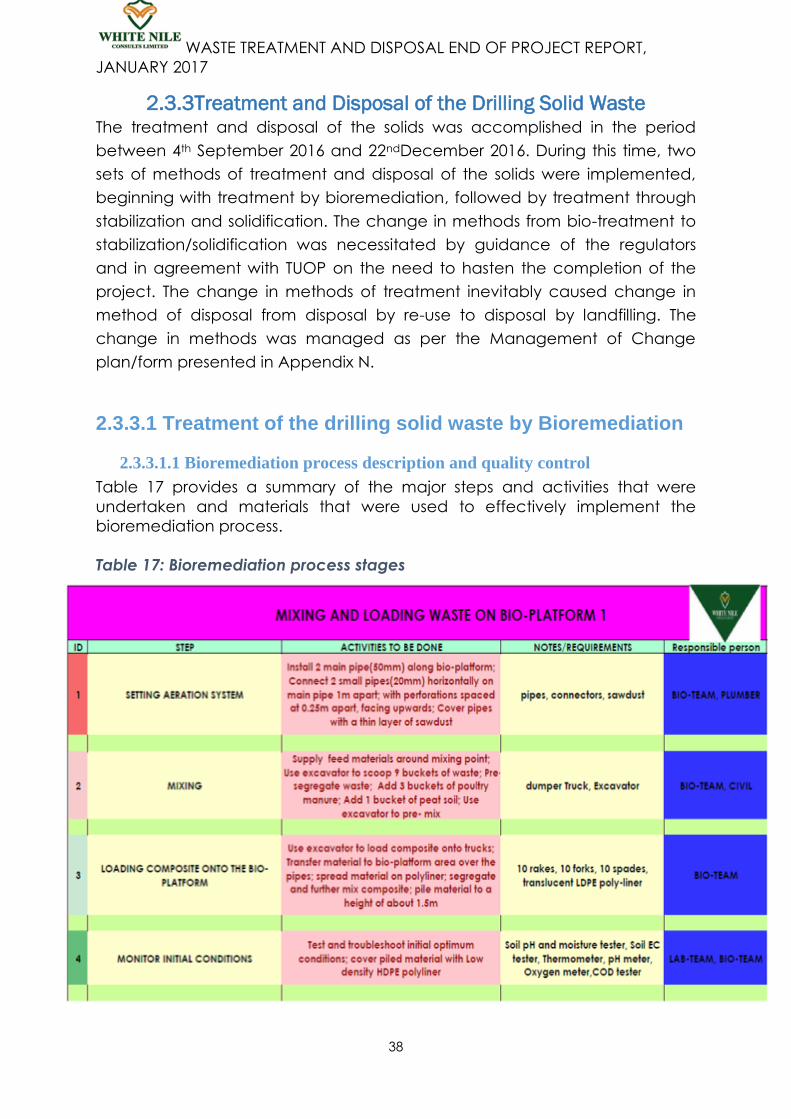
WASTE TREATMENT AND DISPOSAL END OF PROJECT REPORT,
JANUARY 2017
38
2.3.3Treatment and Disposal of the Drilling Solid Waste The treatment and disposal of the solids was accomplished in the period
between 4th September 2016 and 22ndDecember 2016. During this time, two
sets of methods of treatment and disposal of the solids were implemented,
beginning with treatment by bioremediation, followed by treatment through
stabilization and solidification. The change in methods from bio-treatment to
stabilization/solidification was necessitated by guidance of the regulators
and in agreement with TUOP on the need to hasten the completion of the
project. The change in methods of treatment inevitably caused change in
method of disposal from disposal by re-use to disposal by landfilling. The
change in methods was managed as per the Management of Change
plan/form presented in Appendix N.
2.3.3.1 Treatment of the drilling solid waste by Bioremediation
2.3.3.1.1 Bioremediation process description and quality control
Table 17 provides a summary of the major steps and activities that were
undertaken and materials that were used to effectively implement the
bioremediation process.
Table 17: Bioremediation process stages
WASTE TREATMENT AND DISPOSAL END OF PROJECT REPORT,
JANUARY 2017
39
The bioremediation process involved the use of naturally occurring
microorganisms contained in manure (poultry manure and cow dung), which
require organic carbon as a source of energy for their cell tissue formation,
and the chelating capacity of peat soil (peat soil has a high cationic
exchange capacity) to treat solid waste that was contained in Pit 5 (5,403
tons).In this process the microorganisms feed on and assimilate the organic
carbon and as well capture heavy metals contained in the waste material
within their cell structures, thereby creating a stable end product comprised
of constituent inorganic and organic species which would be in inert state
and would be less toxic, thus producing compost material which would be
suitable for safe disposal. The mechanism of the process is summarized in the
following equation:
Organic fraction + O2 + nutrients + microbe → new cells + resistant organic matter +CO2 +H20 +NH3
+SO42- + heat
The design and implementation of the bioremediation process was guided
by findings from a successful experimental laboratory trial model which was
set up to: establish the presence of microorganisms in the manure; establish
the waste-feed material mixing ratios; establish compost sampling and
monitoring regimes; and establish rate of contaminant disappearance and
compost holding time on bio-platforms. A sample of the material that was
bio-treated in the lab model trial was submitted to the external laboratory for
post-treatment analysis of contaminant levels in relation to UK WAC and
national standards (See Appendix F for the lab model report; refer to Table 5
in the report for test results of bio-model compost sample).
During solid waste treatment process, the solid waste was blended with
manure and peat soil in the ratios of 9 (solid waste): 3 (manure): 1(peat soil)
to form a composite that was allowed to undergo composting on Bio-
platform 1for 60 days, counted from the last day of loading the composite
onto the platform. These ratios and the bioremediation time of 60 days were
determined as being optimum for achieving full and effective treatment of
the solid waste by bioremediation. The excavator bucket was used as the
unit of measurement during the mixing of the waste with feed materials.
The implementation of the bioremediation process required the construction
of platforms on which the composite would be loaded for the period of 60
days to decompose. Four bio-platforms were constructed, although only one
platform Bio-platform 1, with dimensions of 80mX30m, was used to hold the

WASTE TREATMENT AND DISPOSAL END OF PROJECT REPORT,
JANUARY 2017
40
portion of the solid waste that was treated by bioremediation over a period
of 60 days. The bio-platform was designed as a self-contained system that
allowed for management of runoff, leachate and air supply and hence
facilitated the monitoring and management of the optimum conditions
required to implement an effective bioremediation process (see Figure 8).
2.3.3.1.2 Equipment used during the implementation of bioremediation
process
Main equipment used during the implementation of the bioremediation
process included: 1 excavator for scooping waste from the pit, mixing and
loading composite waste onto trucks; and 25-ton trucks (02) and 5-ton trucks
(02) were used to transfer blended waste to Bio-platform 1. Other tools used
included hoes, spades and an onsite fuel tank. In order to meet air supply
requirements, a compressor (14-18 bars) was used.

WASTE TREATMENT AND DISPOSAL END OF PROJECT REPORT,
JANUARY 2017
41
Figure 8: Cross section through a self-contained bio-platform

WASTE TREATMENT AND DISPOSAL END OF PROJECT REPORT,
JANUARY 2017
42
Figure 9: Main equipment used in implementing the bioremediation process
2.3.3.1.3 Feed materials used and their sources
Main process materials used in bioremediation include: Manure (2125.2 tons),
peat soil (750.3 tons) and fertilisers (60kg). Water (2108.7 m3) was added to
improve on the moisture content of the blend and saw dust (775Kg) was lined
on top of the air supply pipes to prevent clogging of the air vents by the
biodegrading material. Manure was sourced from farms located in Ibanda,
Kampala, Mukono, Buikwe, and Hoima (See Figure 10). Treated wastewater
and storm water collected in the retention pit was used as process water.
Excavators
Dumper trucks
Air compressor

WASTE TREATMENT AND DISPOSAL END OF PROJECT REPORT,
JANUARY 2017
43
Peat soil was excavated from the surveyed area within WNCL facility. The
quantities of the feed materials used and the rates at which they are
consumed are summarized in Table 18.
Table 18: Feed materials consumption during treatment
DAY MANURE(tons) PEAT SOIL(tons) SAW
DUST(Kg)
FERTILISER(Kg) WATER(m3)
1 11.1 2.1 50 0 3.3
2 18.1 5.1 50 0 5.4
3 37.8 7.7 50 0 0
4 31.8 13.4 50 0 0
5 31.8 11 50 0 0
6 22.7 9 50 0 0
7 160 52 50 0 300
8 160 52 50 0 300
9 330 119 75 12 550
10 330 119 75 12 300
11 330 120 75 12 350
12 332 120 75 12 300
13 330 120 75 12 0
TOTAL 2125.2 750.3 775 60 2108.7
Comments
Manure: Peat soil: Solid waste basis ratio = 3:1:9 respectively
Fertilisers were added to improve C/N ratio of manure
Water was added to improve moisture content of very dry solid waste
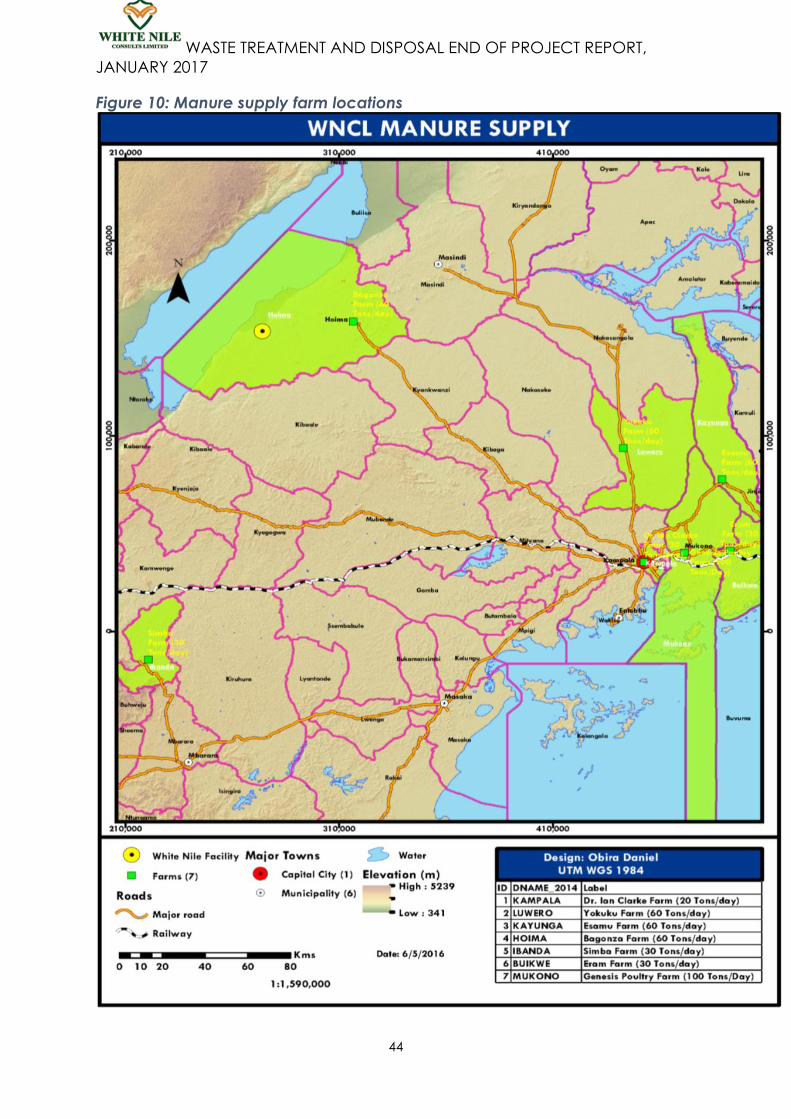
WASTE TREATMENT AND DISPOSAL END OF PROJECT REPORT,
JANUARY 2017
44
Figure 10: Manure supply farm locations
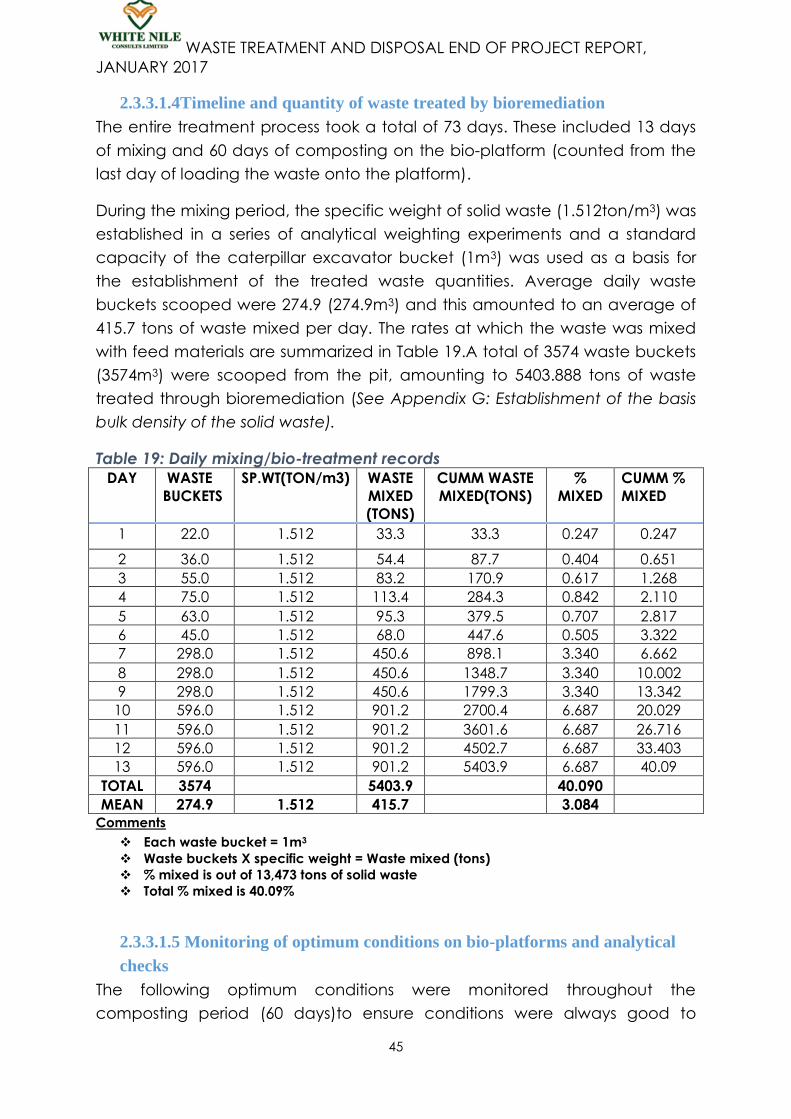
WASTE TREATMENT AND DISPOSAL END OF PROJECT REPORT,
JANUARY 2017
45
2.3.3.1.4Timeline and quantity of waste treated by bioremediation
The entire treatment process took a total of 73 days. These included 13 days
of mixing and 60 days of composting on the bio-platform (counted from the
last day of loading the waste onto the platform).
During the mixing period, the specific weight of solid waste (1.512ton/m3) was
established in a series of analytical weighting experiments and a standard
capacity of the caterpillar excavator bucket (1m3) was used as a basis for
the establishment of the treated waste quantities. Average daily waste
buckets scooped were 274.9 (274.9m3) and this amounted to an average of
415.7 tons of waste mixed per day. The rates at which the waste was mixed
with feed materials are summarized in Table 19.A total of 3574 waste buckets
(3574m3) were scooped from the pit, amounting to 5403.888 tons of waste
treated through bioremediation (See Appendix G: Establishment of the basis
bulk density of the solid waste).
Table 19: Daily mixing/bio-treatment records DAY WASTE
BUCKETS
SP.WT(TON/m3) WASTE
MIXED
(TONS)
CUMM WASTE
MIXED(TONS)
%
MIXED
CUMM %
MIXED
1 22.0 1.512 33.3 33.3 0.247 0.247
2 36.0 1.512 54.4 87.7 0.404 0.651
3 55.0 1.512 83.2 170.9 0.617 1.268
4 75.0 1.512 113.4 284.3 0.842 2.110
5 63.0 1.512 95.3 379.5 0.707 2.817
6 45.0 1.512 68.0 447.6 0.505 3.322
7 298.0 1.512 450.6 898.1 3.340 6.662
8 298.0 1.512 450.6 1348.7 3.340 10.002
9 298.0 1.512 450.6 1799.3 3.340 13.342
10 596.0 1.512 901.2 2700.4 6.687 20.029
11 596.0 1.512 901.2 3601.6 6.687 26.716
12 596.0 1.512 901.2 4502.7 6.687 33.403
13 596.0 1.512 901.2 5403.9 6.687 40.09
TOTAL 3574 5403.9 40.090
MEAN 274.9 1.512 415.7 3.084 Comments
Each waste bucket = 1m3
Waste buckets X specific weight = Waste mixed (tons)
% mixed is out of 13,473 tons of solid waste
Total % mixed is 40.09%
2.3.3.1.5 Monitoring of optimum conditions on bio-platforms and analytical
checks
The following optimum conditions were monitored throughout the
composting period (60 days)to ensure conditions were always good to
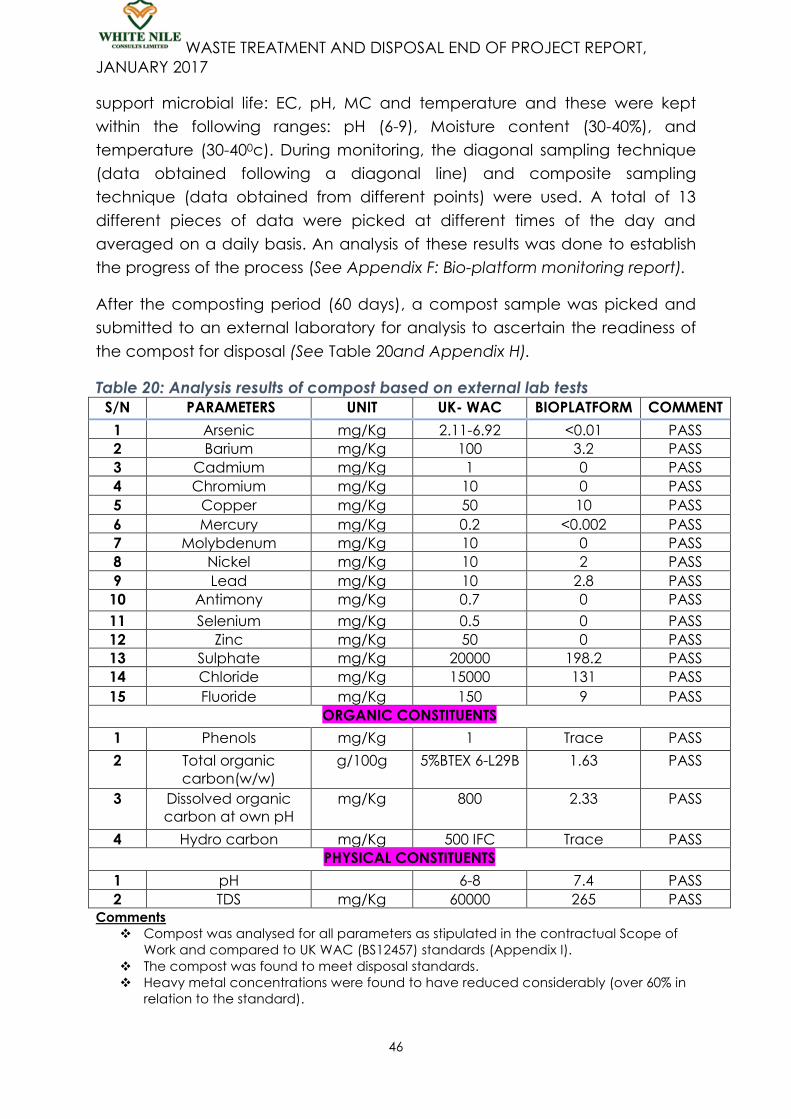
WASTE TREATMENT AND DISPOSAL END OF PROJECT REPORT,
JANUARY 2017
46
support microbial life: EC, pH, MC and temperature and these were kept
within the following ranges: pH (6-9), Moisture content (30-40%), and
temperature (30-400c). During monitoring, the diagonal sampling technique
(data obtained following a diagonal line) and composite sampling
technique (data obtained from different points) were used. A total of 13
different pieces of data were picked at different times of the day and
averaged on a daily basis. An analysis of these results was done to establish
the progress of the process (See Appendix F: Bio-platform monitoring report).
After the composting period (60 days), a compost sample was picked and
submitted to an external laboratory for analysis to ascertain the readiness of
the compost for disposal (See Table 20and Appendix H).
Table 20: Analysis results of compost based on external lab tests
S/N PARAMETERS UNIT UK- WAC BIOPLATFORM COMMENT
1 Arsenic mg/Kg 2.11-6.92 <0.01 PASS
2 Barium mg/Kg 100 3.2 PASS
3 Cadmium mg/Kg 1 0 PASS
4 Chromium mg/Kg 10 0 PASS
5 Copper mg/Kg 50 10 PASS
6 Mercury mg/Kg 0.2 <0.002 PASS
7 Molybdenum mg/Kg 10 0 PASS
8 Nickel mg/Kg 10 2 PASS
9 Lead mg/Kg 10 2.8 PASS
10 Antimony mg/Kg 0.7 0 PASS
11 Selenium mg/Kg 0.5 0 PASS
12 Zinc mg/Kg 50 0 PASS
13 Sulphate mg/Kg 20000 198.2 PASS
14 Chloride mg/Kg 15000 131 PASS
15 Fluoride mg/Kg 150 9 PASS
ORGANIC CONSTITUENTS
1 Phenols mg/Kg 1 Trace PASS
2 Total organic
carbon(w/w)
g/100g 5%BTEX 6-L29B 1.63 PASS
3 Dissolved organic
carbon at own pH
mg/Kg 800 2.33 PASS
4 Hydro carbon mg/Kg 500 IFC Trace PASS
PHYSICAL CONSTITUENTS
1 pH 6-8 7.4 PASS
2 TDS mg/Kg 60000 265 PASS Comments
Compost was analysed for all parameters as stipulated in the contractual Scope of
Work and compared to UK WAC (BS12457) standards (Appendix I).
The compost was found to meet disposal standards.
Heavy metal concentrations were found to have reduced considerably (over 60% in
relation to the standard).
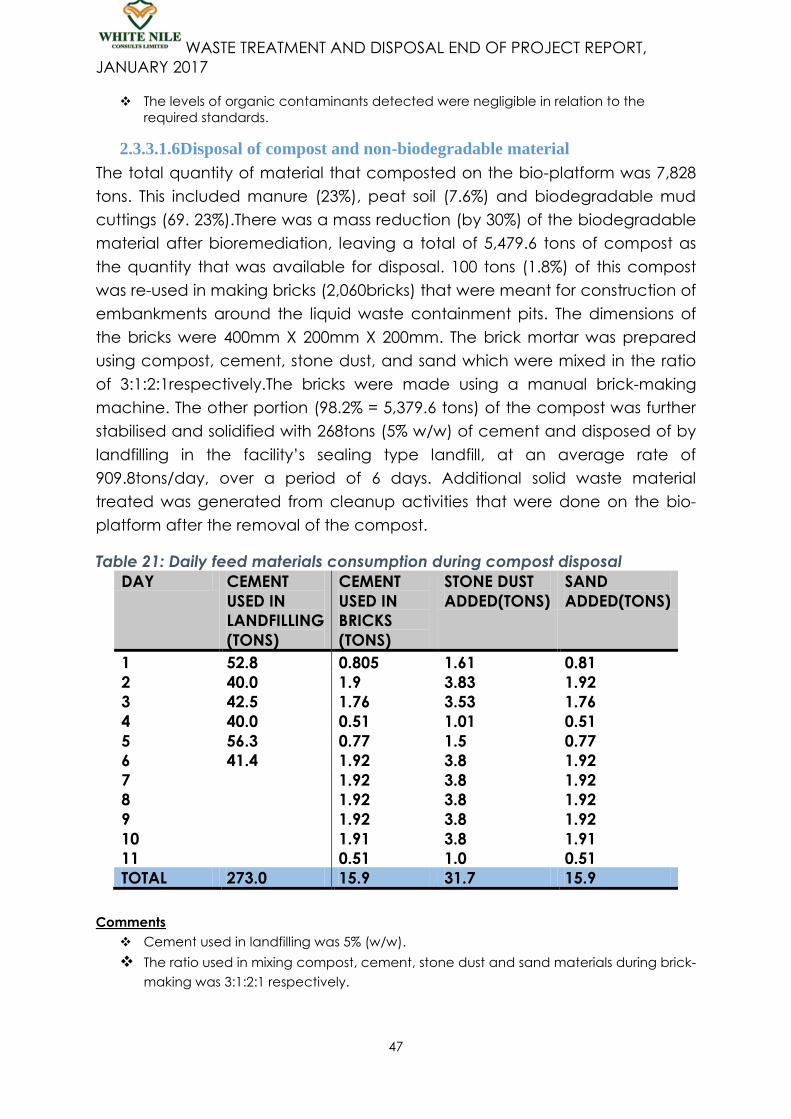
WASTE TREATMENT AND DISPOSAL END OF PROJECT REPORT,
JANUARY 2017
47
The levels of organic contaminants detected were negligible in relation to the
required standards.
2.3.3.1.6Disposal of compost and non-biodegradable material
The total quantity of material that composted on the bio-platform was 7,828
tons. This included manure (23%), peat soil (7.6%) and biodegradable mud
cuttings (69. 23%).There was a mass reduction (by 30%) of the biodegradable
material after bioremediation, leaving a total of 5,479.6 tons of compost as
the quantity that was available for disposal. 100 tons (1.8%) of this compost
was re-used in making bricks (2,060bricks) that were meant for construction of
embankments around the liquid waste containment pits. The dimensions of
the bricks were 400mm X 200mm X 200mm. The brick mortar was prepared
using compost, cement, stone dust, and sand which were mixed in the ratio
of 3:1:2:1respectively.The bricks were made using a manual brick-making
machine. The other portion (98.2% = 5,379.6 tons) of the compost was further
stabilised and solidified with 268tons (5% w/w) of cement and disposed of by
landfilling in the facility’s sealing type landfill, at an average rate of
909.8tons/day, over a period of 6 days. Additional solid waste material
treated was generated from cleanup activities that were done on the bio-
platform after the removal of the compost.
Table 21: Daily feed materials consumption during compost disposal
DAY CEMENT
USED IN
LANDFILLING
(TONS)
CEMENT
USED IN
BRICKS
(TONS)
STONE DUST
ADDED(TONS)
SAND
ADDED(TONS)
1 52.8 0.805 1.61 0.81
2 40.0 1.9 3.83 1.92
3 42.5 1.76 3.53 1.76
4 40.0 0.51 1.01 0.51
5 56.3 0.77 1.5 0.77
6 41.4 1.92 3.8 1.92
7
8
9
10
11
1.92
1.92
1.92
1.91
0.51
3.8
3.8
3.8
3.8
1.0
1.92
1.92
1.92
1.91
0.51
TOTAL 273.0 15.9 31.7 15.9
Comments
Cement used in landfilling was 5% (w/w).
The ratio used in mixing compost, cement, stone dust and sand materials during brick-
making was 3:1:2:1 respectively.

WASTE TREATMENT AND DISPOSAL END OF PROJECT REPORT,
JANUARY 2017
48
Approximately 5.4 tons of non-biodegradable materials consisting of small
pieces of liners, stones, and pieces of jumbo bags were segregated from the
compost upon sorting. The segregated stones were used in the construction
of drainage channels around the bio-platforms while the plastic materials
(liners and pieces of compactor bags) were packed in containers and
transported for disposal by destruction at Luwero Industries Limited in
Nakasongola district.
Table 22: Daily compost landfilling and brick making records DAY COMPOST
LANDFILLED
(TONS)
CUMM
LANDFILLED
%
LANDFILLED
%CUMM
LANDFILLED
BRICKS
MADE
CUMM
BRICKS
MADE
%
BRICKS
MADE
%
CUMM
BRICKS
MADE
1 1056 1056 19.6 19.6 105 105 5.25 5.25
2 800 1856 14.9 34.5 250 355 12.5 17.75
3 850 2706 15.8 50.3 230 585 11.5 29.25
4 800 3506 14.9 65.2 66 651 3.3 32.55
5 1126 4632 20.9 86.1 100 751 5.0 37.55
6 827 5459 15.4 101.5 250 1001 12.5 50.05
7 250 1251 12.5 62.55
8 250 1501 12.5 75.05
9 250 1751 12.5 87.55
10 249 2000 12.45 100
11 60 2060 3.3 103.3
TOT
AL
5459 101.5 2066 103.3
Comments
percentage of compost landfilled was calculated out of 5379.6 tons of compost
The percentage of bricks made was determined out of approximately 2000 bricks
Figure 11: Pictorial of the bioremediation treatment process
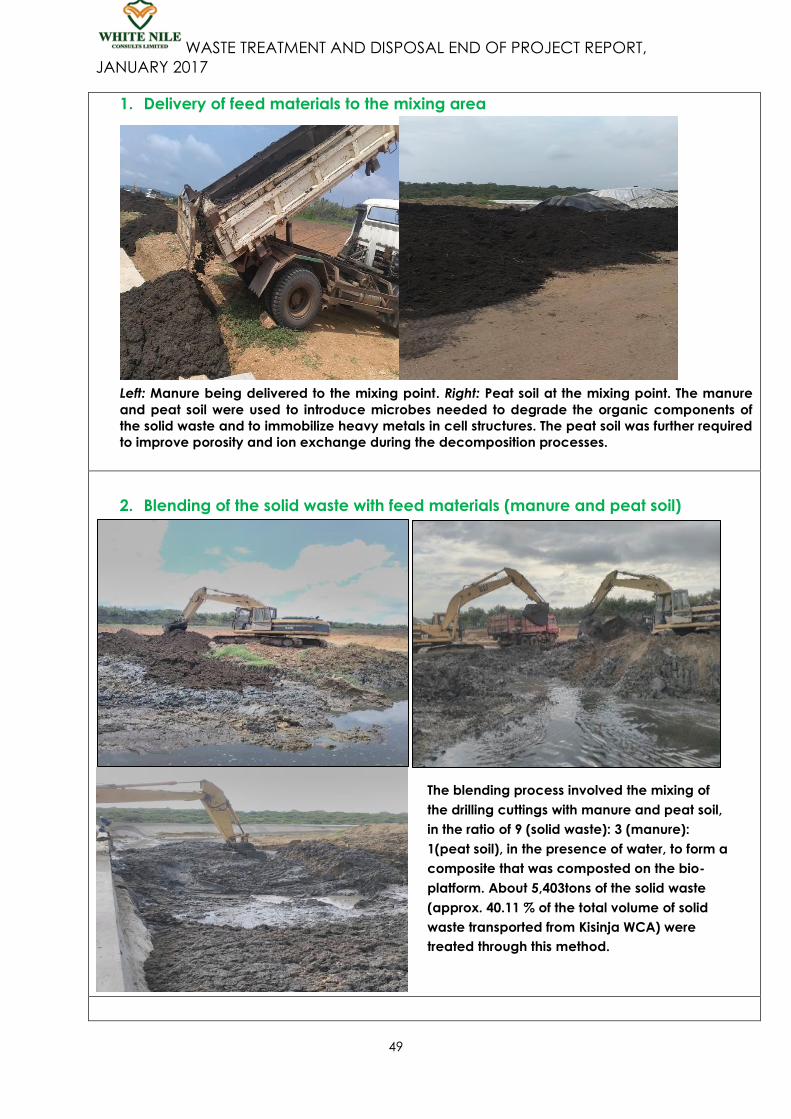
WASTE TREATMENT AND DISPOSAL END OF PROJECT REPORT,
JANUARY 2017
49
1. Delivery of feed materials to the mixing area
Left: Manure being delivered to the mixing point. Right: Peat soil at the mixing point. The manure
and peat soil were used to introduce microbes needed to degrade the organic components of
the solid waste and to immobilize heavy metals in cell structures. The peat soil was further required
to improve porosity and ion exchange during the decomposition processes.
2. Blending of the solid waste with feed materials (manure and peat soil)
The blending process involved the mixing of
the drilling cuttings with manure and peat soil,
in the ratio of 9 (solid waste): 3 (manure):
1(peat soil), in the presence of water, to form a
composite that was composted on the bio-
platform. About 5,403tons of the solid waste
(approx. 40.11 % of the total volume of solid
waste transported from Kisinja WCA) were
treated through this method.

WASTE TREATMENT AND DISPOSAL END OF PROJECT REPORT,
JANUARY 2017
50
3. Transfer of composite to the bio-platform
Left:composite being loaded onto a truck for transfer to the bio-platform. Right: a truck loading the
composite onto the bio-platform.
4. Composting of the mixed material
Left and Centre: The composite consisting of drilling mud and cuttings left to compost on Bio-platform
1 for 60 days. The bio-platform was design with trenches and a sump for proper mangment of
leachate and runoff.Right: water collected in the sumpt being pumped to Pit 5 for use in the mixing of
solid waste with manure and peat soil.
5. Monitoring and management of the optimum conditions

WASTE TREATMENT AND DISPOSAL END OF PROJECT REPORT,
JANUARY 2017
51
Left: A WNCL Lab Technician taking readings of the parameters of pH, temperature, moisture content
and electrical conductivity of the composting material. Monitoring of these parameters was done
daily, over the entire composting period of 60 days, with parameter readings being taken several
times each day. The parameters were used as indicators of the performance of the bioremediation
process and so parameter readings were used to guide the regulation of the conditions of the
composite. Right: an air compressor being used to pump air through the composting material so as to
improve oxygen levels in the composite.
6. Disposal of bio-treated compost by re-use for brick-making
Left and center: Bricks being made from the bio-treated compost. Right: Some of the bricks that were
made out of the compost. Only 100tons (1.8%) of the 5479.6 tons of bio-treated compost from bio-
platform that was available for disposal were used to make the 2,060 bricks that were made. The
bricks were made by mixing the bio-treated compost with stone dust, cement, and sand in the ratio of
3:2:1:1respectively. The bricks will be used within the facility, in the construction of embankments on
the pits.

WASTE TREATMENT AND DISPOSAL END OF PROJECT REPORT,
JANUARY 2017
52
7. Disposal of bio-treated compost by landfilling
Top Left: bio-treated compost being loaded onto a truck for transfer from the bio-platform to Pit 5. Top
Right: cement being added onto the bio-treated compost to provide further stabilization and
solidification. Bottom Left: The bio-treated compost being mixed with cement. Bottom Right: Stabilised
bio-treated compost being loaded onto a truck for transfer to the landfill. The remaining 5,379 tons
(98.2%) of the bio-treated compost which was not used for making bricks was disposed of through this
method.

WASTE TREATMENT AND DISPOSAL END OF PROJECT REPORT,
JANUARY 2017
53
2.3.3.2Treatment of the drilling solid waste by stabilisation and
solidification, and disposal by landfilling
The implementation of these methods of treatment and disposal of drilling
solid waste required the installation of a landfill facility, which was done as
presented below:
2.3.3.2.1 Design and construction of the landfill
The actual design drawings as developed by a registered architect and duly
approved by Hoima District Local Government authorities are attached in
Appendix R (Item 6).
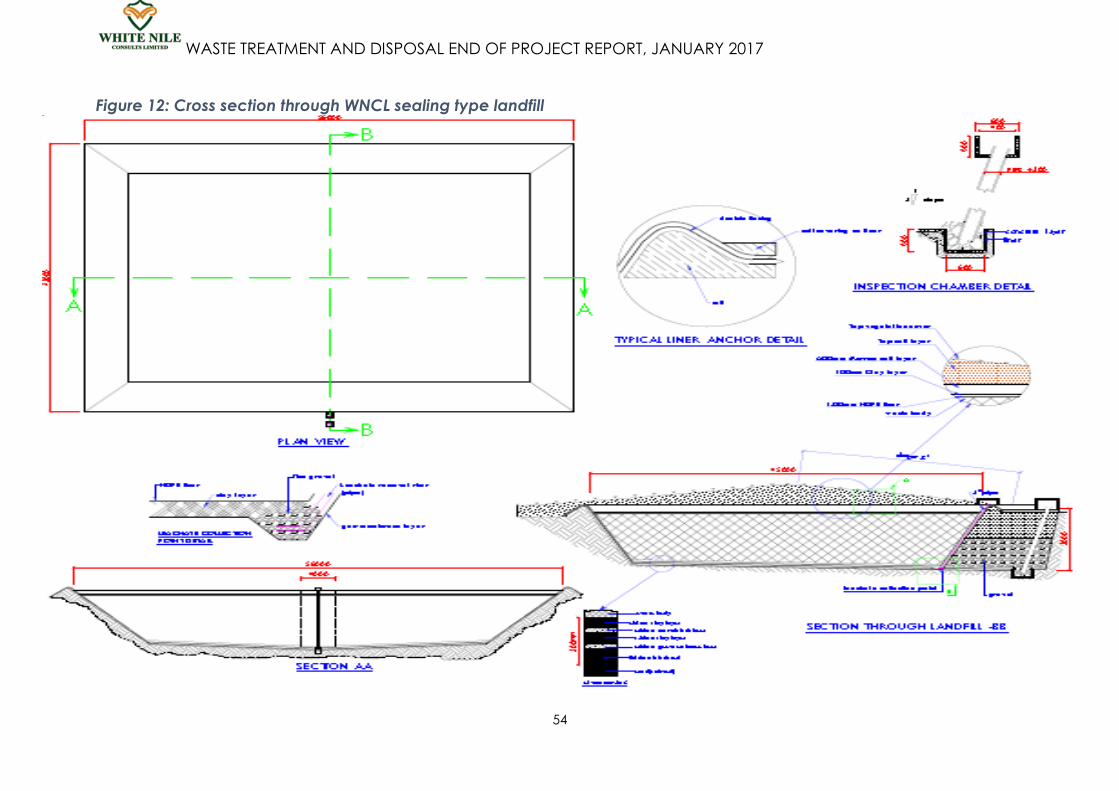
WASTE TREATMENT AND DISPOSAL END OF PROJECT REPORT, JANUARY 2017
54
Figure 12: Cross section through WNCL sealing type landfill

WASTE TREATMENT AND DISPOSAL END OF PROJECT REPORT,
JANUARY 2017
55
Key landfill design features and safeguards: Feature Specs/Safeguards
Dimensions:
56m x 45mx4.5m
Capacity: 11, 340m3
Volume of landfilled material: 9341.28 m3 (14, 233 tons)
Excess volume: 1998.72 m3(provided to accommodate thick lining and to
provide for additional material from cleanup
activities)
Stable geology: Safely located in a place which has no fault lines
Designed for ecological
protection
•Safely located away from vulnerable or sensitive ecosystems
•Bedrock at the base provides a vital safety feature protecting
the water table
•Base safely above the water board
Designed for Low leachate
generation and effective
leachate containment and
management:
•Thick, multi-layered lining at the base and cap (consisting of
thick layers of clay and murram, geo-membrane liner, HDPE
liner);
•impermeable lining (double poly-lining) on all sidewalls
•perimeter drains;
•landfill cell compaction;
•slopes, and
•re-vegetation.
These features function to: isolate waste and prevent migration
of the waste/leachate into the surroundings; prevent run-on of
precipitation over the landfill, minimize the daily exposed
working face, and reduce infiltration of rainfall.
A 3-degree slope towards the leachate point serves to
facilitate leachate collection.
Designed for easy monitoring Monitoring facilities provided in form of leachate
collection/monitoring chamber and inspection chambers.
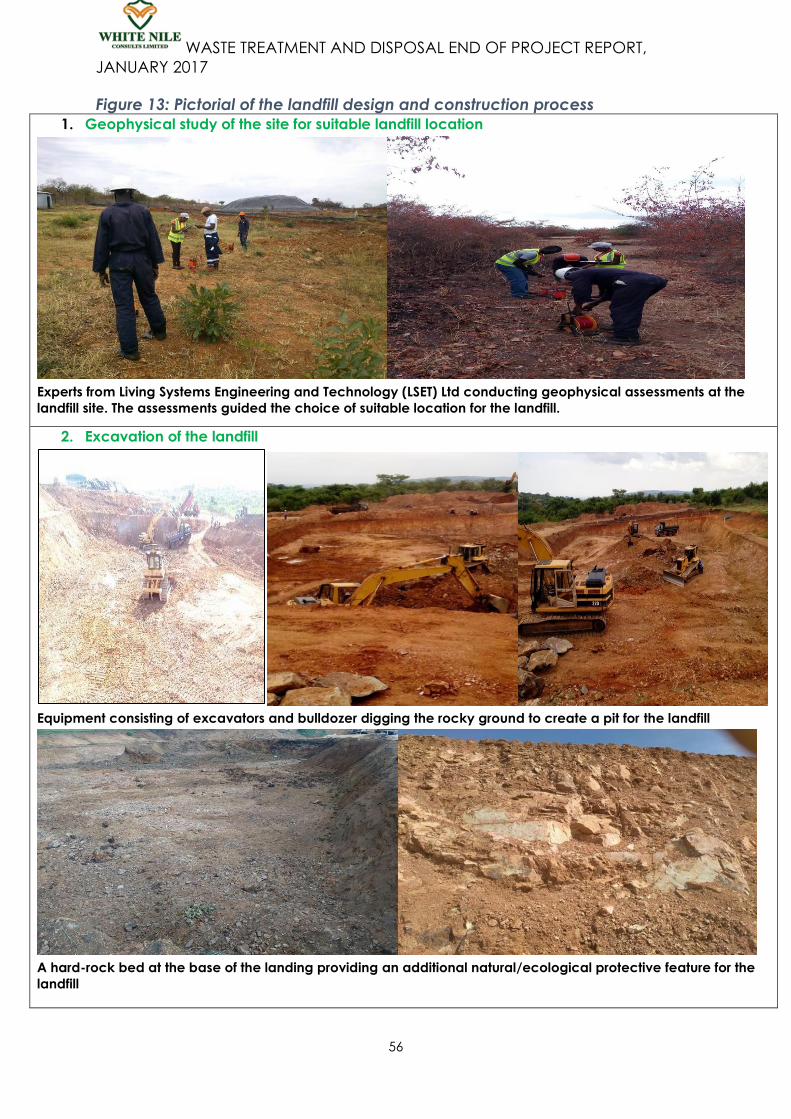
WASTE TREATMENT AND DISPOSAL END OF PROJECT REPORT,
JANUARY 2017
56
Figure 13: Pictorial of the landfill design and construction process
1. Geophysical study of the site for suitable landfill location
Experts from Living Systems Engineering and Technology (LSET) Ltd conducting geophysical assessments at the
landfill site. The assessments guided the choice of suitable location for the landfill.
2. Excavation of the landfill
Equipment consisting of excavators and bulldozer digging the rocky ground to create a pit for the landfill
A hard-rock bed at the base of the landing providing an additional natural/ecological protective feature for the
landfill
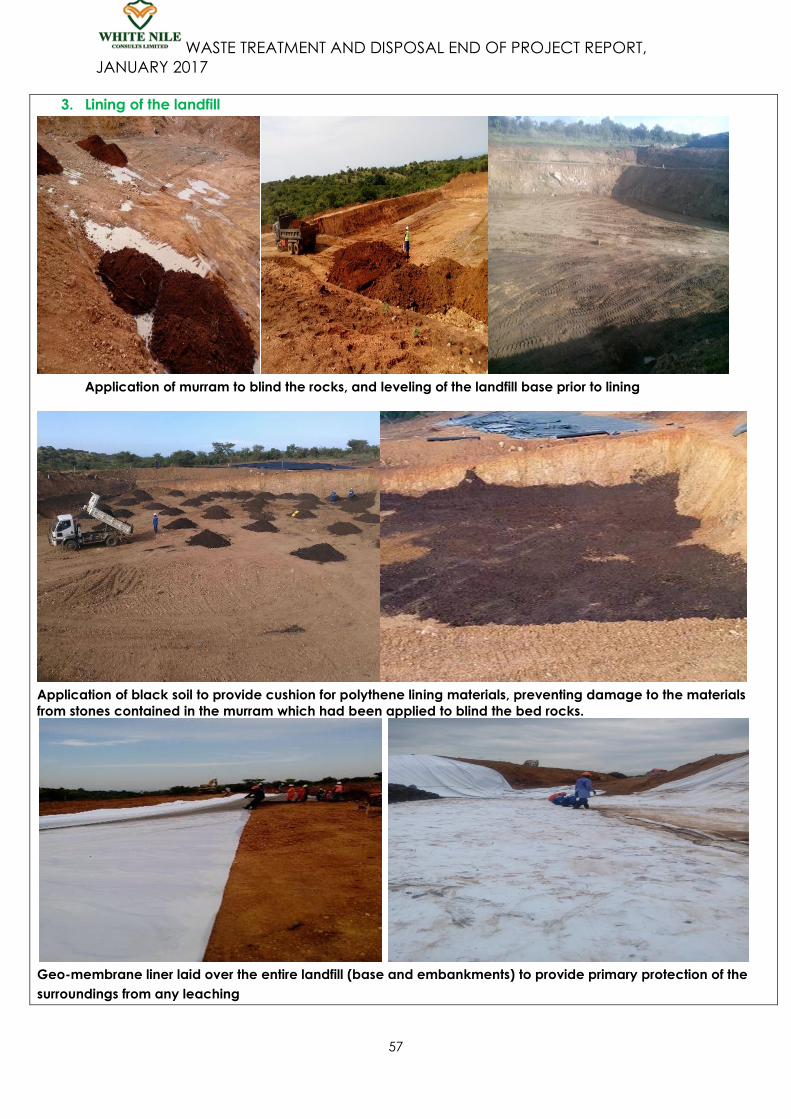
WASTE TREATMENT AND DISPOSAL END OF PROJECT REPORT,
JANUARY 2017
57
3. Lining of the landfill
Application of murram to blind the rocks, and leveling of the landfill base prior to lining
Application of black soil to provide cushion for polythene lining materials, preventing damage to the materials
from stones contained in the murram which had been applied to blind the bed rocks.
Geo-membrane liner laid over the entire landfill (base and embankments) to provide primary protection of the
surroundings from any leaching
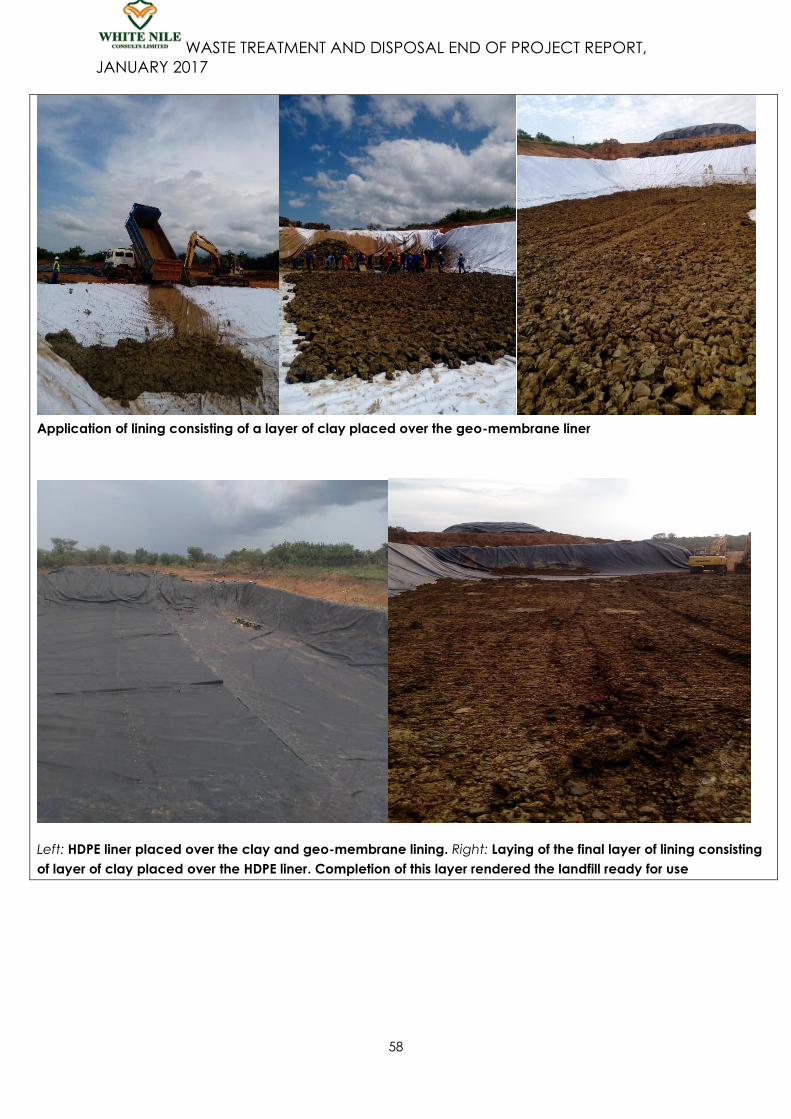
WASTE TREATMENT AND DISPOSAL END OF PROJECT REPORT,
JANUARY 2017
58
Application of lining consisting of a layer of clay placed over the geo-membrane liner
Left: HDPE liner placed over the clay and geo-membrane lining. Right: Laying of the final layer of lining consisting
of layer of clay placed over the HDPE liner. Completion of this layer rendered the landfill ready for use

WASTE TREATMENT AND DISPOSAL END OF PROJECT REPORT,
JANUARY 2017
59
Figure 14: Construction of the leachate collection chamber and inspection
chamber
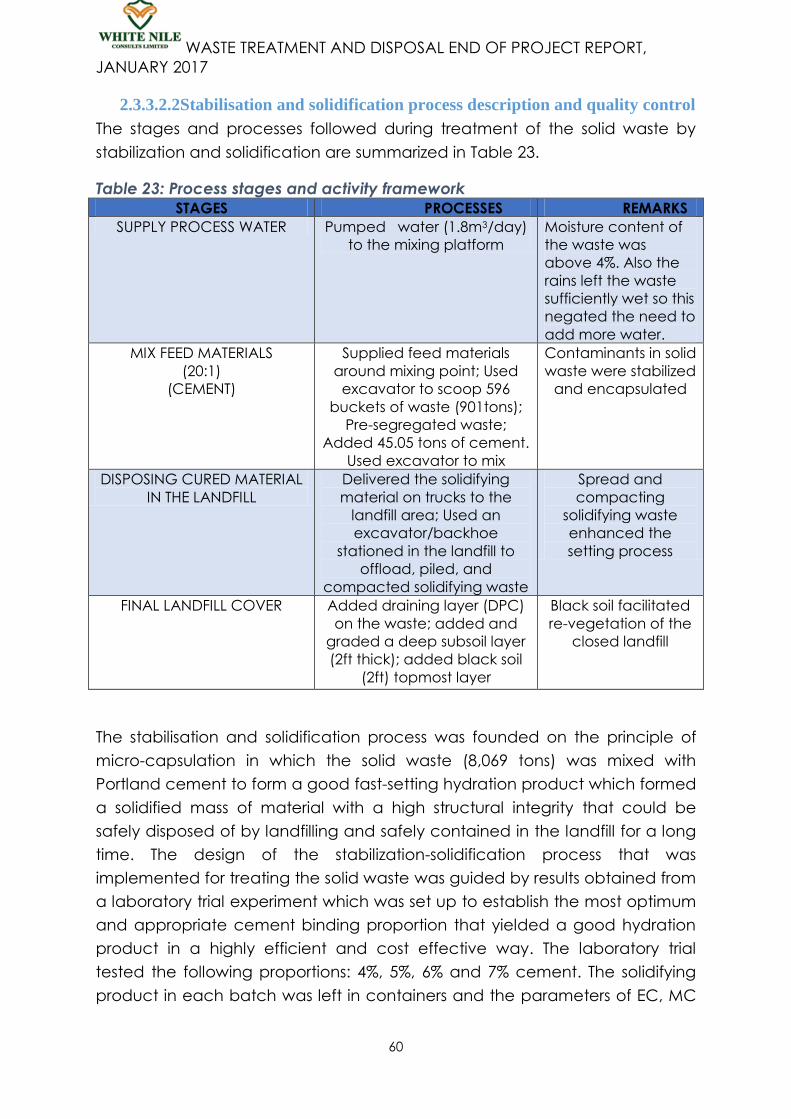
WASTE TREATMENT AND DISPOSAL END OF PROJECT REPORT,
JANUARY 2017
60
2.3.3.2.2Stabilisation and solidification process description and quality control
The stages and processes followed during treatment of the solid waste by
stabilization and solidification are summarized in Table 23.
Table 23: Process stages and activity framework
STAGES PROCESSES REMARKS
SUPPLY PROCESS WATER Pumped water (1.8m3/day)
to the mixing platform
Moisture content of
the waste was
above 4%. Also the
rains left the waste
sufficiently wet so this
negated the need to
add more water.
MIX FEED MATERIALS
(20:1)
(CEMENT)
Supplied feed materials
around mixing point; Used
excavator to scoop 596
buckets of waste (901tons);
Pre-segregated waste;
Added 45.05 tons of cement.
Used excavator to mix
Contaminants in solid
waste were stabilized
and encapsulated
DISPOSING CURED MATERIAL
IN THE LANDFILL
Delivered the solidifying
material on trucks to the
landfill area; Used an
excavator/backhoe
stationed in the landfill to
offload, piled, and
compacted solidifying waste
Spread and
compacting
solidifying waste
enhanced the
setting process
FINAL LANDFILL COVER Added draining layer (DPC)
on the waste; added and
graded a deep subsoil layer
(2ft thick); added black soil
(2ft) topmost layer
Black soil facilitated
re-vegetation of the
closed landfill
The stabilisation and solidification process was founded on the principle of
micro-capsulation in which the solid waste (8,069 tons) was mixed with
Portland cement to form a good fast-setting hydration product which formed
a solidified mass of material with a high structural integrity that could be
safely disposed of by landfilling and safely contained in the landfill for a long
time. The design of the stabilization-solidification process that was
implemented for treating the solid waste was guided by results obtained from
a laboratory trial experiment which was set up to establish the most optimum
and appropriate cement binding proportion that yielded a good hydration
product in a highly efficient and cost effective way. The laboratory trial
tested the following proportions: 4%, 5%, 6% and 7% cement. The solidifying
product in each batch was left in containers and the parameters of EC, MC
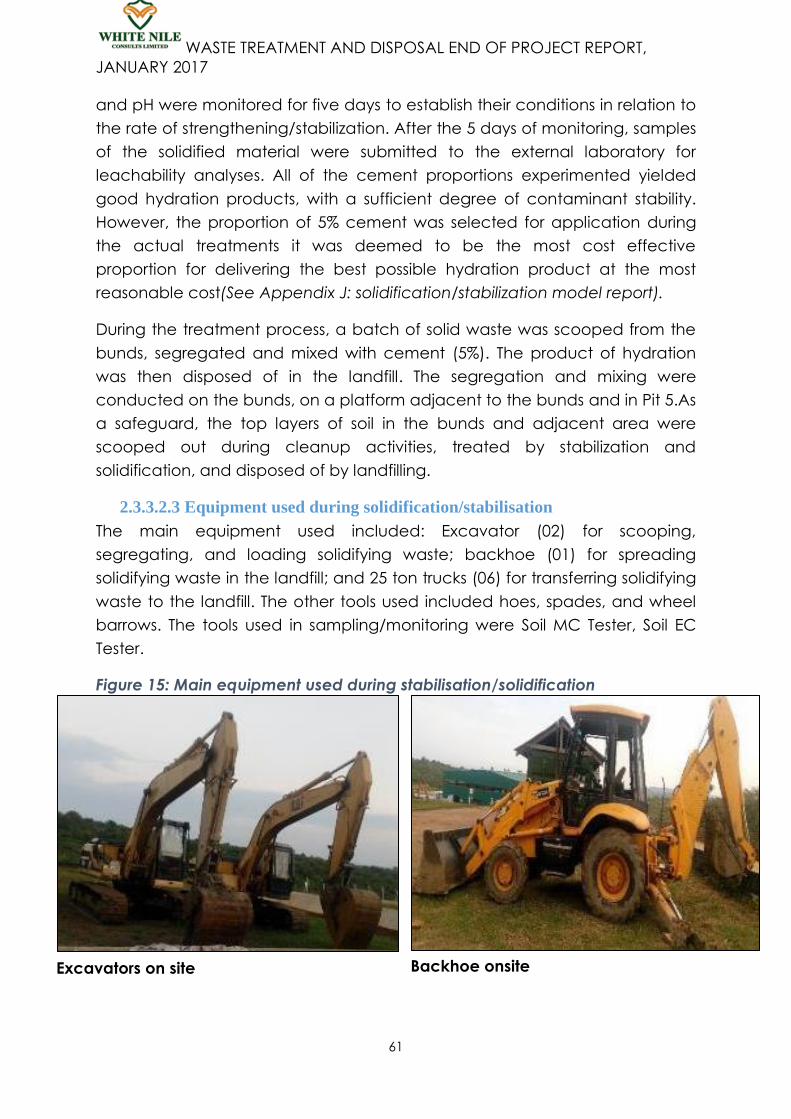
WASTE TREATMENT AND DISPOSAL END OF PROJECT REPORT,
JANUARY 2017
61
and pH were monitored for five days to establish their conditions in relation to
the rate of strengthening/stabilization. After the 5 days of monitoring, samples
of the solidified material were submitted to the external laboratory for
leachability analyses. All of the cement proportions experimented yielded
good hydration products, with a sufficient degree of contaminant stability.
However, the proportion of 5% cement was selected for application during
the actual treatments it was deemed to be the most cost effective
proportion for delivering the best possible hydration product at the most
reasonable cost(See Appendix J: solidification/stabilization model report).
During the treatment process, a batch of solid waste was scooped from the
bunds, segregated and mixed with cement (5%). The product of hydration
was then disposed of in the landfill. The segregation and mixing were
conducted on the bunds, on a platform adjacent to the bunds and in Pit 5.As
a safeguard, the top layers of soil in the bunds and adjacent area were
scooped out during cleanup activities, treated by stabilization and
solidification, and disposed of by landfilling.
2.3.3.2.3 Equipment used during solidification/stabilisation
The main equipment used included: Excavator (02) for scooping,
segregating, and loading solidifying waste; backhoe (01) for spreading
solidifying waste in the landfill; and 25 ton trucks (06) for transferring solidifying
waste to the landfill. The other tools used included hoes, spades, and wheel
barrows. The tools used in sampling/monitoring were Soil MC Tester, Soil EC
Tester.
Figure 15: Main equipment used during stabilisation/solidification
Excavators on site
Backhoe onsite

WASTE TREATMENT AND DISPOSAL END OF PROJECT REPORT,
JANUARY 2017
62
2.3.3.2.4The feed materials used and their sources
The main process material used in stabilisation/solidification was Portland
cement (403 tons). This was supplied by Kampala Cement Company Limited
and received by WNCL stores. The cement was stored in containers (40ft). As
a safeguard, removal of cement from storage was done in such a way that
only the required quantity for a particular batch of waste was issued during
the waste treatment process. Water (1.8m3) was added only when the
moisture content of the waste was insufficient to effect setting of the cement.
Figure 16: Delivery of cement to WNCL stores
Trucks on site
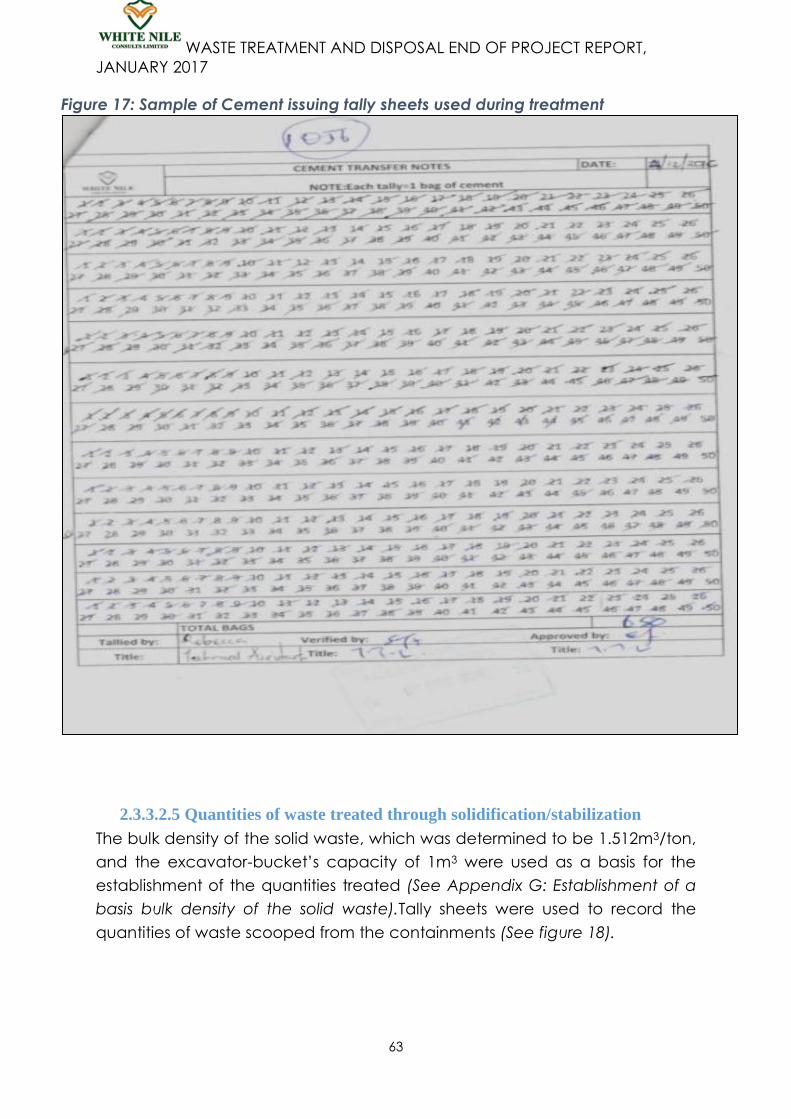
WASTE TREATMENT AND DISPOSAL END OF PROJECT REPORT,
JANUARY 2017
63
Figure 17: Sample of Cement issuing tally sheets used during treatment
2.3.3.2.5 Quantities of waste treated through solidification/stabilization
The bulk density of the solid waste, which was determined to be 1.512m3/ton,
and the excavator-bucket’s capacity of 1m3 were used as a basis for the
establishment of the quantities treated (See Appendix G: Establishment of a
basis bulk density of the solid waste).Tally sheets were used to record the
quantities of waste scooped from the containments (See figure 18).

WASTE TREATMENT AND DISPOSAL END OF PROJECT REPORT,
JANUARY 2017
64
Figure 18: Sample of waste transfer tally sheets used during treatment
The entire treatment process took an average of 12 days. The daily average
number of waste buckets scooped was 491.5(equivalent to 491.5m3of
treated waste), amounting to an average of 743.1tons of treated waste per
day (see Table 24). A total of 5,898 buckets (5,898m3) of solid waste were
scooped and this amounted to an average of 8,917.8 tons of solid waste
treated. The additional solid waste was generated from cleanup activities
and flocculants from the waste water treatment plant.

WASTE TREATMENT AND DISPOSAL END OF PROJECT REPORT,
JANUARY 2017
65
Table 24: Daily solidification/stabilisation records DAY WASTE
BUCKETS
SP.WT(TONS/m3) WASTE
STABILISED(TONS)
CUMM
WASTE(TONS)
% WASTE
STABILISED
CUMM
%
1 745.0 1.512 1126.4 1126.4 8.4 8.4
2 623.0 1.512 942.0 2068.4 7.0 15.4
3 608.0 1.512 919.3 2987.7 6.8 22.2
4 456.0 1.512 689.5 3677.2 5.1 27.3
5 607.0 1.512 917.8 4595.0 6.8 34.1
6 78.0 1.512 117.9 4712.9 0.9 35.0
7 562.0 1.512 849.7 5562.6 6.3 41.3
8 595.0 1.512 899.6 6462.3 6.7 48.0
9 463.0 1.512 700.1 7162.3 5.2 53.2
10 492.0 1.512 743.9 7906.2 5.5 58.7
11 46.0 1.512 69.6 7975.8 0.5 59.2
12 623.0 1.512 942.0 8917.8 7.0 66.2
TOTAL 5898 8917.8 66.2
MEAN 491.5 1.512 743.1 5.5
Comments
Each waste bucket =1m3
Waste buckets X Specific weight = Waste stabilised (tons)
% Waste stabilised is out of 13,473 tons of solid waste
Total solidification/stabilisation 66.2%
2.3.3.2.6Quality checks and management during solidification/stabilisation
The following parameters were monitored daily for 7 days during landfilling so
as to guide the binding process and establish the optimum stabilization rates:
EC, MC, and pH. These presented the most suitable indicators of the progress
of the stabilization and solidification processes. The results from the monitoring
generally indicated that there was an increasing rate in the hardening of the
solidified waste in the landfill. The trend of stabilisation recorded is indicated
in Figure 22.A rapid rise in pH increased the redox potentials of heavy metal
ions and was therefore available in a stable and highly immobilised state. This
was indicated by the rapid drop in the E.C per subsequent day. A drop in the
moisture content resulted from exothermic hydration reactions of cement
during setting. A hardened sample was submitted to an external laboratory
for analytical checks on the levels of contamination (See Table 25).
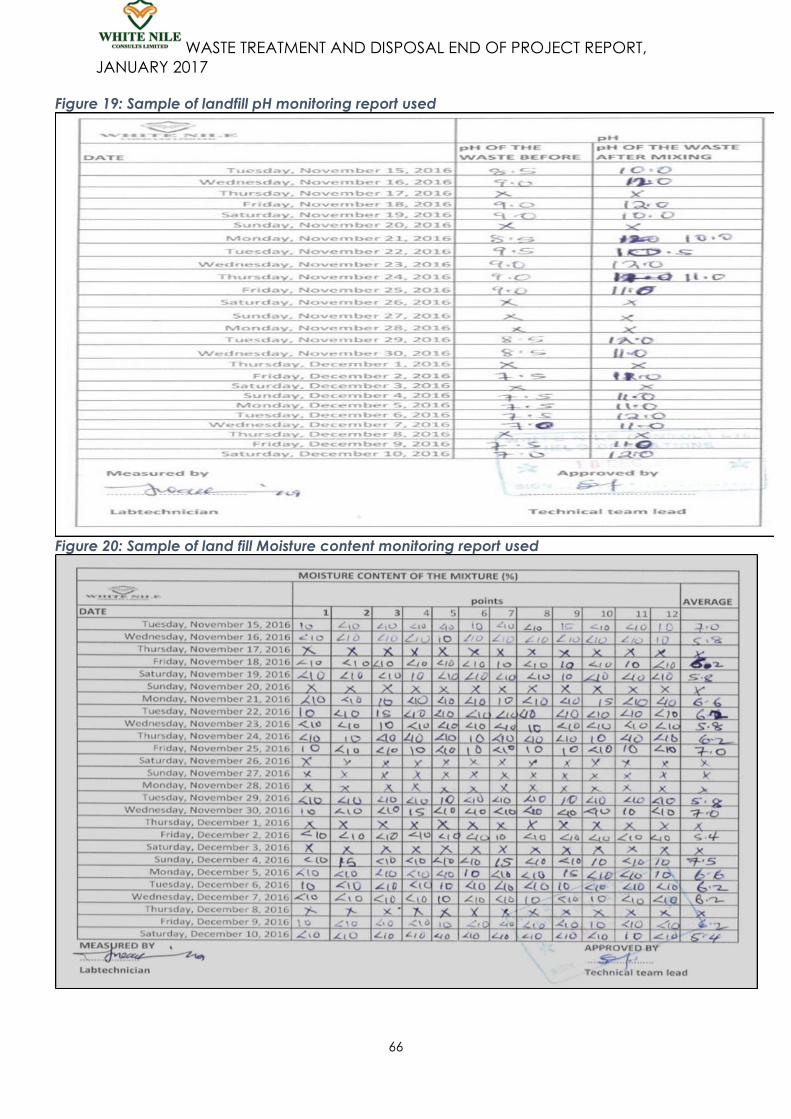
WASTE TREATMENT AND DISPOSAL END OF PROJECT REPORT,
JANUARY 2017
66
Figure 19: Sample of landfill pH monitoring report used
Figure 20: Sample of land fill Moisture content monitoring report used

WASTE TREATMENT AND DISPOSAL END OF PROJECT REPORT,
JANUARY 2017
67
Figure 21: Sample of land fill EC monitoring report used
Figure 22: Daily rate of hardening in the landfill
4
5
6
7
8
9
10
11
12
1 2 3 4 5 6 7
PA
RA
MET
ER
DAYS
RATE OF HARDENING IN THE LANDFILL
pH MC EC

WASTE TREATMENT AND DISPOSAL END OF PROJECT REPORT,
JANUARY 2017
68
Table 25: Landfilled material external lab analysis
S/N PARAMETERS UNIT UK- WAC LANDFILL COMMENT
1 Arsenic mg/Kg 2.11-6.92 <0.01 PASS
2 Barium mg/Kg 100 2.8 PASS
3 Cadmium mg/Kg 1 0 PASS
4 Chromium mg/Kg 10 0 PASS
5 Copper mg/Kg 50 4 PASS
6 Mercury mg/Kg 0.2 <0.002 PASS
7 Molybdenum mg/Kg 10 0 PASS
8 Nickel mg/Kg 10 0.1 PASS
9 Lead mg/Kg 10 1.6 PASS
10 Antimony mg/Kg 0.7 0 PASS
11 Selenium mg/Kg 0.5 0 PASS
12 Zinc mg/Kg 50 0 PASS
13 Sulphate mg/Kg 20000 28.3 PASS
14 Chloride mg/Kg 15000 95 PASS
15 Fluoride mg/Kg 150 2 PASS
ORGANIC CONSTITUENTS
1 Phenols mg/Kg 1 Trace PASS
2 Total organic
carbon(w/w)
g/100g 5%BTEX 6-L29B 1.22 PASS
3 Dissolved organic
carbon at own pH
mg/Kg 800 1.56 PASS
4 Hydrocarbon mg/Kg 500 IFC Trace PASS
PHYSICAL CONSTITUENTS PASS
1 pH 6-8 8.8 PASS
2 TDS mg/Kg 60000 316.2 PASS
Comments
All parameters as stipulated in the contractual Scope of Work were tested against (UK
WAC) and NEMA requirements (Appendix I); and the stabilised waste was found to
meet the respective disposal standards.
As indicated by the high pH, the heavy metal, organic and other contaminants were
stabilised significantly.
2.3.3.2.7 Disposal of the solidified/stabilised waste
The disposal of the stabilized and solidified waste was done by placement in
a sealing type landfill designed to completely isolate and contain all of the
waste material disposed of, thereby preventing the migration of
contaminants in the waste into the environment (see Figure 12).A total
quantity of 8, 917.8 tons of solidifying waste was available for disposal. After
sorting, a quantity of 24 tons of plastic materials consisting of pieces of liner
and compactor bags was segregated out from the mud cuttings, leaving
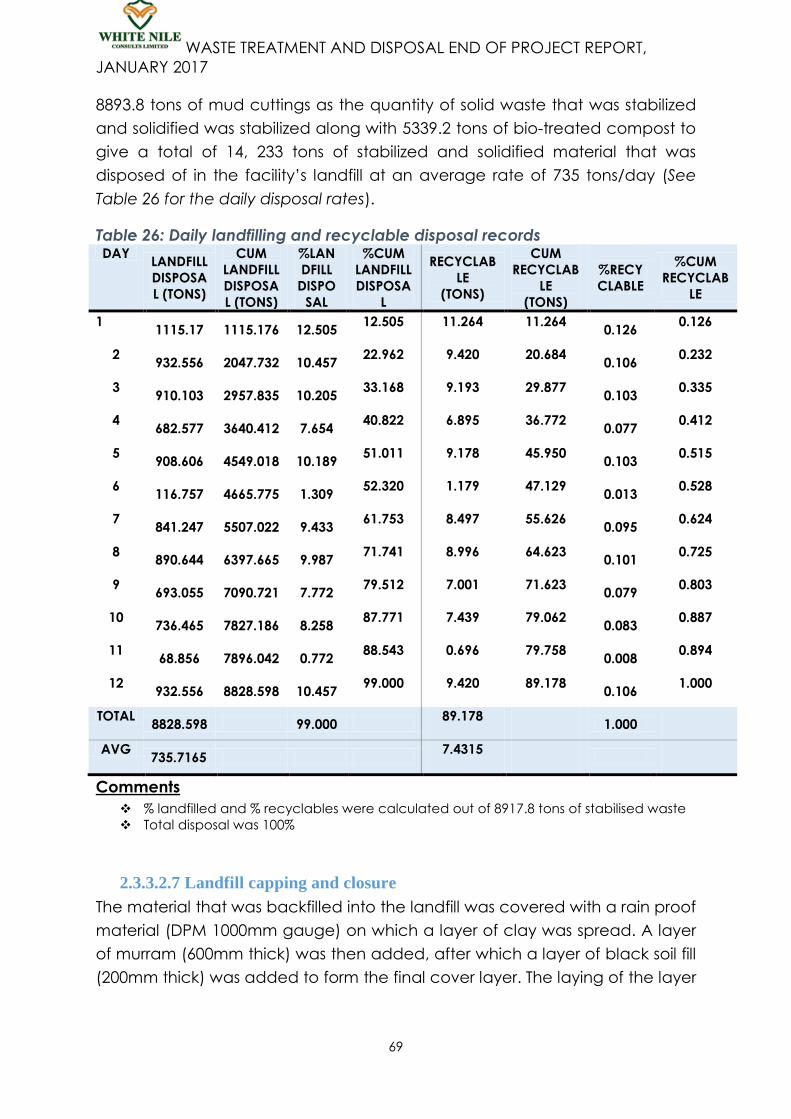
WASTE TREATMENT AND DISPOSAL END OF PROJECT REPORT,
JANUARY 2017
69
8893.8 tons of mud cuttings as the quantity of solid waste that was stabilized
and solidified was stabilized along with 5339.2 tons of bio-treated compost to
give a total of 14, 233 tons of stabilized and solidified material that was
disposed of in the facility’s landfill at an average rate of 735 tons/day (See
Table 26 for the daily disposal rates).
Table 26: Daily landfilling and recyclable disposal records DAY
LANDFILL
DISPOSA
L (TONS)
CUM
LANDFILL
DISPOSA
L (TONS)
%LAN
DFILL
DISPO
SAL
%CUM
LANDFILL
DISPOSA
L
RECYCLAB
LE
(TONS)
CUM
RECYCLAB
LE
(TONS)
%RECY
CLABLE
%CUM
RECYCLAB
LE
1 1115.17 1115.176 12.505
12.505 11.264 11.264 0.126
0.126
2 932.556 2047.732 10.457
22.962 9.420 20.684 0.106
0.232
3 910.103 2957.835 10.205
33.168 9.193 29.877 0.103
0.335
4 682.577 3640.412 7.654
40.822 6.895 36.772 0.077
0.412
5 908.606 4549.018 10.189
51.011 9.178 45.950 0.103
0.515
6 116.757 4665.775 1.309
52.320 1.179 47.129 0.013
0.528
7 841.247 5507.022 9.433
61.753 8.497 55.626 0.095
0.624
8 890.644 6397.665 9.987
71.741 8.996 64.623 0.101
0.725
9 693.055 7090.721 7.772
79.512 7.001 71.623 0.079
0.803
10 736.465 7827.186 8.258
87.771 7.439 79.062 0.083
0.887
11 68.856 7896.042 0.772
88.543 0.696 79.758 0.008
0.894
12 932.556 8828.598 10.457
99.000 9.420 89.178 0.106
1.000
TOTAL 8828.598 99.000
89.178 1.000
AVG 735.7165
7.4315
Comments
% landfilled and % recyclables were calculated out of 8917.8 tons of stabilised waste
Total disposal was 100%
2.3.3.2.7 Landfill capping and closure
The material that was backfilled into the landfill was covered with a rain proof
material (DPM 1000mm gauge) on which a layer of clay was spread. A layer
of murram (600mm thick) was then added, after which a layer of black soil fill
(200mm thick) was added to form the final cover layer. The laying of the layer

WASTE TREATMENT AND DISPOSAL END OF PROJECT REPORT,
JANUARY 2017
70
of black soil marked the end of the landfilling process and the complete end
of the entire drilling waste treatment and disposal process.
Figure 23: Pictorial of the Stabilisation/Solidification and landfilling process
1. Sorting/segregation of the drilling solid waste
Left: An excavator scooping waste from the bund .Centre: sorting of the waste done during scooping, thereby
segregating plastic materials contained in the solid waste. Right: Plastic materials (pieces of poly-liners and
compactor bags) segregated from the waste during sorting being placed for temporary storage in leak-proof
containers, awaiting transfer to Luwero Industries Limited for disposal by destruction (incineration)
2. Addition/application of stabilizing and solidifying agent (portland cement) to the waste
Workers adding cement onto the sorted solid waste material prior to mixing. He cement serves as a stabilizer to
limit chemical reactions/transformation of pollutants and solidifier to limit their ability to migrate/move in the
environment

WASTE TREATMENT AND DISPOSAL END OF PROJECT REPORT,
JANUARY 2017
71
3. Mixing of the drilling mud and cuttings with cement
Excavators mixing cement into the solid waste. The cement reacts with the moisture contained in the wasteto
form a hydration product, which is a solid mass that binds the waste material, limiting the ability of the waste to
material migrate into the environment.
4. Transfer of stabilised material to the landfill
Stabilised material being loaded onto trucks for transfer to the landfill.
Trucks tipping the stabilised material into the landfill

WASTE TREATMENT AND DISPOSAL END OF PROJECT REPORT,
JANUARY 2017
72
Stabilised waste being leveled in the landfill. The operations of the backhoe, excavators and trucks also provided
the function of compacting the stabilised waste loaded in the landfill.
5. Anlysis of stabilised and landfilled material
WNCL Lab Technician conducting analysis of the stabilised material in the landfill as part of the process monitoring
and quality management procedure. Daily laboratory analyses were done to monitor the performance of the
hydration product. This served to guide the waste-cement mixing ratios and process to ensure optimum
performance.
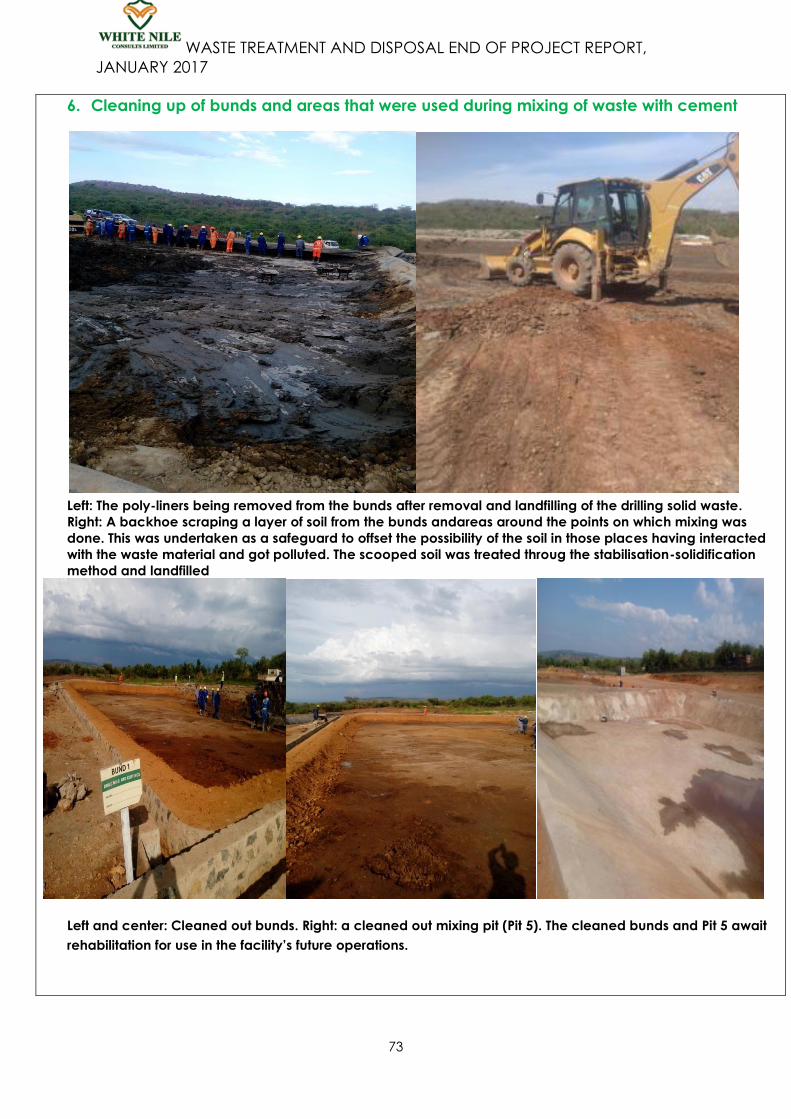
WASTE TREATMENT AND DISPOSAL END OF PROJECT REPORT,
JANUARY 2017
73
6. Cleaning up of bunds and areas that were used during mixing of waste with cement
Left: The poly-liners being removed from the bunds after removal and landfilling of the drilling solid waste.
Right: A backhoe scraping a layer of soil from the bunds andareas around the points on which mixing was
done. This was undertaken as a safeguard to offset the possibility of the soil in those places having interacted
with the waste material and got polluted. The scooped soil was treated throug the stabilisation-solidification
method and landfilled
Left and center: Cleaned out bunds. Right: a cleaned out mixing pit (Pit 5). The cleaned bunds and Pit 5 await
rehabilitation for use in the facility’s future operations.

WASTE TREATMENT AND DISPOSAL END OF PROJECT REPORT,
JANUARY 2017
74
7. Capping and closure of the landfill
A poly-liner placed over the landfilled material, to form the first layer of the capping lining for the landfill. The
poly-liner serves to seal the landfill completely off, preventing infiltration of rain into the stabilised waste
material.
A layer of fine clay applied over the poly-liner to form the second layer of the capping lining for the landfill.
The clay servs to protect the poly-liner from damage that could be created by stones contained in the murram
layer of the capping. The clay also serves to retain water/moisture, thereby controlling its infiltration into the
landfill.

WASTE TREATMENT AND DISPOSAL END OF PROJECT REPORT,
JANUARY 2017
75
A layer of murramplaced over the clay and poly liner, forming the third layer of the capping lining for the landfill.
The thick layer of murram (600mm) serves to reinforce the strength and integrity of the landfill’s capping.
A layer of black soil being applied on the landfill cap to form the fourth and last layer of the capping lining for the
landfill. The layer of black soil serves to facilitte the re-vegatation of the landfill site.
WASTE TREATMENT AND DISPOSAL END OF PROJECT REPORT,
JANUARY 2017
76
2.3.4Overalloutcomes from the solid waste treatment and
disposal processes
All TUOP solid waste that was transported to WNCL facility was successfully
treated and disposed of in safe ways, through re-use for brick making and
immobilization by landfilling. TUOP and WNCL EHS policies were followed and
social performance and local content requirements, including provision of
employment opportunities to local communities, were observed.
No major spill occurred during treatment and disposal of the solid waste.
The findings obtained from the laboratory analyses conducted by the
external lab on both the solid waste treated by bioremediation and by
stabilization and solidification to meet the specifications and standards as set
out under the UK WAC and local (Ugandan) requirements for the suitability of
the solid waste for disposal. All parameters as stipulated in the scope of work
were tested against (UK WAC) and national requirements and the chemical
characteristics of both the solid waste material that was treated by
bioremediation and that treated by stabilisation were found to have been
significantly changed in such ways that their heavy metal contents reduced
to safe limits and the content of organic contaminants was reduced to trace
amounts. The treatment methods and processes applied were therefore
effective and successful and thereby created products which were suitable
for safe disposal by re-use and landfilling.
The re-use of the bio-treated compost in the making of bricks for use in the
facility significantly reduced the facility’s demand for sand, soil and clay,
which would have been required in the brick-making process. This thereby
reduced the need to extract these resources from the environment, hence
contributing to the minimisation of the alteration and possible degradation of
the natural environment from the creation or expansion of clay or soil borrow-
areas and sand mines. The making of the bricks has saved WNCL the
expenses and social and environmental risks that would be associated with
buying and transporting bricks from elsewhere.
2.3.5 Post waste treatment and disposal site restoration
activities
Following the completion of waste treatment and disposal activities which
concluded with the completion of the capping of the landfill, site restoration
activities were undertaken with the aim of returning the site, as approximately
WASTE TREATMENT AND DISPOSAL END OF PROJECT REPORT,
JANUARY 2017
77
as possible, to pre-project conditions, so as to allow any possible self-
regulation and natural reversal of the environmental alterations created by
project activities; and to protect people and the environment by making the
clean and safe, and thereby facilitate the release of the facility for other
activities.
The site restoration-related activities undertaken included housekeeping,
collection and disposal of materials that were segregated from the solid
waste, and re-installation of the perimeter fence, and re-vegetation of the
landfill area.
2.3.5.1 Housekeeping
This mainly involved the removal and stowage of all usable moveable
equipment, tools and materials; and the removal and subsequent disposal of
all scrap and debris which consisted of all unnatural materials around the site
that were unusable and unwanted. Housekeeping activities also included
filling up of any depressions around the facility that were created by the
movement of the heavy equipment that were used during project activities.
2.3.5.2 Disposal of materials that were sorted out of the solid waste
At the completion of the sorting that was done during the treatment of the
solid waste, the quantity of plastic materials consisting of pieces of poly-liner
and compactor bags that was segregated out of the drilling solid waste
amounted to a total of 24 tons. As a safeguard, these materials were packed
in containers (40ft) for temporary storage. Because these materials had been
in direct contact with the drilling solid waste, they were considered
hazardous and hence they were designated for disposal by destruction. A
NEMA-licensed hazardous waste handler was therefore engaged to transport
the segregated materials for destruction by Luwero Industries Limited in
Nakasongola District (See Appendix K).
2.3.5.3 Restoration of the landfill area
Restoration of the landfill area involved the placement of a layer of black soil
on the top of the landfill so as to enable vegetation to grow and thrive over
the landfill site. Because completion of waste treatment activities occurred
during the dry season, the landfill site was left in a state that could support
any natural vegetation that could sprout on its own during the dry season,
while the planned deliberate planting of native grass species (6,300 plants)
will be conducted upon the return of the next rains.

WASTE TREATMENT AND DISPOSAL END OF PROJECT REPORT,
JANUARY 2017
78
Like the other landfill area restoration activities, re-vegetation of the landfill
site will be done in accordance with the landfill site restoration and post
closure management plans presented in the Technical Action Plan for the
Stabilization-Solidification process (presented on Appendix R- Item 1).
2.3.5.4 Re-installation of the perimeter fencing
The sections of the security fence that had been affected by the works that
were undertaken around the landfill area were repaired/re-installed so as to
ensure the fencing around the facility encompassed the entirety of the site,
thus improving the security of the facility and restriction of access by people
and wildlife. The fencing installed was eight (8) feet high, galvanized chain-
link topped with three (3) strands of barbed wire. The fence posts were set firmly
in concrete foundations engineered so as to resist any wind loads.
Figure 24: Repairing of the perimeter fence
The perimeter fence being repaired to limit access to the site and ensure security
2.3.5.5 Replacement of Signage
This involved the replacement of all signage that had come down during
waste treatment and disposal activities and those that were deemed to
have become faint, and placement of new signage at various locations
around the facility.

WASTE TREATMENT AND DISPOSAL END OF PROJECT REPORT,
JANUARY 2017
79
3.0MONITORING AND MANAGEMENT OF ENVIRONMENTAL AND SOCIAL ASPECTS
3.1 Environmental and Social Safeguards implemented during
waste treatment and disposal In accordance to its own commitment and in compliance with contractual
and regulatory obligations, WNCL undertook a responsibility to insure the
integrity, health and safety of its host environment, its employees and society
at large. Hence, based on the ESIA which constituted the overall risk
assessment framework for the implementation of the project, an
Environmental and Social Management and Monitoring Plan was developed
at the conception of the project, which provided the basis for the
development of systems, policies, strategies and plans addressing the
Environment, Health and Safety (EHS), social performance, local content and
monitoring aspects of the project.
Furthermore, the environmental and social safeguards that were
implemented during waste treatment and disposal activities were identified
through the comprehensive risk assessments which were conducted prior to
the implementation of both liquid and solid waste treatment and disposal-
related activities. The risk assessments identified the potential negative
impacts or damage that could result from the implementation of the
respective treatment and disposal activities, and then identified measures to
prevent or minimise and control the severity and extent of the anticipated
impacts. This was done to ensure that the activities conducted at the site do
not cause negative impacts on the local physical, biological as well as
natural environmental including local communities. The safeguards that were
implemented are presented in Appendix O and Appendix P.
3.2The Environment, Health and Safety (EHS) aspect of the project
3.2.1 EHS Strategies implemented during the project
Right from the inception stages of the project, WNCL set out to plan and
perform its activities in ways that minimized environmental discharges and
disturbances; and to build healthy and safe places and systems of work so as
to ensure that people and the environment within and around the facility
were protected and that no disruptions to work occurred throughout the
WASTE TREATMENT AND DISPOSAL END OF PROJECT REPORT,
JANUARY 2017
80
project. In line with these obligations and aspirations, WNCL developed and
implemented effective prevention-oriented EHS systems comprising a range
of policies, strategies, objectives, plans, and procedures, as well as
supervisory and capacity building approaches. Among others, some of the
key strategies adopted to ensure the health and safety of people and the
environment were:
a) Provision of appropriate and adequate Personal Protective Equipment
(PPE):
PPE was provided and its use enforced at all times of operation and in all
areas of the facility in which such equipment was required.
b) Training of personnel
Regular training was provided to all personnel, covering all areas relevant to
EHS so as to enable all staff to perform their duties and responsibilities in ways
that would be healthy and safe for them, the people around them and the
environment in which they were operating. Training activities were
conducted both in-house and externally including participation of some key
staff in NEBOSH/IOSH training.
c) Communication
Open communication was made of all relevant policies, procedures, rules
and codes of conduct governing the behavior of all people who worked,
visited and/or resided at the facility. Avenues of communication included
induction of new entrants, EHS moments during meetings, and display of
information on notice boards.
d) Risk assessments
These were used as the primary tool for managing all significant and
foreseeable risks, as they enabled the identification and control of hazards
and assessment of potential dangers from all inputs, processes and outputs
and the development of strategies for averting or controlling such potential
dangers. Two types of risk assessments were used throughout the project,
namely task-based risk assessments and Job Safety Analyses (JSAs).
Comprehensive risk assessments were conducted for the major tasks of waste
transportation, liquid waste treatment and disposal (see Appendix O), and
solid waste treatment and disposal (See Appendix P). Following the risk
WASTE TREATMENT AND DISPOSAL END OF PROJECT REPORT,
JANUARY 2017
81
assessments conducted for the respective tasks, controls were identified and
implemented to ensure safe delivery to WNCL during transportation and to
minimise potential harm to human health, environment and safety during the
treatment and disposal activities. Upon completion, each of the risk
assessments was published and made available for all staff and contractors
in the areas addressed by the assessments.
Job safety analyses and tool box talks were conducted on a daily basis
during transportation and waste treatment and disposal activities, before
commencement of works and involving staff personnel relevant to particular
activities for which the JSAs and tool box talks are conducted. Records of the
JSAs and tool box talks were captured and maintained in JSA and tool box
talk forms.
e) Permit to work
The Permit to Work system was used throughout the project to control work
activities that were deemed to be potentially hazardous. In this system, Work
Permits were issued to authorize works that were performed and to
communicate the processes followed to all affected parties, ensuring that all
tasks were clearly defined and understood, and that all hazards were
evaluated and measures taken to protect all persons, property and the
environment within and around work areas. Duly completed Work Permits
were issued for all major activities conducted including all activities related to
the transportation and treatment and disposal of the drilling waste. To ease
access and for inspection purposes, the Work Permits were displayed at the
respective work sites at all times that were the works were conducted, as well
as in the office area. Routine and spot-check inspections and audits of the
Permits and the PTW system in general were conducted regularly by both
WNCL and TUOP. A record of all of the permits issued, audits and related
action trackers has been kept in the facility’s filing system.
f) Safety observations
The safety observations method was used as a proactive risk management
tool employed to reduce the possibility of accidents and incidents occurring
at work areas and in the facility at large. This was done by allowing staff and
all persons who accessed the facility to report or comment on any unsafe use
or condition of equipment, tools and infrastructure, and/or report or
comment on any environmental and health hazards observed. The SOCA
card system was maintained in a functional state throughout the

WASTE TREATMENT AND DISPOSAL END OF PROJECT REPORT,
JANUARY 2017
82
transportation and waste treatment and disposal processes so as to enable
the timely identification of hazards and risks, and hence their timely
mitigation. A record of the SOCA cards and related action trackers has been
kept in the facility’s filing system.
g) Control of substances hazardous to health
A system was developed to ensure strict and safe control of any substances
kept at the facility that were deemed to be hazardous to health. This
included the creation of safe space in form of a Chemicals Store for proper
and safe containment of all chemicals that received at the facility and
containers for the containment of cement. The system also included
assessments of chemicals, register of all chemicals, Material Safety Data
Sheets, and procedures for safe handling of the various chemicals that were
held and used at the facility.
h) Good housekeeping
This was adopted as a tool for enhancing safety and efficiency of work areas
by reducing the possibility of accidents occurring as a result of slips, trips and
falls.“Clean as you work” good housekeeping practices were adopted in all
activities undertaken during the waste transportation and treatment and
disposal operations.
3.2.2 Record of incidents
A number of incidents were recorded during the execution of the project, as
indicated in Table 27.
Table 27: Record of incidents
Incident Number Date of
occurrence/reporting
Brief description
151115003 15/11/2015 Spill of potentially contaminated runoff
water from the containment space of
Bund 1 after heavy rains caused the
containment space to fill up and overflow.
151115004 15/11/2015 Accidental offloading of contaminated
murram into an area outside the
designated waste pit due to poor access
to the pit.

WASTE TREATMENT AND DISPOSAL END OF PROJECT REPORT,
JANUARY 2017
83
220416001 22/04/2016 Accidental knocking of the facility’s main
entrance gate by a driver of the firm that
was hired to deliver the treatment
equipment.
These incidents were timely reported, investigated, and addressed through
corrective actions which were taken promptly to remedy their impacts.
Mitigative measures were also put in place to minimise the risk of the
incidences reoccurring. Copies of the full incident reports are presented in
Appendix R(Item 7).
Figure 25: EHS training
WNCL’s workforce being trained on
environmental, health and safety aspects of
work in the oil and gas sector. Issues
addressed included permit to work, job
safety assessment/analysis among other EHS
related
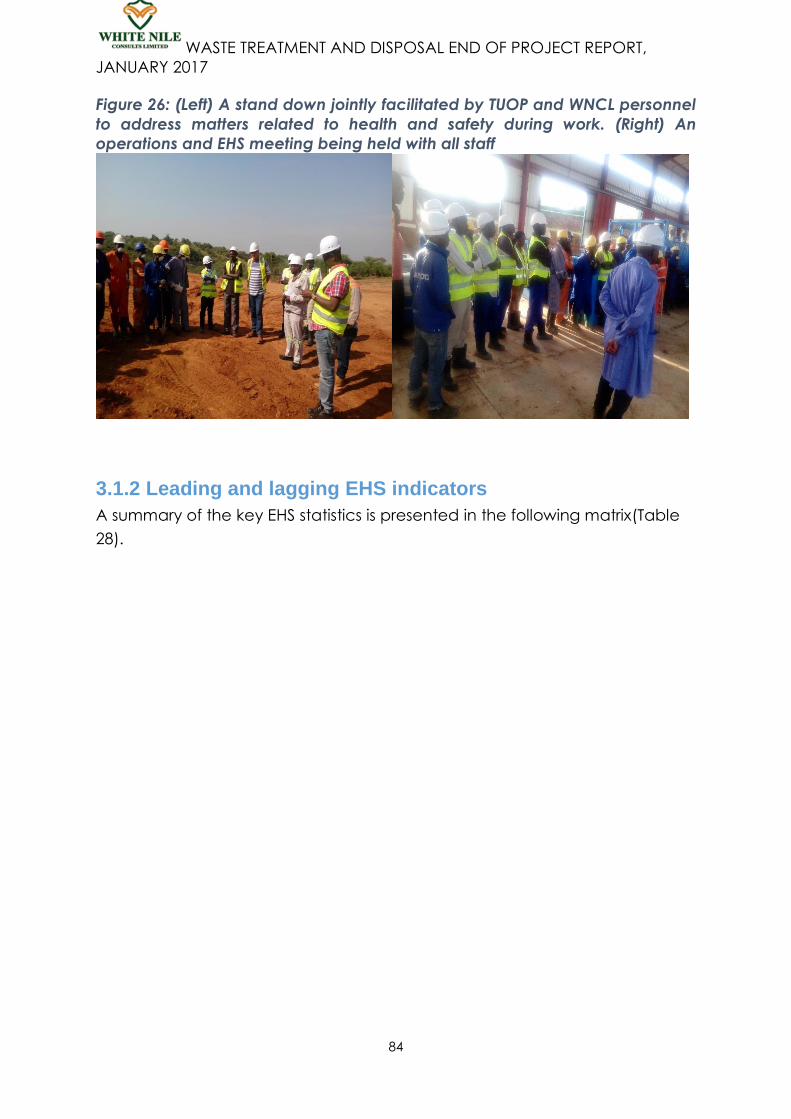
WASTE TREATMENT AND DISPOSAL END OF PROJECT REPORT,
JANUARY 2017
84
Figure 26: (Left) A stand down jointly facilitated by TUOP and WNCL personnel
to address matters related to health and safety during work. (Right) An
operations and EHS meeting being held with all staff
3.1.2 Leading and lagging EHS indicators
A summary of the key EHS statistics is presented in the following matrix(Table
28).
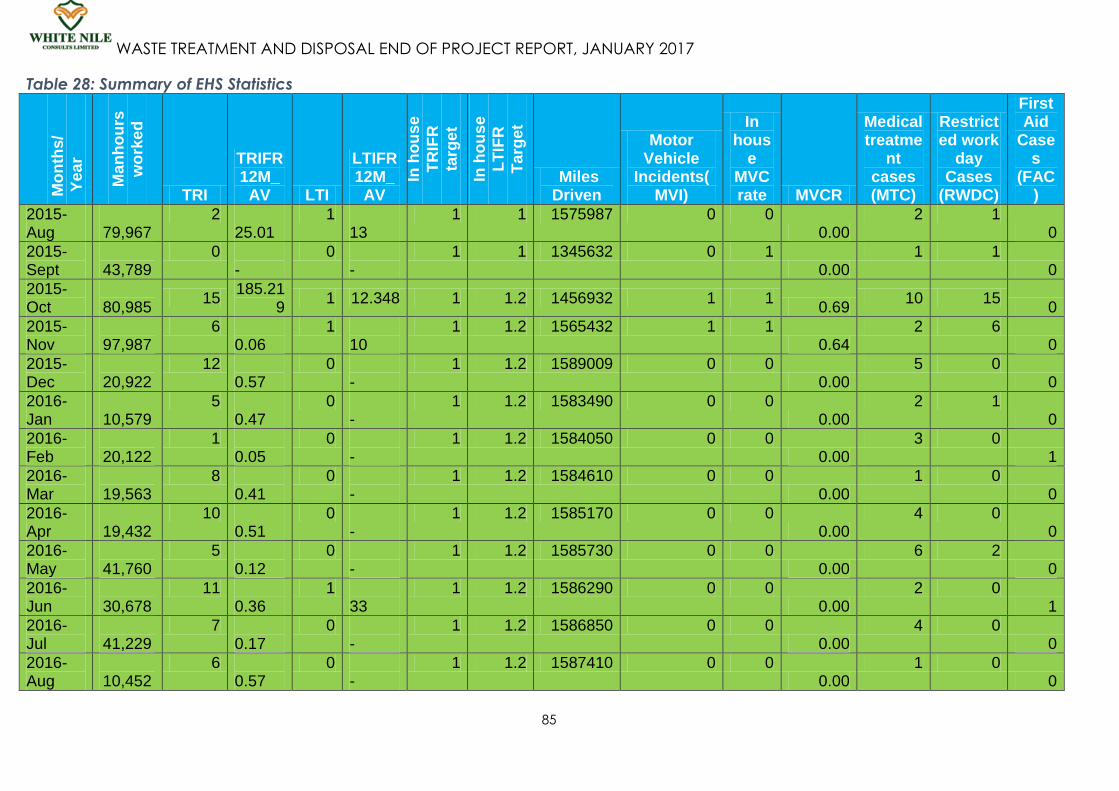
WASTE TREATMENT AND DISPOSAL END OF PROJECT REPORT, JANUARY 2017
85
Table 28: Summary of EHS Statistics
Mo
nth
s/
Ye
ar
Ma
nh
ou
rs
wo
rke
d
TRI
TRIFR 12M_
AV LTI
LTIFR 12M_
AV
In h
ou
se
TR
IFR
targ
et
In h
ou
se
LT
IFR
Targ
et
Miles Driven
Motor Vehicle
Incidents(MVI)
In hous
e MVC rate MVCR
Medical treatme
nt cases (MTC)
Restricted work
day Cases
(RWDC)
First Aid
Cases
(FAC)
2015-Aug
79,967
2 25.01
1 13
1 1 1575987 0 0 0.00
2 1 0
2015-Sept
43,789
0 -
0 -
1 1 1345632 0 1 0.00
1 1 0
2015-Oct
80,985
15 185.21
9 1 12.348 1 1.2 1456932 1 1
0.69 10 15
0
2015-Nov
97,987
6 0.06
1 10
1 1.2 1565432 1 1 0.64
2 6 0
2015-Dec
20,922
12 0.57
0 -
1 1.2 1589009 0 0 0.00
5 0 0
2016-Jan
10,579
5 0.47
0 -
1 1.2 1583490 0 0 0.00
2 1 0
2016-Feb
20,122
1 0.05
0 -
1 1.2 1584050 0 0 0.00
3 0 1
2016-Mar
19,563
8 0.41
0 -
1 1.2 1584610 0 0 0.00
1 0 0
2016-Apr
19,432
10 0.51
0 -
1 1.2 1585170 0 0 0.00
4 0 0
2016-May
41,760
5 0.12
0 -
1 1.2 1585730 0 0 0.00
6 2 0
2016-Jun
30,678
11 0.36
1 33
1 1.2 1586290 0 0 0.00
2 0 1
2016-Jul
41,229
7 0.17
0 -
1 1.2 1586850 0 0 0.00
4 0 0
2016-Aug
10,452
6 0.57
0 -
1 1.2 1587410 0 0 0.00
1 0 0

WASTE TREATMENT AND DISPOSAL END OF PROJECT REPORT, JANUARY 2017
86
2016-Sept
20,134
6 0.30
0 -
1 1.2 1587970 0 0 0.00
3 0 0
2016-Nov
20,229
4 0.20
0 -
1 1.2 1588530 0 0 0.00
2 0 0
2016-Dec

WASTE TREATMENT AND DISPOSAL END OF PROJECT REPORT,
JANUARY 2017
87
3.2 The Social Performance of the project
3.2.1 Obligations under social performance
In cognizance of the contractual and legal requirements and of the fact that
the implementation of the project would inevitably involve contact and
interaction with both local and distant communities, it was imperative for
WNCL to meet the obligations of
a) Upholding and promoting respect for human rights;
b) Identifying and mitigating social risks and harmful impacts, and
enhancing beneficial returns; and
c) Addressing grievances in a timely manner.
These provided the means by which WNCL ensured that the activities
undertaken in delivering the drilling waste transportation and treatment and
disposal services did not pose detrimental effects by creating disturbance or
nuisance factors on the local community and the Ugandan society at large.
4.2.2 Meeting the social performance obligations
To effectively meet the obligatory requirements under the social
performance aspect, WNCL developed asocial performance management
system comprising of dedicated human resources; a community
engagement policy (WNC-HSE-POL-006- COMMUNITY ENGAGEMENT POLICY),
strategy and plan (WNC-HSE-PLN-009- COMMUNITY ENGAGEMENT PLAN);
and a written grievance management procedure (WNC-HSE-PRO-023-
COMMUNITY GRIEVANCE PROCEDURE)
The social performance system functioned well in guiding entry, contact and
interaction of the waste treatment and disposal facility with the surrounding
communities and in integrating communities’ issues into the operations of the
plant and of the company as a whole, as it:
a) Upheld and prioritized engagement of and liaison with all relevant
stakeholders through consultation before and during waste
transportation and treatment and disposal, as evidenced by reports on
the various engagements conducted throughout the life of the project,
which are on record; and
b) Fostered openness and dialogue with employees and community,
providing timely and accurate information and allowing employees
and community members to freely express their concerns and

WASTE TREATMENT AND DISPOSAL END OF PROJECT REPORT,
JANUARY 2017
88
aspirations in relation to the project and the development of their
community, and to register and track their grievances until final closure.
A number of grievances were recorded during the course of project
implementation. All of the grievances recorded were addressed in a timely
fashion as indicated on the grievance log presented on Appendix R(Item 8).
3.2.3 Avenues used to ensure continuous community
engagement and high social performance during the project
The main methods used included:
i) Engagement of communities and other stakeholders through regular
meetings. Periodic sensitization meetings were organized and held with
Local Councils and community members, by both TUOP and WNCL social
performance teams. The meetings were aimed at constantly keeping the
community involved in the project and constantly keeping the community
aware of the nature of waste that was being handled by WNCL, the
potential effects of a spill if one occurred and response thereof to such an
eventuality, how the waste was being handled without allowing posing any
harm to any community, and the progress of the project. Community
engagements were held throughout the project, right from the time of
transportation of the waste, through the waste holding period (8 months) to
the time of treatment and final disposal of the waste and closure of the
project. A register of the engagements is attached is presented on
Appendix R(Item 9).
ii) Engagement of communities through sporting activities. This approach took
the form of organizing regular football matches with the communities of
Kaseeta and Hohwa. The football matches provided a useful and effective
avenue for members of the communities in the respective villages to interact
directly with the waste treatment team who constituted the facility’s football
squad. Talks and other forms of interaction (such as question and answer
sessions) were organized prior to kick-off, during breaks and at the end of the
football matches. These interactions were useful in helping the facility to
gather information on the concerns, fears and interests of the communities
and in response to allay the fears and concerns that the communities had.
iii) Use of mass media. This was mainly done through the involvement of local
radio stations that included Spice FM, Liberty Radio and Radio Hoima to relay

WASTE TREATMENT AND DISPOSAL END OF PROJECT REPORT,
JANUARY 2017
89
information to the general public regarding the project and the various
activities that were related to it. Messages were relayed through the radio
stations throughout the period the in which project was implemented.
iii) Enhancing beneficial returns to the community. These included: a)
upgrading of the road leading from the Kaiso main road through Hohwa
trading center to the waste treatment and disposal facility- thereby providing
an improved road both for the facility and the community of Hohwa and the
general public, b) provision of employment and income generating
opportunities to local community as most labour and material requirements
were met with human resources and materials sourced from the surrounding
villages, and c) maintenance of community playground at Hohwa trading
center through regular mowing.
Figure 27: Community engagement through community meetings
Left: and Center: community engagement meetings facilitated by WNCL Social Performance
Coordinator. Right: WNCL’s SPC and locals from inspecting a broken bridge at Kaseeta
following the community’s request for support to get the bridge repaired.
Maintenance of a road in Hohwa which was done as part of Corporate Social Responsibility
and so as to enhance beneficial returns to the local communities
WASTE TREATMENT AND DISPOSAL END OF PROJECT REPORT,
JANUARY 2017
90
3.3 The Local Content Aspect of the project
3.3.1 Obligations under the local content aspect
Contractual and regulatory requirements made it incumbent on WNCL to:
a) Insuring employment opportunities for local content by prioritizing the
recruitment of the local (Ugandan) population, while paying particular
attention to gender considerations, and to technology transfer and the
development of the local population’s capacity to meaningfully
participate and benefit from their engagement in the project.
b) Ensure maximum benefit for the local (Ugandan) community from the
project’s procurement by giving preference to Ugandan goods and
services.
These provided the founding principles by which the company operated with
respect to the recruitment of the required human resources, procurement of
required equipment, materials and services and optimization of benefits of
the project for the Ugandan society. The requirements were monitored and
reported regularly. A record of the reports has been maintained in the
company’s records.
3.3.2Performance of the project in relation to labour
requirements
3.3.2.1 Distribution of labour by source
Most of the labor used (65%)was sourced from communities residing in nearby
places which comprise villages located within a 1km radius from the facility,
namely Hohwa, Kaseeta, Kyarusesa and Kyenjojo. The second most
significant amount (20%) of the labour used in the project was sourced from
surrounding villages which were defined as areas falling in a 2-5km radius of
the facility. This mainly consisted of human resources sourced from the
villages of Ssebagoro, Kaiso, Nyairongo, Lwengabi and Kabaale. The wider
Hoima district contributed 10% of the labour used in the project. The other
parts of Uganda provided 4% of the source of the total workforce, and this
was particularly to fill in roles for which more specialized labor was required
which could not be obtained from among the near and surrounding
communities. Foreign (non-Ugandan) labor that constituted 1%of the total
workforce used in the project was sourced from other parts of the world
mainly to temporarily support technology transfer processes by providing

WASTE TREATMENT AND DISPOSAL END OF PROJECT REPORT,
JANUARY 2017
91
training to the local (Ugandan) staff on the technologies that were required
and used in implementing the project(See figure 28).
Figure 28: Main sources of labour used in the project
3.3.2.2 Distribution of labour by gender during the project
Throughout the project, a total number of 132 people were enlisted in
different roles. These included permanent staff and support staff in the
categories of gardeners, cooks, cleaners, security guards, and machine
operators. The support team formed the majority of the labour force (more
than 64%)(See figure 29). The team comprised of men (93%) and women
(7%)(See figure 30).This was because most of the work entailed in the
implementation of the project consisted of activities such as construction of
bio-platforms, bunds, pits and drainages, lining engineering structures, sorting
segregated waste, pumping water and operating machines which were
highly labour-intensive and physically demanding and were therefore not
accepted by women, thereby leaving most roles to men as women gave
preference to the less labor intensive activities such as cooking, cleaning,
and gardening. The technical team comprised of 7 highly qualified local
staff. These were: Technical Team Lead (01), Tab Technician (01), EHS team
(02) and technical assistants (03). The participating team involved was
entirely composed only of adults (18-59 years) (100%). Much of the work
0 20 40 60 80 100% labor
Sources of labour
World
Uganda
Within Hoima
Sorrounding places
Nearby places
Key
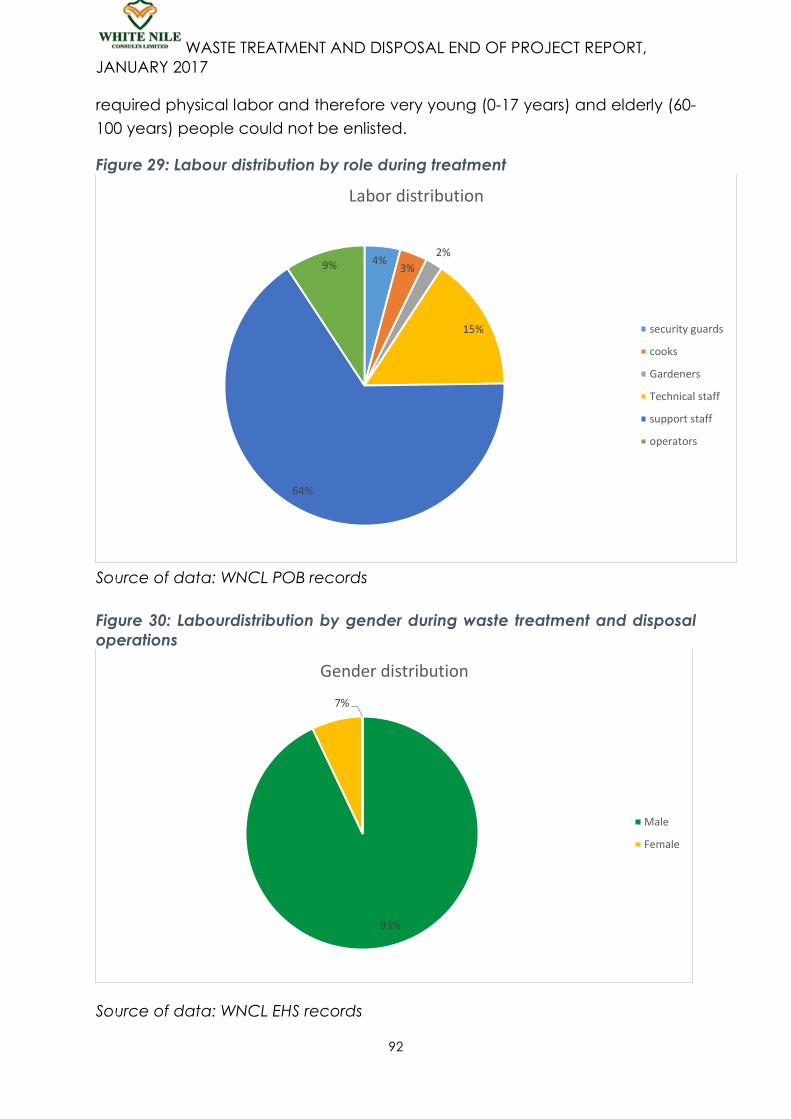
WASTE TREATMENT AND DISPOSAL END OF PROJECT REPORT,
JANUARY 2017
92
required physical labor and therefore very young (0-17 years) and elderly (60-
100 years) people could not be enlisted.
Figure 29: Labour distribution by role during treatment
Source of data: WNCL POB records
Figure 30: Labourdistribution by gender during waste treatment and disposal
operations
Source of data: WNCL EHS records
4% 3%
2%
15%
64%
9%
Labor distribution
security guards
cooks
Gardeners
Technical staff
support staff
operators
93%
7%
Gender distribution
Male
Female
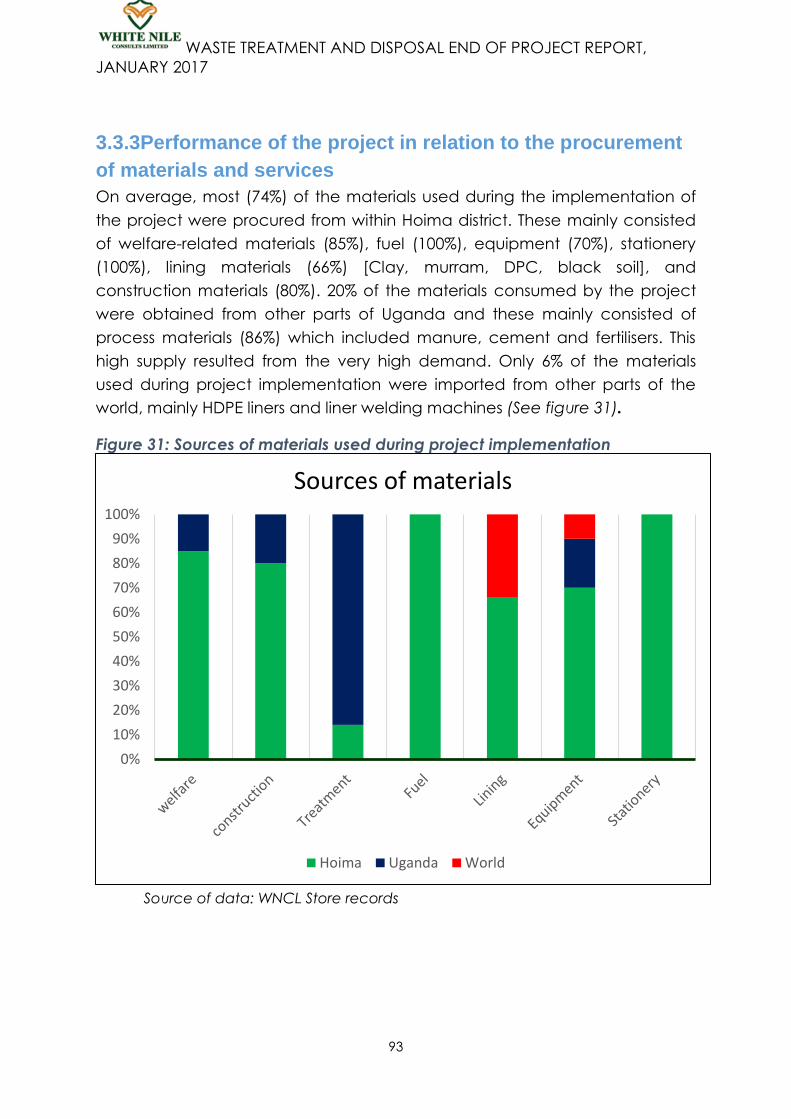
WASTE TREATMENT AND DISPOSAL END OF PROJECT REPORT,
JANUARY 2017
93
3.3.3Performance of the project in relation to the procurement
of materials and services
On average, most (74%) of the materials used during the implementation of
the project were procured from within Hoima district. These mainly consisted
of welfare-related materials (85%), fuel (100%), equipment (70%), stationery
(100%), lining materials (66%) [Clay, murram, DPC, black soil], and
construction materials (80%). 20% of the materials consumed by the project
were obtained from other parts of Uganda and these mainly consisted of
process materials (86%) which included manure, cement and fertilisers. This
high supply resulted from the very high demand. Only 6% of the materials
used during project implementation were imported from other parts of the
world, mainly HDPE liners and liner welding machines (See figure 31).
Figure 31: Sources of materials used during project implementation
Source of data: WNCL Store records
0%
10%
20%
30%
40%
50%
60%
70%
80%
90%
100%
Sources of materials
Hoima Uganda World

WASTE TREATMENT AND DISPOSAL END OF PROJECT REPORT,
JANUARY 2017
94
3.3.4 Summary of data related to the local content aspect of the
project
A summary of the data is presented in Table 29.
Table 29: Local Content monitoring report for the project
Ref Description Answer Other Comments
1.00 EMPLOYMENT
1.10 Persons are currently employed by WNCL in Uganda
1.11 Ugandan nationals
1.111 In
management
positions
5 Executive Director, Consultant, Project Manager,
Finance Manager, Human Resource manager.
1.112 In non-
management
positions
95 Technical, Operations, Admin and support staff.
1.12 Non-Ugandan nationals
1.121 In
management
positions
1.122 In non-
management
positions
2 Technical support
2.0 USE OF UGANDAN GOODS
AND SERVICES
Answer Comments
2.10 Current sourcing (in percentage) of works and services under the project
2.11 Ugandan 98% Most of the goods and services were sourced locally.
2.22 Non-Ugandan 2% Treatment equipment shipped from China.

WASTE TREATMENT AND DISPOSAL END OF PROJECT REPORT,
JANUARY 2017
95
3.4 Site monitoring aspect of project implementation
3.4.1 Environmental and social monitoring
3.4.1.1 Facility driven monitoring
To honour its own commitment and bolster its compliance to contractual and
regulatory requirement to ensure that its activities do not endanger natural
environmental and social systems; WNCL adopted and prioritized the
precautionary approach of proactively seeking to identify and hence
manage environmental and social risks and impacts in a timely fashion. In this
approach, the company accorded a significantly high degree of attention
to ensuring continual and comprehensive monitoring of the environmental
and social facets of the project, thereby constantly keeping the issues under
surveillance, using both internally and externally driven monitoring processes.
In this respect, WNCL developed an environmental and social monitoring
framework consisting of “internal” monitoring- done by the WNCL workforce,
and “external” monitoring- done by a contracted third-party arrangements,
based on respective monitoring plans.
3.4.1.1.1 Internal environmental and social monitoring
Internal monitoring activities took the form of daily and monthly inspections of
the entire facility, with focus on critical areas and physical infrastructure
around the waste treatment and disposal plant; internal audits; and
community engagements for observing social issues. The daily and monthly
inspection monitoring activities were mainly aimed at ensuring that any
discharges and defects at any part of the facility would be promptly
identified and addressed while the community engagements were meant to
facilitate early and proactive identification of any community concerns. The
inspections and community engagements were systematically based on the
monitoring plan (WNC-EHS-PLN-0026 -ENVIRONMENTAL MONITORING PLAN)
and checklists. A record of the inspections, audit and community
engagement was captured and maintained in the facility’s filing system.
3.4.1.2 External environmental and social monitoring
This was a form of environmental and social monitoring of the facility that, for
purposes of objectivity and quality assurance, was allocated to third party
agencies. This was mainly aimed at fostering processes of continuous
improvement in the state and operations of the facility. External
environmental and social monitoring consisted of two types of monitoring
processes, namely i) routine monthly monitoring (based on the plan of work

WASTE TREATMENT AND DISPOSAL END OF PROJECT REPORT,
JANUARY 2017
96
shown in Table 30) conducted by KAM International, which comprehensively
assessed water quality, air quality, soil quality, noise and social issues among
other aspects (copies of reports attached on Appendix R- Item 10); and ii)
annual environmental audits, which are a regulatory requirement. An
environmental audit of the facility was conducted by Eco and Partner
Consult (audit report submitted to NEMA in May 2016). Findings and
recommendations from these monitoring activities were used to update the
facility’s environmental and social management plans and processes.

WASTE TREATMENT AND DISPOSAL END OF PROJECT REPORT,
JANUARY 2017
97
Table 30: Work Plan for External Environmental and Social Monitoring
conducted by KAM International

WASTE TREATMENT AND DISPOSAL END OF PROJECT REPORT,
JANUARY 2017
98
3.4.1.2 Externally driven monitoring
This form of monitoring was conducted by regulatory agencies and by the
client (TUOP).
3.4.1.2.1 Regulatory monitoring
Regulatory monitoring occurred in form of regular visits and inspections by the
relevant regulatory agencies including NEMA and PEPD. These monitoring
activities were mainly aimed at assessing the progress and performance of
the project in terms of quality of the processes and environmental and social
safeguards implemented. The monitoring activities of the regulators were also
aimed supporting the facility’s and project’s compliance with regulatory
requirements and standards, and to support processes of continual
improvement of the operations and processes. Regulatory monitoring
included visits and inspection of the facility by Hoima District Local
Government authorities.
Figure 32: Regulatory and compliance monitoring of the facility and
processes
Left: A team consisting of representatives of NEMA and PEPD inspecting the facility to monitor
performance of the facility and its operations in relation to compliance with regulatory requirements
and standards and implementation of environmental and social safeguards. Right: the team
engaging WNCL personnel in a de-briefing after the inspection.

WASTE TREATMENT AND DISPOSAL END OF PROJECT REPORT,
JANUARY 2017
99
A team from Hoima District Local Government inspecting the facility and its operations
3.4.1.2.2 Monitoring of the facility and project by the client (TUOP)
Monitoring of the facility and the waste treatment and disposal activities and
process by TUOP took the form of daily visits by TUOP field team based in
Kisinja; submission of daily reports; weekly visits by the TUOP Project Team and
leadership; weekly meetings between TUOP and WNCL project teams; and
submission of daily and weekly reports. This range of monitoring activities
undertaken were aimed at maintaining a constant awareness of the progress
and performance of the project, and as a means of ensuring quality
assurance and control with respect to the processes and environmental and
social safeguards undertaken by WNCL in implementing the project.
Figure 33: Monitoring of the facility and operations by TUOP
Daily visits by TUOP field personnel
Left and center: TUOP personnel on a daily visit inspecting operations and processes during liquid
waste and solid waste treatment respectively. Right: TUOP personnel in WNCL’s laboratory to discuss
laboratory’s quality control operations and findings during a daily visit.

WASTE TREATMENT AND DISPOSAL END OF PROJECT REPORT,
JANUARY 2017
100
TUOP field team engaging WNCL workforce on various aspects of the project operations during daily
visits
Weekly visits by TUOP’s Project Team
TUOP’s Project team engaging WNCL workforce on various aspects of the project operations during
weekly visits
Below: A TUOP-WNCL weekly meeting engagement conducted during a weekly visit to the facility
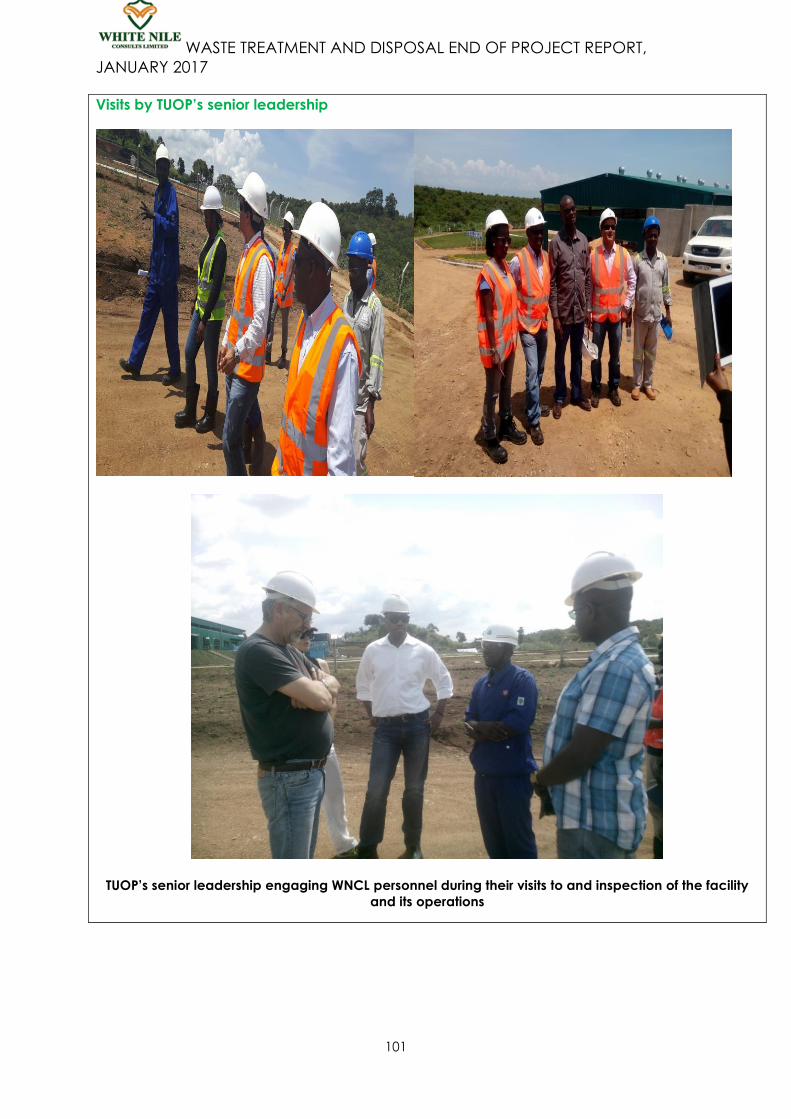
WASTE TREATMENT AND DISPOSAL END OF PROJECT REPORT,
JANUARY 2017
101
Visits by TUOP’s senior leadership
TUOP’s senior leadership engaging WNCL personnel during their visits to and inspection of the facility
and its operations

WASTE TREATMENT AND DISPOSAL END OF PROJECT REPORT,
JANUARY 2017
102
3.4.3 Process Monitoring and control
Given the hugely process-based nature of the waste treatment and disposal
operations undertaken, it was imperative that means were put in place to
ensure that constant monitoring was done so as to foster proper design and
control of the processes, and hence ensure that the outputs and outcomes
that were recorded were as desired and that areas of improvement were
identified and addressed in a timely fashion. Process monitoring was done
through scientific laboratory analyses which were conducted internally in the
field-based laboratory, and externally by third party laboratories.
3.4.3.1 Internal process monitoring
In compliance with contractual requirements, WNCL set up an internal/on-
site (field-based) laboratory to provide routine analyses meant to guide the
design and implementation of waste treatment and disposal activities and as
well to support routine internal environmental monitoring activities (water and
soil quality monitoring).
Figure 34: Experiments conducted in the Internal Lab to monitor and guide
control of waste treatment activities
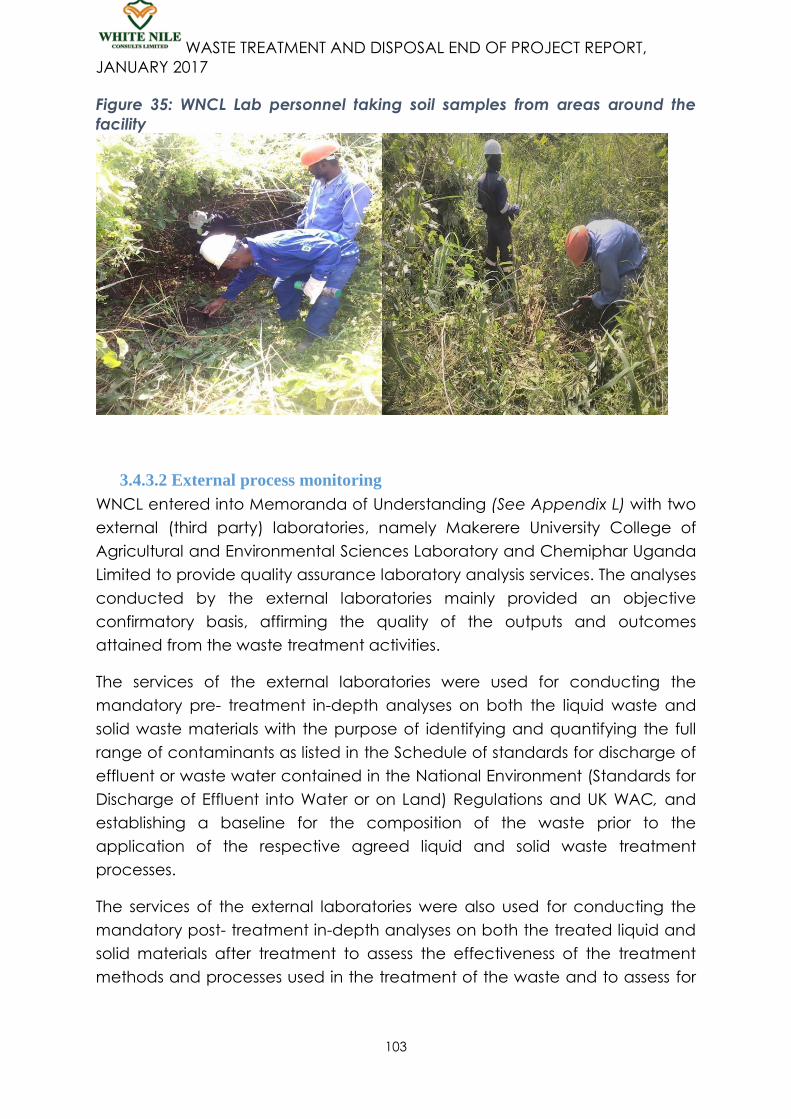
WASTE TREATMENT AND DISPOSAL END OF PROJECT REPORT,
JANUARY 2017
103
Figure 35: WNCL Lab personnel taking soil samples from areas around the
facility
3.4.3.2 External process monitoring
WNCL entered into Memoranda of Understanding (See Appendix L) with two
external (third party) laboratories, namely Makerere University College of
Agricultural and Environmental Sciences Laboratory and Chemiphar Uganda
Limited to provide quality assurance laboratory analysis services. The analyses
conducted by the external laboratories mainly provided an objective
confirmatory basis, affirming the quality of the outputs and outcomes
attained from the waste treatment activities.
The services of the external laboratories were used for conducting the
mandatory pre- treatment in-depth analyses on both the liquid waste and
solid waste materials with the purpose of identifying and quantifying the full
range of contaminants as listed in the Schedule of standards for discharge of
effluent or waste water contained in the National Environment (Standards for
Discharge of Effluent into Water or on Land) Regulations and UK WAC, and
establishing a baseline for the composition of the waste prior to the
application of the respective agreed liquid and solid waste treatment
processes.
The services of the external laboratories were also used for conducting the
mandatory post- treatment in-depth analyses on both the treated liquid and
solid materials after treatment to assess the effectiveness of the treatment
methods and processes used in the treatment of the waste and to assess for

WASTE TREATMENT AND DISPOSAL END OF PROJECT REPORT,
JANUARY 2017
104
the acceptability of the treated materials for disposal, with respect to the
said regulations.
3.4.4 Post treatment and disposal monitoring
To affirm its own commitment to identifying and addressing the impacts of its
activities on the environment and society in and around its facility, and in
compliance with contractual and regulatory requirements to ensure
continued monitoring of the facility after waste treatment and disposal
activities, WNCL developed a plan for monitoring the facility over 5 years as
required under the contract. The plan consists of a two-pronged approach
entailing i) internal monitoring which to be conducted by WNCL staff through
regular site visits; and ii) external monitoring conducted by a third party
agency, namely KAM International, which will undertake comprehensive
assessments and analyses for surface and subsurface water quality, soil
quality, air quality, social issues among other aspects, within and around the
facility as per monitoring plan presented in Appendix M.
Reports from these monitoring activities will be submitted to the client- TUOP
and to regulators (NEMA).
3.5 Project Human Resources
3.5.1 Project Team
The project was managed and implemented by a competent team
indicated in Figure36. In total 105 people were directly employed in the
project. These included staff in managerial, technical and support roles. Care
and effort were made to strategically retain all staff in the project for as long
as possible. As a safeguard, this was applied to causal staff as well; since they
had gained useful training over time and had gained a good understanding
of the project’s operations and the related safety and environmental issues.
3.6 Demobilisation The demobilization of resources that were dedicated to the project but are
not needed in the next phase of project-related activities, which consist of
monitoring, was done in accordance to the demobilization plan presented
on Appendix Q.
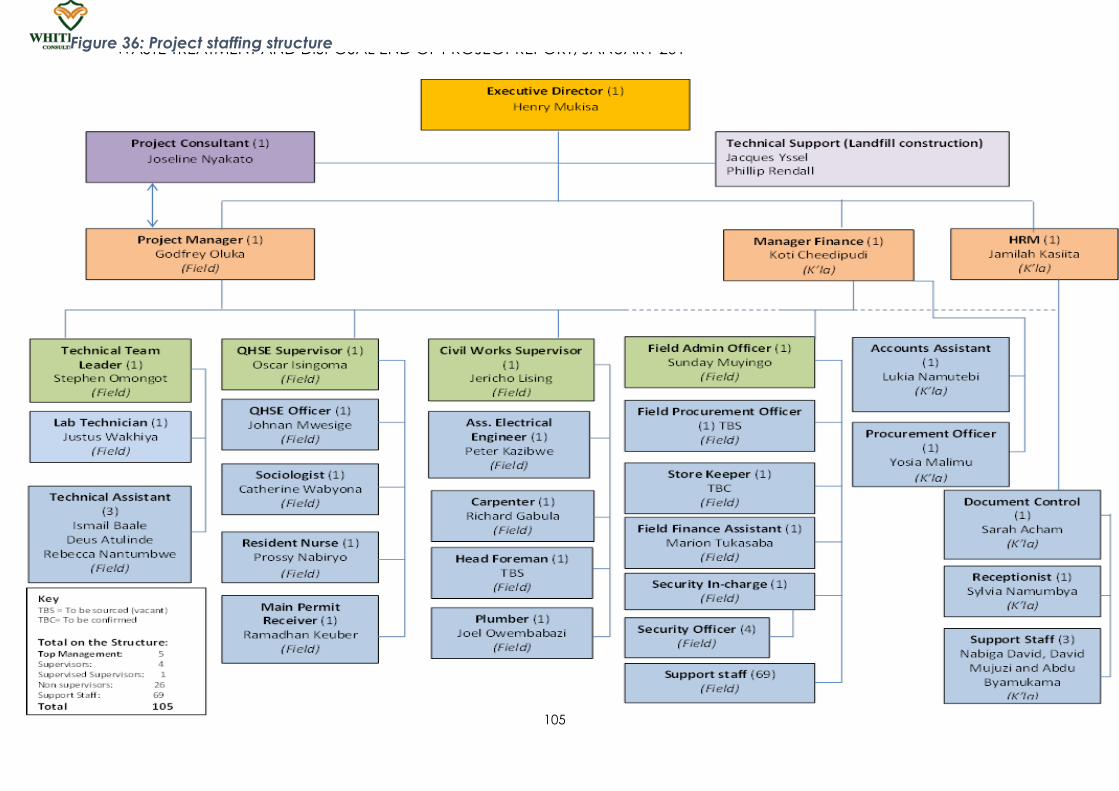
WASTE TREATMENT AND DISPOSAL END OF PROJECT REPORT, JANUARY 2017
105
Figure 36: Project staffing structure

WASTE TREATMENT AND DISPOSAL END OF PROJECT REPORT,
JANUARY 2017
106
4.0 CHALLENGES, LESSONS LEARNED AND CONCLUSIONS
4.1 Challenges and lessons learned
4.1.1 Challenges
The major challenge faced during project implementation was that of low
knowledge and understanding of the project among the communities living
in the surrounding villages. The communities initially had misconceptions
regarding the waste, with many community members perceiving that the
waste was not hazardous and could thus be dumped without treatment. This
misconception also brought forth a feeling among the communities that the
waste handling processes did not require highly skilled labour, and hence the
communities had very high expectations for employment opportunities,
thereby overwhelming the facility with requests for employment.
Alongside the high demand for employment, the local communities had very
high expectations in relation to wages for un-skilled labour as they
demanded a minimum of UGX 50,000 per day, which was high and above
the average wage paid for un-skilled labour in the country. Some of the
communities also expected the project to provide for the construction of
boreholes, schools and health centers, which was unrealistic given the short
life of the project.
The heavy rains in the months of October and November2016 caused halts
during the construction of the landfill and during the loading the loading of
treated waste into the landfill. The rains made the entrance to the landfill
unusable for the heavy equipment due to slipperiness, thereby causing lags
as more than 10 days were lost altogether. And also earlier in the same
period in 2015, rains affected transportation activities to the extent that we
had a spill which was recordable incident and led to suspension of work by
TUOP(Refer to Incident Reports on Appendix R- Item 7).
There were challenges related to the generic nature of the national
standards for the disposal of the solids, while the national effluent discharge
standards were also too generic to be fully applicable to waste water
handled in the oil and gas sector as most of the organic parameters as
stipulated in the said standards are not applicable to oil and gas sector and
were costly to analyze.
There was also an impact on White Niles original budget that did not cater for
rehabilitations of the government road. The requirement by Tullow for White
Nile to rehabilitate the road connecting from Kaiso Tonya –Hohwa (WNCL
facility) negatively impacted on the company’s cash flow. Our
recommendation on this matter is that since government is a partner in the

WASTE TREATMENT AND DISPOSAL END OF PROJECT REPORT,
JANUARY 2017
107
Oil and Gas Sector, it would be fair for the oil company to involve
government so such costs are catered for accordingly.
The other major challenge faced was on efficient and effective availability of
resources. The execution of this contract was done concurrently with other
WNCL infrastructural development. Resource allocation for contract
implementation activities encountered delays at certain times.
Under the section 4 of the contract –Compensation, TUOP required WNCL to
submit invoices with corresponding work orders numbers indicated. However
some jobs were carried out minus work orders being issued to WNCL by TUOP
and this made payment recovery impossible on WNCL’s side. It should be
appreciated that this contract was time bound and therefore need support
from both sides in order to be able to finish on time. This explains why WNCL
went ahead to execute some of the jobs minus work order. Case to mention
was work order number 4500012364 came in August 6months after the job
had been completed. Also the work order for drill cuttings treatment totaling
to 2737MT which had been treated and disposed of in December 2016 had
not yet been received by the time of completing this report in Feb 2017.
We also faced a challenge with TUOP in agreeing on waste quantities that
led to a reconciliation process which was finally settled (Refer to Appendix R-
Item 11). It was clear that the design of the scope of work did not take any
measures to obtain close to accurate quantities of waste especially rubble.
For example the scope of work “Table 1” provides estimates of waste with a
disclaimer at the bottom stating that “PLEASE NOTE THE VALUES ABOVE ARE
ESTIMATES AND SHOULD BE USED AS A GUIDE ONLY’. But later when actual
quantities for decommissioning waste were determined using the
weighbridge on site, TUOP acted uncomfortable by delaying WNCL’s work
order for this job even when the quantities were being monitored, supervised
and signed off by TUOP site representatives. This issue was partially the cause
for WNCL’s suspension on grounds of noncompliance with the contract
requirements to perform jobs with work orders only.
The other reasons for suspension of the contract also included the discomfort
that TUOP had about WNCL’s ability to complete the project on schedule.
Particularly Default Notice Ref CORP-OTHERS-LET-0437 (See copy attached in
Appendix R- Item 12): highlighted the following concerns.
(i) Failure to comply and provide an agreed project schedule
(ii) Failure to undertake the scope of work as set out in the
contract
(iii) Failure to have a completed operational facility on
accordance with the agreed and stipulated schedule
(iv) Continuous failure by WNCL to provide the requisite
resources and materials to facilitate the execution of the
scope of work including completing and having a
functional facility

WASTE TREATMENT AND DISPOSAL END OF PROJECT REPORT,
JANUARY 2017
108
Based on the above reasons, TUOP on 2nd June issued WNCL a suspension
letter (See copy attached in Appendix R- Item 13).
However WNCL addressed concerns TUOP raised in the default letter in Letter
(See copy attached in Appendix R- Item 14).
Nonetheless, the contract was completed on schedule as per contract.
4.1.2 Lessons learned and recommendations
The key lesson learned was the importance of and need for continual
engagement of stakeholders throughout the span of the project. It became
evident that there was need to continuously provide comprehensive
information and arrange visits for the community members, local leaders and
district officials to allow them to visualize the facility’s operations and the
processes implemented. This was very instrumental in addressing the
misconceptions, concerns and fears that stakeholders held. It is therefore a
recommendation that stakeholder engagement should be prioritized for all
projects especially those with significant exposure to communities so as to
ensure attainment and maintenance of social acceptability of the projects.
It emerged that due to the high demand for employment, there was need to
devise ways of ensuring and upholding fairness and transparency in
recruitment as this was useful in addressing the fears that the communities
held about the possibility of bias and inequity during recruitment exercises. It
is recommended that recruitment methods such as those based on chance
should be adopted for sourcing un-skilled labour for future projects. For
example a recruitment process was adopted in which the personnel being
recruited were assigned numbered chits which were jumbled and picked at
random, with the persons whose chits were randomly picked being taken on.
The other lessons learned were that: for projects undertaken in the area of
waste handling and management and implemented in the Hoima area, it is
important to target the dry seasons (January to March and July to October)
for the major activities so as to ensure smooth operations; and that
internationally recognized standards and guidelines as such the UK WAC and
IFC EHS Guidelines for Onshore Oil and Gas Development can be referred to
address gaps in the local standards/requirements. Thus, it is recommended
for future projects, considerations of weather conditions particularly in relation
to seasonal changes should be factored into contractual arrangements and
in planning and implementing projects. It is also recommended that NEMA is
engaged to come up with standards that are specific for the oil and gas
drilling waste management in the Ugandan context.

WASTE TREATMENT AND DISPOSAL END OF PROJECT REPORT,
JANUARY 2017
109
4.2 Conclusions All oil and gas drilling liquid and solid waste handling, treatment and disposal
activities were successfully completed in cost effective and environmentally
and socially safe ways; and in full compliance with and delivery on the scope
of work, contractual obligations, project KPIs and milestones. The waste
treatment and disposal activities were completed with the laying of a layer of
black soil over the entire top of the landfill on 22nd December 2016, ahead of
the 31st December 2016 deadline. The project has thus been declared
substantially completed, pending re-vegetation of the area over the landfill
and the 5-year post treatment environmental and social monitoring.
The findings obtained from both external and internal laboratory analyses
conducted on both the treated liquid and solid waste materials revealed
significant physical, chemical and biological characteristics of the waste,
generally indicating successful conversion of the originally hazardous drilling
waste into non-hazardous materials that were safe for disposal. This was an
indicator that the technologies, methods and processes that were applied in
handling and treating the drilling waste were effective.
The environmental, social and economic benefits that were recorded from
the re-use of materials that were recovered through the waste treatment
processes demonstrated the project’s approach of prioritizing recovery of
materials and their re-use as being an approach that needs to be promoted
since it is effective and very vital for the prevention and minimisation of
environmental and social risks and impacts from extraction of virgin materials
from the environment.
The implementation of the project was ground breaking both in the national
and regional contexts as it presented the first time the method of bio-
treatment of waste by bioremediation and re-use of recovered materials
through brick-making was being used on a large scale, with satisfactory
results and completed well on schedule. This achievement has demonstrated
d land mark for the future of the oil and gas industry in Uganda.
The project was beneficial to the Ugandan society as it delivered a range of
beneficial returns to the Ugandan population, which included:
a) Provision of employment opportunities through the entire life of the
project as the project was competently implemented majorly by
Ugandan professionals and workers.
b) Building of capacity of individuals and companies in the areas of waste
handling, transportation, treatment and disposal. The project team and
the entire oil and gas industry at large particularly benefited from
WASTE TREATMENT AND DISPOSAL END OF PROJECT REPORT,
JANUARY 2017
110
capacity building in the area of oil and gas drilling waste treatment, in
which research/laboratory experiments were undertaken to establish
the most effective and viable methods for treating oil and gas drilling
waste.
c) The creation of awareness and basic understanding of drilling waste
management through the constant engagement of a broad range of
stakeholders that was maintained throughout the project. The local
communities, local/district leaders who originally had little or no
knowledge of and many fears regarding drilling waste accessed an
opportunity to learn about such waste and the possibility and means
through which the waste could be properly treated and disposed of
without causing environmental pollution and its associated risks. This
has been useful in allaying the fears and concerns that these
populations had regarding oil and gas drilling and production
processes in general, thereby allowing them to appreciate the fact
that oil and gas production and associated activities can be
conducted very safely in the region, without necessarily endangering
the environment and people within the region and elsewhere.

WASTE TREATMENT AND DISPOSAL END OF PROJECT REPORT,
JANUARY 2017
111
BIBLIOGRAPHY
Ajmal et al, (1996).Studies on removal and recovery of Cr (vi) from
electroplating wastes. Water Res 30-1478-1482.
Robert, E. Pettit. (1989). Organic matter, Humus, Humic acid, Fulvic acid, and
Humin: Their importance in soil fertility and plant growth
Khan A.G.(2005).Role of soil microbes in the rhizospheres of plants growing on
trace metal contaminated soils in phytoremediation.
Paria, S., and Yuet, P.K. (2006). Solidification-stabilisation of organic and
inorganic contaminants using Portland cement: literature reviews 14(4), 217-
255.
White C., Sharman A.K., and Gadd G.M.(2006).An integrated microbial
process for the bioremediation of soil contaminated with toxic metals.
Yilmaz O., Unluk, and Cokca E. (2003).Solidification/stabilisation of hazardous
wastes containing metals and organic contaminants. “Journal of
environmental engineering-ASCE, 129(4), 366-376”
WASTE TREATMENT AND DISPOSAL END OF PROJECT REPORT,
JANUARY 2017
112
APPENDICES
Appendix A: Project Key Performance Indicators
Appendix B: Project Workplan/Schedule
Appendix C: Project Cost Report
Appendix D: Waste Transfer Records
Appendix E: Final treated water sampling test certificate from the external
laboratory
Appendix F: Bio-platform monitoring report
Appendix G: Determination of Bulk Density of the Solid waste material
Appendix H: Soil Analysis Certificates for the bio-treated compost
Appendix I: List of standards for solid waste disposal (UK WAC and NEMA) as
stipulated in the contractual S cope of Work
Appendix J: Solidification/Stabilisation Trial Model Report
Appendix K: License of Hazardous waste handler, Certificate of Destruction
of contaminated polythene materials segregated from the drilling solid
waste, and waste transfer notes
Appendix L: Memoranda of Understanding between WNCL and certified
laboratories
Appendix M: 5-Year Post Treatment and Disposal Monitoring Plan
Non-compliance with monitoring requirement; corrective remedial action is
essential
Partial compliance with monitoring requirement; preventive action
needed
Compliance with monitoring requirement; preventive action required
Appendix N: Management of Change Forms
Appendix O: Risk assessment for liquid waste treatment
Appendix P: Risk Assessment for treatment of the solids
Appendix Q: Demobilisation Plan
Appendix R: Other Supporting Documents