Oil and Gas: a Blessing for Few. Hydrocarbons and Inequality
30
1 Oil and Gas: a Blessing for Few. Hydrocarbons and Inequality Within Regions in Russia TULLIO BUCCELLATO AND TOMASZ MICKIEWICZ (forthcoming in “Europe-Asia Studies”, 2009) Abstract Building on earlier work on regional inequality in Russia the article seeks to demonstrate that the regional oil and gas abundance is associated with high within-region inequality. It provides empirical evidence that hydrocarbons represent one of the leading determinants of an increased gap between rich and poor in the producing regions. The discussion focuses on a possible cluster of geographic, economic and political factors underlying the phenomenon. SINCE 1999, GROWTH IN RUSSIAN GDP HAS BEEN ACCOMPANIED BY CONTINUED high levels of inequality. 1 Russia is now characterised by more dramatic social differences than most of the other transition economies. The inequality has stabilised at a level comparable to some countries in Latin America, like Venezuela, in Africa, like Nigeria and in the Middle East, like Iran (all net oil exporters). Among possible causal factors, revenues from hydrocarbons seem to have played an important role in affecting the heterogeneity of incomes across the population. Oil and gas, as with other natural resources, represent an easily appropriable and excludable source of wealth. The privileged, who have gained access to oil and gas revenues, have enjoyed a disproportionate increase in their living standards, enlarging the gap with the rest of the population. In this article, we investigate the hypothesis that growth led by natural resources could be associated not only with the widening in differences of living standards across Russian regions but also within regions. In particular, we demonstrate that regions rich in oil are characterised by a higher level of income inequality. We also discuss possible geographic, economic and political explanations for this phenomenon. We argue that some theoretical intuitions drawn from cross-country comparisons may also apply to the cross-regional comparisons, given the geographical, economic and social diversity and the federal character of Russia. 2 In particular, some of the theoretical explanations linking the We would like to express our gratitude to Michael Bradshaw, Peter Duncan, Bassam Fattouh, Christine Fernandes, Christopher Gerry, Carol Leonard, Pasquale Scaramozzino, Paul Segal, Laixiang Sun, Victor Winston and the seminar participants at the Oxford Institute of Energy Studies, University of Oxford, and the School of Oriental and African Studies, University of London for valuable comments and criticism. All remaining errors are ours. 1 Over the period 2000-2006 the income-based Gini index had remained at the level of 0.40-0.41 (Source: Goskomstat, Statistical Yearbook of Russia, 2006). See also Svedberg et al. (2006). 2 Popov (2001) makes a similar argument.
Transcript of Oil and Gas: a Blessing for Few. Hydrocarbons and Inequality

1
Oil and Gas: a Blessing for Few. Hydrocarbons and Inequality Within Regions
in Russia
TULLIO BUCCELLATO AND TOMASZ MICKIEWICZ
(forthcoming in “Europe-Asia Studies”, 2009)
Abstract
Building on earlier work on regional inequality in Russia the article seeks to demonstrate that the regional oil and gas
abundance is associated with high within-region inequality. It provides empirical evidence that hydrocarbons represent
one of the leading determinants of an increased gap between rich and poor in the producing regions. The discussion
focuses on a possible cluster of geographic, economic and political factors underlying the phenomenon.
SINCE 1999, GROWTH IN RUSSIAN GDP HAS BEEN ACCOMPANIED BY CONTINUED high levels of inequality.1 Russia is
now characterised by more dramatic social differences than most of the other transition economies. The inequality has
stabilised at a level comparable to some countries in Latin America, like Venezuela, in Africa, like Nigeria and in the
Middle East, like Iran (all net oil exporters). Among possible causal factors, revenues from hydrocarbons seem to have
played an important role in affecting the heterogeneity of incomes across the population. Oil and gas, as with other
natural resources, represent an easily appropriable and excludable source of wealth. The privileged, who have gained
access to oil and gas revenues, have enjoyed a disproportionate increase in their living standards, enlarging the gap with
the rest of the population.
In this article, we investigate the hypothesis that growth led by natural resources could be associated not only
with the widening in differences of living standards across Russian regions but also within regions. In particular, we
demonstrate that regions rich in oil are characterised by a higher level of income inequality. We also discuss possible
geographic, economic and political explanations for this phenomenon. We argue that some theoretical intuitions drawn
from cross-country comparisons may also apply to the cross-regional comparisons, given the geographical, economic
and social diversity and the federal character of Russia.2 In particular, some of the theoretical explanations linking the
We would like to express our gratitude to Michael Bradshaw, Peter Duncan, Bassam Fattouh, Christine Fernandes, Christopher Gerry, Carol Leonard, Pasquale Scaramozzino, Paul Segal, Laixiang Sun, Victor Winston and the seminar participants at the Oxford Institute of Energy Studies, University of Oxford, and the School of Oriental and African Studies, University of London for valuable comments and criticism. All remaining errors are ours. 1 Over the period 2000-2006 the income-based Gini index had remained at the level of 0.40-0.41 (Source: Goskomstat, Statistical Yearbook of Russia, 2006). See also Svedberg et al. (2006). 2 Popov (2001) makes a similar argument.
2
presence of subsoil hydrocarbons with differences in within-country inequality may also apply to differences in within-
region inequality.
In the economic literature, the role of oil, gas, and—more generally—of natural resources has been broadly
discussed as having an ambiguous impact on economic prosperity, development and long-run growth (Corden & Neary
1982; Eastwood & Venables 1982; Corden 1984; Sachs & Warner 2001; Davis & Tilton 2005). While, positive effects
of natural resource endowment on growth are likely (Sala-i-Martin et al. 2004), this may not always be the case, and
more importantly the gains from growth may not be equally shared. There are several factors that may induce the latter
phenomenon. Boom in the hydrocarbons sector may affect other sectors negatively, including the shift of investments
towards traded natural resources and non-tradable sectors preventing diversified economic growth.3 High concentration
of rents in the hydrocarbons sector, where not accompanied by efficient institutions and government policy, may result
in a skewed distribution of income (Davis & Tilton 2005). In addition, natural resource abundance may stimulate rent-
seeking behaviour that, together with highly concentrated bureaucratic power, induces corruption in the economy and
hence, lowers the quality of institutions (Leite & Weidmann 1999; Davis & Tilton 2005). The latter may enhance
income inequality via its negative effect on entrepreneurial entry (Gylfason & Zoega 2002). This strand of the literature
demonstrates that focus on the link between natural resource endowment and inequality is important not only because
the question itself matters, but also because inequality may have implications for other aspects of economic
development, including poverty.4
In this article we are interested to which degree some of these country-level phenomena are applicable to the
regions of Russia. We focus on the local effects of oil and gas, that is, we investigate if their presence results in a less
equal income distribution within the Russian regions. We achieve this aim by an empirical analysis. We establish that
the link between oil and inequality as seen in the cross-country perspective has its counterpart in a similar link
detectable in Russia.
Economic transition in Russia has caused shifts in allocation of wealth and resources both across (or between)
regions and among (or within) their population. The former aspect of inequality has been investigated by several
authors including Fedorov (2002), and Bradshaw and Vartapetov (2003). Here, we focus on the determinants of the
latter aspect, on the factors affecting within-region dimension of inequality. We divide the regional populations into five
income quintiles and use the shares in income of each of those in our analysis. We find oil and gas play a prominent and
significant role in the process of wealth redistribution and accumulation within the Russian regions. The next section
3 Also, given the international volatility of resource prices, the resource-based economy may ultimately be likely to suffer seriously in the case of price shocks (Sachs & Warner 2001). 4 On the impact of inequality on poverty in Russia, in regional perspective, see Kolenikov and Shorrocks (2005). However, due to data limitations their estimations are based on one year only.
3
summarises briefly some relevant literature concerning the issues of inequality and hydrocarbons resources, mainly
referring to the Russian post-transitional experience. In the following section we move towards the econometric
analysis and present the dataset used, variables included and results obtained.
Hydrocarbons and inequality in Russia
Oil and gas played an important part in Russian economic performance far before the beginning of transition.
Hydrocarbons were a primary source of economic prosperity throughout the Soviet period. Oil production was already
at a level of approximately 25 million barrels by 1920, and in the year 1987-1988 it peaked at 4.5 billion barrels,
making the USSR the largest oil producer in the world. However, the early 1990s were characterised by a marked
inefficiency in oil management in Russia. As a result of that, but also of the separation of some oil-producing former
Soviet republics, production dropped back to third place among in the world, behind Saudi Arabia and the United States
(Considine & Kerr 2002).
It is more controversial to assess how much inequality there was in the Soviet era and to what extent it was
linked to the natural resource endowment. Generally, during Soviet times, a very small share of incomes was derived
officially from rents, as private property of natural resources and capital was almost non-existent (Milanovic 1998). On
the one hand, this limited the impact of natural resources on inequality; on the other, the lack of private ownership
rights facilitated enormous transfers of wealth from the extracting regions to the population centres in the European part
of the country. Nevertheless, during the Soviet period, the production of oil and gas shifted gradually both to the east
and to the south, and this has been seen as having a positive impact on equalisation of average income between the
Soviet republics (but not necessary within republics), via new investment and improved technical and social
infrastructure (Liebowitz 1987; Nechemias 1980).5 Commander et al. (1999) argue that Russia entered the transition
period already with a significantly high level of inequality, which has then further increased as a result of the wealth
transfers realised through privatisation (especially in the energy sector), changes in government expenditure and the
growth in earnings dispersion.
Between-region disparities in oil and gas production and between-region income inequality in Russia
5 However, it is far from obvious to what extent the shift towards the east (to Siberia and the Russian Far East) represented an efficient development path. The Soviet Union’s central planners did not have effective optimisation criteria at their disposal. The geographical allocation of investment was disputed during the Soviet period (Schiffer 1985).

4
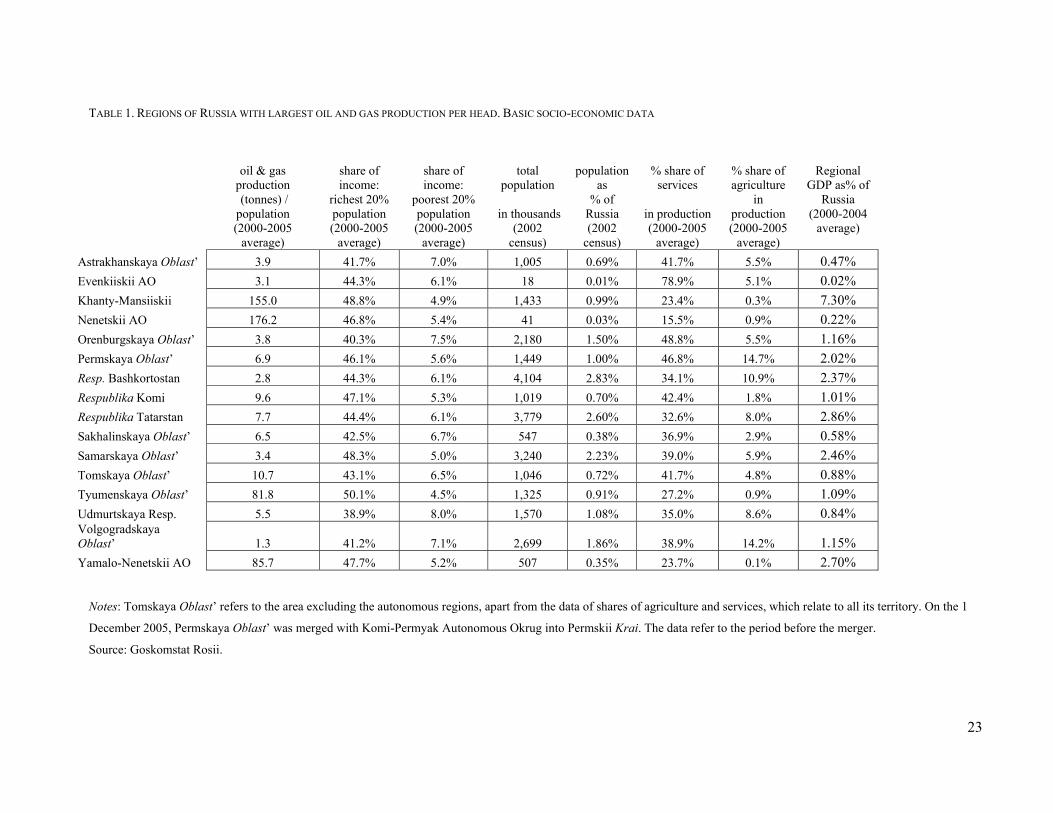
Below, we present location data (Figure 1) and basic economic and social data (Table 1) of the 16 Russian
regions with the largest oil and gas production per head. These are concentrated in the central part of Russia, along both
sides of the Ural, with some extension towards the south, and Sakhalin in the Far East. Western Russia has no
hydrocarbons. The largest producers per head are the Nenetskii Autonomous Okrug and the sub-regions of the Tyumen
Oblast’ (Yamalo-Nenetskii AO, Khanty-Mansiyskii AO). It is also in the Tyumen oblast’ that we find the highest
values of the indicators of inequality. Below, we discuss briefly some of the key contributions on between-region
inequality and polarisation in Russia.6 Next, we will turn to the ‘within’ dimension concerning the heterogeneous
impact of oil and gas on income groups within the regions that has not been explored much in the existing literature.
[Please insert Figure 1 and Table 1 about here]
Regional inequality across Russian regions may be explained using an array of factors. Fedorov (2002)
considers polarisation between Western and Eastern regions, specificity of the national republics and ethnic Russian
oblasti, comparison between urbanised and rural areas, and finally the role of the export orientation and economic
openness of the regions. Using a dataset provided by Goskomstat Rosii, Fedorov (2002) carries a multidimensional
analysis of inequality across Russian regions over the period 1990-1999. He confirms a continuous increase of
inequality over the period 1991-1996. After 1996 the upward inequality trend became less steep and even reversed
slightly in 1998. He establishes that between-regional differences were increasing due to the fact that both urbanised
and exporter regions had grown faster in comparison to closed rural areas.
However, given the structure of Russian exports, exporting is the dimension which is closely related to the
natural resource endowment. The share of hydrocarbons in total exports started from a level of 32% in 1998 and
constantly increased until it reached 49.2% in 2003 (Gurvich 2004). Its share in merchandise exports reached over 60%
in 2006 (Hanson 2007; OECD 2006). Also the ratio of hydrocarbons exports to GDP has been very high: it ranged from
10.4% in 1998 to 17.1% in 2003. These figures are probably underestimated. According to the World Bank (2004) a
consistent part of gas and oil revenues is misattributed to wholesale trade in order to escape taxation (Bradshaw 2006).
Bradshaw and Vartapetov (2003) confirm that inequality assumes a strong geographic connotation, with poorly
performing regions facing problems in ensuring minimum living standards. Such a situation could be alleviated by the
intervention of the central state administration smoothing the differences. However, state intervention has been
6 For the discussion on the differences between the concepts of regional inequality and regional polarisation, see Fedorov (2002).
5
insufficient. The allocation of federal assistance funds has not been based on clear principles, and this has allowed the
development of a system of lobbying activities. In particular, the introduction of the Fund for Financial Support of the
Regions (FFSR) in the mid-1990s failed to alleviate the spatial dimension of inequality. During the 1990s, the lack of
economic and social logic in fiscal transfers between the federal government and the regions resulted from the chaotic
nature of ad hoc compromises between the federal government and the regions, with national republics (such as
Tatarstan, Bashkortostan and Yakutiya) being the key winners (Hahn 2005; Yenikeyeff 2008; Treisman 1998).
Using data provided by Goskomstat Rossii, Bradshaw and Vartapetov (2003) find for 1990-2001 that standard
deviation in income falls sharply as one drops from the city of Moscow and the Tyumen region (the richest regions) and
Ingushetia (the poorest). Similarly, for consumption, there was an increase in inequality led by prosperous regions such
as Moscow, Samara, Tyumen, Perm and Lipetsk. In contrast, the spatial distribution of social and infrastructure
indicators remained more equal.
Starting with the discussion of Russia in terms of the resource-based economy, Bradshaw (2006) discusses the
role of the production of oil and gas and its regional aspects. Already during the Soviet era, natural resource rents were
diverted from the oil and gas producing regions towards the European part of the Soviet Union. The implementation of
this redistribution process was realised through the imposition of low prices on natural capital and high prices on
machine capital. The hard currency inflows generated by the trade of natural resources were concentrated in the capital
Moscow, to be then allocated strategically to the military industrial complex and to be used in exchange for grain and
Western technologies to compensate for the failings of domestic agriculture and innovation processes correspondingly.
On the other hand, in the producing regions, the development of oil and gas was implemented ‘at the expense of socio-
economic infrastructure, not to speak of the environment, resulting in an extremely lopsided regional economy’ (Glatter
2003, p.402). More importantly, a similar mechanism of regional relocation of rents can be detected after the transition,
both by use of transfer pricing and through the taxation mechanism, where revenues are not channelled back to the
regions of origin: ‘the transfers involved are far more significant than any equalization payments through the fiscal
federal structure’ (Bradshaw 2006, p. 742).
Gaddy and Ickes (2005) explore the network of informal rent sharing, which developed around the
hydrocarbons production and trade. There is no exact information on the true value of hydrocarbon rents and on the way
they are redistributed. Both during the Soviet Era and after the transition to market economy, one of the main
characteristics of value distribution has been non-transparency. An important channel of informal rent sharing is
represented by corruption, which takes the form of a tax system parallel to the official one (Dininio & Orttung 2004).
Furthermore, the constant and wide gap between the domestic and international price of natural resources has
contributed to the development of a complex price subsidies system. Companies also distort extraction cost to avoid
6
formal taxation and use various forms of transfer prices to channel wealth away from where it could be taxed at source.
Until the early 2000s, the oil companies were also highly effective in influencing the tax law for their benefit (Fortescue
2006; Yenikeyeff 2008).
Spatial dimension plays a major role in enhancing inequality in Russia. In general, among transition
economies, the territorial extension has been found to be positively correlated with the level of inequality (Gerry &
Mickiewicz 2008; Bradshaw 2006): the larger the extension of a country, the higher the impact of regionally specific
effects on income distribution. Thus, it is not surprising that in Russia the regional patterns of GDP per capita diverged
dramatically from the beginning of the 1990s (Buccellato 2007).
It is interesting to compare the nature of regional disparities in Russia with the other two major emerging
economies: India and China. As with Russia, in the past they experienced a significant dose of central planning, where
the role of communist parties or left-orientated governments was dominant. All the three countries were characterised
by significant disparities between regions. One common feature has been the increasing gap dividing rural and urban
areas. In India and China, a great divide has been also arising between landlocked regions and coastal ones with the
latter adapting better to the increased exposure to international markets. For Russia, as already discussed, natural
resources have played a more significant role, affecting divergence in terms of both economic performance across
regions and the disparities in income.
Within-region inequality: rent seeking and political corruption
According to Svedberg et al. (2006), the dimensions of within-region inequality exceed the between-regional
dimensions. Moreover, marginally high or low average indicators computed at regional level can mask significant
inequality on the lower level. For instance, the Tyumen region, which hosts much of the oil and gas administration, has
a low average poverty rate (12%), but in its southern, rural part, the poverty rate increases to 18% (UNDP 2007).
As discussed above, in the cross-country context, it has been found that large endowments of natural resources
tend to go hand in hand with rent seeking behaviour. The natural resource sector is usually protected by huge barriers to
entry, which leads to the strong position of producers. Where formal institutions are weak, high hydrocarbon-related
rents may fuel corruption (Dininio & Orttung 2004). In the Russian case, in the hydrocarbons-rich regions, the power
struggle was typically limited to a few key players within the local oligarchy. After the initial wave of democratisation
in the early 1990s, the position of members of the political elite was increasingly defined by their relation to productive

7
assets in the hydrocarbons sector (Glatter 2003).7 As documented by Glatter (2003) for the Tyumen Regional Duma, in
1990-1993, 23% of seats were taken by employees and workers, 23% by professionals, 29% by economic leaders and
middle level managers and 10% by administration officials. By the period 1997-2001, the representation of the first two
groups had fallen to zero, and the representation of ‘economic leaders’ increased to 40% and of local administration to
20%. A strong representation of big business in local institutions was also typical for other regions (Sakwa 2008).
While the recentralisation programme implemented in Russia in the early 2000s led to a loss of influence by
regional leaders at the federal level, those local politico-economic elites that were co-opted by the Kremlin consolidated
their position on the local level. ‘As Russian critics of the [recentralisation] plan have pointed out, only partly
facetiously, there are not enough KGB operatives from 1980s Leningrad to fill 89 top posts. … Putin has ceded to
regional leaders much leeway to run their regions as they see fit’ (Slider 2005, pp. 183-184).8 As noted by Svedberg et
al. (2006), ‘[S]ince September 2004 new gubernatorial appointments were made in 35 regions. In most cases, the
governors have been appointed for a third or even fourth term, meaning that the new scheme has allowed them to
bypass the two-term limit that existed under the previous system’ (Svedberg et al. 2006, p. 10). This pattern implies
more stability in the local political and economic structures of power and their increasingly undemocratic character.
To summarise the argument, we posit that local economic structures dominated by oil rents endowed business
elites with enormous resources for forming the ‘mutual hostages’ structures with the state administration and for the
corresponding distortion of democratic processes. That enabled big business to protect its economic interests. The only
change in the 2000s was that the economic power was typically consolidated in the hands of federal corporate groups to
cost of the regional corporate groups, many of which lost their autonomy (Yenikeyeff 2008). Evidence provided by
Svedberg et al. (2006) shows that Khanty-Mansi Autonomous Okrug, which is the main centre of the Russian oil
industry, takes fourth place on the regional list of state capture,9 and the neighbouring Tyumen region, where the oil and
gas administration offices are located, takes the first place. Tyumen moved up to the top of the list in 2003, from a
relatively low position in the mid-1990s.
One of the key channels through which state capture affects income distribution is through its detrimental
effects on entry and entrepreneurship. Preferential treatment of big players comes at cost of smaller firms and the new
7 A well-publicised case of an oil oligarch who became a governor of one of the Russian regions (Chukotka) was that of Mr Roman Abramovich, who was also one of the two controlling shareholders of Sibneft (with Boris Berezovsky), before the sale of the company to Gazprom in September 2005. 8 See also Yenikeyeff (2008) 9 State capture is defined as the situation in which outside interests are able to shape state institutions and policies to their advantage through corrupt transactions with public administration and politicans. It can be measured by preferential treatment obtained by firms: “tax breaks, investment credits, subsidies, subsidised loans, loans with a regional budget guarantee, official delays in tax payments, subsidised licencing free grants of state property, and special “open economic zone” status.” (Svedberg et al., 2006, p.25). The results discussed here are based on an earlier empirical study by Yakovlev and Zhuravskaya (2004).

8
entrants in particular. In turn, low entry of new firms implies that an important escape route out of low-income/poverty
traps via new employment and self-employment is closed (Berkovitz & Jackson 2006). In addition, there is no demand
for labour and no wage competition from new entrants, which could have additional positive effects on incomes. Low
entry coupled with a trend towards recentralisation is also very typical for the oil and gas industry in 2000s (Kryukov &
Tokarev 2007). The negative association between entry and state capture for Russian regions is documented by
Yakovlev and Zhuravskaya (2004).
In general, income distribution is shaped by the way the political process modifies both the primary economic
distribution and the secondary income flows. The empirical link between authoritarian political structures and income
inquality is documented for transition economies in cross country perspective by Gerry and Mickiewicz (2008). They
arue that the authoritarian political structures are linked to non-competitive economic structures and that the latter
inrease income inequality. A similar mechanism is likely to be found in the regional Russian perspective.
Within-region inequality: labour market effects
The political argument is directly connected with the economic one. Russia inherited a very concentrated industrial
apparatus from the Soviet period and a difficult, protracted and painful process of reallocation of labour from obsolete
industries to more profitable new ones followed the transition. In particular, the Stalinist centrally planned system
implied the allocation of blue-collar workers and engineers to isolated mono-structural regions. In sharp contrast, the
transition brought more dynamism into the metropolitan areas. Crucially, scarce inter-regional labour mobility coupled
with regional protectionist policies impeded a natural process of arbitrage, making regional factor endowment
predominant in shaping wage disparities. The competition in some sectors remained inadequate, especially where
privatisation was not coupled with emergence of new entry businesses, and the local structures were dominated by one
sector, hydrocarbons in particular (Glatter 2003). This situation led to forms of local monopsony in the labour market
(Svedberg et al. 2006; Bignebat 2003). With respect to the oil and gas industry, the process of concentration and
increasing entry barriers led to the spatial segmentation of production, where different companies enjoyed quasi-
monopolies within their respective territory of operation in the 2000s (Kryukov & Tokarev 2007). Oil companies enjoy
a monopsony position in recruiting labour, placing workers in a situation of dependency and weak bargaining power.
This is an important factor which helps to explain why the local population is not sharing in the rents generated by the
extracting industry as a result of direct, primary income distribution. In general, monopsony power leads to the
persistence of wage differentials representing an important component of inequality (Bignebat 2003; Kislitsyna 2003).
The factors contributing to this situation include low mobility of labour within the Russian borders, due to the high cost
of migration (including administrative costs), lack of financial liquidity amongst workers and underdeveloped housing
9
markets. In addition, local large firms provide fringe benefits and in-kind payments, which can ‘be explained as an
attachment strategy of firms: paying wages in non-monetary forms makes it hard for workers to raise the cash needed
for leaving the firm/region’ (Svedberg et al. 2006, p.14-15). Low mobility also affects high-skilled workers, and as a
result, the regional labour market may exhibit characteristics of segmented labour markets, where the shortage of high-
skilled workers coupled with an abundance of low-skilled workers leads to wage inequality (Svedberg et al. 2006).
Given the technological characteristics of the oil and gas industry and its organisational structures that emerged from
the process of consolidation in the 2000s, local outcomes of this nature are likely.
To shed some further light on the monopsony issue we carry out a comparison between two of the most
important Russian companies—Gazprom and Rostelecom, both operating in sectors characterised by large rents
(hydrocarbons and telecommunication). Controlling more than 60% of Russian gas reserves and 84.7% of national gas
production, Gazprom alone accounted for 10.6% of Russian GNP in 2006 (source: Gazprom in figures 2002-2006;
http://www.gazprom.com/documents/Stat_Report_Eng.pdf; and Gazprom’s Financial Reports
http://www.gazprom.com/eng/articles/article20163.shtml). Rostelecom is the country’s leading fixed-line
telecommunications company, one of the biggest telecommunication companies in Russia, and operates nationwide
with a network reaching approximately 200,000 kilometres in length (Source: Rostelecom’s Financial Reports;
http://www.rostelecom.ru/en/centr-invest/financial/public/).
Based on the financial statements of the two companies over the period 2002-2006, it clearly emerges that the
share of profits in value added as compared with the corresponding share of wages is much higher in Gazprom. In the
case of Rostelecom the wages cost is always higher than the amount of gross profits. That amounts to a striking inter-
sectoral difference, which is further reinforced by the differences in the internal composition of wage expenses, in terms
of the share of the remuneration of senior management and directors in the total amount of wages and salaries. Over the
period 2002-2006 this share ranged from 0.6% to around 2.4% for Rostelecom and from around 10% to approximately
13% for Gazprom, implying a much lower share for workers in comparison with the management apparatus in value-
added in the hydrocarbons sector (Figure 2).
[Please insert Figure 2 about here]

10
Redistribution
Disparities generated in the labour market could be offset by redistribution through the tax system and government
expenditure. Due to the general increase of international hydrocarbon prices before the reversal of the trend in 2008,
revenues from custom duties strongly increased in the early 2000s and, as a result, their share in total revenues went up
from 7.1% in 1999 to 15.8% in 2004 (Ellman 2006). While oil price growth amounted to 191% between 2002 and 2007,
the corresponding growth in custom duty was 982%. A parallel growth in tax on mineral production between 2002 and
2007 amounted to 353% (Kryukov & Tokarev 2007). Hydrocarbon revenues have been targeted for the creation of the
so-called stabilisation fund, set up to prevent a new financial crisis similar to the one experienced in August 1998. In
January 2006 the stabilisation fund reached a total of 1,459.1 billion rubles (Ellman 2006, p.41-43).
DeBardeleben (2003) has considered the balance of financial flows between the regions and the centre (the
difference between the total amount of tax revenues collected in the regions and expenditure of the regional
government) in four different regions (Stavropol’skii krai, Orlovskaya Oblast’, Nizhegorodskaya Oblast’ and Khanty-
Mansiiskii Autonomous okrug) over the period 1996-1998. The region of Khanty-Mansiiskii Autonomous okrug, which
is the main centre of the Russian oil industry, contributes far more to the federal budget than the three remaining
regions. However, despite the relevant amount of tax revenues generated by the hydrocarbons sector, it is not clear how
they are redistributed, especially across regions. Performing an ordinary least square regression with robust standard
errors on a cross-section of 87 Russian regions for the year 2005, we find an insignificant negative relation between
average monthly transfers to households per capita and percentage of people living under the poverty threshold (Figure
3). These results seem to suggest that the fiscal transfers are not targeting the poor, and are therefore not decisive in
reducing the gap separating the richest and the poorest, which is likely to be the highest in hydrocarbons producing
regions due to the economic and political factors discussed above.
[Please insert Figure 3 about here]
To summarise, we posit the following. The distribution of income both between and within regions is strongly
affected by the rents generated by hydrocarbons extraction and trade, which are supported by the economic and political
structures. The distributional effects are partly driven by the technological characteristics of the extraction processes,
where capital-intensive firms create pockets of limited numbers of well-paid jobs. However, they are enhanced by the
monopsonistic position of these companies against both the bulk of their workers and the local labour force, from which
the employees are drawn. The strong local position of these companies is protected by the dominant position of the key
big business players in the political structures.
11
In addition, a significant part of resource rents is transferred away from the extraction region, leaving less to be
shared directly with local communities. This would not be a problem per se, and could even be welcomed if federal
spending were to compensate for the local distortions. However, existing evidence demonstrates that while the
government share in the oil and gas rents has been on the increase, it has not been accompanied by well-targeted social
transfers, which could return to the communities some of the wealth from the actual physical resources in their
neighbourhood. Taking all these factors together, we can explain the paradox, which is that the regions where the oil
and gas resources are located, are also characterised by the more extreme social contrasts.
The literature provides cross-country evidence that oil and gas endowment is associated with an increase in
inequality, and the same factor may play a significant role in the cross-regional perspective for Russia. Accordingly, we
intend to establish empirically whether, in addition to the dimension of hydrocarbons-driven inequality between regions
in Russia, we also see an increase in inequality within the regions of extraction. In the next section we introduce the
empirical methodology we wish to implement for this purpose.
Hydrocarbons and inequality in the Russian regions
Measuring inequality between and within Russian regions
Inequality is a multidimensional concept. It includes a wide range of aspects, such as wealth, consumption, access to
health, education and other public services. However, any empirical analysis is always limited by the availability of data
and in our study we use the broadest and the most used concept of inequality, concerning divergence in income levels.
We first construct a bi-dimensional measure of inequality between and within regions to demonstrate the role played by
oil and gas. To measure inequality between regions we use the Theil Statistic. We take the logarithm of the ratio of the
average regional income to the average income in the country (which is a relative measure of income gap between a
given regional average and the country average; see the first term in the formula below). This is multiplied by the ratio
of the average regional income to the average income (which can be considered as a proxy of the average share in
country income; see the second term below). Finally, we multiply it by the share of each region’s population in the
Russian population as a whole (to capture the importance of regional contribution to the overall inequality in Russia;
see the third term below). Correspondingly, the formula is:
PopulationTotalPopulationgion
IncomeCountryAverageIncomegionalAverage
IncomeNationalAverageIncomegionalAverageTheil
__Re
___Re_
___Re_ln ××
=
12
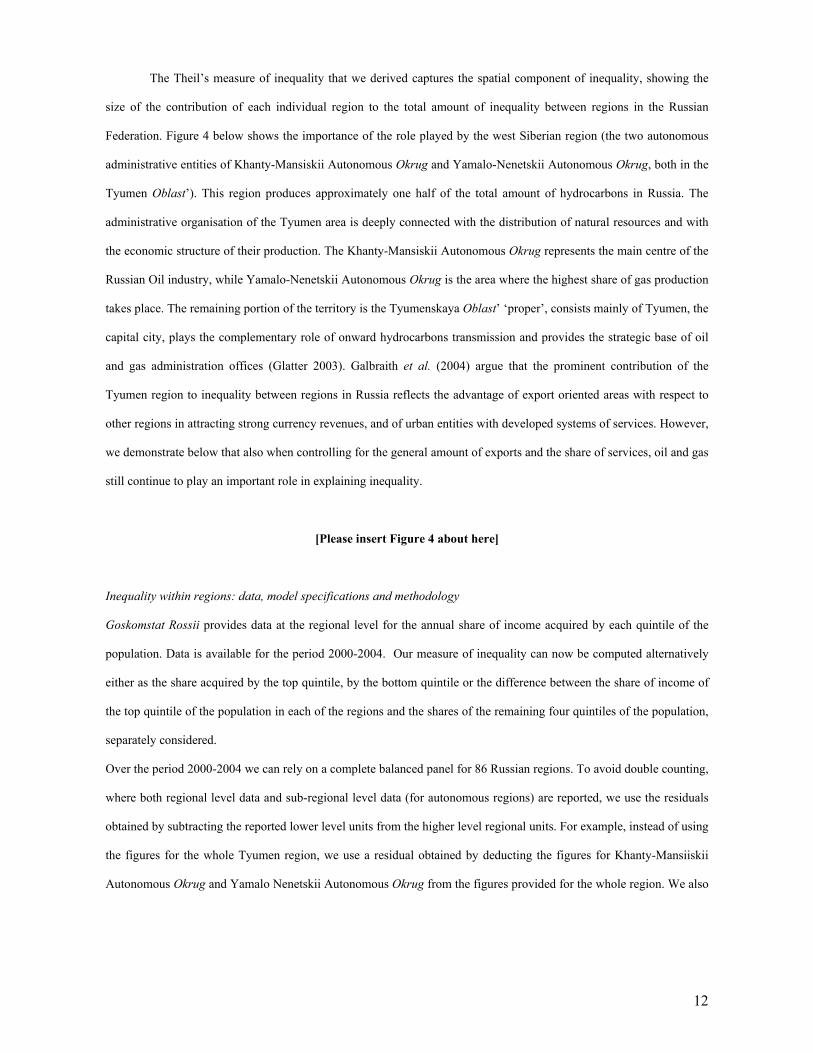
The Theil’s measure of inequality that we derived captures the spatial component of inequality, showing the
size of the contribution of each individual region to the total amount of inequality between regions in the Russian
Federation. Figure 4 below shows the importance of the role played by the west Siberian region (the two autonomous
administrative entities of Khanty-Mansiskii Autonomous Okrug and Yamalo-Nenetskii Autonomous Okrug, both in the
Tyumen Oblast’). This region produces approximately one half of the total amount of hydrocarbons in Russia. The
administrative organisation of the Tyumen area is deeply connected with the distribution of natural resources and with
the economic structure of their production. The Khanty-Mansiskii Autonomous Okrug represents the main centre of the
Russian Oil industry, while Yamalo-Nenetskii Autonomous Okrug is the area where the highest share of gas production
takes place. The remaining portion of the territory is the Tyumenskaya Oblast’ ‘proper’, consists mainly of Tyumen, the
capital city, plays the complementary role of onward hydrocarbons transmission and provides the strategic base of oil
and gas administration offices (Glatter 2003). Galbraith et al. (2004) argue that the prominent contribution of the
Tyumen region to inequality between regions in Russia reflects the advantage of export oriented areas with respect to
other regions in attracting strong currency revenues, and of urban entities with developed systems of services. However,
we demonstrate below that also when controlling for the general amount of exports and the share of services, oil and gas
still continue to play an important role in explaining inequality.
[Please insert Figure 4 about here]
Inequality within regions: data, model specifications and methodology
Goskomstat Rossii provides data at the regional level for the annual share of income acquired by each quintile of the
population. Data is available for the period 2000-2004. Our measure of inequality can now be computed alternatively
either as the share acquired by the top quintile, by the bottom quintile or the difference between the share of income of
the top quintile of the population in each of the regions and the shares of the remaining four quintiles of the population,
separately considered.
Over the period 2000-2004 we can rely on a complete balanced panel for 86 Russian regions. To avoid double counting,
where both regional level data and sub-regional level data (for autonomous regions) are reported, we use the residuals
obtained by subtracting the reported lower level units from the higher level regional units. For example, instead of using
the figures for the whole Tyumen region, we use a residual obtained by deducting the figures for Khanty-Mansiiskii
Autonomous Okrug and Yamalo Nenetskii Autonomous Okrug from the figures provided for the whole region. We also

13
have to exclude the Chechen Republic because of the lack of available data, and the capital, Moscow, because it is an
outlier and presents specific characteristics not comparable with the rest of the Russian Federation.10
One further remark is necessary. The quality of the data at the regional level is sometimes questionable and this
raises the issue of the reliability of regional datasets. In the case of the Russian Federation, Goskomstat Rossii provides
the data as it was collected by the local authorities. Solanko (2003) raises doubts about the precision of regional data
collection in Russia. Yemtsov (2003) also raises the possibility of inconsistencies between national and regional
methodologies of producing data which, for example, would prevent disaggregation of national data into regional
components. However, the methodology used by Goskomstat has constantly improved and has been standardised so that
it conforms more closely to international benchmarks for the period under consideration. Moreover, while recognising
the possible drawbacks in using Goskomstat data, it is the only complete dataset that can be used for our purposes.
As dependent variables we first use the percentage shares of income for each regional population quintile. In
particular, the share of income of the richest 20% is an important indicator of income distribution.11 As our robustness
check, we also utilise the differences between the percentage shares of highest income quintile of the population and the
corresponding shares of the lower quintiles. All are computed at the regional level, that is, they capture the within-
region inequality.
We consider the production of oil and gas tonnes standardised by the number of people living in each region
(P_OIL&GAS) as the core variable for our analysis. To reinforce our results, we introduce some control variables that
have been shown in the economic literature as playing an important role in affecting both income growth and
distribution across individuals and spatial entities. We end up by considering five control variables.
First, differences in wages and hence income inequality can be explained as a consequence of the
heterogeneous distribution of human capital across people and space. Lukyanova (2006) concludes that inequality
becomes more severe where the share of workers with low education levels is higher. The relation between inequality
and investment in human capital is ambiguous in the economic literature (Aghion et al. 1999). However, despite the
uncertainty relating to the long-run impact of investment in human capital on inequality, the link between these two
variables has been widely discussed and we introduce the corresponding variable using a proxy
(ENROLMENT_RATE). This variable represents the percentage of children enrolled in primary school out of the
population of children at the corresponding age. The primary education variable has been used in empirical studies on
determinants of economic development (Barro, 1991; Alesina & Rodrik 1994).
10 We ran our models both without Moscow and with a Moscow dummy variable and found little difference between the results. All are available on request. Consistent with the previous discussion, it is important to note that Moscow remains a major beneficiary of hydrocarbons-related rents. 11 For discussion of this, see, for instance, Reuveny & Li (2003).
14
Furthermore, we introduce two other control variables. The first is the logarithm of the regional GDP
(l_RGDP). After Kuznets (1955; 1963) revealed the inverted U-shaped relationship between the two variables, there
have been numerous studies testing the link. If the debate about the direction by which one variable affects the other
remains still open, the emerging consensus in the recent literature is that income and inequality seem to vary
endogenously (Lundberg & Squire 2003). In order to alleviate the problem we make use of the System Generalised
Method of Moments (GMM), which has been proved to be robust with respect to endogenous variables thanks to its use
of instruments: past values of first differences are used to instrument current levels of variables, and vice versa.
In addition, we control the natural logarithm of total exports denominated in dollars (l_EXPORT). After the
1998 financial crises and the consequent strong devaluation of the ruble, the increase in inequality was affected by
polarisation between regions with access to international trade and those that relied on internal market economic
activities. The gap increased especially when goods were produced at costs denominated in roubles and sold at hard
currency prices on the international markets. Galbraith et al. (2004) conclude that relative income rose more sharply in
regions enjoying hard currency export earnings. However, this increase in income was not necessarily shared evenly by
the local population, which could lead to higher inequality within regions. Controlling for exports is important,
otherwise testing of our hypothesis on the impact of hydrocarbons could suffer from the omission of a related variable,
thereby creating a bias.
The results of Fedorov (2002) suggest that together with exports, the degree of urbanisation has played a very
important role in enhancing disparities across regions. Such a result can be explained by the existence of more
developed services sectors in regions with higher degrees of urbanisation. People working in newly privatised services
usually benefit from higher wages with respect to workers in manufacturing industries and especially to low-skilled
labour in rural areas. Hence, we include also the share of services in total production (SERV) as our explanatory
variable for the within-region dimension of inequality.
Summarising, we end up with the following two main specifications. The first is where the dependent variables
are the shares in regional income of the five quintiles of the regional population. The second relates to the differences
between the shares of the top quintile and the lower ones. Thus we have:
tiERVEXPORT
thjQunt
,ti,6ti,5ti,4
ti,3ti,21
)S()_l(l_RGDP)(
) RATEENROLMENT_(GAS)&P_OIL(_
εααα
ααα
++++
++=−
(1)
15
tiERVEXPORT
thjthDist
,ti,6ti,5ti,4
ti,3ti,21
)S()_l(l_RGDP)(
) RATEENROLMENT_(GAS)&P_OIL(_5_
εααα
ααα
++++
++=−−
(2)
where i represents a region, t a year and j the income quintile (1-5). Qunt_j-th relates to the share in income of the
corresponding quintile. thjthDist −− _5_ relates to the four differences of percentage GDP share between the
fifth percentile and each of the remaining lower four income groups (with j=1,2,3,4). For the five years considered we
can rely on a complete balanced panel for 86 Russian regions.
We now briefly discuss the choice of the appropriate methodology to obtain estimates of the models presented
above. We need to control for regional specific effects unaccounted for by our set of explanatory variables. In addition
we face a potential simultaneity bias, as some of our explanatory variables may be affected by our dependent variable
(ENROLMENT_RATE and l_RGDP for example). We address both problems by choosing the System GMM
methodology as introduced by Arellano and Bover (1995) and Blundell and Bond (1998; 2000). In addition, with
System GMM, we also apply the robust standard errors, implying a further improvement in the quality of our
estimations.
In addition to our preferred models, we also show results obtained by testing for alternative dependent
variables using the same benchmark model as specified in equation (1). In particular we use (a), the Gini index (GINI);
(b) the coefficient of differentiation in income between the richest 10% and the poorest 10% of the population
(Coeff_Diff_Income); and (c) the Theil statistic (calculated using the formula as depicted above based on data on
regional GDP and population as provided by Goskomstat) (THEIL). The first two measures have been discussed
already. Data for the third proxy for inequality is provided by Goskomstat together with the Gini Index and we use it as
an alternative measure of the gap between poorest and richest percentile of the population. However, for the Gini index
and the coefficient of differentiation in income we only have three years available (2003-2005) and this prevents us
from applying the dynamic panel data specifications. For such a short span of time we apply a so-called ‘between
effects’ estimator, based on three years averages of all the variables included in the model.
Results
Our main hypothesis relates to the hydrocarbons as a factor enhancing inequality within regions. All our specifications
confirm the important role of oil and gas production in enhancing divergence and inequality within regions.
We start with presenting results obtained with the percentage shares of each quintiles of the population as the
dependent variables and implementing the System GMM methodology (Table 2). It turns out clearly that oil and gas
16
(P_OIL&GAS) tend to enrich the highest quintile of the population most; in contrast, for all the remaining four
quintiles of the population the variable exhibits a negative relation with the correspondent share of wealth. The effect of
the variable representing the hydrocarbons production is also robust to the introduction of additional control variables
such as the logarithm of regional GDP (l_RGDP) and the logarithm of the amount of exports (l_EXPORT).
Interestingly, the gains from exports are more widely shared. On the other hand, the share of services in total regional
production (SERV) seem to benefit the richest percentile of the population most, a result that could be linked to the
presence of entry barriers.
[Please insert Table 2 about here
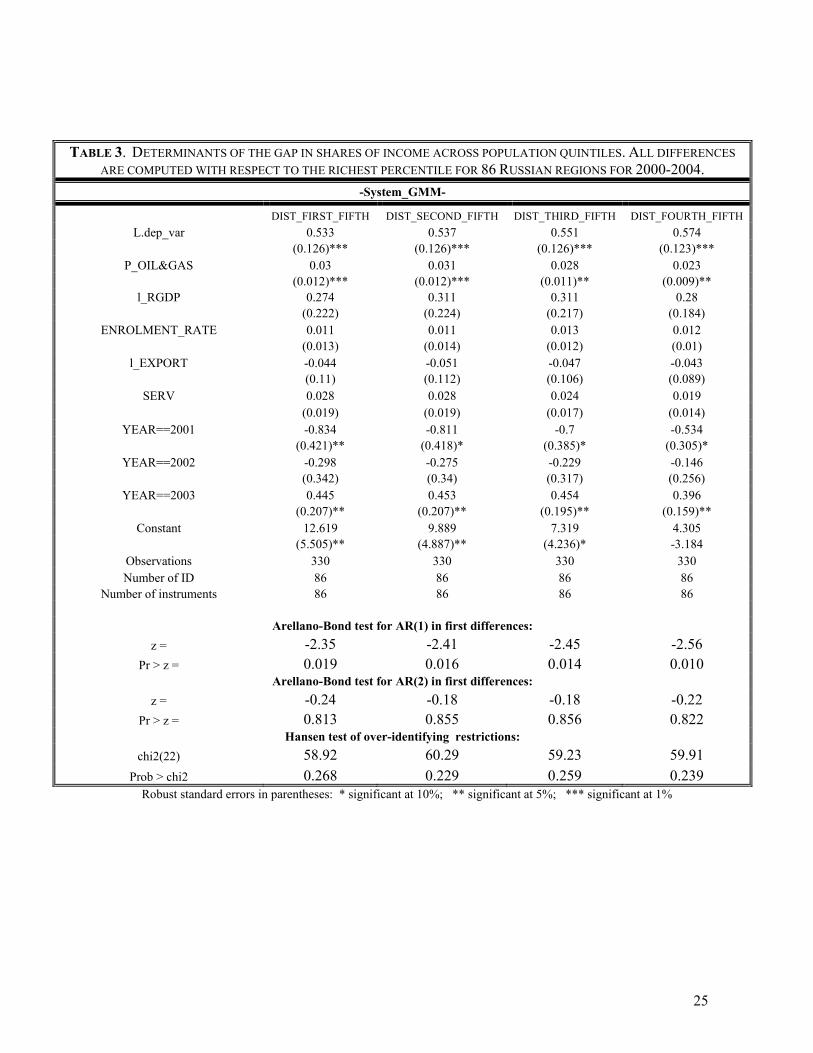
We move next to the analysis based on the gaps between the share of wealth owned by the richest quintile and the
remaining four quintiles individually taken (Table 3). As this is a more restrictive test of our hypotheses, the services
indicator is no longer significant, but the key variable which remains very significant in exacerbating differences across
different quintiles is oil and gas. We should also emphasise that for both models, all the tests seem to confirm the
validity of specification: the lag of the dependent variable is always very significant, the autocorrelation of the first
order is always significant but, importantly, the second order autocorrelation is in contrast never detected, and the over-
identifying restriction test always provides good results.
[Please insert Table 3 about here]
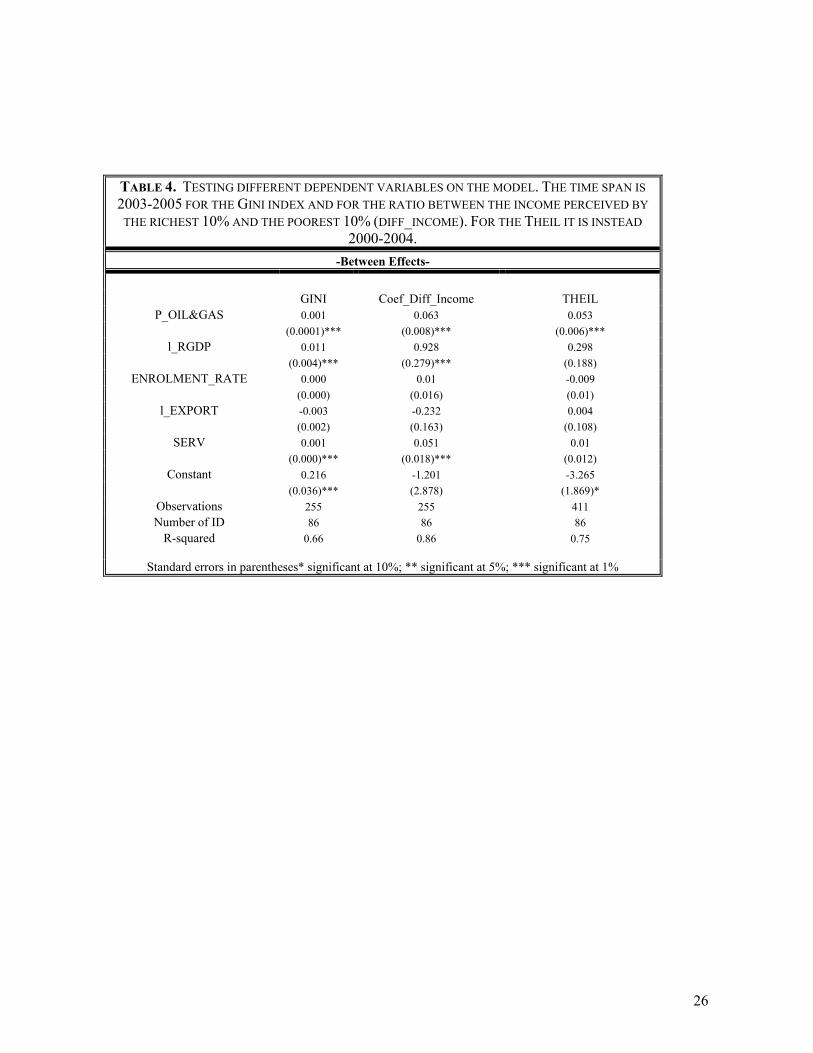
Finally, in Table 4 we present results obtained with three additional dependent variables as proxies for inequality
implementing the between effect regression. The three columns of the table reports results for (1) the Gini index, (2) the
coefficient of differentiation in income between the richest 10% and the poorest 10% of the population and (3) the
Theil’s t statistic, respectively. The only variable which exhibits a positive and highly significant impact on inequality is
again the hydrocarbons production. Services and the regional output are found to have a positive and significant impact
on inequality in two out of three specifications. The enrolment rate and exports lose their explanatory power.
[Please insert Table 4 about here]
Concluding remarks
17
Russia is the largest country on earth (11.5% of its surface, 17,075,200 km2, 6,591,027 mi2), almost twice as large as
Canada, the US and China, and more than twice as large as Brazil and Australia. Despite the recent recentralisation, its
geographical diversity is still matched by institutional, economic and social diversity. It is for this reason that some of
the theoretical tools developed to understand cross-country variation may be applied, as we have done, to analyse
variation on the regional level in Russia (Popov 2001). We focus on hydrocarbons endowment and argue that the
regularities observed on the cross-country level apply to Russian regions as well. In this novel perspective, we test
empirically the determinants of intra-regional inequality in Russia, applying robust dynamic panel data estimators. We
find that regions where oil and gas are produced tend to experience higher levels of income inequality in striking
resemblance to cross-country results.
Why do our findings matter? Even though inequality is not the same as poverty, Kolenikov and Shorrocks
(2005) documented that along the low level of income, inequality is also an important determinant of poverty in Russia.
In the hydrocarbons perspective, these two factors work in the opposite direction. On the one hand, the oil-rich and gas-
rich regions are characterised by higher average incomes; on the other, they are characterised by important intra-
regional disparities. This is well understood in Russia, and one can also see that government initiatives address some of
the problems, examples of which include a ‘self-sufficiency’ target programme launched in Tyumen Region in 2007
(UNDP 2007). More could be done in this respect and the efficient solution would require tackling the problems at their
roots. We argue, that in a striking resemblance to country-level analysis, hydrocarbon rents provide big business with
concentrated wealth which has been used to derail the democratic processes initiated in Russia in the early 1990s.
Glatter (2003) provides a striking example of how this mechanism had operated at the local level and resulted in a high
level of integration between the local oil industry and local political elites achieved by the early 2000s. It seems that the
recent recentralisation drive changes the local balance of power, with a shift from regional corporate groups to federal
corporate groups and a stronger position of the federal government (Yenikeef 2008). However, while the local elites co-
opted by the federal administration give up their ambitions at the federal level and help the president and the ruling
party to achieve the expected elections results at the local level, they are becoming more protected from the potential
local political competition under a new implicit political contract (or ‘mutual hostages’ situation, to use the terminology
of Dininio and Orttung 2004).
Thus, with the return to statism from 2003 onwards (Hanson 2007; OECD 2006), the organisational features of
the big players evolve, but the mechanism remains similar. Åslund (2005) states that after the new reorganisation of the
energy sector, the huge oil revenues have corrupted the top of the state administration and the market reforms needed to
enhance economic efficiency have become suboptimal for the top officials. There is a danger of a renewed state energy
monopoly, implying the shift from a system of oligarchs’ control to a system of bureaucrats’ control of hydrocarbons
18
revenues. The identity of the key players could change at the local level, but not the basic mechanism of political
capitalism. As documented by Svedberg et al. (2006), oil and gas regions open the ranking of regions ordered by the
extent of state capture. This pattern has become clearer now than it was in the late 1990s. Big companies may follow a
seemingly paternalistic approach offering fringe benefits and in-kind payments to its employees. However, the problem
is that this policy has a detrimental effect upon labour mobility and therefore—indirectly—upon income distribution.
Even more seriously, state capture at the regional level is strongly correlated with weak entrepreneurship and low entry
(Svedberg et al., 2006). This produces inequality as it closes some efficient channels to exit poverty and makes the
monopsonistic features of the labour market even stronger. As explicitly explained by one of the regional officials in an
interview, entry is perceived as bad to local businesses as it may create competition driving wages up (Estrin &
Prevezer 2006).
There are some important extensions to our analysis that we have not yet followed. It would be an interesting
extension of current research to investigate to what degree the same pattern applies to other post-Soviet republics. In
particular, there is evidence that a similar situation of regional inequality associated with oil extraction may be present
in Kazakhstan (Kaiser 2006). In addition, since, as of the end of 2008, hydrocarbons-related rents are shrinking due to
lower world market prices, it would be fascinating to discover the impact of this on inequality between regions and
within regions in the Russian Federation. However, this is beyond the scope of the current analysis.
In summary, we stress the interactions between economic structures, political processes and social outcomes.
We demonstrate that oil and gas lead to inequality at the local level and argue that there is evidence that the link
between the two is via a corrupted political mechanism and distorted economic institutional frameworks. However, as
observed by Bradshaw (2006), the example of Norway demonstrates that oil does not need to produce socially
undesirable effects if coupled with an efficient political mechanism. There is nothing deterministic or inevitable about
the future in our conclusions. Russia is too large and complex to make strong assumptions about the sustainability of the
current trends. Its potential for change should not be underestimated.

19
References
Aghion, P., Caroli, E. & Garcia-Penelosa, C. (1999) ‘Inequality and Economic Growth: The Perspective of New
Growth Theory’, Journal of Economic Literature, 37, 4, pp. 1615-1660.
Alesina, A. & Rodrik, D. (1994) ‘Distributive Politics and Economic Growth’, Quarterly Journal of Economics, 109, 2,
pp. 465-490.
Arellano M. & Bover, O. (1995) ‘Another Look at the Instrumental Variable Estimator of Error-Components Models’,
Journal of Econometrics, 68, 1, pp. 29-52.
Åslund, A. (2005) ‘Putin’s Decline and America’s Response’, Policy Brief, Carnegie Endowment for International
Peace, 2005.
Barro, R. (1991), ‘Economic Growth in a Cross Section of Countries’, Quarterly Journal of Economics, 106, 2, pp. 407-
444.
Berkowitz, D. & Jackson, J. E. (2006) ‘Entrepreneurship and the Evolution of Income Distributions in Poland and
Russia’, Journal of Comparative Economics, 34, 2, pp. 338-356.
Bignebat, C. (2003) ‘Spatial dispersion of wages in Russia: does transition reduce inequality on regional labour
markets?’, TEAM University of Paris I & CNRS, mimeo.
Blundell, R. & Bond, S. (1998) ‘Initial Conditions and Moment Restrictions in Dynamic Panel Data Models’, Journal
of Econometrics, 87, 1, pp. 115-143.
Blundell, R. & Bond, S. (2000) ‘GMM estimation with persistent panel data: an application to production functions’,
Econometric Reviews, 19, 3, pp. 321–340.
Bradshaw, M. (2006) ‘Observations on the Geographical Dimensions of Russia’s Resource Abundance,’ Eurasian
Geography and Economics, 47, 6, pp. 724–746.
Bradshaw, M. J. & Vartapetov, K. (2003) ‘A New Perspective on Regional Inequalities in Russia,’ Eurasian Geography
and Economics, 44, 6, pp. 403-429.
Buccellato, T. (2007) Convergence across Russian Regions: A Spatial Econometrics Approach, Discussion Paper 70
(London, CEFIMS SOAS University of London).
Commander, S., Tolstopiatenko, A. & Yemtsov, R. (1999) ‘Channels of Redistribution-Inequality and poverty in the
Russian transition,’ The Economics of Transition, 7, 2, pp. 411-47.
Considine, J. I. & Kerr, W. A. (2002) The Russian Oil Economy (Cheltenham & Northampton, MA, Edward Elgar).
Corden, W. M. & Neary, J. P. (1982) ‘Booming Sector and De-Industrialisation in a Small Open Economy,’ The
Economic Journal, 92, 368, pp. 825-848.

20
Corden, W. M. (1984), ‘Booming Sector and Dutch Disease Economics: Survey and Consolidation’, Oxford Economic
Papers, 36, 3, pp. 359-380.
Davis, G. & Tilton, J. E. (2005) ‘The Resource Curse’, Natural Resources Forum, 29, 3, pp. 233-242.
DeBardeleben, J. (2003) ‘Fiscal Federalism and How Russians Vote’, Europe-Asia Studies, 55, 3, pp. 339-363.
Dininio, P. & Orttung, R. (2004) ‘Explaining Patters of Corruption in the Russian Regions’, William Davidson Institute
Working Paper No 727, University of Michigan.
Eastwood, R. K. & Venables, A. J. (1982) ‘The Macroeconomic Implications of a Resource Discovery in an Open
Economy’, The Economic Journal, 92, 366, pp. 285-299.
Ellman, M. (ed.) (2006) Russia's Oil and Natural Gas- Bonanza or Curse? (London, Anthem Press).
Estrin, S. & Prevezer, M. (2006) ‘On the Role of Institutions in Firm Entry and Survival in Emerging Markets; A Cross-
Country Case Study Approach’, paper presented at CNEM seminar, London Business School, mimeo.
Federov, L. (2002) ‘Regional Inequality and Regional Polarization in Russia, 1990–99’, World Development, 30, 3, pp.
443–456.
Fortescue, S. (2006) Russia’s Oil Barons and metal Magnates. Oligarchs and the State in Transition (Houndmills,
Palgrave Macmillan).
Gaddy, C. G. & Ickes, B. W. (2005) ‘Resource Rents and the Russian Economy,’ Eurasian Geography and Economics,
46, 8, pp. 559–583.
Galbraith, J. K., Krytynskaia, L. & Wang, O. (2004) ‘The Experience of Rising Inequality in Russia and China during
the Transition’, The European Journal of Comparative Economics, 1, 1, pp. 87-106.
Gerry, C. J. & Mickiewicz, T. M. (2008) ‘Inequality, Democracy and Taxation: Lessons from the Post-Communist
Transition,’ Europe Asia Studies, 60, 1, pp. 89-113.
Glatter, P. (2003) ‘Continuity and Change in the Tyumen’ Regional Elite 1991-2001’, Europe-Asia Studies, 55, 3, pp.
401-435.
Gurvich, E. T. (2004) ‘Makroekonomicheskaya otsenka roli rossiiskogo neftegazovogo sektora’, Voprosy Ekonomiki,
10.
Gylfason, T. & Zoega, G. (2002) Inequality and Economic Growth: Do Natural Resources Matter?, Working Paper 712
(5) (Munich, CESifo).
Hahn, G. (2005) ‘Reforming the Federation’, in White, S., Gitelman, Z. & Sakwa, R. (eds) (2005) Developments in
Russian Politics 6 (Houndmills, Palgrave Macmillan), pp. 148-167.
Hanson, P. (2007) ‘The Russian Economic Puzzle: Going Forwards, Backwards or Sideways?’, International Affairs,
83, 5, pp. 869-889.

21
Kaser, M. (2006) ‘Sustaining Growth: A Prospectus For Labour Market Policies In Kazakhstan’, Russian And Eurasian
Centre, St Antony’s College, University of Oxford, mimeo, 2006.
Kislitsyna, O. (2003) Income Inequality in Russia during Transition-How Can It Be Explained?, Working Paper 03/08
(Moscow, Economics Education and Research Consortium).
Kolenikov, S. & Shorrocks, A. (2005) ‘A Decomposition Analysis of Regional Poverty in Russia’, Review of
Development Economics, 9, 1, pp. 25-46.
Kryukov, V. & Tokarev, A. (2007) Neftegazovye Resursy v Transformeremoi Ekonomike (Novosibirsk, Nauka-Center).
Kuznets, S. (1955) ‘Economic Growth and Income Inequality’, American Economic Review, 45, 1, pp. 1-28.
Kuznets, S. (1963) ‘Quantitative Aspects of the Economic Growth of Nations’, Economic Development and Cultural
Change, 11, pp. 1-80.
Leite, C. A. & Weidman, J. (1999) Does Mother Nature Corrupt? Natural Resources, Corruption, and Economic
Growth, Working Paper WP/99/85 (Washington, DC, IMF).
Liebowitz, D. (1987) ‘Soviet Investment Strategy: A Further Test of the “Equalization Hypothesis”’, Annals of the
Association of American Geographers, 77, 3, pp. 396-407.
Lukyanova, A. (2006) Wage Inequality in Russia (1994–2003), Working Paper 06/03 (Moscow, Economics Education
and Research Consortium).
Lundberg, M. & Squire, L. (2003) ‘The Simultaneous Evolution of Growth and Inequality’, Economic Journal, 113,
487, pp. 326-344.
Milanovic, B. (1998) Income, Inequality and Poverty during the Transition from Planned to Market Economy
(Washington, DC, World Bank).
Nechemias, C. (1980) ‘Regional Differentiation of Living Standards in the RSFSR: the Issue of Inequality’, Soviet
Studies, 32, 3, pp. 366-378.
OECD (2006) Economic Surveys: Russian Federation (Paris, Organisation for Economic Cooperation and
Development).
Popov, V. (2001) ‘Reform Strategies and Economic Performance of Russia’s Regions’, World Development, 29, 5, pp.
865-886.
Reuveny, R. & Li, Q. (2003) ‘Economic Openness, Democracy, and Income Inequality. An Empirical Analysis’,
Comparative Political Studies, 36, 5, pp. 575-601.
Sachs, J. D. & Warner, A. M. (2001) ‘Natural Resources and Economic Development-The curse of natural resources’,
European Economic Review, 45, 4-6, pp. 827-838.
Sakwa, R. (2008) Putin. Russia’s Choice (London, Routledge).
22
Sala-I-Martin, X., Doppelhofer, G. & Miller, R. I. (2004) ‘Determinants of Long-Term Growth: A Bayesian Averaging
of Classical Estimates (BACE) Approach’, American Economic Review, 94, 4-6, pp. 813-835.
Schiffer, J. (1985) ‘Interpretations of the issue of “inequality” in Soviet regional policy debates’, International Journal
of Urban and Regional Research, 9, 4, pp. 508-532.
Slider, D. (2005) ‘Politics in the Regions’, in White, S., Gitelman, Z. & Sakwa, R. (eds.) (2005) Development in
Russian Politics 6 (Houndmills, Palgrave Macmillan), pp. 168-185.
Solanko, L. (2003) An Empirical Note on Growth and Convergence Across Russian Regions, Discussion Paper 9
(Helsinki, Bank of Finland, Institute for Economies in Transition).
Svedberg, M., Ono, J. & Mosina, O. (2006) (eds.) Unleashing the Potential. Growth and Investment in Russian Regions
(Moscow, Centre for Economic and Financial Research and Stockholm, Stockholm Institute of Transition Economics).
Treisman, D. (1998) ‘Deciphering Russia’s Federal Finance: Fiscal Appeasement in 1995 and 1996’, Europe Asia
Studies, 50, 5, pp. 893-906.
UNDP (2007) Russian Regions: Goals, Challenges, Achievements. Human Development Report. Russian Federation
2006/2007 (New York, United Nations Development Programme).
Yakovlev, E. & Zhuravskaya, E. (2004) State Capture and Controlling Owners of Firms, Working Paper 44 (Moscow,
CEFIR).
Yemtsov, R. (2003) Quo Vadis? Inequality and Poverty Dynamics across Russian Regions’, Discussion Paper 67
(Helsinki, WIDER).
Yenikeyeff, S. (2008) The Battle for Russian Oil: The Kremlin, Governors and Oligarchs (Oxford, Oxford University
Press), forthcoming.
World Bank (2004) Country Economic Memorandum for Russia (Washington, DC, World Bank)
23
TABLE 1. REGIONS OF RUSSIA WITH LARGEST OIL AND GAS PRODUCTION PER HEAD. BASIC SOCIO-ECONOMIC DATA
oil & gas
production share of income:
share of income:
total population
population as
% share of services
% share of agriculture
Regional GDP as% of
(tonnes) / population
richest 20% population
poorest 20% population in thousands
% of Russia in production
in production
Russia (2000-2004
(2000-2005
average) (2000-2005
average) (2000-2005
average) (2002
census) (2002
census) (2000-2005
average) (2000-2005
average) average)
Astrakhanskaya Oblast’ 3.9 41.7% 7.0% 1,005 0.69% 41.7% 5.5% 0.47% Evenkiiskii AO 3.1 44.3% 6.1% 18 0.01% 78.9% 5.1% 0.02% Khanty-Mansiiskii 155.0 48.8% 4.9% 1,433 0.99% 23.4% 0.3% 7.30% Nenetskii AO 176.2 46.8% 5.4% 41 0.03% 15.5% 0.9% 0.22% Orenburgskaya Oblast’ 3.8 40.3% 7.5% 2,180 1.50% 48.8% 5.5% 1.16% Permskaya Oblast’ 6.9 46.1% 5.6% 1,449 1.00% 46.8% 14.7% 2.02% Resp. Bashkortostan 2.8 44.3% 6.1% 4,104 2.83% 34.1% 10.9% 2.37% Respublika Komi 9.6 47.1% 5.3% 1,019 0.70% 42.4% 1.8% 1.01% Respublika Tatarstan 7.7 44.4% 6.1% 3,779 2.60% 32.6% 8.0% 2.86% Sakhalinskaya Oblast’ 6.5 42.5% 6.7% 547 0.38% 36.9% 2.9% 0.58% Samarskaya Oblast’ 3.4 48.3% 5.0% 3,240 2.23% 39.0% 5.9% 2.46% Tomskaya Oblast’ 10.7 43.1% 6.5% 1,046 0.72% 41.7% 4.8% 0.88% Tyumenskaya Oblast’ 81.8 50.1% 4.5% 1,325 0.91% 27.2% 0.9% 1.09% Udmurtskaya Resp. 5.5 38.9% 8.0% 1,570 1.08% 35.0% 8.6% 0.84% Volgogradskaya Oblast’ 1.3 41.2% 7.1% 2,699 1.86% 38.9% 14.2% 1.15% Yamalo-Nenetskii AO 85.7 47.7% 5.2% 507 0.35% 23.7% 0.1% 2.70%
Notes: Tomskaya Oblast’ refers to the area excluding the autonomous regions, apart from the data of shares of agriculture and services, which relate to all its territory. On the 1
December 2005, Permskaya Oblast’ was merged with Komi-Permyak Autonomous Okrug into Permskii Krai. The data refer to the period before the merger.
Source: Goskomstat Rosii.

24
TABLE 2. DETERMINANTS OF PERCENTAGE SHARES OF INCOME ACROSS POPULATION QUINTILES FOR 86
RUSSIAN REGIONS OVER 2000-2004. -System_GMM-
FIRST SECOND THIRD FOURTH FIFTH L. dep_var 0.742 0.721 0.781 0.873 0.851
(0.088)*** (0.097)*** (0.098)*** (0.089)*** (0.087)*** P_OIL&GAS -0.004 -0.005 -0.003 -0.001 0.008
(0.002)** (0.002)** (0.002) (0.001)* (0.006) ENROLMENT_RATE -0.002 -0.002 -0.003 -0.001 0.008
(0.004) (0.004) (0.003) (0.001) (0.01) l_RGDP -0.08 -0.093 -0.058 -0.015 0.155
(0.056) (0.061) (0.044) (0.013) (0.157) l_EXPORT 0.009 0.022 0.002 0.008 0.017
(0.035) (0.037) (0.027) (0.007) (0.107) SERV -0.007 -0.006 -0.003 -0.001 0.013
(0.003)** (0.003)* (0.002) (0.001) (0.01) YEAR==2001 0.044 0.066 0.014 0.017 0.032
(0.061) (0.069) (0.046) (0.009)* (0.191) YEAR==2002 -0.049 -0.037 -0.046 -0.004 0.285
(0.053) (0.06) (0.042) (0.01) (0.143)** YEAR==2003 -0.196 -0.181 -0.162 -0.024 0.656
(0.036)*** (0.041)*** (0.032)*** (0.010)** (0.128)*** Constant 2.874 4.393 4.44 3.077 3.776
(0.854)*** (1.368)*** (1.797)** -2.07 -3.863 Observations 337 337 337 337 337Number of ID 86 86 86 86 86
Number of instruments 86 86 86 86 86
Arellano-Bond test for AR(1) in first differences:z = -2.93 -2.91 -3.23 -3.70 -3.08
Pr > z = 0.003 0.004 0.001 0.000 0.002 Arellano-Bond test for AR(2) in first differences:
z = -0.75 -0.31 -0.34 -0.41 -0.72 Pr > z = 0.452 0.753 0.737 0.682 0.473
Hansen test of over-identifying restrictions:chi2(22) 36.28 36.88 34.83 47.88 38.20
Prob > chi2 0.455 0.428 0.524 0.089 0.370 Robust standard errors in parentheses
* significant at 10%; ** significant at 5%; *** significant at 1%
25
TABLE 3. DETERMINANTS OF THE GAP IN SHARES OF INCOME ACROSS POPULATION QUINTILES. ALL DIFFERENCES ARE COMPUTED WITH RESPECT TO THE RICHEST PERCENTILE FOR 86 RUSSIAN REGIONS FOR 2000-2004.
-System_GMM-
DIST_FIRST_FIFTH DIST_SECOND_FIFTH DIST_THIRD_FIFTH DIST_FOURTH_FIFTH L.dep_var 0.533 0.537 0.551 0.574
(0.126)*** (0.126)*** (0.126)*** (0.123)*** P_OIL&GAS 0.03 0.031 0.028 0.023
(0.012)*** (0.012)*** (0.011)** (0.009)** l_RGDP 0.274 0.311 0.311 0.28
(0.222) (0.224) (0.217) (0.184) ENROLMENT_RATE 0.011 0.011 0.013 0.012
(0.013) (0.014) (0.012) (0.01) l_EXPORT -0.044 -0.051 -0.047 -0.043
(0.11) (0.112) (0.106) (0.089) SERV 0.028 0.028 0.024 0.019
(0.019) (0.019) (0.017) (0.014) YEAR==2001 -0.834 -0.811 -0.7 -0.534
(0.421)** (0.418)* (0.385)* (0.305)* YEAR==2002 -0.298 -0.275 -0.229 -0.146
(0.342) (0.34) (0.317) (0.256) YEAR==2003 0.445 0.453 0.454 0.396
(0.207)** (0.207)** (0.195)** (0.159)** Constant 12.619 9.889 7.319 4.305
(5.505)** (4.887)** (4.236)* -3.184 Observations 330 330 330 330 Number of ID 86 86 86 86
Number of instruments 86 86 86 86
Arellano-Bond test for AR(1) in first differences:z = -2.35 -2.41 -2.45 -2.56
Pr > z = 0.019 0.016 0.014 0.010 Arellano-Bond test for AR(2) in first differences:
z = -0.24 -0.18 -0.18 -0.22 Pr > z = 0.813 0.855 0.856 0.822
Hansen test of over-identifying restrictions: chi2(22) 58.92 60.29 59.23 59.91
Prob > chi2 0.268 0.229 0.259 0.239 Robust standard errors in parentheses: * significant at 10%; ** significant at 5%; *** significant at 1%
26
TABLE 4. TESTING DIFFERENT DEPENDENT VARIABLES ON THE MODEL. THE TIME SPAN IS 2003-2005 FOR THE GINI INDEX AND FOR THE RATIO BETWEEN THE INCOME PERCEIVED BY
THE RICHEST 10% AND THE POOREST 10% (DIFF_INCOME). FOR THE THEIL IT IS INSTEAD 2000-2004.
-Between Effects-
GINI Coef_Diff_Income THEIL
P_OIL&GAS 0.001 0.063 0.053 (0.0001)*** (0.008)*** (0.006)***
l_RGDP 0.011 0.928 0.298 (0.004)*** (0.279)*** (0.188)
ENROLMENT_RATE 0.000 0.01 -0.009 (0.000) (0.016) (0.01)
l_EXPORT -0.003 -0.232 0.004 (0.002) (0.163) (0.108)
SERV 0.001 0.051 0.01 (0.000)*** (0.018)*** (0.012)
Constant 0.216 -1.201 -3.265 (0.036)*** (2.878) (1.869)*
Observations 255 255 411 Number of ID 86 86 86
R-squared 0.66 0.86 0.75
Standard errors in parentheses* significant at 10%; ** significant at 5%; *** significant at 1%

27
FIGURE 1. REGIONS OF RUSSIA WITH LARGE PRODUCTION OF OIL AND GAS PER HEAD

28
FIGURE 2. THE REMUNERATION OF SENIOR MANAGEMENT AND DIRECTORS COMPARED WITH WAGES AND SALARIES OF WORKERS. ROSTELECOM AND GASPROM OVER THE PERIOD 2002-2006.
ROSTELECOM GAZPROM
0%
20%
40%
60%
80%
100%
Rostelecom_2002 Rostelecom_2003 Rostelecom_2004 Rostelecom_2005 Rostelecom_2006
Wages salaries other benefits and payroll taxes Remuneration to senior management and directors
0%
10%
20%
30%
40%
50%
60%
70%
80%
90%
100%
Gazprom_2002 Gazprom_2003 Gazprom_2004 Gazprom_2005 Gazprom_2006
Wages salaries other benefits and payroll taxes Remuneration to senior management and directors
Source: Financial Reports of the two companies for the period considered (2002-2006)

29
FIGURE 3. PER CAPITA AVERAGE MONTHLY TRANSFERS IN RUBLES AND PERCENTAGE OF PEOPLE LIVING BELOW THE POVERTY THRESHOLD IN 87 RUSSIAN REGIONS IN 2005.
1
23
4
56 7
89
10
11121314
15
16
17
1819
20
21
22
23 2425
26
27
28
29
3031
32
33
343536
373839404142 4344
45
4647
48
4950 51
52
53
54 55
56
57
585960
61
62
63
64
65
66
6768
69
70
71
72 737475
76
77
7879
8081
8283
84
85
8687
050
100
150
0 20 40 60 80Pov2005
P_MONTHLY_TRANSFERS Fitted values
REGION ID REGION ID REGION ID Belgorodskaya Oblast’ 1 Respublika Adygeya 30 Khanty-Mansiiskii AO 59 Bryanskaya Oblast’ 2 Respublika Dagestan 31 Yamalo-Nenetskii AO 60 Vladimirskaya Oblast’ 3 Respublika Ingushetia 32 Chelyabinskaya Oblast’ 61 Voronezhskaya Oblast’ 4 Kabardino-Balkarskaya Respublika 33 Respublika Altai 62 Ivanovskaya Oblast’ 5 Respublika Kalmykia 34 Respublika Buryatiya 63 Kaluzhskaya Oblast’ 6 Karachaevo-Cherkesskaya Respublika 35 Respublika Tyva 64 Kostromskaya Oblast’ 7 Respublika Severnaya Osetiya-Alaniya 36 Respublika Khakasya 65 Kurskaya Oblast’ 8 Krasnodarskii krai 37 Altayskii krai 66 Lipetskaya Oblast’ 9 Stavropolskii krai 38 Krasnoyarskii krai 67 Moskovskaya Oblast’ 10 Astrakhanskaya Oblast’ 39 Taimyrskii AO 68 Orlovskaya Oblast’ 11 Volgogradskaya Oblast’ 40 Evenkiiskii AO 69 Ryazanskaya Oblast’ 12 Rostovskaya Oblast’ 41 Irkutskaya oblast’ 70 Smolenskaya Oblast’ 13 Respublika Bashkortostan 42 Ust-Ordynskii Buryatskii AO 71 Tambovskaya Oblast’ 14 Respublika Mari El 43 Kemerovskaya Oblast’ 72 Tverskaya Oblast’ 15 Respublika Mordovia 44 Novosibirskaya Oblast’ 73 Tulskaya Oblast’ 16 Respublika Tatarstan 45 Omskaya Oblast’ 74 Yaroslavskaya Oblast’ 17 Udmurtskaya Respublika 46 Tomskaya Oblast’ 75 G. Moskva 18 Chuvashskaya Respublika 47 Chitinskaya Oblast’ 76 Respublika Karelia 19 Kirovskaya Oblast’ 48 Aginskii Buryatskii AO 77 Respublika Komi 20 Nizhegorodskaya Oblast’ 49 Respublika Sakha (Yakutiya) 78 Arkhangelskaya Oblast’ 21 Orenburgskaya Oblast’ 50 Primorskii krai 79 Nenetskii AO 22 Penzenskaya Oblast’ 51 Khabarovskii krai 80 Vologodskaya Oblast’ 23 Permskaya Oblast’ 52 Amurskaya Oblast’ 81 Kaliningradskaya Oblast’ 24 Samarskaya Oblast’ 53 Kamchatskaya oblast’ 82 Leningradskaya Oblast’ 25 Saratovskaya Oblast’ 54 Koryakskii AO 83 Murmanskaya Oblast’ 26 Ulyanovskaya Oblast’ 55 Magadanskaya Oblast’ 84 Novgorodskaya Oblast’ 27 Kurganskaya Oblast’ 56 Sakhalinskaya Oblast’ 85 Pskovskaya Oblast’ 28 Sverdlovskaya Oblast’ 57 Evreiskaya avtomnaya oblast’ 86 G. Sankt-Peterburg 29 Tyumenskaya Oblast’ 58 Chukotskii Avtonom. Okrug 87
Source: The graph is based on data as provided by the Russian State Statistic Service ( Goskomstat).

30
FIGURE 4: THEIL’S T STATISTIC COMPUTED FOR 87 RUSSIAN REGIONS OVER THE PERIOD 1995, 2000-2004.
G. Moskva
Chanty-Mansijskij AO
Jamalo-Neneckij AO
G. Moskva
Chanty-Mansijskij AO
Jamalo-Neneckij AO
G. Moskva
Chanty-Mansijskij AO
Jamalo-Neneckij AO
G. Moskva
Chanty-Mansijskij AO
Jamalo-Neneckij AO
G. Moskva
Chanty-Mansijskij AO
Jamalo-Neneckij AO
-40%
-20%
0%
20%
40%
60%
80%
THEIL_2000 THEIL_2001 THEIL_2002 THEIL_2003 THEIL_2004