OIG – 12 -119 Annual Review of the United States Coast Guard's
36
Department of Homeland Security Annual Review of the United States Coast Guard’s Mission Performance (FY 2011) OIG-12-119 September 2012
Transcript of OIG – 12 -119 Annual Review of the United States Coast Guard's
Department of Homeland Security
Annual Review of the United States Coast Guardrsquos Mission Performance (FY 2011)
OIG-12-119 September 2012
OFFICE OF INSPECTOR GENERAL Department of Homeland Security
Washington DC 20528 wwwoigdhsgov
SEP 1 3 2012
MEMORANDUM FOR Stephen P Metruck
Assistant Commandant for Resources and
Chief Financial Officer United States Coast Guard
FROM Anne L Richards ~UL Assistant Inspector General for Audits
SUBJECT Annual Review of the United States Coast Guards Mission
Performance (FY 2011)
Attached is our final report Annual Review of the United States Coast Guards Mission
Performance (FY 2011) We incorporated the formal comments from the United States
Coast Guard in the final report The report contains no recommendations
Consistent with our responsibility under the Inspector General Act we are providing copies
of our report to appropriate congressional committees with oversight and appropriation
responsibility over the Department of Homeland Security We will post the report on our website for public dissemination
Please call me with any questions or your staff may contact John E McCoy II Deputy
Assistant Inspector General for Audits at (202) 254-4100
Attachment
OFFICE OF INSPECTOR GENERAL Department of Homeland Security
Table of Contents
Executive Summary 1
Background 2
Results of Review 3
Resource Hours for Non-Homeland Security and Homeland Security Missions 3 The USCGrsquos Mission Performance 5 FY 2011 Budget Information 6 Management Comments and OIG Analysis 6
Appendixes
Appendix A Objectives Scope and Methodology 7 Appendix B Management Comments to the Draft Report 9 Appendix C Non-Homeland Security Missions 10 Appendix D Homeland Security Missions 20 Appendix E FY 2011 Performance Measure Summary 30 Appendix F Major Contributors to This Report 31 Appendix G Report Distribution 32
Abbreviations
DHS Department of Homeland Security FY fiscal year GAO Government Accountability Office OIG Office of Inspector General USCG United States Coast Guard
wwwoigdhsgov OIG-12-119
OFFICE OF INSPECTOR GENERAL Department of Homeland Security
Executive Summary
This report presents our annual review of the United States Coast Guardrsquos (USCGrsquos) mission performance as required by the Homeland Security Act of 2002 The Act defines the USCGrsquos 11 statutory missions as either non-homeland security missions (marine safety marine environmental protection search and rescue aids-to-navigation living marine resources and ice operations) or homeland security missions (ports waterways and coastal security drug interdiction migrant interdiction defense readiness and other law enforcement) The Act also prohibits the Secretary from substantially reducing any of the USCGrsquos missions after its transfer to the Department of Homeland Security (DHS)
The objective of this review was to determine the extent to which the USCG is maintaining its historical level of effort on non-homeland security missions To address our objective we reviewed the resource hours the USCG used to perform its various missions We also reviewed the USCGrsquos performance measures and results for each non-homeland security and homeland security mission We did not verify the accuracy of the USCG-provided data
In fiscal year 2011 the USCG dedicated approximately 4 percent more resource hours to homeland security missions than non-homeland security missions Fiscal year 2011 homeland security mission resource hours totaled 355586 while non-homeland security mission resource hours totaled 328008 Homeland security mission resource hours decreased by approximately 05 percent from fiscal year 2010 and remained approximately 91 percent above the baseline Non-homeland security mission resource hours decreased by approximately 7 percent from fiscal year 2010 and were approximately 10 percent above the baseline
The USCG reported that it met or exceeded 14 of 23 summary performance measures in FY 2011 This includes 9 of 12 non-homeland security performance measures and 5 of 11 homeland security performance measures In FY 2011 the USCG budgeted approximately the same percentage of its funding for non-homeland security missions (496 percent) as homeland security missions (504 percent)
This report contains no recommendations
wwwoigdhsgov 1 OIG-12-119
OFFICE OF INSPECTOR GENERAL Department of Homeland Security
Background
Section 888 of the Homeland Security Act of 2002 Public Law 107-296 dated November 25 2002 directs the Inspector General to conduct an annual review that assesses the performance of all USCG missions with a particular emphasis on non-homeland security missions The Act defines the USCGrsquos 11 statutory missions as either non-homeland security missions or homeland security missions and prohibits the Secretary of Homeland Security from substantially or significantly reducing any of the USCGrsquos missions or its capability to perform those missions Table 1 depicts the USCGrsquos 11 statutory missions and the alignment of those missions with USCG programs
Table 1 Alignment of USCG Programs with Statutory Non-Homeland Security and Homeland Security Missions
Non-Homeland Security Missions Alignment with USCG Programs
1 Living Marine Resources Maritime Law Enforcement 2 Marine Safety Maritime Prevention
Maritime Response 3 Marine Environmental Protection
Maritime Prevention 4 Search and Rescue Maritime Response 5 Aids-to-Navigation Marine Transportation System Management 6 Ice Operations Marine Transportation System Management
Homeland Security Missions Alignment with USCG Programs
1 Ports Waterways and Coastal Maritime Security Operations Security Maritime Prevention
2 Drug Interdiction Maritime Law Enforcement 3 Migrant Interdiction Maritime Law Enforcement 4 Defense Readiness Defense Operations 5 Other Law Enforcement Maritime Law Enforcement
Source DHS Office of Inspector General (OIG) based on USCG-provided data
The USCG uses resource hoursmdashgenerally the number of flight hours (for aircraft) and underway hours (for boats and cutters) used to carry out a specific missionmdashto determine the amount of time expended on each of its non-homeland security and homeland security missions We compared the total number of resource hours reported by the USCG from a baseline of pre-September 11 2001 data through fiscal year (FY) 2011 The USCGndashcalculated baseline is an annual average of resource hours based on eight FY quarters preceding September 11 2001 We did not verify the resource hour data reported by the USCG nor did we validate whether the USCG accurately classified resource hours used for each mission We assessed total resource hours for the 11 individual missions in order to identify the changes in each
wwwoigdhsgov 2 OIG-12-119
OFFICE OF INSPECTOR GENERAL Department of Homeland Security
Results of Review
Our review of USCG-provided data indicated that in FY 2011 the USCG dedicated approximately 4 percent more resource hours to homeland security missions than non-homeland security missions FY 2011 homeland security mission resource hours totaled 355586 while non-homeland security mission resource hours totaled 328008 FY 2011 homeland security mission resource hours decreased by approximately 05 percent from FY 2010 and remained approximately 91 percent above the baseline Non-homeland security mission resource hours decreased by approximately 7 percent from FY 2010 and were approximately 10 percent above the baseline The total number of resource hours for all missions has continued to decline since FY 2006 The USCG reported that it met or exceeded 14 of 23 summary performance measures in FY 2011 This includes 9 of 12 non-homeland security performance measures and 5 of 11 homeland security performance measures In FY 2011 the USCG budgeted approximately the same percentage of its funding for non-homeland security missions (496 percent) as homeland security missions (504 percent)
Resource Hours for Non-Homeland Security and Homeland Security Missions
Since 2006 the USCG has dedicated the majority of resource hours to homeland security missions except in FY 2010 as illustrated in the following chart
Chart 1 Resource Hours ndash All Missions
Source DHS-OIG based on USCG-provided data
Although there was virtually no gap between homeland security and non-homeland security missions in FY 2010 the increase in non-homeland security
wwwoigdhsgov 3 OIG-12-119
FY 2008 FY 2009 FY 2010 FY 2011
of of of of Total Total Total Total Missions Hours Hours Hours Hours
Mission Mission Mission Mission Hours Hours Hours Hours
Non Homeland Security
Living Marine Resources 105769 142 94178 131 93470 132 93616 137
Marine Safety 45794 62 52579 73 58828 83 64210 94
Marine Environmental Protection 3441 05 2949 04 29039 41 4682 07
Search and Rescue 61321 83 58607 82 64273 91 55934 82
Aids-to-Navigation 106638 144 100904 141 95268 134 98819 145
Ice Operations 11938 16 8033 11 11639 16 10747 16
Sub-Total 334901 452 317250 442 352517 497 328008 481
Homeland Security Ports Waterways Coastal
Security 205715 277 181264 252 157427 222 155969 228
Drug Interdiction 75892 102 80564 112 67307 95 73401 107
Migrant Interdiction 74918 101 76100 106 76848 108 72213 106
Defense Readiness 42688 58 56128 78 47030 66 41424 61
Other Law Enforcement 8272 11 6686 09 8708 12 12579 18
Sub-Total 407485 549 400742 557 357320 503 355586 520
Total 742386 1001 717992 999 709837 100 683594 1001
OFFICE OF INSPECTOR GENERAL Department of Homeland Security
mission resource hours in FY 2010 was mainly attributable to the Deepwater Horizon oil spill and earthquake relief efforts in Haiti
According to the USCGrsquos data the gap between resource hours for homeland security versus non-homeland security missions has narrowed from an approximately 10 percent difference in FY 2006 (55 percent of resource hours for homeland security missions versus 45 percent for non-homeland security missions) to approximately 4 percent in FY 2011 (52 percent of resource hours for homeland security missions versus 48 percent for non-homeland security missions)
As illustrated in table 2 the total number of resource hours the USCG dedicates to its specific statutory missions continues to decline In FY 2011 the total USCGndashreported resource hours dropped to 683594 which is a decline of approximately 8 percent compared to 742386 hours in FY 2008
Table 2 FY 2011 Coast Guard Resource Hours (Rounded)
Source DHS-OIG based on USCG-provided data (Percentage totals do not sum to 100 due to rounding)
The USCG attributes this decline in total resource hours in part to the decreased availability of assets such as cutters and aircraft due to their age or use in training activities The percentages of total resource hours by statutory
wwwoigdhsgov 4 OIG-12-119
OFFICE OF INSPECTOR GENERAL Department of Homeland Security
mission areas from FY 2006 through FY 2011 are illustrated in the following chart
Chart 2 Percentage of Total Resource Hours by Fiscal Year
0 5 10 15 20 25 30
Search and Rescue
Marine Safety
Aids-to-Navigation
Ice Operations
Marine Environmental Protection
Living Marine Resources
Illegal Drug Interdiction
Undocumented Migrant Interdiction
Other Law Enforcement
Ports Waterways Coastal Security
Defense Readiness
Percentage of Total Resource Hours by Fiscal Year
FY11
FY10
FY09
FY08
FY07
FY06
Non-Homeland Security Missions
Homeland Security Missions
Source DHS-OIG based on USCG-provided data
Resource hours for non-homeland security missions are summarized in appendix C and homeland security missions are summarized in appendix D
The USCGrsquos Mission Performance
We based the performance portion of our review on the USCGrsquos December 2011 internal report titled United States Coast Guard Fiscal Year 2011 Performance Report as well as previous USCG performance reports and OIG reports Because USCG performance reports are internal documents they contain additional management and break-out measures that we did not include in our report In addition the USCG may add retire or change the methodology of certain measures from year-to-year This report includes those measures that the USCG considers summary measures In FY 2011 the USCG used 23 summary performance measures compared with 15 summary performance measures in FY 2010 Fourteen of the 15 measures reported in FY 2010 were continued in FY
wwwoigdhsgov 5 OIG-12-119
OFFICE OF INSPECTOR GENERAL Department of Homeland Security
2011 The methodology for the remaining FY 2010 measure Percent Reduction in Maritime Terrorism Risk over which the USCG has Influence was revised resulting in four new ports waterways and coastal security measures as shown in appendix D
The USCG reported that it met or exceeded 14 of 23 summary performance measures in FY 2011 This includes 9 of 12 non-homeland security performance measures and 5 of 11 homeland security performance measures Non-homeland security performance measures and results are included in appendix C and homeland security measures and results are in appendix D Appendix E contains a summary of the USCGrsquos FY 2011 performance measures for its 11 missions
FY 2011 Budget Information
In FY 2011 the USCG budgeted approximately the same percentage of its funding for non-homeland security missions (496 percent) as homeland security missions (504 percent) Based on the USCGrsquos FY 2012 budget the historical funding gap between non-homeland security and homeland security missions is expected to remain narrow For FY 2012 the USCG budgeted approximately 518 percent of its mission resources for non-homeland security missions and 482 percent for homeland security missions The largest percentage of the USCGrsquos mission resources will continue to be dedicated to its ports waterways and coastal security mission which garnered 222 percent of the budget in FY 2012 and is projected to receive 209 percent of the budget in FY 2013
Management Comments and OIG Analysis
The formal reply from the Assistant Commandant for Resources and Chief Financial Officer for the Coast Guard is included in appendix B USCG also provided technical comments on our draft report and we addressed them as appropriate throughout the report
wwwoigdhsgov 6 OIG-12-119
OFFICE OF INSPECTOR GENERAL Department of Homeland Security
Appendix A Objectives Scope and Methodology
The DHS OIG was established by the Homeland Security Act of 2002 (Public Law 107shy296) by amendment to the Inspector General Act of 1978 This is one of a series of audit inspection and special reports prepared as part of our oversight responsibilities to promote economy efficiency and effectiveness within the Department
Section 888(f)(1) of the Homeland Security Act of 2002 directs the Inspector General to conduct an annual assessment of the USCGrsquos performance of all its missions with a particular emphasis on non-homeland security missions The objective of this review was to determine the extent to which the USCG is maintaining its historical level of effort on non-homeland security missions
We reviewed the following Government Accountability Office (GAO) reports and testimonies
bull GAO-12-14 Coast Guard Security Risk Model Meets DHS Criteria but More Training Could Enhance Its Use for Managing Programs and Operations November 2011
bull GAO-12-254T Coast Guard Observations on Arctic Requirements Icebreakers and Coordination with Stakeholders December 2011
bull GAO-12-518 Border Security Opportunities Exist to Ensure More Effective Use of DHSrsquos Air and Marine Assets March 2012
bull GAO-10-411T Coast Guard Observations on the Requested Fiscal Year 2011 Budget Past Performance and Current Challenges February 2010
bull GAO-10-268R Coast Guard Workforce Issues January 2010
We analyzed the total number of resource hours reported by the USCG prior to September 11 2001 through FY 2011 We did not attempt to verify the resource hour data nor did we attempt to validate whether the USCG had accurately categorized such data We assessed total resource hours for the USCGrsquos 11 individual missions to identify the changes in each
We analyzed performance measures and targets to determine whether the measures for each of the USCGrsquos missions had been accomplished We obtained information on performance from the USCGrsquos internal report United States Coast Guard Fiscal Year 2011 Performance Report dated December 2011 In addition we reviewed our Annual Review of the United States Coast Guardrsquos Mission Performance (FY 2010) dated September 2011 for performance measure data prior to FY 2011 We obtained budget information from DHSrsquos Budget-in-Brief for FYs 2011- FY 2013
wwwoigdhsgov 7 OIG-12-119
OFFICE OF INSPECTOR GENERAL Department of Homeland Security
We conducted this review between April and August 2012 under the authority of the Inspector General Act of 1978 as amended and according to the Quality Standards for Inspections issued by the Council of the Inspectors General on Integrity and Efficiency
wwwoigdhsgov 8 OIG-12-119
OFFICE OF INSPECTOR GENERAL Department of Homeland Security
Appendix B Management Comments to the Draft Report
US Oopartmonl of Commandant 2100 Second Street sw Stop 7245 United WashingtOn DC 20593 Homeland security States Coast Guard
StaffSymbolCG-823
United Statas Phone (202) 372-3S33 F (202)372-2311
Coast Guard
7501
AUG 3 1 2012
Reply to Audit Manager Attn of Mark Kulwicki
(202) 372-3533 To Anne L Richards
Assistant Inspector General for Audits
Subj DHS orG REPORT ON ANNUAL REVIEW OF THE UNITED STATES COAST GUARDS MISSION PERFORMANCE (FY 2011)
Ref (a) DHS orG Draft Report dated August 16 2012
I Thank you for the opportunity to review and comment on the Department of Homeland Security (DHS) Office of Inspector Generals Draft Report 12-028-AUD-USCG entitled Annual Review of the United States Coast Guards Mission Perfonnance (FY 2011)
2 The United States Coast Guard (USCG) appreciates the efforts of the orG to docwnent measures that we can take to enhance the programs overall effectiveness
3 The USCG recommends the following technical comments contained in the enclosure
4 If you have any questions my point of contact is Mr Mark Kulwicki who can be reached at (202) 372-3533
Enclosure (I) USCG technical comments
Copy Brooke Bebow Director Lisa Vonder Haar Audit Manager Stephen Doran Auditor Rkhard Joyce Program Analyst Marisa Coccaro Referencer
wwwoigdhsgov 9 OIG-12-119
OFFICE OF INSPECTOR GENERAL Department of Homeland Security
Appendix C Non-Homeland Security Missions
The FY 2011 non-homeland security mission resource hours totaled 328008 and decreased by approximately 7 percent from FY 2010 However the FY 2011 level remains at approximately 10 percent above baseline levels The following graph illustrates the trend in non-homeland security mission resource hours since 2006 compared with the baseline period
Non-Homeland Security Resource Hours
0
50000
100000
150000
200000
250000
300000
350000
Reso
urce
Hou
rs
2007
2006
Baseline
2011
2010
2009
2008
Fiscal Year Source DHS-OIG based on USCG-provided data
In FY 2011 the USCG reported that it met or exceeded 9 of 12 summary performance measures for its 6 non-homeland security missions compared with meeting 7 of 10 summary performance measures in FY 2010 The resource hours and summary performance measures and results for each non-homeland security mission are discussed below
Living Marine Resources
Living marine resources law enforcement is an obligation under the Magnuson-Stevens Fishery Conservation and Management Act the Endangered Species Act and several other laws for the protection of marine resources Its core responsibility is to provide effective and professional enforcement to advance national goals for the conservation management and recovery of living marine resources marine protected species and
wwwoigdhsgov 10 OIG-12-119
Living Marine Resources Performance Measure ndash Fishing Regulation Compliance Rate
FY 2006 Actual
FY 2007 Actual
FY 2008 Actual
FY 2009 Actual
FY 2010 Actual
FY 2011 Target
FY 2011 Actual
966 962 953 968 972 96 974 X
Not Met X
Not Met X
Not Met X
Not Met
Met
Met
Source DHS-OIG based on USCG-provided data
OFFICE OF INSPECTOR GENERAL Department of Homeland Security
national marine sanctuaries and monuments This includes enforcement of living marine resource regulations and other activities that strengthen both domestic and international living marine resources regimes
Resource Hours FY 2011 resource hours for living marine resources totaled 93616 This is an increase of 02 percent from FY 2010 and is higher than the baseline by 26 percent
Source DHS-OIG based on USCG-provided data
Performance Measures and Results The USCG uses the percentage of fishing vessels observed at-sea complying with domestic regulations as a measure of its effect on enforcement of US fisheries and protected species regulations The measure reflects the percentage of USCG boardings at-sea where no significant violations of domestic living marine resource regulations were detected As shown in the chart below the USCG reported that it met its single living marine resources performance measure in FY 2011
wwwoigdhsgov 11 OIG-12-119
OFFICE OF INSPECTOR GENERAL Department of Homeland Security
Marine Safety
The focus of the USCGrsquos marine safety mission is the prevention of deaths injuries and property loss Marine safety responsibilities include ensuring the safe and environmentally sound operation of millions of recreational vessels and thousands of US flagged commercial vessels The USCG develops and enforces Federal marine safety regulations certifies and provides credentials to over 218000 mariners investigates commercial marine casualties and shares its findings and conducts compulsory inspections as well as voluntary safety exams
Resource Hours The USCG did not report hours for this mission prior to 2005 FY 2011 resource hours for marine safety totaled 64210 and increased by approximately 91 percent from FY 2010
Source DHS-OIG based on USCG-provided data
Performance Measures and Results The USCG reported that it met three of four summary performance measures related to marine safety in FY 2011 Federal regulations require the person in charge of commercial US flagged vessels to notify the USCG of any loss of life or injury requiring professional medical treatment beyond first aid The USCG uses deaths and injuries as a measure of commercial mariner and passenger safety and the five-year average number of deaths and injuries as an indicator of long-term performance trends In FY 2011 the USCG met its target for commercial mariner deaths and injuries but missed the target for passenger deaths and injuries as shown below
wwwoigdhsgov 12 OIG-12-119
Marine Safety Performance Measure ndash Five-Year Average Number of Commercial
Mariner Deaths and Injuries
FY 2006 Actual
FY 2007 Actual
FY 2008 Actual
FY 2009 Actual
FY 2010 Actual
FY 2011 Target
FY 2011 Actual
502 526 496 498 474 lt475 431
NA NA Met Met Met Met
Source DHS-OIG based on USCG-provided data
Marine Safety Performance Measure ndash Five-Year Average Number of
Recreational Boating Deaths and Injuries FY 2006 FY 2007 FY 2008 FY 2009 FY 2010 FY 2011 FY 2011 Actual Actual Actual Actual Actual Target Actual 4366 4249 4147 4150 4091 lt4115 3904
NA NA Met Met Met Met
OFFICE OF INSPECTOR GENERAL Department of Homeland Security
Marine Safety Performance Measure ndash Five-Year Average Number of
Commercial Passenger Deaths and Injuries FY 2006 FY 2007 FY 2008 FY 2009 FY 2010 FY 2011 FY 2011 Actual Actual Actual Actual Actual Target Actual
216 238 252 238 250 lt223 232
NA NA X X X
Not Met Met Not Met Not Met Source DHS-OIG based on USCG-provided data
Federal regulations also require operators or owners of recreational vessels to file a boating accident report when a person dies or disappears from the vessel under certain circumstances The USCG uses deaths and injuries as a measure of marine safety for the recreational boating segment of the American maritime community and a five-year average of these as an indicator of long-term performance trends The USCG reported that it met its target for this measure in FY 2011
Source DHS-OIG based on USCG-provided data
In FY 2011 the USCG added a new long-term performance measure for the five-year average number of commercial and recreational deaths and injuries The target for this measure was met
wwwoigdhsgov 13 OIG-12-119
OFFICE OF INSPECTOR GENERAL Department of Homeland Security
Marine Safety Performance Measure ndash Five-Year Average Number of
Commercial and Recreational Deaths And Injuries FY 2006 FY 2007 FY 2008 FY 2009 FY 2010 FY 2011 FY 2011 Actual Actual Actual Actual Actual Target Actual
NA NA NA NA NA lt4813 4567
NA NA NA NA NA Met
Source DHS-OIG based on USCG-provided data
Marine Environmental Protection
The marine environmental protection mission focuses on minimizing oil and hazardous substance effect on human health the environment and the marine transportation system The USCG regulates the handling of oil hazardous substances and other shipboard wastes to prevent their discharge into US or international waterways stop unauthorized ocean dumping reduce ship-based air emissions and avert the introduction of invasive species The USCG is the lead Federal agency for directing the removal and mitigation of oil spills from the waters and adjoining shorelines of the coastal zone
Resource Hours Marine environmental protection resource hours totaled 4682 in FY 2011 This represents a decrease of 839 percent from FY 2010 and is attributable to the reduction of resource hours necessary for the Deepwater Horizon oil spill in the Gulf of Mexico
Source DHS-OIG based on USCG-provided data
wwwoigdhsgov 14 OIG-12-119
Marine Environmental Protection Performance Measure Average Number of Oil Spills in the Maritime Environment
FY 2006 FY 2007 FY 2008 FY 2009 FY 2010 FY 2011 FY 2011 Actual Actual Actual Actual Actual Target Actual 143 139 132 123 115 lt116 102
NA NA Met Met Met Met
Source DHS-OIG based on USCG-provided data
OFFICE OF INSPECTOR GENERAL Department of Homeland Security
Performance Measures and Results Federal regulation requires vessel or facility operators to report the discharge of any hazardous substance that equals or exceeds reportable quantities and requires the reporting of any discharge of oil or oil products that cause a sheen discoloration sludge or emulsion on or below the surface of any navigable waterway of the United States The USCG uses the number of chemical discharge incidents and the number of oil spills greater than 100 gallons as proxy indicators of marine environmental protection and normalizes five-year averages of these as indicators of long-term trends In FY 2011 the USCG reported that it met the target for ldquoAverage Number of Chemical Discharge Incidents in the Maritime Environmentrdquo which was previously reported as ldquo5-Yr Average Chemical Discharge Incidents per 100 Million Short Tons Shippedrdquo
Marine Environmental Protection Performance Measure ndash Average Number of Chemical Discharge
Incidents in the Maritime Environment FY
2006 Actual
FY 2007
Actual
FY 2008
Actual
FY 2009
Actual
FY 2010
Actual
FY FY 2011 2011
Target Actual 278 244 198 187 181 lt220 150
NA NA Met Met Met Met
Source DHS-OIG based on USCG-provided data
USCG also reported that it met the target for ldquoAverage Number of Oil Spills in the Maritime Environmentrdquo which was previously reported as ldquo5-Yr Average Oil Spills gt 100 Gallons per 100 Million Short Tons Shippedrdquo
Search and Rescue
USCG strives to minimize lives lost injury and property loss or damage by rendering aid to those in distress in the maritime environment and elsewhere as called upon The search and rescue mission is accomplished through resource readiness distress monitoring and communication search planning on-scene operations and domestic and international partnerships
wwwoigdhsgov 15 OIG-12-119
OFFICE OF INSPECTOR GENERAL Department of Homeland Security
Resource Hours Search and rescue is a demand-driven mission Requirements for search and rescue increase or decrease relative to the number of people requiring the USCGrsquos assistance Resource hours in FY 2011 totaled 55934 and decreased approximately 13 percent from FY 2010
Source DHS-OIG based on USCG-provided data
0 10000 20000 30000 40000 50000 60000 70000 80000 90000
Baseline
2006
2007
2008
2009
2010
2011 Re
sour
ce H
ours
Search and Rescue Resource Hours
Fiscal Year
Performance Measures and Results USCG met the FY 2011 target for percent of people in imminent danger saved in the maritime environment was not met Though this yearrsquos performance is below the overall target it is more than the 744 percent level posted in FY 2010 In FY 2011 the USCG saved 3804 lives in 20510 cases with 732 lives lost and 390 lives unaccounted for This total excluded outlier cases with more than 10 lives at risk Other than raw numbers of lives saved and lost there is no clear indication of the drivers that led to this decrease The USCG is conducting further analysis is in progress to identify any systemic issues Additionally uncontrollable variables such as weather location incident severity and life saving devices on board continue to influence the number and outcome of search and rescue incidents
Search and Rescue Performance Measure ndash Percent of People in Imminent Danger Saved
in the Maritime Environment FY FY FY FY FY FY FY
2006 2007 2008 2009 2010 2011 2011 Actual Actual Actual Actual Actual Target Actual
76 766 768 773 744 100 773 X X
Met Met Met Met Not Met Not Met Source DHS-OIG based on USCG-provided data
wwwoigdhsgov 16 OIG-12-119
Search and Rescue Performance Measure ndash Percent of Time Rescue Assets are On-Scene
within 2 Hours FY
2006 FY
2007 FY
2008 FY
2009 FY
2010 FY
2011 FY
2011 Actual Actual Actual Actual Actual Target Actual 937 943 933 940 933 100 931
Met Met Met Met Met X
Not Met Source DHS-OIG based on USCG-provided data
OFFICE OF INSPECTOR GENERAL Department of Homeland Security
The FY 2011 target for percent of time rescue assets are on-scene within 2 hours was not met However overall performance is in line with the USCGrsquos expectations based on placement of resources and proximity to shore of the majority of search and rescue incidents and shows consistent performance over the last six years This measure has been adjusted to exclude cases in which an operational decision was made to delay a response Certain determining factors such as weather resource availability and risk assessment delay response time
Aids-to-Navigation
USCG minimizes disruptions to maritime commerce by assessing and mitigating risks to safe navigation It provides and maintains more than 51000 buoys beacons lights and other aids to mark channels and denote hazards
Resource Hours FY 2011 resource hours totaled 98819 and increased approximately 37 percent from FY 2010 This is an approximately 12 percent decrease from the baseline level
wwwoigdhsgov 17 OIG-12-119
Aids-to-Navigation Performance Measure ndash Availability of Maritime Navigation Aids
FY 2006 FY 2007 FY 2008 FY 2009 FY 2010 FY 2011 FY 2011 Actual Actual Actual Actual Actual Target Actual 968 980 983 980 985 975 985
X Not Met Met Met Met Met Met
Source DHS-OIG based on USCG-provided data
Aids-to-Navigation Performance Measure ndash Average Number of Navigational Accidents
FY 2006 FY 2007 FY 2008 FY 2009 FY 2010 FY 2011 FY 2011 Actual Actual Actual Actual Actual Target Actual 1765 1823 1857 1878 1878 1945
X Not Met
X Not Met
X Not Met
X Not Met
X Not Met Met
Source DHS-OIG based on USCG-provided data
OFFICE OF INSPECTOR GENERAL Department of Homeland Security
Source DHS-OIG based on USCG-provided data
Performance Measures and Results The USCG reported that it met its FY 2011 target for the availability of maritime navigation aids for the fifth consecutive year
In FY 2011 the USCG reported that it met its target for the average number of navigational accidents This is the first time this measure was met in the past six years
wwwoigdhsgov 18 OIG-12-119
Ice Operations Performance Measure ndash Number of Days Critical Waterways Are Closed to
Commerce Due to Ice FY 2006 FY 2007 FY 2008 FY 2009 FY 2010 FY 2011 FY 2011 Actual Actual Actual Actual Actual Target Actual
0 0 0 0 6 2 avg amp 8 severe
0
Met Met Met Met X
Not Met Met Source DHS-OIG based on USCG-provided data
OFFICE OF INSPECTOR GENERAL Department of Homeland Security
Ice Operations
This mission supports winter commerce and prevents and responds to ice that causes flooding These activities are essential to winter and spring commerce and the safety of waterside communities on the Great Lakes in New England and on the Hudson River and occasionally in the mid-Atlantic
Resource Hours In FY 2011 resource hours totaled 10747 and decreased approximately 77 percent from FY 2010 which is approximately 10 percent lower than the baseline level
Source DHS-OIG based on USCG-provided data
Performance Measures and Results The USCG reported that it met its FY 2011 target for the number of days critical waterways are closed to commerce due to ice Domestic icebreakers on the Great Lakes assisted over 1700 commercial vessel transits carrying $300 million in bulk commodities Favorable environmental conditions continued partnership with the Canadian Coast Guard and effective employment of domestic icebreaking assets contributed to achieving the performance target
wwwoigdhsgov 19 OIG-12-119
OFFICE OF INSPECTOR GENERAL Department of Homeland Security
Appendix D Homeland Security Missions
The FY 2011 homeland security mission resource hours totaled 355586 and decreased by approximately 05 percent from FY 2010 Between FY 2006 and FY 2011 total resource hours for homeland security missions were the highest in FY 2007 However the FY 2011 level remains at approximately 91 percent above baseline levels as depicted in the following graph
Source DHS-OIG based on USCG-provided data
In FY 2011 the USCG reported that it met or exceeded 5 of 11 summary performance measures for its 5 homeland security missions compared with meeting 2 of 5 summary performance measures in FY 2010 The resource hours and performance measures and results for each non-homeland security mission are summarized below
Ports Waterways and Coastal Security
The ports waterways and coastal security mission aims to deny terrorists the use and exploitation of the maritime domain and marine transportation system as a means for attacks on US territory population centers vessels and maritime critical infrastructure and key resources This mission includes preparedness planning and exercises antiterrorism and counterterrorism activities and initial recovery efforts if attacks are successful
wwwoigdhsgov 20 OIG-12-119
OFFICE OF INSPECTOR GENERAL Department of Homeland Security
Resource Hours In FY 2011 resource hours for ports waterways and coastal security totaled 155969 which is a decrease of 09 percent from FY 2010
Source DHS-OIG based on USCG-provided data
Performance Measures and Results USCG reported that it met three of its six FY 2011 targets for ports waterways and coastal security In FY 2011 the USCG added two new summary measures related to compliance with security regulations and significantly updated the methodology for the FY 2010 summary measure Percent Reduction in Maritime Terrorism Risk over which the USCG has Influence resulting in four maritime security risk measures as shown in the following charts The USCG improved and created a new baseline for the maritime security risk measures in FY 2010 thus FY 2011 results should not be compared to previous years
The revised maritime security risk measures are risk-based outcome measures that begin with an assessment of likely high-consequence maritime terrorist attack scenarios Threat vulnerability and consequence levels are estimated for each scenario which generates a proxy (index) value of raw risk that exists in the maritime domain Next the USCG interventions (security and response operations regime and awareness activities) for the fiscal year are scored against the scenarios with regard to the decreases in threat vulnerability and consequence that each has been estimated to have afforded The resulting measures are proxy measures of performance
As depicted below the USCG reported that it met its FY 2011 target for ldquoPercent Reduction of all Maritime Security Risk Subject to USCG Influencerdquo
wwwoigdhsgov 21 OIG-12-119
Ports Waterways and Coastal Security Performance Measure ndash Percent Reduction of all Maritime Security Risk
Subject to USCG Influence
FY 2006 Actual
FY 2007 Actual
FY 2008 Actual
FY 2009 Actual
FY 2010 Actual
FY 2011 Target
FY 2011 Actual
NA NA NA NA NA 44 44
Met Met Met Met Met Met Source DHS-OIG based on USCG-provided data
OFFICE OF INSPECTOR GENERAL Department of Homeland Security
USCG exceeded its FY 2011 target for Percent Reduction of all Maritime Security Risk Resulting from USCG Consequence Management
Ports Waterways and Coastal Security Performance Measure ndash Percent Reduction of Maritime Security Risk
Resulting from US Coast Guard Consequence Management
FY 2006 Actual
FY 2007 Actual
FY 2008 Actual
FY 2009 Actual
FY 2010 Actual
FY 2011 Target
FY 2011 Actual
NA NA NA NA NA 3 4
Met Met Met Met Met Met Source DHS-OIG based on USCG-provided data
USCG did not meet its target for ldquoPercent Reduction of Maritime Security Risk Resulting from USCG Efforts to Prevent a Terrorist Entering the US via Maritime Meansrdquo This is attributable to lower effectiveness judgments for the Maritime Security Response Team due to the loss of dedicated airlift and the suspension of hook-and-climb training Additionally major cutter capacity decreased due to the decommissioning of one High Endurance Cutter and an overall reduction of major cutter resource hours
Ports Waterways and Coastal Security Performance Measure ndash Percent Reduction of Maritime Security Risk
Resulting from USCG Efforts to Prevent a Terrorist Entering the US via Maritime Means
FY 2006 Actual
FY 2007 Actual
FY 2008 Actual
FY 2009 Actual
FY 2010 Actual
FY 2011 Target
FY 2011 Actual
NA NA NA NA NA 52 43
Met Met Met Met Met Not Met Source DHS-OIG based on USCG-provided data
USCG missed its target for ldquoPercent Reduction of Maritime Security Risk Resulting from USCG Efforts to Prevent a Weapon of Mass Destruction from Entering the United States
wwwoigdhsgov 22 OIG-12-119
Ports Waterways and Coastal Security Performance Measure ndash Percent Reduction of Maritime Security Risk
Resulting from USCG Efforts to Prevent a Weapon of Mass Destruction from Entering the US via Maritime Means
FY 2006 Actual
FY 2007 Actual
FY 2008 Actual
FY 2009 Actual
FY 2010 Actual
FY 2011 Target
FY 2011 Actual
NA NA NA NA NA 29 28
Met Met Met Met Met Not Met
Ports Waterways and Coastal Security Performance Measure ndash Annual Maritime Transportation Security Act Facility
Compliance Rate with Transportation Worker Identification Credential Regulations
FY 2006 Actual
FY 2007 Actual
FY 2008 Actual
FY 2009 Actual
FY 2010 Actual
FY 2011 Target
FY 2011 Actual
NA NA NA NA 100 85 99
NA NA NA NA Met Met
Source DHS-OIG based on USCG-provided data
OFFICE OF INSPECTOR GENERAL Department of Homeland Security
via Maritime Meansrdquo by one percentage point This is attributable to lower effectiveness judgments for the Maritime Security Response Team due to loss of dedicated airlift and the challenges of identifying a broad range of Weapons of Mass Destruction amongst the volume of legitimate shipping cargo Additionally major cutter capacity decreased due to the decommissioning of one High Endurance Cutter and an overall reduction of major cutter resource hours
Source DHS-OIG based on USCG-provided data
USCG exceeded its FY 2011 target for ldquoAnnual Maritime Transportation Security Act Facility Compliance Rate with Transportation Worker Identification Credential Regulationsrdquo
USCG missed its target for ldquoPercent of Maritime Facilities in Compliance with Security Regulationsrdquo by only one-tenth of one percent The USCG has focused the use of its personnel resources to conduct Maritime Transportation Security Act compliance exams at waterfront facilities that are at higher risk for a transportation security incident By increasing partnerships with these facilities 999 percent of regulated facilities did not have serious deficiencies warranting a notice of violation or civil penalty in FY 2011
wwwoigdhsgov 23 OIG-12-119
Ports Waterways and Coastal Security Performance Measure ndash Percent Of Maritime Facilities in Compliance with
Security Regulations
FY 2006 Actual
FY 2007 Actual
FY 2008 Actual
FY 2009 Actual
FY 2010 Actual
FY 2011 Target
FY 2011 Actual
NA NA NA NA NA 100 999
NA NA NA NA NA Not Met
Source DHS-OIG based on USCG-provided data
OFFICE OF INSPECTOR GENERAL Department of Homeland Security
Drug Interdiction
USCGrsquos drug interdiction efforts support national strategies to disrupt the market for illegal drugs and prevent transnational threats from reaching the United States The USCG is the lead Federal agency for drug interdiction on the high seas and shares the lead for drug interdiction in the territorial seas of the US with Customs and Border Protection The USCG coordinates with its interagency partners to deter illicit drug trafficking including the Department of Defense Department of Justice Department of State and other components within DHS
Resource Hours FY 2011 resource hours totaled 73401 and increased by approximately 9 percent from FY 2010 but are about 40 percent below baseline levels
Source DHS-OIG based on USCG-provided data
Performance Measures and Results The USCG uses the interagency Consolidated Counter Drug Database as its main source for tracking cocaine movement estimates
wwwoigdhsgov 24 OIG-12-119
Drug Interdiction Performance Measure ndash Removal Rate for Cocaine from Non-commercial
Vessels in Maritime Transit Zone FY 2006 FY 2007 FY 2008 FY 2009 FY 2010 FY 2011 FY 2011 Actual Actual Actual Actual Actual Target Actual
NA NA NA 150 135 155 116
NA NA NA X
Not Met X
Not Met X
Not Met Source DHS-OIG based on USCG-provided data
OFFICE OF INSPECTOR GENERAL Department of Homeland Security
The one performance measure related to Drug Interdiction ldquoRemoval Rate for Cocaine from Non-commercial Vessels in Maritime Transit Zonerdquo was not met in FY 2011 According to the USCG the reasons for not meeting this target can be attributed to reduced asset and resource availability smaller average load sizes of cocaine and increasingly sophisticated criminal organizations
Migrant Interdiction
USCG migrant interdiction policy and operations are designed to provide effective law enforcement presence at sea and achieve three main objectives (1) deter undocumented migrants and transnational human smugglers from using maritime routes to enter the US (2) detect and interdict undocumented migrants and human smugglers far from the US border and (3) expand USCG participation in multi-agency and bi-national border security initiatives While the USCG leads the interdiction mission on the high seas it partners with Customs and Border Protection and Immigration and Customs Enforcement for shore-side interdiction operations
Resource Hours Migrant interdiction resource hours remain approximately 144 percent above baseline levels In FY 2011 resource hours totaled 72213 and decreased approximately 60 percent from FY 2010 to FY 2011
wwwoigdhsgov 25 OIG-12-119
Migrant Interdiction Performance Measure ndash Percentage of Undocumented Migrants who
Attempt to Enter the United States Via Maritime Routes that are Interdicted
FY 2006 Actual
FY 2007 Actual
FY 2008 Actual
FY 2009 Actual
FY 2010 Actual
FY 2011 Target
FY 2011 Actual
NA 652 627 844 645 739 728
NA Not Met Not Met Met Not Met Not Met
OFFICE OF INSPECTOR GENERAL Department of Homeland Security
Source DHS-OIG based on USCG-provided data
Performance Measures and Results According to the USCG the number of undocumented migrants attempting to enter the US remained low in FY 2011 compared to numbers observed over the last decade due in part to a slumping US economy successful prosecution of smugglers effective bilateral cooperation and use of biometrics The USCG reported that it met one of its two performance measures related to migrant interdiction in FY 2011 Although the USCG did not meet the target for ldquoPercentage of Undocumented Migrants who Attempt to Enter the United States via Maritime Routes that are Interdictedrdquo the actual result of 728 percent was an improvement over FY 2010rsquos 645 percent This measure includes migrants who are interdicted by foreign counterparts of the USCG many of whom have fewer resources than the USCG
Source DHS-OIG based on USCG-provided data
As shown in the table below the USCG exceeded its target for the ldquoPercent of Undocumented Migrants who Attempt to Enter the United States via Maritime Routes Interdicted by the Coast Guardrdquo
wwwoigdhsgov 26 OIG-12-119
Migrant Interdiction Performance Measure ndash Percent of Undocumented Migrants who Attempt to Enter the United States via Maritime Routes Interdicted by the Coast Guard
FY 2006 Actual
FY 2007 Actual
FY 2008 Actual
FY 2009 Actual
FY 2010 Actual
FY 2011 Target
FY 2011 Actual
NA 421 469 375 447 430 517
NA NA Not Met Not Met Met Met
Source DHS-OIG based on USCG-provided data
OFFICE OF INSPECTOR GENERAL Department of Homeland Security
Defense Readiness
The USCG maintains a level of readiness and training that allows for the immediate integration with Department of Defense forces for peacetime operations or during times of war This supports US national interests abroad as well as facilitating support to DHS for the integration of Homeland Defense and Homeland Security
Resource Hours In FY 2011 resource hours for Defense Readiness totaled 41424 and were still above the baseline although resource hours decreased by 119 percent from FY 2010 to FY 2011
Source DHS-OIG based on USCG-provided data
Performance Measures and Results The USCG did not meet its overall target of 381 percent defense readiness for the year The declining readiness of the USCGrsquos High Endurance Cutter fleet continues to present significant challenges to mission
wwwoigdhsgov 27 OIG-12-119
Defense Readiness Performance Measure ndash Defense Readiness Assessment of all USCG High-
Endurance Cutters Patrol Boats and Port Security Units
FY 2006 Actual
FY 2007 Actual
FY 2008 Actual
FY 2009 Actual
FY 2010 Actual
FY 2011 Target
FY 2011 Actual
NA NA NA NA 241 381 251
NA NA NA NA Not Met Not Met
Source DHS-OIG based on USCG-provided data
OFFICE OF INSPECTOR GENERAL Department of Homeland Security
performance High Endurance Cutter readiness is being addressed by the USCGrsquos acquisition of the National Security Cutter
Other Law Enforcement
The other law enforcement mission orchestrates the enforcement of regulations on foreign fishing vessels This enforcement takes two forms the first is the deterrence detection and interdiction of illegal incursions into the US exclusive economic zone by foreign fishing vessels 1 The protection of the US exclusive economic zone from incursions by foreign fishing vessels contributes to a fundamental USCG maritime security objective to protect our Nationrsquos renewable natural resources The second part of the other law enforcement mission is to ensure compliance with international agreements for the management of living marine resources This is primarily accomplished through enforcement on foreign fishing vessels of conservation and management measures created by regional fishery management organizations
Resource Hours In FY 2011 resource hours for the other law enforcement mission totaled 12579 which is an increase of 445 percent from FY 2010 According to the USCG this increase in resource hours was due to increased patrols for illegal unregulated and unreported fishing activity
1 The exclusive economic zone is the zone where the US and other coastal nations have jurisdiction over economic and resource management The exclusive economic zone includes waters three to 200 miles offshore (or nine to 200 miles offshore in western Florida and Texas)
wwwoigdhsgov 28 OIG-12-119
OFFICE OF INSPECTOR GENERAL Department of Homeland Security
Source DHS-OIG based on USCG-provided data
Performance Measures and Results The USCG uses the number of detected incursions into the US Exclusive Economic Zone by foreign fishing vessels as a measure of its performance In FY 2011 there were 122 detected incursions of foreign fishing vessels into the US Exclusive Economic Zone which met the performance target of fewer than 180 incursions
Other Law Enforcement Performance Measure ndash Number of Detected Incursions of Foreign Fishing
Vessels violating US Waters
FY 2006 Actual
FY 2007 Actual
FY 2008 Actual
FY 2009 Actual
FY 2010 Actual
FY 2011 Target
FY 2011 Actual
164 126 81 112 82 lt180 122
Met Met Met Met Met Met Source DHS-OIG based on USCG-provided data
wwwoigdhsgov 29 OIG-12-119
Mission Measure Met Not Met
Non-Homeland Security Missions
Search and Rescue Percentage of People in Imminent Danger Saved in the Maritime Environment
X
Percent of Time Rescue Assets are On-Scene within 2 Hours X
Aids-to-Navigation Availability of Maritime Navigation Aids X Average Number of Navigational Accidents X
Ice Operations Number of Days Critical Waterways Are Closed to Commerce Due to Ice X Living Marine Resources Fishing Regulation Compliance Rate X
Marine Safety
5-Yr Average Number of Commercial and Recreational Deaths and Injuries
X
5-Yr Average Number of Commercial Mariner Deaths and Injuries X
5-Yr Average Number of Commercial Passenger Deaths and Injuries X
5-Yr Average Number of Recreational Boating Deaths and Injuries X
Marine Environmental Protection
Average Number of Chemical Discharge Incidents in the Maritime Environment
X
Average Number of Oil Spills in the Maritime Environment X Total Non-Homeland Security Performance Measures 9 3
Homeland Security Missions
Ports Waterways and Coastal Security
Percentage Reduction of all Maritime Security Risk Subject to USCG Influence
X
Percent Reduction of Maritime Security Risk Resulting from USCG Consequence Management
X
Percent Reduction of Maritime Security Risk Resulting from USCG Efforts to Prevent a Terrorist Entering the US via Maritime Means
X
Percent Reduction of Maritime Security Risk Resulting from USCG Efforts to Prevent a Weapon of Mass Destruction from Entering the US via Maritime Means
X
Annual MTSA Facility Compliance Rate with Transportation Worker Identification Credential Regulations
X
Percent of Maritime Facilities In Compliance with Security Regulations X
Drug Interdiction Removal Rate for Cocaine from Non-commercial Vessels in Maritime Transit Zone
X
Migrant Interdiction
Percentage of Undocumented Migrants who Attempt to Enter the United States Via Maritime Routes that are Interdicted
X
Percent of Undocumented Migrants who Attempt to Enter the US by Maritime Routes Interdicted by the USCG
X
Defense Readiness Defense Readiness Assessment of all USCG High-Endurance Cutters Patrol Boats and Port Security Units
X
Other Law Enforcement Number of Detected Incursions of Foreign Fishing Vessels Violating US Waters
X
Total Homeland Security Performance Measures 5 6
Total USCG Performance Measures 14 9 Source DHS-OIG based on USCG-provided data
OFFICE OF INSPECTOR GENERAL Department of Homeland Security
Appendix E FY 2011 Performance Measure Summary
wwwoigdhsgov 30 OIG-12-119
OFFICE OF INSPECTOR GENERAL Department of Homeland Security
Appendix F Major Contributors to This Report
Brooke Bebow Director Lisa Vonder Haar Audit Manager Stephen Doran Auditor Richard Joyce Program Analyst Marisa Coccaro Referencer
wwwoigdhsgov 31 OIG-12-119
OFFICE OF INSPECTOR GENERAL Department of Homeland Security
Appendix G Report Distribution
Department of Homeland Security
Secretary Deputy Secretary Chief of Staff Deputy Chief of Staff General Counsel Executive Secretary Director GAOOIG Liaison Office Assistant Secretary for Office of Policy Assistant Secretary for Office of Public Affairs Assistant Secretary for Office of Legislative Affairs Acting Chief Privacy Officer
United States Coast Guard
Commandant Assistant Commandant for Resources and Chief Financial Officer USCG Audit Liaison
Office of Management and Budget
Chief Homeland Security Branch DHS OIG Budget Examiner
Congress
Congressional Oversight and Appropriations Committees as appropriate
wwwoigdhsgov 32 OIG-12-119
ADDITIONAL INFORMATION AND COPIES
To obtain additional copies of this document please call us at (202) 254-4100 fax your request to (202) 254-4305 or e-mail your request to our Office of Inspector General (OIG) Office of Public Affairs at DHS-OIGOfficePublicAffairsoigdhsgov
For additional information visit our website at wwwoigdhsgov or follow us on Twitter at dhsoig
OIG HOTLINE
To expedite the reporting of alleged fraud waste abuse or mismanagement or any other kinds of criminal or noncriminal misconduct relative to Department of Homeland Security (DHS) programs and operations please visit our website at wwwoigdhsgov and click on the red tab titled Hotline to report You will be directed to complete and submit an automated DHS OIG Investigative Referral Submission Form Submission through our website ensures that your complaint will be promptly received and reviewed by DHS OIG
Should you be unable to access our website you may submit your complaint in writing to DHS Office of Inspector General Attention Office of Investigations Hotline 245 Murray Drive SW Building 410Mail Stop 2600 Washington DC 20528 or you may call 1 (800) 323-8603 or fax it directly to us at (202) 254-4297
The OIG seeks to protect the identity of each writer and caller
OFFICE OF INSPECTOR GENERAL Department of Homeland Security
Executive Summary
This report presents our annual review of the United States Coast Guardrsquos (USCGrsquos) mission performance as required by the Homeland Security Act of 2002 The Act defines the USCGrsquos 11 statutory missions as either non-homeland security missions (marine safety marine environmental protection search and rescue aids-to-navigation living marine resources and ice operations) or homeland security missions (ports waterways and coastal security drug interdiction migrant interdiction defense readiness and other law enforcement) The Act also prohibits the Secretary from substantially reducing any of the USCGrsquos missions after its transfer to the Department of Homeland Security (DHS)
The objective of this review was to determine the extent to which the USCG is maintaining its historical level of effort on non-homeland security missions To address our objective we reviewed the resource hours the USCG used to perform its various missions We also reviewed the USCGrsquos performance measures and results for each non-homeland security and homeland security mission We did not verify the accuracy of the USCG-provided data
In fiscal year 2011 the USCG dedicated approximately 4 percent more resource hours to homeland security missions than non-homeland security missions Fiscal year 2011 homeland security mission resource hours totaled 355586 while non-homeland security mission resource hours totaled 328008 Homeland security mission resource hours decreased by approximately 05 percent from fiscal year 2010 and remained approximately 91 percent above the baseline Non-homeland security mission resource hours decreased by approximately 7 percent from fiscal year 2010 and were approximately 10 percent above the baseline
The USCG reported that it met or exceeded 14 of 23 summary performance measures in FY 2011 This includes 9 of 12 non-homeland security performance measures and 5 of 11 homeland security performance measures In FY 2011 the USCG budgeted approximately the same percentage of its funding for non-homeland security missions (496 percent) as homeland security missions (504 percent)
This report contains no recommendations
wwwoigdhsgov 1 OIG-12-119
OFFICE OF INSPECTOR GENERAL Department of Homeland Security
Background
Section 888 of the Homeland Security Act of 2002 Public Law 107-296 dated November 25 2002 directs the Inspector General to conduct an annual review that assesses the performance of all USCG missions with a particular emphasis on non-homeland security missions The Act defines the USCGrsquos 11 statutory missions as either non-homeland security missions or homeland security missions and prohibits the Secretary of Homeland Security from substantially or significantly reducing any of the USCGrsquos missions or its capability to perform those missions Table 1 depicts the USCGrsquos 11 statutory missions and the alignment of those missions with USCG programs
Table 1 Alignment of USCG Programs with Statutory Non-Homeland Security and Homeland Security Missions
Non-Homeland Security Missions Alignment with USCG Programs
1 Living Marine Resources Maritime Law Enforcement 2 Marine Safety Maritime Prevention
Maritime Response 3 Marine Environmental Protection
Maritime Prevention 4 Search and Rescue Maritime Response 5 Aids-to-Navigation Marine Transportation System Management 6 Ice Operations Marine Transportation System Management
Homeland Security Missions Alignment with USCG Programs
1 Ports Waterways and Coastal Maritime Security Operations Security Maritime Prevention
2 Drug Interdiction Maritime Law Enforcement 3 Migrant Interdiction Maritime Law Enforcement 4 Defense Readiness Defense Operations 5 Other Law Enforcement Maritime Law Enforcement
Source DHS Office of Inspector General (OIG) based on USCG-provided data
The USCG uses resource hoursmdashgenerally the number of flight hours (for aircraft) and underway hours (for boats and cutters) used to carry out a specific missionmdashto determine the amount of time expended on each of its non-homeland security and homeland security missions We compared the total number of resource hours reported by the USCG from a baseline of pre-September 11 2001 data through fiscal year (FY) 2011 The USCGndashcalculated baseline is an annual average of resource hours based on eight FY quarters preceding September 11 2001 We did not verify the resource hour data reported by the USCG nor did we validate whether the USCG accurately classified resource hours used for each mission We assessed total resource hours for the 11 individual missions in order to identify the changes in each
wwwoigdhsgov 2 OIG-12-119
OFFICE OF INSPECTOR GENERAL Department of Homeland Security
Results of Review
Our review of USCG-provided data indicated that in FY 2011 the USCG dedicated approximately 4 percent more resource hours to homeland security missions than non-homeland security missions FY 2011 homeland security mission resource hours totaled 355586 while non-homeland security mission resource hours totaled 328008 FY 2011 homeland security mission resource hours decreased by approximately 05 percent from FY 2010 and remained approximately 91 percent above the baseline Non-homeland security mission resource hours decreased by approximately 7 percent from FY 2010 and were approximately 10 percent above the baseline The total number of resource hours for all missions has continued to decline since FY 2006 The USCG reported that it met or exceeded 14 of 23 summary performance measures in FY 2011 This includes 9 of 12 non-homeland security performance measures and 5 of 11 homeland security performance measures In FY 2011 the USCG budgeted approximately the same percentage of its funding for non-homeland security missions (496 percent) as homeland security missions (504 percent)
Resource Hours for Non-Homeland Security and Homeland Security Missions
Since 2006 the USCG has dedicated the majority of resource hours to homeland security missions except in FY 2010 as illustrated in the following chart
Chart 1 Resource Hours ndash All Missions
Source DHS-OIG based on USCG-provided data
Although there was virtually no gap between homeland security and non-homeland security missions in FY 2010 the increase in non-homeland security
wwwoigdhsgov 3 OIG-12-119
FY 2008 FY 2009 FY 2010 FY 2011
of of of of Total Total Total Total Missions Hours Hours Hours Hours
Mission Mission Mission Mission Hours Hours Hours Hours
Non Homeland Security
Living Marine Resources 105769 142 94178 131 93470 132 93616 137
Marine Safety 45794 62 52579 73 58828 83 64210 94
Marine Environmental Protection 3441 05 2949 04 29039 41 4682 07
Search and Rescue 61321 83 58607 82 64273 91 55934 82
Aids-to-Navigation 106638 144 100904 141 95268 134 98819 145
Ice Operations 11938 16 8033 11 11639 16 10747 16
Sub-Total 334901 452 317250 442 352517 497 328008 481
Homeland Security Ports Waterways Coastal
Security 205715 277 181264 252 157427 222 155969 228
Drug Interdiction 75892 102 80564 112 67307 95 73401 107
Migrant Interdiction 74918 101 76100 106 76848 108 72213 106
Defense Readiness 42688 58 56128 78 47030 66 41424 61
Other Law Enforcement 8272 11 6686 09 8708 12 12579 18
Sub-Total 407485 549 400742 557 357320 503 355586 520
Total 742386 1001 717992 999 709837 100 683594 1001
OFFICE OF INSPECTOR GENERAL Department of Homeland Security
mission resource hours in FY 2010 was mainly attributable to the Deepwater Horizon oil spill and earthquake relief efforts in Haiti
According to the USCGrsquos data the gap between resource hours for homeland security versus non-homeland security missions has narrowed from an approximately 10 percent difference in FY 2006 (55 percent of resource hours for homeland security missions versus 45 percent for non-homeland security missions) to approximately 4 percent in FY 2011 (52 percent of resource hours for homeland security missions versus 48 percent for non-homeland security missions)
As illustrated in table 2 the total number of resource hours the USCG dedicates to its specific statutory missions continues to decline In FY 2011 the total USCGndashreported resource hours dropped to 683594 which is a decline of approximately 8 percent compared to 742386 hours in FY 2008
Table 2 FY 2011 Coast Guard Resource Hours (Rounded)
Source DHS-OIG based on USCG-provided data (Percentage totals do not sum to 100 due to rounding)
The USCG attributes this decline in total resource hours in part to the decreased availability of assets such as cutters and aircraft due to their age or use in training activities The percentages of total resource hours by statutory
wwwoigdhsgov 4 OIG-12-119
OFFICE OF INSPECTOR GENERAL Department of Homeland Security
mission areas from FY 2006 through FY 2011 are illustrated in the following chart
Chart 2 Percentage of Total Resource Hours by Fiscal Year
0 5 10 15 20 25 30
Search and Rescue
Marine Safety
Aids-to-Navigation
Ice Operations
Marine Environmental Protection
Living Marine Resources
Illegal Drug Interdiction
Undocumented Migrant Interdiction
Other Law Enforcement
Ports Waterways Coastal Security
Defense Readiness
Percentage of Total Resource Hours by Fiscal Year
FY11
FY10
FY09
FY08
FY07
FY06
Non-Homeland Security Missions
Homeland Security Missions
Source DHS-OIG based on USCG-provided data
Resource hours for non-homeland security missions are summarized in appendix C and homeland security missions are summarized in appendix D
The USCGrsquos Mission Performance
We based the performance portion of our review on the USCGrsquos December 2011 internal report titled United States Coast Guard Fiscal Year 2011 Performance Report as well as previous USCG performance reports and OIG reports Because USCG performance reports are internal documents they contain additional management and break-out measures that we did not include in our report In addition the USCG may add retire or change the methodology of certain measures from year-to-year This report includes those measures that the USCG considers summary measures In FY 2011 the USCG used 23 summary performance measures compared with 15 summary performance measures in FY 2010 Fourteen of the 15 measures reported in FY 2010 were continued in FY
wwwoigdhsgov 5 OIG-12-119
OFFICE OF INSPECTOR GENERAL Department of Homeland Security
2011 The methodology for the remaining FY 2010 measure Percent Reduction in Maritime Terrorism Risk over which the USCG has Influence was revised resulting in four new ports waterways and coastal security measures as shown in appendix D
The USCG reported that it met or exceeded 14 of 23 summary performance measures in FY 2011 This includes 9 of 12 non-homeland security performance measures and 5 of 11 homeland security performance measures Non-homeland security performance measures and results are included in appendix C and homeland security measures and results are in appendix D Appendix E contains a summary of the USCGrsquos FY 2011 performance measures for its 11 missions
FY 2011 Budget Information
In FY 2011 the USCG budgeted approximately the same percentage of its funding for non-homeland security missions (496 percent) as homeland security missions (504 percent) Based on the USCGrsquos FY 2012 budget the historical funding gap between non-homeland security and homeland security missions is expected to remain narrow For FY 2012 the USCG budgeted approximately 518 percent of its mission resources for non-homeland security missions and 482 percent for homeland security missions The largest percentage of the USCGrsquos mission resources will continue to be dedicated to its ports waterways and coastal security mission which garnered 222 percent of the budget in FY 2012 and is projected to receive 209 percent of the budget in FY 2013
Management Comments and OIG Analysis
The formal reply from the Assistant Commandant for Resources and Chief Financial Officer for the Coast Guard is included in appendix B USCG also provided technical comments on our draft report and we addressed them as appropriate throughout the report
wwwoigdhsgov 6 OIG-12-119
OFFICE OF INSPECTOR GENERAL Department of Homeland Security
Appendix A Objectives Scope and Methodology
The DHS OIG was established by the Homeland Security Act of 2002 (Public Law 107shy296) by amendment to the Inspector General Act of 1978 This is one of a series of audit inspection and special reports prepared as part of our oversight responsibilities to promote economy efficiency and effectiveness within the Department
Section 888(f)(1) of the Homeland Security Act of 2002 directs the Inspector General to conduct an annual assessment of the USCGrsquos performance of all its missions with a particular emphasis on non-homeland security missions The objective of this review was to determine the extent to which the USCG is maintaining its historical level of effort on non-homeland security missions
We reviewed the following Government Accountability Office (GAO) reports and testimonies
bull GAO-12-14 Coast Guard Security Risk Model Meets DHS Criteria but More Training Could Enhance Its Use for Managing Programs and Operations November 2011
bull GAO-12-254T Coast Guard Observations on Arctic Requirements Icebreakers and Coordination with Stakeholders December 2011
bull GAO-12-518 Border Security Opportunities Exist to Ensure More Effective Use of DHSrsquos Air and Marine Assets March 2012
bull GAO-10-411T Coast Guard Observations on the Requested Fiscal Year 2011 Budget Past Performance and Current Challenges February 2010
bull GAO-10-268R Coast Guard Workforce Issues January 2010
We analyzed the total number of resource hours reported by the USCG prior to September 11 2001 through FY 2011 We did not attempt to verify the resource hour data nor did we attempt to validate whether the USCG had accurately categorized such data We assessed total resource hours for the USCGrsquos 11 individual missions to identify the changes in each
We analyzed performance measures and targets to determine whether the measures for each of the USCGrsquos missions had been accomplished We obtained information on performance from the USCGrsquos internal report United States Coast Guard Fiscal Year 2011 Performance Report dated December 2011 In addition we reviewed our Annual Review of the United States Coast Guardrsquos Mission Performance (FY 2010) dated September 2011 for performance measure data prior to FY 2011 We obtained budget information from DHSrsquos Budget-in-Brief for FYs 2011- FY 2013
wwwoigdhsgov 7 OIG-12-119
OFFICE OF INSPECTOR GENERAL Department of Homeland Security
We conducted this review between April and August 2012 under the authority of the Inspector General Act of 1978 as amended and according to the Quality Standards for Inspections issued by the Council of the Inspectors General on Integrity and Efficiency
wwwoigdhsgov 8 OIG-12-119
OFFICE OF INSPECTOR GENERAL Department of Homeland Security
Appendix B Management Comments to the Draft Report
US Oopartmonl of Commandant 2100 Second Street sw Stop 7245 United WashingtOn DC 20593 Homeland security States Coast Guard
StaffSymbolCG-823
United Statas Phone (202) 372-3S33 F (202)372-2311
Coast Guard
7501
AUG 3 1 2012
Reply to Audit Manager Attn of Mark Kulwicki
(202) 372-3533 To Anne L Richards
Assistant Inspector General for Audits
Subj DHS orG REPORT ON ANNUAL REVIEW OF THE UNITED STATES COAST GUARDS MISSION PERFORMANCE (FY 2011)
Ref (a) DHS orG Draft Report dated August 16 2012
I Thank you for the opportunity to review and comment on the Department of Homeland Security (DHS) Office of Inspector Generals Draft Report 12-028-AUD-USCG entitled Annual Review of the United States Coast Guards Mission Perfonnance (FY 2011)
2 The United States Coast Guard (USCG) appreciates the efforts of the orG to docwnent measures that we can take to enhance the programs overall effectiveness
3 The USCG recommends the following technical comments contained in the enclosure
4 If you have any questions my point of contact is Mr Mark Kulwicki who can be reached at (202) 372-3533
Enclosure (I) USCG technical comments
Copy Brooke Bebow Director Lisa Vonder Haar Audit Manager Stephen Doran Auditor Rkhard Joyce Program Analyst Marisa Coccaro Referencer
wwwoigdhsgov 9 OIG-12-119
OFFICE OF INSPECTOR GENERAL Department of Homeland Security
Appendix C Non-Homeland Security Missions
The FY 2011 non-homeland security mission resource hours totaled 328008 and decreased by approximately 7 percent from FY 2010 However the FY 2011 level remains at approximately 10 percent above baseline levels The following graph illustrates the trend in non-homeland security mission resource hours since 2006 compared with the baseline period
Non-Homeland Security Resource Hours
0
50000
100000
150000
200000
250000
300000
350000
Reso
urce
Hou
rs
2007
2006
Baseline
2011
2010
2009
2008
Fiscal Year Source DHS-OIG based on USCG-provided data
In FY 2011 the USCG reported that it met or exceeded 9 of 12 summary performance measures for its 6 non-homeland security missions compared with meeting 7 of 10 summary performance measures in FY 2010 The resource hours and summary performance measures and results for each non-homeland security mission are discussed below
Living Marine Resources
Living marine resources law enforcement is an obligation under the Magnuson-Stevens Fishery Conservation and Management Act the Endangered Species Act and several other laws for the protection of marine resources Its core responsibility is to provide effective and professional enforcement to advance national goals for the conservation management and recovery of living marine resources marine protected species and
wwwoigdhsgov 10 OIG-12-119
Living Marine Resources Performance Measure ndash Fishing Regulation Compliance Rate
FY 2006 Actual
FY 2007 Actual
FY 2008 Actual
FY 2009 Actual
FY 2010 Actual
FY 2011 Target
FY 2011 Actual
966 962 953 968 972 96 974 X
Not Met X
Not Met X
Not Met X
Not Met
Met
Met
Source DHS-OIG based on USCG-provided data
OFFICE OF INSPECTOR GENERAL Department of Homeland Security
national marine sanctuaries and monuments This includes enforcement of living marine resource regulations and other activities that strengthen both domestic and international living marine resources regimes
Resource Hours FY 2011 resource hours for living marine resources totaled 93616 This is an increase of 02 percent from FY 2010 and is higher than the baseline by 26 percent
Source DHS-OIG based on USCG-provided data
Performance Measures and Results The USCG uses the percentage of fishing vessels observed at-sea complying with domestic regulations as a measure of its effect on enforcement of US fisheries and protected species regulations The measure reflects the percentage of USCG boardings at-sea where no significant violations of domestic living marine resource regulations were detected As shown in the chart below the USCG reported that it met its single living marine resources performance measure in FY 2011
wwwoigdhsgov 11 OIG-12-119
OFFICE OF INSPECTOR GENERAL Department of Homeland Security
Marine Safety
The focus of the USCGrsquos marine safety mission is the prevention of deaths injuries and property loss Marine safety responsibilities include ensuring the safe and environmentally sound operation of millions of recreational vessels and thousands of US flagged commercial vessels The USCG develops and enforces Federal marine safety regulations certifies and provides credentials to over 218000 mariners investigates commercial marine casualties and shares its findings and conducts compulsory inspections as well as voluntary safety exams
Resource Hours The USCG did not report hours for this mission prior to 2005 FY 2011 resource hours for marine safety totaled 64210 and increased by approximately 91 percent from FY 2010
Source DHS-OIG based on USCG-provided data
Performance Measures and Results The USCG reported that it met three of four summary performance measures related to marine safety in FY 2011 Federal regulations require the person in charge of commercial US flagged vessels to notify the USCG of any loss of life or injury requiring professional medical treatment beyond first aid The USCG uses deaths and injuries as a measure of commercial mariner and passenger safety and the five-year average number of deaths and injuries as an indicator of long-term performance trends In FY 2011 the USCG met its target for commercial mariner deaths and injuries but missed the target for passenger deaths and injuries as shown below
wwwoigdhsgov 12 OIG-12-119
Marine Safety Performance Measure ndash Five-Year Average Number of Commercial
Mariner Deaths and Injuries
FY 2006 Actual
FY 2007 Actual
FY 2008 Actual
FY 2009 Actual
FY 2010 Actual
FY 2011 Target
FY 2011 Actual
502 526 496 498 474 lt475 431
NA NA Met Met Met Met
Source DHS-OIG based on USCG-provided data
Marine Safety Performance Measure ndash Five-Year Average Number of
Recreational Boating Deaths and Injuries FY 2006 FY 2007 FY 2008 FY 2009 FY 2010 FY 2011 FY 2011 Actual Actual Actual Actual Actual Target Actual 4366 4249 4147 4150 4091 lt4115 3904
NA NA Met Met Met Met
OFFICE OF INSPECTOR GENERAL Department of Homeland Security
Marine Safety Performance Measure ndash Five-Year Average Number of
Commercial Passenger Deaths and Injuries FY 2006 FY 2007 FY 2008 FY 2009 FY 2010 FY 2011 FY 2011 Actual Actual Actual Actual Actual Target Actual
216 238 252 238 250 lt223 232
NA NA X X X
Not Met Met Not Met Not Met Source DHS-OIG based on USCG-provided data
Federal regulations also require operators or owners of recreational vessels to file a boating accident report when a person dies or disappears from the vessel under certain circumstances The USCG uses deaths and injuries as a measure of marine safety for the recreational boating segment of the American maritime community and a five-year average of these as an indicator of long-term performance trends The USCG reported that it met its target for this measure in FY 2011
Source DHS-OIG based on USCG-provided data
In FY 2011 the USCG added a new long-term performance measure for the five-year average number of commercial and recreational deaths and injuries The target for this measure was met
wwwoigdhsgov 13 OIG-12-119
OFFICE OF INSPECTOR GENERAL Department of Homeland Security
Marine Safety Performance Measure ndash Five-Year Average Number of
Commercial and Recreational Deaths And Injuries FY 2006 FY 2007 FY 2008 FY 2009 FY 2010 FY 2011 FY 2011 Actual Actual Actual Actual Actual Target Actual
NA NA NA NA NA lt4813 4567
NA NA NA NA NA Met
Source DHS-OIG based on USCG-provided data
Marine Environmental Protection
The marine environmental protection mission focuses on minimizing oil and hazardous substance effect on human health the environment and the marine transportation system The USCG regulates the handling of oil hazardous substances and other shipboard wastes to prevent their discharge into US or international waterways stop unauthorized ocean dumping reduce ship-based air emissions and avert the introduction of invasive species The USCG is the lead Federal agency for directing the removal and mitigation of oil spills from the waters and adjoining shorelines of the coastal zone
Resource Hours Marine environmental protection resource hours totaled 4682 in FY 2011 This represents a decrease of 839 percent from FY 2010 and is attributable to the reduction of resource hours necessary for the Deepwater Horizon oil spill in the Gulf of Mexico
Source DHS-OIG based on USCG-provided data
wwwoigdhsgov 14 OIG-12-119
Marine Environmental Protection Performance Measure Average Number of Oil Spills in the Maritime Environment
FY 2006 FY 2007 FY 2008 FY 2009 FY 2010 FY 2011 FY 2011 Actual Actual Actual Actual Actual Target Actual 143 139 132 123 115 lt116 102
NA NA Met Met Met Met
Source DHS-OIG based on USCG-provided data
OFFICE OF INSPECTOR GENERAL Department of Homeland Security
Performance Measures and Results Federal regulation requires vessel or facility operators to report the discharge of any hazardous substance that equals or exceeds reportable quantities and requires the reporting of any discharge of oil or oil products that cause a sheen discoloration sludge or emulsion on or below the surface of any navigable waterway of the United States The USCG uses the number of chemical discharge incidents and the number of oil spills greater than 100 gallons as proxy indicators of marine environmental protection and normalizes five-year averages of these as indicators of long-term trends In FY 2011 the USCG reported that it met the target for ldquoAverage Number of Chemical Discharge Incidents in the Maritime Environmentrdquo which was previously reported as ldquo5-Yr Average Chemical Discharge Incidents per 100 Million Short Tons Shippedrdquo
Marine Environmental Protection Performance Measure ndash Average Number of Chemical Discharge
Incidents in the Maritime Environment FY
2006 Actual
FY 2007
Actual
FY 2008
Actual
FY 2009
Actual
FY 2010
Actual
FY FY 2011 2011
Target Actual 278 244 198 187 181 lt220 150
NA NA Met Met Met Met
Source DHS-OIG based on USCG-provided data
USCG also reported that it met the target for ldquoAverage Number of Oil Spills in the Maritime Environmentrdquo which was previously reported as ldquo5-Yr Average Oil Spills gt 100 Gallons per 100 Million Short Tons Shippedrdquo
Search and Rescue
USCG strives to minimize lives lost injury and property loss or damage by rendering aid to those in distress in the maritime environment and elsewhere as called upon The search and rescue mission is accomplished through resource readiness distress monitoring and communication search planning on-scene operations and domestic and international partnerships
wwwoigdhsgov 15 OIG-12-119
OFFICE OF INSPECTOR GENERAL Department of Homeland Security
Resource Hours Search and rescue is a demand-driven mission Requirements for search and rescue increase or decrease relative to the number of people requiring the USCGrsquos assistance Resource hours in FY 2011 totaled 55934 and decreased approximately 13 percent from FY 2010
Source DHS-OIG based on USCG-provided data
0 10000 20000 30000 40000 50000 60000 70000 80000 90000
Baseline
2006
2007
2008
2009
2010
2011 Re
sour
ce H
ours
Search and Rescue Resource Hours
Fiscal Year
Performance Measures and Results USCG met the FY 2011 target for percent of people in imminent danger saved in the maritime environment was not met Though this yearrsquos performance is below the overall target it is more than the 744 percent level posted in FY 2010 In FY 2011 the USCG saved 3804 lives in 20510 cases with 732 lives lost and 390 lives unaccounted for This total excluded outlier cases with more than 10 lives at risk Other than raw numbers of lives saved and lost there is no clear indication of the drivers that led to this decrease The USCG is conducting further analysis is in progress to identify any systemic issues Additionally uncontrollable variables such as weather location incident severity and life saving devices on board continue to influence the number and outcome of search and rescue incidents
Search and Rescue Performance Measure ndash Percent of People in Imminent Danger Saved
in the Maritime Environment FY FY FY FY FY FY FY
2006 2007 2008 2009 2010 2011 2011 Actual Actual Actual Actual Actual Target Actual
76 766 768 773 744 100 773 X X
Met Met Met Met Not Met Not Met Source DHS-OIG based on USCG-provided data
wwwoigdhsgov 16 OIG-12-119
Search and Rescue Performance Measure ndash Percent of Time Rescue Assets are On-Scene
within 2 Hours FY
2006 FY
2007 FY
2008 FY
2009 FY
2010 FY
2011 FY
2011 Actual Actual Actual Actual Actual Target Actual 937 943 933 940 933 100 931
Met Met Met Met Met X
Not Met Source DHS-OIG based on USCG-provided data
OFFICE OF INSPECTOR GENERAL Department of Homeland Security
The FY 2011 target for percent of time rescue assets are on-scene within 2 hours was not met However overall performance is in line with the USCGrsquos expectations based on placement of resources and proximity to shore of the majority of search and rescue incidents and shows consistent performance over the last six years This measure has been adjusted to exclude cases in which an operational decision was made to delay a response Certain determining factors such as weather resource availability and risk assessment delay response time
Aids-to-Navigation
USCG minimizes disruptions to maritime commerce by assessing and mitigating risks to safe navigation It provides and maintains more than 51000 buoys beacons lights and other aids to mark channels and denote hazards
Resource Hours FY 2011 resource hours totaled 98819 and increased approximately 37 percent from FY 2010 This is an approximately 12 percent decrease from the baseline level
wwwoigdhsgov 17 OIG-12-119
Aids-to-Navigation Performance Measure ndash Availability of Maritime Navigation Aids
FY 2006 FY 2007 FY 2008 FY 2009 FY 2010 FY 2011 FY 2011 Actual Actual Actual Actual Actual Target Actual 968 980 983 980 985 975 985
X Not Met Met Met Met Met Met
Source DHS-OIG based on USCG-provided data
Aids-to-Navigation Performance Measure ndash Average Number of Navigational Accidents
FY 2006 FY 2007 FY 2008 FY 2009 FY 2010 FY 2011 FY 2011 Actual Actual Actual Actual Actual Target Actual 1765 1823 1857 1878 1878 1945
X Not Met
X Not Met
X Not Met
X Not Met
X Not Met Met
Source DHS-OIG based on USCG-provided data
OFFICE OF INSPECTOR GENERAL Department of Homeland Security
Source DHS-OIG based on USCG-provided data
Performance Measures and Results The USCG reported that it met its FY 2011 target for the availability of maritime navigation aids for the fifth consecutive year
In FY 2011 the USCG reported that it met its target for the average number of navigational accidents This is the first time this measure was met in the past six years
wwwoigdhsgov 18 OIG-12-119
Ice Operations Performance Measure ndash Number of Days Critical Waterways Are Closed to
Commerce Due to Ice FY 2006 FY 2007 FY 2008 FY 2009 FY 2010 FY 2011 FY 2011 Actual Actual Actual Actual Actual Target Actual
0 0 0 0 6 2 avg amp 8 severe
0
Met Met Met Met X
Not Met Met Source DHS-OIG based on USCG-provided data
OFFICE OF INSPECTOR GENERAL Department of Homeland Security
Ice Operations
This mission supports winter commerce and prevents and responds to ice that causes flooding These activities are essential to winter and spring commerce and the safety of waterside communities on the Great Lakes in New England and on the Hudson River and occasionally in the mid-Atlantic
Resource Hours In FY 2011 resource hours totaled 10747 and decreased approximately 77 percent from FY 2010 which is approximately 10 percent lower than the baseline level
Source DHS-OIG based on USCG-provided data
Performance Measures and Results The USCG reported that it met its FY 2011 target for the number of days critical waterways are closed to commerce due to ice Domestic icebreakers on the Great Lakes assisted over 1700 commercial vessel transits carrying $300 million in bulk commodities Favorable environmental conditions continued partnership with the Canadian Coast Guard and effective employment of domestic icebreaking assets contributed to achieving the performance target
wwwoigdhsgov 19 OIG-12-119
OFFICE OF INSPECTOR GENERAL Department of Homeland Security
Appendix D Homeland Security Missions
The FY 2011 homeland security mission resource hours totaled 355586 and decreased by approximately 05 percent from FY 2010 Between FY 2006 and FY 2011 total resource hours for homeland security missions were the highest in FY 2007 However the FY 2011 level remains at approximately 91 percent above baseline levels as depicted in the following graph
Source DHS-OIG based on USCG-provided data
In FY 2011 the USCG reported that it met or exceeded 5 of 11 summary performance measures for its 5 homeland security missions compared with meeting 2 of 5 summary performance measures in FY 2010 The resource hours and performance measures and results for each non-homeland security mission are summarized below
Ports Waterways and Coastal Security
The ports waterways and coastal security mission aims to deny terrorists the use and exploitation of the maritime domain and marine transportation system as a means for attacks on US territory population centers vessels and maritime critical infrastructure and key resources This mission includes preparedness planning and exercises antiterrorism and counterterrorism activities and initial recovery efforts if attacks are successful
wwwoigdhsgov 20 OIG-12-119
OFFICE OF INSPECTOR GENERAL Department of Homeland Security
Resource Hours In FY 2011 resource hours for ports waterways and coastal security totaled 155969 which is a decrease of 09 percent from FY 2010
Source DHS-OIG based on USCG-provided data
Performance Measures and Results USCG reported that it met three of its six FY 2011 targets for ports waterways and coastal security In FY 2011 the USCG added two new summary measures related to compliance with security regulations and significantly updated the methodology for the FY 2010 summary measure Percent Reduction in Maritime Terrorism Risk over which the USCG has Influence resulting in four maritime security risk measures as shown in the following charts The USCG improved and created a new baseline for the maritime security risk measures in FY 2010 thus FY 2011 results should not be compared to previous years
The revised maritime security risk measures are risk-based outcome measures that begin with an assessment of likely high-consequence maritime terrorist attack scenarios Threat vulnerability and consequence levels are estimated for each scenario which generates a proxy (index) value of raw risk that exists in the maritime domain Next the USCG interventions (security and response operations regime and awareness activities) for the fiscal year are scored against the scenarios with regard to the decreases in threat vulnerability and consequence that each has been estimated to have afforded The resulting measures are proxy measures of performance
As depicted below the USCG reported that it met its FY 2011 target for ldquoPercent Reduction of all Maritime Security Risk Subject to USCG Influencerdquo
wwwoigdhsgov 21 OIG-12-119
Ports Waterways and Coastal Security Performance Measure ndash Percent Reduction of all Maritime Security Risk
Subject to USCG Influence
FY 2006 Actual
FY 2007 Actual
FY 2008 Actual
FY 2009 Actual
FY 2010 Actual
FY 2011 Target
FY 2011 Actual
NA NA NA NA NA 44 44
Met Met Met Met Met Met Source DHS-OIG based on USCG-provided data
OFFICE OF INSPECTOR GENERAL Department of Homeland Security
USCG exceeded its FY 2011 target for Percent Reduction of all Maritime Security Risk Resulting from USCG Consequence Management
Ports Waterways and Coastal Security Performance Measure ndash Percent Reduction of Maritime Security Risk
Resulting from US Coast Guard Consequence Management
FY 2006 Actual
FY 2007 Actual
FY 2008 Actual
FY 2009 Actual
FY 2010 Actual
FY 2011 Target
FY 2011 Actual
NA NA NA NA NA 3 4
Met Met Met Met Met Met Source DHS-OIG based on USCG-provided data
USCG did not meet its target for ldquoPercent Reduction of Maritime Security Risk Resulting from USCG Efforts to Prevent a Terrorist Entering the US via Maritime Meansrdquo This is attributable to lower effectiveness judgments for the Maritime Security Response Team due to the loss of dedicated airlift and the suspension of hook-and-climb training Additionally major cutter capacity decreased due to the decommissioning of one High Endurance Cutter and an overall reduction of major cutter resource hours
Ports Waterways and Coastal Security Performance Measure ndash Percent Reduction of Maritime Security Risk
Resulting from USCG Efforts to Prevent a Terrorist Entering the US via Maritime Means
FY 2006 Actual
FY 2007 Actual
FY 2008 Actual
FY 2009 Actual
FY 2010 Actual
FY 2011 Target
FY 2011 Actual
NA NA NA NA NA 52 43
Met Met Met Met Met Not Met Source DHS-OIG based on USCG-provided data
USCG missed its target for ldquoPercent Reduction of Maritime Security Risk Resulting from USCG Efforts to Prevent a Weapon of Mass Destruction from Entering the United States
wwwoigdhsgov 22 OIG-12-119
Ports Waterways and Coastal Security Performance Measure ndash Percent Reduction of Maritime Security Risk
Resulting from USCG Efforts to Prevent a Weapon of Mass Destruction from Entering the US via Maritime Means
FY 2006 Actual
FY 2007 Actual
FY 2008 Actual
FY 2009 Actual
FY 2010 Actual
FY 2011 Target
FY 2011 Actual
NA NA NA NA NA 29 28
Met Met Met Met Met Not Met
Ports Waterways and Coastal Security Performance Measure ndash Annual Maritime Transportation Security Act Facility
Compliance Rate with Transportation Worker Identification Credential Regulations
FY 2006 Actual
FY 2007 Actual
FY 2008 Actual
FY 2009 Actual
FY 2010 Actual
FY 2011 Target
FY 2011 Actual
NA NA NA NA 100 85 99
NA NA NA NA Met Met
Source DHS-OIG based on USCG-provided data
OFFICE OF INSPECTOR GENERAL Department of Homeland Security
via Maritime Meansrdquo by one percentage point This is attributable to lower effectiveness judgments for the Maritime Security Response Team due to loss of dedicated airlift and the challenges of identifying a broad range of Weapons of Mass Destruction amongst the volume of legitimate shipping cargo Additionally major cutter capacity decreased due to the decommissioning of one High Endurance Cutter and an overall reduction of major cutter resource hours
Source DHS-OIG based on USCG-provided data
USCG exceeded its FY 2011 target for ldquoAnnual Maritime Transportation Security Act Facility Compliance Rate with Transportation Worker Identification Credential Regulationsrdquo
USCG missed its target for ldquoPercent of Maritime Facilities in Compliance with Security Regulationsrdquo by only one-tenth of one percent The USCG has focused the use of its personnel resources to conduct Maritime Transportation Security Act compliance exams at waterfront facilities that are at higher risk for a transportation security incident By increasing partnerships with these facilities 999 percent of regulated facilities did not have serious deficiencies warranting a notice of violation or civil penalty in FY 2011
wwwoigdhsgov 23 OIG-12-119
Ports Waterways and Coastal Security Performance Measure ndash Percent Of Maritime Facilities in Compliance with
Security Regulations
FY 2006 Actual
FY 2007 Actual
FY 2008 Actual
FY 2009 Actual
FY 2010 Actual
FY 2011 Target
FY 2011 Actual
NA NA NA NA NA 100 999
NA NA NA NA NA Not Met
Source DHS-OIG based on USCG-provided data
OFFICE OF INSPECTOR GENERAL Department of Homeland Security
Drug Interdiction
USCGrsquos drug interdiction efforts support national strategies to disrupt the market for illegal drugs and prevent transnational threats from reaching the United States The USCG is the lead Federal agency for drug interdiction on the high seas and shares the lead for drug interdiction in the territorial seas of the US with Customs and Border Protection The USCG coordinates with its interagency partners to deter illicit drug trafficking including the Department of Defense Department of Justice Department of State and other components within DHS
Resource Hours FY 2011 resource hours totaled 73401 and increased by approximately 9 percent from FY 2010 but are about 40 percent below baseline levels
Source DHS-OIG based on USCG-provided data
Performance Measures and Results The USCG uses the interagency Consolidated Counter Drug Database as its main source for tracking cocaine movement estimates
wwwoigdhsgov 24 OIG-12-119
Drug Interdiction Performance Measure ndash Removal Rate for Cocaine from Non-commercial
Vessels in Maritime Transit Zone FY 2006 FY 2007 FY 2008 FY 2009 FY 2010 FY 2011 FY 2011 Actual Actual Actual Actual Actual Target Actual
NA NA NA 150 135 155 116
NA NA NA X
Not Met X
Not Met X
Not Met Source DHS-OIG based on USCG-provided data
OFFICE OF INSPECTOR GENERAL Department of Homeland Security
The one performance measure related to Drug Interdiction ldquoRemoval Rate for Cocaine from Non-commercial Vessels in Maritime Transit Zonerdquo was not met in FY 2011 According to the USCG the reasons for not meeting this target can be attributed to reduced asset and resource availability smaller average load sizes of cocaine and increasingly sophisticated criminal organizations
Migrant Interdiction
USCG migrant interdiction policy and operations are designed to provide effective law enforcement presence at sea and achieve three main objectives (1) deter undocumented migrants and transnational human smugglers from using maritime routes to enter the US (2) detect and interdict undocumented migrants and human smugglers far from the US border and (3) expand USCG participation in multi-agency and bi-national border security initiatives While the USCG leads the interdiction mission on the high seas it partners with Customs and Border Protection and Immigration and Customs Enforcement for shore-side interdiction operations
Resource Hours Migrant interdiction resource hours remain approximately 144 percent above baseline levels In FY 2011 resource hours totaled 72213 and decreased approximately 60 percent from FY 2010 to FY 2011
wwwoigdhsgov 25 OIG-12-119
Migrant Interdiction Performance Measure ndash Percentage of Undocumented Migrants who
Attempt to Enter the United States Via Maritime Routes that are Interdicted
FY 2006 Actual
FY 2007 Actual
FY 2008 Actual
FY 2009 Actual
FY 2010 Actual
FY 2011 Target
FY 2011 Actual
NA 652 627 844 645 739 728
NA Not Met Not Met Met Not Met Not Met
OFFICE OF INSPECTOR GENERAL Department of Homeland Security
Source DHS-OIG based on USCG-provided data
Performance Measures and Results According to the USCG the number of undocumented migrants attempting to enter the US remained low in FY 2011 compared to numbers observed over the last decade due in part to a slumping US economy successful prosecution of smugglers effective bilateral cooperation and use of biometrics The USCG reported that it met one of its two performance measures related to migrant interdiction in FY 2011 Although the USCG did not meet the target for ldquoPercentage of Undocumented Migrants who Attempt to Enter the United States via Maritime Routes that are Interdictedrdquo the actual result of 728 percent was an improvement over FY 2010rsquos 645 percent This measure includes migrants who are interdicted by foreign counterparts of the USCG many of whom have fewer resources than the USCG
Source DHS-OIG based on USCG-provided data
As shown in the table below the USCG exceeded its target for the ldquoPercent of Undocumented Migrants who Attempt to Enter the United States via Maritime Routes Interdicted by the Coast Guardrdquo
wwwoigdhsgov 26 OIG-12-119
Migrant Interdiction Performance Measure ndash Percent of Undocumented Migrants who Attempt to Enter the United States via Maritime Routes Interdicted by the Coast Guard
FY 2006 Actual
FY 2007 Actual
FY 2008 Actual
FY 2009 Actual
FY 2010 Actual
FY 2011 Target
FY 2011 Actual
NA 421 469 375 447 430 517
NA NA Not Met Not Met Met Met
Source DHS-OIG based on USCG-provided data
OFFICE OF INSPECTOR GENERAL Department of Homeland Security
Defense Readiness
The USCG maintains a level of readiness and training that allows for the immediate integration with Department of Defense forces for peacetime operations or during times of war This supports US national interests abroad as well as facilitating support to DHS for the integration of Homeland Defense and Homeland Security
Resource Hours In FY 2011 resource hours for Defense Readiness totaled 41424 and were still above the baseline although resource hours decreased by 119 percent from FY 2010 to FY 2011
Source DHS-OIG based on USCG-provided data
Performance Measures and Results The USCG did not meet its overall target of 381 percent defense readiness for the year The declining readiness of the USCGrsquos High Endurance Cutter fleet continues to present significant challenges to mission
wwwoigdhsgov 27 OIG-12-119
Defense Readiness Performance Measure ndash Defense Readiness Assessment of all USCG High-
Endurance Cutters Patrol Boats and Port Security Units
FY 2006 Actual
FY 2007 Actual
FY 2008 Actual
FY 2009 Actual
FY 2010 Actual
FY 2011 Target
FY 2011 Actual
NA NA NA NA 241 381 251
NA NA NA NA Not Met Not Met
Source DHS-OIG based on USCG-provided data
OFFICE OF INSPECTOR GENERAL Department of Homeland Security
performance High Endurance Cutter readiness is being addressed by the USCGrsquos acquisition of the National Security Cutter
Other Law Enforcement
The other law enforcement mission orchestrates the enforcement of regulations on foreign fishing vessels This enforcement takes two forms the first is the deterrence detection and interdiction of illegal incursions into the US exclusive economic zone by foreign fishing vessels 1 The protection of the US exclusive economic zone from incursions by foreign fishing vessels contributes to a fundamental USCG maritime security objective to protect our Nationrsquos renewable natural resources The second part of the other law enforcement mission is to ensure compliance with international agreements for the management of living marine resources This is primarily accomplished through enforcement on foreign fishing vessels of conservation and management measures created by regional fishery management organizations
Resource Hours In FY 2011 resource hours for the other law enforcement mission totaled 12579 which is an increase of 445 percent from FY 2010 According to the USCG this increase in resource hours was due to increased patrols for illegal unregulated and unreported fishing activity
1 The exclusive economic zone is the zone where the US and other coastal nations have jurisdiction over economic and resource management The exclusive economic zone includes waters three to 200 miles offshore (or nine to 200 miles offshore in western Florida and Texas)
wwwoigdhsgov 28 OIG-12-119
OFFICE OF INSPECTOR GENERAL Department of Homeland Security
Source DHS-OIG based on USCG-provided data
Performance Measures and Results The USCG uses the number of detected incursions into the US Exclusive Economic Zone by foreign fishing vessels as a measure of its performance In FY 2011 there were 122 detected incursions of foreign fishing vessels into the US Exclusive Economic Zone which met the performance target of fewer than 180 incursions
Other Law Enforcement Performance Measure ndash Number of Detected Incursions of Foreign Fishing
Vessels violating US Waters
FY 2006 Actual
FY 2007 Actual
FY 2008 Actual
FY 2009 Actual
FY 2010 Actual
FY 2011 Target
FY 2011 Actual
164 126 81 112 82 lt180 122
Met Met Met Met Met Met Source DHS-OIG based on USCG-provided data
wwwoigdhsgov 29 OIG-12-119
Mission Measure Met Not Met
Non-Homeland Security Missions
Search and Rescue Percentage of People in Imminent Danger Saved in the Maritime Environment
X
Percent of Time Rescue Assets are On-Scene within 2 Hours X
Aids-to-Navigation Availability of Maritime Navigation Aids X Average Number of Navigational Accidents X
Ice Operations Number of Days Critical Waterways Are Closed to Commerce Due to Ice X Living Marine Resources Fishing Regulation Compliance Rate X
Marine Safety
5-Yr Average Number of Commercial and Recreational Deaths and Injuries
X
5-Yr Average Number of Commercial Mariner Deaths and Injuries X
5-Yr Average Number of Commercial Passenger Deaths and Injuries X
5-Yr Average Number of Recreational Boating Deaths and Injuries X
Marine Environmental Protection
Average Number of Chemical Discharge Incidents in the Maritime Environment
X
Average Number of Oil Spills in the Maritime Environment X Total Non-Homeland Security Performance Measures 9 3
Homeland Security Missions
Ports Waterways and Coastal Security
Percentage Reduction of all Maritime Security Risk Subject to USCG Influence
X
Percent Reduction of Maritime Security Risk Resulting from USCG Consequence Management
X
Percent Reduction of Maritime Security Risk Resulting from USCG Efforts to Prevent a Terrorist Entering the US via Maritime Means
X
Percent Reduction of Maritime Security Risk Resulting from USCG Efforts to Prevent a Weapon of Mass Destruction from Entering the US via Maritime Means
X
Annual MTSA Facility Compliance Rate with Transportation Worker Identification Credential Regulations
X
Percent of Maritime Facilities In Compliance with Security Regulations X
Drug Interdiction Removal Rate for Cocaine from Non-commercial Vessels in Maritime Transit Zone
X
Migrant Interdiction
Percentage of Undocumented Migrants who Attempt to Enter the United States Via Maritime Routes that are Interdicted
X
Percent of Undocumented Migrants who Attempt to Enter the US by Maritime Routes Interdicted by the USCG
X
Defense Readiness Defense Readiness Assessment of all USCG High-Endurance Cutters Patrol Boats and Port Security Units
X
Other Law Enforcement Number of Detected Incursions of Foreign Fishing Vessels Violating US Waters
X
Total Homeland Security Performance Measures 5 6
Total USCG Performance Measures 14 9 Source DHS-OIG based on USCG-provided data
OFFICE OF INSPECTOR GENERAL Department of Homeland Security
Appendix E FY 2011 Performance Measure Summary
wwwoigdhsgov 30 OIG-12-119
OFFICE OF INSPECTOR GENERAL Department of Homeland Security
Appendix F Major Contributors to This Report
Brooke Bebow Director Lisa Vonder Haar Audit Manager Stephen Doran Auditor Richard Joyce Program Analyst Marisa Coccaro Referencer
wwwoigdhsgov 31 OIG-12-119
OFFICE OF INSPECTOR GENERAL Department of Homeland Security
Appendix G Report Distribution
Department of Homeland Security
Secretary Deputy Secretary Chief of Staff Deputy Chief of Staff General Counsel Executive Secretary Director GAOOIG Liaison Office Assistant Secretary for Office of Policy Assistant Secretary for Office of Public Affairs Assistant Secretary for Office of Legislative Affairs Acting Chief Privacy Officer
United States Coast Guard
Commandant Assistant Commandant for Resources and Chief Financial Officer USCG Audit Liaison
Office of Management and Budget
Chief Homeland Security Branch DHS OIG Budget Examiner
Congress
Congressional Oversight and Appropriations Committees as appropriate
wwwoigdhsgov 32 OIG-12-119
ADDITIONAL INFORMATION AND COPIES
To obtain additional copies of this document please call us at (202) 254-4100 fax your request to (202) 254-4305 or e-mail your request to our Office of Inspector General (OIG) Office of Public Affairs at DHS-OIGOfficePublicAffairsoigdhsgov
For additional information visit our website at wwwoigdhsgov or follow us on Twitter at dhsoig
OIG HOTLINE
To expedite the reporting of alleged fraud waste abuse or mismanagement or any other kinds of criminal or noncriminal misconduct relative to Department of Homeland Security (DHS) programs and operations please visit our website at wwwoigdhsgov and click on the red tab titled Hotline to report You will be directed to complete and submit an automated DHS OIG Investigative Referral Submission Form Submission through our website ensures that your complaint will be promptly received and reviewed by DHS OIG
Should you be unable to access our website you may submit your complaint in writing to DHS Office of Inspector General Attention Office of Investigations Hotline 245 Murray Drive SW Building 410Mail Stop 2600 Washington DC 20528 or you may call 1 (800) 323-8603 or fax it directly to us at (202) 254-4297
The OIG seeks to protect the identity of each writer and caller
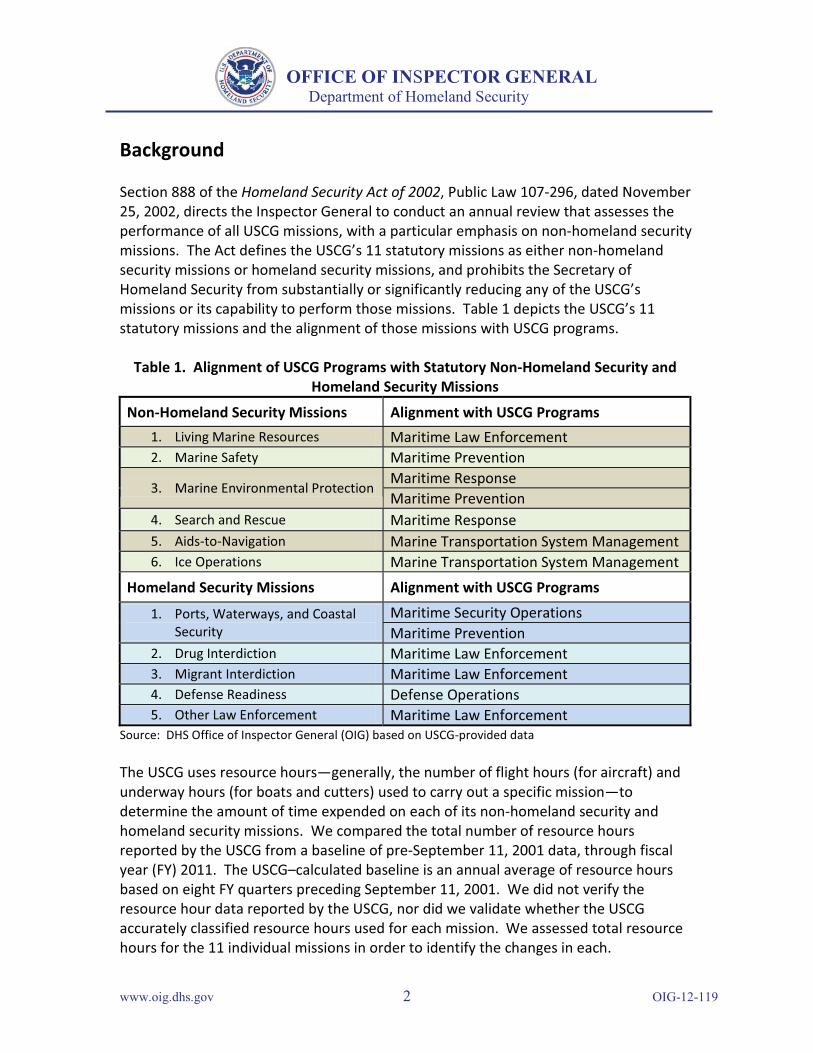
OFFICE OF INSPECTOR GENERAL Department of Homeland Security
Background
Section 888 of the Homeland Security Act of 2002 Public Law 107-296 dated November 25 2002 directs the Inspector General to conduct an annual review that assesses the performance of all USCG missions with a particular emphasis on non-homeland security missions The Act defines the USCGrsquos 11 statutory missions as either non-homeland security missions or homeland security missions and prohibits the Secretary of Homeland Security from substantially or significantly reducing any of the USCGrsquos missions or its capability to perform those missions Table 1 depicts the USCGrsquos 11 statutory missions and the alignment of those missions with USCG programs
Table 1 Alignment of USCG Programs with Statutory Non-Homeland Security and Homeland Security Missions
Non-Homeland Security Missions Alignment with USCG Programs
1 Living Marine Resources Maritime Law Enforcement 2 Marine Safety Maritime Prevention
Maritime Response 3 Marine Environmental Protection
Maritime Prevention 4 Search and Rescue Maritime Response 5 Aids-to-Navigation Marine Transportation System Management 6 Ice Operations Marine Transportation System Management
Homeland Security Missions Alignment with USCG Programs
1 Ports Waterways and Coastal Maritime Security Operations Security Maritime Prevention
2 Drug Interdiction Maritime Law Enforcement 3 Migrant Interdiction Maritime Law Enforcement 4 Defense Readiness Defense Operations 5 Other Law Enforcement Maritime Law Enforcement
Source DHS Office of Inspector General (OIG) based on USCG-provided data
The USCG uses resource hoursmdashgenerally the number of flight hours (for aircraft) and underway hours (for boats and cutters) used to carry out a specific missionmdashto determine the amount of time expended on each of its non-homeland security and homeland security missions We compared the total number of resource hours reported by the USCG from a baseline of pre-September 11 2001 data through fiscal year (FY) 2011 The USCGndashcalculated baseline is an annual average of resource hours based on eight FY quarters preceding September 11 2001 We did not verify the resource hour data reported by the USCG nor did we validate whether the USCG accurately classified resource hours used for each mission We assessed total resource hours for the 11 individual missions in order to identify the changes in each
wwwoigdhsgov 2 OIG-12-119
OFFICE OF INSPECTOR GENERAL Department of Homeland Security
Results of Review
Our review of USCG-provided data indicated that in FY 2011 the USCG dedicated approximately 4 percent more resource hours to homeland security missions than non-homeland security missions FY 2011 homeland security mission resource hours totaled 355586 while non-homeland security mission resource hours totaled 328008 FY 2011 homeland security mission resource hours decreased by approximately 05 percent from FY 2010 and remained approximately 91 percent above the baseline Non-homeland security mission resource hours decreased by approximately 7 percent from FY 2010 and were approximately 10 percent above the baseline The total number of resource hours for all missions has continued to decline since FY 2006 The USCG reported that it met or exceeded 14 of 23 summary performance measures in FY 2011 This includes 9 of 12 non-homeland security performance measures and 5 of 11 homeland security performance measures In FY 2011 the USCG budgeted approximately the same percentage of its funding for non-homeland security missions (496 percent) as homeland security missions (504 percent)
Resource Hours for Non-Homeland Security and Homeland Security Missions
Since 2006 the USCG has dedicated the majority of resource hours to homeland security missions except in FY 2010 as illustrated in the following chart
Chart 1 Resource Hours ndash All Missions
Source DHS-OIG based on USCG-provided data
Although there was virtually no gap between homeland security and non-homeland security missions in FY 2010 the increase in non-homeland security
wwwoigdhsgov 3 OIG-12-119
FY 2008 FY 2009 FY 2010 FY 2011
of of of of Total Total Total Total Missions Hours Hours Hours Hours
Mission Mission Mission Mission Hours Hours Hours Hours
Non Homeland Security
Living Marine Resources 105769 142 94178 131 93470 132 93616 137
Marine Safety 45794 62 52579 73 58828 83 64210 94
Marine Environmental Protection 3441 05 2949 04 29039 41 4682 07
Search and Rescue 61321 83 58607 82 64273 91 55934 82
Aids-to-Navigation 106638 144 100904 141 95268 134 98819 145
Ice Operations 11938 16 8033 11 11639 16 10747 16
Sub-Total 334901 452 317250 442 352517 497 328008 481
Homeland Security Ports Waterways Coastal
Security 205715 277 181264 252 157427 222 155969 228
Drug Interdiction 75892 102 80564 112 67307 95 73401 107
Migrant Interdiction 74918 101 76100 106 76848 108 72213 106
Defense Readiness 42688 58 56128 78 47030 66 41424 61
Other Law Enforcement 8272 11 6686 09 8708 12 12579 18
Sub-Total 407485 549 400742 557 357320 503 355586 520
Total 742386 1001 717992 999 709837 100 683594 1001
OFFICE OF INSPECTOR GENERAL Department of Homeland Security
mission resource hours in FY 2010 was mainly attributable to the Deepwater Horizon oil spill and earthquake relief efforts in Haiti
According to the USCGrsquos data the gap between resource hours for homeland security versus non-homeland security missions has narrowed from an approximately 10 percent difference in FY 2006 (55 percent of resource hours for homeland security missions versus 45 percent for non-homeland security missions) to approximately 4 percent in FY 2011 (52 percent of resource hours for homeland security missions versus 48 percent for non-homeland security missions)
As illustrated in table 2 the total number of resource hours the USCG dedicates to its specific statutory missions continues to decline In FY 2011 the total USCGndashreported resource hours dropped to 683594 which is a decline of approximately 8 percent compared to 742386 hours in FY 2008
Table 2 FY 2011 Coast Guard Resource Hours (Rounded)
Source DHS-OIG based on USCG-provided data (Percentage totals do not sum to 100 due to rounding)
The USCG attributes this decline in total resource hours in part to the decreased availability of assets such as cutters and aircraft due to their age or use in training activities The percentages of total resource hours by statutory
wwwoigdhsgov 4 OIG-12-119
OFFICE OF INSPECTOR GENERAL Department of Homeland Security
mission areas from FY 2006 through FY 2011 are illustrated in the following chart
Chart 2 Percentage of Total Resource Hours by Fiscal Year
0 5 10 15 20 25 30
Search and Rescue
Marine Safety
Aids-to-Navigation
Ice Operations
Marine Environmental Protection
Living Marine Resources
Illegal Drug Interdiction
Undocumented Migrant Interdiction
Other Law Enforcement
Ports Waterways Coastal Security
Defense Readiness
Percentage of Total Resource Hours by Fiscal Year
FY11
FY10
FY09
FY08
FY07
FY06
Non-Homeland Security Missions
Homeland Security Missions
Source DHS-OIG based on USCG-provided data
Resource hours for non-homeland security missions are summarized in appendix C and homeland security missions are summarized in appendix D
The USCGrsquos Mission Performance
We based the performance portion of our review on the USCGrsquos December 2011 internal report titled United States Coast Guard Fiscal Year 2011 Performance Report as well as previous USCG performance reports and OIG reports Because USCG performance reports are internal documents they contain additional management and break-out measures that we did not include in our report In addition the USCG may add retire or change the methodology of certain measures from year-to-year This report includes those measures that the USCG considers summary measures In FY 2011 the USCG used 23 summary performance measures compared with 15 summary performance measures in FY 2010 Fourteen of the 15 measures reported in FY 2010 were continued in FY
wwwoigdhsgov 5 OIG-12-119
OFFICE OF INSPECTOR GENERAL Department of Homeland Security
2011 The methodology for the remaining FY 2010 measure Percent Reduction in Maritime Terrorism Risk over which the USCG has Influence was revised resulting in four new ports waterways and coastal security measures as shown in appendix D
The USCG reported that it met or exceeded 14 of 23 summary performance measures in FY 2011 This includes 9 of 12 non-homeland security performance measures and 5 of 11 homeland security performance measures Non-homeland security performance measures and results are included in appendix C and homeland security measures and results are in appendix D Appendix E contains a summary of the USCGrsquos FY 2011 performance measures for its 11 missions
FY 2011 Budget Information
In FY 2011 the USCG budgeted approximately the same percentage of its funding for non-homeland security missions (496 percent) as homeland security missions (504 percent) Based on the USCGrsquos FY 2012 budget the historical funding gap between non-homeland security and homeland security missions is expected to remain narrow For FY 2012 the USCG budgeted approximately 518 percent of its mission resources for non-homeland security missions and 482 percent for homeland security missions The largest percentage of the USCGrsquos mission resources will continue to be dedicated to its ports waterways and coastal security mission which garnered 222 percent of the budget in FY 2012 and is projected to receive 209 percent of the budget in FY 2013
Management Comments and OIG Analysis
The formal reply from the Assistant Commandant for Resources and Chief Financial Officer for the Coast Guard is included in appendix B USCG also provided technical comments on our draft report and we addressed them as appropriate throughout the report
wwwoigdhsgov 6 OIG-12-119
OFFICE OF INSPECTOR GENERAL Department of Homeland Security
Appendix A Objectives Scope and Methodology
The DHS OIG was established by the Homeland Security Act of 2002 (Public Law 107shy296) by amendment to the Inspector General Act of 1978 This is one of a series of audit inspection and special reports prepared as part of our oversight responsibilities to promote economy efficiency and effectiveness within the Department
Section 888(f)(1) of the Homeland Security Act of 2002 directs the Inspector General to conduct an annual assessment of the USCGrsquos performance of all its missions with a particular emphasis on non-homeland security missions The objective of this review was to determine the extent to which the USCG is maintaining its historical level of effort on non-homeland security missions
We reviewed the following Government Accountability Office (GAO) reports and testimonies
bull GAO-12-14 Coast Guard Security Risk Model Meets DHS Criteria but More Training Could Enhance Its Use for Managing Programs and Operations November 2011
bull GAO-12-254T Coast Guard Observations on Arctic Requirements Icebreakers and Coordination with Stakeholders December 2011
bull GAO-12-518 Border Security Opportunities Exist to Ensure More Effective Use of DHSrsquos Air and Marine Assets March 2012
bull GAO-10-411T Coast Guard Observations on the Requested Fiscal Year 2011 Budget Past Performance and Current Challenges February 2010
bull GAO-10-268R Coast Guard Workforce Issues January 2010
We analyzed the total number of resource hours reported by the USCG prior to September 11 2001 through FY 2011 We did not attempt to verify the resource hour data nor did we attempt to validate whether the USCG had accurately categorized such data We assessed total resource hours for the USCGrsquos 11 individual missions to identify the changes in each
We analyzed performance measures and targets to determine whether the measures for each of the USCGrsquos missions had been accomplished We obtained information on performance from the USCGrsquos internal report United States Coast Guard Fiscal Year 2011 Performance Report dated December 2011 In addition we reviewed our Annual Review of the United States Coast Guardrsquos Mission Performance (FY 2010) dated September 2011 for performance measure data prior to FY 2011 We obtained budget information from DHSrsquos Budget-in-Brief for FYs 2011- FY 2013
wwwoigdhsgov 7 OIG-12-119
OFFICE OF INSPECTOR GENERAL Department of Homeland Security
We conducted this review between April and August 2012 under the authority of the Inspector General Act of 1978 as amended and according to the Quality Standards for Inspections issued by the Council of the Inspectors General on Integrity and Efficiency
wwwoigdhsgov 8 OIG-12-119
OFFICE OF INSPECTOR GENERAL Department of Homeland Security
Appendix B Management Comments to the Draft Report
US Oopartmonl of Commandant 2100 Second Street sw Stop 7245 United WashingtOn DC 20593 Homeland security States Coast Guard
StaffSymbolCG-823
United Statas Phone (202) 372-3S33 F (202)372-2311
Coast Guard
7501
AUG 3 1 2012
Reply to Audit Manager Attn of Mark Kulwicki
(202) 372-3533 To Anne L Richards
Assistant Inspector General for Audits
Subj DHS orG REPORT ON ANNUAL REVIEW OF THE UNITED STATES COAST GUARDS MISSION PERFORMANCE (FY 2011)
Ref (a) DHS orG Draft Report dated August 16 2012
I Thank you for the opportunity to review and comment on the Department of Homeland Security (DHS) Office of Inspector Generals Draft Report 12-028-AUD-USCG entitled Annual Review of the United States Coast Guards Mission Perfonnance (FY 2011)
2 The United States Coast Guard (USCG) appreciates the efforts of the orG to docwnent measures that we can take to enhance the programs overall effectiveness
3 The USCG recommends the following technical comments contained in the enclosure
4 If you have any questions my point of contact is Mr Mark Kulwicki who can be reached at (202) 372-3533
Enclosure (I) USCG technical comments
Copy Brooke Bebow Director Lisa Vonder Haar Audit Manager Stephen Doran Auditor Rkhard Joyce Program Analyst Marisa Coccaro Referencer
wwwoigdhsgov 9 OIG-12-119
OFFICE OF INSPECTOR GENERAL Department of Homeland Security
Appendix C Non-Homeland Security Missions
The FY 2011 non-homeland security mission resource hours totaled 328008 and decreased by approximately 7 percent from FY 2010 However the FY 2011 level remains at approximately 10 percent above baseline levels The following graph illustrates the trend in non-homeland security mission resource hours since 2006 compared with the baseline period
Non-Homeland Security Resource Hours
0
50000
100000
150000
200000
250000
300000
350000
Reso
urce
Hou
rs
2007
2006
Baseline
2011
2010
2009
2008
Fiscal Year Source DHS-OIG based on USCG-provided data
In FY 2011 the USCG reported that it met or exceeded 9 of 12 summary performance measures for its 6 non-homeland security missions compared with meeting 7 of 10 summary performance measures in FY 2010 The resource hours and summary performance measures and results for each non-homeland security mission are discussed below
Living Marine Resources
Living marine resources law enforcement is an obligation under the Magnuson-Stevens Fishery Conservation and Management Act the Endangered Species Act and several other laws for the protection of marine resources Its core responsibility is to provide effective and professional enforcement to advance national goals for the conservation management and recovery of living marine resources marine protected species and
wwwoigdhsgov 10 OIG-12-119
Living Marine Resources Performance Measure ndash Fishing Regulation Compliance Rate
FY 2006 Actual
FY 2007 Actual
FY 2008 Actual
FY 2009 Actual
FY 2010 Actual
FY 2011 Target
FY 2011 Actual
966 962 953 968 972 96 974 X
Not Met X
Not Met X
Not Met X
Not Met
Met
Met
Source DHS-OIG based on USCG-provided data
OFFICE OF INSPECTOR GENERAL Department of Homeland Security
national marine sanctuaries and monuments This includes enforcement of living marine resource regulations and other activities that strengthen both domestic and international living marine resources regimes
Resource Hours FY 2011 resource hours for living marine resources totaled 93616 This is an increase of 02 percent from FY 2010 and is higher than the baseline by 26 percent
Source DHS-OIG based on USCG-provided data
Performance Measures and Results The USCG uses the percentage of fishing vessels observed at-sea complying with domestic regulations as a measure of its effect on enforcement of US fisheries and protected species regulations The measure reflects the percentage of USCG boardings at-sea where no significant violations of domestic living marine resource regulations were detected As shown in the chart below the USCG reported that it met its single living marine resources performance measure in FY 2011
wwwoigdhsgov 11 OIG-12-119
OFFICE OF INSPECTOR GENERAL Department of Homeland Security
Marine Safety
The focus of the USCGrsquos marine safety mission is the prevention of deaths injuries and property loss Marine safety responsibilities include ensuring the safe and environmentally sound operation of millions of recreational vessels and thousands of US flagged commercial vessels The USCG develops and enforces Federal marine safety regulations certifies and provides credentials to over 218000 mariners investigates commercial marine casualties and shares its findings and conducts compulsory inspections as well as voluntary safety exams
Resource Hours The USCG did not report hours for this mission prior to 2005 FY 2011 resource hours for marine safety totaled 64210 and increased by approximately 91 percent from FY 2010
Source DHS-OIG based on USCG-provided data
Performance Measures and Results The USCG reported that it met three of four summary performance measures related to marine safety in FY 2011 Federal regulations require the person in charge of commercial US flagged vessels to notify the USCG of any loss of life or injury requiring professional medical treatment beyond first aid The USCG uses deaths and injuries as a measure of commercial mariner and passenger safety and the five-year average number of deaths and injuries as an indicator of long-term performance trends In FY 2011 the USCG met its target for commercial mariner deaths and injuries but missed the target for passenger deaths and injuries as shown below
wwwoigdhsgov 12 OIG-12-119
Marine Safety Performance Measure ndash Five-Year Average Number of Commercial
Mariner Deaths and Injuries
FY 2006 Actual
FY 2007 Actual
FY 2008 Actual
FY 2009 Actual
FY 2010 Actual
FY 2011 Target
FY 2011 Actual
502 526 496 498 474 lt475 431
NA NA Met Met Met Met
Source DHS-OIG based on USCG-provided data
Marine Safety Performance Measure ndash Five-Year Average Number of
Recreational Boating Deaths and Injuries FY 2006 FY 2007 FY 2008 FY 2009 FY 2010 FY 2011 FY 2011 Actual Actual Actual Actual Actual Target Actual 4366 4249 4147 4150 4091 lt4115 3904
NA NA Met Met Met Met
OFFICE OF INSPECTOR GENERAL Department of Homeland Security
Marine Safety Performance Measure ndash Five-Year Average Number of
Commercial Passenger Deaths and Injuries FY 2006 FY 2007 FY 2008 FY 2009 FY 2010 FY 2011 FY 2011 Actual Actual Actual Actual Actual Target Actual
216 238 252 238 250 lt223 232
NA NA X X X
Not Met Met Not Met Not Met Source DHS-OIG based on USCG-provided data
Federal regulations also require operators or owners of recreational vessels to file a boating accident report when a person dies or disappears from the vessel under certain circumstances The USCG uses deaths and injuries as a measure of marine safety for the recreational boating segment of the American maritime community and a five-year average of these as an indicator of long-term performance trends The USCG reported that it met its target for this measure in FY 2011
Source DHS-OIG based on USCG-provided data
In FY 2011 the USCG added a new long-term performance measure for the five-year average number of commercial and recreational deaths and injuries The target for this measure was met
wwwoigdhsgov 13 OIG-12-119
OFFICE OF INSPECTOR GENERAL Department of Homeland Security
Marine Safety Performance Measure ndash Five-Year Average Number of
Commercial and Recreational Deaths And Injuries FY 2006 FY 2007 FY 2008 FY 2009 FY 2010 FY 2011 FY 2011 Actual Actual Actual Actual Actual Target Actual
NA NA NA NA NA lt4813 4567
NA NA NA NA NA Met
Source DHS-OIG based on USCG-provided data
Marine Environmental Protection
The marine environmental protection mission focuses on minimizing oil and hazardous substance effect on human health the environment and the marine transportation system The USCG regulates the handling of oil hazardous substances and other shipboard wastes to prevent their discharge into US or international waterways stop unauthorized ocean dumping reduce ship-based air emissions and avert the introduction of invasive species The USCG is the lead Federal agency for directing the removal and mitigation of oil spills from the waters and adjoining shorelines of the coastal zone
Resource Hours Marine environmental protection resource hours totaled 4682 in FY 2011 This represents a decrease of 839 percent from FY 2010 and is attributable to the reduction of resource hours necessary for the Deepwater Horizon oil spill in the Gulf of Mexico
Source DHS-OIG based on USCG-provided data
wwwoigdhsgov 14 OIG-12-119
Marine Environmental Protection Performance Measure Average Number of Oil Spills in the Maritime Environment
FY 2006 FY 2007 FY 2008 FY 2009 FY 2010 FY 2011 FY 2011 Actual Actual Actual Actual Actual Target Actual 143 139 132 123 115 lt116 102
NA NA Met Met Met Met
Source DHS-OIG based on USCG-provided data
OFFICE OF INSPECTOR GENERAL Department of Homeland Security
Performance Measures and Results Federal regulation requires vessel or facility operators to report the discharge of any hazardous substance that equals or exceeds reportable quantities and requires the reporting of any discharge of oil or oil products that cause a sheen discoloration sludge or emulsion on or below the surface of any navigable waterway of the United States The USCG uses the number of chemical discharge incidents and the number of oil spills greater than 100 gallons as proxy indicators of marine environmental protection and normalizes five-year averages of these as indicators of long-term trends In FY 2011 the USCG reported that it met the target for ldquoAverage Number of Chemical Discharge Incidents in the Maritime Environmentrdquo which was previously reported as ldquo5-Yr Average Chemical Discharge Incidents per 100 Million Short Tons Shippedrdquo
Marine Environmental Protection Performance Measure ndash Average Number of Chemical Discharge
Incidents in the Maritime Environment FY
2006 Actual
FY 2007
Actual
FY 2008
Actual
FY 2009
Actual
FY 2010
Actual
FY FY 2011 2011
Target Actual 278 244 198 187 181 lt220 150
NA NA Met Met Met Met
Source DHS-OIG based on USCG-provided data
USCG also reported that it met the target for ldquoAverage Number of Oil Spills in the Maritime Environmentrdquo which was previously reported as ldquo5-Yr Average Oil Spills gt 100 Gallons per 100 Million Short Tons Shippedrdquo
Search and Rescue
USCG strives to minimize lives lost injury and property loss or damage by rendering aid to those in distress in the maritime environment and elsewhere as called upon The search and rescue mission is accomplished through resource readiness distress monitoring and communication search planning on-scene operations and domestic and international partnerships
wwwoigdhsgov 15 OIG-12-119
OFFICE OF INSPECTOR GENERAL Department of Homeland Security
Resource Hours Search and rescue is a demand-driven mission Requirements for search and rescue increase or decrease relative to the number of people requiring the USCGrsquos assistance Resource hours in FY 2011 totaled 55934 and decreased approximately 13 percent from FY 2010
Source DHS-OIG based on USCG-provided data
0 10000 20000 30000 40000 50000 60000 70000 80000 90000
Baseline
2006
2007
2008
2009
2010
2011 Re
sour
ce H
ours
Search and Rescue Resource Hours
Fiscal Year
Performance Measures and Results USCG met the FY 2011 target for percent of people in imminent danger saved in the maritime environment was not met Though this yearrsquos performance is below the overall target it is more than the 744 percent level posted in FY 2010 In FY 2011 the USCG saved 3804 lives in 20510 cases with 732 lives lost and 390 lives unaccounted for This total excluded outlier cases with more than 10 lives at risk Other than raw numbers of lives saved and lost there is no clear indication of the drivers that led to this decrease The USCG is conducting further analysis is in progress to identify any systemic issues Additionally uncontrollable variables such as weather location incident severity and life saving devices on board continue to influence the number and outcome of search and rescue incidents
Search and Rescue Performance Measure ndash Percent of People in Imminent Danger Saved
in the Maritime Environment FY FY FY FY FY FY FY
2006 2007 2008 2009 2010 2011 2011 Actual Actual Actual Actual Actual Target Actual
76 766 768 773 744 100 773 X X
Met Met Met Met Not Met Not Met Source DHS-OIG based on USCG-provided data
wwwoigdhsgov 16 OIG-12-119
Search and Rescue Performance Measure ndash Percent of Time Rescue Assets are On-Scene
within 2 Hours FY
2006 FY
2007 FY
2008 FY
2009 FY
2010 FY
2011 FY
2011 Actual Actual Actual Actual Actual Target Actual 937 943 933 940 933 100 931
Met Met Met Met Met X
Not Met Source DHS-OIG based on USCG-provided data
OFFICE OF INSPECTOR GENERAL Department of Homeland Security
The FY 2011 target for percent of time rescue assets are on-scene within 2 hours was not met However overall performance is in line with the USCGrsquos expectations based on placement of resources and proximity to shore of the majority of search and rescue incidents and shows consistent performance over the last six years This measure has been adjusted to exclude cases in which an operational decision was made to delay a response Certain determining factors such as weather resource availability and risk assessment delay response time
Aids-to-Navigation
USCG minimizes disruptions to maritime commerce by assessing and mitigating risks to safe navigation It provides and maintains more than 51000 buoys beacons lights and other aids to mark channels and denote hazards
Resource Hours FY 2011 resource hours totaled 98819 and increased approximately 37 percent from FY 2010 This is an approximately 12 percent decrease from the baseline level
wwwoigdhsgov 17 OIG-12-119
Aids-to-Navigation Performance Measure ndash Availability of Maritime Navigation Aids
FY 2006 FY 2007 FY 2008 FY 2009 FY 2010 FY 2011 FY 2011 Actual Actual Actual Actual Actual Target Actual 968 980 983 980 985 975 985
X Not Met Met Met Met Met Met
Source DHS-OIG based on USCG-provided data
Aids-to-Navigation Performance Measure ndash Average Number of Navigational Accidents
FY 2006 FY 2007 FY 2008 FY 2009 FY 2010 FY 2011 FY 2011 Actual Actual Actual Actual Actual Target Actual 1765 1823 1857 1878 1878 1945
X Not Met
X Not Met
X Not Met
X Not Met
X Not Met Met
Source DHS-OIG based on USCG-provided data
OFFICE OF INSPECTOR GENERAL Department of Homeland Security
Source DHS-OIG based on USCG-provided data
Performance Measures and Results The USCG reported that it met its FY 2011 target for the availability of maritime navigation aids for the fifth consecutive year
In FY 2011 the USCG reported that it met its target for the average number of navigational accidents This is the first time this measure was met in the past six years
wwwoigdhsgov 18 OIG-12-119
Ice Operations Performance Measure ndash Number of Days Critical Waterways Are Closed to
Commerce Due to Ice FY 2006 FY 2007 FY 2008 FY 2009 FY 2010 FY 2011 FY 2011 Actual Actual Actual Actual Actual Target Actual
0 0 0 0 6 2 avg amp 8 severe
0
Met Met Met Met X
Not Met Met Source DHS-OIG based on USCG-provided data
OFFICE OF INSPECTOR GENERAL Department of Homeland Security
Ice Operations
This mission supports winter commerce and prevents and responds to ice that causes flooding These activities are essential to winter and spring commerce and the safety of waterside communities on the Great Lakes in New England and on the Hudson River and occasionally in the mid-Atlantic
Resource Hours In FY 2011 resource hours totaled 10747 and decreased approximately 77 percent from FY 2010 which is approximately 10 percent lower than the baseline level
Source DHS-OIG based on USCG-provided data
Performance Measures and Results The USCG reported that it met its FY 2011 target for the number of days critical waterways are closed to commerce due to ice Domestic icebreakers on the Great Lakes assisted over 1700 commercial vessel transits carrying $300 million in bulk commodities Favorable environmental conditions continued partnership with the Canadian Coast Guard and effective employment of domestic icebreaking assets contributed to achieving the performance target
wwwoigdhsgov 19 OIG-12-119
OFFICE OF INSPECTOR GENERAL Department of Homeland Security
Appendix D Homeland Security Missions
The FY 2011 homeland security mission resource hours totaled 355586 and decreased by approximately 05 percent from FY 2010 Between FY 2006 and FY 2011 total resource hours for homeland security missions were the highest in FY 2007 However the FY 2011 level remains at approximately 91 percent above baseline levels as depicted in the following graph
Source DHS-OIG based on USCG-provided data
In FY 2011 the USCG reported that it met or exceeded 5 of 11 summary performance measures for its 5 homeland security missions compared with meeting 2 of 5 summary performance measures in FY 2010 The resource hours and performance measures and results for each non-homeland security mission are summarized below
Ports Waterways and Coastal Security
The ports waterways and coastal security mission aims to deny terrorists the use and exploitation of the maritime domain and marine transportation system as a means for attacks on US territory population centers vessels and maritime critical infrastructure and key resources This mission includes preparedness planning and exercises antiterrorism and counterterrorism activities and initial recovery efforts if attacks are successful
wwwoigdhsgov 20 OIG-12-119
OFFICE OF INSPECTOR GENERAL Department of Homeland Security
Resource Hours In FY 2011 resource hours for ports waterways and coastal security totaled 155969 which is a decrease of 09 percent from FY 2010
Source DHS-OIG based on USCG-provided data
Performance Measures and Results USCG reported that it met three of its six FY 2011 targets for ports waterways and coastal security In FY 2011 the USCG added two new summary measures related to compliance with security regulations and significantly updated the methodology for the FY 2010 summary measure Percent Reduction in Maritime Terrorism Risk over which the USCG has Influence resulting in four maritime security risk measures as shown in the following charts The USCG improved and created a new baseline for the maritime security risk measures in FY 2010 thus FY 2011 results should not be compared to previous years
The revised maritime security risk measures are risk-based outcome measures that begin with an assessment of likely high-consequence maritime terrorist attack scenarios Threat vulnerability and consequence levels are estimated for each scenario which generates a proxy (index) value of raw risk that exists in the maritime domain Next the USCG interventions (security and response operations regime and awareness activities) for the fiscal year are scored against the scenarios with regard to the decreases in threat vulnerability and consequence that each has been estimated to have afforded The resulting measures are proxy measures of performance
As depicted below the USCG reported that it met its FY 2011 target for ldquoPercent Reduction of all Maritime Security Risk Subject to USCG Influencerdquo
wwwoigdhsgov 21 OIG-12-119
Ports Waterways and Coastal Security Performance Measure ndash Percent Reduction of all Maritime Security Risk
Subject to USCG Influence
FY 2006 Actual
FY 2007 Actual
FY 2008 Actual
FY 2009 Actual
FY 2010 Actual
FY 2011 Target
FY 2011 Actual
NA NA NA NA NA 44 44
Met Met Met Met Met Met Source DHS-OIG based on USCG-provided data
OFFICE OF INSPECTOR GENERAL Department of Homeland Security
USCG exceeded its FY 2011 target for Percent Reduction of all Maritime Security Risk Resulting from USCG Consequence Management
Ports Waterways and Coastal Security Performance Measure ndash Percent Reduction of Maritime Security Risk
Resulting from US Coast Guard Consequence Management
FY 2006 Actual
FY 2007 Actual
FY 2008 Actual
FY 2009 Actual
FY 2010 Actual
FY 2011 Target
FY 2011 Actual
NA NA NA NA NA 3 4
Met Met Met Met Met Met Source DHS-OIG based on USCG-provided data
USCG did not meet its target for ldquoPercent Reduction of Maritime Security Risk Resulting from USCG Efforts to Prevent a Terrorist Entering the US via Maritime Meansrdquo This is attributable to lower effectiveness judgments for the Maritime Security Response Team due to the loss of dedicated airlift and the suspension of hook-and-climb training Additionally major cutter capacity decreased due to the decommissioning of one High Endurance Cutter and an overall reduction of major cutter resource hours
Ports Waterways and Coastal Security Performance Measure ndash Percent Reduction of Maritime Security Risk
Resulting from USCG Efforts to Prevent a Terrorist Entering the US via Maritime Means
FY 2006 Actual
FY 2007 Actual
FY 2008 Actual
FY 2009 Actual
FY 2010 Actual
FY 2011 Target
FY 2011 Actual
NA NA NA NA NA 52 43
Met Met Met Met Met Not Met Source DHS-OIG based on USCG-provided data
USCG missed its target for ldquoPercent Reduction of Maritime Security Risk Resulting from USCG Efforts to Prevent a Weapon of Mass Destruction from Entering the United States
wwwoigdhsgov 22 OIG-12-119
Ports Waterways and Coastal Security Performance Measure ndash Percent Reduction of Maritime Security Risk
Resulting from USCG Efforts to Prevent a Weapon of Mass Destruction from Entering the US via Maritime Means
FY 2006 Actual
FY 2007 Actual
FY 2008 Actual
FY 2009 Actual
FY 2010 Actual
FY 2011 Target
FY 2011 Actual
NA NA NA NA NA 29 28
Met Met Met Met Met Not Met
Ports Waterways and Coastal Security Performance Measure ndash Annual Maritime Transportation Security Act Facility
Compliance Rate with Transportation Worker Identification Credential Regulations
FY 2006 Actual
FY 2007 Actual
FY 2008 Actual
FY 2009 Actual
FY 2010 Actual
FY 2011 Target
FY 2011 Actual
NA NA NA NA 100 85 99
NA NA NA NA Met Met
Source DHS-OIG based on USCG-provided data
OFFICE OF INSPECTOR GENERAL Department of Homeland Security
via Maritime Meansrdquo by one percentage point This is attributable to lower effectiveness judgments for the Maritime Security Response Team due to loss of dedicated airlift and the challenges of identifying a broad range of Weapons of Mass Destruction amongst the volume of legitimate shipping cargo Additionally major cutter capacity decreased due to the decommissioning of one High Endurance Cutter and an overall reduction of major cutter resource hours
Source DHS-OIG based on USCG-provided data
USCG exceeded its FY 2011 target for ldquoAnnual Maritime Transportation Security Act Facility Compliance Rate with Transportation Worker Identification Credential Regulationsrdquo
USCG missed its target for ldquoPercent of Maritime Facilities in Compliance with Security Regulationsrdquo by only one-tenth of one percent The USCG has focused the use of its personnel resources to conduct Maritime Transportation Security Act compliance exams at waterfront facilities that are at higher risk for a transportation security incident By increasing partnerships with these facilities 999 percent of regulated facilities did not have serious deficiencies warranting a notice of violation or civil penalty in FY 2011
wwwoigdhsgov 23 OIG-12-119
Ports Waterways and Coastal Security Performance Measure ndash Percent Of Maritime Facilities in Compliance with
Security Regulations
FY 2006 Actual
FY 2007 Actual
FY 2008 Actual
FY 2009 Actual
FY 2010 Actual
FY 2011 Target
FY 2011 Actual
NA NA NA NA NA 100 999
NA NA NA NA NA Not Met
Source DHS-OIG based on USCG-provided data
OFFICE OF INSPECTOR GENERAL Department of Homeland Security
Drug Interdiction
USCGrsquos drug interdiction efforts support national strategies to disrupt the market for illegal drugs and prevent transnational threats from reaching the United States The USCG is the lead Federal agency for drug interdiction on the high seas and shares the lead for drug interdiction in the territorial seas of the US with Customs and Border Protection The USCG coordinates with its interagency partners to deter illicit drug trafficking including the Department of Defense Department of Justice Department of State and other components within DHS
Resource Hours FY 2011 resource hours totaled 73401 and increased by approximately 9 percent from FY 2010 but are about 40 percent below baseline levels
Source DHS-OIG based on USCG-provided data
Performance Measures and Results The USCG uses the interagency Consolidated Counter Drug Database as its main source for tracking cocaine movement estimates
wwwoigdhsgov 24 OIG-12-119
Drug Interdiction Performance Measure ndash Removal Rate for Cocaine from Non-commercial
Vessels in Maritime Transit Zone FY 2006 FY 2007 FY 2008 FY 2009 FY 2010 FY 2011 FY 2011 Actual Actual Actual Actual Actual Target Actual
NA NA NA 150 135 155 116
NA NA NA X
Not Met X
Not Met X
Not Met Source DHS-OIG based on USCG-provided data
OFFICE OF INSPECTOR GENERAL Department of Homeland Security
The one performance measure related to Drug Interdiction ldquoRemoval Rate for Cocaine from Non-commercial Vessels in Maritime Transit Zonerdquo was not met in FY 2011 According to the USCG the reasons for not meeting this target can be attributed to reduced asset and resource availability smaller average load sizes of cocaine and increasingly sophisticated criminal organizations
Migrant Interdiction
USCG migrant interdiction policy and operations are designed to provide effective law enforcement presence at sea and achieve three main objectives (1) deter undocumented migrants and transnational human smugglers from using maritime routes to enter the US (2) detect and interdict undocumented migrants and human smugglers far from the US border and (3) expand USCG participation in multi-agency and bi-national border security initiatives While the USCG leads the interdiction mission on the high seas it partners with Customs and Border Protection and Immigration and Customs Enforcement for shore-side interdiction operations
Resource Hours Migrant interdiction resource hours remain approximately 144 percent above baseline levels In FY 2011 resource hours totaled 72213 and decreased approximately 60 percent from FY 2010 to FY 2011
wwwoigdhsgov 25 OIG-12-119
Migrant Interdiction Performance Measure ndash Percentage of Undocumented Migrants who
Attempt to Enter the United States Via Maritime Routes that are Interdicted
FY 2006 Actual
FY 2007 Actual
FY 2008 Actual
FY 2009 Actual
FY 2010 Actual
FY 2011 Target
FY 2011 Actual
NA 652 627 844 645 739 728
NA Not Met Not Met Met Not Met Not Met
OFFICE OF INSPECTOR GENERAL Department of Homeland Security
Source DHS-OIG based on USCG-provided data
Performance Measures and Results According to the USCG the number of undocumented migrants attempting to enter the US remained low in FY 2011 compared to numbers observed over the last decade due in part to a slumping US economy successful prosecution of smugglers effective bilateral cooperation and use of biometrics The USCG reported that it met one of its two performance measures related to migrant interdiction in FY 2011 Although the USCG did not meet the target for ldquoPercentage of Undocumented Migrants who Attempt to Enter the United States via Maritime Routes that are Interdictedrdquo the actual result of 728 percent was an improvement over FY 2010rsquos 645 percent This measure includes migrants who are interdicted by foreign counterparts of the USCG many of whom have fewer resources than the USCG
Source DHS-OIG based on USCG-provided data
As shown in the table below the USCG exceeded its target for the ldquoPercent of Undocumented Migrants who Attempt to Enter the United States via Maritime Routes Interdicted by the Coast Guardrdquo
wwwoigdhsgov 26 OIG-12-119
Migrant Interdiction Performance Measure ndash Percent of Undocumented Migrants who Attempt to Enter the United States via Maritime Routes Interdicted by the Coast Guard
FY 2006 Actual
FY 2007 Actual
FY 2008 Actual
FY 2009 Actual
FY 2010 Actual
FY 2011 Target
FY 2011 Actual
NA 421 469 375 447 430 517
NA NA Not Met Not Met Met Met
Source DHS-OIG based on USCG-provided data
OFFICE OF INSPECTOR GENERAL Department of Homeland Security
Defense Readiness
The USCG maintains a level of readiness and training that allows for the immediate integration with Department of Defense forces for peacetime operations or during times of war This supports US national interests abroad as well as facilitating support to DHS for the integration of Homeland Defense and Homeland Security
Resource Hours In FY 2011 resource hours for Defense Readiness totaled 41424 and were still above the baseline although resource hours decreased by 119 percent from FY 2010 to FY 2011
Source DHS-OIG based on USCG-provided data
Performance Measures and Results The USCG did not meet its overall target of 381 percent defense readiness for the year The declining readiness of the USCGrsquos High Endurance Cutter fleet continues to present significant challenges to mission
wwwoigdhsgov 27 OIG-12-119
Defense Readiness Performance Measure ndash Defense Readiness Assessment of all USCG High-
Endurance Cutters Patrol Boats and Port Security Units
FY 2006 Actual
FY 2007 Actual
FY 2008 Actual
FY 2009 Actual
FY 2010 Actual
FY 2011 Target
FY 2011 Actual
NA NA NA NA 241 381 251
NA NA NA NA Not Met Not Met
Source DHS-OIG based on USCG-provided data
OFFICE OF INSPECTOR GENERAL Department of Homeland Security
performance High Endurance Cutter readiness is being addressed by the USCGrsquos acquisition of the National Security Cutter
Other Law Enforcement
The other law enforcement mission orchestrates the enforcement of regulations on foreign fishing vessels This enforcement takes two forms the first is the deterrence detection and interdiction of illegal incursions into the US exclusive economic zone by foreign fishing vessels 1 The protection of the US exclusive economic zone from incursions by foreign fishing vessels contributes to a fundamental USCG maritime security objective to protect our Nationrsquos renewable natural resources The second part of the other law enforcement mission is to ensure compliance with international agreements for the management of living marine resources This is primarily accomplished through enforcement on foreign fishing vessels of conservation and management measures created by regional fishery management organizations
Resource Hours In FY 2011 resource hours for the other law enforcement mission totaled 12579 which is an increase of 445 percent from FY 2010 According to the USCG this increase in resource hours was due to increased patrols for illegal unregulated and unreported fishing activity
1 The exclusive economic zone is the zone where the US and other coastal nations have jurisdiction over economic and resource management The exclusive economic zone includes waters three to 200 miles offshore (or nine to 200 miles offshore in western Florida and Texas)
wwwoigdhsgov 28 OIG-12-119
OFFICE OF INSPECTOR GENERAL Department of Homeland Security
Source DHS-OIG based on USCG-provided data
Performance Measures and Results The USCG uses the number of detected incursions into the US Exclusive Economic Zone by foreign fishing vessels as a measure of its performance In FY 2011 there were 122 detected incursions of foreign fishing vessels into the US Exclusive Economic Zone which met the performance target of fewer than 180 incursions
Other Law Enforcement Performance Measure ndash Number of Detected Incursions of Foreign Fishing
Vessels violating US Waters
FY 2006 Actual
FY 2007 Actual
FY 2008 Actual
FY 2009 Actual
FY 2010 Actual
FY 2011 Target
FY 2011 Actual
164 126 81 112 82 lt180 122
Met Met Met Met Met Met Source DHS-OIG based on USCG-provided data
wwwoigdhsgov 29 OIG-12-119
Mission Measure Met Not Met
Non-Homeland Security Missions
Search and Rescue Percentage of People in Imminent Danger Saved in the Maritime Environment
X
Percent of Time Rescue Assets are On-Scene within 2 Hours X
Aids-to-Navigation Availability of Maritime Navigation Aids X Average Number of Navigational Accidents X
Ice Operations Number of Days Critical Waterways Are Closed to Commerce Due to Ice X Living Marine Resources Fishing Regulation Compliance Rate X
Marine Safety
5-Yr Average Number of Commercial and Recreational Deaths and Injuries
X
5-Yr Average Number of Commercial Mariner Deaths and Injuries X
5-Yr Average Number of Commercial Passenger Deaths and Injuries X
5-Yr Average Number of Recreational Boating Deaths and Injuries X
Marine Environmental Protection
Average Number of Chemical Discharge Incidents in the Maritime Environment
X
Average Number of Oil Spills in the Maritime Environment X Total Non-Homeland Security Performance Measures 9 3
Homeland Security Missions
Ports Waterways and Coastal Security
Percentage Reduction of all Maritime Security Risk Subject to USCG Influence
X
Percent Reduction of Maritime Security Risk Resulting from USCG Consequence Management
X
Percent Reduction of Maritime Security Risk Resulting from USCG Efforts to Prevent a Terrorist Entering the US via Maritime Means
X
Percent Reduction of Maritime Security Risk Resulting from USCG Efforts to Prevent a Weapon of Mass Destruction from Entering the US via Maritime Means
X
Annual MTSA Facility Compliance Rate with Transportation Worker Identification Credential Regulations
X
Percent of Maritime Facilities In Compliance with Security Regulations X
Drug Interdiction Removal Rate for Cocaine from Non-commercial Vessels in Maritime Transit Zone
X
Migrant Interdiction
Percentage of Undocumented Migrants who Attempt to Enter the United States Via Maritime Routes that are Interdicted
X
Percent of Undocumented Migrants who Attempt to Enter the US by Maritime Routes Interdicted by the USCG
X
Defense Readiness Defense Readiness Assessment of all USCG High-Endurance Cutters Patrol Boats and Port Security Units
X
Other Law Enforcement Number of Detected Incursions of Foreign Fishing Vessels Violating US Waters
X
Total Homeland Security Performance Measures 5 6
Total USCG Performance Measures 14 9 Source DHS-OIG based on USCG-provided data
OFFICE OF INSPECTOR GENERAL Department of Homeland Security
Appendix E FY 2011 Performance Measure Summary
wwwoigdhsgov 30 OIG-12-119
OFFICE OF INSPECTOR GENERAL Department of Homeland Security
Appendix F Major Contributors to This Report
Brooke Bebow Director Lisa Vonder Haar Audit Manager Stephen Doran Auditor Richard Joyce Program Analyst Marisa Coccaro Referencer
wwwoigdhsgov 31 OIG-12-119
OFFICE OF INSPECTOR GENERAL Department of Homeland Security
Appendix G Report Distribution
Department of Homeland Security
Secretary Deputy Secretary Chief of Staff Deputy Chief of Staff General Counsel Executive Secretary Director GAOOIG Liaison Office Assistant Secretary for Office of Policy Assistant Secretary for Office of Public Affairs Assistant Secretary for Office of Legislative Affairs Acting Chief Privacy Officer
United States Coast Guard
Commandant Assistant Commandant for Resources and Chief Financial Officer USCG Audit Liaison
Office of Management and Budget
Chief Homeland Security Branch DHS OIG Budget Examiner
Congress
Congressional Oversight and Appropriations Committees as appropriate
wwwoigdhsgov 32 OIG-12-119
ADDITIONAL INFORMATION AND COPIES
To obtain additional copies of this document please call us at (202) 254-4100 fax your request to (202) 254-4305 or e-mail your request to our Office of Inspector General (OIG) Office of Public Affairs at DHS-OIGOfficePublicAffairsoigdhsgov
For additional information visit our website at wwwoigdhsgov or follow us on Twitter at dhsoig
OIG HOTLINE
To expedite the reporting of alleged fraud waste abuse or mismanagement or any other kinds of criminal or noncriminal misconduct relative to Department of Homeland Security (DHS) programs and operations please visit our website at wwwoigdhsgov and click on the red tab titled Hotline to report You will be directed to complete and submit an automated DHS OIG Investigative Referral Submission Form Submission through our website ensures that your complaint will be promptly received and reviewed by DHS OIG
Should you be unable to access our website you may submit your complaint in writing to DHS Office of Inspector General Attention Office of Investigations Hotline 245 Murray Drive SW Building 410Mail Stop 2600 Washington DC 20528 or you may call 1 (800) 323-8603 or fax it directly to us at (202) 254-4297
The OIG seeks to protect the identity of each writer and caller
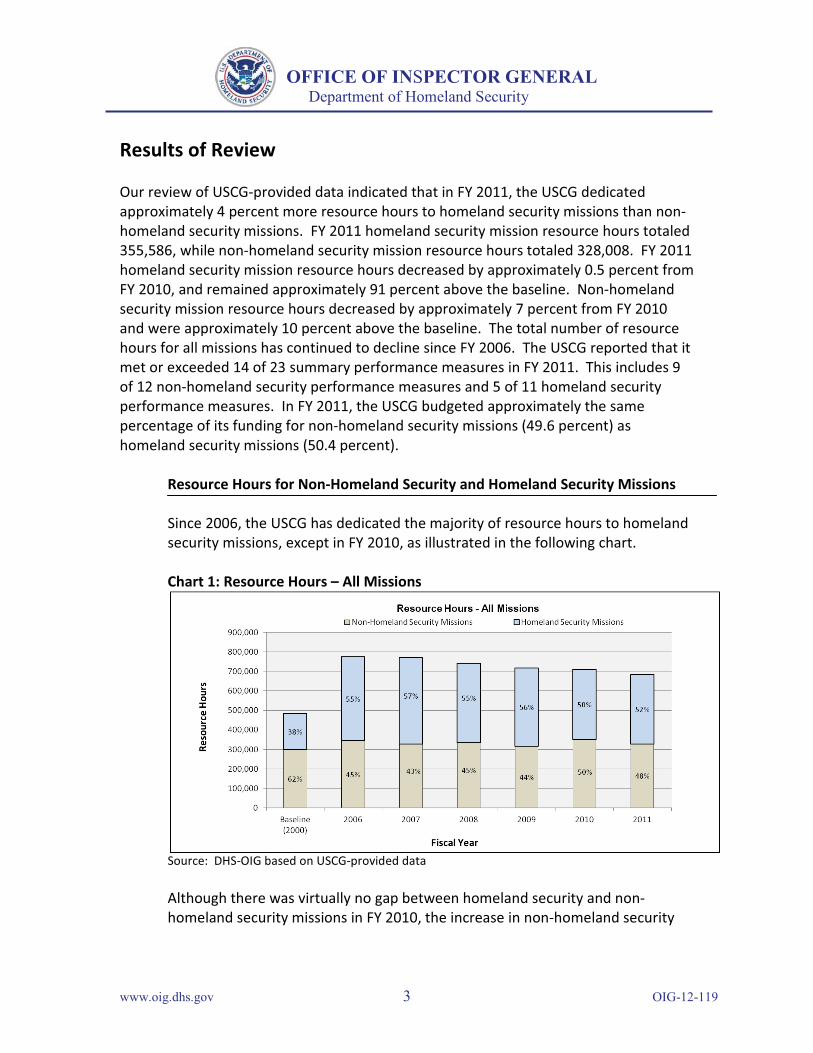
OFFICE OF INSPECTOR GENERAL Department of Homeland Security
Results of Review
Our review of USCG-provided data indicated that in FY 2011 the USCG dedicated approximately 4 percent more resource hours to homeland security missions than non-homeland security missions FY 2011 homeland security mission resource hours totaled 355586 while non-homeland security mission resource hours totaled 328008 FY 2011 homeland security mission resource hours decreased by approximately 05 percent from FY 2010 and remained approximately 91 percent above the baseline Non-homeland security mission resource hours decreased by approximately 7 percent from FY 2010 and were approximately 10 percent above the baseline The total number of resource hours for all missions has continued to decline since FY 2006 The USCG reported that it met or exceeded 14 of 23 summary performance measures in FY 2011 This includes 9 of 12 non-homeland security performance measures and 5 of 11 homeland security performance measures In FY 2011 the USCG budgeted approximately the same percentage of its funding for non-homeland security missions (496 percent) as homeland security missions (504 percent)
Resource Hours for Non-Homeland Security and Homeland Security Missions
Since 2006 the USCG has dedicated the majority of resource hours to homeland security missions except in FY 2010 as illustrated in the following chart
Chart 1 Resource Hours ndash All Missions
Source DHS-OIG based on USCG-provided data
Although there was virtually no gap between homeland security and non-homeland security missions in FY 2010 the increase in non-homeland security
wwwoigdhsgov 3 OIG-12-119
FY 2008 FY 2009 FY 2010 FY 2011
of of of of Total Total Total Total Missions Hours Hours Hours Hours
Mission Mission Mission Mission Hours Hours Hours Hours
Non Homeland Security
Living Marine Resources 105769 142 94178 131 93470 132 93616 137
Marine Safety 45794 62 52579 73 58828 83 64210 94
Marine Environmental Protection 3441 05 2949 04 29039 41 4682 07
Search and Rescue 61321 83 58607 82 64273 91 55934 82
Aids-to-Navigation 106638 144 100904 141 95268 134 98819 145
Ice Operations 11938 16 8033 11 11639 16 10747 16
Sub-Total 334901 452 317250 442 352517 497 328008 481
Homeland Security Ports Waterways Coastal
Security 205715 277 181264 252 157427 222 155969 228
Drug Interdiction 75892 102 80564 112 67307 95 73401 107
Migrant Interdiction 74918 101 76100 106 76848 108 72213 106
Defense Readiness 42688 58 56128 78 47030 66 41424 61
Other Law Enforcement 8272 11 6686 09 8708 12 12579 18
Sub-Total 407485 549 400742 557 357320 503 355586 520
Total 742386 1001 717992 999 709837 100 683594 1001
OFFICE OF INSPECTOR GENERAL Department of Homeland Security
mission resource hours in FY 2010 was mainly attributable to the Deepwater Horizon oil spill and earthquake relief efforts in Haiti
According to the USCGrsquos data the gap between resource hours for homeland security versus non-homeland security missions has narrowed from an approximately 10 percent difference in FY 2006 (55 percent of resource hours for homeland security missions versus 45 percent for non-homeland security missions) to approximately 4 percent in FY 2011 (52 percent of resource hours for homeland security missions versus 48 percent for non-homeland security missions)
As illustrated in table 2 the total number of resource hours the USCG dedicates to its specific statutory missions continues to decline In FY 2011 the total USCGndashreported resource hours dropped to 683594 which is a decline of approximately 8 percent compared to 742386 hours in FY 2008
Table 2 FY 2011 Coast Guard Resource Hours (Rounded)
Source DHS-OIG based on USCG-provided data (Percentage totals do not sum to 100 due to rounding)
The USCG attributes this decline in total resource hours in part to the decreased availability of assets such as cutters and aircraft due to their age or use in training activities The percentages of total resource hours by statutory
wwwoigdhsgov 4 OIG-12-119
OFFICE OF INSPECTOR GENERAL Department of Homeland Security
mission areas from FY 2006 through FY 2011 are illustrated in the following chart
Chart 2 Percentage of Total Resource Hours by Fiscal Year
0 5 10 15 20 25 30
Search and Rescue
Marine Safety
Aids-to-Navigation
Ice Operations
Marine Environmental Protection
Living Marine Resources
Illegal Drug Interdiction
Undocumented Migrant Interdiction
Other Law Enforcement
Ports Waterways Coastal Security
Defense Readiness
Percentage of Total Resource Hours by Fiscal Year
FY11
FY10
FY09
FY08
FY07
FY06
Non-Homeland Security Missions
Homeland Security Missions
Source DHS-OIG based on USCG-provided data
Resource hours for non-homeland security missions are summarized in appendix C and homeland security missions are summarized in appendix D
The USCGrsquos Mission Performance
We based the performance portion of our review on the USCGrsquos December 2011 internal report titled United States Coast Guard Fiscal Year 2011 Performance Report as well as previous USCG performance reports and OIG reports Because USCG performance reports are internal documents they contain additional management and break-out measures that we did not include in our report In addition the USCG may add retire or change the methodology of certain measures from year-to-year This report includes those measures that the USCG considers summary measures In FY 2011 the USCG used 23 summary performance measures compared with 15 summary performance measures in FY 2010 Fourteen of the 15 measures reported in FY 2010 were continued in FY
wwwoigdhsgov 5 OIG-12-119
OFFICE OF INSPECTOR GENERAL Department of Homeland Security
2011 The methodology for the remaining FY 2010 measure Percent Reduction in Maritime Terrorism Risk over which the USCG has Influence was revised resulting in four new ports waterways and coastal security measures as shown in appendix D
The USCG reported that it met or exceeded 14 of 23 summary performance measures in FY 2011 This includes 9 of 12 non-homeland security performance measures and 5 of 11 homeland security performance measures Non-homeland security performance measures and results are included in appendix C and homeland security measures and results are in appendix D Appendix E contains a summary of the USCGrsquos FY 2011 performance measures for its 11 missions
FY 2011 Budget Information
In FY 2011 the USCG budgeted approximately the same percentage of its funding for non-homeland security missions (496 percent) as homeland security missions (504 percent) Based on the USCGrsquos FY 2012 budget the historical funding gap between non-homeland security and homeland security missions is expected to remain narrow For FY 2012 the USCG budgeted approximately 518 percent of its mission resources for non-homeland security missions and 482 percent for homeland security missions The largest percentage of the USCGrsquos mission resources will continue to be dedicated to its ports waterways and coastal security mission which garnered 222 percent of the budget in FY 2012 and is projected to receive 209 percent of the budget in FY 2013
Management Comments and OIG Analysis
The formal reply from the Assistant Commandant for Resources and Chief Financial Officer for the Coast Guard is included in appendix B USCG also provided technical comments on our draft report and we addressed them as appropriate throughout the report
wwwoigdhsgov 6 OIG-12-119
OFFICE OF INSPECTOR GENERAL Department of Homeland Security
Appendix A Objectives Scope and Methodology
The DHS OIG was established by the Homeland Security Act of 2002 (Public Law 107shy296) by amendment to the Inspector General Act of 1978 This is one of a series of audit inspection and special reports prepared as part of our oversight responsibilities to promote economy efficiency and effectiveness within the Department
Section 888(f)(1) of the Homeland Security Act of 2002 directs the Inspector General to conduct an annual assessment of the USCGrsquos performance of all its missions with a particular emphasis on non-homeland security missions The objective of this review was to determine the extent to which the USCG is maintaining its historical level of effort on non-homeland security missions
We reviewed the following Government Accountability Office (GAO) reports and testimonies
bull GAO-12-14 Coast Guard Security Risk Model Meets DHS Criteria but More Training Could Enhance Its Use for Managing Programs and Operations November 2011
bull GAO-12-254T Coast Guard Observations on Arctic Requirements Icebreakers and Coordination with Stakeholders December 2011
bull GAO-12-518 Border Security Opportunities Exist to Ensure More Effective Use of DHSrsquos Air and Marine Assets March 2012
bull GAO-10-411T Coast Guard Observations on the Requested Fiscal Year 2011 Budget Past Performance and Current Challenges February 2010
bull GAO-10-268R Coast Guard Workforce Issues January 2010
We analyzed the total number of resource hours reported by the USCG prior to September 11 2001 through FY 2011 We did not attempt to verify the resource hour data nor did we attempt to validate whether the USCG had accurately categorized such data We assessed total resource hours for the USCGrsquos 11 individual missions to identify the changes in each
We analyzed performance measures and targets to determine whether the measures for each of the USCGrsquos missions had been accomplished We obtained information on performance from the USCGrsquos internal report United States Coast Guard Fiscal Year 2011 Performance Report dated December 2011 In addition we reviewed our Annual Review of the United States Coast Guardrsquos Mission Performance (FY 2010) dated September 2011 for performance measure data prior to FY 2011 We obtained budget information from DHSrsquos Budget-in-Brief for FYs 2011- FY 2013
wwwoigdhsgov 7 OIG-12-119
OFFICE OF INSPECTOR GENERAL Department of Homeland Security
We conducted this review between April and August 2012 under the authority of the Inspector General Act of 1978 as amended and according to the Quality Standards for Inspections issued by the Council of the Inspectors General on Integrity and Efficiency
wwwoigdhsgov 8 OIG-12-119
OFFICE OF INSPECTOR GENERAL Department of Homeland Security
Appendix B Management Comments to the Draft Report
US Oopartmonl of Commandant 2100 Second Street sw Stop 7245 United WashingtOn DC 20593 Homeland security States Coast Guard
StaffSymbolCG-823
United Statas Phone (202) 372-3S33 F (202)372-2311
Coast Guard
7501
AUG 3 1 2012
Reply to Audit Manager Attn of Mark Kulwicki
(202) 372-3533 To Anne L Richards
Assistant Inspector General for Audits
Subj DHS orG REPORT ON ANNUAL REVIEW OF THE UNITED STATES COAST GUARDS MISSION PERFORMANCE (FY 2011)
Ref (a) DHS orG Draft Report dated August 16 2012
I Thank you for the opportunity to review and comment on the Department of Homeland Security (DHS) Office of Inspector Generals Draft Report 12-028-AUD-USCG entitled Annual Review of the United States Coast Guards Mission Perfonnance (FY 2011)
2 The United States Coast Guard (USCG) appreciates the efforts of the orG to docwnent measures that we can take to enhance the programs overall effectiveness
3 The USCG recommends the following technical comments contained in the enclosure
4 If you have any questions my point of contact is Mr Mark Kulwicki who can be reached at (202) 372-3533
Enclosure (I) USCG technical comments
Copy Brooke Bebow Director Lisa Vonder Haar Audit Manager Stephen Doran Auditor Rkhard Joyce Program Analyst Marisa Coccaro Referencer
wwwoigdhsgov 9 OIG-12-119
OFFICE OF INSPECTOR GENERAL Department of Homeland Security
Appendix C Non-Homeland Security Missions
The FY 2011 non-homeland security mission resource hours totaled 328008 and decreased by approximately 7 percent from FY 2010 However the FY 2011 level remains at approximately 10 percent above baseline levels The following graph illustrates the trend in non-homeland security mission resource hours since 2006 compared with the baseline period
Non-Homeland Security Resource Hours
0
50000
100000
150000
200000
250000
300000
350000
Reso
urce
Hou
rs
2007
2006
Baseline
2011
2010
2009
2008
Fiscal Year Source DHS-OIG based on USCG-provided data
In FY 2011 the USCG reported that it met or exceeded 9 of 12 summary performance measures for its 6 non-homeland security missions compared with meeting 7 of 10 summary performance measures in FY 2010 The resource hours and summary performance measures and results for each non-homeland security mission are discussed below
Living Marine Resources
Living marine resources law enforcement is an obligation under the Magnuson-Stevens Fishery Conservation and Management Act the Endangered Species Act and several other laws for the protection of marine resources Its core responsibility is to provide effective and professional enforcement to advance national goals for the conservation management and recovery of living marine resources marine protected species and
wwwoigdhsgov 10 OIG-12-119
Living Marine Resources Performance Measure ndash Fishing Regulation Compliance Rate
FY 2006 Actual
FY 2007 Actual
FY 2008 Actual
FY 2009 Actual
FY 2010 Actual
FY 2011 Target
FY 2011 Actual
966 962 953 968 972 96 974 X
Not Met X
Not Met X
Not Met X
Not Met
Met
Met
Source DHS-OIG based on USCG-provided data
OFFICE OF INSPECTOR GENERAL Department of Homeland Security
national marine sanctuaries and monuments This includes enforcement of living marine resource regulations and other activities that strengthen both domestic and international living marine resources regimes
Resource Hours FY 2011 resource hours for living marine resources totaled 93616 This is an increase of 02 percent from FY 2010 and is higher than the baseline by 26 percent
Source DHS-OIG based on USCG-provided data
Performance Measures and Results The USCG uses the percentage of fishing vessels observed at-sea complying with domestic regulations as a measure of its effect on enforcement of US fisheries and protected species regulations The measure reflects the percentage of USCG boardings at-sea where no significant violations of domestic living marine resource regulations were detected As shown in the chart below the USCG reported that it met its single living marine resources performance measure in FY 2011
wwwoigdhsgov 11 OIG-12-119
OFFICE OF INSPECTOR GENERAL Department of Homeland Security
Marine Safety
The focus of the USCGrsquos marine safety mission is the prevention of deaths injuries and property loss Marine safety responsibilities include ensuring the safe and environmentally sound operation of millions of recreational vessels and thousands of US flagged commercial vessels The USCG develops and enforces Federal marine safety regulations certifies and provides credentials to over 218000 mariners investigates commercial marine casualties and shares its findings and conducts compulsory inspections as well as voluntary safety exams
Resource Hours The USCG did not report hours for this mission prior to 2005 FY 2011 resource hours for marine safety totaled 64210 and increased by approximately 91 percent from FY 2010
Source DHS-OIG based on USCG-provided data
Performance Measures and Results The USCG reported that it met three of four summary performance measures related to marine safety in FY 2011 Federal regulations require the person in charge of commercial US flagged vessels to notify the USCG of any loss of life or injury requiring professional medical treatment beyond first aid The USCG uses deaths and injuries as a measure of commercial mariner and passenger safety and the five-year average number of deaths and injuries as an indicator of long-term performance trends In FY 2011 the USCG met its target for commercial mariner deaths and injuries but missed the target for passenger deaths and injuries as shown below
wwwoigdhsgov 12 OIG-12-119
Marine Safety Performance Measure ndash Five-Year Average Number of Commercial
Mariner Deaths and Injuries
FY 2006 Actual
FY 2007 Actual
FY 2008 Actual
FY 2009 Actual
FY 2010 Actual
FY 2011 Target
FY 2011 Actual
502 526 496 498 474 lt475 431
NA NA Met Met Met Met
Source DHS-OIG based on USCG-provided data
Marine Safety Performance Measure ndash Five-Year Average Number of
Recreational Boating Deaths and Injuries FY 2006 FY 2007 FY 2008 FY 2009 FY 2010 FY 2011 FY 2011 Actual Actual Actual Actual Actual Target Actual 4366 4249 4147 4150 4091 lt4115 3904
NA NA Met Met Met Met
OFFICE OF INSPECTOR GENERAL Department of Homeland Security
Marine Safety Performance Measure ndash Five-Year Average Number of
Commercial Passenger Deaths and Injuries FY 2006 FY 2007 FY 2008 FY 2009 FY 2010 FY 2011 FY 2011 Actual Actual Actual Actual Actual Target Actual
216 238 252 238 250 lt223 232
NA NA X X X
Not Met Met Not Met Not Met Source DHS-OIG based on USCG-provided data
Federal regulations also require operators or owners of recreational vessels to file a boating accident report when a person dies or disappears from the vessel under certain circumstances The USCG uses deaths and injuries as a measure of marine safety for the recreational boating segment of the American maritime community and a five-year average of these as an indicator of long-term performance trends The USCG reported that it met its target for this measure in FY 2011
Source DHS-OIG based on USCG-provided data
In FY 2011 the USCG added a new long-term performance measure for the five-year average number of commercial and recreational deaths and injuries The target for this measure was met
wwwoigdhsgov 13 OIG-12-119
OFFICE OF INSPECTOR GENERAL Department of Homeland Security
Marine Safety Performance Measure ndash Five-Year Average Number of
Commercial and Recreational Deaths And Injuries FY 2006 FY 2007 FY 2008 FY 2009 FY 2010 FY 2011 FY 2011 Actual Actual Actual Actual Actual Target Actual
NA NA NA NA NA lt4813 4567
NA NA NA NA NA Met
Source DHS-OIG based on USCG-provided data
Marine Environmental Protection
The marine environmental protection mission focuses on minimizing oil and hazardous substance effect on human health the environment and the marine transportation system The USCG regulates the handling of oil hazardous substances and other shipboard wastes to prevent their discharge into US or international waterways stop unauthorized ocean dumping reduce ship-based air emissions and avert the introduction of invasive species The USCG is the lead Federal agency for directing the removal and mitigation of oil spills from the waters and adjoining shorelines of the coastal zone
Resource Hours Marine environmental protection resource hours totaled 4682 in FY 2011 This represents a decrease of 839 percent from FY 2010 and is attributable to the reduction of resource hours necessary for the Deepwater Horizon oil spill in the Gulf of Mexico
Source DHS-OIG based on USCG-provided data
wwwoigdhsgov 14 OIG-12-119
Marine Environmental Protection Performance Measure Average Number of Oil Spills in the Maritime Environment
FY 2006 FY 2007 FY 2008 FY 2009 FY 2010 FY 2011 FY 2011 Actual Actual Actual Actual Actual Target Actual 143 139 132 123 115 lt116 102
NA NA Met Met Met Met
Source DHS-OIG based on USCG-provided data
OFFICE OF INSPECTOR GENERAL Department of Homeland Security
Performance Measures and Results Federal regulation requires vessel or facility operators to report the discharge of any hazardous substance that equals or exceeds reportable quantities and requires the reporting of any discharge of oil or oil products that cause a sheen discoloration sludge or emulsion on or below the surface of any navigable waterway of the United States The USCG uses the number of chemical discharge incidents and the number of oil spills greater than 100 gallons as proxy indicators of marine environmental protection and normalizes five-year averages of these as indicators of long-term trends In FY 2011 the USCG reported that it met the target for ldquoAverage Number of Chemical Discharge Incidents in the Maritime Environmentrdquo which was previously reported as ldquo5-Yr Average Chemical Discharge Incidents per 100 Million Short Tons Shippedrdquo
Marine Environmental Protection Performance Measure ndash Average Number of Chemical Discharge
Incidents in the Maritime Environment FY
2006 Actual
FY 2007
Actual
FY 2008
Actual
FY 2009
Actual
FY 2010
Actual
FY FY 2011 2011
Target Actual 278 244 198 187 181 lt220 150
NA NA Met Met Met Met
Source DHS-OIG based on USCG-provided data
USCG also reported that it met the target for ldquoAverage Number of Oil Spills in the Maritime Environmentrdquo which was previously reported as ldquo5-Yr Average Oil Spills gt 100 Gallons per 100 Million Short Tons Shippedrdquo
Search and Rescue
USCG strives to minimize lives lost injury and property loss or damage by rendering aid to those in distress in the maritime environment and elsewhere as called upon The search and rescue mission is accomplished through resource readiness distress monitoring and communication search planning on-scene operations and domestic and international partnerships
wwwoigdhsgov 15 OIG-12-119
OFFICE OF INSPECTOR GENERAL Department of Homeland Security
Resource Hours Search and rescue is a demand-driven mission Requirements for search and rescue increase or decrease relative to the number of people requiring the USCGrsquos assistance Resource hours in FY 2011 totaled 55934 and decreased approximately 13 percent from FY 2010
Source DHS-OIG based on USCG-provided data
0 10000 20000 30000 40000 50000 60000 70000 80000 90000
Baseline
2006
2007
2008
2009
2010
2011 Re
sour
ce H
ours
Search and Rescue Resource Hours
Fiscal Year
Performance Measures and Results USCG met the FY 2011 target for percent of people in imminent danger saved in the maritime environment was not met Though this yearrsquos performance is below the overall target it is more than the 744 percent level posted in FY 2010 In FY 2011 the USCG saved 3804 lives in 20510 cases with 732 lives lost and 390 lives unaccounted for This total excluded outlier cases with more than 10 lives at risk Other than raw numbers of lives saved and lost there is no clear indication of the drivers that led to this decrease The USCG is conducting further analysis is in progress to identify any systemic issues Additionally uncontrollable variables such as weather location incident severity and life saving devices on board continue to influence the number and outcome of search and rescue incidents
Search and Rescue Performance Measure ndash Percent of People in Imminent Danger Saved
in the Maritime Environment FY FY FY FY FY FY FY
2006 2007 2008 2009 2010 2011 2011 Actual Actual Actual Actual Actual Target Actual
76 766 768 773 744 100 773 X X
Met Met Met Met Not Met Not Met Source DHS-OIG based on USCG-provided data
wwwoigdhsgov 16 OIG-12-119
Search and Rescue Performance Measure ndash Percent of Time Rescue Assets are On-Scene
within 2 Hours FY
2006 FY
2007 FY
2008 FY
2009 FY
2010 FY
2011 FY
2011 Actual Actual Actual Actual Actual Target Actual 937 943 933 940 933 100 931
Met Met Met Met Met X
Not Met Source DHS-OIG based on USCG-provided data
OFFICE OF INSPECTOR GENERAL Department of Homeland Security
The FY 2011 target for percent of time rescue assets are on-scene within 2 hours was not met However overall performance is in line with the USCGrsquos expectations based on placement of resources and proximity to shore of the majority of search and rescue incidents and shows consistent performance over the last six years This measure has been adjusted to exclude cases in which an operational decision was made to delay a response Certain determining factors such as weather resource availability and risk assessment delay response time
Aids-to-Navigation
USCG minimizes disruptions to maritime commerce by assessing and mitigating risks to safe navigation It provides and maintains more than 51000 buoys beacons lights and other aids to mark channels and denote hazards
Resource Hours FY 2011 resource hours totaled 98819 and increased approximately 37 percent from FY 2010 This is an approximately 12 percent decrease from the baseline level
wwwoigdhsgov 17 OIG-12-119
Aids-to-Navigation Performance Measure ndash Availability of Maritime Navigation Aids
FY 2006 FY 2007 FY 2008 FY 2009 FY 2010 FY 2011 FY 2011 Actual Actual Actual Actual Actual Target Actual 968 980 983 980 985 975 985
X Not Met Met Met Met Met Met
Source DHS-OIG based on USCG-provided data
Aids-to-Navigation Performance Measure ndash Average Number of Navigational Accidents
FY 2006 FY 2007 FY 2008 FY 2009 FY 2010 FY 2011 FY 2011 Actual Actual Actual Actual Actual Target Actual 1765 1823 1857 1878 1878 1945
X Not Met
X Not Met
X Not Met
X Not Met
X Not Met Met
Source DHS-OIG based on USCG-provided data
OFFICE OF INSPECTOR GENERAL Department of Homeland Security
Source DHS-OIG based on USCG-provided data
Performance Measures and Results The USCG reported that it met its FY 2011 target for the availability of maritime navigation aids for the fifth consecutive year
In FY 2011 the USCG reported that it met its target for the average number of navigational accidents This is the first time this measure was met in the past six years
wwwoigdhsgov 18 OIG-12-119
Ice Operations Performance Measure ndash Number of Days Critical Waterways Are Closed to
Commerce Due to Ice FY 2006 FY 2007 FY 2008 FY 2009 FY 2010 FY 2011 FY 2011 Actual Actual Actual Actual Actual Target Actual
0 0 0 0 6 2 avg amp 8 severe
0
Met Met Met Met X
Not Met Met Source DHS-OIG based on USCG-provided data
OFFICE OF INSPECTOR GENERAL Department of Homeland Security
Ice Operations
This mission supports winter commerce and prevents and responds to ice that causes flooding These activities are essential to winter and spring commerce and the safety of waterside communities on the Great Lakes in New England and on the Hudson River and occasionally in the mid-Atlantic
Resource Hours In FY 2011 resource hours totaled 10747 and decreased approximately 77 percent from FY 2010 which is approximately 10 percent lower than the baseline level
Source DHS-OIG based on USCG-provided data
Performance Measures and Results The USCG reported that it met its FY 2011 target for the number of days critical waterways are closed to commerce due to ice Domestic icebreakers on the Great Lakes assisted over 1700 commercial vessel transits carrying $300 million in bulk commodities Favorable environmental conditions continued partnership with the Canadian Coast Guard and effective employment of domestic icebreaking assets contributed to achieving the performance target
wwwoigdhsgov 19 OIG-12-119
OFFICE OF INSPECTOR GENERAL Department of Homeland Security
Appendix D Homeland Security Missions
The FY 2011 homeland security mission resource hours totaled 355586 and decreased by approximately 05 percent from FY 2010 Between FY 2006 and FY 2011 total resource hours for homeland security missions were the highest in FY 2007 However the FY 2011 level remains at approximately 91 percent above baseline levels as depicted in the following graph
Source DHS-OIG based on USCG-provided data
In FY 2011 the USCG reported that it met or exceeded 5 of 11 summary performance measures for its 5 homeland security missions compared with meeting 2 of 5 summary performance measures in FY 2010 The resource hours and performance measures and results for each non-homeland security mission are summarized below
Ports Waterways and Coastal Security
The ports waterways and coastal security mission aims to deny terrorists the use and exploitation of the maritime domain and marine transportation system as a means for attacks on US territory population centers vessels and maritime critical infrastructure and key resources This mission includes preparedness planning and exercises antiterrorism and counterterrorism activities and initial recovery efforts if attacks are successful
wwwoigdhsgov 20 OIG-12-119
OFFICE OF INSPECTOR GENERAL Department of Homeland Security
Resource Hours In FY 2011 resource hours for ports waterways and coastal security totaled 155969 which is a decrease of 09 percent from FY 2010
Source DHS-OIG based on USCG-provided data
Performance Measures and Results USCG reported that it met three of its six FY 2011 targets for ports waterways and coastal security In FY 2011 the USCG added two new summary measures related to compliance with security regulations and significantly updated the methodology for the FY 2010 summary measure Percent Reduction in Maritime Terrorism Risk over which the USCG has Influence resulting in four maritime security risk measures as shown in the following charts The USCG improved and created a new baseline for the maritime security risk measures in FY 2010 thus FY 2011 results should not be compared to previous years
The revised maritime security risk measures are risk-based outcome measures that begin with an assessment of likely high-consequence maritime terrorist attack scenarios Threat vulnerability and consequence levels are estimated for each scenario which generates a proxy (index) value of raw risk that exists in the maritime domain Next the USCG interventions (security and response operations regime and awareness activities) for the fiscal year are scored against the scenarios with regard to the decreases in threat vulnerability and consequence that each has been estimated to have afforded The resulting measures are proxy measures of performance
As depicted below the USCG reported that it met its FY 2011 target for ldquoPercent Reduction of all Maritime Security Risk Subject to USCG Influencerdquo
wwwoigdhsgov 21 OIG-12-119
Ports Waterways and Coastal Security Performance Measure ndash Percent Reduction of all Maritime Security Risk
Subject to USCG Influence
FY 2006 Actual
FY 2007 Actual
FY 2008 Actual
FY 2009 Actual
FY 2010 Actual
FY 2011 Target
FY 2011 Actual
NA NA NA NA NA 44 44
Met Met Met Met Met Met Source DHS-OIG based on USCG-provided data
OFFICE OF INSPECTOR GENERAL Department of Homeland Security
USCG exceeded its FY 2011 target for Percent Reduction of all Maritime Security Risk Resulting from USCG Consequence Management
Ports Waterways and Coastal Security Performance Measure ndash Percent Reduction of Maritime Security Risk
Resulting from US Coast Guard Consequence Management
FY 2006 Actual
FY 2007 Actual
FY 2008 Actual
FY 2009 Actual
FY 2010 Actual
FY 2011 Target
FY 2011 Actual
NA NA NA NA NA 3 4
Met Met Met Met Met Met Source DHS-OIG based on USCG-provided data
USCG did not meet its target for ldquoPercent Reduction of Maritime Security Risk Resulting from USCG Efforts to Prevent a Terrorist Entering the US via Maritime Meansrdquo This is attributable to lower effectiveness judgments for the Maritime Security Response Team due to the loss of dedicated airlift and the suspension of hook-and-climb training Additionally major cutter capacity decreased due to the decommissioning of one High Endurance Cutter and an overall reduction of major cutter resource hours
Ports Waterways and Coastal Security Performance Measure ndash Percent Reduction of Maritime Security Risk
Resulting from USCG Efforts to Prevent a Terrorist Entering the US via Maritime Means
FY 2006 Actual
FY 2007 Actual
FY 2008 Actual
FY 2009 Actual
FY 2010 Actual
FY 2011 Target
FY 2011 Actual
NA NA NA NA NA 52 43
Met Met Met Met Met Not Met Source DHS-OIG based on USCG-provided data
USCG missed its target for ldquoPercent Reduction of Maritime Security Risk Resulting from USCG Efforts to Prevent a Weapon of Mass Destruction from Entering the United States
wwwoigdhsgov 22 OIG-12-119
Ports Waterways and Coastal Security Performance Measure ndash Percent Reduction of Maritime Security Risk
Resulting from USCG Efforts to Prevent a Weapon of Mass Destruction from Entering the US via Maritime Means
FY 2006 Actual
FY 2007 Actual
FY 2008 Actual
FY 2009 Actual
FY 2010 Actual
FY 2011 Target
FY 2011 Actual
NA NA NA NA NA 29 28
Met Met Met Met Met Not Met
Ports Waterways and Coastal Security Performance Measure ndash Annual Maritime Transportation Security Act Facility
Compliance Rate with Transportation Worker Identification Credential Regulations
FY 2006 Actual
FY 2007 Actual
FY 2008 Actual
FY 2009 Actual
FY 2010 Actual
FY 2011 Target
FY 2011 Actual
NA NA NA NA 100 85 99
NA NA NA NA Met Met
Source DHS-OIG based on USCG-provided data
OFFICE OF INSPECTOR GENERAL Department of Homeland Security
via Maritime Meansrdquo by one percentage point This is attributable to lower effectiveness judgments for the Maritime Security Response Team due to loss of dedicated airlift and the challenges of identifying a broad range of Weapons of Mass Destruction amongst the volume of legitimate shipping cargo Additionally major cutter capacity decreased due to the decommissioning of one High Endurance Cutter and an overall reduction of major cutter resource hours
Source DHS-OIG based on USCG-provided data
USCG exceeded its FY 2011 target for ldquoAnnual Maritime Transportation Security Act Facility Compliance Rate with Transportation Worker Identification Credential Regulationsrdquo
USCG missed its target for ldquoPercent of Maritime Facilities in Compliance with Security Regulationsrdquo by only one-tenth of one percent The USCG has focused the use of its personnel resources to conduct Maritime Transportation Security Act compliance exams at waterfront facilities that are at higher risk for a transportation security incident By increasing partnerships with these facilities 999 percent of regulated facilities did not have serious deficiencies warranting a notice of violation or civil penalty in FY 2011
wwwoigdhsgov 23 OIG-12-119
Ports Waterways and Coastal Security Performance Measure ndash Percent Of Maritime Facilities in Compliance with
Security Regulations
FY 2006 Actual
FY 2007 Actual
FY 2008 Actual
FY 2009 Actual
FY 2010 Actual
FY 2011 Target
FY 2011 Actual
NA NA NA NA NA 100 999
NA NA NA NA NA Not Met
Source DHS-OIG based on USCG-provided data
OFFICE OF INSPECTOR GENERAL Department of Homeland Security
Drug Interdiction
USCGrsquos drug interdiction efforts support national strategies to disrupt the market for illegal drugs and prevent transnational threats from reaching the United States The USCG is the lead Federal agency for drug interdiction on the high seas and shares the lead for drug interdiction in the territorial seas of the US with Customs and Border Protection The USCG coordinates with its interagency partners to deter illicit drug trafficking including the Department of Defense Department of Justice Department of State and other components within DHS
Resource Hours FY 2011 resource hours totaled 73401 and increased by approximately 9 percent from FY 2010 but are about 40 percent below baseline levels
Source DHS-OIG based on USCG-provided data
Performance Measures and Results The USCG uses the interagency Consolidated Counter Drug Database as its main source for tracking cocaine movement estimates
wwwoigdhsgov 24 OIG-12-119
Drug Interdiction Performance Measure ndash Removal Rate for Cocaine from Non-commercial
Vessels in Maritime Transit Zone FY 2006 FY 2007 FY 2008 FY 2009 FY 2010 FY 2011 FY 2011 Actual Actual Actual Actual Actual Target Actual
NA NA NA 150 135 155 116
NA NA NA X
Not Met X
Not Met X
Not Met Source DHS-OIG based on USCG-provided data
OFFICE OF INSPECTOR GENERAL Department of Homeland Security
The one performance measure related to Drug Interdiction ldquoRemoval Rate for Cocaine from Non-commercial Vessels in Maritime Transit Zonerdquo was not met in FY 2011 According to the USCG the reasons for not meeting this target can be attributed to reduced asset and resource availability smaller average load sizes of cocaine and increasingly sophisticated criminal organizations
Migrant Interdiction
USCG migrant interdiction policy and operations are designed to provide effective law enforcement presence at sea and achieve three main objectives (1) deter undocumented migrants and transnational human smugglers from using maritime routes to enter the US (2) detect and interdict undocumented migrants and human smugglers far from the US border and (3) expand USCG participation in multi-agency and bi-national border security initiatives While the USCG leads the interdiction mission on the high seas it partners with Customs and Border Protection and Immigration and Customs Enforcement for shore-side interdiction operations
Resource Hours Migrant interdiction resource hours remain approximately 144 percent above baseline levels In FY 2011 resource hours totaled 72213 and decreased approximately 60 percent from FY 2010 to FY 2011
wwwoigdhsgov 25 OIG-12-119
Migrant Interdiction Performance Measure ndash Percentage of Undocumented Migrants who
Attempt to Enter the United States Via Maritime Routes that are Interdicted
FY 2006 Actual
FY 2007 Actual
FY 2008 Actual
FY 2009 Actual
FY 2010 Actual
FY 2011 Target
FY 2011 Actual
NA 652 627 844 645 739 728
NA Not Met Not Met Met Not Met Not Met
OFFICE OF INSPECTOR GENERAL Department of Homeland Security
Source DHS-OIG based on USCG-provided data
Performance Measures and Results According to the USCG the number of undocumented migrants attempting to enter the US remained low in FY 2011 compared to numbers observed over the last decade due in part to a slumping US economy successful prosecution of smugglers effective bilateral cooperation and use of biometrics The USCG reported that it met one of its two performance measures related to migrant interdiction in FY 2011 Although the USCG did not meet the target for ldquoPercentage of Undocumented Migrants who Attempt to Enter the United States via Maritime Routes that are Interdictedrdquo the actual result of 728 percent was an improvement over FY 2010rsquos 645 percent This measure includes migrants who are interdicted by foreign counterparts of the USCG many of whom have fewer resources than the USCG
Source DHS-OIG based on USCG-provided data
As shown in the table below the USCG exceeded its target for the ldquoPercent of Undocumented Migrants who Attempt to Enter the United States via Maritime Routes Interdicted by the Coast Guardrdquo
wwwoigdhsgov 26 OIG-12-119
Migrant Interdiction Performance Measure ndash Percent of Undocumented Migrants who Attempt to Enter the United States via Maritime Routes Interdicted by the Coast Guard
FY 2006 Actual
FY 2007 Actual
FY 2008 Actual
FY 2009 Actual
FY 2010 Actual
FY 2011 Target
FY 2011 Actual
NA 421 469 375 447 430 517
NA NA Not Met Not Met Met Met
Source DHS-OIG based on USCG-provided data
OFFICE OF INSPECTOR GENERAL Department of Homeland Security
Defense Readiness
The USCG maintains a level of readiness and training that allows for the immediate integration with Department of Defense forces for peacetime operations or during times of war This supports US national interests abroad as well as facilitating support to DHS for the integration of Homeland Defense and Homeland Security
Resource Hours In FY 2011 resource hours for Defense Readiness totaled 41424 and were still above the baseline although resource hours decreased by 119 percent from FY 2010 to FY 2011
Source DHS-OIG based on USCG-provided data
Performance Measures and Results The USCG did not meet its overall target of 381 percent defense readiness for the year The declining readiness of the USCGrsquos High Endurance Cutter fleet continues to present significant challenges to mission
wwwoigdhsgov 27 OIG-12-119
Defense Readiness Performance Measure ndash Defense Readiness Assessment of all USCG High-
Endurance Cutters Patrol Boats and Port Security Units
FY 2006 Actual
FY 2007 Actual
FY 2008 Actual
FY 2009 Actual
FY 2010 Actual
FY 2011 Target
FY 2011 Actual
NA NA NA NA 241 381 251
NA NA NA NA Not Met Not Met
Source DHS-OIG based on USCG-provided data
OFFICE OF INSPECTOR GENERAL Department of Homeland Security
performance High Endurance Cutter readiness is being addressed by the USCGrsquos acquisition of the National Security Cutter
Other Law Enforcement
The other law enforcement mission orchestrates the enforcement of regulations on foreign fishing vessels This enforcement takes two forms the first is the deterrence detection and interdiction of illegal incursions into the US exclusive economic zone by foreign fishing vessels 1 The protection of the US exclusive economic zone from incursions by foreign fishing vessels contributes to a fundamental USCG maritime security objective to protect our Nationrsquos renewable natural resources The second part of the other law enforcement mission is to ensure compliance with international agreements for the management of living marine resources This is primarily accomplished through enforcement on foreign fishing vessels of conservation and management measures created by regional fishery management organizations
Resource Hours In FY 2011 resource hours for the other law enforcement mission totaled 12579 which is an increase of 445 percent from FY 2010 According to the USCG this increase in resource hours was due to increased patrols for illegal unregulated and unreported fishing activity
1 The exclusive economic zone is the zone where the US and other coastal nations have jurisdiction over economic and resource management The exclusive economic zone includes waters three to 200 miles offshore (or nine to 200 miles offshore in western Florida and Texas)
wwwoigdhsgov 28 OIG-12-119
OFFICE OF INSPECTOR GENERAL Department of Homeland Security
Source DHS-OIG based on USCG-provided data
Performance Measures and Results The USCG uses the number of detected incursions into the US Exclusive Economic Zone by foreign fishing vessels as a measure of its performance In FY 2011 there were 122 detected incursions of foreign fishing vessels into the US Exclusive Economic Zone which met the performance target of fewer than 180 incursions
Other Law Enforcement Performance Measure ndash Number of Detected Incursions of Foreign Fishing
Vessels violating US Waters
FY 2006 Actual
FY 2007 Actual
FY 2008 Actual
FY 2009 Actual
FY 2010 Actual
FY 2011 Target
FY 2011 Actual
164 126 81 112 82 lt180 122
Met Met Met Met Met Met Source DHS-OIG based on USCG-provided data
wwwoigdhsgov 29 OIG-12-119
Mission Measure Met Not Met
Non-Homeland Security Missions
Search and Rescue Percentage of People in Imminent Danger Saved in the Maritime Environment
X
Percent of Time Rescue Assets are On-Scene within 2 Hours X
Aids-to-Navigation Availability of Maritime Navigation Aids X Average Number of Navigational Accidents X
Ice Operations Number of Days Critical Waterways Are Closed to Commerce Due to Ice X Living Marine Resources Fishing Regulation Compliance Rate X
Marine Safety
5-Yr Average Number of Commercial and Recreational Deaths and Injuries
X
5-Yr Average Number of Commercial Mariner Deaths and Injuries X
5-Yr Average Number of Commercial Passenger Deaths and Injuries X
5-Yr Average Number of Recreational Boating Deaths and Injuries X
Marine Environmental Protection
Average Number of Chemical Discharge Incidents in the Maritime Environment
X
Average Number of Oil Spills in the Maritime Environment X Total Non-Homeland Security Performance Measures 9 3
Homeland Security Missions
Ports Waterways and Coastal Security
Percentage Reduction of all Maritime Security Risk Subject to USCG Influence
X
Percent Reduction of Maritime Security Risk Resulting from USCG Consequence Management
X
Percent Reduction of Maritime Security Risk Resulting from USCG Efforts to Prevent a Terrorist Entering the US via Maritime Means
X
Percent Reduction of Maritime Security Risk Resulting from USCG Efforts to Prevent a Weapon of Mass Destruction from Entering the US via Maritime Means
X
Annual MTSA Facility Compliance Rate with Transportation Worker Identification Credential Regulations
X
Percent of Maritime Facilities In Compliance with Security Regulations X
Drug Interdiction Removal Rate for Cocaine from Non-commercial Vessels in Maritime Transit Zone
X
Migrant Interdiction
Percentage of Undocumented Migrants who Attempt to Enter the United States Via Maritime Routes that are Interdicted
X
Percent of Undocumented Migrants who Attempt to Enter the US by Maritime Routes Interdicted by the USCG
X
Defense Readiness Defense Readiness Assessment of all USCG High-Endurance Cutters Patrol Boats and Port Security Units
X
Other Law Enforcement Number of Detected Incursions of Foreign Fishing Vessels Violating US Waters
X
Total Homeland Security Performance Measures 5 6
Total USCG Performance Measures 14 9 Source DHS-OIG based on USCG-provided data
OFFICE OF INSPECTOR GENERAL Department of Homeland Security
Appendix E FY 2011 Performance Measure Summary
wwwoigdhsgov 30 OIG-12-119
OFFICE OF INSPECTOR GENERAL Department of Homeland Security
Appendix F Major Contributors to This Report
Brooke Bebow Director Lisa Vonder Haar Audit Manager Stephen Doran Auditor Richard Joyce Program Analyst Marisa Coccaro Referencer
wwwoigdhsgov 31 OIG-12-119
OFFICE OF INSPECTOR GENERAL Department of Homeland Security
Appendix G Report Distribution
Department of Homeland Security
Secretary Deputy Secretary Chief of Staff Deputy Chief of Staff General Counsel Executive Secretary Director GAOOIG Liaison Office Assistant Secretary for Office of Policy Assistant Secretary for Office of Public Affairs Assistant Secretary for Office of Legislative Affairs Acting Chief Privacy Officer
United States Coast Guard
Commandant Assistant Commandant for Resources and Chief Financial Officer USCG Audit Liaison
Office of Management and Budget
Chief Homeland Security Branch DHS OIG Budget Examiner
Congress
Congressional Oversight and Appropriations Committees as appropriate
wwwoigdhsgov 32 OIG-12-119
ADDITIONAL INFORMATION AND COPIES
To obtain additional copies of this document please call us at (202) 254-4100 fax your request to (202) 254-4305 or e-mail your request to our Office of Inspector General (OIG) Office of Public Affairs at DHS-OIGOfficePublicAffairsoigdhsgov
For additional information visit our website at wwwoigdhsgov or follow us on Twitter at dhsoig
OIG HOTLINE
To expedite the reporting of alleged fraud waste abuse or mismanagement or any other kinds of criminal or noncriminal misconduct relative to Department of Homeland Security (DHS) programs and operations please visit our website at wwwoigdhsgov and click on the red tab titled Hotline to report You will be directed to complete and submit an automated DHS OIG Investigative Referral Submission Form Submission through our website ensures that your complaint will be promptly received and reviewed by DHS OIG
Should you be unable to access our website you may submit your complaint in writing to DHS Office of Inspector General Attention Office of Investigations Hotline 245 Murray Drive SW Building 410Mail Stop 2600 Washington DC 20528 or you may call 1 (800) 323-8603 or fax it directly to us at (202) 254-4297
The OIG seeks to protect the identity of each writer and caller
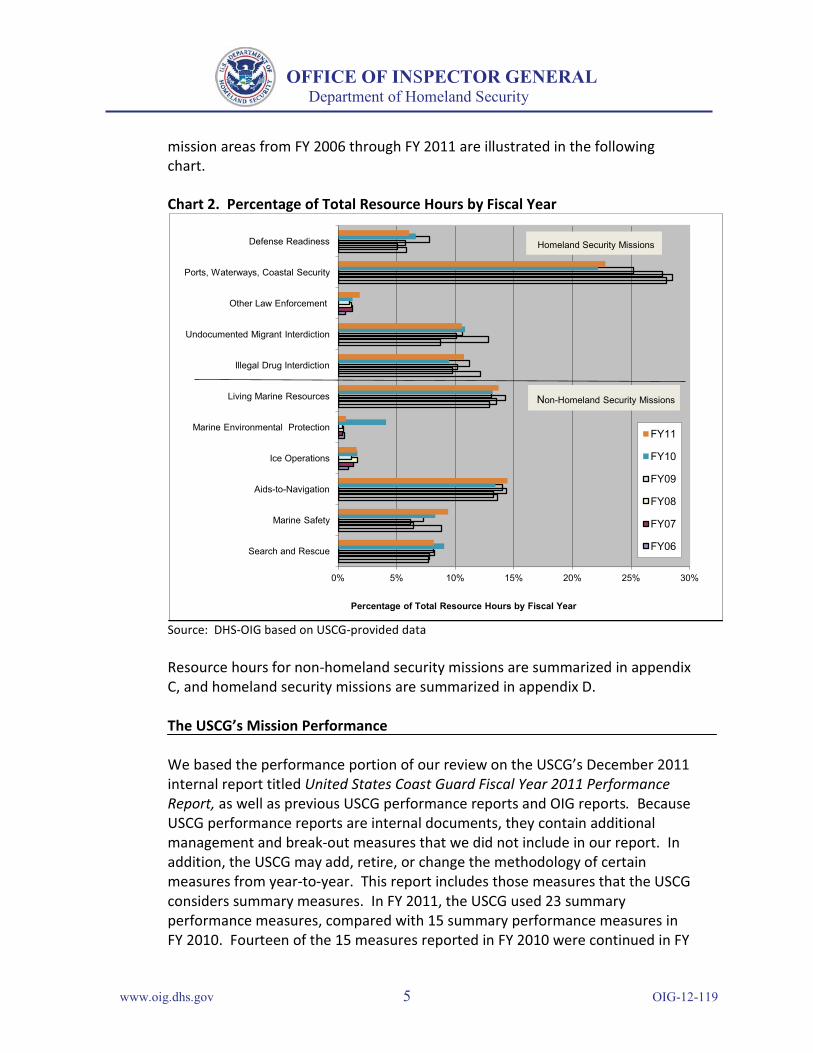
OFFICE OF INSPECTOR GENERAL Department of Homeland Security
mission areas from FY 2006 through FY 2011 are illustrated in the following chart
Chart 2 Percentage of Total Resource Hours by Fiscal Year
0 5 10 15 20 25 30
Search and Rescue
Marine Safety
Aids-to-Navigation
Ice Operations
Marine Environmental Protection
Living Marine Resources
Illegal Drug Interdiction
Undocumented Migrant Interdiction
Other Law Enforcement
Ports Waterways Coastal Security
Defense Readiness
Percentage of Total Resource Hours by Fiscal Year
FY11
FY10
FY09
FY08
FY07
FY06
Non-Homeland Security Missions
Homeland Security Missions
Source DHS-OIG based on USCG-provided data
Resource hours for non-homeland security missions are summarized in appendix C and homeland security missions are summarized in appendix D
The USCGrsquos Mission Performance
We based the performance portion of our review on the USCGrsquos December 2011 internal report titled United States Coast Guard Fiscal Year 2011 Performance Report as well as previous USCG performance reports and OIG reports Because USCG performance reports are internal documents they contain additional management and break-out measures that we did not include in our report In addition the USCG may add retire or change the methodology of certain measures from year-to-year This report includes those measures that the USCG considers summary measures In FY 2011 the USCG used 23 summary performance measures compared with 15 summary performance measures in FY 2010 Fourteen of the 15 measures reported in FY 2010 were continued in FY
wwwoigdhsgov 5 OIG-12-119
OFFICE OF INSPECTOR GENERAL Department of Homeland Security
2011 The methodology for the remaining FY 2010 measure Percent Reduction in Maritime Terrorism Risk over which the USCG has Influence was revised resulting in four new ports waterways and coastal security measures as shown in appendix D
The USCG reported that it met or exceeded 14 of 23 summary performance measures in FY 2011 This includes 9 of 12 non-homeland security performance measures and 5 of 11 homeland security performance measures Non-homeland security performance measures and results are included in appendix C and homeland security measures and results are in appendix D Appendix E contains a summary of the USCGrsquos FY 2011 performance measures for its 11 missions
FY 2011 Budget Information
In FY 2011 the USCG budgeted approximately the same percentage of its funding for non-homeland security missions (496 percent) as homeland security missions (504 percent) Based on the USCGrsquos FY 2012 budget the historical funding gap between non-homeland security and homeland security missions is expected to remain narrow For FY 2012 the USCG budgeted approximately 518 percent of its mission resources for non-homeland security missions and 482 percent for homeland security missions The largest percentage of the USCGrsquos mission resources will continue to be dedicated to its ports waterways and coastal security mission which garnered 222 percent of the budget in FY 2012 and is projected to receive 209 percent of the budget in FY 2013
Management Comments and OIG Analysis
The formal reply from the Assistant Commandant for Resources and Chief Financial Officer for the Coast Guard is included in appendix B USCG also provided technical comments on our draft report and we addressed them as appropriate throughout the report
wwwoigdhsgov 6 OIG-12-119
OFFICE OF INSPECTOR GENERAL Department of Homeland Security
Appendix A Objectives Scope and Methodology
The DHS OIG was established by the Homeland Security Act of 2002 (Public Law 107shy296) by amendment to the Inspector General Act of 1978 This is one of a series of audit inspection and special reports prepared as part of our oversight responsibilities to promote economy efficiency and effectiveness within the Department
Section 888(f)(1) of the Homeland Security Act of 2002 directs the Inspector General to conduct an annual assessment of the USCGrsquos performance of all its missions with a particular emphasis on non-homeland security missions The objective of this review was to determine the extent to which the USCG is maintaining its historical level of effort on non-homeland security missions
We reviewed the following Government Accountability Office (GAO) reports and testimonies
bull GAO-12-14 Coast Guard Security Risk Model Meets DHS Criteria but More Training Could Enhance Its Use for Managing Programs and Operations November 2011
bull GAO-12-254T Coast Guard Observations on Arctic Requirements Icebreakers and Coordination with Stakeholders December 2011
bull GAO-12-518 Border Security Opportunities Exist to Ensure More Effective Use of DHSrsquos Air and Marine Assets March 2012
bull GAO-10-411T Coast Guard Observations on the Requested Fiscal Year 2011 Budget Past Performance and Current Challenges February 2010
bull GAO-10-268R Coast Guard Workforce Issues January 2010
We analyzed the total number of resource hours reported by the USCG prior to September 11 2001 through FY 2011 We did not attempt to verify the resource hour data nor did we attempt to validate whether the USCG had accurately categorized such data We assessed total resource hours for the USCGrsquos 11 individual missions to identify the changes in each
We analyzed performance measures and targets to determine whether the measures for each of the USCGrsquos missions had been accomplished We obtained information on performance from the USCGrsquos internal report United States Coast Guard Fiscal Year 2011 Performance Report dated December 2011 In addition we reviewed our Annual Review of the United States Coast Guardrsquos Mission Performance (FY 2010) dated September 2011 for performance measure data prior to FY 2011 We obtained budget information from DHSrsquos Budget-in-Brief for FYs 2011- FY 2013
wwwoigdhsgov 7 OIG-12-119
OFFICE OF INSPECTOR GENERAL Department of Homeland Security
We conducted this review between April and August 2012 under the authority of the Inspector General Act of 1978 as amended and according to the Quality Standards for Inspections issued by the Council of the Inspectors General on Integrity and Efficiency
wwwoigdhsgov 8 OIG-12-119
OFFICE OF INSPECTOR GENERAL Department of Homeland Security
Appendix B Management Comments to the Draft Report
US Oopartmonl of Commandant 2100 Second Street sw Stop 7245 United WashingtOn DC 20593 Homeland security States Coast Guard
StaffSymbolCG-823
United Statas Phone (202) 372-3S33 F (202)372-2311
Coast Guard
7501
AUG 3 1 2012
Reply to Audit Manager Attn of Mark Kulwicki
(202) 372-3533 To Anne L Richards
Assistant Inspector General for Audits
Subj DHS orG REPORT ON ANNUAL REVIEW OF THE UNITED STATES COAST GUARDS MISSION PERFORMANCE (FY 2011)
Ref (a) DHS orG Draft Report dated August 16 2012
I Thank you for the opportunity to review and comment on the Department of Homeland Security (DHS) Office of Inspector Generals Draft Report 12-028-AUD-USCG entitled Annual Review of the United States Coast Guards Mission Perfonnance (FY 2011)
2 The United States Coast Guard (USCG) appreciates the efforts of the orG to docwnent measures that we can take to enhance the programs overall effectiveness
3 The USCG recommends the following technical comments contained in the enclosure
4 If you have any questions my point of contact is Mr Mark Kulwicki who can be reached at (202) 372-3533
Enclosure (I) USCG technical comments
Copy Brooke Bebow Director Lisa Vonder Haar Audit Manager Stephen Doran Auditor Rkhard Joyce Program Analyst Marisa Coccaro Referencer
wwwoigdhsgov 9 OIG-12-119
OFFICE OF INSPECTOR GENERAL Department of Homeland Security
Appendix C Non-Homeland Security Missions
The FY 2011 non-homeland security mission resource hours totaled 328008 and decreased by approximately 7 percent from FY 2010 However the FY 2011 level remains at approximately 10 percent above baseline levels The following graph illustrates the trend in non-homeland security mission resource hours since 2006 compared with the baseline period
Non-Homeland Security Resource Hours
0
50000
100000
150000
200000
250000
300000
350000
Reso
urce
Hou
rs
2007
2006
Baseline
2011
2010
2009
2008
Fiscal Year Source DHS-OIG based on USCG-provided data
In FY 2011 the USCG reported that it met or exceeded 9 of 12 summary performance measures for its 6 non-homeland security missions compared with meeting 7 of 10 summary performance measures in FY 2010 The resource hours and summary performance measures and results for each non-homeland security mission are discussed below
Living Marine Resources
Living marine resources law enforcement is an obligation under the Magnuson-Stevens Fishery Conservation and Management Act the Endangered Species Act and several other laws for the protection of marine resources Its core responsibility is to provide effective and professional enforcement to advance national goals for the conservation management and recovery of living marine resources marine protected species and
wwwoigdhsgov 10 OIG-12-119
Living Marine Resources Performance Measure ndash Fishing Regulation Compliance Rate
FY 2006 Actual
FY 2007 Actual
FY 2008 Actual
FY 2009 Actual
FY 2010 Actual
FY 2011 Target
FY 2011 Actual
966 962 953 968 972 96 974 X
Not Met X
Not Met X
Not Met X
Not Met
Met
Met
Source DHS-OIG based on USCG-provided data
OFFICE OF INSPECTOR GENERAL Department of Homeland Security
national marine sanctuaries and monuments This includes enforcement of living marine resource regulations and other activities that strengthen both domestic and international living marine resources regimes
Resource Hours FY 2011 resource hours for living marine resources totaled 93616 This is an increase of 02 percent from FY 2010 and is higher than the baseline by 26 percent
Source DHS-OIG based on USCG-provided data
Performance Measures and Results The USCG uses the percentage of fishing vessels observed at-sea complying with domestic regulations as a measure of its effect on enforcement of US fisheries and protected species regulations The measure reflects the percentage of USCG boardings at-sea where no significant violations of domestic living marine resource regulations were detected As shown in the chart below the USCG reported that it met its single living marine resources performance measure in FY 2011
wwwoigdhsgov 11 OIG-12-119
OFFICE OF INSPECTOR GENERAL Department of Homeland Security
Marine Safety
The focus of the USCGrsquos marine safety mission is the prevention of deaths injuries and property loss Marine safety responsibilities include ensuring the safe and environmentally sound operation of millions of recreational vessels and thousands of US flagged commercial vessels The USCG develops and enforces Federal marine safety regulations certifies and provides credentials to over 218000 mariners investigates commercial marine casualties and shares its findings and conducts compulsory inspections as well as voluntary safety exams
Resource Hours The USCG did not report hours for this mission prior to 2005 FY 2011 resource hours for marine safety totaled 64210 and increased by approximately 91 percent from FY 2010
Source DHS-OIG based on USCG-provided data
Performance Measures and Results The USCG reported that it met three of four summary performance measures related to marine safety in FY 2011 Federal regulations require the person in charge of commercial US flagged vessels to notify the USCG of any loss of life or injury requiring professional medical treatment beyond first aid The USCG uses deaths and injuries as a measure of commercial mariner and passenger safety and the five-year average number of deaths and injuries as an indicator of long-term performance trends In FY 2011 the USCG met its target for commercial mariner deaths and injuries but missed the target for passenger deaths and injuries as shown below
wwwoigdhsgov 12 OIG-12-119
Marine Safety Performance Measure ndash Five-Year Average Number of Commercial
Mariner Deaths and Injuries
FY 2006 Actual
FY 2007 Actual
FY 2008 Actual
FY 2009 Actual
FY 2010 Actual
FY 2011 Target
FY 2011 Actual
502 526 496 498 474 lt475 431
NA NA Met Met Met Met
Source DHS-OIG based on USCG-provided data
Marine Safety Performance Measure ndash Five-Year Average Number of
Recreational Boating Deaths and Injuries FY 2006 FY 2007 FY 2008 FY 2009 FY 2010 FY 2011 FY 2011 Actual Actual Actual Actual Actual Target Actual 4366 4249 4147 4150 4091 lt4115 3904
NA NA Met Met Met Met
OFFICE OF INSPECTOR GENERAL Department of Homeland Security
Marine Safety Performance Measure ndash Five-Year Average Number of
Commercial Passenger Deaths and Injuries FY 2006 FY 2007 FY 2008 FY 2009 FY 2010 FY 2011 FY 2011 Actual Actual Actual Actual Actual Target Actual
216 238 252 238 250 lt223 232
NA NA X X X
Not Met Met Not Met Not Met Source DHS-OIG based on USCG-provided data
Federal regulations also require operators or owners of recreational vessels to file a boating accident report when a person dies or disappears from the vessel under certain circumstances The USCG uses deaths and injuries as a measure of marine safety for the recreational boating segment of the American maritime community and a five-year average of these as an indicator of long-term performance trends The USCG reported that it met its target for this measure in FY 2011
Source DHS-OIG based on USCG-provided data
In FY 2011 the USCG added a new long-term performance measure for the five-year average number of commercial and recreational deaths and injuries The target for this measure was met
wwwoigdhsgov 13 OIG-12-119
OFFICE OF INSPECTOR GENERAL Department of Homeland Security
Marine Safety Performance Measure ndash Five-Year Average Number of
Commercial and Recreational Deaths And Injuries FY 2006 FY 2007 FY 2008 FY 2009 FY 2010 FY 2011 FY 2011 Actual Actual Actual Actual Actual Target Actual
NA NA NA NA NA lt4813 4567
NA NA NA NA NA Met
Source DHS-OIG based on USCG-provided data
Marine Environmental Protection
The marine environmental protection mission focuses on minimizing oil and hazardous substance effect on human health the environment and the marine transportation system The USCG regulates the handling of oil hazardous substances and other shipboard wastes to prevent their discharge into US or international waterways stop unauthorized ocean dumping reduce ship-based air emissions and avert the introduction of invasive species The USCG is the lead Federal agency for directing the removal and mitigation of oil spills from the waters and adjoining shorelines of the coastal zone
Resource Hours Marine environmental protection resource hours totaled 4682 in FY 2011 This represents a decrease of 839 percent from FY 2010 and is attributable to the reduction of resource hours necessary for the Deepwater Horizon oil spill in the Gulf of Mexico
Source DHS-OIG based on USCG-provided data
wwwoigdhsgov 14 OIG-12-119
Marine Environmental Protection Performance Measure Average Number of Oil Spills in the Maritime Environment
FY 2006 FY 2007 FY 2008 FY 2009 FY 2010 FY 2011 FY 2011 Actual Actual Actual Actual Actual Target Actual 143 139 132 123 115 lt116 102
NA NA Met Met Met Met
Source DHS-OIG based on USCG-provided data
OFFICE OF INSPECTOR GENERAL Department of Homeland Security
Performance Measures and Results Federal regulation requires vessel or facility operators to report the discharge of any hazardous substance that equals or exceeds reportable quantities and requires the reporting of any discharge of oil or oil products that cause a sheen discoloration sludge or emulsion on or below the surface of any navigable waterway of the United States The USCG uses the number of chemical discharge incidents and the number of oil spills greater than 100 gallons as proxy indicators of marine environmental protection and normalizes five-year averages of these as indicators of long-term trends In FY 2011 the USCG reported that it met the target for ldquoAverage Number of Chemical Discharge Incidents in the Maritime Environmentrdquo which was previously reported as ldquo5-Yr Average Chemical Discharge Incidents per 100 Million Short Tons Shippedrdquo
Marine Environmental Protection Performance Measure ndash Average Number of Chemical Discharge
Incidents in the Maritime Environment FY
2006 Actual
FY 2007
Actual
FY 2008
Actual
FY 2009
Actual
FY 2010
Actual
FY FY 2011 2011
Target Actual 278 244 198 187 181 lt220 150
NA NA Met Met Met Met
Source DHS-OIG based on USCG-provided data
USCG also reported that it met the target for ldquoAverage Number of Oil Spills in the Maritime Environmentrdquo which was previously reported as ldquo5-Yr Average Oil Spills gt 100 Gallons per 100 Million Short Tons Shippedrdquo
Search and Rescue
USCG strives to minimize lives lost injury and property loss or damage by rendering aid to those in distress in the maritime environment and elsewhere as called upon The search and rescue mission is accomplished through resource readiness distress monitoring and communication search planning on-scene operations and domestic and international partnerships
wwwoigdhsgov 15 OIG-12-119
OFFICE OF INSPECTOR GENERAL Department of Homeland Security
Resource Hours Search and rescue is a demand-driven mission Requirements for search and rescue increase or decrease relative to the number of people requiring the USCGrsquos assistance Resource hours in FY 2011 totaled 55934 and decreased approximately 13 percent from FY 2010
Source DHS-OIG based on USCG-provided data
0 10000 20000 30000 40000 50000 60000 70000 80000 90000
Baseline
2006
2007
2008
2009
2010
2011 Re
sour
ce H
ours
Search and Rescue Resource Hours
Fiscal Year
Performance Measures and Results USCG met the FY 2011 target for percent of people in imminent danger saved in the maritime environment was not met Though this yearrsquos performance is below the overall target it is more than the 744 percent level posted in FY 2010 In FY 2011 the USCG saved 3804 lives in 20510 cases with 732 lives lost and 390 lives unaccounted for This total excluded outlier cases with more than 10 lives at risk Other than raw numbers of lives saved and lost there is no clear indication of the drivers that led to this decrease The USCG is conducting further analysis is in progress to identify any systemic issues Additionally uncontrollable variables such as weather location incident severity and life saving devices on board continue to influence the number and outcome of search and rescue incidents
Search and Rescue Performance Measure ndash Percent of People in Imminent Danger Saved
in the Maritime Environment FY FY FY FY FY FY FY
2006 2007 2008 2009 2010 2011 2011 Actual Actual Actual Actual Actual Target Actual
76 766 768 773 744 100 773 X X
Met Met Met Met Not Met Not Met Source DHS-OIG based on USCG-provided data
wwwoigdhsgov 16 OIG-12-119
Search and Rescue Performance Measure ndash Percent of Time Rescue Assets are On-Scene
within 2 Hours FY
2006 FY
2007 FY
2008 FY
2009 FY
2010 FY
2011 FY
2011 Actual Actual Actual Actual Actual Target Actual 937 943 933 940 933 100 931
Met Met Met Met Met X
Not Met Source DHS-OIG based on USCG-provided data
OFFICE OF INSPECTOR GENERAL Department of Homeland Security
The FY 2011 target for percent of time rescue assets are on-scene within 2 hours was not met However overall performance is in line with the USCGrsquos expectations based on placement of resources and proximity to shore of the majority of search and rescue incidents and shows consistent performance over the last six years This measure has been adjusted to exclude cases in which an operational decision was made to delay a response Certain determining factors such as weather resource availability and risk assessment delay response time
Aids-to-Navigation
USCG minimizes disruptions to maritime commerce by assessing and mitigating risks to safe navigation It provides and maintains more than 51000 buoys beacons lights and other aids to mark channels and denote hazards
Resource Hours FY 2011 resource hours totaled 98819 and increased approximately 37 percent from FY 2010 This is an approximately 12 percent decrease from the baseline level
wwwoigdhsgov 17 OIG-12-119
Aids-to-Navigation Performance Measure ndash Availability of Maritime Navigation Aids
FY 2006 FY 2007 FY 2008 FY 2009 FY 2010 FY 2011 FY 2011 Actual Actual Actual Actual Actual Target Actual 968 980 983 980 985 975 985
X Not Met Met Met Met Met Met
Source DHS-OIG based on USCG-provided data
Aids-to-Navigation Performance Measure ndash Average Number of Navigational Accidents
FY 2006 FY 2007 FY 2008 FY 2009 FY 2010 FY 2011 FY 2011 Actual Actual Actual Actual Actual Target Actual 1765 1823 1857 1878 1878 1945
X Not Met
X Not Met
X Not Met
X Not Met
X Not Met Met
Source DHS-OIG based on USCG-provided data
OFFICE OF INSPECTOR GENERAL Department of Homeland Security
Source DHS-OIG based on USCG-provided data
Performance Measures and Results The USCG reported that it met its FY 2011 target for the availability of maritime navigation aids for the fifth consecutive year
In FY 2011 the USCG reported that it met its target for the average number of navigational accidents This is the first time this measure was met in the past six years
wwwoigdhsgov 18 OIG-12-119
Ice Operations Performance Measure ndash Number of Days Critical Waterways Are Closed to
Commerce Due to Ice FY 2006 FY 2007 FY 2008 FY 2009 FY 2010 FY 2011 FY 2011 Actual Actual Actual Actual Actual Target Actual
0 0 0 0 6 2 avg amp 8 severe
0
Met Met Met Met X
Not Met Met Source DHS-OIG based on USCG-provided data
OFFICE OF INSPECTOR GENERAL Department of Homeland Security
Ice Operations
This mission supports winter commerce and prevents and responds to ice that causes flooding These activities are essential to winter and spring commerce and the safety of waterside communities on the Great Lakes in New England and on the Hudson River and occasionally in the mid-Atlantic
Resource Hours In FY 2011 resource hours totaled 10747 and decreased approximately 77 percent from FY 2010 which is approximately 10 percent lower than the baseline level
Source DHS-OIG based on USCG-provided data
Performance Measures and Results The USCG reported that it met its FY 2011 target for the number of days critical waterways are closed to commerce due to ice Domestic icebreakers on the Great Lakes assisted over 1700 commercial vessel transits carrying $300 million in bulk commodities Favorable environmental conditions continued partnership with the Canadian Coast Guard and effective employment of domestic icebreaking assets contributed to achieving the performance target
wwwoigdhsgov 19 OIG-12-119
OFFICE OF INSPECTOR GENERAL Department of Homeland Security
Appendix D Homeland Security Missions
The FY 2011 homeland security mission resource hours totaled 355586 and decreased by approximately 05 percent from FY 2010 Between FY 2006 and FY 2011 total resource hours for homeland security missions were the highest in FY 2007 However the FY 2011 level remains at approximately 91 percent above baseline levels as depicted in the following graph
Source DHS-OIG based on USCG-provided data
In FY 2011 the USCG reported that it met or exceeded 5 of 11 summary performance measures for its 5 homeland security missions compared with meeting 2 of 5 summary performance measures in FY 2010 The resource hours and performance measures and results for each non-homeland security mission are summarized below
Ports Waterways and Coastal Security
The ports waterways and coastal security mission aims to deny terrorists the use and exploitation of the maritime domain and marine transportation system as a means for attacks on US territory population centers vessels and maritime critical infrastructure and key resources This mission includes preparedness planning and exercises antiterrorism and counterterrorism activities and initial recovery efforts if attacks are successful
wwwoigdhsgov 20 OIG-12-119
OFFICE OF INSPECTOR GENERAL Department of Homeland Security
Resource Hours In FY 2011 resource hours for ports waterways and coastal security totaled 155969 which is a decrease of 09 percent from FY 2010
Source DHS-OIG based on USCG-provided data
Performance Measures and Results USCG reported that it met three of its six FY 2011 targets for ports waterways and coastal security In FY 2011 the USCG added two new summary measures related to compliance with security regulations and significantly updated the methodology for the FY 2010 summary measure Percent Reduction in Maritime Terrorism Risk over which the USCG has Influence resulting in four maritime security risk measures as shown in the following charts The USCG improved and created a new baseline for the maritime security risk measures in FY 2010 thus FY 2011 results should not be compared to previous years
The revised maritime security risk measures are risk-based outcome measures that begin with an assessment of likely high-consequence maritime terrorist attack scenarios Threat vulnerability and consequence levels are estimated for each scenario which generates a proxy (index) value of raw risk that exists in the maritime domain Next the USCG interventions (security and response operations regime and awareness activities) for the fiscal year are scored against the scenarios with regard to the decreases in threat vulnerability and consequence that each has been estimated to have afforded The resulting measures are proxy measures of performance
As depicted below the USCG reported that it met its FY 2011 target for ldquoPercent Reduction of all Maritime Security Risk Subject to USCG Influencerdquo
wwwoigdhsgov 21 OIG-12-119
Ports Waterways and Coastal Security Performance Measure ndash Percent Reduction of all Maritime Security Risk
Subject to USCG Influence
FY 2006 Actual
FY 2007 Actual
FY 2008 Actual
FY 2009 Actual
FY 2010 Actual
FY 2011 Target
FY 2011 Actual
NA NA NA NA NA 44 44
Met Met Met Met Met Met Source DHS-OIG based on USCG-provided data
OFFICE OF INSPECTOR GENERAL Department of Homeland Security
USCG exceeded its FY 2011 target for Percent Reduction of all Maritime Security Risk Resulting from USCG Consequence Management
Ports Waterways and Coastal Security Performance Measure ndash Percent Reduction of Maritime Security Risk
Resulting from US Coast Guard Consequence Management
FY 2006 Actual
FY 2007 Actual
FY 2008 Actual
FY 2009 Actual
FY 2010 Actual
FY 2011 Target
FY 2011 Actual
NA NA NA NA NA 3 4
Met Met Met Met Met Met Source DHS-OIG based on USCG-provided data
USCG did not meet its target for ldquoPercent Reduction of Maritime Security Risk Resulting from USCG Efforts to Prevent a Terrorist Entering the US via Maritime Meansrdquo This is attributable to lower effectiveness judgments for the Maritime Security Response Team due to the loss of dedicated airlift and the suspension of hook-and-climb training Additionally major cutter capacity decreased due to the decommissioning of one High Endurance Cutter and an overall reduction of major cutter resource hours
Ports Waterways and Coastal Security Performance Measure ndash Percent Reduction of Maritime Security Risk
Resulting from USCG Efforts to Prevent a Terrorist Entering the US via Maritime Means
FY 2006 Actual
FY 2007 Actual
FY 2008 Actual
FY 2009 Actual
FY 2010 Actual
FY 2011 Target
FY 2011 Actual
NA NA NA NA NA 52 43
Met Met Met Met Met Not Met Source DHS-OIG based on USCG-provided data
USCG missed its target for ldquoPercent Reduction of Maritime Security Risk Resulting from USCG Efforts to Prevent a Weapon of Mass Destruction from Entering the United States
wwwoigdhsgov 22 OIG-12-119
Ports Waterways and Coastal Security Performance Measure ndash Percent Reduction of Maritime Security Risk
Resulting from USCG Efforts to Prevent a Weapon of Mass Destruction from Entering the US via Maritime Means
FY 2006 Actual
FY 2007 Actual
FY 2008 Actual
FY 2009 Actual
FY 2010 Actual
FY 2011 Target
FY 2011 Actual
NA NA NA NA NA 29 28
Met Met Met Met Met Not Met
Ports Waterways and Coastal Security Performance Measure ndash Annual Maritime Transportation Security Act Facility
Compliance Rate with Transportation Worker Identification Credential Regulations
FY 2006 Actual
FY 2007 Actual
FY 2008 Actual
FY 2009 Actual
FY 2010 Actual
FY 2011 Target
FY 2011 Actual
NA NA NA NA 100 85 99
NA NA NA NA Met Met
Source DHS-OIG based on USCG-provided data
OFFICE OF INSPECTOR GENERAL Department of Homeland Security
via Maritime Meansrdquo by one percentage point This is attributable to lower effectiveness judgments for the Maritime Security Response Team due to loss of dedicated airlift and the challenges of identifying a broad range of Weapons of Mass Destruction amongst the volume of legitimate shipping cargo Additionally major cutter capacity decreased due to the decommissioning of one High Endurance Cutter and an overall reduction of major cutter resource hours
Source DHS-OIG based on USCG-provided data
USCG exceeded its FY 2011 target for ldquoAnnual Maritime Transportation Security Act Facility Compliance Rate with Transportation Worker Identification Credential Regulationsrdquo
USCG missed its target for ldquoPercent of Maritime Facilities in Compliance with Security Regulationsrdquo by only one-tenth of one percent The USCG has focused the use of its personnel resources to conduct Maritime Transportation Security Act compliance exams at waterfront facilities that are at higher risk for a transportation security incident By increasing partnerships with these facilities 999 percent of regulated facilities did not have serious deficiencies warranting a notice of violation or civil penalty in FY 2011
wwwoigdhsgov 23 OIG-12-119
Ports Waterways and Coastal Security Performance Measure ndash Percent Of Maritime Facilities in Compliance with
Security Regulations
FY 2006 Actual
FY 2007 Actual
FY 2008 Actual
FY 2009 Actual
FY 2010 Actual
FY 2011 Target
FY 2011 Actual
NA NA NA NA NA 100 999
NA NA NA NA NA Not Met
Source DHS-OIG based on USCG-provided data
OFFICE OF INSPECTOR GENERAL Department of Homeland Security
Drug Interdiction
USCGrsquos drug interdiction efforts support national strategies to disrupt the market for illegal drugs and prevent transnational threats from reaching the United States The USCG is the lead Federal agency for drug interdiction on the high seas and shares the lead for drug interdiction in the territorial seas of the US with Customs and Border Protection The USCG coordinates with its interagency partners to deter illicit drug trafficking including the Department of Defense Department of Justice Department of State and other components within DHS
Resource Hours FY 2011 resource hours totaled 73401 and increased by approximately 9 percent from FY 2010 but are about 40 percent below baseline levels
Source DHS-OIG based on USCG-provided data
Performance Measures and Results The USCG uses the interagency Consolidated Counter Drug Database as its main source for tracking cocaine movement estimates
wwwoigdhsgov 24 OIG-12-119
Drug Interdiction Performance Measure ndash Removal Rate for Cocaine from Non-commercial
Vessels in Maritime Transit Zone FY 2006 FY 2007 FY 2008 FY 2009 FY 2010 FY 2011 FY 2011 Actual Actual Actual Actual Actual Target Actual
NA NA NA 150 135 155 116
NA NA NA X
Not Met X
Not Met X
Not Met Source DHS-OIG based on USCG-provided data
OFFICE OF INSPECTOR GENERAL Department of Homeland Security
The one performance measure related to Drug Interdiction ldquoRemoval Rate for Cocaine from Non-commercial Vessels in Maritime Transit Zonerdquo was not met in FY 2011 According to the USCG the reasons for not meeting this target can be attributed to reduced asset and resource availability smaller average load sizes of cocaine and increasingly sophisticated criminal organizations
Migrant Interdiction
USCG migrant interdiction policy and operations are designed to provide effective law enforcement presence at sea and achieve three main objectives (1) deter undocumented migrants and transnational human smugglers from using maritime routes to enter the US (2) detect and interdict undocumented migrants and human smugglers far from the US border and (3) expand USCG participation in multi-agency and bi-national border security initiatives While the USCG leads the interdiction mission on the high seas it partners with Customs and Border Protection and Immigration and Customs Enforcement for shore-side interdiction operations
Resource Hours Migrant interdiction resource hours remain approximately 144 percent above baseline levels In FY 2011 resource hours totaled 72213 and decreased approximately 60 percent from FY 2010 to FY 2011
wwwoigdhsgov 25 OIG-12-119
Migrant Interdiction Performance Measure ndash Percentage of Undocumented Migrants who
Attempt to Enter the United States Via Maritime Routes that are Interdicted
FY 2006 Actual
FY 2007 Actual
FY 2008 Actual
FY 2009 Actual
FY 2010 Actual
FY 2011 Target
FY 2011 Actual
NA 652 627 844 645 739 728
NA Not Met Not Met Met Not Met Not Met
OFFICE OF INSPECTOR GENERAL Department of Homeland Security
Source DHS-OIG based on USCG-provided data
Performance Measures and Results According to the USCG the number of undocumented migrants attempting to enter the US remained low in FY 2011 compared to numbers observed over the last decade due in part to a slumping US economy successful prosecution of smugglers effective bilateral cooperation and use of biometrics The USCG reported that it met one of its two performance measures related to migrant interdiction in FY 2011 Although the USCG did not meet the target for ldquoPercentage of Undocumented Migrants who Attempt to Enter the United States via Maritime Routes that are Interdictedrdquo the actual result of 728 percent was an improvement over FY 2010rsquos 645 percent This measure includes migrants who are interdicted by foreign counterparts of the USCG many of whom have fewer resources than the USCG
Source DHS-OIG based on USCG-provided data
As shown in the table below the USCG exceeded its target for the ldquoPercent of Undocumented Migrants who Attempt to Enter the United States via Maritime Routes Interdicted by the Coast Guardrdquo
wwwoigdhsgov 26 OIG-12-119
Migrant Interdiction Performance Measure ndash Percent of Undocumented Migrants who Attempt to Enter the United States via Maritime Routes Interdicted by the Coast Guard
FY 2006 Actual
FY 2007 Actual
FY 2008 Actual
FY 2009 Actual
FY 2010 Actual
FY 2011 Target
FY 2011 Actual
NA 421 469 375 447 430 517
NA NA Not Met Not Met Met Met
Source DHS-OIG based on USCG-provided data
OFFICE OF INSPECTOR GENERAL Department of Homeland Security
Defense Readiness
The USCG maintains a level of readiness and training that allows for the immediate integration with Department of Defense forces for peacetime operations or during times of war This supports US national interests abroad as well as facilitating support to DHS for the integration of Homeland Defense and Homeland Security
Resource Hours In FY 2011 resource hours for Defense Readiness totaled 41424 and were still above the baseline although resource hours decreased by 119 percent from FY 2010 to FY 2011
Source DHS-OIG based on USCG-provided data
Performance Measures and Results The USCG did not meet its overall target of 381 percent defense readiness for the year The declining readiness of the USCGrsquos High Endurance Cutter fleet continues to present significant challenges to mission
wwwoigdhsgov 27 OIG-12-119
Defense Readiness Performance Measure ndash Defense Readiness Assessment of all USCG High-
Endurance Cutters Patrol Boats and Port Security Units
FY 2006 Actual
FY 2007 Actual
FY 2008 Actual
FY 2009 Actual
FY 2010 Actual
FY 2011 Target
FY 2011 Actual
NA NA NA NA 241 381 251
NA NA NA NA Not Met Not Met
Source DHS-OIG based on USCG-provided data
OFFICE OF INSPECTOR GENERAL Department of Homeland Security
performance High Endurance Cutter readiness is being addressed by the USCGrsquos acquisition of the National Security Cutter
Other Law Enforcement
The other law enforcement mission orchestrates the enforcement of regulations on foreign fishing vessels This enforcement takes two forms the first is the deterrence detection and interdiction of illegal incursions into the US exclusive economic zone by foreign fishing vessels 1 The protection of the US exclusive economic zone from incursions by foreign fishing vessels contributes to a fundamental USCG maritime security objective to protect our Nationrsquos renewable natural resources The second part of the other law enforcement mission is to ensure compliance with international agreements for the management of living marine resources This is primarily accomplished through enforcement on foreign fishing vessels of conservation and management measures created by regional fishery management organizations
Resource Hours In FY 2011 resource hours for the other law enforcement mission totaled 12579 which is an increase of 445 percent from FY 2010 According to the USCG this increase in resource hours was due to increased patrols for illegal unregulated and unreported fishing activity
1 The exclusive economic zone is the zone where the US and other coastal nations have jurisdiction over economic and resource management The exclusive economic zone includes waters three to 200 miles offshore (or nine to 200 miles offshore in western Florida and Texas)
wwwoigdhsgov 28 OIG-12-119
OFFICE OF INSPECTOR GENERAL Department of Homeland Security
Source DHS-OIG based on USCG-provided data
Performance Measures and Results The USCG uses the number of detected incursions into the US Exclusive Economic Zone by foreign fishing vessels as a measure of its performance In FY 2011 there were 122 detected incursions of foreign fishing vessels into the US Exclusive Economic Zone which met the performance target of fewer than 180 incursions
Other Law Enforcement Performance Measure ndash Number of Detected Incursions of Foreign Fishing
Vessels violating US Waters
FY 2006 Actual
FY 2007 Actual
FY 2008 Actual
FY 2009 Actual
FY 2010 Actual
FY 2011 Target
FY 2011 Actual
164 126 81 112 82 lt180 122
Met Met Met Met Met Met Source DHS-OIG based on USCG-provided data
wwwoigdhsgov 29 OIG-12-119
Mission Measure Met Not Met
Non-Homeland Security Missions
Search and Rescue Percentage of People in Imminent Danger Saved in the Maritime Environment
X
Percent of Time Rescue Assets are On-Scene within 2 Hours X
Aids-to-Navigation Availability of Maritime Navigation Aids X Average Number of Navigational Accidents X
Ice Operations Number of Days Critical Waterways Are Closed to Commerce Due to Ice X Living Marine Resources Fishing Regulation Compliance Rate X
Marine Safety
5-Yr Average Number of Commercial and Recreational Deaths and Injuries
X
5-Yr Average Number of Commercial Mariner Deaths and Injuries X
5-Yr Average Number of Commercial Passenger Deaths and Injuries X
5-Yr Average Number of Recreational Boating Deaths and Injuries X
Marine Environmental Protection
Average Number of Chemical Discharge Incidents in the Maritime Environment
X
Average Number of Oil Spills in the Maritime Environment X Total Non-Homeland Security Performance Measures 9 3
Homeland Security Missions
Ports Waterways and Coastal Security
Percentage Reduction of all Maritime Security Risk Subject to USCG Influence
X
Percent Reduction of Maritime Security Risk Resulting from USCG Consequence Management
X
Percent Reduction of Maritime Security Risk Resulting from USCG Efforts to Prevent a Terrorist Entering the US via Maritime Means
X
Percent Reduction of Maritime Security Risk Resulting from USCG Efforts to Prevent a Weapon of Mass Destruction from Entering the US via Maritime Means
X
Annual MTSA Facility Compliance Rate with Transportation Worker Identification Credential Regulations
X
Percent of Maritime Facilities In Compliance with Security Regulations X
Drug Interdiction Removal Rate for Cocaine from Non-commercial Vessels in Maritime Transit Zone
X
Migrant Interdiction
Percentage of Undocumented Migrants who Attempt to Enter the United States Via Maritime Routes that are Interdicted
X
Percent of Undocumented Migrants who Attempt to Enter the US by Maritime Routes Interdicted by the USCG
X
Defense Readiness Defense Readiness Assessment of all USCG High-Endurance Cutters Patrol Boats and Port Security Units
X
Other Law Enforcement Number of Detected Incursions of Foreign Fishing Vessels Violating US Waters
X
Total Homeland Security Performance Measures 5 6
Total USCG Performance Measures 14 9 Source DHS-OIG based on USCG-provided data
OFFICE OF INSPECTOR GENERAL Department of Homeland Security
Appendix E FY 2011 Performance Measure Summary
wwwoigdhsgov 30 OIG-12-119
OFFICE OF INSPECTOR GENERAL Department of Homeland Security
Appendix F Major Contributors to This Report
Brooke Bebow Director Lisa Vonder Haar Audit Manager Stephen Doran Auditor Richard Joyce Program Analyst Marisa Coccaro Referencer
wwwoigdhsgov 31 OIG-12-119
OFFICE OF INSPECTOR GENERAL Department of Homeland Security
Appendix G Report Distribution
Department of Homeland Security
Secretary Deputy Secretary Chief of Staff Deputy Chief of Staff General Counsel Executive Secretary Director GAOOIG Liaison Office Assistant Secretary for Office of Policy Assistant Secretary for Office of Public Affairs Assistant Secretary for Office of Legislative Affairs Acting Chief Privacy Officer
United States Coast Guard
Commandant Assistant Commandant for Resources and Chief Financial Officer USCG Audit Liaison
Office of Management and Budget
Chief Homeland Security Branch DHS OIG Budget Examiner
Congress
Congressional Oversight and Appropriations Committees as appropriate
wwwoigdhsgov 32 OIG-12-119
ADDITIONAL INFORMATION AND COPIES
To obtain additional copies of this document please call us at (202) 254-4100 fax your request to (202) 254-4305 or e-mail your request to our Office of Inspector General (OIG) Office of Public Affairs at DHS-OIGOfficePublicAffairsoigdhsgov
For additional information visit our website at wwwoigdhsgov or follow us on Twitter at dhsoig
OIG HOTLINE
To expedite the reporting of alleged fraud waste abuse or mismanagement or any other kinds of criminal or noncriminal misconduct relative to Department of Homeland Security (DHS) programs and operations please visit our website at wwwoigdhsgov and click on the red tab titled Hotline to report You will be directed to complete and submit an automated DHS OIG Investigative Referral Submission Form Submission through our website ensures that your complaint will be promptly received and reviewed by DHS OIG
Should you be unable to access our website you may submit your complaint in writing to DHS Office of Inspector General Attention Office of Investigations Hotline 245 Murray Drive SW Building 410Mail Stop 2600 Washington DC 20528 or you may call 1 (800) 323-8603 or fax it directly to us at (202) 254-4297
The OIG seeks to protect the identity of each writer and caller
OFFICE OF INSPECTOR GENERAL Department of Homeland Security
Appendix B Management Comments to the Draft Report
US Oopartmonl of Commandant 2100 Second Street sw Stop 7245 United WashingtOn DC 20593 Homeland security States Coast Guard
StaffSymbolCG-823
United Statas Phone (202) 372-3S33 F (202)372-2311
Coast Guard
7501
AUG 3 1 2012
Reply to Audit Manager Attn of Mark Kulwicki
(202) 372-3533 To Anne L Richards
Assistant Inspector General for Audits
Subj DHS orG REPORT ON ANNUAL REVIEW OF THE UNITED STATES COAST GUARDS MISSION PERFORMANCE (FY 2011)
Ref (a) DHS orG Draft Report dated August 16 2012
I Thank you for the opportunity to review and comment on the Department of Homeland Security (DHS) Office of Inspector Generals Draft Report 12-028-AUD-USCG entitled Annual Review of the United States Coast Guards Mission Perfonnance (FY 2011)
2 The United States Coast Guard (USCG) appreciates the efforts of the orG to docwnent measures that we can take to enhance the programs overall effectiveness
3 The USCG recommends the following technical comments contained in the enclosure
4 If you have any questions my point of contact is Mr Mark Kulwicki who can be reached at (202) 372-3533
Enclosure (I) USCG technical comments
Copy Brooke Bebow Director Lisa Vonder Haar Audit Manager Stephen Doran Auditor Rkhard Joyce Program Analyst Marisa Coccaro Referencer
wwwoigdhsgov 9 OIG-12-119
OFFICE OF INSPECTOR GENERAL Department of Homeland Security
Appendix C Non-Homeland Security Missions
The FY 2011 non-homeland security mission resource hours totaled 328008 and decreased by approximately 7 percent from FY 2010 However the FY 2011 level remains at approximately 10 percent above baseline levels The following graph illustrates the trend in non-homeland security mission resource hours since 2006 compared with the baseline period
Non-Homeland Security Resource Hours
0
50000
100000
150000
200000
250000
300000
350000
Reso
urce
Hou
rs
2007
2006
Baseline
2011
2010
2009
2008
Fiscal Year Source DHS-OIG based on USCG-provided data
In FY 2011 the USCG reported that it met or exceeded 9 of 12 summary performance measures for its 6 non-homeland security missions compared with meeting 7 of 10 summary performance measures in FY 2010 The resource hours and summary performance measures and results for each non-homeland security mission are discussed below
Living Marine Resources
Living marine resources law enforcement is an obligation under the Magnuson-Stevens Fishery Conservation and Management Act the Endangered Species Act and several other laws for the protection of marine resources Its core responsibility is to provide effective and professional enforcement to advance national goals for the conservation management and recovery of living marine resources marine protected species and
wwwoigdhsgov 10 OIG-12-119
Living Marine Resources Performance Measure ndash Fishing Regulation Compliance Rate
FY 2006 Actual
FY 2007 Actual
FY 2008 Actual
FY 2009 Actual
FY 2010 Actual
FY 2011 Target
FY 2011 Actual
966 962 953 968 972 96 974 X
Not Met X
Not Met X
Not Met X
Not Met
Met
Met
Source DHS-OIG based on USCG-provided data
OFFICE OF INSPECTOR GENERAL Department of Homeland Security
national marine sanctuaries and monuments This includes enforcement of living marine resource regulations and other activities that strengthen both domestic and international living marine resources regimes
Resource Hours FY 2011 resource hours for living marine resources totaled 93616 This is an increase of 02 percent from FY 2010 and is higher than the baseline by 26 percent
Source DHS-OIG based on USCG-provided data
Performance Measures and Results The USCG uses the percentage of fishing vessels observed at-sea complying with domestic regulations as a measure of its effect on enforcement of US fisheries and protected species regulations The measure reflects the percentage of USCG boardings at-sea where no significant violations of domestic living marine resource regulations were detected As shown in the chart below the USCG reported that it met its single living marine resources performance measure in FY 2011
wwwoigdhsgov 11 OIG-12-119
OFFICE OF INSPECTOR GENERAL Department of Homeland Security
Marine Safety
The focus of the USCGrsquos marine safety mission is the prevention of deaths injuries and property loss Marine safety responsibilities include ensuring the safe and environmentally sound operation of millions of recreational vessels and thousands of US flagged commercial vessels The USCG develops and enforces Federal marine safety regulations certifies and provides credentials to over 218000 mariners investigates commercial marine casualties and shares its findings and conducts compulsory inspections as well as voluntary safety exams
Resource Hours The USCG did not report hours for this mission prior to 2005 FY 2011 resource hours for marine safety totaled 64210 and increased by approximately 91 percent from FY 2010
Source DHS-OIG based on USCG-provided data
Performance Measures and Results The USCG reported that it met three of four summary performance measures related to marine safety in FY 2011 Federal regulations require the person in charge of commercial US flagged vessels to notify the USCG of any loss of life or injury requiring professional medical treatment beyond first aid The USCG uses deaths and injuries as a measure of commercial mariner and passenger safety and the five-year average number of deaths and injuries as an indicator of long-term performance trends In FY 2011 the USCG met its target for commercial mariner deaths and injuries but missed the target for passenger deaths and injuries as shown below
wwwoigdhsgov 12 OIG-12-119
Marine Safety Performance Measure ndash Five-Year Average Number of Commercial
Mariner Deaths and Injuries
FY 2006 Actual
FY 2007 Actual
FY 2008 Actual
FY 2009 Actual
FY 2010 Actual
FY 2011 Target
FY 2011 Actual
502 526 496 498 474 lt475 431
NA NA Met Met Met Met
Source DHS-OIG based on USCG-provided data
Marine Safety Performance Measure ndash Five-Year Average Number of
Recreational Boating Deaths and Injuries FY 2006 FY 2007 FY 2008 FY 2009 FY 2010 FY 2011 FY 2011 Actual Actual Actual Actual Actual Target Actual 4366 4249 4147 4150 4091 lt4115 3904
NA NA Met Met Met Met
OFFICE OF INSPECTOR GENERAL Department of Homeland Security
Marine Safety Performance Measure ndash Five-Year Average Number of
Commercial Passenger Deaths and Injuries FY 2006 FY 2007 FY 2008 FY 2009 FY 2010 FY 2011 FY 2011 Actual Actual Actual Actual Actual Target Actual
216 238 252 238 250 lt223 232
NA NA X X X
Not Met Met Not Met Not Met Source DHS-OIG based on USCG-provided data
Federal regulations also require operators or owners of recreational vessels to file a boating accident report when a person dies or disappears from the vessel under certain circumstances The USCG uses deaths and injuries as a measure of marine safety for the recreational boating segment of the American maritime community and a five-year average of these as an indicator of long-term performance trends The USCG reported that it met its target for this measure in FY 2011
Source DHS-OIG based on USCG-provided data
In FY 2011 the USCG added a new long-term performance measure for the five-year average number of commercial and recreational deaths and injuries The target for this measure was met
wwwoigdhsgov 13 OIG-12-119
OFFICE OF INSPECTOR GENERAL Department of Homeland Security
Marine Safety Performance Measure ndash Five-Year Average Number of
Commercial and Recreational Deaths And Injuries FY 2006 FY 2007 FY 2008 FY 2009 FY 2010 FY 2011 FY 2011 Actual Actual Actual Actual Actual Target Actual
NA NA NA NA NA lt4813 4567
NA NA NA NA NA Met
Source DHS-OIG based on USCG-provided data
Marine Environmental Protection
The marine environmental protection mission focuses on minimizing oil and hazardous substance effect on human health the environment and the marine transportation system The USCG regulates the handling of oil hazardous substances and other shipboard wastes to prevent their discharge into US or international waterways stop unauthorized ocean dumping reduce ship-based air emissions and avert the introduction of invasive species The USCG is the lead Federal agency for directing the removal and mitigation of oil spills from the waters and adjoining shorelines of the coastal zone
Resource Hours Marine environmental protection resource hours totaled 4682 in FY 2011 This represents a decrease of 839 percent from FY 2010 and is attributable to the reduction of resource hours necessary for the Deepwater Horizon oil spill in the Gulf of Mexico
Source DHS-OIG based on USCG-provided data
wwwoigdhsgov 14 OIG-12-119
Marine Environmental Protection Performance Measure Average Number of Oil Spills in the Maritime Environment
FY 2006 FY 2007 FY 2008 FY 2009 FY 2010 FY 2011 FY 2011 Actual Actual Actual Actual Actual Target Actual 143 139 132 123 115 lt116 102
NA NA Met Met Met Met
Source DHS-OIG based on USCG-provided data
OFFICE OF INSPECTOR GENERAL Department of Homeland Security
Performance Measures and Results Federal regulation requires vessel or facility operators to report the discharge of any hazardous substance that equals or exceeds reportable quantities and requires the reporting of any discharge of oil or oil products that cause a sheen discoloration sludge or emulsion on or below the surface of any navigable waterway of the United States The USCG uses the number of chemical discharge incidents and the number of oil spills greater than 100 gallons as proxy indicators of marine environmental protection and normalizes five-year averages of these as indicators of long-term trends In FY 2011 the USCG reported that it met the target for ldquoAverage Number of Chemical Discharge Incidents in the Maritime Environmentrdquo which was previously reported as ldquo5-Yr Average Chemical Discharge Incidents per 100 Million Short Tons Shippedrdquo
Marine Environmental Protection Performance Measure ndash Average Number of Chemical Discharge
Incidents in the Maritime Environment FY
2006 Actual
FY 2007
Actual
FY 2008
Actual
FY 2009
Actual
FY 2010
Actual
FY FY 2011 2011
Target Actual 278 244 198 187 181 lt220 150
NA NA Met Met Met Met
Source DHS-OIG based on USCG-provided data
USCG also reported that it met the target for ldquoAverage Number of Oil Spills in the Maritime Environmentrdquo which was previously reported as ldquo5-Yr Average Oil Spills gt 100 Gallons per 100 Million Short Tons Shippedrdquo
Search and Rescue
USCG strives to minimize lives lost injury and property loss or damage by rendering aid to those in distress in the maritime environment and elsewhere as called upon The search and rescue mission is accomplished through resource readiness distress monitoring and communication search planning on-scene operations and domestic and international partnerships
wwwoigdhsgov 15 OIG-12-119
OFFICE OF INSPECTOR GENERAL Department of Homeland Security
Resource Hours Search and rescue is a demand-driven mission Requirements for search and rescue increase or decrease relative to the number of people requiring the USCGrsquos assistance Resource hours in FY 2011 totaled 55934 and decreased approximately 13 percent from FY 2010
Source DHS-OIG based on USCG-provided data
0 10000 20000 30000 40000 50000 60000 70000 80000 90000
Baseline
2006
2007
2008
2009
2010
2011 Re
sour
ce H
ours
Search and Rescue Resource Hours
Fiscal Year
Performance Measures and Results USCG met the FY 2011 target for percent of people in imminent danger saved in the maritime environment was not met Though this yearrsquos performance is below the overall target it is more than the 744 percent level posted in FY 2010 In FY 2011 the USCG saved 3804 lives in 20510 cases with 732 lives lost and 390 lives unaccounted for This total excluded outlier cases with more than 10 lives at risk Other than raw numbers of lives saved and lost there is no clear indication of the drivers that led to this decrease The USCG is conducting further analysis is in progress to identify any systemic issues Additionally uncontrollable variables such as weather location incident severity and life saving devices on board continue to influence the number and outcome of search and rescue incidents
Search and Rescue Performance Measure ndash Percent of People in Imminent Danger Saved
in the Maritime Environment FY FY FY FY FY FY FY
2006 2007 2008 2009 2010 2011 2011 Actual Actual Actual Actual Actual Target Actual
76 766 768 773 744 100 773 X X
Met Met Met Met Not Met Not Met Source DHS-OIG based on USCG-provided data
wwwoigdhsgov 16 OIG-12-119
Search and Rescue Performance Measure ndash Percent of Time Rescue Assets are On-Scene
within 2 Hours FY
2006 FY
2007 FY
2008 FY
2009 FY
2010 FY
2011 FY
2011 Actual Actual Actual Actual Actual Target Actual 937 943 933 940 933 100 931
Met Met Met Met Met X
Not Met Source DHS-OIG based on USCG-provided data
OFFICE OF INSPECTOR GENERAL Department of Homeland Security
The FY 2011 target for percent of time rescue assets are on-scene within 2 hours was not met However overall performance is in line with the USCGrsquos expectations based on placement of resources and proximity to shore of the majority of search and rescue incidents and shows consistent performance over the last six years This measure has been adjusted to exclude cases in which an operational decision was made to delay a response Certain determining factors such as weather resource availability and risk assessment delay response time
Aids-to-Navigation
USCG minimizes disruptions to maritime commerce by assessing and mitigating risks to safe navigation It provides and maintains more than 51000 buoys beacons lights and other aids to mark channels and denote hazards
Resource Hours FY 2011 resource hours totaled 98819 and increased approximately 37 percent from FY 2010 This is an approximately 12 percent decrease from the baseline level
wwwoigdhsgov 17 OIG-12-119
Aids-to-Navigation Performance Measure ndash Availability of Maritime Navigation Aids
FY 2006 FY 2007 FY 2008 FY 2009 FY 2010 FY 2011 FY 2011 Actual Actual Actual Actual Actual Target Actual 968 980 983 980 985 975 985
X Not Met Met Met Met Met Met
Source DHS-OIG based on USCG-provided data
Aids-to-Navigation Performance Measure ndash Average Number of Navigational Accidents
FY 2006 FY 2007 FY 2008 FY 2009 FY 2010 FY 2011 FY 2011 Actual Actual Actual Actual Actual Target Actual 1765 1823 1857 1878 1878 1945
X Not Met
X Not Met
X Not Met
X Not Met
X Not Met Met
Source DHS-OIG based on USCG-provided data
OFFICE OF INSPECTOR GENERAL Department of Homeland Security
Source DHS-OIG based on USCG-provided data
Performance Measures and Results The USCG reported that it met its FY 2011 target for the availability of maritime navigation aids for the fifth consecutive year
In FY 2011 the USCG reported that it met its target for the average number of navigational accidents This is the first time this measure was met in the past six years
wwwoigdhsgov 18 OIG-12-119
Ice Operations Performance Measure ndash Number of Days Critical Waterways Are Closed to
Commerce Due to Ice FY 2006 FY 2007 FY 2008 FY 2009 FY 2010 FY 2011 FY 2011 Actual Actual Actual Actual Actual Target Actual
0 0 0 0 6 2 avg amp 8 severe
0
Met Met Met Met X
Not Met Met Source DHS-OIG based on USCG-provided data
OFFICE OF INSPECTOR GENERAL Department of Homeland Security
Ice Operations
This mission supports winter commerce and prevents and responds to ice that causes flooding These activities are essential to winter and spring commerce and the safety of waterside communities on the Great Lakes in New England and on the Hudson River and occasionally in the mid-Atlantic
Resource Hours In FY 2011 resource hours totaled 10747 and decreased approximately 77 percent from FY 2010 which is approximately 10 percent lower than the baseline level
Source DHS-OIG based on USCG-provided data
Performance Measures and Results The USCG reported that it met its FY 2011 target for the number of days critical waterways are closed to commerce due to ice Domestic icebreakers on the Great Lakes assisted over 1700 commercial vessel transits carrying $300 million in bulk commodities Favorable environmental conditions continued partnership with the Canadian Coast Guard and effective employment of domestic icebreaking assets contributed to achieving the performance target
wwwoigdhsgov 19 OIG-12-119
OFFICE OF INSPECTOR GENERAL Department of Homeland Security
Appendix D Homeland Security Missions
The FY 2011 homeland security mission resource hours totaled 355586 and decreased by approximately 05 percent from FY 2010 Between FY 2006 and FY 2011 total resource hours for homeland security missions were the highest in FY 2007 However the FY 2011 level remains at approximately 91 percent above baseline levels as depicted in the following graph
Source DHS-OIG based on USCG-provided data
In FY 2011 the USCG reported that it met or exceeded 5 of 11 summary performance measures for its 5 homeland security missions compared with meeting 2 of 5 summary performance measures in FY 2010 The resource hours and performance measures and results for each non-homeland security mission are summarized below
Ports Waterways and Coastal Security
The ports waterways and coastal security mission aims to deny terrorists the use and exploitation of the maritime domain and marine transportation system as a means for attacks on US territory population centers vessels and maritime critical infrastructure and key resources This mission includes preparedness planning and exercises antiterrorism and counterterrorism activities and initial recovery efforts if attacks are successful
wwwoigdhsgov 20 OIG-12-119
OFFICE OF INSPECTOR GENERAL Department of Homeland Security
Resource Hours In FY 2011 resource hours for ports waterways and coastal security totaled 155969 which is a decrease of 09 percent from FY 2010
Source DHS-OIG based on USCG-provided data
Performance Measures and Results USCG reported that it met three of its six FY 2011 targets for ports waterways and coastal security In FY 2011 the USCG added two new summary measures related to compliance with security regulations and significantly updated the methodology for the FY 2010 summary measure Percent Reduction in Maritime Terrorism Risk over which the USCG has Influence resulting in four maritime security risk measures as shown in the following charts The USCG improved and created a new baseline for the maritime security risk measures in FY 2010 thus FY 2011 results should not be compared to previous years
The revised maritime security risk measures are risk-based outcome measures that begin with an assessment of likely high-consequence maritime terrorist attack scenarios Threat vulnerability and consequence levels are estimated for each scenario which generates a proxy (index) value of raw risk that exists in the maritime domain Next the USCG interventions (security and response operations regime and awareness activities) for the fiscal year are scored against the scenarios with regard to the decreases in threat vulnerability and consequence that each has been estimated to have afforded The resulting measures are proxy measures of performance
As depicted below the USCG reported that it met its FY 2011 target for ldquoPercent Reduction of all Maritime Security Risk Subject to USCG Influencerdquo
wwwoigdhsgov 21 OIG-12-119
Ports Waterways and Coastal Security Performance Measure ndash Percent Reduction of all Maritime Security Risk
Subject to USCG Influence
FY 2006 Actual
FY 2007 Actual
FY 2008 Actual
FY 2009 Actual
FY 2010 Actual
FY 2011 Target
FY 2011 Actual
NA NA NA NA NA 44 44
Met Met Met Met Met Met Source DHS-OIG based on USCG-provided data
OFFICE OF INSPECTOR GENERAL Department of Homeland Security
USCG exceeded its FY 2011 target for Percent Reduction of all Maritime Security Risk Resulting from USCG Consequence Management
Ports Waterways and Coastal Security Performance Measure ndash Percent Reduction of Maritime Security Risk
Resulting from US Coast Guard Consequence Management
FY 2006 Actual
FY 2007 Actual
FY 2008 Actual
FY 2009 Actual
FY 2010 Actual
FY 2011 Target
FY 2011 Actual
NA NA NA NA NA 3 4
Met Met Met Met Met Met Source DHS-OIG based on USCG-provided data
USCG did not meet its target for ldquoPercent Reduction of Maritime Security Risk Resulting from USCG Efforts to Prevent a Terrorist Entering the US via Maritime Meansrdquo This is attributable to lower effectiveness judgments for the Maritime Security Response Team due to the loss of dedicated airlift and the suspension of hook-and-climb training Additionally major cutter capacity decreased due to the decommissioning of one High Endurance Cutter and an overall reduction of major cutter resource hours
Ports Waterways and Coastal Security Performance Measure ndash Percent Reduction of Maritime Security Risk
Resulting from USCG Efforts to Prevent a Terrorist Entering the US via Maritime Means
FY 2006 Actual
FY 2007 Actual
FY 2008 Actual
FY 2009 Actual
FY 2010 Actual
FY 2011 Target
FY 2011 Actual
NA NA NA NA NA 52 43
Met Met Met Met Met Not Met Source DHS-OIG based on USCG-provided data
USCG missed its target for ldquoPercent Reduction of Maritime Security Risk Resulting from USCG Efforts to Prevent a Weapon of Mass Destruction from Entering the United States
wwwoigdhsgov 22 OIG-12-119
Ports Waterways and Coastal Security Performance Measure ndash Percent Reduction of Maritime Security Risk
Resulting from USCG Efforts to Prevent a Weapon of Mass Destruction from Entering the US via Maritime Means
FY 2006 Actual
FY 2007 Actual
FY 2008 Actual
FY 2009 Actual
FY 2010 Actual
FY 2011 Target
FY 2011 Actual
NA NA NA NA NA 29 28
Met Met Met Met Met Not Met
Ports Waterways and Coastal Security Performance Measure ndash Annual Maritime Transportation Security Act Facility
Compliance Rate with Transportation Worker Identification Credential Regulations
FY 2006 Actual
FY 2007 Actual
FY 2008 Actual
FY 2009 Actual
FY 2010 Actual
FY 2011 Target
FY 2011 Actual
NA NA NA NA 100 85 99
NA NA NA NA Met Met
Source DHS-OIG based on USCG-provided data
OFFICE OF INSPECTOR GENERAL Department of Homeland Security
via Maritime Meansrdquo by one percentage point This is attributable to lower effectiveness judgments for the Maritime Security Response Team due to loss of dedicated airlift and the challenges of identifying a broad range of Weapons of Mass Destruction amongst the volume of legitimate shipping cargo Additionally major cutter capacity decreased due to the decommissioning of one High Endurance Cutter and an overall reduction of major cutter resource hours
Source DHS-OIG based on USCG-provided data
USCG exceeded its FY 2011 target for ldquoAnnual Maritime Transportation Security Act Facility Compliance Rate with Transportation Worker Identification Credential Regulationsrdquo
USCG missed its target for ldquoPercent of Maritime Facilities in Compliance with Security Regulationsrdquo by only one-tenth of one percent The USCG has focused the use of its personnel resources to conduct Maritime Transportation Security Act compliance exams at waterfront facilities that are at higher risk for a transportation security incident By increasing partnerships with these facilities 999 percent of regulated facilities did not have serious deficiencies warranting a notice of violation or civil penalty in FY 2011
wwwoigdhsgov 23 OIG-12-119
Ports Waterways and Coastal Security Performance Measure ndash Percent Of Maritime Facilities in Compliance with
Security Regulations
FY 2006 Actual
FY 2007 Actual
FY 2008 Actual
FY 2009 Actual
FY 2010 Actual
FY 2011 Target
FY 2011 Actual
NA NA NA NA NA 100 999
NA NA NA NA NA Not Met
Source DHS-OIG based on USCG-provided data
OFFICE OF INSPECTOR GENERAL Department of Homeland Security
Drug Interdiction
USCGrsquos drug interdiction efforts support national strategies to disrupt the market for illegal drugs and prevent transnational threats from reaching the United States The USCG is the lead Federal agency for drug interdiction on the high seas and shares the lead for drug interdiction in the territorial seas of the US with Customs and Border Protection The USCG coordinates with its interagency partners to deter illicit drug trafficking including the Department of Defense Department of Justice Department of State and other components within DHS
Resource Hours FY 2011 resource hours totaled 73401 and increased by approximately 9 percent from FY 2010 but are about 40 percent below baseline levels
Source DHS-OIG based on USCG-provided data
Performance Measures and Results The USCG uses the interagency Consolidated Counter Drug Database as its main source for tracking cocaine movement estimates
wwwoigdhsgov 24 OIG-12-119
Drug Interdiction Performance Measure ndash Removal Rate for Cocaine from Non-commercial
Vessels in Maritime Transit Zone FY 2006 FY 2007 FY 2008 FY 2009 FY 2010 FY 2011 FY 2011 Actual Actual Actual Actual Actual Target Actual
NA NA NA 150 135 155 116
NA NA NA X
Not Met X
Not Met X
Not Met Source DHS-OIG based on USCG-provided data
OFFICE OF INSPECTOR GENERAL Department of Homeland Security
The one performance measure related to Drug Interdiction ldquoRemoval Rate for Cocaine from Non-commercial Vessels in Maritime Transit Zonerdquo was not met in FY 2011 According to the USCG the reasons for not meeting this target can be attributed to reduced asset and resource availability smaller average load sizes of cocaine and increasingly sophisticated criminal organizations
Migrant Interdiction
USCG migrant interdiction policy and operations are designed to provide effective law enforcement presence at sea and achieve three main objectives (1) deter undocumented migrants and transnational human smugglers from using maritime routes to enter the US (2) detect and interdict undocumented migrants and human smugglers far from the US border and (3) expand USCG participation in multi-agency and bi-national border security initiatives While the USCG leads the interdiction mission on the high seas it partners with Customs and Border Protection and Immigration and Customs Enforcement for shore-side interdiction operations
Resource Hours Migrant interdiction resource hours remain approximately 144 percent above baseline levels In FY 2011 resource hours totaled 72213 and decreased approximately 60 percent from FY 2010 to FY 2011
wwwoigdhsgov 25 OIG-12-119
Migrant Interdiction Performance Measure ndash Percentage of Undocumented Migrants who
Attempt to Enter the United States Via Maritime Routes that are Interdicted
FY 2006 Actual
FY 2007 Actual
FY 2008 Actual
FY 2009 Actual
FY 2010 Actual
FY 2011 Target
FY 2011 Actual
NA 652 627 844 645 739 728
NA Not Met Not Met Met Not Met Not Met
OFFICE OF INSPECTOR GENERAL Department of Homeland Security
Source DHS-OIG based on USCG-provided data
Performance Measures and Results According to the USCG the number of undocumented migrants attempting to enter the US remained low in FY 2011 compared to numbers observed over the last decade due in part to a slumping US economy successful prosecution of smugglers effective bilateral cooperation and use of biometrics The USCG reported that it met one of its two performance measures related to migrant interdiction in FY 2011 Although the USCG did not meet the target for ldquoPercentage of Undocumented Migrants who Attempt to Enter the United States via Maritime Routes that are Interdictedrdquo the actual result of 728 percent was an improvement over FY 2010rsquos 645 percent This measure includes migrants who are interdicted by foreign counterparts of the USCG many of whom have fewer resources than the USCG
Source DHS-OIG based on USCG-provided data
As shown in the table below the USCG exceeded its target for the ldquoPercent of Undocumented Migrants who Attempt to Enter the United States via Maritime Routes Interdicted by the Coast Guardrdquo
wwwoigdhsgov 26 OIG-12-119
Migrant Interdiction Performance Measure ndash Percent of Undocumented Migrants who Attempt to Enter the United States via Maritime Routes Interdicted by the Coast Guard
FY 2006 Actual
FY 2007 Actual
FY 2008 Actual
FY 2009 Actual
FY 2010 Actual
FY 2011 Target
FY 2011 Actual
NA 421 469 375 447 430 517
NA NA Not Met Not Met Met Met
Source DHS-OIG based on USCG-provided data
OFFICE OF INSPECTOR GENERAL Department of Homeland Security
Defense Readiness
The USCG maintains a level of readiness and training that allows for the immediate integration with Department of Defense forces for peacetime operations or during times of war This supports US national interests abroad as well as facilitating support to DHS for the integration of Homeland Defense and Homeland Security
Resource Hours In FY 2011 resource hours for Defense Readiness totaled 41424 and were still above the baseline although resource hours decreased by 119 percent from FY 2010 to FY 2011
Source DHS-OIG based on USCG-provided data
Performance Measures and Results The USCG did not meet its overall target of 381 percent defense readiness for the year The declining readiness of the USCGrsquos High Endurance Cutter fleet continues to present significant challenges to mission
wwwoigdhsgov 27 OIG-12-119
Defense Readiness Performance Measure ndash Defense Readiness Assessment of all USCG High-
Endurance Cutters Patrol Boats and Port Security Units
FY 2006 Actual
FY 2007 Actual
FY 2008 Actual
FY 2009 Actual
FY 2010 Actual
FY 2011 Target
FY 2011 Actual
NA NA NA NA 241 381 251
NA NA NA NA Not Met Not Met
Source DHS-OIG based on USCG-provided data
OFFICE OF INSPECTOR GENERAL Department of Homeland Security
performance High Endurance Cutter readiness is being addressed by the USCGrsquos acquisition of the National Security Cutter
Other Law Enforcement
The other law enforcement mission orchestrates the enforcement of regulations on foreign fishing vessels This enforcement takes two forms the first is the deterrence detection and interdiction of illegal incursions into the US exclusive economic zone by foreign fishing vessels 1 The protection of the US exclusive economic zone from incursions by foreign fishing vessels contributes to a fundamental USCG maritime security objective to protect our Nationrsquos renewable natural resources The second part of the other law enforcement mission is to ensure compliance with international agreements for the management of living marine resources This is primarily accomplished through enforcement on foreign fishing vessels of conservation and management measures created by regional fishery management organizations
Resource Hours In FY 2011 resource hours for the other law enforcement mission totaled 12579 which is an increase of 445 percent from FY 2010 According to the USCG this increase in resource hours was due to increased patrols for illegal unregulated and unreported fishing activity
1 The exclusive economic zone is the zone where the US and other coastal nations have jurisdiction over economic and resource management The exclusive economic zone includes waters three to 200 miles offshore (or nine to 200 miles offshore in western Florida and Texas)
wwwoigdhsgov 28 OIG-12-119
OFFICE OF INSPECTOR GENERAL Department of Homeland Security
Source DHS-OIG based on USCG-provided data
Performance Measures and Results The USCG uses the number of detected incursions into the US Exclusive Economic Zone by foreign fishing vessels as a measure of its performance In FY 2011 there were 122 detected incursions of foreign fishing vessels into the US Exclusive Economic Zone which met the performance target of fewer than 180 incursions
Other Law Enforcement Performance Measure ndash Number of Detected Incursions of Foreign Fishing
Vessels violating US Waters
FY 2006 Actual
FY 2007 Actual
FY 2008 Actual
FY 2009 Actual
FY 2010 Actual
FY 2011 Target
FY 2011 Actual
164 126 81 112 82 lt180 122
Met Met Met Met Met Met Source DHS-OIG based on USCG-provided data
wwwoigdhsgov 29 OIG-12-119
Mission Measure Met Not Met
Non-Homeland Security Missions
Search and Rescue Percentage of People in Imminent Danger Saved in the Maritime Environment
X
Percent of Time Rescue Assets are On-Scene within 2 Hours X
Aids-to-Navigation Availability of Maritime Navigation Aids X Average Number of Navigational Accidents X
Ice Operations Number of Days Critical Waterways Are Closed to Commerce Due to Ice X Living Marine Resources Fishing Regulation Compliance Rate X
Marine Safety
5-Yr Average Number of Commercial and Recreational Deaths and Injuries
X
5-Yr Average Number of Commercial Mariner Deaths and Injuries X
5-Yr Average Number of Commercial Passenger Deaths and Injuries X
5-Yr Average Number of Recreational Boating Deaths and Injuries X
Marine Environmental Protection
Average Number of Chemical Discharge Incidents in the Maritime Environment
X
Average Number of Oil Spills in the Maritime Environment X Total Non-Homeland Security Performance Measures 9 3
Homeland Security Missions
Ports Waterways and Coastal Security
Percentage Reduction of all Maritime Security Risk Subject to USCG Influence
X
Percent Reduction of Maritime Security Risk Resulting from USCG Consequence Management
X
Percent Reduction of Maritime Security Risk Resulting from USCG Efforts to Prevent a Terrorist Entering the US via Maritime Means
X
Percent Reduction of Maritime Security Risk Resulting from USCG Efforts to Prevent a Weapon of Mass Destruction from Entering the US via Maritime Means
X
Annual MTSA Facility Compliance Rate with Transportation Worker Identification Credential Regulations
X
Percent of Maritime Facilities In Compliance with Security Regulations X
Drug Interdiction Removal Rate for Cocaine from Non-commercial Vessels in Maritime Transit Zone
X
Migrant Interdiction
Percentage of Undocumented Migrants who Attempt to Enter the United States Via Maritime Routes that are Interdicted
X
Percent of Undocumented Migrants who Attempt to Enter the US by Maritime Routes Interdicted by the USCG
X
Defense Readiness Defense Readiness Assessment of all USCG High-Endurance Cutters Patrol Boats and Port Security Units
X
Other Law Enforcement Number of Detected Incursions of Foreign Fishing Vessels Violating US Waters
X
Total Homeland Security Performance Measures 5 6
Total USCG Performance Measures 14 9 Source DHS-OIG based on USCG-provided data
OFFICE OF INSPECTOR GENERAL Department of Homeland Security
Appendix E FY 2011 Performance Measure Summary
wwwoigdhsgov 30 OIG-12-119
OFFICE OF INSPECTOR GENERAL Department of Homeland Security
Appendix F Major Contributors to This Report
Brooke Bebow Director Lisa Vonder Haar Audit Manager Stephen Doran Auditor Richard Joyce Program Analyst Marisa Coccaro Referencer
wwwoigdhsgov 31 OIG-12-119
OFFICE OF INSPECTOR GENERAL Department of Homeland Security
Appendix G Report Distribution
Department of Homeland Security
Secretary Deputy Secretary Chief of Staff Deputy Chief of Staff General Counsel Executive Secretary Director GAOOIG Liaison Office Assistant Secretary for Office of Policy Assistant Secretary for Office of Public Affairs Assistant Secretary for Office of Legislative Affairs Acting Chief Privacy Officer
United States Coast Guard
Commandant Assistant Commandant for Resources and Chief Financial Officer USCG Audit Liaison
Office of Management and Budget
Chief Homeland Security Branch DHS OIG Budget Examiner
Congress
Congressional Oversight and Appropriations Committees as appropriate
wwwoigdhsgov 32 OIG-12-119
ADDITIONAL INFORMATION AND COPIES
To obtain additional copies of this document please call us at (202) 254-4100 fax your request to (202) 254-4305 or e-mail your request to our Office of Inspector General (OIG) Office of Public Affairs at DHS-OIGOfficePublicAffairsoigdhsgov
For additional information visit our website at wwwoigdhsgov or follow us on Twitter at dhsoig
OIG HOTLINE
To expedite the reporting of alleged fraud waste abuse or mismanagement or any other kinds of criminal or noncriminal misconduct relative to Department of Homeland Security (DHS) programs and operations please visit our website at wwwoigdhsgov and click on the red tab titled Hotline to report You will be directed to complete and submit an automated DHS OIG Investigative Referral Submission Form Submission through our website ensures that your complaint will be promptly received and reviewed by DHS OIG
Should you be unable to access our website you may submit your complaint in writing to DHS Office of Inspector General Attention Office of Investigations Hotline 245 Murray Drive SW Building 410Mail Stop 2600 Washington DC 20528 or you may call 1 (800) 323-8603 or fax it directly to us at (202) 254-4297
The OIG seeks to protect the identity of each writer and caller

OFFICE OF INSPECTOR GENERAL Department of Homeland Security
Appendix C Non-Homeland Security Missions
The FY 2011 non-homeland security mission resource hours totaled 328008 and decreased by approximately 7 percent from FY 2010 However the FY 2011 level remains at approximately 10 percent above baseline levels The following graph illustrates the trend in non-homeland security mission resource hours since 2006 compared with the baseline period
Non-Homeland Security Resource Hours
0
50000
100000
150000
200000
250000
300000
350000
Reso
urce
Hou
rs
2007
2006
Baseline
2011
2010
2009
2008
Fiscal Year Source DHS-OIG based on USCG-provided data
In FY 2011 the USCG reported that it met or exceeded 9 of 12 summary performance measures for its 6 non-homeland security missions compared with meeting 7 of 10 summary performance measures in FY 2010 The resource hours and summary performance measures and results for each non-homeland security mission are discussed below
Living Marine Resources
Living marine resources law enforcement is an obligation under the Magnuson-Stevens Fishery Conservation and Management Act the Endangered Species Act and several other laws for the protection of marine resources Its core responsibility is to provide effective and professional enforcement to advance national goals for the conservation management and recovery of living marine resources marine protected species and
wwwoigdhsgov 10 OIG-12-119
Living Marine Resources Performance Measure ndash Fishing Regulation Compliance Rate
FY 2006 Actual
FY 2007 Actual
FY 2008 Actual
FY 2009 Actual
FY 2010 Actual
FY 2011 Target
FY 2011 Actual
966 962 953 968 972 96 974 X
Not Met X
Not Met X
Not Met X
Not Met
Met
Met
Source DHS-OIG based on USCG-provided data
OFFICE OF INSPECTOR GENERAL Department of Homeland Security
national marine sanctuaries and monuments This includes enforcement of living marine resource regulations and other activities that strengthen both domestic and international living marine resources regimes
Resource Hours FY 2011 resource hours for living marine resources totaled 93616 This is an increase of 02 percent from FY 2010 and is higher than the baseline by 26 percent
Source DHS-OIG based on USCG-provided data
Performance Measures and Results The USCG uses the percentage of fishing vessels observed at-sea complying with domestic regulations as a measure of its effect on enforcement of US fisheries and protected species regulations The measure reflects the percentage of USCG boardings at-sea where no significant violations of domestic living marine resource regulations were detected As shown in the chart below the USCG reported that it met its single living marine resources performance measure in FY 2011
wwwoigdhsgov 11 OIG-12-119
OFFICE OF INSPECTOR GENERAL Department of Homeland Security
Marine Safety
The focus of the USCGrsquos marine safety mission is the prevention of deaths injuries and property loss Marine safety responsibilities include ensuring the safe and environmentally sound operation of millions of recreational vessels and thousands of US flagged commercial vessels The USCG develops and enforces Federal marine safety regulations certifies and provides credentials to over 218000 mariners investigates commercial marine casualties and shares its findings and conducts compulsory inspections as well as voluntary safety exams
Resource Hours The USCG did not report hours for this mission prior to 2005 FY 2011 resource hours for marine safety totaled 64210 and increased by approximately 91 percent from FY 2010
Source DHS-OIG based on USCG-provided data
Performance Measures and Results The USCG reported that it met three of four summary performance measures related to marine safety in FY 2011 Federal regulations require the person in charge of commercial US flagged vessels to notify the USCG of any loss of life or injury requiring professional medical treatment beyond first aid The USCG uses deaths and injuries as a measure of commercial mariner and passenger safety and the five-year average number of deaths and injuries as an indicator of long-term performance trends In FY 2011 the USCG met its target for commercial mariner deaths and injuries but missed the target for passenger deaths and injuries as shown below
wwwoigdhsgov 12 OIG-12-119
Marine Safety Performance Measure ndash Five-Year Average Number of Commercial
Mariner Deaths and Injuries
FY 2006 Actual
FY 2007 Actual
FY 2008 Actual
FY 2009 Actual
FY 2010 Actual
FY 2011 Target
FY 2011 Actual
502 526 496 498 474 lt475 431
NA NA Met Met Met Met
Source DHS-OIG based on USCG-provided data
Marine Safety Performance Measure ndash Five-Year Average Number of
Recreational Boating Deaths and Injuries FY 2006 FY 2007 FY 2008 FY 2009 FY 2010 FY 2011 FY 2011 Actual Actual Actual Actual Actual Target Actual 4366 4249 4147 4150 4091 lt4115 3904
NA NA Met Met Met Met
OFFICE OF INSPECTOR GENERAL Department of Homeland Security
Marine Safety Performance Measure ndash Five-Year Average Number of
Commercial Passenger Deaths and Injuries FY 2006 FY 2007 FY 2008 FY 2009 FY 2010 FY 2011 FY 2011 Actual Actual Actual Actual Actual Target Actual
216 238 252 238 250 lt223 232
NA NA X X X
Not Met Met Not Met Not Met Source DHS-OIG based on USCG-provided data
Federal regulations also require operators or owners of recreational vessels to file a boating accident report when a person dies or disappears from the vessel under certain circumstances The USCG uses deaths and injuries as a measure of marine safety for the recreational boating segment of the American maritime community and a five-year average of these as an indicator of long-term performance trends The USCG reported that it met its target for this measure in FY 2011
Source DHS-OIG based on USCG-provided data
In FY 2011 the USCG added a new long-term performance measure for the five-year average number of commercial and recreational deaths and injuries The target for this measure was met
wwwoigdhsgov 13 OIG-12-119
OFFICE OF INSPECTOR GENERAL Department of Homeland Security
Marine Safety Performance Measure ndash Five-Year Average Number of
Commercial and Recreational Deaths And Injuries FY 2006 FY 2007 FY 2008 FY 2009 FY 2010 FY 2011 FY 2011 Actual Actual Actual Actual Actual Target Actual
NA NA NA NA NA lt4813 4567
NA NA NA NA NA Met
Source DHS-OIG based on USCG-provided data
Marine Environmental Protection
The marine environmental protection mission focuses on minimizing oil and hazardous substance effect on human health the environment and the marine transportation system The USCG regulates the handling of oil hazardous substances and other shipboard wastes to prevent their discharge into US or international waterways stop unauthorized ocean dumping reduce ship-based air emissions and avert the introduction of invasive species The USCG is the lead Federal agency for directing the removal and mitigation of oil spills from the waters and adjoining shorelines of the coastal zone
Resource Hours Marine environmental protection resource hours totaled 4682 in FY 2011 This represents a decrease of 839 percent from FY 2010 and is attributable to the reduction of resource hours necessary for the Deepwater Horizon oil spill in the Gulf of Mexico
Source DHS-OIG based on USCG-provided data
wwwoigdhsgov 14 OIG-12-119
Marine Environmental Protection Performance Measure Average Number of Oil Spills in the Maritime Environment
FY 2006 FY 2007 FY 2008 FY 2009 FY 2010 FY 2011 FY 2011 Actual Actual Actual Actual Actual Target Actual 143 139 132 123 115 lt116 102
NA NA Met Met Met Met
Source DHS-OIG based on USCG-provided data
OFFICE OF INSPECTOR GENERAL Department of Homeland Security
Performance Measures and Results Federal regulation requires vessel or facility operators to report the discharge of any hazardous substance that equals or exceeds reportable quantities and requires the reporting of any discharge of oil or oil products that cause a sheen discoloration sludge or emulsion on or below the surface of any navigable waterway of the United States The USCG uses the number of chemical discharge incidents and the number of oil spills greater than 100 gallons as proxy indicators of marine environmental protection and normalizes five-year averages of these as indicators of long-term trends In FY 2011 the USCG reported that it met the target for ldquoAverage Number of Chemical Discharge Incidents in the Maritime Environmentrdquo which was previously reported as ldquo5-Yr Average Chemical Discharge Incidents per 100 Million Short Tons Shippedrdquo
Marine Environmental Protection Performance Measure ndash Average Number of Chemical Discharge
Incidents in the Maritime Environment FY
2006 Actual
FY 2007
Actual
FY 2008
Actual
FY 2009
Actual
FY 2010
Actual
FY FY 2011 2011
Target Actual 278 244 198 187 181 lt220 150
NA NA Met Met Met Met
Source DHS-OIG based on USCG-provided data
USCG also reported that it met the target for ldquoAverage Number of Oil Spills in the Maritime Environmentrdquo which was previously reported as ldquo5-Yr Average Oil Spills gt 100 Gallons per 100 Million Short Tons Shippedrdquo
Search and Rescue
USCG strives to minimize lives lost injury and property loss or damage by rendering aid to those in distress in the maritime environment and elsewhere as called upon The search and rescue mission is accomplished through resource readiness distress monitoring and communication search planning on-scene operations and domestic and international partnerships
wwwoigdhsgov 15 OIG-12-119
OFFICE OF INSPECTOR GENERAL Department of Homeland Security
Resource Hours Search and rescue is a demand-driven mission Requirements for search and rescue increase or decrease relative to the number of people requiring the USCGrsquos assistance Resource hours in FY 2011 totaled 55934 and decreased approximately 13 percent from FY 2010
Source DHS-OIG based on USCG-provided data
0 10000 20000 30000 40000 50000 60000 70000 80000 90000
Baseline
2006
2007
2008
2009
2010
2011 Re
sour
ce H
ours
Search and Rescue Resource Hours
Fiscal Year
Performance Measures and Results USCG met the FY 2011 target for percent of people in imminent danger saved in the maritime environment was not met Though this yearrsquos performance is below the overall target it is more than the 744 percent level posted in FY 2010 In FY 2011 the USCG saved 3804 lives in 20510 cases with 732 lives lost and 390 lives unaccounted for This total excluded outlier cases with more than 10 lives at risk Other than raw numbers of lives saved and lost there is no clear indication of the drivers that led to this decrease The USCG is conducting further analysis is in progress to identify any systemic issues Additionally uncontrollable variables such as weather location incident severity and life saving devices on board continue to influence the number and outcome of search and rescue incidents
Search and Rescue Performance Measure ndash Percent of People in Imminent Danger Saved
in the Maritime Environment FY FY FY FY FY FY FY
2006 2007 2008 2009 2010 2011 2011 Actual Actual Actual Actual Actual Target Actual
76 766 768 773 744 100 773 X X
Met Met Met Met Not Met Not Met Source DHS-OIG based on USCG-provided data
wwwoigdhsgov 16 OIG-12-119
Search and Rescue Performance Measure ndash Percent of Time Rescue Assets are On-Scene
within 2 Hours FY
2006 FY
2007 FY
2008 FY
2009 FY
2010 FY
2011 FY
2011 Actual Actual Actual Actual Actual Target Actual 937 943 933 940 933 100 931
Met Met Met Met Met X
Not Met Source DHS-OIG based on USCG-provided data
OFFICE OF INSPECTOR GENERAL Department of Homeland Security
The FY 2011 target for percent of time rescue assets are on-scene within 2 hours was not met However overall performance is in line with the USCGrsquos expectations based on placement of resources and proximity to shore of the majority of search and rescue incidents and shows consistent performance over the last six years This measure has been adjusted to exclude cases in which an operational decision was made to delay a response Certain determining factors such as weather resource availability and risk assessment delay response time
Aids-to-Navigation
USCG minimizes disruptions to maritime commerce by assessing and mitigating risks to safe navigation It provides and maintains more than 51000 buoys beacons lights and other aids to mark channels and denote hazards
Resource Hours FY 2011 resource hours totaled 98819 and increased approximately 37 percent from FY 2010 This is an approximately 12 percent decrease from the baseline level
wwwoigdhsgov 17 OIG-12-119
Aids-to-Navigation Performance Measure ndash Availability of Maritime Navigation Aids
FY 2006 FY 2007 FY 2008 FY 2009 FY 2010 FY 2011 FY 2011 Actual Actual Actual Actual Actual Target Actual 968 980 983 980 985 975 985
X Not Met Met Met Met Met Met
Source DHS-OIG based on USCG-provided data
Aids-to-Navigation Performance Measure ndash Average Number of Navigational Accidents
FY 2006 FY 2007 FY 2008 FY 2009 FY 2010 FY 2011 FY 2011 Actual Actual Actual Actual Actual Target Actual 1765 1823 1857 1878 1878 1945
X Not Met
X Not Met
X Not Met
X Not Met
X Not Met Met
Source DHS-OIG based on USCG-provided data
OFFICE OF INSPECTOR GENERAL Department of Homeland Security
Source DHS-OIG based on USCG-provided data
Performance Measures and Results The USCG reported that it met its FY 2011 target for the availability of maritime navigation aids for the fifth consecutive year
In FY 2011 the USCG reported that it met its target for the average number of navigational accidents This is the first time this measure was met in the past six years
wwwoigdhsgov 18 OIG-12-119
Ice Operations Performance Measure ndash Number of Days Critical Waterways Are Closed to
Commerce Due to Ice FY 2006 FY 2007 FY 2008 FY 2009 FY 2010 FY 2011 FY 2011 Actual Actual Actual Actual Actual Target Actual
0 0 0 0 6 2 avg amp 8 severe
0
Met Met Met Met X
Not Met Met Source DHS-OIG based on USCG-provided data
OFFICE OF INSPECTOR GENERAL Department of Homeland Security
Ice Operations
This mission supports winter commerce and prevents and responds to ice that causes flooding These activities are essential to winter and spring commerce and the safety of waterside communities on the Great Lakes in New England and on the Hudson River and occasionally in the mid-Atlantic
Resource Hours In FY 2011 resource hours totaled 10747 and decreased approximately 77 percent from FY 2010 which is approximately 10 percent lower than the baseline level
Source DHS-OIG based on USCG-provided data
Performance Measures and Results The USCG reported that it met its FY 2011 target for the number of days critical waterways are closed to commerce due to ice Domestic icebreakers on the Great Lakes assisted over 1700 commercial vessel transits carrying $300 million in bulk commodities Favorable environmental conditions continued partnership with the Canadian Coast Guard and effective employment of domestic icebreaking assets contributed to achieving the performance target
wwwoigdhsgov 19 OIG-12-119
OFFICE OF INSPECTOR GENERAL Department of Homeland Security
Appendix D Homeland Security Missions
The FY 2011 homeland security mission resource hours totaled 355586 and decreased by approximately 05 percent from FY 2010 Between FY 2006 and FY 2011 total resource hours for homeland security missions were the highest in FY 2007 However the FY 2011 level remains at approximately 91 percent above baseline levels as depicted in the following graph
Source DHS-OIG based on USCG-provided data
In FY 2011 the USCG reported that it met or exceeded 5 of 11 summary performance measures for its 5 homeland security missions compared with meeting 2 of 5 summary performance measures in FY 2010 The resource hours and performance measures and results for each non-homeland security mission are summarized below
Ports Waterways and Coastal Security
The ports waterways and coastal security mission aims to deny terrorists the use and exploitation of the maritime domain and marine transportation system as a means for attacks on US territory population centers vessels and maritime critical infrastructure and key resources This mission includes preparedness planning and exercises antiterrorism and counterterrorism activities and initial recovery efforts if attacks are successful
wwwoigdhsgov 20 OIG-12-119
OFFICE OF INSPECTOR GENERAL Department of Homeland Security
Resource Hours In FY 2011 resource hours for ports waterways and coastal security totaled 155969 which is a decrease of 09 percent from FY 2010
Source DHS-OIG based on USCG-provided data
Performance Measures and Results USCG reported that it met three of its six FY 2011 targets for ports waterways and coastal security In FY 2011 the USCG added two new summary measures related to compliance with security regulations and significantly updated the methodology for the FY 2010 summary measure Percent Reduction in Maritime Terrorism Risk over which the USCG has Influence resulting in four maritime security risk measures as shown in the following charts The USCG improved and created a new baseline for the maritime security risk measures in FY 2010 thus FY 2011 results should not be compared to previous years
The revised maritime security risk measures are risk-based outcome measures that begin with an assessment of likely high-consequence maritime terrorist attack scenarios Threat vulnerability and consequence levels are estimated for each scenario which generates a proxy (index) value of raw risk that exists in the maritime domain Next the USCG interventions (security and response operations regime and awareness activities) for the fiscal year are scored against the scenarios with regard to the decreases in threat vulnerability and consequence that each has been estimated to have afforded The resulting measures are proxy measures of performance
As depicted below the USCG reported that it met its FY 2011 target for ldquoPercent Reduction of all Maritime Security Risk Subject to USCG Influencerdquo
wwwoigdhsgov 21 OIG-12-119
Ports Waterways and Coastal Security Performance Measure ndash Percent Reduction of all Maritime Security Risk
Subject to USCG Influence
FY 2006 Actual
FY 2007 Actual
FY 2008 Actual
FY 2009 Actual
FY 2010 Actual
FY 2011 Target
FY 2011 Actual
NA NA NA NA NA 44 44
Met Met Met Met Met Met Source DHS-OIG based on USCG-provided data
OFFICE OF INSPECTOR GENERAL Department of Homeland Security
USCG exceeded its FY 2011 target for Percent Reduction of all Maritime Security Risk Resulting from USCG Consequence Management
Ports Waterways and Coastal Security Performance Measure ndash Percent Reduction of Maritime Security Risk
Resulting from US Coast Guard Consequence Management
FY 2006 Actual
FY 2007 Actual
FY 2008 Actual
FY 2009 Actual
FY 2010 Actual
FY 2011 Target
FY 2011 Actual
NA NA NA NA NA 3 4
Met Met Met Met Met Met Source DHS-OIG based on USCG-provided data
USCG did not meet its target for ldquoPercent Reduction of Maritime Security Risk Resulting from USCG Efforts to Prevent a Terrorist Entering the US via Maritime Meansrdquo This is attributable to lower effectiveness judgments for the Maritime Security Response Team due to the loss of dedicated airlift and the suspension of hook-and-climb training Additionally major cutter capacity decreased due to the decommissioning of one High Endurance Cutter and an overall reduction of major cutter resource hours
Ports Waterways and Coastal Security Performance Measure ndash Percent Reduction of Maritime Security Risk
Resulting from USCG Efforts to Prevent a Terrorist Entering the US via Maritime Means
FY 2006 Actual
FY 2007 Actual
FY 2008 Actual
FY 2009 Actual
FY 2010 Actual
FY 2011 Target
FY 2011 Actual
NA NA NA NA NA 52 43
Met Met Met Met Met Not Met Source DHS-OIG based on USCG-provided data
USCG missed its target for ldquoPercent Reduction of Maritime Security Risk Resulting from USCG Efforts to Prevent a Weapon of Mass Destruction from Entering the United States
wwwoigdhsgov 22 OIG-12-119
Ports Waterways and Coastal Security Performance Measure ndash Percent Reduction of Maritime Security Risk
Resulting from USCG Efforts to Prevent a Weapon of Mass Destruction from Entering the US via Maritime Means
FY 2006 Actual
FY 2007 Actual
FY 2008 Actual
FY 2009 Actual
FY 2010 Actual
FY 2011 Target
FY 2011 Actual
NA NA NA NA NA 29 28
Met Met Met Met Met Not Met
Ports Waterways and Coastal Security Performance Measure ndash Annual Maritime Transportation Security Act Facility
Compliance Rate with Transportation Worker Identification Credential Regulations
FY 2006 Actual
FY 2007 Actual
FY 2008 Actual
FY 2009 Actual
FY 2010 Actual
FY 2011 Target
FY 2011 Actual
NA NA NA NA 100 85 99
NA NA NA NA Met Met
Source DHS-OIG based on USCG-provided data
OFFICE OF INSPECTOR GENERAL Department of Homeland Security
via Maritime Meansrdquo by one percentage point This is attributable to lower effectiveness judgments for the Maritime Security Response Team due to loss of dedicated airlift and the challenges of identifying a broad range of Weapons of Mass Destruction amongst the volume of legitimate shipping cargo Additionally major cutter capacity decreased due to the decommissioning of one High Endurance Cutter and an overall reduction of major cutter resource hours
Source DHS-OIG based on USCG-provided data
USCG exceeded its FY 2011 target for ldquoAnnual Maritime Transportation Security Act Facility Compliance Rate with Transportation Worker Identification Credential Regulationsrdquo
USCG missed its target for ldquoPercent of Maritime Facilities in Compliance with Security Regulationsrdquo by only one-tenth of one percent The USCG has focused the use of its personnel resources to conduct Maritime Transportation Security Act compliance exams at waterfront facilities that are at higher risk for a transportation security incident By increasing partnerships with these facilities 999 percent of regulated facilities did not have serious deficiencies warranting a notice of violation or civil penalty in FY 2011
wwwoigdhsgov 23 OIG-12-119
Ports Waterways and Coastal Security Performance Measure ndash Percent Of Maritime Facilities in Compliance with
Security Regulations
FY 2006 Actual
FY 2007 Actual
FY 2008 Actual
FY 2009 Actual
FY 2010 Actual
FY 2011 Target
FY 2011 Actual
NA NA NA NA NA 100 999
NA NA NA NA NA Not Met
Source DHS-OIG based on USCG-provided data
OFFICE OF INSPECTOR GENERAL Department of Homeland Security
Drug Interdiction
USCGrsquos drug interdiction efforts support national strategies to disrupt the market for illegal drugs and prevent transnational threats from reaching the United States The USCG is the lead Federal agency for drug interdiction on the high seas and shares the lead for drug interdiction in the territorial seas of the US with Customs and Border Protection The USCG coordinates with its interagency partners to deter illicit drug trafficking including the Department of Defense Department of Justice Department of State and other components within DHS
Resource Hours FY 2011 resource hours totaled 73401 and increased by approximately 9 percent from FY 2010 but are about 40 percent below baseline levels
Source DHS-OIG based on USCG-provided data
Performance Measures and Results The USCG uses the interagency Consolidated Counter Drug Database as its main source for tracking cocaine movement estimates
wwwoigdhsgov 24 OIG-12-119
Drug Interdiction Performance Measure ndash Removal Rate for Cocaine from Non-commercial
Vessels in Maritime Transit Zone FY 2006 FY 2007 FY 2008 FY 2009 FY 2010 FY 2011 FY 2011 Actual Actual Actual Actual Actual Target Actual
NA NA NA 150 135 155 116
NA NA NA X
Not Met X
Not Met X
Not Met Source DHS-OIG based on USCG-provided data
OFFICE OF INSPECTOR GENERAL Department of Homeland Security
The one performance measure related to Drug Interdiction ldquoRemoval Rate for Cocaine from Non-commercial Vessels in Maritime Transit Zonerdquo was not met in FY 2011 According to the USCG the reasons for not meeting this target can be attributed to reduced asset and resource availability smaller average load sizes of cocaine and increasingly sophisticated criminal organizations
Migrant Interdiction
USCG migrant interdiction policy and operations are designed to provide effective law enforcement presence at sea and achieve three main objectives (1) deter undocumented migrants and transnational human smugglers from using maritime routes to enter the US (2) detect and interdict undocumented migrants and human smugglers far from the US border and (3) expand USCG participation in multi-agency and bi-national border security initiatives While the USCG leads the interdiction mission on the high seas it partners with Customs and Border Protection and Immigration and Customs Enforcement for shore-side interdiction operations
Resource Hours Migrant interdiction resource hours remain approximately 144 percent above baseline levels In FY 2011 resource hours totaled 72213 and decreased approximately 60 percent from FY 2010 to FY 2011
wwwoigdhsgov 25 OIG-12-119
Migrant Interdiction Performance Measure ndash Percentage of Undocumented Migrants who
Attempt to Enter the United States Via Maritime Routes that are Interdicted
FY 2006 Actual
FY 2007 Actual
FY 2008 Actual
FY 2009 Actual
FY 2010 Actual
FY 2011 Target
FY 2011 Actual
NA 652 627 844 645 739 728
NA Not Met Not Met Met Not Met Not Met
OFFICE OF INSPECTOR GENERAL Department of Homeland Security
Source DHS-OIG based on USCG-provided data
Performance Measures and Results According to the USCG the number of undocumented migrants attempting to enter the US remained low in FY 2011 compared to numbers observed over the last decade due in part to a slumping US economy successful prosecution of smugglers effective bilateral cooperation and use of biometrics The USCG reported that it met one of its two performance measures related to migrant interdiction in FY 2011 Although the USCG did not meet the target for ldquoPercentage of Undocumented Migrants who Attempt to Enter the United States via Maritime Routes that are Interdictedrdquo the actual result of 728 percent was an improvement over FY 2010rsquos 645 percent This measure includes migrants who are interdicted by foreign counterparts of the USCG many of whom have fewer resources than the USCG
Source DHS-OIG based on USCG-provided data
As shown in the table below the USCG exceeded its target for the ldquoPercent of Undocumented Migrants who Attempt to Enter the United States via Maritime Routes Interdicted by the Coast Guardrdquo
wwwoigdhsgov 26 OIG-12-119
Migrant Interdiction Performance Measure ndash Percent of Undocumented Migrants who Attempt to Enter the United States via Maritime Routes Interdicted by the Coast Guard
FY 2006 Actual
FY 2007 Actual
FY 2008 Actual
FY 2009 Actual
FY 2010 Actual
FY 2011 Target
FY 2011 Actual
NA 421 469 375 447 430 517
NA NA Not Met Not Met Met Met
Source DHS-OIG based on USCG-provided data
OFFICE OF INSPECTOR GENERAL Department of Homeland Security
Defense Readiness
The USCG maintains a level of readiness and training that allows for the immediate integration with Department of Defense forces for peacetime operations or during times of war This supports US national interests abroad as well as facilitating support to DHS for the integration of Homeland Defense and Homeland Security
Resource Hours In FY 2011 resource hours for Defense Readiness totaled 41424 and were still above the baseline although resource hours decreased by 119 percent from FY 2010 to FY 2011
Source DHS-OIG based on USCG-provided data
Performance Measures and Results The USCG did not meet its overall target of 381 percent defense readiness for the year The declining readiness of the USCGrsquos High Endurance Cutter fleet continues to present significant challenges to mission
wwwoigdhsgov 27 OIG-12-119
Defense Readiness Performance Measure ndash Defense Readiness Assessment of all USCG High-
Endurance Cutters Patrol Boats and Port Security Units
FY 2006 Actual
FY 2007 Actual
FY 2008 Actual
FY 2009 Actual
FY 2010 Actual
FY 2011 Target
FY 2011 Actual
NA NA NA NA 241 381 251
NA NA NA NA Not Met Not Met
Source DHS-OIG based on USCG-provided data
OFFICE OF INSPECTOR GENERAL Department of Homeland Security
performance High Endurance Cutter readiness is being addressed by the USCGrsquos acquisition of the National Security Cutter
Other Law Enforcement
The other law enforcement mission orchestrates the enforcement of regulations on foreign fishing vessels This enforcement takes two forms the first is the deterrence detection and interdiction of illegal incursions into the US exclusive economic zone by foreign fishing vessels 1 The protection of the US exclusive economic zone from incursions by foreign fishing vessels contributes to a fundamental USCG maritime security objective to protect our Nationrsquos renewable natural resources The second part of the other law enforcement mission is to ensure compliance with international agreements for the management of living marine resources This is primarily accomplished through enforcement on foreign fishing vessels of conservation and management measures created by regional fishery management organizations
Resource Hours In FY 2011 resource hours for the other law enforcement mission totaled 12579 which is an increase of 445 percent from FY 2010 According to the USCG this increase in resource hours was due to increased patrols for illegal unregulated and unreported fishing activity
1 The exclusive economic zone is the zone where the US and other coastal nations have jurisdiction over economic and resource management The exclusive economic zone includes waters three to 200 miles offshore (or nine to 200 miles offshore in western Florida and Texas)
wwwoigdhsgov 28 OIG-12-119
OFFICE OF INSPECTOR GENERAL Department of Homeland Security
Source DHS-OIG based on USCG-provided data
Performance Measures and Results The USCG uses the number of detected incursions into the US Exclusive Economic Zone by foreign fishing vessels as a measure of its performance In FY 2011 there were 122 detected incursions of foreign fishing vessels into the US Exclusive Economic Zone which met the performance target of fewer than 180 incursions
Other Law Enforcement Performance Measure ndash Number of Detected Incursions of Foreign Fishing
Vessels violating US Waters
FY 2006 Actual
FY 2007 Actual
FY 2008 Actual
FY 2009 Actual
FY 2010 Actual
FY 2011 Target
FY 2011 Actual
164 126 81 112 82 lt180 122
Met Met Met Met Met Met Source DHS-OIG based on USCG-provided data
wwwoigdhsgov 29 OIG-12-119
Mission Measure Met Not Met
Non-Homeland Security Missions
Search and Rescue Percentage of People in Imminent Danger Saved in the Maritime Environment
X
Percent of Time Rescue Assets are On-Scene within 2 Hours X
Aids-to-Navigation Availability of Maritime Navigation Aids X Average Number of Navigational Accidents X
Ice Operations Number of Days Critical Waterways Are Closed to Commerce Due to Ice X Living Marine Resources Fishing Regulation Compliance Rate X
Marine Safety
5-Yr Average Number of Commercial and Recreational Deaths and Injuries
X
5-Yr Average Number of Commercial Mariner Deaths and Injuries X
5-Yr Average Number of Commercial Passenger Deaths and Injuries X
5-Yr Average Number of Recreational Boating Deaths and Injuries X
Marine Environmental Protection
Average Number of Chemical Discharge Incidents in the Maritime Environment
X
Average Number of Oil Spills in the Maritime Environment X Total Non-Homeland Security Performance Measures 9 3
Homeland Security Missions
Ports Waterways and Coastal Security
Percentage Reduction of all Maritime Security Risk Subject to USCG Influence
X
Percent Reduction of Maritime Security Risk Resulting from USCG Consequence Management
X
Percent Reduction of Maritime Security Risk Resulting from USCG Efforts to Prevent a Terrorist Entering the US via Maritime Means
X
Percent Reduction of Maritime Security Risk Resulting from USCG Efforts to Prevent a Weapon of Mass Destruction from Entering the US via Maritime Means
X
Annual MTSA Facility Compliance Rate with Transportation Worker Identification Credential Regulations
X
Percent of Maritime Facilities In Compliance with Security Regulations X
Drug Interdiction Removal Rate for Cocaine from Non-commercial Vessels in Maritime Transit Zone
X
Migrant Interdiction
Percentage of Undocumented Migrants who Attempt to Enter the United States Via Maritime Routes that are Interdicted
X
Percent of Undocumented Migrants who Attempt to Enter the US by Maritime Routes Interdicted by the USCG
X
Defense Readiness Defense Readiness Assessment of all USCG High-Endurance Cutters Patrol Boats and Port Security Units
X
Other Law Enforcement Number of Detected Incursions of Foreign Fishing Vessels Violating US Waters
X
Total Homeland Security Performance Measures 5 6
Total USCG Performance Measures 14 9 Source DHS-OIG based on USCG-provided data
OFFICE OF INSPECTOR GENERAL Department of Homeland Security
Appendix E FY 2011 Performance Measure Summary
wwwoigdhsgov 30 OIG-12-119
OFFICE OF INSPECTOR GENERAL Department of Homeland Security
Appendix F Major Contributors to This Report
Brooke Bebow Director Lisa Vonder Haar Audit Manager Stephen Doran Auditor Richard Joyce Program Analyst Marisa Coccaro Referencer
wwwoigdhsgov 31 OIG-12-119
OFFICE OF INSPECTOR GENERAL Department of Homeland Security
Appendix G Report Distribution
Department of Homeland Security
Secretary Deputy Secretary Chief of Staff Deputy Chief of Staff General Counsel Executive Secretary Director GAOOIG Liaison Office Assistant Secretary for Office of Policy Assistant Secretary for Office of Public Affairs Assistant Secretary for Office of Legislative Affairs Acting Chief Privacy Officer
United States Coast Guard
Commandant Assistant Commandant for Resources and Chief Financial Officer USCG Audit Liaison
Office of Management and Budget
Chief Homeland Security Branch DHS OIG Budget Examiner
Congress
Congressional Oversight and Appropriations Committees as appropriate
wwwoigdhsgov 32 OIG-12-119
ADDITIONAL INFORMATION AND COPIES
To obtain additional copies of this document please call us at (202) 254-4100 fax your request to (202) 254-4305 or e-mail your request to our Office of Inspector General (OIG) Office of Public Affairs at DHS-OIGOfficePublicAffairsoigdhsgov
For additional information visit our website at wwwoigdhsgov or follow us on Twitter at dhsoig
OIG HOTLINE
To expedite the reporting of alleged fraud waste abuse or mismanagement or any other kinds of criminal or noncriminal misconduct relative to Department of Homeland Security (DHS) programs and operations please visit our website at wwwoigdhsgov and click on the red tab titled Hotline to report You will be directed to complete and submit an automated DHS OIG Investigative Referral Submission Form Submission through our website ensures that your complaint will be promptly received and reviewed by DHS OIG
Should you be unable to access our website you may submit your complaint in writing to DHS Office of Inspector General Attention Office of Investigations Hotline 245 Murray Drive SW Building 410Mail Stop 2600 Washington DC 20528 or you may call 1 (800) 323-8603 or fax it directly to us at (202) 254-4297
The OIG seeks to protect the identity of each writer and caller
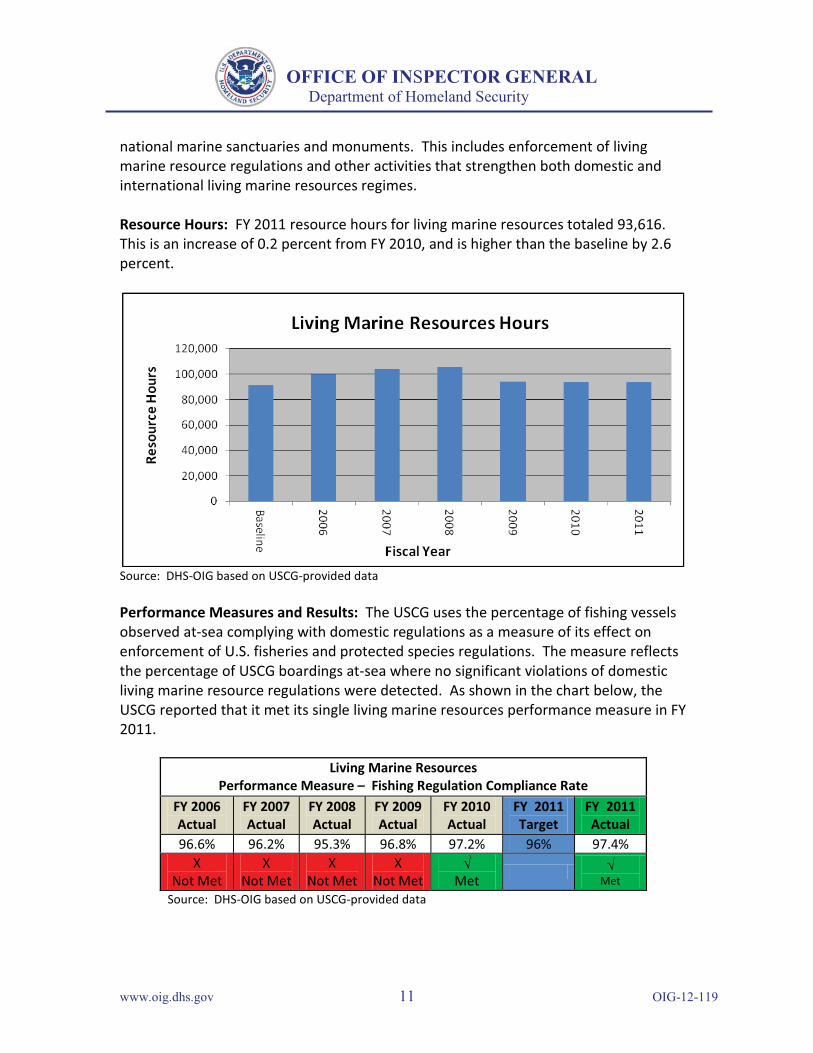
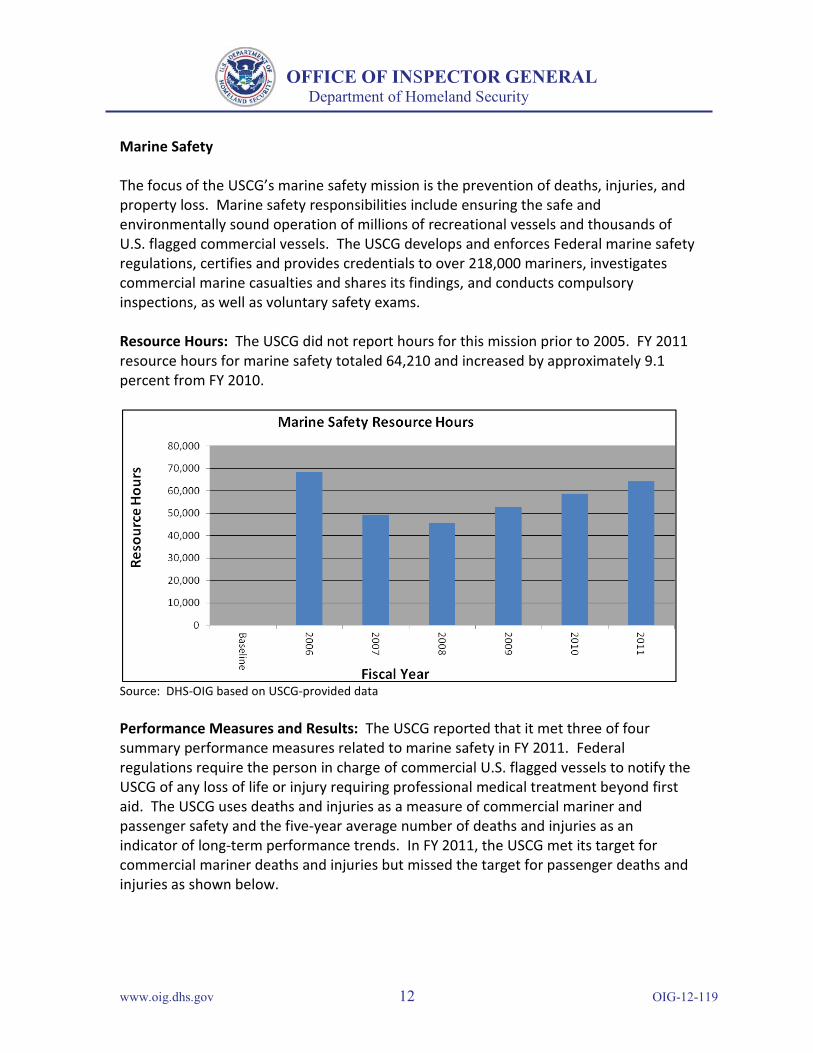
OFFICE OF INSPECTOR GENERAL Department of Homeland Security
Marine Safety
The focus of the USCGrsquos marine safety mission is the prevention of deaths injuries and property loss Marine safety responsibilities include ensuring the safe and environmentally sound operation of millions of recreational vessels and thousands of US flagged commercial vessels The USCG develops and enforces Federal marine safety regulations certifies and provides credentials to over 218000 mariners investigates commercial marine casualties and shares its findings and conducts compulsory inspections as well as voluntary safety exams
Resource Hours The USCG did not report hours for this mission prior to 2005 FY 2011 resource hours for marine safety totaled 64210 and increased by approximately 91 percent from FY 2010
Source DHS-OIG based on USCG-provided data
Performance Measures and Results The USCG reported that it met three of four summary performance measures related to marine safety in FY 2011 Federal regulations require the person in charge of commercial US flagged vessels to notify the USCG of any loss of life or injury requiring professional medical treatment beyond first aid The USCG uses deaths and injuries as a measure of commercial mariner and passenger safety and the five-year average number of deaths and injuries as an indicator of long-term performance trends In FY 2011 the USCG met its target for commercial mariner deaths and injuries but missed the target for passenger deaths and injuries as shown below
wwwoigdhsgov 12 OIG-12-119
Marine Safety Performance Measure ndash Five-Year Average Number of Commercial
Mariner Deaths and Injuries
FY 2006 Actual
FY 2007 Actual
FY 2008 Actual
FY 2009 Actual
FY 2010 Actual
FY 2011 Target
FY 2011 Actual
502 526 496 498 474 lt475 431
NA NA Met Met Met Met
Source DHS-OIG based on USCG-provided data
Marine Safety Performance Measure ndash Five-Year Average Number of
Recreational Boating Deaths and Injuries FY 2006 FY 2007 FY 2008 FY 2009 FY 2010 FY 2011 FY 2011 Actual Actual Actual Actual Actual Target Actual 4366 4249 4147 4150 4091 lt4115 3904
NA NA Met Met Met Met
OFFICE OF INSPECTOR GENERAL Department of Homeland Security
Marine Safety Performance Measure ndash Five-Year Average Number of
Commercial Passenger Deaths and Injuries FY 2006 FY 2007 FY 2008 FY 2009 FY 2010 FY 2011 FY 2011 Actual Actual Actual Actual Actual Target Actual
216 238 252 238 250 lt223 232
NA NA X X X
Not Met Met Not Met Not Met Source DHS-OIG based on USCG-provided data
Federal regulations also require operators or owners of recreational vessels to file a boating accident report when a person dies or disappears from the vessel under certain circumstances The USCG uses deaths and injuries as a measure of marine safety for the recreational boating segment of the American maritime community and a five-year average of these as an indicator of long-term performance trends The USCG reported that it met its target for this measure in FY 2011
Source DHS-OIG based on USCG-provided data
In FY 2011 the USCG added a new long-term performance measure for the five-year average number of commercial and recreational deaths and injuries The target for this measure was met
wwwoigdhsgov 13 OIG-12-119
OFFICE OF INSPECTOR GENERAL Department of Homeland Security
Marine Safety Performance Measure ndash Five-Year Average Number of
Commercial and Recreational Deaths And Injuries FY 2006 FY 2007 FY 2008 FY 2009 FY 2010 FY 2011 FY 2011 Actual Actual Actual Actual Actual Target Actual
NA NA NA NA NA lt4813 4567
NA NA NA NA NA Met
Source DHS-OIG based on USCG-provided data
Marine Environmental Protection
The marine environmental protection mission focuses on minimizing oil and hazardous substance effect on human health the environment and the marine transportation system The USCG regulates the handling of oil hazardous substances and other shipboard wastes to prevent their discharge into US or international waterways stop unauthorized ocean dumping reduce ship-based air emissions and avert the introduction of invasive species The USCG is the lead Federal agency for directing the removal and mitigation of oil spills from the waters and adjoining shorelines of the coastal zone
Resource Hours Marine environmental protection resource hours totaled 4682 in FY 2011 This represents a decrease of 839 percent from FY 2010 and is attributable to the reduction of resource hours necessary for the Deepwater Horizon oil spill in the Gulf of Mexico
Source DHS-OIG based on USCG-provided data
wwwoigdhsgov 14 OIG-12-119
Marine Environmental Protection Performance Measure Average Number of Oil Spills in the Maritime Environment
FY 2006 FY 2007 FY 2008 FY 2009 FY 2010 FY 2011 FY 2011 Actual Actual Actual Actual Actual Target Actual 143 139 132 123 115 lt116 102
NA NA Met Met Met Met
Source DHS-OIG based on USCG-provided data
OFFICE OF INSPECTOR GENERAL Department of Homeland Security
Performance Measures and Results Federal regulation requires vessel or facility operators to report the discharge of any hazardous substance that equals or exceeds reportable quantities and requires the reporting of any discharge of oil or oil products that cause a sheen discoloration sludge or emulsion on or below the surface of any navigable waterway of the United States The USCG uses the number of chemical discharge incidents and the number of oil spills greater than 100 gallons as proxy indicators of marine environmental protection and normalizes five-year averages of these as indicators of long-term trends In FY 2011 the USCG reported that it met the target for ldquoAverage Number of Chemical Discharge Incidents in the Maritime Environmentrdquo which was previously reported as ldquo5-Yr Average Chemical Discharge Incidents per 100 Million Short Tons Shippedrdquo
Marine Environmental Protection Performance Measure ndash Average Number of Chemical Discharge
Incidents in the Maritime Environment FY
2006 Actual
FY 2007
Actual
FY 2008
Actual
FY 2009
Actual
FY 2010
Actual
FY FY 2011 2011
Target Actual 278 244 198 187 181 lt220 150
NA NA Met Met Met Met
Source DHS-OIG based on USCG-provided data
USCG also reported that it met the target for ldquoAverage Number of Oil Spills in the Maritime Environmentrdquo which was previously reported as ldquo5-Yr Average Oil Spills gt 100 Gallons per 100 Million Short Tons Shippedrdquo
Search and Rescue
USCG strives to minimize lives lost injury and property loss or damage by rendering aid to those in distress in the maritime environment and elsewhere as called upon The search and rescue mission is accomplished through resource readiness distress monitoring and communication search planning on-scene operations and domestic and international partnerships
wwwoigdhsgov 15 OIG-12-119
OFFICE OF INSPECTOR GENERAL Department of Homeland Security
Resource Hours Search and rescue is a demand-driven mission Requirements for search and rescue increase or decrease relative to the number of people requiring the USCGrsquos assistance Resource hours in FY 2011 totaled 55934 and decreased approximately 13 percent from FY 2010
Source DHS-OIG based on USCG-provided data
0 10000 20000 30000 40000 50000 60000 70000 80000 90000
Baseline
2006
2007
2008
2009
2010
2011 Re
sour
ce H
ours
Search and Rescue Resource Hours
Fiscal Year
Performance Measures and Results USCG met the FY 2011 target for percent of people in imminent danger saved in the maritime environment was not met Though this yearrsquos performance is below the overall target it is more than the 744 percent level posted in FY 2010 In FY 2011 the USCG saved 3804 lives in 20510 cases with 732 lives lost and 390 lives unaccounted for This total excluded outlier cases with more than 10 lives at risk Other than raw numbers of lives saved and lost there is no clear indication of the drivers that led to this decrease The USCG is conducting further analysis is in progress to identify any systemic issues Additionally uncontrollable variables such as weather location incident severity and life saving devices on board continue to influence the number and outcome of search and rescue incidents
Search and Rescue Performance Measure ndash Percent of People in Imminent Danger Saved
in the Maritime Environment FY FY FY FY FY FY FY
2006 2007 2008 2009 2010 2011 2011 Actual Actual Actual Actual Actual Target Actual
76 766 768 773 744 100 773 X X
Met Met Met Met Not Met Not Met Source DHS-OIG based on USCG-provided data
wwwoigdhsgov 16 OIG-12-119
Search and Rescue Performance Measure ndash Percent of Time Rescue Assets are On-Scene
within 2 Hours FY
2006 FY
2007 FY
2008 FY
2009 FY
2010 FY
2011 FY
2011 Actual Actual Actual Actual Actual Target Actual 937 943 933 940 933 100 931
Met Met Met Met Met X
Not Met Source DHS-OIG based on USCG-provided data
OFFICE OF INSPECTOR GENERAL Department of Homeland Security
The FY 2011 target for percent of time rescue assets are on-scene within 2 hours was not met However overall performance is in line with the USCGrsquos expectations based on placement of resources and proximity to shore of the majority of search and rescue incidents and shows consistent performance over the last six years This measure has been adjusted to exclude cases in which an operational decision was made to delay a response Certain determining factors such as weather resource availability and risk assessment delay response time
Aids-to-Navigation
USCG minimizes disruptions to maritime commerce by assessing and mitigating risks to safe navigation It provides and maintains more than 51000 buoys beacons lights and other aids to mark channels and denote hazards
Resource Hours FY 2011 resource hours totaled 98819 and increased approximately 37 percent from FY 2010 This is an approximately 12 percent decrease from the baseline level
wwwoigdhsgov 17 OIG-12-119
Aids-to-Navigation Performance Measure ndash Availability of Maritime Navigation Aids
FY 2006 FY 2007 FY 2008 FY 2009 FY 2010 FY 2011 FY 2011 Actual Actual Actual Actual Actual Target Actual 968 980 983 980 985 975 985
X Not Met Met Met Met Met Met
Source DHS-OIG based on USCG-provided data
Aids-to-Navigation Performance Measure ndash Average Number of Navigational Accidents
FY 2006 FY 2007 FY 2008 FY 2009 FY 2010 FY 2011 FY 2011 Actual Actual Actual Actual Actual Target Actual 1765 1823 1857 1878 1878 1945
X Not Met
X Not Met
X Not Met
X Not Met
X Not Met Met
Source DHS-OIG based on USCG-provided data
OFFICE OF INSPECTOR GENERAL Department of Homeland Security
Source DHS-OIG based on USCG-provided data
Performance Measures and Results The USCG reported that it met its FY 2011 target for the availability of maritime navigation aids for the fifth consecutive year
In FY 2011 the USCG reported that it met its target for the average number of navigational accidents This is the first time this measure was met in the past six years
wwwoigdhsgov 18 OIG-12-119
Ice Operations Performance Measure ndash Number of Days Critical Waterways Are Closed to
Commerce Due to Ice FY 2006 FY 2007 FY 2008 FY 2009 FY 2010 FY 2011 FY 2011 Actual Actual Actual Actual Actual Target Actual
0 0 0 0 6 2 avg amp 8 severe
0
Met Met Met Met X
Not Met Met Source DHS-OIG based on USCG-provided data
OFFICE OF INSPECTOR GENERAL Department of Homeland Security
Ice Operations
This mission supports winter commerce and prevents and responds to ice that causes flooding These activities are essential to winter and spring commerce and the safety of waterside communities on the Great Lakes in New England and on the Hudson River and occasionally in the mid-Atlantic
Resource Hours In FY 2011 resource hours totaled 10747 and decreased approximately 77 percent from FY 2010 which is approximately 10 percent lower than the baseline level
Source DHS-OIG based on USCG-provided data
Performance Measures and Results The USCG reported that it met its FY 2011 target for the number of days critical waterways are closed to commerce due to ice Domestic icebreakers on the Great Lakes assisted over 1700 commercial vessel transits carrying $300 million in bulk commodities Favorable environmental conditions continued partnership with the Canadian Coast Guard and effective employment of domestic icebreaking assets contributed to achieving the performance target
wwwoigdhsgov 19 OIG-12-119
OFFICE OF INSPECTOR GENERAL Department of Homeland Security
Appendix D Homeland Security Missions
The FY 2011 homeland security mission resource hours totaled 355586 and decreased by approximately 05 percent from FY 2010 Between FY 2006 and FY 2011 total resource hours for homeland security missions were the highest in FY 2007 However the FY 2011 level remains at approximately 91 percent above baseline levels as depicted in the following graph
Source DHS-OIG based on USCG-provided data
In FY 2011 the USCG reported that it met or exceeded 5 of 11 summary performance measures for its 5 homeland security missions compared with meeting 2 of 5 summary performance measures in FY 2010 The resource hours and performance measures and results for each non-homeland security mission are summarized below
Ports Waterways and Coastal Security
The ports waterways and coastal security mission aims to deny terrorists the use and exploitation of the maritime domain and marine transportation system as a means for attacks on US territory population centers vessels and maritime critical infrastructure and key resources This mission includes preparedness planning and exercises antiterrorism and counterterrorism activities and initial recovery efforts if attacks are successful
wwwoigdhsgov 20 OIG-12-119
OFFICE OF INSPECTOR GENERAL Department of Homeland Security
Resource Hours In FY 2011 resource hours for ports waterways and coastal security totaled 155969 which is a decrease of 09 percent from FY 2010
Source DHS-OIG based on USCG-provided data
Performance Measures and Results USCG reported that it met three of its six FY 2011 targets for ports waterways and coastal security In FY 2011 the USCG added two new summary measures related to compliance with security regulations and significantly updated the methodology for the FY 2010 summary measure Percent Reduction in Maritime Terrorism Risk over which the USCG has Influence resulting in four maritime security risk measures as shown in the following charts The USCG improved and created a new baseline for the maritime security risk measures in FY 2010 thus FY 2011 results should not be compared to previous years
The revised maritime security risk measures are risk-based outcome measures that begin with an assessment of likely high-consequence maritime terrorist attack scenarios Threat vulnerability and consequence levels are estimated for each scenario which generates a proxy (index) value of raw risk that exists in the maritime domain Next the USCG interventions (security and response operations regime and awareness activities) for the fiscal year are scored against the scenarios with regard to the decreases in threat vulnerability and consequence that each has been estimated to have afforded The resulting measures are proxy measures of performance
As depicted below the USCG reported that it met its FY 2011 target for ldquoPercent Reduction of all Maritime Security Risk Subject to USCG Influencerdquo
wwwoigdhsgov 21 OIG-12-119
Ports Waterways and Coastal Security Performance Measure ndash Percent Reduction of all Maritime Security Risk
Subject to USCG Influence
FY 2006 Actual
FY 2007 Actual
FY 2008 Actual
FY 2009 Actual
FY 2010 Actual
FY 2011 Target
FY 2011 Actual
NA NA NA NA NA 44 44
Met Met Met Met Met Met Source DHS-OIG based on USCG-provided data
OFFICE OF INSPECTOR GENERAL Department of Homeland Security
USCG exceeded its FY 2011 target for Percent Reduction of all Maritime Security Risk Resulting from USCG Consequence Management
Ports Waterways and Coastal Security Performance Measure ndash Percent Reduction of Maritime Security Risk
Resulting from US Coast Guard Consequence Management
FY 2006 Actual
FY 2007 Actual
FY 2008 Actual
FY 2009 Actual
FY 2010 Actual
FY 2011 Target
FY 2011 Actual
NA NA NA NA NA 3 4
Met Met Met Met Met Met Source DHS-OIG based on USCG-provided data
USCG did not meet its target for ldquoPercent Reduction of Maritime Security Risk Resulting from USCG Efforts to Prevent a Terrorist Entering the US via Maritime Meansrdquo This is attributable to lower effectiveness judgments for the Maritime Security Response Team due to the loss of dedicated airlift and the suspension of hook-and-climb training Additionally major cutter capacity decreased due to the decommissioning of one High Endurance Cutter and an overall reduction of major cutter resource hours
Ports Waterways and Coastal Security Performance Measure ndash Percent Reduction of Maritime Security Risk
Resulting from USCG Efforts to Prevent a Terrorist Entering the US via Maritime Means
FY 2006 Actual
FY 2007 Actual
FY 2008 Actual
FY 2009 Actual
FY 2010 Actual
FY 2011 Target
FY 2011 Actual
NA NA NA NA NA 52 43
Met Met Met Met Met Not Met Source DHS-OIG based on USCG-provided data
USCG missed its target for ldquoPercent Reduction of Maritime Security Risk Resulting from USCG Efforts to Prevent a Weapon of Mass Destruction from Entering the United States
wwwoigdhsgov 22 OIG-12-119
Ports Waterways and Coastal Security Performance Measure ndash Percent Reduction of Maritime Security Risk
Resulting from USCG Efforts to Prevent a Weapon of Mass Destruction from Entering the US via Maritime Means
FY 2006 Actual
FY 2007 Actual
FY 2008 Actual
FY 2009 Actual
FY 2010 Actual
FY 2011 Target
FY 2011 Actual
NA NA NA NA NA 29 28
Met Met Met Met Met Not Met
Ports Waterways and Coastal Security Performance Measure ndash Annual Maritime Transportation Security Act Facility
Compliance Rate with Transportation Worker Identification Credential Regulations
FY 2006 Actual
FY 2007 Actual
FY 2008 Actual
FY 2009 Actual
FY 2010 Actual
FY 2011 Target
FY 2011 Actual
NA NA NA NA 100 85 99
NA NA NA NA Met Met
Source DHS-OIG based on USCG-provided data
OFFICE OF INSPECTOR GENERAL Department of Homeland Security
via Maritime Meansrdquo by one percentage point This is attributable to lower effectiveness judgments for the Maritime Security Response Team due to loss of dedicated airlift and the challenges of identifying a broad range of Weapons of Mass Destruction amongst the volume of legitimate shipping cargo Additionally major cutter capacity decreased due to the decommissioning of one High Endurance Cutter and an overall reduction of major cutter resource hours
Source DHS-OIG based on USCG-provided data
USCG exceeded its FY 2011 target for ldquoAnnual Maritime Transportation Security Act Facility Compliance Rate with Transportation Worker Identification Credential Regulationsrdquo
USCG missed its target for ldquoPercent of Maritime Facilities in Compliance with Security Regulationsrdquo by only one-tenth of one percent The USCG has focused the use of its personnel resources to conduct Maritime Transportation Security Act compliance exams at waterfront facilities that are at higher risk for a transportation security incident By increasing partnerships with these facilities 999 percent of regulated facilities did not have serious deficiencies warranting a notice of violation or civil penalty in FY 2011
wwwoigdhsgov 23 OIG-12-119
Ports Waterways and Coastal Security Performance Measure ndash Percent Of Maritime Facilities in Compliance with
Security Regulations
FY 2006 Actual
FY 2007 Actual
FY 2008 Actual
FY 2009 Actual
FY 2010 Actual
FY 2011 Target
FY 2011 Actual
NA NA NA NA NA 100 999
NA NA NA NA NA Not Met
Source DHS-OIG based on USCG-provided data
OFFICE OF INSPECTOR GENERAL Department of Homeland Security
Drug Interdiction
USCGrsquos drug interdiction efforts support national strategies to disrupt the market for illegal drugs and prevent transnational threats from reaching the United States The USCG is the lead Federal agency for drug interdiction on the high seas and shares the lead for drug interdiction in the territorial seas of the US with Customs and Border Protection The USCG coordinates with its interagency partners to deter illicit drug trafficking including the Department of Defense Department of Justice Department of State and other components within DHS
Resource Hours FY 2011 resource hours totaled 73401 and increased by approximately 9 percent from FY 2010 but are about 40 percent below baseline levels
Source DHS-OIG based on USCG-provided data
Performance Measures and Results The USCG uses the interagency Consolidated Counter Drug Database as its main source for tracking cocaine movement estimates
wwwoigdhsgov 24 OIG-12-119
Drug Interdiction Performance Measure ndash Removal Rate for Cocaine from Non-commercial
Vessels in Maritime Transit Zone FY 2006 FY 2007 FY 2008 FY 2009 FY 2010 FY 2011 FY 2011 Actual Actual Actual Actual Actual Target Actual
NA NA NA 150 135 155 116
NA NA NA X
Not Met X
Not Met X
Not Met Source DHS-OIG based on USCG-provided data
OFFICE OF INSPECTOR GENERAL Department of Homeland Security
The one performance measure related to Drug Interdiction ldquoRemoval Rate for Cocaine from Non-commercial Vessels in Maritime Transit Zonerdquo was not met in FY 2011 According to the USCG the reasons for not meeting this target can be attributed to reduced asset and resource availability smaller average load sizes of cocaine and increasingly sophisticated criminal organizations
Migrant Interdiction
USCG migrant interdiction policy and operations are designed to provide effective law enforcement presence at sea and achieve three main objectives (1) deter undocumented migrants and transnational human smugglers from using maritime routes to enter the US (2) detect and interdict undocumented migrants and human smugglers far from the US border and (3) expand USCG participation in multi-agency and bi-national border security initiatives While the USCG leads the interdiction mission on the high seas it partners with Customs and Border Protection and Immigration and Customs Enforcement for shore-side interdiction operations
Resource Hours Migrant interdiction resource hours remain approximately 144 percent above baseline levels In FY 2011 resource hours totaled 72213 and decreased approximately 60 percent from FY 2010 to FY 2011
wwwoigdhsgov 25 OIG-12-119
Migrant Interdiction Performance Measure ndash Percentage of Undocumented Migrants who
Attempt to Enter the United States Via Maritime Routes that are Interdicted
FY 2006 Actual
FY 2007 Actual
FY 2008 Actual
FY 2009 Actual
FY 2010 Actual
FY 2011 Target
FY 2011 Actual
NA 652 627 844 645 739 728
NA Not Met Not Met Met Not Met Not Met
OFFICE OF INSPECTOR GENERAL Department of Homeland Security
Source DHS-OIG based on USCG-provided data
Performance Measures and Results According to the USCG the number of undocumented migrants attempting to enter the US remained low in FY 2011 compared to numbers observed over the last decade due in part to a slumping US economy successful prosecution of smugglers effective bilateral cooperation and use of biometrics The USCG reported that it met one of its two performance measures related to migrant interdiction in FY 2011 Although the USCG did not meet the target for ldquoPercentage of Undocumented Migrants who Attempt to Enter the United States via Maritime Routes that are Interdictedrdquo the actual result of 728 percent was an improvement over FY 2010rsquos 645 percent This measure includes migrants who are interdicted by foreign counterparts of the USCG many of whom have fewer resources than the USCG
Source DHS-OIG based on USCG-provided data
As shown in the table below the USCG exceeded its target for the ldquoPercent of Undocumented Migrants who Attempt to Enter the United States via Maritime Routes Interdicted by the Coast Guardrdquo
wwwoigdhsgov 26 OIG-12-119
Migrant Interdiction Performance Measure ndash Percent of Undocumented Migrants who Attempt to Enter the United States via Maritime Routes Interdicted by the Coast Guard
FY 2006 Actual
FY 2007 Actual
FY 2008 Actual
FY 2009 Actual
FY 2010 Actual
FY 2011 Target
FY 2011 Actual
NA 421 469 375 447 430 517
NA NA Not Met Not Met Met Met
Source DHS-OIG based on USCG-provided data
OFFICE OF INSPECTOR GENERAL Department of Homeland Security
Defense Readiness
The USCG maintains a level of readiness and training that allows for the immediate integration with Department of Defense forces for peacetime operations or during times of war This supports US national interests abroad as well as facilitating support to DHS for the integration of Homeland Defense and Homeland Security
Resource Hours In FY 2011 resource hours for Defense Readiness totaled 41424 and were still above the baseline although resource hours decreased by 119 percent from FY 2010 to FY 2011
Source DHS-OIG based on USCG-provided data
Performance Measures and Results The USCG did not meet its overall target of 381 percent defense readiness for the year The declining readiness of the USCGrsquos High Endurance Cutter fleet continues to present significant challenges to mission
wwwoigdhsgov 27 OIG-12-119
Defense Readiness Performance Measure ndash Defense Readiness Assessment of all USCG High-
Endurance Cutters Patrol Boats and Port Security Units
FY 2006 Actual
FY 2007 Actual
FY 2008 Actual
FY 2009 Actual
FY 2010 Actual
FY 2011 Target
FY 2011 Actual
NA NA NA NA 241 381 251
NA NA NA NA Not Met Not Met
Source DHS-OIG based on USCG-provided data
OFFICE OF INSPECTOR GENERAL Department of Homeland Security
performance High Endurance Cutter readiness is being addressed by the USCGrsquos acquisition of the National Security Cutter
Other Law Enforcement
The other law enforcement mission orchestrates the enforcement of regulations on foreign fishing vessels This enforcement takes two forms the first is the deterrence detection and interdiction of illegal incursions into the US exclusive economic zone by foreign fishing vessels 1 The protection of the US exclusive economic zone from incursions by foreign fishing vessels contributes to a fundamental USCG maritime security objective to protect our Nationrsquos renewable natural resources The second part of the other law enforcement mission is to ensure compliance with international agreements for the management of living marine resources This is primarily accomplished through enforcement on foreign fishing vessels of conservation and management measures created by regional fishery management organizations
Resource Hours In FY 2011 resource hours for the other law enforcement mission totaled 12579 which is an increase of 445 percent from FY 2010 According to the USCG this increase in resource hours was due to increased patrols for illegal unregulated and unreported fishing activity
1 The exclusive economic zone is the zone where the US and other coastal nations have jurisdiction over economic and resource management The exclusive economic zone includes waters three to 200 miles offshore (or nine to 200 miles offshore in western Florida and Texas)
wwwoigdhsgov 28 OIG-12-119
OFFICE OF INSPECTOR GENERAL Department of Homeland Security
Source DHS-OIG based on USCG-provided data
Performance Measures and Results The USCG uses the number of detected incursions into the US Exclusive Economic Zone by foreign fishing vessels as a measure of its performance In FY 2011 there were 122 detected incursions of foreign fishing vessels into the US Exclusive Economic Zone which met the performance target of fewer than 180 incursions
Other Law Enforcement Performance Measure ndash Number of Detected Incursions of Foreign Fishing
Vessels violating US Waters
FY 2006 Actual
FY 2007 Actual
FY 2008 Actual
FY 2009 Actual
FY 2010 Actual
FY 2011 Target
FY 2011 Actual
164 126 81 112 82 lt180 122
Met Met Met Met Met Met Source DHS-OIG based on USCG-provided data
wwwoigdhsgov 29 OIG-12-119
Mission Measure Met Not Met
Non-Homeland Security Missions
Search and Rescue Percentage of People in Imminent Danger Saved in the Maritime Environment
X
Percent of Time Rescue Assets are On-Scene within 2 Hours X
Aids-to-Navigation Availability of Maritime Navigation Aids X Average Number of Navigational Accidents X
Ice Operations Number of Days Critical Waterways Are Closed to Commerce Due to Ice X Living Marine Resources Fishing Regulation Compliance Rate X
Marine Safety
5-Yr Average Number of Commercial and Recreational Deaths and Injuries
X
5-Yr Average Number of Commercial Mariner Deaths and Injuries X
5-Yr Average Number of Commercial Passenger Deaths and Injuries X
5-Yr Average Number of Recreational Boating Deaths and Injuries X
Marine Environmental Protection
Average Number of Chemical Discharge Incidents in the Maritime Environment
X
Average Number of Oil Spills in the Maritime Environment X Total Non-Homeland Security Performance Measures 9 3
Homeland Security Missions
Ports Waterways and Coastal Security
Percentage Reduction of all Maritime Security Risk Subject to USCG Influence
X
Percent Reduction of Maritime Security Risk Resulting from USCG Consequence Management
X
Percent Reduction of Maritime Security Risk Resulting from USCG Efforts to Prevent a Terrorist Entering the US via Maritime Means
X
Percent Reduction of Maritime Security Risk Resulting from USCG Efforts to Prevent a Weapon of Mass Destruction from Entering the US via Maritime Means
X
Annual MTSA Facility Compliance Rate with Transportation Worker Identification Credential Regulations
X
Percent of Maritime Facilities In Compliance with Security Regulations X
Drug Interdiction Removal Rate for Cocaine from Non-commercial Vessels in Maritime Transit Zone
X
Migrant Interdiction
Percentage of Undocumented Migrants who Attempt to Enter the United States Via Maritime Routes that are Interdicted
X
Percent of Undocumented Migrants who Attempt to Enter the US by Maritime Routes Interdicted by the USCG
X
Defense Readiness Defense Readiness Assessment of all USCG High-Endurance Cutters Patrol Boats and Port Security Units
X
Other Law Enforcement Number of Detected Incursions of Foreign Fishing Vessels Violating US Waters
X
Total Homeland Security Performance Measures 5 6
Total USCG Performance Measures 14 9 Source DHS-OIG based on USCG-provided data
OFFICE OF INSPECTOR GENERAL Department of Homeland Security
Appendix E FY 2011 Performance Measure Summary
wwwoigdhsgov 30 OIG-12-119
OFFICE OF INSPECTOR GENERAL Department of Homeland Security
Appendix F Major Contributors to This Report
Brooke Bebow Director Lisa Vonder Haar Audit Manager Stephen Doran Auditor Richard Joyce Program Analyst Marisa Coccaro Referencer
wwwoigdhsgov 31 OIG-12-119
OFFICE OF INSPECTOR GENERAL Department of Homeland Security
Appendix G Report Distribution
Department of Homeland Security
Secretary Deputy Secretary Chief of Staff Deputy Chief of Staff General Counsel Executive Secretary Director GAOOIG Liaison Office Assistant Secretary for Office of Policy Assistant Secretary for Office of Public Affairs Assistant Secretary for Office of Legislative Affairs Acting Chief Privacy Officer
United States Coast Guard
Commandant Assistant Commandant for Resources and Chief Financial Officer USCG Audit Liaison
Office of Management and Budget
Chief Homeland Security Branch DHS OIG Budget Examiner
Congress
Congressional Oversight and Appropriations Committees as appropriate
wwwoigdhsgov 32 OIG-12-119
ADDITIONAL INFORMATION AND COPIES
To obtain additional copies of this document please call us at (202) 254-4100 fax your request to (202) 254-4305 or e-mail your request to our Office of Inspector General (OIG) Office of Public Affairs at DHS-OIGOfficePublicAffairsoigdhsgov
For additional information visit our website at wwwoigdhsgov or follow us on Twitter at dhsoig
OIG HOTLINE
To expedite the reporting of alleged fraud waste abuse or mismanagement or any other kinds of criminal or noncriminal misconduct relative to Department of Homeland Security (DHS) programs and operations please visit our website at wwwoigdhsgov and click on the red tab titled Hotline to report You will be directed to complete and submit an automated DHS OIG Investigative Referral Submission Form Submission through our website ensures that your complaint will be promptly received and reviewed by DHS OIG
Should you be unable to access our website you may submit your complaint in writing to DHS Office of Inspector General Attention Office of Investigations Hotline 245 Murray Drive SW Building 410Mail Stop 2600 Washington DC 20528 or you may call 1 (800) 323-8603 or fax it directly to us at (202) 254-4297
The OIG seeks to protect the identity of each writer and caller
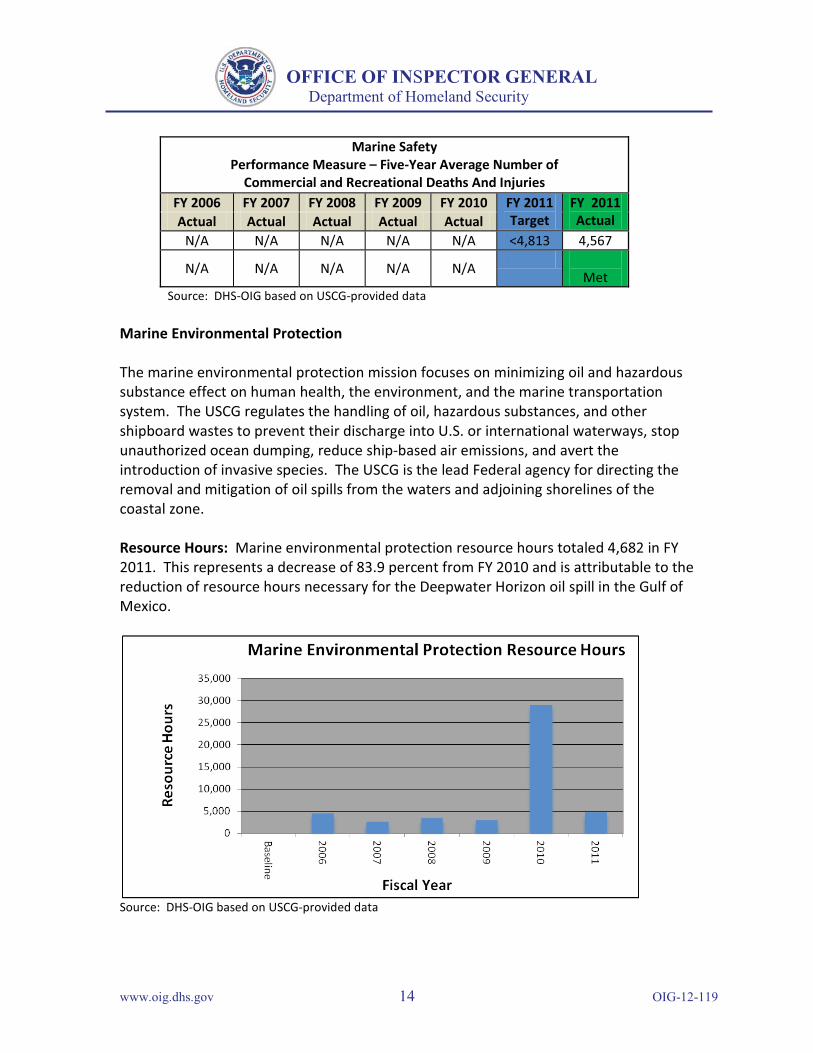
OFFICE OF INSPECTOR GENERAL Department of Homeland Security
Marine Safety Performance Measure ndash Five-Year Average Number of
Commercial and Recreational Deaths And Injuries FY 2006 FY 2007 FY 2008 FY 2009 FY 2010 FY 2011 FY 2011 Actual Actual Actual Actual Actual Target Actual
NA NA NA NA NA lt4813 4567
NA NA NA NA NA Met
Source DHS-OIG based on USCG-provided data
Marine Environmental Protection
The marine environmental protection mission focuses on minimizing oil and hazardous substance effect on human health the environment and the marine transportation system The USCG regulates the handling of oil hazardous substances and other shipboard wastes to prevent their discharge into US or international waterways stop unauthorized ocean dumping reduce ship-based air emissions and avert the introduction of invasive species The USCG is the lead Federal agency for directing the removal and mitigation of oil spills from the waters and adjoining shorelines of the coastal zone
Resource Hours Marine environmental protection resource hours totaled 4682 in FY 2011 This represents a decrease of 839 percent from FY 2010 and is attributable to the reduction of resource hours necessary for the Deepwater Horizon oil spill in the Gulf of Mexico
Source DHS-OIG based on USCG-provided data
wwwoigdhsgov 14 OIG-12-119
Marine Environmental Protection Performance Measure Average Number of Oil Spills in the Maritime Environment
FY 2006 FY 2007 FY 2008 FY 2009 FY 2010 FY 2011 FY 2011 Actual Actual Actual Actual Actual Target Actual 143 139 132 123 115 lt116 102
NA NA Met Met Met Met
Source DHS-OIG based on USCG-provided data
OFFICE OF INSPECTOR GENERAL Department of Homeland Security
Performance Measures and Results Federal regulation requires vessel or facility operators to report the discharge of any hazardous substance that equals or exceeds reportable quantities and requires the reporting of any discharge of oil or oil products that cause a sheen discoloration sludge or emulsion on or below the surface of any navigable waterway of the United States The USCG uses the number of chemical discharge incidents and the number of oil spills greater than 100 gallons as proxy indicators of marine environmental protection and normalizes five-year averages of these as indicators of long-term trends In FY 2011 the USCG reported that it met the target for ldquoAverage Number of Chemical Discharge Incidents in the Maritime Environmentrdquo which was previously reported as ldquo5-Yr Average Chemical Discharge Incidents per 100 Million Short Tons Shippedrdquo
Marine Environmental Protection Performance Measure ndash Average Number of Chemical Discharge
Incidents in the Maritime Environment FY
2006 Actual
FY 2007
Actual
FY 2008
Actual
FY 2009
Actual
FY 2010
Actual
FY FY 2011 2011
Target Actual 278 244 198 187 181 lt220 150
NA NA Met Met Met Met
Source DHS-OIG based on USCG-provided data
USCG also reported that it met the target for ldquoAverage Number of Oil Spills in the Maritime Environmentrdquo which was previously reported as ldquo5-Yr Average Oil Spills gt 100 Gallons per 100 Million Short Tons Shippedrdquo
Search and Rescue
USCG strives to minimize lives lost injury and property loss or damage by rendering aid to those in distress in the maritime environment and elsewhere as called upon The search and rescue mission is accomplished through resource readiness distress monitoring and communication search planning on-scene operations and domestic and international partnerships
wwwoigdhsgov 15 OIG-12-119
OFFICE OF INSPECTOR GENERAL Department of Homeland Security
Resource Hours Search and rescue is a demand-driven mission Requirements for search and rescue increase or decrease relative to the number of people requiring the USCGrsquos assistance Resource hours in FY 2011 totaled 55934 and decreased approximately 13 percent from FY 2010
Source DHS-OIG based on USCG-provided data
0 10000 20000 30000 40000 50000 60000 70000 80000 90000
Baseline
2006
2007
2008
2009
2010
2011 Re
sour
ce H
ours
Search and Rescue Resource Hours
Fiscal Year
Performance Measures and Results USCG met the FY 2011 target for percent of people in imminent danger saved in the maritime environment was not met Though this yearrsquos performance is below the overall target it is more than the 744 percent level posted in FY 2010 In FY 2011 the USCG saved 3804 lives in 20510 cases with 732 lives lost and 390 lives unaccounted for This total excluded outlier cases with more than 10 lives at risk Other than raw numbers of lives saved and lost there is no clear indication of the drivers that led to this decrease The USCG is conducting further analysis is in progress to identify any systemic issues Additionally uncontrollable variables such as weather location incident severity and life saving devices on board continue to influence the number and outcome of search and rescue incidents
Search and Rescue Performance Measure ndash Percent of People in Imminent Danger Saved
in the Maritime Environment FY FY FY FY FY FY FY
2006 2007 2008 2009 2010 2011 2011 Actual Actual Actual Actual Actual Target Actual
76 766 768 773 744 100 773 X X
Met Met Met Met Not Met Not Met Source DHS-OIG based on USCG-provided data
wwwoigdhsgov 16 OIG-12-119
Search and Rescue Performance Measure ndash Percent of Time Rescue Assets are On-Scene
within 2 Hours FY
2006 FY
2007 FY
2008 FY
2009 FY
2010 FY
2011 FY
2011 Actual Actual Actual Actual Actual Target Actual 937 943 933 940 933 100 931
Met Met Met Met Met X
Not Met Source DHS-OIG based on USCG-provided data
OFFICE OF INSPECTOR GENERAL Department of Homeland Security
The FY 2011 target for percent of time rescue assets are on-scene within 2 hours was not met However overall performance is in line with the USCGrsquos expectations based on placement of resources and proximity to shore of the majority of search and rescue incidents and shows consistent performance over the last six years This measure has been adjusted to exclude cases in which an operational decision was made to delay a response Certain determining factors such as weather resource availability and risk assessment delay response time
Aids-to-Navigation
USCG minimizes disruptions to maritime commerce by assessing and mitigating risks to safe navigation It provides and maintains more than 51000 buoys beacons lights and other aids to mark channels and denote hazards
Resource Hours FY 2011 resource hours totaled 98819 and increased approximately 37 percent from FY 2010 This is an approximately 12 percent decrease from the baseline level
wwwoigdhsgov 17 OIG-12-119
Aids-to-Navigation Performance Measure ndash Availability of Maritime Navigation Aids
FY 2006 FY 2007 FY 2008 FY 2009 FY 2010 FY 2011 FY 2011 Actual Actual Actual Actual Actual Target Actual 968 980 983 980 985 975 985
X Not Met Met Met Met Met Met
Source DHS-OIG based on USCG-provided data
Aids-to-Navigation Performance Measure ndash Average Number of Navigational Accidents
FY 2006 FY 2007 FY 2008 FY 2009 FY 2010 FY 2011 FY 2011 Actual Actual Actual Actual Actual Target Actual 1765 1823 1857 1878 1878 1945
X Not Met
X Not Met
X Not Met
X Not Met
X Not Met Met
Source DHS-OIG based on USCG-provided data
OFFICE OF INSPECTOR GENERAL Department of Homeland Security
Source DHS-OIG based on USCG-provided data
Performance Measures and Results The USCG reported that it met its FY 2011 target for the availability of maritime navigation aids for the fifth consecutive year
In FY 2011 the USCG reported that it met its target for the average number of navigational accidents This is the first time this measure was met in the past six years
wwwoigdhsgov 18 OIG-12-119
Ice Operations Performance Measure ndash Number of Days Critical Waterways Are Closed to
Commerce Due to Ice FY 2006 FY 2007 FY 2008 FY 2009 FY 2010 FY 2011 FY 2011 Actual Actual Actual Actual Actual Target Actual
0 0 0 0 6 2 avg amp 8 severe
0
Met Met Met Met X
Not Met Met Source DHS-OIG based on USCG-provided data
OFFICE OF INSPECTOR GENERAL Department of Homeland Security
Ice Operations
This mission supports winter commerce and prevents and responds to ice that causes flooding These activities are essential to winter and spring commerce and the safety of waterside communities on the Great Lakes in New England and on the Hudson River and occasionally in the mid-Atlantic
Resource Hours In FY 2011 resource hours totaled 10747 and decreased approximately 77 percent from FY 2010 which is approximately 10 percent lower than the baseline level
Source DHS-OIG based on USCG-provided data
Performance Measures and Results The USCG reported that it met its FY 2011 target for the number of days critical waterways are closed to commerce due to ice Domestic icebreakers on the Great Lakes assisted over 1700 commercial vessel transits carrying $300 million in bulk commodities Favorable environmental conditions continued partnership with the Canadian Coast Guard and effective employment of domestic icebreaking assets contributed to achieving the performance target
wwwoigdhsgov 19 OIG-12-119
OFFICE OF INSPECTOR GENERAL Department of Homeland Security
Appendix D Homeland Security Missions
The FY 2011 homeland security mission resource hours totaled 355586 and decreased by approximately 05 percent from FY 2010 Between FY 2006 and FY 2011 total resource hours for homeland security missions were the highest in FY 2007 However the FY 2011 level remains at approximately 91 percent above baseline levels as depicted in the following graph
Source DHS-OIG based on USCG-provided data
In FY 2011 the USCG reported that it met or exceeded 5 of 11 summary performance measures for its 5 homeland security missions compared with meeting 2 of 5 summary performance measures in FY 2010 The resource hours and performance measures and results for each non-homeland security mission are summarized below
Ports Waterways and Coastal Security
The ports waterways and coastal security mission aims to deny terrorists the use and exploitation of the maritime domain and marine transportation system as a means for attacks on US territory population centers vessels and maritime critical infrastructure and key resources This mission includes preparedness planning and exercises antiterrorism and counterterrorism activities and initial recovery efforts if attacks are successful
wwwoigdhsgov 20 OIG-12-119
OFFICE OF INSPECTOR GENERAL Department of Homeland Security
Resource Hours In FY 2011 resource hours for ports waterways and coastal security totaled 155969 which is a decrease of 09 percent from FY 2010
Source DHS-OIG based on USCG-provided data
Performance Measures and Results USCG reported that it met three of its six FY 2011 targets for ports waterways and coastal security In FY 2011 the USCG added two new summary measures related to compliance with security regulations and significantly updated the methodology for the FY 2010 summary measure Percent Reduction in Maritime Terrorism Risk over which the USCG has Influence resulting in four maritime security risk measures as shown in the following charts The USCG improved and created a new baseline for the maritime security risk measures in FY 2010 thus FY 2011 results should not be compared to previous years
The revised maritime security risk measures are risk-based outcome measures that begin with an assessment of likely high-consequence maritime terrorist attack scenarios Threat vulnerability and consequence levels are estimated for each scenario which generates a proxy (index) value of raw risk that exists in the maritime domain Next the USCG interventions (security and response operations regime and awareness activities) for the fiscal year are scored against the scenarios with regard to the decreases in threat vulnerability and consequence that each has been estimated to have afforded The resulting measures are proxy measures of performance
As depicted below the USCG reported that it met its FY 2011 target for ldquoPercent Reduction of all Maritime Security Risk Subject to USCG Influencerdquo
wwwoigdhsgov 21 OIG-12-119
Ports Waterways and Coastal Security Performance Measure ndash Percent Reduction of all Maritime Security Risk
Subject to USCG Influence
FY 2006 Actual
FY 2007 Actual
FY 2008 Actual
FY 2009 Actual
FY 2010 Actual
FY 2011 Target
FY 2011 Actual
NA NA NA NA NA 44 44
Met Met Met Met Met Met Source DHS-OIG based on USCG-provided data
OFFICE OF INSPECTOR GENERAL Department of Homeland Security
USCG exceeded its FY 2011 target for Percent Reduction of all Maritime Security Risk Resulting from USCG Consequence Management
Ports Waterways and Coastal Security Performance Measure ndash Percent Reduction of Maritime Security Risk
Resulting from US Coast Guard Consequence Management
FY 2006 Actual
FY 2007 Actual
FY 2008 Actual
FY 2009 Actual
FY 2010 Actual
FY 2011 Target
FY 2011 Actual
NA NA NA NA NA 3 4
Met Met Met Met Met Met Source DHS-OIG based on USCG-provided data
USCG did not meet its target for ldquoPercent Reduction of Maritime Security Risk Resulting from USCG Efforts to Prevent a Terrorist Entering the US via Maritime Meansrdquo This is attributable to lower effectiveness judgments for the Maritime Security Response Team due to the loss of dedicated airlift and the suspension of hook-and-climb training Additionally major cutter capacity decreased due to the decommissioning of one High Endurance Cutter and an overall reduction of major cutter resource hours
Ports Waterways and Coastal Security Performance Measure ndash Percent Reduction of Maritime Security Risk
Resulting from USCG Efforts to Prevent a Terrorist Entering the US via Maritime Means
FY 2006 Actual
FY 2007 Actual
FY 2008 Actual
FY 2009 Actual
FY 2010 Actual
FY 2011 Target
FY 2011 Actual
NA NA NA NA NA 52 43
Met Met Met Met Met Not Met Source DHS-OIG based on USCG-provided data
USCG missed its target for ldquoPercent Reduction of Maritime Security Risk Resulting from USCG Efforts to Prevent a Weapon of Mass Destruction from Entering the United States
wwwoigdhsgov 22 OIG-12-119
Ports Waterways and Coastal Security Performance Measure ndash Percent Reduction of Maritime Security Risk
Resulting from USCG Efforts to Prevent a Weapon of Mass Destruction from Entering the US via Maritime Means
FY 2006 Actual
FY 2007 Actual
FY 2008 Actual
FY 2009 Actual
FY 2010 Actual
FY 2011 Target
FY 2011 Actual
NA NA NA NA NA 29 28
Met Met Met Met Met Not Met
Ports Waterways and Coastal Security Performance Measure ndash Annual Maritime Transportation Security Act Facility
Compliance Rate with Transportation Worker Identification Credential Regulations
FY 2006 Actual
FY 2007 Actual
FY 2008 Actual
FY 2009 Actual
FY 2010 Actual
FY 2011 Target
FY 2011 Actual
NA NA NA NA 100 85 99
NA NA NA NA Met Met
Source DHS-OIG based on USCG-provided data
OFFICE OF INSPECTOR GENERAL Department of Homeland Security
via Maritime Meansrdquo by one percentage point This is attributable to lower effectiveness judgments for the Maritime Security Response Team due to loss of dedicated airlift and the challenges of identifying a broad range of Weapons of Mass Destruction amongst the volume of legitimate shipping cargo Additionally major cutter capacity decreased due to the decommissioning of one High Endurance Cutter and an overall reduction of major cutter resource hours
Source DHS-OIG based on USCG-provided data
USCG exceeded its FY 2011 target for ldquoAnnual Maritime Transportation Security Act Facility Compliance Rate with Transportation Worker Identification Credential Regulationsrdquo
USCG missed its target for ldquoPercent of Maritime Facilities in Compliance with Security Regulationsrdquo by only one-tenth of one percent The USCG has focused the use of its personnel resources to conduct Maritime Transportation Security Act compliance exams at waterfront facilities that are at higher risk for a transportation security incident By increasing partnerships with these facilities 999 percent of regulated facilities did not have serious deficiencies warranting a notice of violation or civil penalty in FY 2011
wwwoigdhsgov 23 OIG-12-119
Ports Waterways and Coastal Security Performance Measure ndash Percent Of Maritime Facilities in Compliance with
Security Regulations
FY 2006 Actual
FY 2007 Actual
FY 2008 Actual
FY 2009 Actual
FY 2010 Actual
FY 2011 Target
FY 2011 Actual
NA NA NA NA NA 100 999
NA NA NA NA NA Not Met
Source DHS-OIG based on USCG-provided data
OFFICE OF INSPECTOR GENERAL Department of Homeland Security
Drug Interdiction
USCGrsquos drug interdiction efforts support national strategies to disrupt the market for illegal drugs and prevent transnational threats from reaching the United States The USCG is the lead Federal agency for drug interdiction on the high seas and shares the lead for drug interdiction in the territorial seas of the US with Customs and Border Protection The USCG coordinates with its interagency partners to deter illicit drug trafficking including the Department of Defense Department of Justice Department of State and other components within DHS
Resource Hours FY 2011 resource hours totaled 73401 and increased by approximately 9 percent from FY 2010 but are about 40 percent below baseline levels
Source DHS-OIG based on USCG-provided data
Performance Measures and Results The USCG uses the interagency Consolidated Counter Drug Database as its main source for tracking cocaine movement estimates
wwwoigdhsgov 24 OIG-12-119
Drug Interdiction Performance Measure ndash Removal Rate for Cocaine from Non-commercial
Vessels in Maritime Transit Zone FY 2006 FY 2007 FY 2008 FY 2009 FY 2010 FY 2011 FY 2011 Actual Actual Actual Actual Actual Target Actual
NA NA NA 150 135 155 116
NA NA NA X
Not Met X
Not Met X
Not Met Source DHS-OIG based on USCG-provided data
OFFICE OF INSPECTOR GENERAL Department of Homeland Security
The one performance measure related to Drug Interdiction ldquoRemoval Rate for Cocaine from Non-commercial Vessels in Maritime Transit Zonerdquo was not met in FY 2011 According to the USCG the reasons for not meeting this target can be attributed to reduced asset and resource availability smaller average load sizes of cocaine and increasingly sophisticated criminal organizations
Migrant Interdiction
USCG migrant interdiction policy and operations are designed to provide effective law enforcement presence at sea and achieve three main objectives (1) deter undocumented migrants and transnational human smugglers from using maritime routes to enter the US (2) detect and interdict undocumented migrants and human smugglers far from the US border and (3) expand USCG participation in multi-agency and bi-national border security initiatives While the USCG leads the interdiction mission on the high seas it partners with Customs and Border Protection and Immigration and Customs Enforcement for shore-side interdiction operations
Resource Hours Migrant interdiction resource hours remain approximately 144 percent above baseline levels In FY 2011 resource hours totaled 72213 and decreased approximately 60 percent from FY 2010 to FY 2011
wwwoigdhsgov 25 OIG-12-119
Migrant Interdiction Performance Measure ndash Percentage of Undocumented Migrants who
Attempt to Enter the United States Via Maritime Routes that are Interdicted
FY 2006 Actual
FY 2007 Actual
FY 2008 Actual
FY 2009 Actual
FY 2010 Actual
FY 2011 Target
FY 2011 Actual
NA 652 627 844 645 739 728
NA Not Met Not Met Met Not Met Not Met
OFFICE OF INSPECTOR GENERAL Department of Homeland Security
Source DHS-OIG based on USCG-provided data
Performance Measures and Results According to the USCG the number of undocumented migrants attempting to enter the US remained low in FY 2011 compared to numbers observed over the last decade due in part to a slumping US economy successful prosecution of smugglers effective bilateral cooperation and use of biometrics The USCG reported that it met one of its two performance measures related to migrant interdiction in FY 2011 Although the USCG did not meet the target for ldquoPercentage of Undocumented Migrants who Attempt to Enter the United States via Maritime Routes that are Interdictedrdquo the actual result of 728 percent was an improvement over FY 2010rsquos 645 percent This measure includes migrants who are interdicted by foreign counterparts of the USCG many of whom have fewer resources than the USCG
Source DHS-OIG based on USCG-provided data
As shown in the table below the USCG exceeded its target for the ldquoPercent of Undocumented Migrants who Attempt to Enter the United States via Maritime Routes Interdicted by the Coast Guardrdquo
wwwoigdhsgov 26 OIG-12-119
Migrant Interdiction Performance Measure ndash Percent of Undocumented Migrants who Attempt to Enter the United States via Maritime Routes Interdicted by the Coast Guard
FY 2006 Actual
FY 2007 Actual
FY 2008 Actual
FY 2009 Actual
FY 2010 Actual
FY 2011 Target
FY 2011 Actual
NA 421 469 375 447 430 517
NA NA Not Met Not Met Met Met
Source DHS-OIG based on USCG-provided data
OFFICE OF INSPECTOR GENERAL Department of Homeland Security
Defense Readiness
The USCG maintains a level of readiness and training that allows for the immediate integration with Department of Defense forces for peacetime operations or during times of war This supports US national interests abroad as well as facilitating support to DHS for the integration of Homeland Defense and Homeland Security
Resource Hours In FY 2011 resource hours for Defense Readiness totaled 41424 and were still above the baseline although resource hours decreased by 119 percent from FY 2010 to FY 2011
Source DHS-OIG based on USCG-provided data
Performance Measures and Results The USCG did not meet its overall target of 381 percent defense readiness for the year The declining readiness of the USCGrsquos High Endurance Cutter fleet continues to present significant challenges to mission
wwwoigdhsgov 27 OIG-12-119
Defense Readiness Performance Measure ndash Defense Readiness Assessment of all USCG High-
Endurance Cutters Patrol Boats and Port Security Units
FY 2006 Actual
FY 2007 Actual
FY 2008 Actual
FY 2009 Actual
FY 2010 Actual
FY 2011 Target
FY 2011 Actual
NA NA NA NA 241 381 251
NA NA NA NA Not Met Not Met
Source DHS-OIG based on USCG-provided data
OFFICE OF INSPECTOR GENERAL Department of Homeland Security
performance High Endurance Cutter readiness is being addressed by the USCGrsquos acquisition of the National Security Cutter
Other Law Enforcement
The other law enforcement mission orchestrates the enforcement of regulations on foreign fishing vessels This enforcement takes two forms the first is the deterrence detection and interdiction of illegal incursions into the US exclusive economic zone by foreign fishing vessels 1 The protection of the US exclusive economic zone from incursions by foreign fishing vessels contributes to a fundamental USCG maritime security objective to protect our Nationrsquos renewable natural resources The second part of the other law enforcement mission is to ensure compliance with international agreements for the management of living marine resources This is primarily accomplished through enforcement on foreign fishing vessels of conservation and management measures created by regional fishery management organizations
Resource Hours In FY 2011 resource hours for the other law enforcement mission totaled 12579 which is an increase of 445 percent from FY 2010 According to the USCG this increase in resource hours was due to increased patrols for illegal unregulated and unreported fishing activity
1 The exclusive economic zone is the zone where the US and other coastal nations have jurisdiction over economic and resource management The exclusive economic zone includes waters three to 200 miles offshore (or nine to 200 miles offshore in western Florida and Texas)
wwwoigdhsgov 28 OIG-12-119
OFFICE OF INSPECTOR GENERAL Department of Homeland Security
Source DHS-OIG based on USCG-provided data
Performance Measures and Results The USCG uses the number of detected incursions into the US Exclusive Economic Zone by foreign fishing vessels as a measure of its performance In FY 2011 there were 122 detected incursions of foreign fishing vessels into the US Exclusive Economic Zone which met the performance target of fewer than 180 incursions
Other Law Enforcement Performance Measure ndash Number of Detected Incursions of Foreign Fishing
Vessels violating US Waters
FY 2006 Actual
FY 2007 Actual
FY 2008 Actual
FY 2009 Actual
FY 2010 Actual
FY 2011 Target
FY 2011 Actual
164 126 81 112 82 lt180 122
Met Met Met Met Met Met Source DHS-OIG based on USCG-provided data
wwwoigdhsgov 29 OIG-12-119
Mission Measure Met Not Met
Non-Homeland Security Missions
Search and Rescue Percentage of People in Imminent Danger Saved in the Maritime Environment
X
Percent of Time Rescue Assets are On-Scene within 2 Hours X
Aids-to-Navigation Availability of Maritime Navigation Aids X Average Number of Navigational Accidents X
Ice Operations Number of Days Critical Waterways Are Closed to Commerce Due to Ice X Living Marine Resources Fishing Regulation Compliance Rate X
Marine Safety
5-Yr Average Number of Commercial and Recreational Deaths and Injuries
X
5-Yr Average Number of Commercial Mariner Deaths and Injuries X
5-Yr Average Number of Commercial Passenger Deaths and Injuries X
5-Yr Average Number of Recreational Boating Deaths and Injuries X
Marine Environmental Protection
Average Number of Chemical Discharge Incidents in the Maritime Environment
X
Average Number of Oil Spills in the Maritime Environment X Total Non-Homeland Security Performance Measures 9 3
Homeland Security Missions
Ports Waterways and Coastal Security
Percentage Reduction of all Maritime Security Risk Subject to USCG Influence
X
Percent Reduction of Maritime Security Risk Resulting from USCG Consequence Management
X
Percent Reduction of Maritime Security Risk Resulting from USCG Efforts to Prevent a Terrorist Entering the US via Maritime Means
X
Percent Reduction of Maritime Security Risk Resulting from USCG Efforts to Prevent a Weapon of Mass Destruction from Entering the US via Maritime Means
X
Annual MTSA Facility Compliance Rate with Transportation Worker Identification Credential Regulations
X
Percent of Maritime Facilities In Compliance with Security Regulations X
Drug Interdiction Removal Rate for Cocaine from Non-commercial Vessels in Maritime Transit Zone
X
Migrant Interdiction
Percentage of Undocumented Migrants who Attempt to Enter the United States Via Maritime Routes that are Interdicted
X
Percent of Undocumented Migrants who Attempt to Enter the US by Maritime Routes Interdicted by the USCG
X
Defense Readiness Defense Readiness Assessment of all USCG High-Endurance Cutters Patrol Boats and Port Security Units
X
Other Law Enforcement Number of Detected Incursions of Foreign Fishing Vessels Violating US Waters
X
Total Homeland Security Performance Measures 5 6
Total USCG Performance Measures 14 9 Source DHS-OIG based on USCG-provided data
OFFICE OF INSPECTOR GENERAL Department of Homeland Security
Appendix E FY 2011 Performance Measure Summary
wwwoigdhsgov 30 OIG-12-119
OFFICE OF INSPECTOR GENERAL Department of Homeland Security
Appendix F Major Contributors to This Report
Brooke Bebow Director Lisa Vonder Haar Audit Manager Stephen Doran Auditor Richard Joyce Program Analyst Marisa Coccaro Referencer
wwwoigdhsgov 31 OIG-12-119
OFFICE OF INSPECTOR GENERAL Department of Homeland Security
Appendix G Report Distribution
Department of Homeland Security
Secretary Deputy Secretary Chief of Staff Deputy Chief of Staff General Counsel Executive Secretary Director GAOOIG Liaison Office Assistant Secretary for Office of Policy Assistant Secretary for Office of Public Affairs Assistant Secretary for Office of Legislative Affairs Acting Chief Privacy Officer
United States Coast Guard
Commandant Assistant Commandant for Resources and Chief Financial Officer USCG Audit Liaison
Office of Management and Budget
Chief Homeland Security Branch DHS OIG Budget Examiner
Congress
Congressional Oversight and Appropriations Committees as appropriate
wwwoigdhsgov 32 OIG-12-119
ADDITIONAL INFORMATION AND COPIES
To obtain additional copies of this document please call us at (202) 254-4100 fax your request to (202) 254-4305 or e-mail your request to our Office of Inspector General (OIG) Office of Public Affairs at DHS-OIGOfficePublicAffairsoigdhsgov
For additional information visit our website at wwwoigdhsgov or follow us on Twitter at dhsoig
OIG HOTLINE
To expedite the reporting of alleged fraud waste abuse or mismanagement or any other kinds of criminal or noncriminal misconduct relative to Department of Homeland Security (DHS) programs and operations please visit our website at wwwoigdhsgov and click on the red tab titled Hotline to report You will be directed to complete and submit an automated DHS OIG Investigative Referral Submission Form Submission through our website ensures that your complaint will be promptly received and reviewed by DHS OIG
Should you be unable to access our website you may submit your complaint in writing to DHS Office of Inspector General Attention Office of Investigations Hotline 245 Murray Drive SW Building 410Mail Stop 2600 Washington DC 20528 or you may call 1 (800) 323-8603 or fax it directly to us at (202) 254-4297
The OIG seeks to protect the identity of each writer and caller
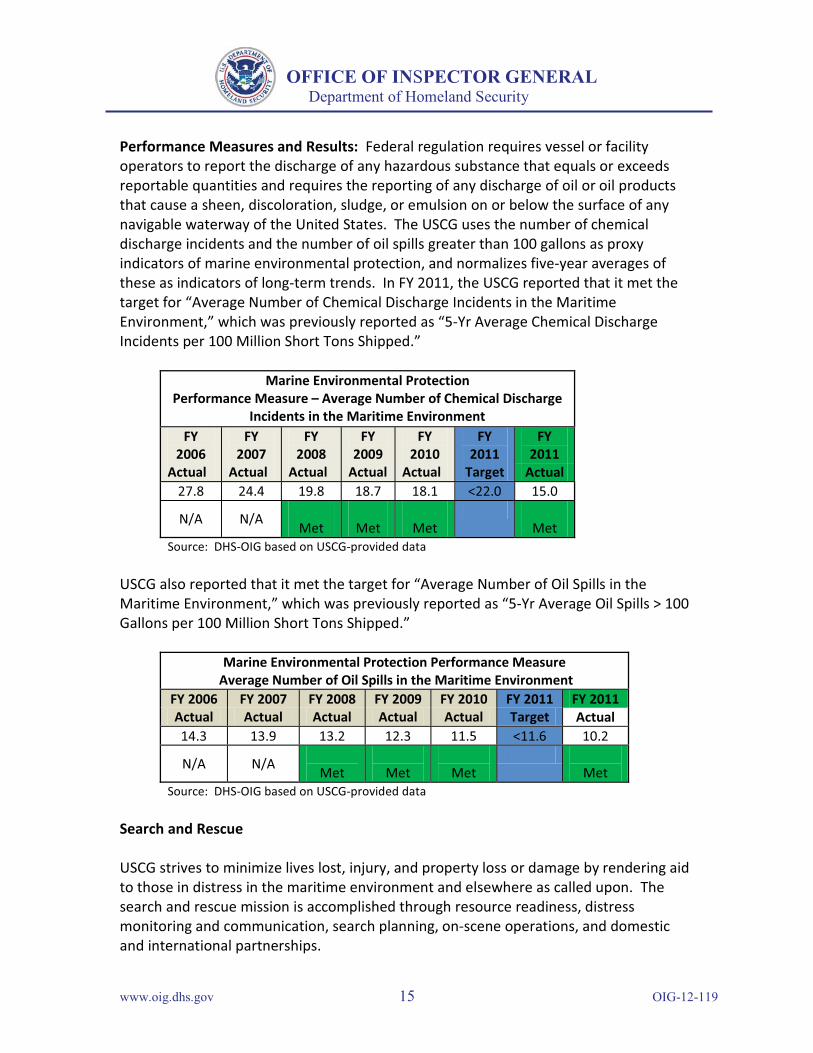
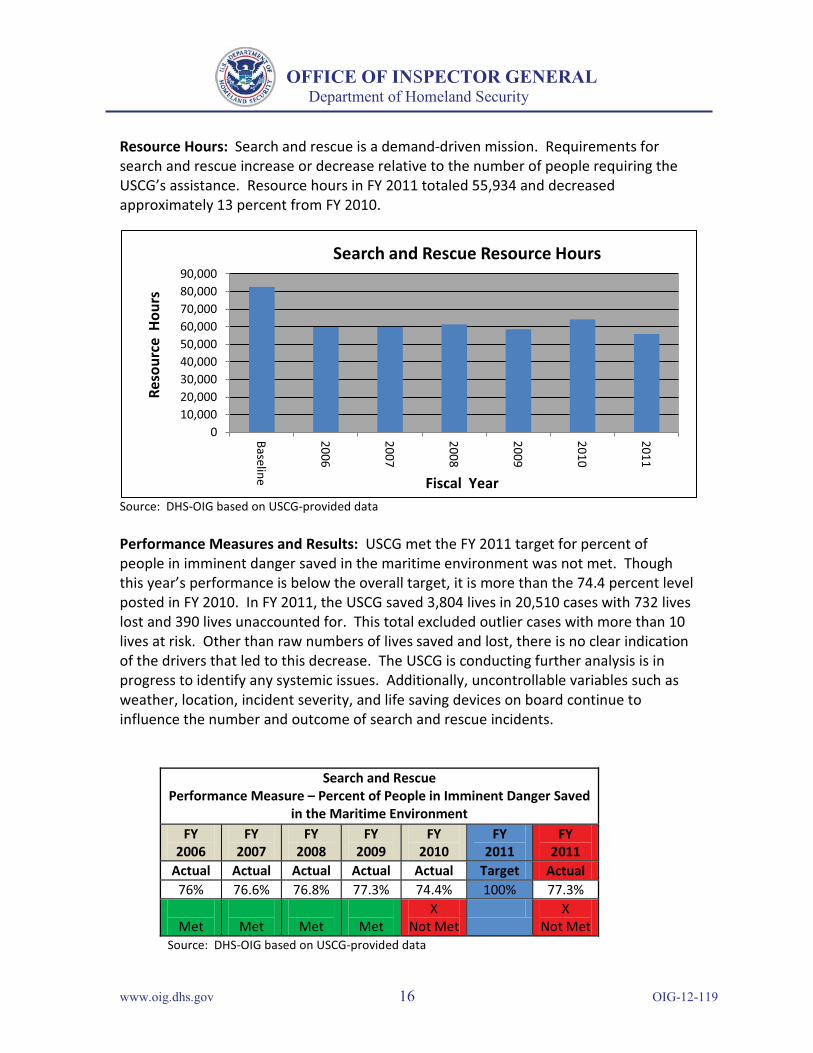
OFFICE OF INSPECTOR GENERAL Department of Homeland Security
Resource Hours Search and rescue is a demand-driven mission Requirements for search and rescue increase or decrease relative to the number of people requiring the USCGrsquos assistance Resource hours in FY 2011 totaled 55934 and decreased approximately 13 percent from FY 2010
Source DHS-OIG based on USCG-provided data
0 10000 20000 30000 40000 50000 60000 70000 80000 90000
Baseline
2006
2007
2008
2009
2010
2011 Re
sour
ce H
ours
Search and Rescue Resource Hours
Fiscal Year
Performance Measures and Results USCG met the FY 2011 target for percent of people in imminent danger saved in the maritime environment was not met Though this yearrsquos performance is below the overall target it is more than the 744 percent level posted in FY 2010 In FY 2011 the USCG saved 3804 lives in 20510 cases with 732 lives lost and 390 lives unaccounted for This total excluded outlier cases with more than 10 lives at risk Other than raw numbers of lives saved and lost there is no clear indication of the drivers that led to this decrease The USCG is conducting further analysis is in progress to identify any systemic issues Additionally uncontrollable variables such as weather location incident severity and life saving devices on board continue to influence the number and outcome of search and rescue incidents
Search and Rescue Performance Measure ndash Percent of People in Imminent Danger Saved
in the Maritime Environment FY FY FY FY FY FY FY
2006 2007 2008 2009 2010 2011 2011 Actual Actual Actual Actual Actual Target Actual
76 766 768 773 744 100 773 X X
Met Met Met Met Not Met Not Met Source DHS-OIG based on USCG-provided data
wwwoigdhsgov 16 OIG-12-119
Search and Rescue Performance Measure ndash Percent of Time Rescue Assets are On-Scene
within 2 Hours FY
2006 FY
2007 FY
2008 FY
2009 FY
2010 FY
2011 FY
2011 Actual Actual Actual Actual Actual Target Actual 937 943 933 940 933 100 931
Met Met Met Met Met X
Not Met Source DHS-OIG based on USCG-provided data
OFFICE OF INSPECTOR GENERAL Department of Homeland Security
The FY 2011 target for percent of time rescue assets are on-scene within 2 hours was not met However overall performance is in line with the USCGrsquos expectations based on placement of resources and proximity to shore of the majority of search and rescue incidents and shows consistent performance over the last six years This measure has been adjusted to exclude cases in which an operational decision was made to delay a response Certain determining factors such as weather resource availability and risk assessment delay response time
Aids-to-Navigation
USCG minimizes disruptions to maritime commerce by assessing and mitigating risks to safe navigation It provides and maintains more than 51000 buoys beacons lights and other aids to mark channels and denote hazards
Resource Hours FY 2011 resource hours totaled 98819 and increased approximately 37 percent from FY 2010 This is an approximately 12 percent decrease from the baseline level
wwwoigdhsgov 17 OIG-12-119
Aids-to-Navigation Performance Measure ndash Availability of Maritime Navigation Aids
FY 2006 FY 2007 FY 2008 FY 2009 FY 2010 FY 2011 FY 2011 Actual Actual Actual Actual Actual Target Actual 968 980 983 980 985 975 985
X Not Met Met Met Met Met Met
Source DHS-OIG based on USCG-provided data
Aids-to-Navigation Performance Measure ndash Average Number of Navigational Accidents
FY 2006 FY 2007 FY 2008 FY 2009 FY 2010 FY 2011 FY 2011 Actual Actual Actual Actual Actual Target Actual 1765 1823 1857 1878 1878 1945
X Not Met
X Not Met
X Not Met
X Not Met
X Not Met Met
Source DHS-OIG based on USCG-provided data
OFFICE OF INSPECTOR GENERAL Department of Homeland Security
Source DHS-OIG based on USCG-provided data
Performance Measures and Results The USCG reported that it met its FY 2011 target for the availability of maritime navigation aids for the fifth consecutive year
In FY 2011 the USCG reported that it met its target for the average number of navigational accidents This is the first time this measure was met in the past six years
wwwoigdhsgov 18 OIG-12-119
Ice Operations Performance Measure ndash Number of Days Critical Waterways Are Closed to
Commerce Due to Ice FY 2006 FY 2007 FY 2008 FY 2009 FY 2010 FY 2011 FY 2011 Actual Actual Actual Actual Actual Target Actual
0 0 0 0 6 2 avg amp 8 severe
0
Met Met Met Met X
Not Met Met Source DHS-OIG based on USCG-provided data
OFFICE OF INSPECTOR GENERAL Department of Homeland Security
Ice Operations
This mission supports winter commerce and prevents and responds to ice that causes flooding These activities are essential to winter and spring commerce and the safety of waterside communities on the Great Lakes in New England and on the Hudson River and occasionally in the mid-Atlantic
Resource Hours In FY 2011 resource hours totaled 10747 and decreased approximately 77 percent from FY 2010 which is approximately 10 percent lower than the baseline level
Source DHS-OIG based on USCG-provided data
Performance Measures and Results The USCG reported that it met its FY 2011 target for the number of days critical waterways are closed to commerce due to ice Domestic icebreakers on the Great Lakes assisted over 1700 commercial vessel transits carrying $300 million in bulk commodities Favorable environmental conditions continued partnership with the Canadian Coast Guard and effective employment of domestic icebreaking assets contributed to achieving the performance target
wwwoigdhsgov 19 OIG-12-119
OFFICE OF INSPECTOR GENERAL Department of Homeland Security
Appendix D Homeland Security Missions
The FY 2011 homeland security mission resource hours totaled 355586 and decreased by approximately 05 percent from FY 2010 Between FY 2006 and FY 2011 total resource hours for homeland security missions were the highest in FY 2007 However the FY 2011 level remains at approximately 91 percent above baseline levels as depicted in the following graph
Source DHS-OIG based on USCG-provided data
In FY 2011 the USCG reported that it met or exceeded 5 of 11 summary performance measures for its 5 homeland security missions compared with meeting 2 of 5 summary performance measures in FY 2010 The resource hours and performance measures and results for each non-homeland security mission are summarized below
Ports Waterways and Coastal Security
The ports waterways and coastal security mission aims to deny terrorists the use and exploitation of the maritime domain and marine transportation system as a means for attacks on US territory population centers vessels and maritime critical infrastructure and key resources This mission includes preparedness planning and exercises antiterrorism and counterterrorism activities and initial recovery efforts if attacks are successful
wwwoigdhsgov 20 OIG-12-119
OFFICE OF INSPECTOR GENERAL Department of Homeland Security
Resource Hours In FY 2011 resource hours for ports waterways and coastal security totaled 155969 which is a decrease of 09 percent from FY 2010
Source DHS-OIG based on USCG-provided data
Performance Measures and Results USCG reported that it met three of its six FY 2011 targets for ports waterways and coastal security In FY 2011 the USCG added two new summary measures related to compliance with security regulations and significantly updated the methodology for the FY 2010 summary measure Percent Reduction in Maritime Terrorism Risk over which the USCG has Influence resulting in four maritime security risk measures as shown in the following charts The USCG improved and created a new baseline for the maritime security risk measures in FY 2010 thus FY 2011 results should not be compared to previous years
The revised maritime security risk measures are risk-based outcome measures that begin with an assessment of likely high-consequence maritime terrorist attack scenarios Threat vulnerability and consequence levels are estimated for each scenario which generates a proxy (index) value of raw risk that exists in the maritime domain Next the USCG interventions (security and response operations regime and awareness activities) for the fiscal year are scored against the scenarios with regard to the decreases in threat vulnerability and consequence that each has been estimated to have afforded The resulting measures are proxy measures of performance
As depicted below the USCG reported that it met its FY 2011 target for ldquoPercent Reduction of all Maritime Security Risk Subject to USCG Influencerdquo
wwwoigdhsgov 21 OIG-12-119
Ports Waterways and Coastal Security Performance Measure ndash Percent Reduction of all Maritime Security Risk
Subject to USCG Influence
FY 2006 Actual
FY 2007 Actual
FY 2008 Actual
FY 2009 Actual
FY 2010 Actual
FY 2011 Target
FY 2011 Actual
NA NA NA NA NA 44 44
Met Met Met Met Met Met Source DHS-OIG based on USCG-provided data
OFFICE OF INSPECTOR GENERAL Department of Homeland Security
USCG exceeded its FY 2011 target for Percent Reduction of all Maritime Security Risk Resulting from USCG Consequence Management
Ports Waterways and Coastal Security Performance Measure ndash Percent Reduction of Maritime Security Risk
Resulting from US Coast Guard Consequence Management
FY 2006 Actual
FY 2007 Actual
FY 2008 Actual
FY 2009 Actual
FY 2010 Actual
FY 2011 Target
FY 2011 Actual
NA NA NA NA NA 3 4
Met Met Met Met Met Met Source DHS-OIG based on USCG-provided data
USCG did not meet its target for ldquoPercent Reduction of Maritime Security Risk Resulting from USCG Efforts to Prevent a Terrorist Entering the US via Maritime Meansrdquo This is attributable to lower effectiveness judgments for the Maritime Security Response Team due to the loss of dedicated airlift and the suspension of hook-and-climb training Additionally major cutter capacity decreased due to the decommissioning of one High Endurance Cutter and an overall reduction of major cutter resource hours
Ports Waterways and Coastal Security Performance Measure ndash Percent Reduction of Maritime Security Risk
Resulting from USCG Efforts to Prevent a Terrorist Entering the US via Maritime Means
FY 2006 Actual
FY 2007 Actual
FY 2008 Actual
FY 2009 Actual
FY 2010 Actual
FY 2011 Target
FY 2011 Actual
NA NA NA NA NA 52 43
Met Met Met Met Met Not Met Source DHS-OIG based on USCG-provided data
USCG missed its target for ldquoPercent Reduction of Maritime Security Risk Resulting from USCG Efforts to Prevent a Weapon of Mass Destruction from Entering the United States
wwwoigdhsgov 22 OIG-12-119
Ports Waterways and Coastal Security Performance Measure ndash Percent Reduction of Maritime Security Risk
Resulting from USCG Efforts to Prevent a Weapon of Mass Destruction from Entering the US via Maritime Means
FY 2006 Actual
FY 2007 Actual
FY 2008 Actual
FY 2009 Actual
FY 2010 Actual
FY 2011 Target
FY 2011 Actual
NA NA NA NA NA 29 28
Met Met Met Met Met Not Met
Ports Waterways and Coastal Security Performance Measure ndash Annual Maritime Transportation Security Act Facility
Compliance Rate with Transportation Worker Identification Credential Regulations
FY 2006 Actual
FY 2007 Actual
FY 2008 Actual
FY 2009 Actual
FY 2010 Actual
FY 2011 Target
FY 2011 Actual
NA NA NA NA 100 85 99
NA NA NA NA Met Met
Source DHS-OIG based on USCG-provided data
OFFICE OF INSPECTOR GENERAL Department of Homeland Security
via Maritime Meansrdquo by one percentage point This is attributable to lower effectiveness judgments for the Maritime Security Response Team due to loss of dedicated airlift and the challenges of identifying a broad range of Weapons of Mass Destruction amongst the volume of legitimate shipping cargo Additionally major cutter capacity decreased due to the decommissioning of one High Endurance Cutter and an overall reduction of major cutter resource hours
Source DHS-OIG based on USCG-provided data
USCG exceeded its FY 2011 target for ldquoAnnual Maritime Transportation Security Act Facility Compliance Rate with Transportation Worker Identification Credential Regulationsrdquo
USCG missed its target for ldquoPercent of Maritime Facilities in Compliance with Security Regulationsrdquo by only one-tenth of one percent The USCG has focused the use of its personnel resources to conduct Maritime Transportation Security Act compliance exams at waterfront facilities that are at higher risk for a transportation security incident By increasing partnerships with these facilities 999 percent of regulated facilities did not have serious deficiencies warranting a notice of violation or civil penalty in FY 2011
wwwoigdhsgov 23 OIG-12-119
Ports Waterways and Coastal Security Performance Measure ndash Percent Of Maritime Facilities in Compliance with
Security Regulations
FY 2006 Actual
FY 2007 Actual
FY 2008 Actual
FY 2009 Actual
FY 2010 Actual
FY 2011 Target
FY 2011 Actual
NA NA NA NA NA 100 999
NA NA NA NA NA Not Met
Source DHS-OIG based on USCG-provided data
OFFICE OF INSPECTOR GENERAL Department of Homeland Security
Drug Interdiction
USCGrsquos drug interdiction efforts support national strategies to disrupt the market for illegal drugs and prevent transnational threats from reaching the United States The USCG is the lead Federal agency for drug interdiction on the high seas and shares the lead for drug interdiction in the territorial seas of the US with Customs and Border Protection The USCG coordinates with its interagency partners to deter illicit drug trafficking including the Department of Defense Department of Justice Department of State and other components within DHS
Resource Hours FY 2011 resource hours totaled 73401 and increased by approximately 9 percent from FY 2010 but are about 40 percent below baseline levels
Source DHS-OIG based on USCG-provided data
Performance Measures and Results The USCG uses the interagency Consolidated Counter Drug Database as its main source for tracking cocaine movement estimates
wwwoigdhsgov 24 OIG-12-119
Drug Interdiction Performance Measure ndash Removal Rate for Cocaine from Non-commercial
Vessels in Maritime Transit Zone FY 2006 FY 2007 FY 2008 FY 2009 FY 2010 FY 2011 FY 2011 Actual Actual Actual Actual Actual Target Actual
NA NA NA 150 135 155 116
NA NA NA X
Not Met X
Not Met X
Not Met Source DHS-OIG based on USCG-provided data
OFFICE OF INSPECTOR GENERAL Department of Homeland Security
The one performance measure related to Drug Interdiction ldquoRemoval Rate for Cocaine from Non-commercial Vessels in Maritime Transit Zonerdquo was not met in FY 2011 According to the USCG the reasons for not meeting this target can be attributed to reduced asset and resource availability smaller average load sizes of cocaine and increasingly sophisticated criminal organizations
Migrant Interdiction
USCG migrant interdiction policy and operations are designed to provide effective law enforcement presence at sea and achieve three main objectives (1) deter undocumented migrants and transnational human smugglers from using maritime routes to enter the US (2) detect and interdict undocumented migrants and human smugglers far from the US border and (3) expand USCG participation in multi-agency and bi-national border security initiatives While the USCG leads the interdiction mission on the high seas it partners with Customs and Border Protection and Immigration and Customs Enforcement for shore-side interdiction operations
Resource Hours Migrant interdiction resource hours remain approximately 144 percent above baseline levels In FY 2011 resource hours totaled 72213 and decreased approximately 60 percent from FY 2010 to FY 2011
wwwoigdhsgov 25 OIG-12-119
Migrant Interdiction Performance Measure ndash Percentage of Undocumented Migrants who
Attempt to Enter the United States Via Maritime Routes that are Interdicted
FY 2006 Actual
FY 2007 Actual
FY 2008 Actual
FY 2009 Actual
FY 2010 Actual
FY 2011 Target
FY 2011 Actual
NA 652 627 844 645 739 728
NA Not Met Not Met Met Not Met Not Met
OFFICE OF INSPECTOR GENERAL Department of Homeland Security
Source DHS-OIG based on USCG-provided data
Performance Measures and Results According to the USCG the number of undocumented migrants attempting to enter the US remained low in FY 2011 compared to numbers observed over the last decade due in part to a slumping US economy successful prosecution of smugglers effective bilateral cooperation and use of biometrics The USCG reported that it met one of its two performance measures related to migrant interdiction in FY 2011 Although the USCG did not meet the target for ldquoPercentage of Undocumented Migrants who Attempt to Enter the United States via Maritime Routes that are Interdictedrdquo the actual result of 728 percent was an improvement over FY 2010rsquos 645 percent This measure includes migrants who are interdicted by foreign counterparts of the USCG many of whom have fewer resources than the USCG
Source DHS-OIG based on USCG-provided data
As shown in the table below the USCG exceeded its target for the ldquoPercent of Undocumented Migrants who Attempt to Enter the United States via Maritime Routes Interdicted by the Coast Guardrdquo
wwwoigdhsgov 26 OIG-12-119
Migrant Interdiction Performance Measure ndash Percent of Undocumented Migrants who Attempt to Enter the United States via Maritime Routes Interdicted by the Coast Guard
FY 2006 Actual
FY 2007 Actual
FY 2008 Actual
FY 2009 Actual
FY 2010 Actual
FY 2011 Target
FY 2011 Actual
NA 421 469 375 447 430 517
NA NA Not Met Not Met Met Met
Source DHS-OIG based on USCG-provided data
OFFICE OF INSPECTOR GENERAL Department of Homeland Security
Defense Readiness
The USCG maintains a level of readiness and training that allows for the immediate integration with Department of Defense forces for peacetime operations or during times of war This supports US national interests abroad as well as facilitating support to DHS for the integration of Homeland Defense and Homeland Security
Resource Hours In FY 2011 resource hours for Defense Readiness totaled 41424 and were still above the baseline although resource hours decreased by 119 percent from FY 2010 to FY 2011
Source DHS-OIG based on USCG-provided data
Performance Measures and Results The USCG did not meet its overall target of 381 percent defense readiness for the year The declining readiness of the USCGrsquos High Endurance Cutter fleet continues to present significant challenges to mission
wwwoigdhsgov 27 OIG-12-119
Defense Readiness Performance Measure ndash Defense Readiness Assessment of all USCG High-
Endurance Cutters Patrol Boats and Port Security Units
FY 2006 Actual
FY 2007 Actual
FY 2008 Actual
FY 2009 Actual
FY 2010 Actual
FY 2011 Target
FY 2011 Actual
NA NA NA NA 241 381 251
NA NA NA NA Not Met Not Met
Source DHS-OIG based on USCG-provided data
OFFICE OF INSPECTOR GENERAL Department of Homeland Security
performance High Endurance Cutter readiness is being addressed by the USCGrsquos acquisition of the National Security Cutter
Other Law Enforcement
The other law enforcement mission orchestrates the enforcement of regulations on foreign fishing vessels This enforcement takes two forms the first is the deterrence detection and interdiction of illegal incursions into the US exclusive economic zone by foreign fishing vessels 1 The protection of the US exclusive economic zone from incursions by foreign fishing vessels contributes to a fundamental USCG maritime security objective to protect our Nationrsquos renewable natural resources The second part of the other law enforcement mission is to ensure compliance with international agreements for the management of living marine resources This is primarily accomplished through enforcement on foreign fishing vessels of conservation and management measures created by regional fishery management organizations
Resource Hours In FY 2011 resource hours for the other law enforcement mission totaled 12579 which is an increase of 445 percent from FY 2010 According to the USCG this increase in resource hours was due to increased patrols for illegal unregulated and unreported fishing activity
1 The exclusive economic zone is the zone where the US and other coastal nations have jurisdiction over economic and resource management The exclusive economic zone includes waters three to 200 miles offshore (or nine to 200 miles offshore in western Florida and Texas)
wwwoigdhsgov 28 OIG-12-119
OFFICE OF INSPECTOR GENERAL Department of Homeland Security
Source DHS-OIG based on USCG-provided data
Performance Measures and Results The USCG uses the number of detected incursions into the US Exclusive Economic Zone by foreign fishing vessels as a measure of its performance In FY 2011 there were 122 detected incursions of foreign fishing vessels into the US Exclusive Economic Zone which met the performance target of fewer than 180 incursions
Other Law Enforcement Performance Measure ndash Number of Detected Incursions of Foreign Fishing
Vessels violating US Waters
FY 2006 Actual
FY 2007 Actual
FY 2008 Actual
FY 2009 Actual
FY 2010 Actual
FY 2011 Target
FY 2011 Actual
164 126 81 112 82 lt180 122
Met Met Met Met Met Met Source DHS-OIG based on USCG-provided data
wwwoigdhsgov 29 OIG-12-119
Mission Measure Met Not Met
Non-Homeland Security Missions
Search and Rescue Percentage of People in Imminent Danger Saved in the Maritime Environment
X
Percent of Time Rescue Assets are On-Scene within 2 Hours X
Aids-to-Navigation Availability of Maritime Navigation Aids X Average Number of Navigational Accidents X
Ice Operations Number of Days Critical Waterways Are Closed to Commerce Due to Ice X Living Marine Resources Fishing Regulation Compliance Rate X
Marine Safety
5-Yr Average Number of Commercial and Recreational Deaths and Injuries
X
5-Yr Average Number of Commercial Mariner Deaths and Injuries X
5-Yr Average Number of Commercial Passenger Deaths and Injuries X
5-Yr Average Number of Recreational Boating Deaths and Injuries X
Marine Environmental Protection
Average Number of Chemical Discharge Incidents in the Maritime Environment
X
Average Number of Oil Spills in the Maritime Environment X Total Non-Homeland Security Performance Measures 9 3
Homeland Security Missions
Ports Waterways and Coastal Security
Percentage Reduction of all Maritime Security Risk Subject to USCG Influence
X
Percent Reduction of Maritime Security Risk Resulting from USCG Consequence Management
X
Percent Reduction of Maritime Security Risk Resulting from USCG Efforts to Prevent a Terrorist Entering the US via Maritime Means
X
Percent Reduction of Maritime Security Risk Resulting from USCG Efforts to Prevent a Weapon of Mass Destruction from Entering the US via Maritime Means
X
Annual MTSA Facility Compliance Rate with Transportation Worker Identification Credential Regulations
X
Percent of Maritime Facilities In Compliance with Security Regulations X
Drug Interdiction Removal Rate for Cocaine from Non-commercial Vessels in Maritime Transit Zone
X
Migrant Interdiction
Percentage of Undocumented Migrants who Attempt to Enter the United States Via Maritime Routes that are Interdicted
X
Percent of Undocumented Migrants who Attempt to Enter the US by Maritime Routes Interdicted by the USCG
X
Defense Readiness Defense Readiness Assessment of all USCG High-Endurance Cutters Patrol Boats and Port Security Units
X
Other Law Enforcement Number of Detected Incursions of Foreign Fishing Vessels Violating US Waters
X
Total Homeland Security Performance Measures 5 6
Total USCG Performance Measures 14 9 Source DHS-OIG based on USCG-provided data
OFFICE OF INSPECTOR GENERAL Department of Homeland Security
Appendix E FY 2011 Performance Measure Summary
wwwoigdhsgov 30 OIG-12-119
OFFICE OF INSPECTOR GENERAL Department of Homeland Security
Appendix F Major Contributors to This Report
Brooke Bebow Director Lisa Vonder Haar Audit Manager Stephen Doran Auditor Richard Joyce Program Analyst Marisa Coccaro Referencer
wwwoigdhsgov 31 OIG-12-119
OFFICE OF INSPECTOR GENERAL Department of Homeland Security
Appendix G Report Distribution
Department of Homeland Security
Secretary Deputy Secretary Chief of Staff Deputy Chief of Staff General Counsel Executive Secretary Director GAOOIG Liaison Office Assistant Secretary for Office of Policy Assistant Secretary for Office of Public Affairs Assistant Secretary for Office of Legislative Affairs Acting Chief Privacy Officer
United States Coast Guard
Commandant Assistant Commandant for Resources and Chief Financial Officer USCG Audit Liaison
Office of Management and Budget
Chief Homeland Security Branch DHS OIG Budget Examiner
Congress
Congressional Oversight and Appropriations Committees as appropriate
wwwoigdhsgov 32 OIG-12-119
ADDITIONAL INFORMATION AND COPIES
To obtain additional copies of this document please call us at (202) 254-4100 fax your request to (202) 254-4305 or e-mail your request to our Office of Inspector General (OIG) Office of Public Affairs at DHS-OIGOfficePublicAffairsoigdhsgov
For additional information visit our website at wwwoigdhsgov or follow us on Twitter at dhsoig
OIG HOTLINE
To expedite the reporting of alleged fraud waste abuse or mismanagement or any other kinds of criminal or noncriminal misconduct relative to Department of Homeland Security (DHS) programs and operations please visit our website at wwwoigdhsgov and click on the red tab titled Hotline to report You will be directed to complete and submit an automated DHS OIG Investigative Referral Submission Form Submission through our website ensures that your complaint will be promptly received and reviewed by DHS OIG
Should you be unable to access our website you may submit your complaint in writing to DHS Office of Inspector General Attention Office of Investigations Hotline 245 Murray Drive SW Building 410Mail Stop 2600 Washington DC 20528 or you may call 1 (800) 323-8603 or fax it directly to us at (202) 254-4297
The OIG seeks to protect the identity of each writer and caller
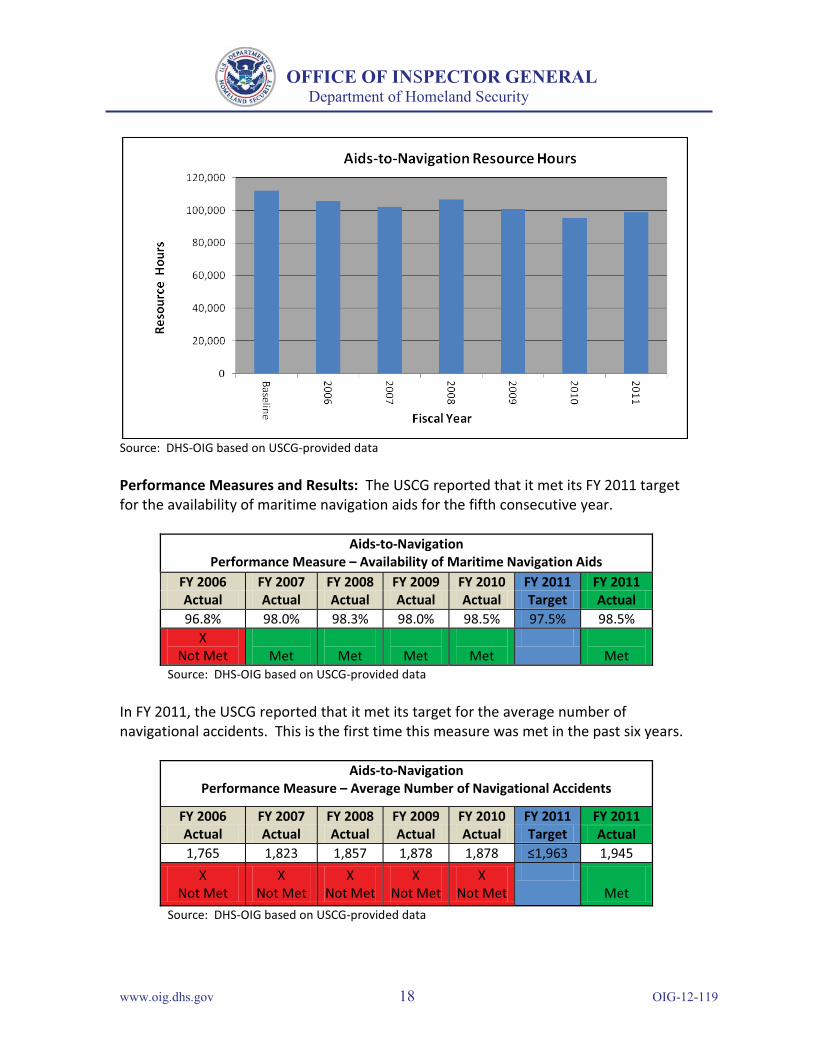

OFFICE OF INSPECTOR GENERAL Department of Homeland Security
Resource Hours In FY 2011 resource hours for ports waterways and coastal security totaled 155969 which is a decrease of 09 percent from FY 2010
Source DHS-OIG based on USCG-provided data
Performance Measures and Results USCG reported that it met three of its six FY 2011 targets for ports waterways and coastal security In FY 2011 the USCG added two new summary measures related to compliance with security regulations and significantly updated the methodology for the FY 2010 summary measure Percent Reduction in Maritime Terrorism Risk over which the USCG has Influence resulting in four maritime security risk measures as shown in the following charts The USCG improved and created a new baseline for the maritime security risk measures in FY 2010 thus FY 2011 results should not be compared to previous years
The revised maritime security risk measures are risk-based outcome measures that begin with an assessment of likely high-consequence maritime terrorist attack scenarios Threat vulnerability and consequence levels are estimated for each scenario which generates a proxy (index) value of raw risk that exists in the maritime domain Next the USCG interventions (security and response operations regime and awareness activities) for the fiscal year are scored against the scenarios with regard to the decreases in threat vulnerability and consequence that each has been estimated to have afforded The resulting measures are proxy measures of performance
As depicted below the USCG reported that it met its FY 2011 target for ldquoPercent Reduction of all Maritime Security Risk Subject to USCG Influencerdquo
wwwoigdhsgov 21 OIG-12-119
Ports Waterways and Coastal Security Performance Measure ndash Percent Reduction of all Maritime Security Risk
Subject to USCG Influence
FY 2006 Actual
FY 2007 Actual
FY 2008 Actual
FY 2009 Actual
FY 2010 Actual
FY 2011 Target
FY 2011 Actual
NA NA NA NA NA 44 44
Met Met Met Met Met Met Source DHS-OIG based on USCG-provided data
OFFICE OF INSPECTOR GENERAL Department of Homeland Security
USCG exceeded its FY 2011 target for Percent Reduction of all Maritime Security Risk Resulting from USCG Consequence Management
Ports Waterways and Coastal Security Performance Measure ndash Percent Reduction of Maritime Security Risk
Resulting from US Coast Guard Consequence Management
FY 2006 Actual
FY 2007 Actual
FY 2008 Actual
FY 2009 Actual
FY 2010 Actual
FY 2011 Target
FY 2011 Actual
NA NA NA NA NA 3 4
Met Met Met Met Met Met Source DHS-OIG based on USCG-provided data
USCG did not meet its target for ldquoPercent Reduction of Maritime Security Risk Resulting from USCG Efforts to Prevent a Terrorist Entering the US via Maritime Meansrdquo This is attributable to lower effectiveness judgments for the Maritime Security Response Team due to the loss of dedicated airlift and the suspension of hook-and-climb training Additionally major cutter capacity decreased due to the decommissioning of one High Endurance Cutter and an overall reduction of major cutter resource hours
Ports Waterways and Coastal Security Performance Measure ndash Percent Reduction of Maritime Security Risk
Resulting from USCG Efforts to Prevent a Terrorist Entering the US via Maritime Means
FY 2006 Actual
FY 2007 Actual
FY 2008 Actual
FY 2009 Actual
FY 2010 Actual
FY 2011 Target
FY 2011 Actual
NA NA NA NA NA 52 43
Met Met Met Met Met Not Met Source DHS-OIG based on USCG-provided data
USCG missed its target for ldquoPercent Reduction of Maritime Security Risk Resulting from USCG Efforts to Prevent a Weapon of Mass Destruction from Entering the United States
wwwoigdhsgov 22 OIG-12-119
Ports Waterways and Coastal Security Performance Measure ndash Percent Reduction of Maritime Security Risk
Resulting from USCG Efforts to Prevent a Weapon of Mass Destruction from Entering the US via Maritime Means
FY 2006 Actual
FY 2007 Actual
FY 2008 Actual
FY 2009 Actual
FY 2010 Actual
FY 2011 Target
FY 2011 Actual
NA NA NA NA NA 29 28
Met Met Met Met Met Not Met
Ports Waterways and Coastal Security Performance Measure ndash Annual Maritime Transportation Security Act Facility
Compliance Rate with Transportation Worker Identification Credential Regulations
FY 2006 Actual
FY 2007 Actual
FY 2008 Actual
FY 2009 Actual
FY 2010 Actual
FY 2011 Target
FY 2011 Actual
NA NA NA NA 100 85 99
NA NA NA NA Met Met
Source DHS-OIG based on USCG-provided data
OFFICE OF INSPECTOR GENERAL Department of Homeland Security
via Maritime Meansrdquo by one percentage point This is attributable to lower effectiveness judgments for the Maritime Security Response Team due to loss of dedicated airlift and the challenges of identifying a broad range of Weapons of Mass Destruction amongst the volume of legitimate shipping cargo Additionally major cutter capacity decreased due to the decommissioning of one High Endurance Cutter and an overall reduction of major cutter resource hours
Source DHS-OIG based on USCG-provided data
USCG exceeded its FY 2011 target for ldquoAnnual Maritime Transportation Security Act Facility Compliance Rate with Transportation Worker Identification Credential Regulationsrdquo
USCG missed its target for ldquoPercent of Maritime Facilities in Compliance with Security Regulationsrdquo by only one-tenth of one percent The USCG has focused the use of its personnel resources to conduct Maritime Transportation Security Act compliance exams at waterfront facilities that are at higher risk for a transportation security incident By increasing partnerships with these facilities 999 percent of regulated facilities did not have serious deficiencies warranting a notice of violation or civil penalty in FY 2011
wwwoigdhsgov 23 OIG-12-119
Ports Waterways and Coastal Security Performance Measure ndash Percent Of Maritime Facilities in Compliance with
Security Regulations
FY 2006 Actual
FY 2007 Actual
FY 2008 Actual
FY 2009 Actual
FY 2010 Actual
FY 2011 Target
FY 2011 Actual
NA NA NA NA NA 100 999
NA NA NA NA NA Not Met
Source DHS-OIG based on USCG-provided data
OFFICE OF INSPECTOR GENERAL Department of Homeland Security
Drug Interdiction
USCGrsquos drug interdiction efforts support national strategies to disrupt the market for illegal drugs and prevent transnational threats from reaching the United States The USCG is the lead Federal agency for drug interdiction on the high seas and shares the lead for drug interdiction in the territorial seas of the US with Customs and Border Protection The USCG coordinates with its interagency partners to deter illicit drug trafficking including the Department of Defense Department of Justice Department of State and other components within DHS
Resource Hours FY 2011 resource hours totaled 73401 and increased by approximately 9 percent from FY 2010 but are about 40 percent below baseline levels
Source DHS-OIG based on USCG-provided data
Performance Measures and Results The USCG uses the interagency Consolidated Counter Drug Database as its main source for tracking cocaine movement estimates
wwwoigdhsgov 24 OIG-12-119
Drug Interdiction Performance Measure ndash Removal Rate for Cocaine from Non-commercial
Vessels in Maritime Transit Zone FY 2006 FY 2007 FY 2008 FY 2009 FY 2010 FY 2011 FY 2011 Actual Actual Actual Actual Actual Target Actual
NA NA NA 150 135 155 116
NA NA NA X
Not Met X
Not Met X
Not Met Source DHS-OIG based on USCG-provided data
OFFICE OF INSPECTOR GENERAL Department of Homeland Security
The one performance measure related to Drug Interdiction ldquoRemoval Rate for Cocaine from Non-commercial Vessels in Maritime Transit Zonerdquo was not met in FY 2011 According to the USCG the reasons for not meeting this target can be attributed to reduced asset and resource availability smaller average load sizes of cocaine and increasingly sophisticated criminal organizations
Migrant Interdiction
USCG migrant interdiction policy and operations are designed to provide effective law enforcement presence at sea and achieve three main objectives (1) deter undocumented migrants and transnational human smugglers from using maritime routes to enter the US (2) detect and interdict undocumented migrants and human smugglers far from the US border and (3) expand USCG participation in multi-agency and bi-national border security initiatives While the USCG leads the interdiction mission on the high seas it partners with Customs and Border Protection and Immigration and Customs Enforcement for shore-side interdiction operations
Resource Hours Migrant interdiction resource hours remain approximately 144 percent above baseline levels In FY 2011 resource hours totaled 72213 and decreased approximately 60 percent from FY 2010 to FY 2011
wwwoigdhsgov 25 OIG-12-119
Migrant Interdiction Performance Measure ndash Percentage of Undocumented Migrants who
Attempt to Enter the United States Via Maritime Routes that are Interdicted
FY 2006 Actual
FY 2007 Actual
FY 2008 Actual
FY 2009 Actual
FY 2010 Actual
FY 2011 Target
FY 2011 Actual
NA 652 627 844 645 739 728
NA Not Met Not Met Met Not Met Not Met
OFFICE OF INSPECTOR GENERAL Department of Homeland Security
Source DHS-OIG based on USCG-provided data
Performance Measures and Results According to the USCG the number of undocumented migrants attempting to enter the US remained low in FY 2011 compared to numbers observed over the last decade due in part to a slumping US economy successful prosecution of smugglers effective bilateral cooperation and use of biometrics The USCG reported that it met one of its two performance measures related to migrant interdiction in FY 2011 Although the USCG did not meet the target for ldquoPercentage of Undocumented Migrants who Attempt to Enter the United States via Maritime Routes that are Interdictedrdquo the actual result of 728 percent was an improvement over FY 2010rsquos 645 percent This measure includes migrants who are interdicted by foreign counterparts of the USCG many of whom have fewer resources than the USCG
Source DHS-OIG based on USCG-provided data
As shown in the table below the USCG exceeded its target for the ldquoPercent of Undocumented Migrants who Attempt to Enter the United States via Maritime Routes Interdicted by the Coast Guardrdquo
wwwoigdhsgov 26 OIG-12-119
Migrant Interdiction Performance Measure ndash Percent of Undocumented Migrants who Attempt to Enter the United States via Maritime Routes Interdicted by the Coast Guard
FY 2006 Actual
FY 2007 Actual
FY 2008 Actual
FY 2009 Actual
FY 2010 Actual
FY 2011 Target
FY 2011 Actual
NA 421 469 375 447 430 517
NA NA Not Met Not Met Met Met
Source DHS-OIG based on USCG-provided data
OFFICE OF INSPECTOR GENERAL Department of Homeland Security
Defense Readiness
The USCG maintains a level of readiness and training that allows for the immediate integration with Department of Defense forces for peacetime operations or during times of war This supports US national interests abroad as well as facilitating support to DHS for the integration of Homeland Defense and Homeland Security
Resource Hours In FY 2011 resource hours for Defense Readiness totaled 41424 and were still above the baseline although resource hours decreased by 119 percent from FY 2010 to FY 2011
Source DHS-OIG based on USCG-provided data
Performance Measures and Results The USCG did not meet its overall target of 381 percent defense readiness for the year The declining readiness of the USCGrsquos High Endurance Cutter fleet continues to present significant challenges to mission
wwwoigdhsgov 27 OIG-12-119
Defense Readiness Performance Measure ndash Defense Readiness Assessment of all USCG High-
Endurance Cutters Patrol Boats and Port Security Units
FY 2006 Actual
FY 2007 Actual
FY 2008 Actual
FY 2009 Actual
FY 2010 Actual
FY 2011 Target
FY 2011 Actual
NA NA NA NA 241 381 251
NA NA NA NA Not Met Not Met
Source DHS-OIG based on USCG-provided data
OFFICE OF INSPECTOR GENERAL Department of Homeland Security
performance High Endurance Cutter readiness is being addressed by the USCGrsquos acquisition of the National Security Cutter
Other Law Enforcement
The other law enforcement mission orchestrates the enforcement of regulations on foreign fishing vessels This enforcement takes two forms the first is the deterrence detection and interdiction of illegal incursions into the US exclusive economic zone by foreign fishing vessels 1 The protection of the US exclusive economic zone from incursions by foreign fishing vessels contributes to a fundamental USCG maritime security objective to protect our Nationrsquos renewable natural resources The second part of the other law enforcement mission is to ensure compliance with international agreements for the management of living marine resources This is primarily accomplished through enforcement on foreign fishing vessels of conservation and management measures created by regional fishery management organizations
Resource Hours In FY 2011 resource hours for the other law enforcement mission totaled 12579 which is an increase of 445 percent from FY 2010 According to the USCG this increase in resource hours was due to increased patrols for illegal unregulated and unreported fishing activity
1 The exclusive economic zone is the zone where the US and other coastal nations have jurisdiction over economic and resource management The exclusive economic zone includes waters three to 200 miles offshore (or nine to 200 miles offshore in western Florida and Texas)
wwwoigdhsgov 28 OIG-12-119
OFFICE OF INSPECTOR GENERAL Department of Homeland Security
Source DHS-OIG based on USCG-provided data
Performance Measures and Results The USCG uses the number of detected incursions into the US Exclusive Economic Zone by foreign fishing vessels as a measure of its performance In FY 2011 there were 122 detected incursions of foreign fishing vessels into the US Exclusive Economic Zone which met the performance target of fewer than 180 incursions
Other Law Enforcement Performance Measure ndash Number of Detected Incursions of Foreign Fishing
Vessels violating US Waters
FY 2006 Actual
FY 2007 Actual
FY 2008 Actual
FY 2009 Actual
FY 2010 Actual
FY 2011 Target
FY 2011 Actual
164 126 81 112 82 lt180 122
Met Met Met Met Met Met Source DHS-OIG based on USCG-provided data
wwwoigdhsgov 29 OIG-12-119
Mission Measure Met Not Met
Non-Homeland Security Missions
Search and Rescue Percentage of People in Imminent Danger Saved in the Maritime Environment
X
Percent of Time Rescue Assets are On-Scene within 2 Hours X
Aids-to-Navigation Availability of Maritime Navigation Aids X Average Number of Navigational Accidents X
Ice Operations Number of Days Critical Waterways Are Closed to Commerce Due to Ice X Living Marine Resources Fishing Regulation Compliance Rate X
Marine Safety
5-Yr Average Number of Commercial and Recreational Deaths and Injuries
X
5-Yr Average Number of Commercial Mariner Deaths and Injuries X
5-Yr Average Number of Commercial Passenger Deaths and Injuries X
5-Yr Average Number of Recreational Boating Deaths and Injuries X
Marine Environmental Protection
Average Number of Chemical Discharge Incidents in the Maritime Environment
X
Average Number of Oil Spills in the Maritime Environment X Total Non-Homeland Security Performance Measures 9 3
Homeland Security Missions
Ports Waterways and Coastal Security
Percentage Reduction of all Maritime Security Risk Subject to USCG Influence
X
Percent Reduction of Maritime Security Risk Resulting from USCG Consequence Management
X
Percent Reduction of Maritime Security Risk Resulting from USCG Efforts to Prevent a Terrorist Entering the US via Maritime Means
X
Percent Reduction of Maritime Security Risk Resulting from USCG Efforts to Prevent a Weapon of Mass Destruction from Entering the US via Maritime Means
X
Annual MTSA Facility Compliance Rate with Transportation Worker Identification Credential Regulations
X
Percent of Maritime Facilities In Compliance with Security Regulations X
Drug Interdiction Removal Rate for Cocaine from Non-commercial Vessels in Maritime Transit Zone
X
Migrant Interdiction
Percentage of Undocumented Migrants who Attempt to Enter the United States Via Maritime Routes that are Interdicted
X
Percent of Undocumented Migrants who Attempt to Enter the US by Maritime Routes Interdicted by the USCG
X
Defense Readiness Defense Readiness Assessment of all USCG High-Endurance Cutters Patrol Boats and Port Security Units
X
Other Law Enforcement Number of Detected Incursions of Foreign Fishing Vessels Violating US Waters
X
Total Homeland Security Performance Measures 5 6
Total USCG Performance Measures 14 9 Source DHS-OIG based on USCG-provided data
OFFICE OF INSPECTOR GENERAL Department of Homeland Security
Appendix E FY 2011 Performance Measure Summary
wwwoigdhsgov 30 OIG-12-119
OFFICE OF INSPECTOR GENERAL Department of Homeland Security
Appendix F Major Contributors to This Report
Brooke Bebow Director Lisa Vonder Haar Audit Manager Stephen Doran Auditor Richard Joyce Program Analyst Marisa Coccaro Referencer
wwwoigdhsgov 31 OIG-12-119
OFFICE OF INSPECTOR GENERAL Department of Homeland Security
Appendix G Report Distribution
Department of Homeland Security
Secretary Deputy Secretary Chief of Staff Deputy Chief of Staff General Counsel Executive Secretary Director GAOOIG Liaison Office Assistant Secretary for Office of Policy Assistant Secretary for Office of Public Affairs Assistant Secretary for Office of Legislative Affairs Acting Chief Privacy Officer
United States Coast Guard
Commandant Assistant Commandant for Resources and Chief Financial Officer USCG Audit Liaison
Office of Management and Budget
Chief Homeland Security Branch DHS OIG Budget Examiner
Congress
Congressional Oversight and Appropriations Committees as appropriate
wwwoigdhsgov 32 OIG-12-119
ADDITIONAL INFORMATION AND COPIES
To obtain additional copies of this document please call us at (202) 254-4100 fax your request to (202) 254-4305 or e-mail your request to our Office of Inspector General (OIG) Office of Public Affairs at DHS-OIGOfficePublicAffairsoigdhsgov
For additional information visit our website at wwwoigdhsgov or follow us on Twitter at dhsoig
OIG HOTLINE
To expedite the reporting of alleged fraud waste abuse or mismanagement or any other kinds of criminal or noncriminal misconduct relative to Department of Homeland Security (DHS) programs and operations please visit our website at wwwoigdhsgov and click on the red tab titled Hotline to report You will be directed to complete and submit an automated DHS OIG Investigative Referral Submission Form Submission through our website ensures that your complaint will be promptly received and reviewed by DHS OIG
Should you be unable to access our website you may submit your complaint in writing to DHS Office of Inspector General Attention Office of Investigations Hotline 245 Murray Drive SW Building 410Mail Stop 2600 Washington DC 20528 or you may call 1 (800) 323-8603 or fax it directly to us at (202) 254-4297
The OIG seeks to protect the identity of each writer and caller
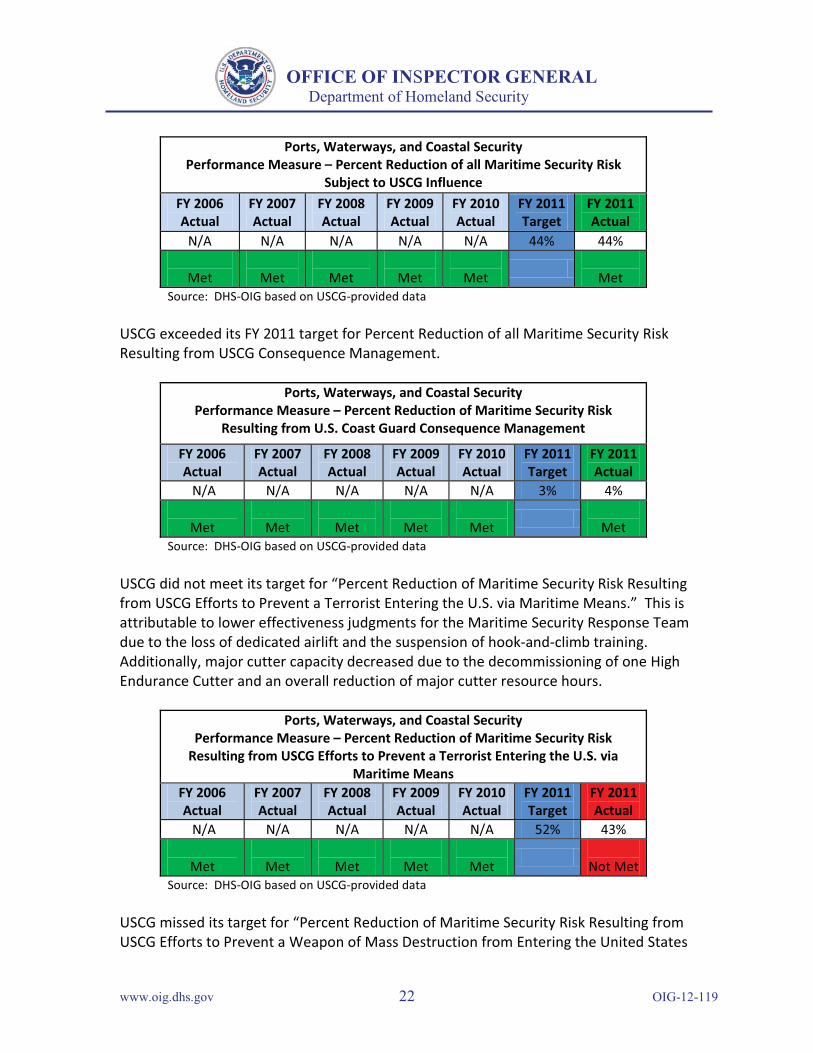
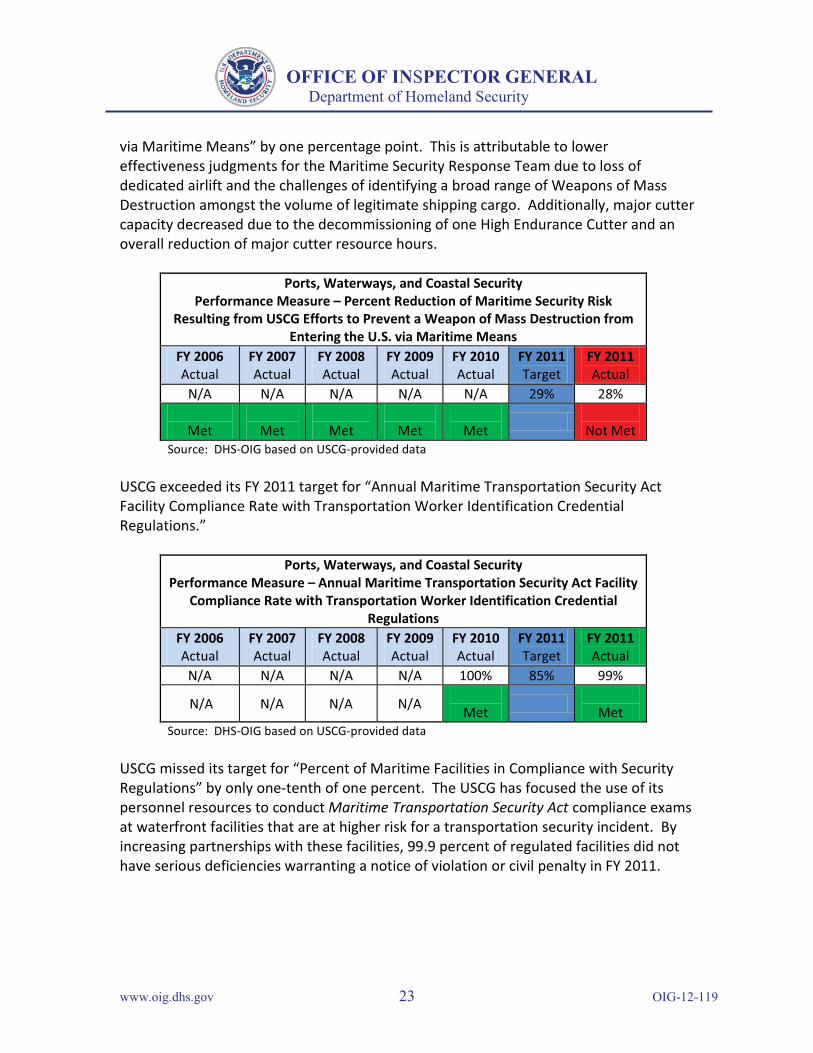
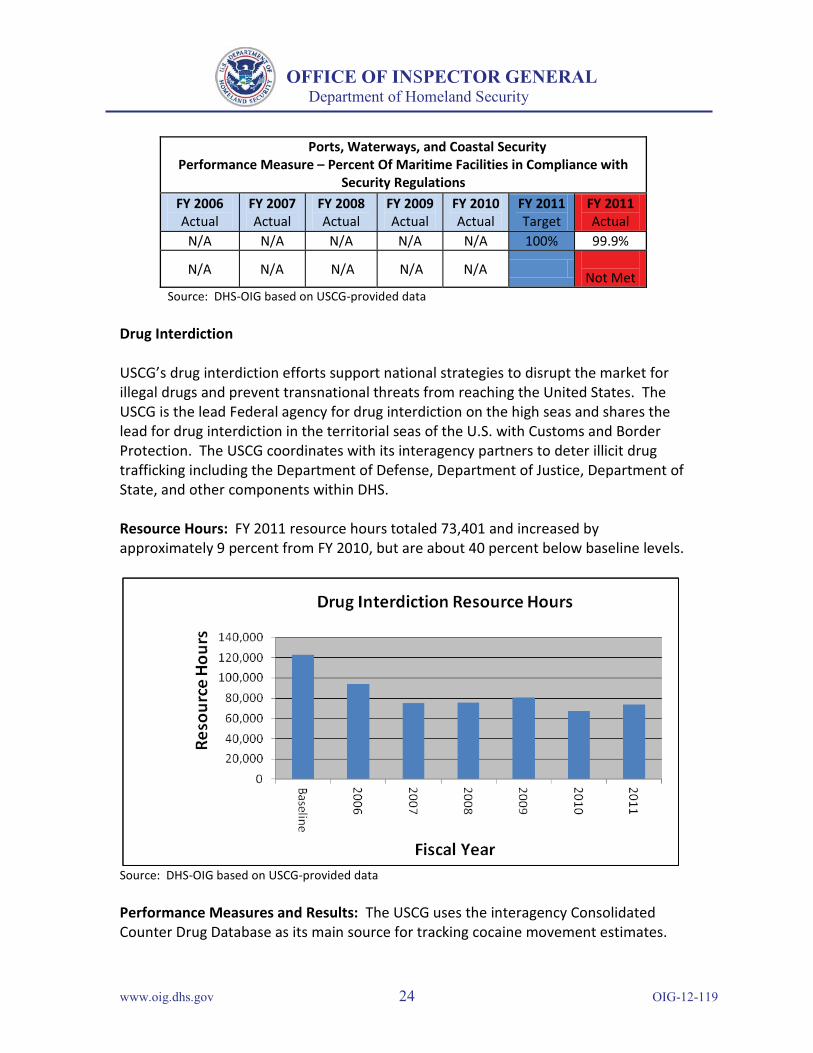
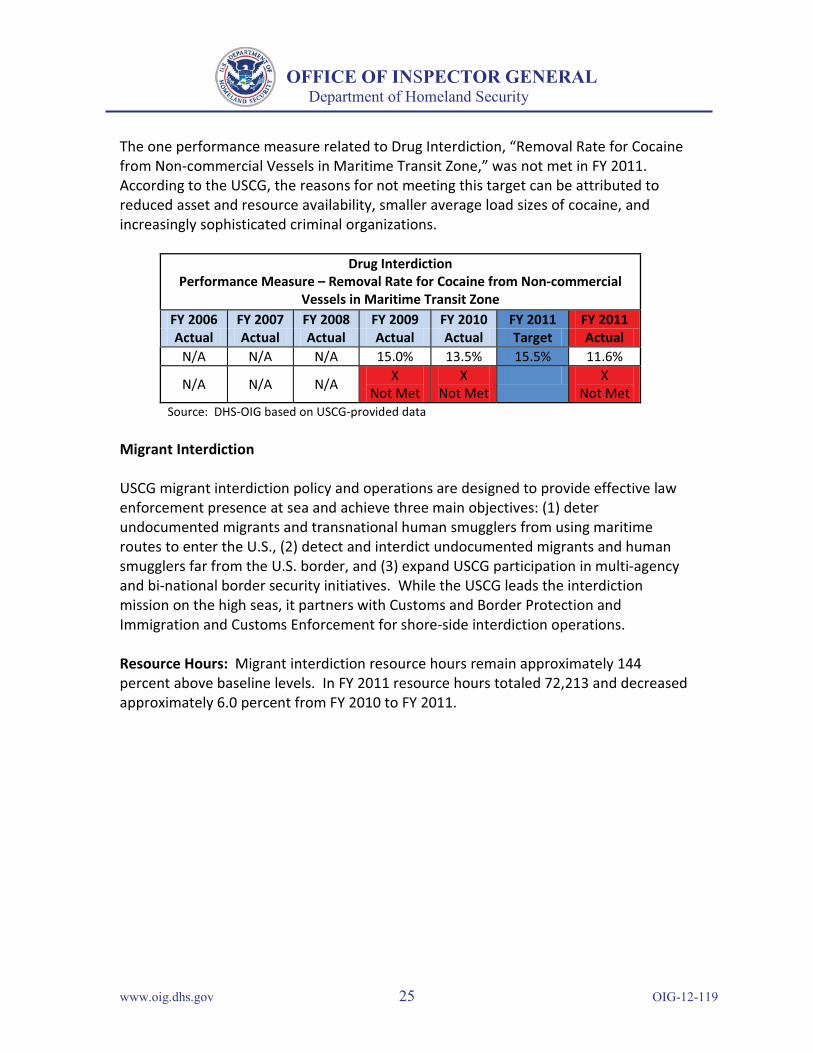
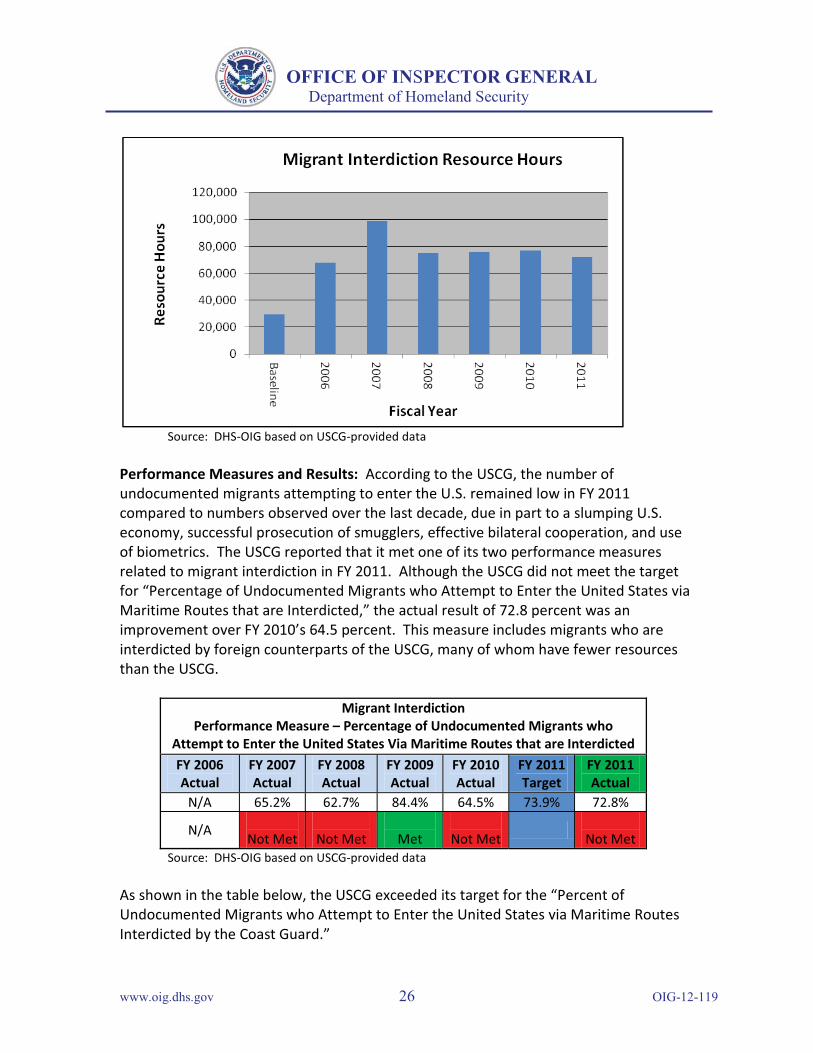
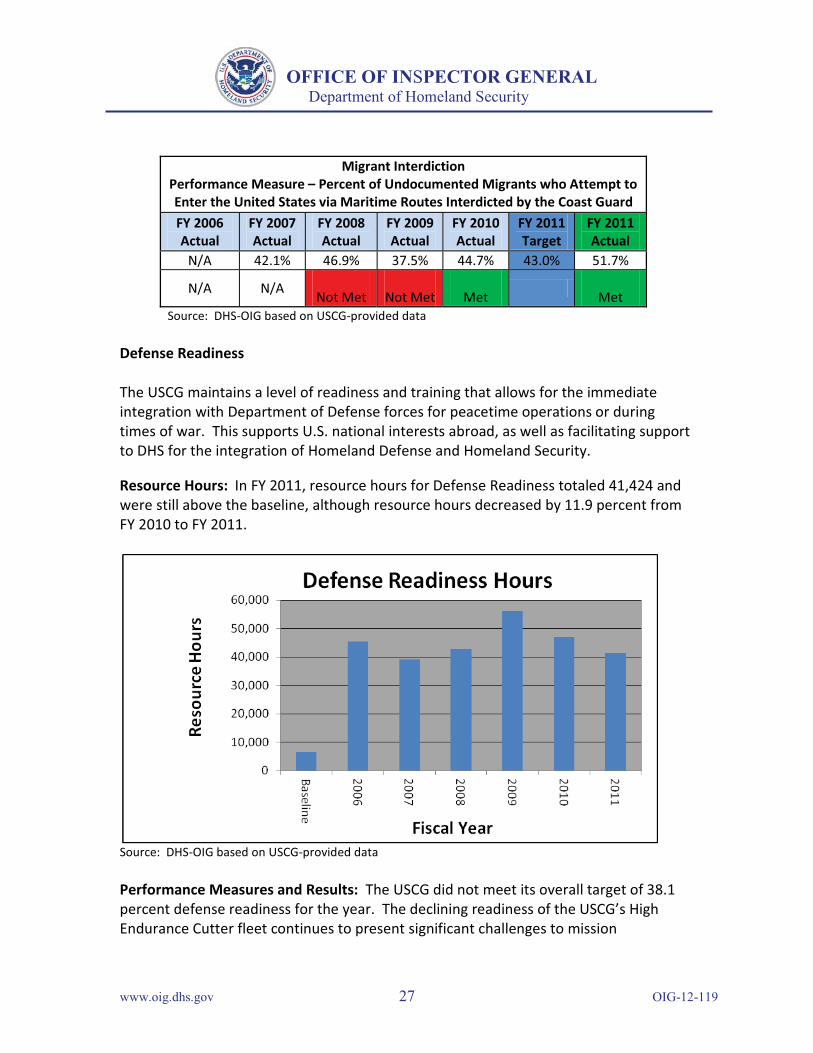

OFFICE OF INSPECTOR GENERAL Department of Homeland Security
Source DHS-OIG based on USCG-provided data
Performance Measures and Results The USCG uses the number of detected incursions into the US Exclusive Economic Zone by foreign fishing vessels as a measure of its performance In FY 2011 there were 122 detected incursions of foreign fishing vessels into the US Exclusive Economic Zone which met the performance target of fewer than 180 incursions
Other Law Enforcement Performance Measure ndash Number of Detected Incursions of Foreign Fishing
Vessels violating US Waters
FY 2006 Actual
FY 2007 Actual
FY 2008 Actual
FY 2009 Actual
FY 2010 Actual
FY 2011 Target
FY 2011 Actual
164 126 81 112 82 lt180 122
Met Met Met Met Met Met Source DHS-OIG based on USCG-provided data
wwwoigdhsgov 29 OIG-12-119
Mission Measure Met Not Met
Non-Homeland Security Missions
Search and Rescue Percentage of People in Imminent Danger Saved in the Maritime Environment
X
Percent of Time Rescue Assets are On-Scene within 2 Hours X
Aids-to-Navigation Availability of Maritime Navigation Aids X Average Number of Navigational Accidents X
Ice Operations Number of Days Critical Waterways Are Closed to Commerce Due to Ice X Living Marine Resources Fishing Regulation Compliance Rate X
Marine Safety
5-Yr Average Number of Commercial and Recreational Deaths and Injuries
X
5-Yr Average Number of Commercial Mariner Deaths and Injuries X
5-Yr Average Number of Commercial Passenger Deaths and Injuries X
5-Yr Average Number of Recreational Boating Deaths and Injuries X
Marine Environmental Protection
Average Number of Chemical Discharge Incidents in the Maritime Environment
X
Average Number of Oil Spills in the Maritime Environment X Total Non-Homeland Security Performance Measures 9 3
Homeland Security Missions
Ports Waterways and Coastal Security
Percentage Reduction of all Maritime Security Risk Subject to USCG Influence
X
Percent Reduction of Maritime Security Risk Resulting from USCG Consequence Management
X
Percent Reduction of Maritime Security Risk Resulting from USCG Efforts to Prevent a Terrorist Entering the US via Maritime Means
X
Percent Reduction of Maritime Security Risk Resulting from USCG Efforts to Prevent a Weapon of Mass Destruction from Entering the US via Maritime Means
X
Annual MTSA Facility Compliance Rate with Transportation Worker Identification Credential Regulations
X
Percent of Maritime Facilities In Compliance with Security Regulations X
Drug Interdiction Removal Rate for Cocaine from Non-commercial Vessels in Maritime Transit Zone
X
Migrant Interdiction
Percentage of Undocumented Migrants who Attempt to Enter the United States Via Maritime Routes that are Interdicted
X
Percent of Undocumented Migrants who Attempt to Enter the US by Maritime Routes Interdicted by the USCG
X
Defense Readiness Defense Readiness Assessment of all USCG High-Endurance Cutters Patrol Boats and Port Security Units
X
Other Law Enforcement Number of Detected Incursions of Foreign Fishing Vessels Violating US Waters
X
Total Homeland Security Performance Measures 5 6
Total USCG Performance Measures 14 9 Source DHS-OIG based on USCG-provided data
OFFICE OF INSPECTOR GENERAL Department of Homeland Security
Appendix E FY 2011 Performance Measure Summary
wwwoigdhsgov 30 OIG-12-119
OFFICE OF INSPECTOR GENERAL Department of Homeland Security
Appendix F Major Contributors to This Report
Brooke Bebow Director Lisa Vonder Haar Audit Manager Stephen Doran Auditor Richard Joyce Program Analyst Marisa Coccaro Referencer
wwwoigdhsgov 31 OIG-12-119
OFFICE OF INSPECTOR GENERAL Department of Homeland Security
Appendix G Report Distribution
Department of Homeland Security
Secretary Deputy Secretary Chief of Staff Deputy Chief of Staff General Counsel Executive Secretary Director GAOOIG Liaison Office Assistant Secretary for Office of Policy Assistant Secretary for Office of Public Affairs Assistant Secretary for Office of Legislative Affairs Acting Chief Privacy Officer
United States Coast Guard
Commandant Assistant Commandant for Resources and Chief Financial Officer USCG Audit Liaison
Office of Management and Budget
Chief Homeland Security Branch DHS OIG Budget Examiner
Congress
Congressional Oversight and Appropriations Committees as appropriate
wwwoigdhsgov 32 OIG-12-119
ADDITIONAL INFORMATION AND COPIES
To obtain additional copies of this document please call us at (202) 254-4100 fax your request to (202) 254-4305 or e-mail your request to our Office of Inspector General (OIG) Office of Public Affairs at DHS-OIGOfficePublicAffairsoigdhsgov
For additional information visit our website at wwwoigdhsgov or follow us on Twitter at dhsoig
OIG HOTLINE
To expedite the reporting of alleged fraud waste abuse or mismanagement or any other kinds of criminal or noncriminal misconduct relative to Department of Homeland Security (DHS) programs and operations please visit our website at wwwoigdhsgov and click on the red tab titled Hotline to report You will be directed to complete and submit an automated DHS OIG Investigative Referral Submission Form Submission through our website ensures that your complaint will be promptly received and reviewed by DHS OIG
Should you be unable to access our website you may submit your complaint in writing to DHS Office of Inspector General Attention Office of Investigations Hotline 245 Murray Drive SW Building 410Mail Stop 2600 Washington DC 20528 or you may call 1 (800) 323-8603 or fax it directly to us at (202) 254-4297
The OIG seeks to protect the identity of each writer and caller
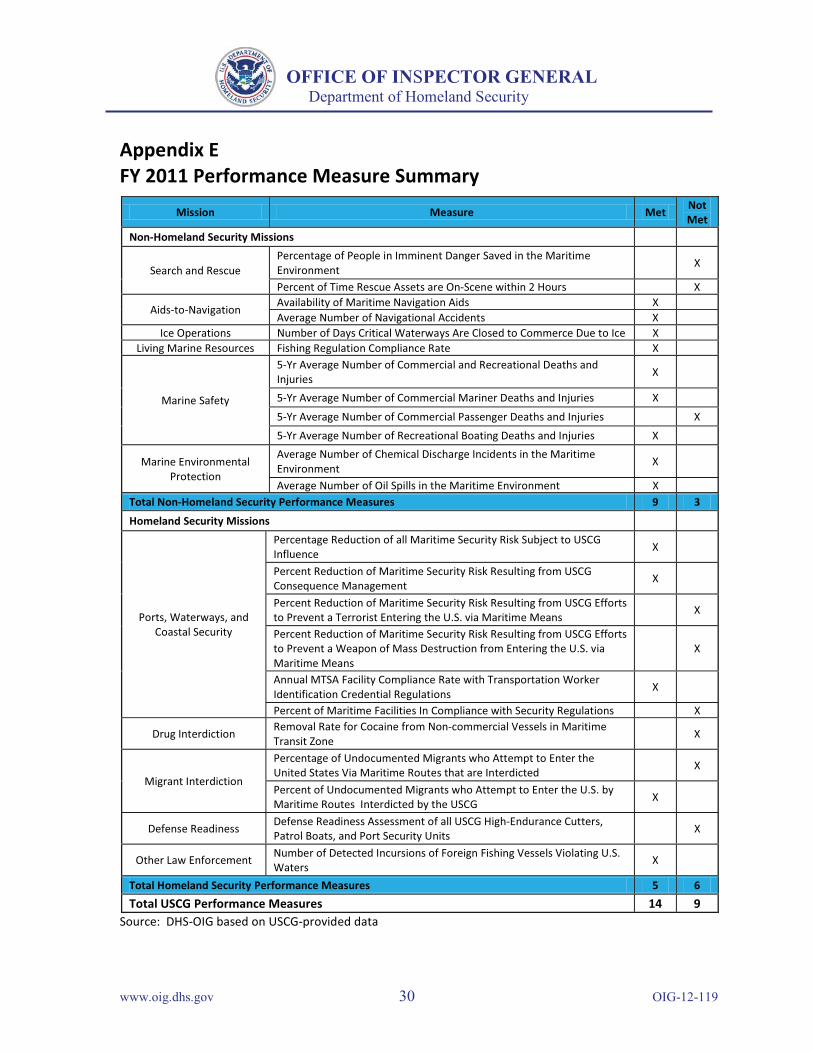
OFFICE OF INSPECTOR GENERAL Department of Homeland Security
Appendix G Report Distribution
Department of Homeland Security
Secretary Deputy Secretary Chief of Staff Deputy Chief of Staff General Counsel Executive Secretary Director GAOOIG Liaison Office Assistant Secretary for Office of Policy Assistant Secretary for Office of Public Affairs Assistant Secretary for Office of Legislative Affairs Acting Chief Privacy Officer
United States Coast Guard
Commandant Assistant Commandant for Resources and Chief Financial Officer USCG Audit Liaison
Office of Management and Budget
Chief Homeland Security Branch DHS OIG Budget Examiner
Congress
Congressional Oversight and Appropriations Committees as appropriate
wwwoigdhsgov 32 OIG-12-119
ADDITIONAL INFORMATION AND COPIES
To obtain additional copies of this document please call us at (202) 254-4100 fax your request to (202) 254-4305 or e-mail your request to our Office of Inspector General (OIG) Office of Public Affairs at DHS-OIGOfficePublicAffairsoigdhsgov
For additional information visit our website at wwwoigdhsgov or follow us on Twitter at dhsoig
OIG HOTLINE
To expedite the reporting of alleged fraud waste abuse or mismanagement or any other kinds of criminal or noncriminal misconduct relative to Department of Homeland Security (DHS) programs and operations please visit our website at wwwoigdhsgov and click on the red tab titled Hotline to report You will be directed to complete and submit an automated DHS OIG Investigative Referral Submission Form Submission through our website ensures that your complaint will be promptly received and reviewed by DHS OIG
Should you be unable to access our website you may submit your complaint in writing to DHS Office of Inspector General Attention Office of Investigations Hotline 245 Murray Drive SW Building 410Mail Stop 2600 Washington DC 20528 or you may call 1 (800) 323-8603 or fax it directly to us at (202) 254-4297
The OIG seeks to protect the identity of each writer and caller