Ohio Department of Public Safety Ohio Traffic Safety...
49
Applied Research Center Miami University Page 1 Ohio Department of Public Safety Ohio Traffic Safety Office 2009 Grantee Observation Surveys of Seat Belt Use The National Highway Traffic Safety Administration (NHTSA) and the Ohio Department of Public Safety (ODPS) and the Ohio Traffic Safety Office (OTSO) are interested in obtaining standardized restraint use information from OTSO-sponsored highway safety grantees throughout Ohio. The Ohio Traffic Safety Office (OTSO) required that its 2008-2009 Safe Communities, law enforcement, and occupant protection grant recipients conduct observation surveys of seat belt use in their respective Ohio counties. The required surveys conducted at selected sites are a major component of the ongoing OTSO commitment to reduce highway fatalities and serious injuries throughout Ohio by increasing seat belt use. The surveys were scheduled as follows: Data used for the Baseline Survey was conducted during the 2008 evaluation. The next survey was initiated during June, 2009 and concurrently with OTSO Earned Media, Paid Media, and Law Enforcement initiatives to increase seat belt use throughout Ohio. The follow-up survey was scheduled during September of 2009. The OTSO grantees conducted 168,318 surveys of occupant seat belt use, including 142,948 driver and 25,370 passenger surveys. The accompanying figures and tables contain all data from the three surveys and depict observed seat belt use rates for all front seat vehicle occupants, drivers, and passengers for each of the participating Ohio Counties served by the OTSO grant recipients. It is important to remember that survey results for each county could vary as a function of the number of observations, fluctuation in the sample size, and other confounding factors. This caveat should be considered when interpreting results throughout the report. The grantee survey results indicate an un-weighted statewide seat belt use rate of 70% for the Baseline Survey, 77% for June of 2009, and 70% for the September 2009 Survey period. It is important to emphasize these rates obtained through the grantee survey do not replace or replicate Ohio’s annual observational survey which adheres to rigorous guidelines set by the National Highway Traffic Safety Administration (NHTSA). For Ohio’s annual statewide observation survey, all observation sites were randomly selected intersections and off-ramps from each of the five geographic regions of the state and all sites had an equal probability of selection. In contrast, the present grantee survey did not fully adhere to those methodological standards. For instance, while some of the grantee sites were included in the statewide survey, some were randomly selected by the Miami University Evaluator, and other sites were selected based on grantee programmatic or judgmental criteria and human resource constraints. Consequently, the following data can and should be interpreted and used to enhance statewide, county, and local seat belt use and highway safety with those sample selection criteria in mind. 1 1 County seat belt use data by vehicle type, sex, age, and race can be provided to GHSO grantees upon request.
Transcript of Ohio Department of Public Safety Ohio Traffic Safety...

Applied Research Center Miami University
Page 1
Ohio Department of Public Safety Ohio Traffic Safety Office
2009 Grantee Observation Surveys of Seat Belt Use
The National Highway Traffic Safety Administration (NHTSA) and the Ohio Department of Public Safety (ODPS) and the Ohio
Traffic Safety Office (OTSO) are interested in obtaining standardized restraint use information from OTSO-sponsored highway
safety grantees throughout Ohio. The Ohio Traffic Safety Office (OTSO) required that its 2008-2009 Safe Communities, law
enforcement, and occupant protection grant recipients conduct observation surveys of seat belt use in their respective Ohio
counties. The required surveys conducted at selected sites are a major component of the ongoing OTSO commitment to
reduce highway fatalities and serious injuries throughout Ohio by increasing seat belt use. The surveys were scheduled as
follows: Data used for the Baseline Survey was conducted during the 2008 evaluation. The next survey was initiated during
June, 2009 and concurrently with OTSO Earned Media, Paid Media, and Law Enforcement initiatives to increase seat belt use
throughout Ohio. The follow-up survey was scheduled during September of 2009. The OTSO grantees conducted 168,318
surveys of occupant seat belt use, including 142,948 driver and 25,370 passenger surveys. The accompanying figures and
tables contain all data from the three surveys and depict observed seat belt use rates for all front seat vehicle occupants,
drivers, and passengers for each of the participating Ohio Counties served by the OTSO grant recipients. It is important to
remember that survey results for each county could vary as a function of the number of observations, fluctuation in the sample
size, and other confounding factors. This caveat should be considered when interpreting results throughout the report.
The grantee survey results indicate an un-weighted statewide seat belt use rate of 70% for the Baseline Survey, 77% for June
of 2009, and 70% for the September 2009 Survey period. It is important to emphasize these rates obtained through the
grantee survey do not replace or replicate Ohio’s annual observational survey which adheres to rigorous guidelines set by the
National Highway Traffic Safety Administration (NHTSA). For Ohio’s annual statewide observation survey, all observation sites
were randomly selected intersections and off-ramps from each of the five geographic regions of the state and all sites had an
equal probability of selection. In contrast, the present grantee survey did not fully adhere to those methodological standards.
For instance, while some of the grantee sites were included in the statewide survey, some were randomly selected by the
Miami University Evaluator, and other sites were selected based on grantee programmatic or judgmental criteria and human
resource constraints. Consequently, the following data can and should be interpreted and used to enhance statewide, county,
and local seat belt use and highway safety with those sample selection criteria in mind.1
1 County seat belt use data by vehicle type, sex, age, and race can be provided to GHSO grantees upon request.

Applied Research Center Miami University
Page 2
ALL PARTICIPATING COUNTIES
As reported above, OTSO grantees conducted 168,318
observation surveys of occupant seat belt use,
consisting of 142,948 driver and 25,370 passenger
surveys. The Baseline survey included 56,743 total
occupants, June of 2009 had 60,219 total occupants,
and the September, 2009 survey had 51,356 occupants.
The overall occupant (drivers and passengers) seat belt
usage rate for all counties combined, increased between
the Baseline and the June surveys. The usage rate fell
from the June (77%) to September survey (70%), well
below NHTSA’s target of an 85% for Ohio.
CROSS-TABULATION OF ALL COUNTIES SEAT BELT USE RATES BY SURVEY, DRIVER, AND FRONT SEAT PASSENGER, VEHICLE TYPE, AND
OCCUPANTS’ DEMOGRAPHIC CHARACTERISTICS
DRIVER PASSENGER
BELTED UNBELTED TOTAL BELTED UNBELTED TOTAL
OVERALL RESULTS FOR ALL COUNTIES 78% 22% 142,948 76% 24% 25,370
SURVEY
BASELINE 79% 21% 47,904 77% 23% 8,839
JUNE 2009 78% 22% 50,537 77% 23% 9,682
SEPTEMBER 2009 77% 23% 44,507 74% 26% 6,849
VEHICLE TYPE
PASSENGER CAR 78% 22% 73,244 76% 24% 12,902
VAN/MINIVAN 82% 18% 16,708 82% 18% 3,676
SUV 82% 18% 26,574 81% 19% 4,617
PICKUP TRUCK 68% 32% 26,139 66% 34% 4,120
SEX MALE 74% 26% 81,432 67% 33% 9,200
FEMALE 82% 18% 61,042 82% 18% 16,024
AGE
0 - 4 - - - 86% 14% 179
5 - 14 - - - 82% 18% 2,116
15 - 25 70% 30% 19,082 67% 33% 5,841
26 - 64 78% 22% 106,991 76% 24% 12,918
65+ 83% 17% 15,795 86% 14% 3,932
RACE
CAUCASIAN 78% 22% 131,105 77% 23% 22,377
AFRICAN AMERICAN 66% 34% 8,544 60% 40% 1,597
OTHER 76% 24% 1,606 72% 28% 373
70%77%
70%
30%23%
30%
0%
20%
40%
60%
80%
100%
Baseline June 2009 September 2009
Belted
Unbelted
n = 56,743 n = 60,219 n = 51,356
ALL PARTICIPATING COUNTIES
Applied Research Center Miami University
Page 3
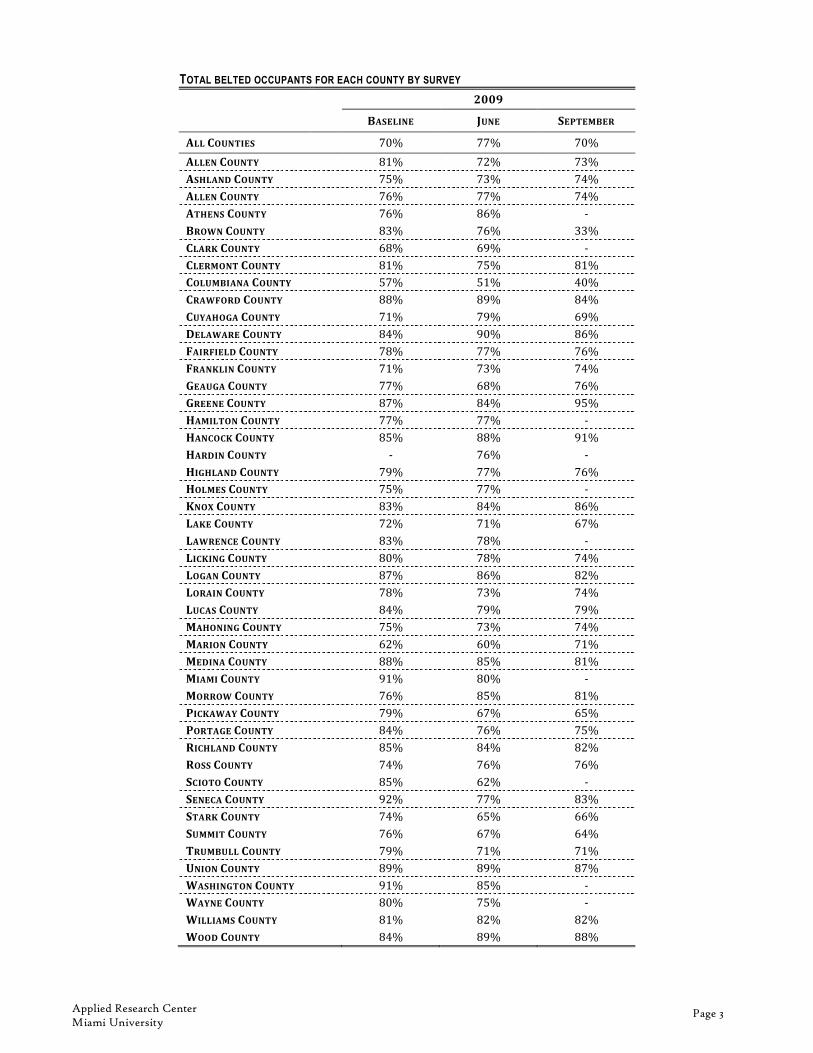
TOTAL BELTED OCCUPANTS FOR EACH COUNTY BY SURVEY
2009
BASELINE JUNE SEPTEMBER
ALL COUNTIES 70% 77% 70%
ALLEN COUNTY 81% 72% 73%
ASHLAND COUNTY 75% 73% 74%
ALLEN COUNTY 76% 77% 74%
ATHENS COUNTY 76% 86% -
BROWN COUNTY 83% 76% 33%
CLARK COUNTY 68% 69% -
CLERMONT COUNTY 81% 75% 81%
COLUMBIANA COUNTY 57% 51% 40%
CRAWFORD COUNTY 88% 89% 84%
CUYAHOGA COUNTY 71% 79% 69%
DELAWARE COUNTY 84% 90% 86%
FAIRFIELD COUNTY 78% 77% 76%
FRANKLIN COUNTY 71% 73% 74%
GEAUGA COUNTY 77% 68% 76%
GREENE COUNTY 87% 84% 95%
HAMILTON COUNTY 77% 77% -
HANCOCK COUNTY 85% 88% 91%
HARDIN COUNTY - 76% -
HIGHLAND COUNTY 79% 77% 76%
HOLMES COUNTY 75% 77% -
KNOX COUNTY 83% 84% 86%
LAKE COUNTY 72% 71% 67%
LAWRENCE COUNTY 83% 78% -
LICKING COUNTY 80% 78% 74%
LOGAN COUNTY 87% 86% 82%
LORAIN COUNTY 78% 73% 74%
LUCAS COUNTY 84% 79% 79%
MAHONING COUNTY 75% 73% 74%
MARION COUNTY 62% 60% 71%
MEDINA COUNTY 88% 85% 81%
MIAMI COUNTY 91% 80% -
MORROW COUNTY 76% 85% 81%
PICKAWAY COUNTY 79% 67% 65%
PORTAGE COUNTY 84% 76% 75%
RICHLAND COUNTY 85% 84% 82%
ROSS COUNTY 74% 76% 76%
SCIOTO COUNTY 85% 62% -
SENECA COUNTY 92% 77% 83%
STARK COUNTY 74% 65% 66%
SUMMIT COUNTY 76% 67% 64%
TRUMBULL COUNTY 79% 71% 71%
UNION COUNTY 89% 89% 87%
WASHINGTON COUNTY 91% 85% -
WAYNE COUNTY 80% 75% -
WILLIAMS COUNTY 81% 82% 82%
WOOD COUNTY 84% 89% 88%
Applied Research Center Miami University
Page 4
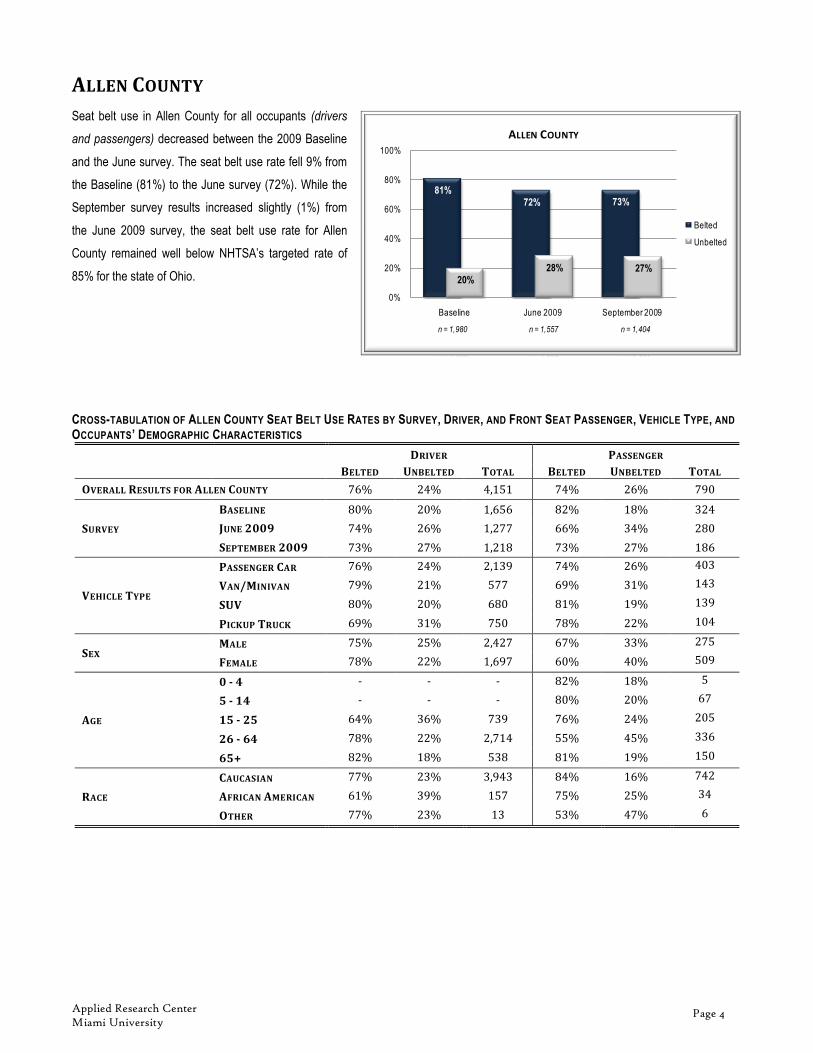
ALLEN COUNTY
Seat belt use in Allen County for all occupants (drivers
and passengers) decreased between the 2009 Baseline
and the June survey. The seat belt use rate fell 9% from
the Baseline (81%) to the June survey (72%). While the
September survey results increased slightly (1%) from
the June 2009 survey, the seat belt use rate for Allen
County remained well below NHTSA’s targeted rate of
85% for the state of Ohio.
CROSS-TABULATION OF ALLEN COUNTY SEAT BELT USE RATES BY SURVEY, DRIVER, AND FRONT SEAT PASSENGER, VEHICLE TYPE, AND
OCCUPANTS’ DEMOGRAPHIC CHARACTERISTICS
DRIVER PASSENGER
BELTED UNBELTED TOTAL BELTED UNBELTED TOTAL
OVERALL RESULTS FOR ALLEN COUNTY 76% 24% 4,151 74% 26% 790
SURVEY
BASELINE 80% 20% 1,656 82% 18% 324
JUNE 2009 74% 26% 1,277 66% 34% 280
SEPTEMBER 2009 73% 27% 1,218 73% 27% 186
VEHICLE TYPE
PASSENGER CAR 76% 24% 2,139 74% 26% 403
VAN/MINIVAN 79% 21% 577 69% 31% 143
SUV 80% 20% 680 81% 19% 139
PICKUP TRUCK 69% 31% 750 78% 22% 104
SEX MALE 75% 25% 2,427 67% 33% 275
FEMALE 78% 22% 1,697 60% 40% 509
AGE
0 - 4 - - - 82% 18% 5
5 - 14 - - - 80% 20% 67
15 - 25 64% 36% 739 76% 24% 205
26 - 64 78% 22% 2,714 55% 45% 336
65+ 82% 18% 538 81% 19% 150
RACE
CAUCASIAN 77% 23% 3,943 84% 16% 742
AFRICAN AMERICAN 61% 39% 157 75% 25% 34
OTHER 77% 23% 13 53% 47% 6
81%72% 73%
20%
28% 27%
0%
20%
40%
60%
80%
100%
Baseline June 2009 September 2009
Belted
Unbelted
ALLEN COUNTY
n = 1,980 n = 1,557 n = 1,404

Applied Research Center Miami University
Page 5
ASHLAND COUNTY
Seat belt use in Ashland County remained relatively
consistent between survey periods. For instance, the
seat belt use for all occupants (drivers and passengers)
decreased slightly between the 2009 Baseline survey
(75%) and the June survey (73%), then increased to
74% during the September 2009 survey period.
CROSS-TABULATION OF ASHLAND COUNTY SEAT BELT USE RATES BY SURVEY, DRIVER, AND FRONT SEAT PASSENGER, VEHICLE TYPE, AND OCCUPANTS’ DEMOGRAPHIC CHARACTERISTICS
DRIVER PASSENGER
BELTED UNBELTED TOTAL BELTED UNBELTED TOTAL
OVERALL RESULTS FOR ASHLAND COUNTY 74% 26% 524 73% 27% 128
SURVEY
BASELINE 76% 24% 157 74% 26% 57
JUNE 2009 76% 24% 131 62% 38% 29
SEPTEMBER 2009 73% 27% 236 79% 21% 42
VEHICLE TYPE
PASSENGER CAR 73% 27% 285 67% 33% 70
VAN/MINIVAN 76% 24% 59 100% - 10
SUV 80% 20% 104 71% 29% 24
PICKUP TRUCK 69% 31% 71 77% 23% 22
SEX MALE 75% 25% 244 72% 28% 50
FEMALE 73% 27% 271 75% 25% 73
AGE
0 – 4 - 100% 1
5 – 14 69% 31% 13
15 – 25 60% 40% 84 64% 36% 25
26 – 64 76% 24% 386 79% 21% 70
65+ 83% 17% 46 73% 27% 15
RACE
CAUCASIAN 74% 26% 482 73% 27% 115
AFRICAN AMERICAN 100% - 4 50% 50% 2
OTHER - - - - - -
75% 73% 74%
25% 27% 26%
0%
20%
40%
60%
80%
100%
Baseline June 2009 September 2009
Belted
Unbelted
ASHLAND COUNTY
n = 214 n = 160 n = 278

Applied Research Center Miami University
Page 6
ASHTABULA COUNTY
Seat belt usage in Ashtabula County for all occupants
(drivers and passengers) increased from the 2009
Baseline to the June survey. The usage rate rose slightly
(1%) from the Baseline (76%) to the June survey (77%);
however belt use decreased to 74% during the
September survey. Consequently, the rate of seat belt
usage was well below NHTSA’s target of 85% for Ohio.
CROSS-TABULATION OF ASHTABULA COUNTY SEAT BELT USE RATES BY SURVEY, DRIVER, AND FRONT SEAT PASSENGER, VEHICLE TYPE, AND OCCUPANTS’ DEMOGRAPHIC CHARACTERISTICS
DRIVER PASSENGER
BELTED UNBELTED TOTAL BELTED UNBELTED TOTAL
OVERALL RESULTS FOR ASHTABULA COUNTY 74% 26% 2,821 80% 20% 757
SURVEY
BASELINE 75% 25% 814 78% 22% 305
JUNE 2009 75% 25% 1,104 83% 17% 274
SEPTEMBER 2009 73% 27% 903 79% 21% 178
VEHICLE TYPE
PASSENGER CAR 78% 22% 1,483 82% 18% 379
VAN/MINIVAN 78% 22% 313 85% 15% 113
SUV 77% 23% 402 82% 18% 119
PICKUP TRUCK 61% 39% 580 71% 29% 140
SEX MALE 71% 29% 1,811 66% 34% 195
FEMALE 80% 20% 986 85% 15% 554
AGE
0 – 4 - - - 90% 10% 21
5 – 14 - - - 90% 10% 52
15 – 25 71% 29% 544 68% 32% 146
26 – 64 75% 25% 1,838 82% 18% 408
65+ 76% 24% 420 79% 21% 121
RACE
CAUCASIAN 74% 26% 2,633 81% 19% 649
AFRICAN AMERICAN 76% 24% 106 65% 35% 17
OTHER 80% 20% 49 33% 67% 3
76% 77% 74%
24% 23% 26%
0%
20%
40%
60%
80%
100%
Baseline June 2009 September 2009
Belted
Unbelted
ASHTABULA COUNTY
n = 1,119 n = 1,378 n = 1,081

Applied Research Center Miami University
Page 7
ATHENS COUNTY
Occupant (drivers and passengers) seat belt usage
rates for Athens County increased approximately 10%
between the 2009 Baseline and the June surveys. The
June survey rate of 86% shows that Athens County
surpassed NHTSA’s targeted usage rate of 85% for
Ohio. It should be noted that findings for this county are
based on relatively few observations. Moreover, Athens
County did not submit September surveys for inclusion
in the analysis.
CROSS-TABULATION OF ATHENS COUNTY SEAT BELT USE RATES BY SURVEY, DRIVER, AND FRONT SEAT PASSENGER, VEHICLE TYPE, AND
OCCUPANTS’ DEMOGRAPHIC CHARACTERISTICS
DRIVER PASSENGER
BELTED UNBELTED TOTAL BELTED UNBELTED TOTAL
OVERALL RESULTS FOR ATHENS COUNTY 79% 21% 457 89% 11% 127
SURVEY
BASELINE 74% 26% 226 84% 16% 57
JUNE 2009 84% 16% 231 93% 7% 70
SEPTEMBER 2009 - - - - - -
VEHICLE TYPE
PASSENGER CAR 76% 24% 252 85% 15% 74
VAN/MINIVAN 89% 11% 55 100% - 19
SUV 91% 9% 69 100% - 20
PICKUP TRUCK 70% 30% 80 79% 21% 14
SEX MALE 78% 22% 253 81% 19% 37
FEMALE 80% 20% 201 92% 8% 89
AGE
0 – 4 - - - 100% - 1
5 – 14 - - - 75% 25% 4
15 – 25 84% 16% 141 89% 11% 65
26 – 64 76% 24% 295 90% 10% 48
65+ 90% 10% 20 100% - 6
RACE
CAUCASIAN 77% 23% 423 89% 11% 115
AFRICAN AMERICAN 89% 11% 9 80% 20% 5
OTHER 100% - 14 100% - 7
76%
86%
24%
14%0%
20%
40%
60%
80%
100%
Baseline June 2009
Belted
Unbelted
ATHENS COUNTY
n = 283 n = 301

Applied Research Center Miami University
Page 8
BROWN COUNTY
The 2009 overall seat belt use rate in Brown County
(drivers and passenger) decreased significantly between
the Baseline (83%) and June (76%) surveys. Moreover,
the seat belt use rate declined to 33% in September.
Brown County personnel affiliated with this project
lacked an explanation for the decline in seat belt use.
CROSS-TABULATION OF BROWN COUNTY SEAT BELT USE RATES BY SURVEY, DRIVER, AND FRONT SEAT PASSENGER, VEHICLE TYPE, AND
OCCUPANTS’ DEMOGRAPHIC CHARACTERISTICS
DRIVER PASSENGER
BELTED UNBELTED TOTAL BELTED UNBELTED TOTAL
OVERALL RESULTS FOR BROWN COUNTY 70% 30% 2,119 79% 21% 331
SURVEY
BASELINE 82% 18% 1,199 87% 13% 197
JUNE 2009 74% 26% 488 82% 18% 91
SEPTEMBER 2009 34% 66% 432 30% 70% 43
VEHICLE TYPE
PASSENGER CAR 63% 37% 1,006 74% 26% 134
VAN/MINIVAN 84% 16% 219 75% 25% 32
SUV 86% 14% 275 97% 3% 68
PICKUP TRUCK 71% 29% 608 73% 27% 95
SEX MALE 71% 29% 1,311 72% 28% 132
FEMALE 69% 31% 795 83% 17% 198
AGE
0 – 4 - - - - - -
5 – 14 - - - 67% 33% 3
15 – 25 79% 21% 359 76% 24% 86
26 – 64 65% 35% 1,501 74% 26% 186
65+ 93% 7% 257 98% 2% 56
RACE
CAUCASIAN 70% 30% 2,075 79% 21% 321
AFRICAN AMERICAN 85% 15% 26 67% 33% 9
OTHER - - - - - -
83%76%
33%
17%25%
67%
0%
20%
40%
60%
80%
100%
Baseline June 2009 September 2009
Belted
Unbelted
BROWN COUNTY
n = 1,396 n = 579 n = 475

Applied Research Center Miami University
Page 9
CLARK COUNTY
There was very little change in Clark County’s seat belt
usage rate from the Baseline survey to the June survey.
The rate for all occupants (drivers and passengers)
increased slightly (1%) between the two survey periods.
These results indicate that Clark County is well below
NHTSA’s targeted belt use rate of 85%. No September
surveys for this county were submitted for analysis.
CROSS-TABULATION OF CLARK COUNTY SEAT BELT USE RATES BY SURVEY, DRIVER, AND FRONT SEAT PASSENGER, VEHICLE TYPE, AND
OCCUPANTS’ DEMOGRAPHIC CHARACTERISTICS
DRIVER PASSENGER
BELTED UNBELTED TOTAL BELTED UNBELTED TOTAL
OVERALL RESULTS FOR CLARK COUNTY 69% 31% 2,757 66% 34% 398
SURVEY
BASELINE 70% 30% 1,149 60% 40% 180
JUNE 2009 69% 31% 1,608 72% 28% 218
SEPTEMBER 2009 - - - - - -
VEHICLE TYPE
PASSENGER CAR 70% 30% 1,396 64% 36% 218
VAN/MINIVAN 74% 26% 354 76% 24% 58
SUV 72% 28% 400 70% 30% 53
PICKUP TRUCK 63% 37% 591 62% 38% 69
SEX MALE 68% 32% 1,670 55% 45% 129
FEMALE 72% 28% 1,079 73% 27% 266
AGE
0 - 4 - - - - 100% 1
5 - 14 - - - 70% 30% 30
15 - 25 61% 39% 285 55% 45% 100
26 - 64 69% 31% 2,183 68% 32% 194
65+ 79% 21% 271 86% 14% 65
RACE
CAUCASIAN 70% 30% 2,552 68% 32% 362
AFRICAN AMERICAN 61% 39% 144 53% 47% 17
OTHER 63% 37% 30 64% 36% 11
68% 69%
32% 31%
0%
20%
40%
60%
80%
100%
Baseline June 2009
Belted
Unbelted
CLARK COUNTY
n = 1,329 n = 1,826
Applied Research Center Miami University
Page 10
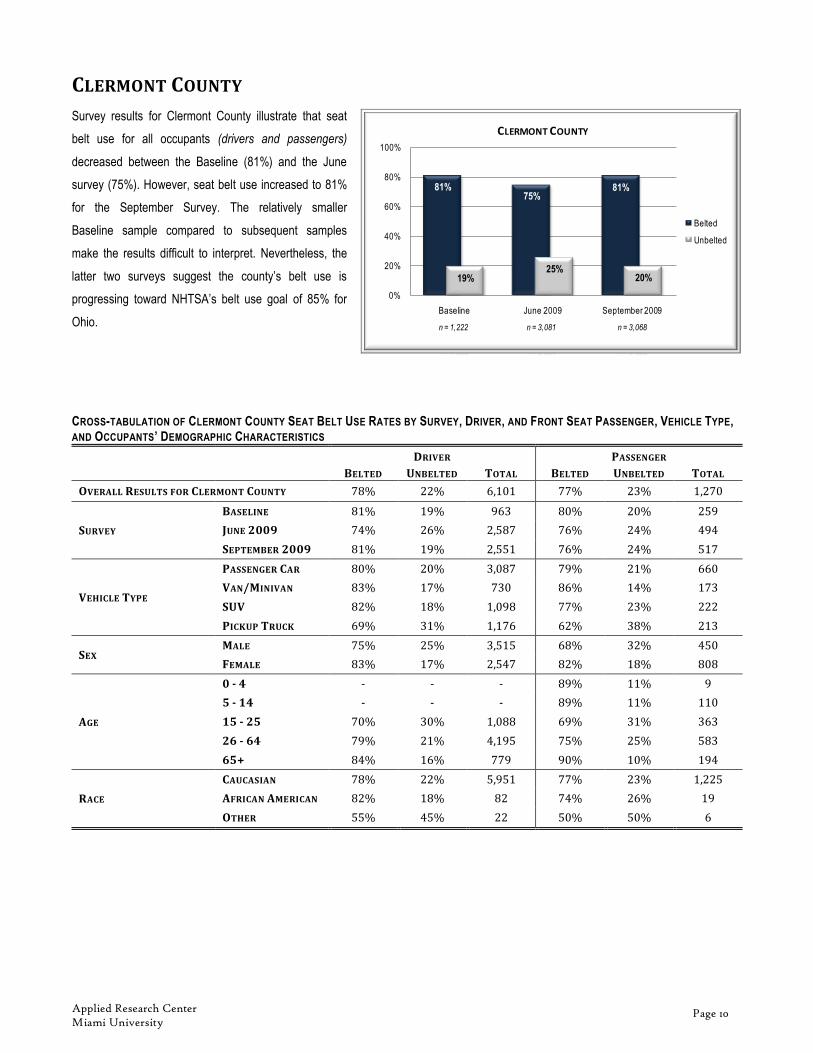
CLERMONT COUNTY
Survey results for Clermont County illustrate that seat
belt use for all occupants (drivers and passengers)
decreased between the Baseline (81%) and the June
survey (75%). However, seat belt use increased to 81%
for the September Survey. The relatively smaller
Baseline sample compared to subsequent samples
make the results difficult to interpret. Nevertheless, the
latter two surveys suggest the county’s belt use is
progressing toward NHTSA’s belt use goal of 85% for
Ohio.
CROSS-TABULATION OF CLERMONT COUNTY SEAT BELT USE RATES BY SURVEY, DRIVER, AND FRONT SEAT PASSENGER, VEHICLE TYPE, AND OCCUPANTS’ DEMOGRAPHIC CHARACTERISTICS
DRIVER PASSENGER
BELTED UNBELTED TOTAL BELTED UNBELTED TOTAL
OVERALL RESULTS FOR CLERMONT COUNTY 78% 22% 6,101 77% 23% 1,270
SURVEY
BASELINE 81% 19% 963 80% 20% 259
JUNE 2009 74% 26% 2,587 76% 24% 494
SEPTEMBER 2009 81% 19% 2,551 76% 24% 517
VEHICLE TYPE
PASSENGER CAR 80% 20% 3,087 79% 21% 660
VAN/MINIVAN 83% 17% 730 86% 14% 173
SUV 82% 18% 1,098 77% 23% 222
PICKUP TRUCK 69% 31% 1,176 62% 38% 213
SEX MALE 75% 25% 3,515 68% 32% 450
FEMALE 83% 17% 2,547 82% 18% 808
AGE
0 - 4 - - - 89% 11% 9
5 - 14 - - - 89% 11% 110
15 - 25 70% 30% 1,088 69% 31% 363
26 - 64 79% 21% 4,195 75% 25% 583
65+ 84% 16% 779 90% 10% 194
RACE
CAUCASIAN 78% 22% 5,951 77% 23% 1,225
AFRICAN AMERICAN 82% 18% 82 74% 26% 19
OTHER 55% 45% 22 50% 50% 6
81%75%
81%
19%25%
20%
0%
20%
40%
60%
80%
100%
Baseline June 2009 September 2009
Belted
Unbelted
CLERMONTCOUNTY
n = 1,222 n = 3,081 n = 3,068
Applied Research Center Miami University
Page 11
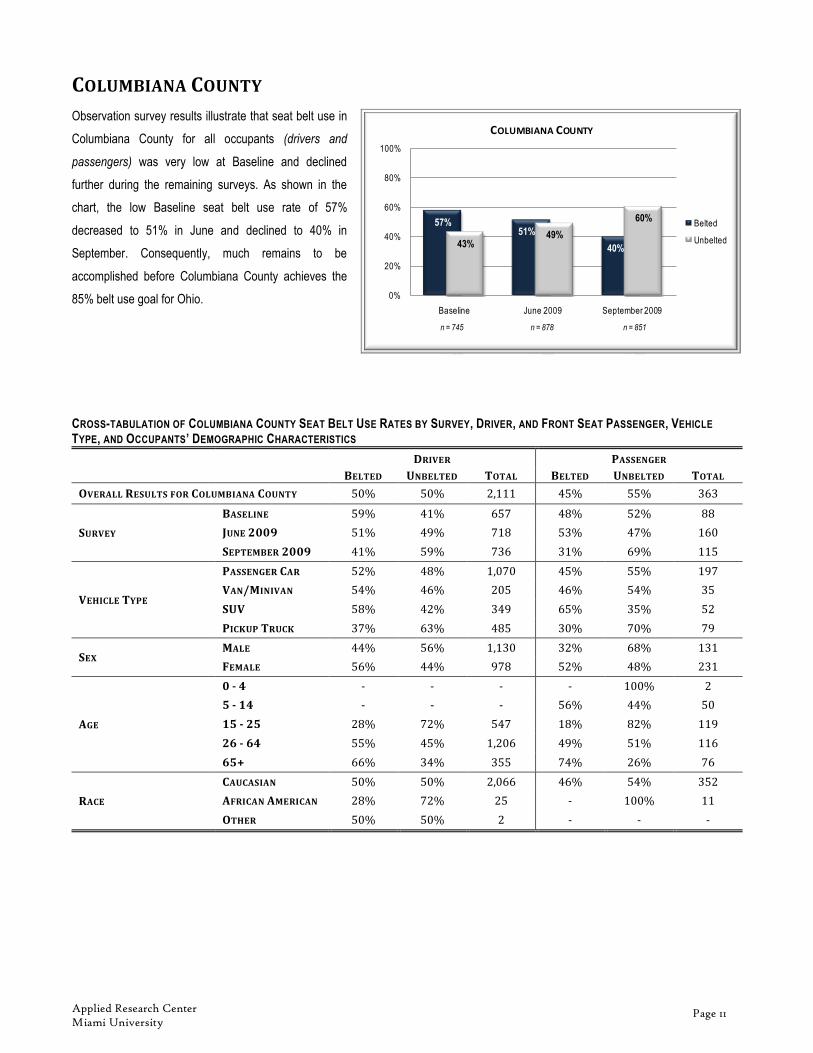
COLUMBIANA COUNTY
Observation survey results illustrate that seat belt use in
Columbiana County for all occupants (drivers and
passengers) was very low at Baseline and declined
further during the remaining surveys. As shown in the
chart, the low Baseline seat belt use rate of 57%
decreased to 51% in June and declined to 40% in
September. Consequently, much remains to be
accomplished before Columbiana County achieves the
85% belt use goal for Ohio.
CROSS-TABULATION OF COLUMBIANA COUNTY SEAT BELT USE RATES BY SURVEY, DRIVER, AND FRONT SEAT PASSENGER, VEHICLE
TYPE, AND OCCUPANTS’ DEMOGRAPHIC CHARACTERISTICS
DRIVER PASSENGER
BELTED UNBELTED TOTAL BELTED UNBELTED TOTAL
OVERALL RESULTS FOR COLUMBIANA COUNTY 50% 50% 2,111 45% 55% 363
SURVEY
BASELINE 59% 41% 657 48% 52% 88
JUNE 2009 51% 49% 718 53% 47% 160
SEPTEMBER 2009 41% 59% 736 31% 69% 115
VEHICLE TYPE
PASSENGER CAR 52% 48% 1,070 45% 55% 197
VAN/MINIVAN 54% 46% 205 46% 54% 35
SUV 58% 42% 349 65% 35% 52
PICKUP TRUCK 37% 63% 485 30% 70% 79
SEX MALE 44% 56% 1,130 32% 68% 131
FEMALE 56% 44% 978 52% 48% 231
AGE
0 - 4 - - - - 100% 2
5 - 14 - - - 56% 44% 50
15 - 25 28% 72% 547 18% 82% 119
26 - 64 55% 45% 1,206 49% 51% 116
65+ 66% 34% 355 74% 26% 76
RACE
CAUCASIAN 50% 50% 2,066 46% 54% 352
AFRICAN AMERICAN 28% 72% 25 - 100% 11
OTHER 50% 50% 2 - - -
57%51%
40%43%49%
60%
0%
20%
40%
60%
80%
100%
Baseline June 2009 September 2009
Belted
Unbelted
COLUMBIANA COUNTY
n = 745 n = 878 n = 851

Applied Research Center Miami University
Page 12
CRAWFORD COUNTY
Seat belt usage in Crawford County for all occupants
(drivers and passengers) remained steady between the
2009 Baseline (88%) and the June survey (89%). A
slight belt use decline is noted from the June to
September surveys, however, seat belt use remained
near NHTSA’s 85% goal for Ohio. It should be noted that
findings for this county are based on a relatively small
sample of observations, especially during the Baseline
survey.
CROSS-TABULATION OF CRAWFORD COUNTY SEAT BELT USE RATES BY SURVEY, DRIVER, AND FRONT SEAT PASSENGER, VEHICLE TYPE, AND OCCUPANTS’ DEMOGRAPHIC CHARACTERISTICS
DRIVER PASSENGER
BELTED UNBELTED TOTAL BELTED UNBELTED TOTAL
OVERALL RESULTS FOR CRAWFORD COUNTY 87% 13% 519 86% 14% 155
SURVEY
BASELINE 90% 10% 135 84% 16% 44
JUNE 2009 90% 10% 197 86% 14% 65
SEPTEMBER 2009 83% 17% 187 89% 11% 46
VEHICLE TYPE
PASSENGER CAR 90% 10% 252 87% 13% 75
VAN/MINIVAN 88% 12% 67 95% 5% 22
SUV 90% 10% 104 89% 11% 36
PICKUP TRUCK 77% 23% 94 73% 27% 22
SEX MALE 84% 16% 280 71% 29% 49
FEMALE 91% 9% 237 93% 7% 105
AGE
0 - 4 - - - - - -
5 - 14 - - - 100% - 15
15 - 25 85% 15% 92 77% 23% 43
26 - 64 87% 13% 319 88% 12% 67
65+ 90% 10% 106 90% 10% 30
RACE
CAUCASIAN 87% 13% 514 86% 14% 154
AFRICAN AMERICAN 100% - 2 - - -
OTHER 100% - 1 100% - 1
88% 89%84%
12% 11% 16%
0%
20%
40%
60%
80%
100%
Baseline June 2009 September 2009
Belted
Unbelted
CRAWFORD COUNTY
n = 179 n = 262 n = 233

Applied Research Center Miami University
Page 13
CUYAHOGA COUNTY
The seat belt usage rate in Cuyahoga County for all
occupants (drivers and passengers) was highest during
the June 2009 survey (79%). The county still needs to
significantly increase seat belt use in order to meet
NHTSA’s goal of 85% for Ohio.
CROSS-TABULATION OF CUYAHOGA COUNTY SEAT BELT USE RATES BY SURVEY, DRIVER, AND FRONT SEAT PASSENGER, VEHICLE TYPE, AND OCCUPANTS’ DEMOGRAPHIC CHARACTERISTICS
DRIVER PASSENGER
BELTED UNBELTED TOTAL BELTED UNBELTED TOTAL
OVERALL RESULTS FOR CUYAHOGA COUNTY 73% 27% 11,570 71% 29% 1,291
SURVEY
BASELINE 71% 29% 4,849 70% 305 600
JUNE 2009 78% 22% 3,145 82% 18% 292
SEPTEMBER 2009 70% 30% 3,576 65% 35% 399
VEHICLE TYPE
PASSENGER CAR 73% 27% 6,812 72% 28% 759
VAN/MINIVAN 77% 23% 1,338 73% 27% 193
SUV 76% 24% 2,295 76% 24% 240
PICKUP TRUCK 57% 43% 1,123 48% 52% 99
SEX MALE 68% 32% 6,396 65% 35% 509
FEMALE 78% 22% 5,169 74% 26% 780
AGE
0 - 4 - - - 100% - 2
5 - 14 - - - 80% 20% 92
15 - 25 66% 34% 697 71% 29% 222
26 - 64 72% 28% 9,644 67% 33% 773
65+ 80% 20% 1,223 80% 20% 198
RACE
CAUCASIAN 75% 25% 9,112 74% 26% 1,015
AFRICAN AMERICAN 62% 38% 2,197 60% 40% 236
OTHER 72% 28% 239 62% 38% 37
71%79%
69%
29%21%
31%
0%
20%
40%
60%
80%
100%
Baseline June 2009 September 2009
Belted
Unbelted
CUYAHOGA COUNTY
n = 5,449 n = 3,437 n = 3,975

Applied Research Center Miami University
Page 14
DELAWARE COUNTY
The seat belt usage rate in Delaware County for all
occupants (drivers and passengers) increased 6%
overall between the 2009 Baseline (84%) and the June
survey (90%). Even though the usage rate dropped
slightly to 86% during the September survey, the County
remained above the Ohio’s target goal of 85% seat belt
use.
CROSS-TABULATION OF DELAWARE COUNTY SEAT BELT USE RATES BY SURVEY, DRIVER, AND FRONT SEAT PASSENGER, VEHICLE TYPE, AND OCCUPANTS’ DEMOGRAPHIC CHARACTERISTICS
DRIVER PASSENGER
BELTED UNBELTED TOTAL BELTED UNBELTED TOTAL
OVERALL RESULTS FOR DELAWARE COUNTY 87% 13% 7,462 89% 11% 1,106
SURVEY
BASELINE 84% 16% 1,473 87% 13% 295
JUNE 2009 89% 11% 3,156 93% 7% 467
SEPTEMBER 2009 86% 14% 2,833 86% 14% 344
VEHICLE TYPE
PASSENGER CAR 89% 11% 3,571 92% 8% 510
VAN/MINIVAN 90% 10% 1,060 90% 10% 197
SUV 89% 11% 1,649 89% 11% 240
PICKUP TRUCK 76% 24% 1,169 78% 22% 157
SEX MALE 83% 17% 4,022 82% 18% 416
FEMALE 91% 9% 3,419 94% 6% 680
AGE
0 - 4 - - - 86% 14% 7
5 - 14 - - - 96% 4% 89
15 - 25 86% 14% 919 86% 14% 244
26 - 64 87% 13% 5,770 88% 12% 606
65+ 86% 14% 708 93% 7% 134
RACE
CAUCASIAN 87% 13% 7,058 90% 10% 1,024
AFRICAN AMERICAN 87% 13% 180 88% 12% 26
OTHER 85% 15% 96 72% 28% 25
84%90%
86%
16% 10% 14%0%
20%
40%
60%
80%
100%
Baseline June 2009 September 2009
Belted
Unbelted
DELAWARE COUNTY
n = 1,768 n = 3,623 n = 3,177

Applied Research Center Miami University
Page 15
FAIRFIELD COUNTY
According to the survey results, seat belt use in Fairfield
County for all occupants (drivers and passengers)
remained relatively consistent (i.e., 78% to 76%)
throughout the surveys. However, as shown, the
Baseline rate of 78% declined by 1% for each of the
subsequent surveys. In addition, the county is still below
NHTSA’s belt use goal of 85% for Ohio.
CROSS-TABULATION OF FAIRFIELD COUNTY SEAT BELT USE RATES BY SURVEY, DRIVER, AND FRONT SEAT PASSENGER, VEHICLE TYPE, AND OCCUPANTS’ DEMOGRAPHIC CHARACTERISTICS
DRIVER PASSENGER
BELTED UNBELTED TOTAL BELTED UNBELTED TOTAL
OVERALL RESULTS FOR FAIRFIELD COUNTY 76% 24% 3,830 80% 20% 740
SURVEY
BASELINE 78% 22% 1,204 79% 21% 306
JUNE 2009 75% 25% 657 85% 15% 194
SEPTEMBER 2009 76% 24% 1,969 78% 22% 240
VEHICLE TYPE
PASSENGER CAR 76% 24% 1,861 78% 22% 345
VAN/MINIVAN 85% 15% 466 87% 13% 110
SUV 80% 20% 828 89% 11% 156
PICKUP TRUCK 65% 35% 669 70% 30% 128
SEX MALE 71% 29% 2,041 73% 27% 252
FEMALE 82% 18% 1,776 84% 16% 482
AGE
0 - 4 - - - 75% 25% 4
5 - 14 - - - 85% 15% 100
15 - 25 68% 32% 594 70% 30% 184
26 - 64 78% 22% 2,821 81% 19% 340
65+ 76% 24% 382 94% 6% 103
RACE
CAUCASIAN 76% 24% 3,576 81% 19% 693
AFRICAN AMERICAN 79% 21% 123 77% 23% 22
OTHER 58% 42% 24 80% 20% 5
78% 77% 76%
22% 23% 24%
0%
20%
40%
60%
80%
100%
Baseline June 2009 September 2009
Belted
Unbelted
FAIRFIELD COUNTY
n = 1,510 n = 851 n = 2,209

Applied Research Center Miami University
Page 16
FRANKLIN COUNTY
Seat belt usage in Franklin County for all occupants
(drivers and passengers) increased slightly between the
2009 surveys: Baseline (71%), June (73%), and
September (74%). While seat belt use increased, the
final usage rate is still well below the seat belt use goal
of 85% for the state of Ohio.
CROSS-TABULATION OF FRANKLIN COUNTY SEAT BELT USE RATES BY SURVEY, DRIVER, AND FRONT SEAT PASSENGER, VEHICLE TYPE, AND OCCUPANTS’ DEMOGRAPHIC CHARACTERISTICS
DRIVER PASSENGER
BELTED UNBELTED TOTAL BELTED UNBELTED TOTAL
OVERALL RESULTS FOR FRANKLIN COUNTY 74% 26% 4,272 64% 36% 815
SURVEY
BASELINE 73% 27% 1,301 61% 39% 240
JUNE 2009 74% 26% 1,370 67% 33% 287
SEPTEMBER 2009 76% 24% 1,601 63% 38% 288
VEHICLE TYPE
PASSENGER CAR 74% 26% 2,392 62% 38% 449
VAN/MINIVAN 79% 21% 449 65% 35% 105
SUV 78% 22% 849 72% 28% 166
PICKUP TRUCK 66% 34% 565 53% 47% 90
SEX MALE 69% 31% 2,464 58% 42% 340
FEMALE 81% 19% 1,790 67% 33% 471
AGE
0 - 4 - - - 100% - 3
5 - 14 - - - 68% 32% 65
15 - 25 64% 36% 686 57% 43% 288
26 - 64 76% 24% 3,173 65% 35% 363
65+ 78% 22% 397 76% 24% 90
RACE
CAUCASIAN 75% 25% 3,425 64% 36% 632
AFRICAN AMERICAN 68% 32% 596 60% 40% 121
OTHER 72% 28% 208 63% 37% 54
71% 73% 74%
29% 27% 26%
0%
20%
40%
60%
80%
100%
Baseline June 2009 September 2009
Belted
Unbelted
FRANKLIN COUNTY
n = 1,541 n = 1,657 n = 1,889
Applied Research Center Miami University
Page 17
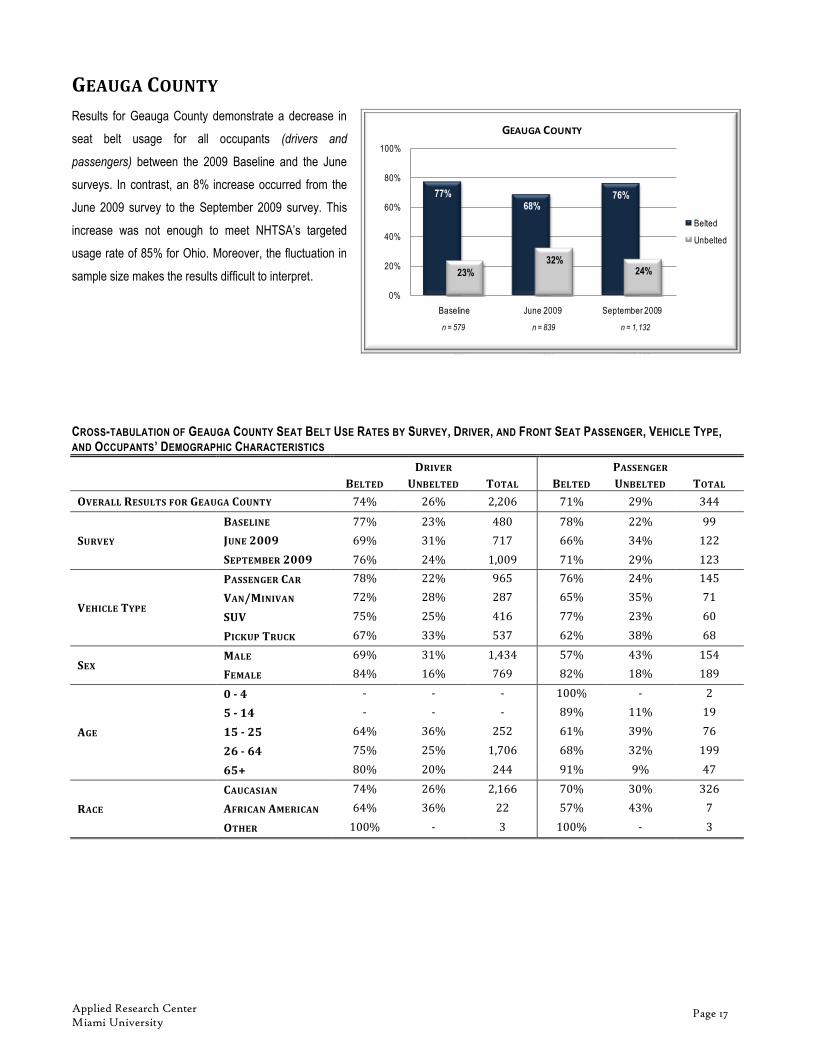
GEAUGA COUNTY
Results for Geauga County demonstrate a decrease in
seat belt usage for all occupants (drivers and
passengers) between the 2009 Baseline and the June
surveys. In contrast, an 8% increase occurred from the
June 2009 survey to the September 2009 survey. This
increase was not enough to meet NHTSA’s targeted
usage rate of 85% for Ohio. Moreover, the fluctuation in
sample size makes the results difficult to interpret.
CROSS-TABULATION OF GEAUGA COUNTY SEAT BELT USE RATES BY SURVEY, DRIVER, AND FRONT SEAT PASSENGER, VEHICLE TYPE, AND OCCUPANTS’ DEMOGRAPHIC CHARACTERISTICS
DRIVER PASSENGER
BELTED UNBELTED TOTAL BELTED UNBELTED TOTAL
OVERALL RESULTS FOR GEAUGA COUNTY 74% 26% 2,206 71% 29% 344
SURVEY
BASELINE 77% 23% 480 78% 22% 99
JUNE 2009 69% 31% 717 66% 34% 122
SEPTEMBER 2009 76% 24% 1,009 71% 29% 123
VEHICLE TYPE
PASSENGER CAR 78% 22% 965 76% 24% 145
VAN/MINIVAN 72% 28% 287 65% 35% 71
SUV 75% 25% 416 77% 23% 60
PICKUP TRUCK 67% 33% 537 62% 38% 68
SEX MALE 69% 31% 1,434 57% 43% 154
FEMALE 84% 16% 769 82% 18% 189
AGE
0 - 4 - - - 100% - 2
5 - 14 - - - 89% 11% 19
15 - 25 64% 36% 252 61% 39% 76
26 - 64 75% 25% 1,706 68% 32% 199
65+ 80% 20% 244 91% 9% 47
RACE
CAUCASIAN 74% 26% 2,166 70% 30% 326
AFRICAN AMERICAN 64% 36% 22 57% 43% 7
OTHER 100% - 3 100% - 3
77%
68%76%
23%
32%24%
0%
20%
40%
60%
80%
100%
Baseline June 2009 September 2009
Belted
Unbelted
GEAUGA COUNTY
n = 579 n = 839 n = 1,132
Applied Research Center Miami University
Page 18
GREENE COUNTY
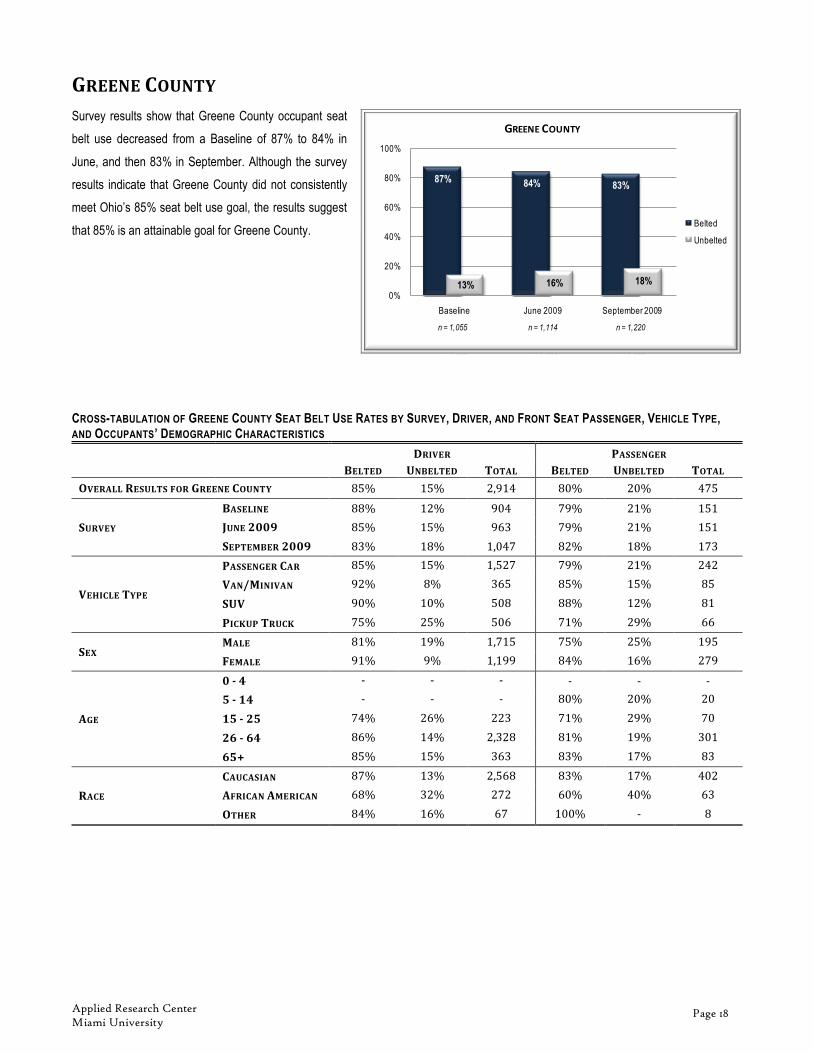
Survey results show that Greene County occupant seat
belt use decreased from a Baseline of 87% to 84% in
June, and then 83% in September. Although the survey
results indicate that Greene County did not consistently
meet Ohio’s 85% seat belt use goal, the results suggest
that 85% is an attainable goal for Greene County.
CROSS-TABULATION OF GREENE COUNTY SEAT BELT USE RATES BY SURVEY, DRIVER, AND FRONT SEAT PASSENGER, VEHICLE TYPE, AND OCCUPANTS’ DEMOGRAPHIC CHARACTERISTICS
DRIVER PASSENGER
BELTED UNBELTED TOTAL BELTED UNBELTED TOTAL
OVERALL RESULTS FOR GREENE COUNTY 85% 15% 2,914 80% 20% 475
SURVEY
BASELINE 88% 12% 904 79% 21% 151
JUNE 2009 85% 15% 963 79% 21% 151
SEPTEMBER 2009 83% 18% 1,047 82% 18% 173
VEHICLE TYPE
PASSENGER CAR 85% 15% 1,527 79% 21% 242
VAN/MINIVAN 92% 8% 365 85% 15% 85
SUV 90% 10% 508 88% 12% 81
PICKUP TRUCK 75% 25% 506 71% 29% 66
SEX MALE 81% 19% 1,715 75% 25% 195
FEMALE 91% 9% 1,199 84% 16% 279
AGE
0 - 4 - - - - - -
5 - 14 - - - 80% 20% 20
15 - 25 74% 26% 223 71% 29% 70
26 - 64 86% 14% 2,328 81% 19% 301
65+ 85% 15% 363 83% 17% 83
RACE
CAUCASIAN 87% 13% 2,568 83% 17% 402
AFRICAN AMERICAN 68% 32% 272 60% 40% 63
OTHER 84% 16% 67 100% - 8
87% 84% 83%
13% 16% 18%
0%
20%
40%
60%
80%
100%
Baseline June 2009 September 2009
Belted
Unbelted
GREENE COUNTY
n = 1,055 n = 1,114 n = 1,220

Applied Research Center Miami University
Page 19
HAMILTON COUNTY
Seat belt usage in Hamilton County for all occupants
(drivers and passengers) remained the same (77%)
between the 2009 Baseline and the June survey. This
rate is below the targeted usage rate of 85% from
NHTSA’s for the state of Ohio. Hamilton County did not
submit surveys for September.
CROSS-TABULATION OF HAMILTON COUNTY SEAT BELT USE RATES BY SURVEY, DRIVER, AND FRONT SEAT PASSENGER, VEHICLE TYPE, AND OCCUPANTS’ DEMOGRAPHIC CHARACTERISTICS
DRIVER PASSENGER
BELTED UNBELTED TOTAL BELTED UNBELTED TOTAL
OVERALL RESULTS FOR HAMILTON COUNTY 78% 22% 3,224 72% 28% 652
SURVEY
BASELINE 78% 22% 1,727 72% 28% 366
JUNE 2009 78% 22% 1,497 71% 29% 286
SEPTEMBER 2009 - - - - - -
VEHICLE TYPE
PASSENGER CAR 80% 20% 1,887 74% 26% 335
VAN/MINIVAN 80% 20% 402 73% 27% 105
SUV 76% 24% 646 74% 26% 154
PICKUP TRUCK 66% 34% 277 53% 47% 57
SEX MALE 74% 26% 1,800 65% 35% 295
FEMALE 83% 17% 1,407 78% 22% 355
AGE
0 - 4 - - - 50% 50% 8
5 - 14 - - - 80% 20% 84
15 - 25 71% 29% 471 58% 42% 187
26 - 64 78% 22% 2,482 73% 27% 289
65+ 86% 14% 259 96% 4% 80
RACE
CAUCASIAN 81% 19% 2,347 80% 20% 423
AFRICAN AMERICAN 69% 31% 778 52% 48% 196
OTHER 76% 24% 82 89% 11% 27
77% 77%
23% 23%
0%
20%
40%
60%
80%
100%
Baseline June 2009
Belted
Unbelted
HAMILTON COUNTY
n = 2,093 n = 1,783

Applied Research Center Miami University
Page 20
HANCOCK COUNTY
Results for Hancock County show that seat belt usage
for all occupants (drivers and passengers) steadily
increased throughout the survey period. Between the
2009 Baseline and the June survey, a 3% increase
occurred, and a 3% increase was noted from the June
survey (88%) to the September survey (91%). Hancock
County consistently remained at or above NHTSA’s
targeted seat belt use rate of 85% for Ohio.
CROSS-TABULATION OF HANCOCK COUNTY SEAT BELT USE RATES BY SURVEY, DRIVER, AND FRONT SEAT PASSENGER, VEHICLE TYPE, AND OCCUPANTS’ DEMOGRAPHIC CHARACTERISTICS
DRIVER PASSENGER
BELTED UNBELTED TOTAL BELTED UNBELTED TOTAL
OVERALL RESULTS FOR HANCOCK COUNTY 89% 11% 922 85% 15% 211
SURVEY
BASELINE 86% 14% 284 80% 20% 85
JUNE 2009 89% 11% 357 86% 14% 76
SEPTEMBER 2009 91% 9% 281 92% 8% 50
VEHICLE TYPE
PASSENGER CAR 88% 12% 497 83% 17% 107
VAN/MINIVAN 95% 5% 98 95% 5% 22
SUV 89% 11% 168 95% 5% 41
PICKUP TRUCK 87% 13% 157 73% 28% 40
SEX MALE 86% 14% 546 73% 27% 77
FEMALE 92% 8% 376 92% 8% 134
AGE
0 – 4 - - - 100% - 1
5 – 14 - - - 82% 18% 17
15 - 25 81% 19% 187 81% 19% 43
26 - 64 91% 9% 570 85% 15% 107
65+ 88% 12% 165 88% 12% 43
RACE
CAUCASIAN 88% 12% 883 85% 15% 200
AFRICAN AMERICAN 100% - 16 80% 20% 5
OTHER 82% 18% 17 80% 20% 5
85% 88% 91%
15% 12% 9%0%
20%
40%
60%
80%
100%
Baseline June 2009 September 2009
Belted
Unbelted
HANCOCK COUNTY
n = 369 n = 433 n = 331

Applied Research Center Miami University
Page 21
HARDIN COUNTY
The June 2009 surveys were the first, and only, surveys
submitted for analysis for Hardin County. Seat belt usage for all
occupants (drivers and passengers) was 76%, and thus well
below NHTSA’s seat belt usage goal of 85% for Ohio. Also, the
results for the county are based on a small sample of
observations.
CROSS-TABULATION OF HARDIN COUNTY SEAT BELT USE RATES BY SURVEY, DRIVER, AND FRONT SEAT PASSENGER, VEHICLE TYPE, AND
OCCUPANTS’ DEMOGRAPHIC CHARACTERISTICS
DRIVER PASSENGER
BELTED UNBELTED TOTAL BELTED UNBELTED TOTAL
OVERALL RESULTS FOR HARDIN COUNTY 71% 29% 28 86% 14% 14
SURVEY
BASELINE - - - - - -
JUNE 2009 71% 29% 28 86% 14% 14
SEPTEMBER 2009 - - - - - -
VEHICLE TYPE
PASSENGER CAR 63% 38% 16 80% 20% 10
VAN/MINIVAN 100% - 2 - - -
SUV 100% - 4 100% - 2
PICKUP TRUCK 80% 20% 5 100% - 1
SEX MALE 61% 39% 18 80% 20% 5
FEMALE 90% 10% 10 86% 14% 7
AGE
0 - 4 - - - 100% - 2
5 - 14 - - - 100% - 1
15 - 25 67% 33% 3 100% - 2
26 - 64 71% 29% 24 71% 29% 7
65+ 100% - 1 - - -
RACE
CAUCASIAN 74% 26% 27 91% 9% 11
AFRICAN AMERICAN - - - - - -
OTHER - - - - - -
76%
24%
0%
20%
40%
60%
80%
100%
June 2009
Belted
Unbelted
HARDIN COUNTY
n = 42

Applied Research Center Miami University
Page 22
HIGHLAND COUNTY
Seat belt usage in Highland County for all occupants
(drivers and passengers) decreased slightly between the
2009 Baseline and the June survey, as well as the June
and September surveys. The usage rate fell 3% from the
Baseline (79%) to the September survey (76%). These
rates are below NHTSA’s targeted usage rate of 85% for
the state of Ohio. Also, seat belt use estimates for this
county are based on a small sample of observations.
CROSS-TABULATION OF HIGHLAND COUNTY SEAT BELT USE RATES BY SURVEY, DRIVER, AND FRONT SEAT PASSENGER, VEHICLE TYPE, AND OCCUPANTS’ DEMOGRAPHIC CHARACTERISTICS
DRIVER PASSENGER
BELTED UNBELTED TOTAL BELTED UNBELTED TOTAL
OVERALL RESULTS FOR HIGHLAND COUNTY 78% 22% 246 75% 25% 20
SURVEY
BASELINE 79% 21% 82 77% 23% 13
JUNE 2009 78% 22% 81 71% 29% 7
SEPTEMBER 2009 76% 24% 83 - - -
VEHICLE TYPE
PASSENGER CAR 81% 19% 89 67% 33% 9
VAN/MINIVAN 90% 10% 20 - - -
SUV 97% 3% 38 80% 20% 5
PICKUP TRUCK 65% 35% 99 83% 17% 6
SEX MALE 69% 31% 154 67% 33% 3
FEMALE 92% 8% 92 76% 24% 17
AGE
0 - 4 - - - 100% - 1
5 - 14 - - - 80% 20% 5
15 - 25 83% 17% 46 50% 50% 4
26 - 64 78% 22% 175 71% 29% 7
65+ 68% 32% 25 100% - 3
RACE
CAUCASIAN 78% 22% 232 75% 25% 16
AFRICAN AMERICAN 62% 38% 13 75% 25% 4
OTHER 100% - 1 - - -
79% 77% 76%
21% 23% 24%
0%
20%
40%
60%
80%
100%
Baseline June 2009 September 2009
Belted
Unbelted
HIGHLAND COUNTY
n = 95 n = 88 n = 83

Applied Research Center Miami University
Page 23
HOLMES COUNTY
Holmes County survey results indicate a slight increase
in seat belt use from the Baseline occupant usage rate of
75% to the June rate of 77%. Despite this increase,
Holmes County remains well below the usage rate target
of 85% for the state of Ohio. No September surveys
were submitted for analysis.
CROSS-TABULATION OF HOLMES COUNTY SEAT BELT USE RATES BY SURVEY, DRIVER, AND FRONT SEAT PASSENGER, VEHICLE TYPE, AND OCCUPANTS’ DEMOGRAPHIC CHARACTERISTICS
DRIVER PASSENGER
BELTED UNBELTED TOTAL BELTED UNBELTED TOTAL
OVERALL RESULTS FOR HOLMES COUNTY 76% 24% 1,975 76% 24% 629
SURVEY
BASELINE 76% 24% 1,069 71% 29% 284
JUNE 2009 76% 24% 906 81% 19% 345
SEPTEMBER 2009 - - - - - -
VEHICLE TYPE
PASSENGER CAR 80% 20% 811 78% 22% 263
VAN/MINIVAN 86% 14% 256 84% 16% 115
SUV 81% 19% 388 79% 21% 117
PICKUP TRUCK 61% 39% 518 63% 37% 134
SEX MALE 72% 28% 1,146 62% 38% 191
FEMALE 81% 19% 828 82% 18% 438
AGE
0 - 4 - - - - - -
5 - 14 - - - 82% 18% 49
15 - 25 71% 29% 297 65% 35% 98
26 - 64 75% 25% 1,053 77% 23% 287
65+ 82% 18% 287 83% 17% 127
RACE
CAUCASIAN 76% 24% 1,624 77% 23% 547
AFRICAN AMERICAN 75% 25% 4 75% 25% 4
OTHER 60% 40% 5 60% 40% 10
75% 77%
25% 23%
0%
20%
40%
60%
80%
100%
Baseline June 2009
Belted
Unbelted
HOLMES COUNTY
n = 1,353 n = 1,251
Applied Research Center Miami University
Page 24
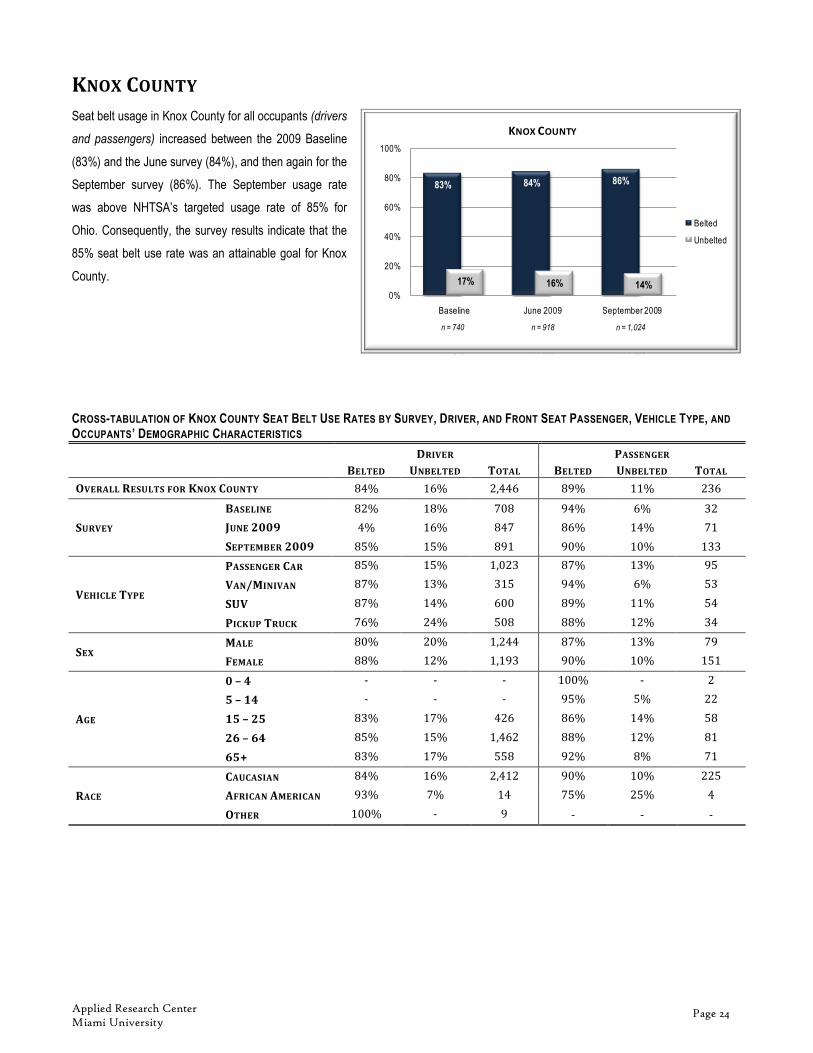
KNOX COUNTY
Seat belt usage in Knox County for all occupants (drivers
and passengers) increased between the 2009 Baseline
(83%) and the June survey (84%), and then again for the
September survey (86%). The September usage rate
was above NHTSA’s targeted usage rate of 85% for
Ohio. Consequently, the survey results indicate that the
85% seat belt use rate was an attainable goal for Knox
County.
CROSS-TABULATION OF KNOX COUNTY SEAT BELT USE RATES BY SURVEY, DRIVER, AND FRONT SEAT PASSENGER, VEHICLE TYPE, AND
OCCUPANTS’ DEMOGRAPHIC CHARACTERISTICS
DRIVER PASSENGER
BELTED UNBELTED TOTAL BELTED UNBELTED TOTAL
OVERALL RESULTS FOR KNOX COUNTY 84% 16% 2,446 89% 11% 236
SURVEY
BASELINE 82% 18% 708 94% 6% 32
JUNE 2009 4% 16% 847 86% 14% 71
SEPTEMBER 2009 85% 15% 891 90% 10% 133
VEHICLE TYPE
PASSENGER CAR 85% 15% 1,023 87% 13% 95
VAN/MINIVAN 87% 13% 315 94% 6% 53
SUV 87% 14% 600 89% 11% 54
PICKUP TRUCK 76% 24% 508 88% 12% 34
SEX MALE 80% 20% 1,244 87% 13% 79
FEMALE 88% 12% 1,193 90% 10% 151
AGE
0 – 4 - - - 100% - 2
5 – 14 - - - 95% 5% 22
15 – 25 83% 17% 426 86% 14% 58
26 – 64 85% 15% 1,462 88% 12% 81
65+ 83% 17% 558 92% 8% 71
RACE
CAUCASIAN 84% 16% 2,412 90% 10% 225
AFRICAN AMERICAN 93% 7% 14 75% 25% 4
OTHER 100% - 9 - - -
83% 84% 86%
17% 16% 14%0%
20%
40%
60%
80%
100%
Baseline June 2009 September 2009
Belted
Unbelted
KNOX COUNTY
n = 740 n = 918 n = 1,024

Applied Research Center Miami University
Page 25
LAKE COUNTY
Results for Lake County show a steady decrease in seat
belt usage for all occupants (drivers and passengers).
The usage rate fell 5% from the Baseline (72%) to the
September survey (67%). Consequently, seat belt use in
Lake County is well below NHTSA’s targeted usage rate
of 85% for Ohio.
CROSS-TABULATION OF LAKE COUNTY SEAT BELT USE RATES BY SURVEY, DRIVER, AND FRONT SEAT PASSENGER, VEHICLE TYPE, AND
OCCUPANTS’ DEMOGRAPHIC CHARACTERISTICS
DRIVER PASSENGER
BELTED UNBELTED TOTAL BELTED UNBELTED TOTAL
OVERALL RESULTS FOR LAKE COUNTY 71% 29% 4,309 67% 33% 778
SURVEY
BASELINE 72% 28% 1,633 70% 30% 291
JUNE 2009 72% 28% 1,369 67% 33% 267
SEPTEMBER 2009 68% 32% 1,307 61% 39% 220
VEHICLE TYPE
PASSENGER CAR 70% 30% 2,368 67% 33% 451
VAN/MINIVAN 75% 25% 557 75% 25% 109
SUV 77% 23% 768 72% 28% 123
PICKUP TRUCK 59% 41% 580 45% 55% 89
SEX MALE 67% 33% 2,375 66% 34% 470
FEMALE 74% 26% 1,926 68% 32% 304
AGE
0 - 4 - - - - - -
5 - 14 - - - 69% 31% 48
15 - 25 60% 40% 430 58% 42% 202
26 - 64 71% 29% 3,480 66% 34% 411
65+ 79% 21% 376 83% 17% 112
RACE
CAUCASIAN 71% 29% 4,024 67% 33% 698
AFRICAN AMERICAN 54% 46% 204 63% 38% 48
OTHER 68% 32% 28 71% 29% 7
72% 71%67%
28% 29%33%
0%
20%
40%
60%
80%
100%
Baseline June 2009 September 2009
Belted
Unbelted
LAKE COUNTY
n = 1,924 n = 1,636 n = 1,527

Applied Research Center Miami University
Page 26
LAWRENCE COUNTY
Seat belt usage in Lawrence County for all occupants
(drivers and passengers) decreased between the 2008
Baseline and the June survey. The usage rate fell 5%
from the Baseline (83%) to the June survey (78%). This
decline in seat belt use brought the average further from
NHTSA’s targeted usage rate of 85%. No September
surveys for this county were submitted for analysis.
Furthermore, both samples are small, especially the
Baseline sample.
CROSS-TABULATION OF LAWRENCE COUNTY SEAT BELT USE RATES BY SURVEY, DRIVER, AND FRONT SEAT PASSENGER, VEHICLE TYPE, AND OCCUPANTS’ DEMOGRAPHIC CHARACTERISTICS
DRIVER PASSENGER
BELTED UNBELTED TOTAL BELTED UNBELTED TOTAL
OVERALL RESULTS FOR LAWRENCE COUNTY 78% 22% 351 82% 18% 102
SURVEY
BASELINE 84% 16% 106 79% 21% 29
JUNE 2009 76% 24% 245 84% 16% 73
SEPTEMBER 2009 - - - - - -
VEHICLE TYPE
PASSENGER CAR 80% 20% 164 78% 22% 50
VAN/MINIVAN 82% 18% 39 92% 8% 12
SUV 77% 23% 53 88% 13% 16
PICKUP TRUCK 74% 26% 95 83% 17% 24
SEX MALE 74% 26% 207 81% 19% 32
FEMALE 85% 15% 143 84% 16% 68
AGE
0 - 4 - - - - - -
5 - 14 - - - 80% 20% 5
15 - 25 80% 20% 30 89% 11% 27
26 - 64 78% 22% 307 79% 21% 66
65+ 92% 8% 13 100% - 4
RACE
CAUCASIAN 79% 21% 337 82% 18% 100
AFRICAN AMERICAN 67% 33% 3 100% - 2
OTHER 100% - 1 - - -
83%78%
17%22%
0%
20%
40%
60%
80%
100%
Baseline June 2009
Belted
Unbelted
LAWRENCE COUNTY
n = 135 n = 318

Applied Research Center Miami University
Page 27
LICKING COUNTY
Results from Licking County show the seat belt usage
rate for all occupants (drivers and passengers) was 80%
for the Baseline, and decreased to 78% for the June
survey. The results then decreased further to 74% for
the September survey. Therefore, Licking County seat
belt use is below NHTSA’s target usage rate of 85% for
Ohio.
CROSS-TABULATION OF LICKING COUNTY SEAT BELT USE RATES BY SURVEY, DRIVER, AND FRONT SEAT PASSENGER, VEHICLE TYPE, AND
OCCUPANTS’ DEMOGRAPHIC CHARACTERISTICS
DRIVER PASSENGER
BELTED UNBELTED TOTAL BELTED UNBELTED TOTAL
OVERALL RESULTS FOR LICKING COUNTY 79% 21% 3,355 74% 26% 901
SURVEY
BASELINE 81% 19% 1,119 79% 21% 263
JUNE 2009 79% 21% 1,251 76% 24% 386
SEPTEMBER 2009 76% 24% 985 66% 34% 252
VEHICLE TYPE
PASSENGER CAR 79% 21% 1,638 78% 22% 432
VAN/MINIVAN 83% 17% 362 79% 21% 141
SUV 85% 15% 627 79% 21% 157
PICKUP TRUCK 69% 31% 727 56% 44% 170
SEX MALE 76% 24% 1,925 66% 34% 370
FEMALE 82% 18% 1,418 79% 21% 530
AGE
0 - 4 - - - 100% - 5
5 - 14 - - - 73% 27% 89
15 - 25 75% 25% 502 68% 32% 181
26 - 64 78% 22% 2,477 73% 27% 489
65+ 84% 16% 361 88% 12% 116
RACE
CAUCASIAN 78% 22% 3,241 74% 26% 874
AFRICAN AMERICAN 79% 21% 57 72% 28% 18
OTHER 80% 20% 15 50% 50% 6
80% 78%74%
20% 22%26%
0%
20%
40%
60%
80%
100%
Baseline June 2009 September 2009
Belted
Unbelted
LICKING COUNTY
n = 1,382 n = 1,637 n = 1,237

Applied Research Center Miami University
Page 28
LOGAN COUNTY
Results for all occupants (drivers and passengers) in
Logan County show that seat belt use decreased from
87% during the Baseline to 86% for the June survey,
down to 82% for the September survey. These results
indicate that Logan County was above NHTSA’s 85%
target rate during the Baseline and June surveys, but not
for the September survey.
CROSS-TABULATION OF LOGAN COUNTY SEAT BELT USE RATES BY SURVEY, DRIVER, AND FRONT SEAT PASSENGER, VEHICLE TYPE, AND
OCCUPANTS’ DEMOGRAPHIC CHARACTERISTICS
DRIVER PASSENGER
BELTED UNBELTED TOTAL BELTED UNBELTED TOTAL
OVERALL RESULTS FOR LOGAN COUNTY 84% 16% 437 86% 14% 106
SURVEY
BASELINE 87% 13% 85 86% 145 21
JUNE 2009 86% 14% 153 87% 13% 38
SEPTEMBER 2009 81% 19% 199 85% 15% 47
VEHICLE TYPE
PASSENGER CAR 87% 13% 192 86% 14% 49
VAN/MINIVAN 85% 15% 52 88% 12% 17
SUV 90% 10% 86 95% 5% 20
PICKUP TRUCK 74% 26% 107 75% 25% 20
SEX MALE 81% 19% 269 70% 30% 33
FEMALE 90% 10% 167 93% 7% 73
AGE
0 - 4 - - - - - -
5 - 14 - - - 100% - 5
15 - 25 80% 20% 35 89% 11% 18
26 - 64 84% 16% 369 84% 16% 70
65+ 85% 15% 33 85% 15% 13
RACE
CAUCASIAN 84% 16% 432 86% 14% 104
AFRICAN AMERICAN 100% - 4 100% - 2
OTHER - - - - - -
87% 86%82%
13% 14%18%
0%
20%
40%
60%
80%
100%
Baseline June 2009 September 2009
Belted
Unbelted
LOGAN COUNTY
n = 106 n = 191 n = 246

Applied Research Center Miami University
Page 29
LORAIN COUNTY
The seat belt usage rate for all occupants (drivers and
passengers) in Lorain County fluctuated slightly between
the 2009 Baseline (78%) and the June (73%) and
September (74%) surveys. Consequently, seat belt use
results are below NHTSA’s target usage rate of 85% for
Ohio.
CROSS-TABULATION OF LORAIN COUNTY SEAT BELT USE RATES BY SURVEY, DRIVER, AND FRONT SEAT PASSENGER, VEHICLE TYPE, AND
OCCUPANTS’ DEMOGRAPHIC CHARACTERISTICS
DRIVER PASSENGER
BELTED UNBELTED TOTAL BELTED UNBELTED TOTAL
OVERALL RESULTS FOR LORAIN COUNTY 75% 25% 5,654 73% 27% 1,104
SURVEY
BASELINE 77% 23% 1,769 78% 22% 365
JUNE 2009 73% 27% 1,958 70% 30% 390
SEPTEMBER 2009 75% 25% 1,927 71% 29% 349
VEHICLE TYPE
PASSENGER CAR 76% 24% 3,025 74% 26% 601
VAN/MINIVAN 76% 24% 625 80% 20% 144
SUV 79% 21% 1,034 73% 27% 198
PICKUP TRUCK 67% 33% 959 66% 34% 159
SEX MALE 73% 27% 3,179 63% 37% 398
FEMALE 78% 22% 2,448 79% 21% 701
AGE
0 - 4 - - - 97% 3% 31
5 - 14 - - - 81% 19% 120
15 - 25 70% 30% 891 60% 40% 273
26 - 64 75% 25% 4,062 73% 27% 477
65+ 85% 15% 661 85% 15% 201
RACE
CAUCASIAN 76% 24% 5,172 75% 25% 980
AFRICAN AMERICAN 64% 36% 331 53% 47% 81
OTHER 60% 40% 95 64% 36% 25
78%73% 74%
23%27% 26%
0%
20%
40%
60%
80%
100%
Baseline June 2009 September 2009
Belted
Unbelted
LORAIN COUNTY
n = 2,134 n = 2,348 n = 2,276

Applied Research Center Miami University
Page 30
LUCAS COUNTY
After achieving a Baseline seat belt use rate of 84%,
subsequent survey results show that seat belt use in
Lucas County for all occupants (drivers and passengers)
remained at 79% for the June and the September
surveys. The reason for this decline in observed seat
belt use is unclear. Nevertheless, these results indicate
that Lucas County is below NHTSA’s goal of 85% seat
belt use for Ohio.
CROSS-TABULATION OF LUCAS COUNTY SEAT BELT USE RATES BY SURVEY, DRIVER, AND FRONT SEAT PASSENGER, VEHICLE TYPE, AND
OCCUPANTS’ DEMOGRAPHIC CHARACTERISTICS
DRIVER PASSENGER
BELTED UNBELTED TOTAL BELTED UNBELTED TOTAL
OVERALL RESULTS FOR LUCAS COUNTY 80% 20% 4,847 80% 20% 761
SURVEY
BASELINE 84% 16% 1,340 83% 17% 173
JUNE 2009 79% 21% 1,862 79% 21% 347
SEPTEMBER 2009 79% 21% 1,645 81% 19% 241
VEHICLE TYPE
PASSENGER CAR 80% 20% 2,749 78% 22% 421
VAN/MINIVAN 84% 16% 552 84% 16% 116
SUV 83% 17% 907 90% 10% 120
PICKUP TRUCK 75% 25% 633 73% 27% 104
SEX MALE 78% 22% 2,795 69% 31% 257
FEMALE 83% 17% 2,036 86% 14% 499
AGE
0 - 4 - - - 86% 14% 7
5 - 14 - - - 90% 10% 48
15 - 25 74% 26% 780 74% 26% 227
26 - 64 81% 19% 3,707 81% 19% 395
65+ 87% 13% 349 89% 11% 76
RACE
CAUCASIAN 82% 18% 4,069 85% 15% 608
AFRICAN AMERICAN 69% 31% 702 62% 38% 130
OTHER 72% 28% 36 73% 27% 11
84%79% 79%
16%21% 21%
0%
20%
40%
60%
80%
100%
Baseline June 2009 September 2009
Belted
Unbelted
LUCAS COUNTY
n = 1,513 n = 2,209 n = 1,886
Applied Research Center Miami University
Page 31
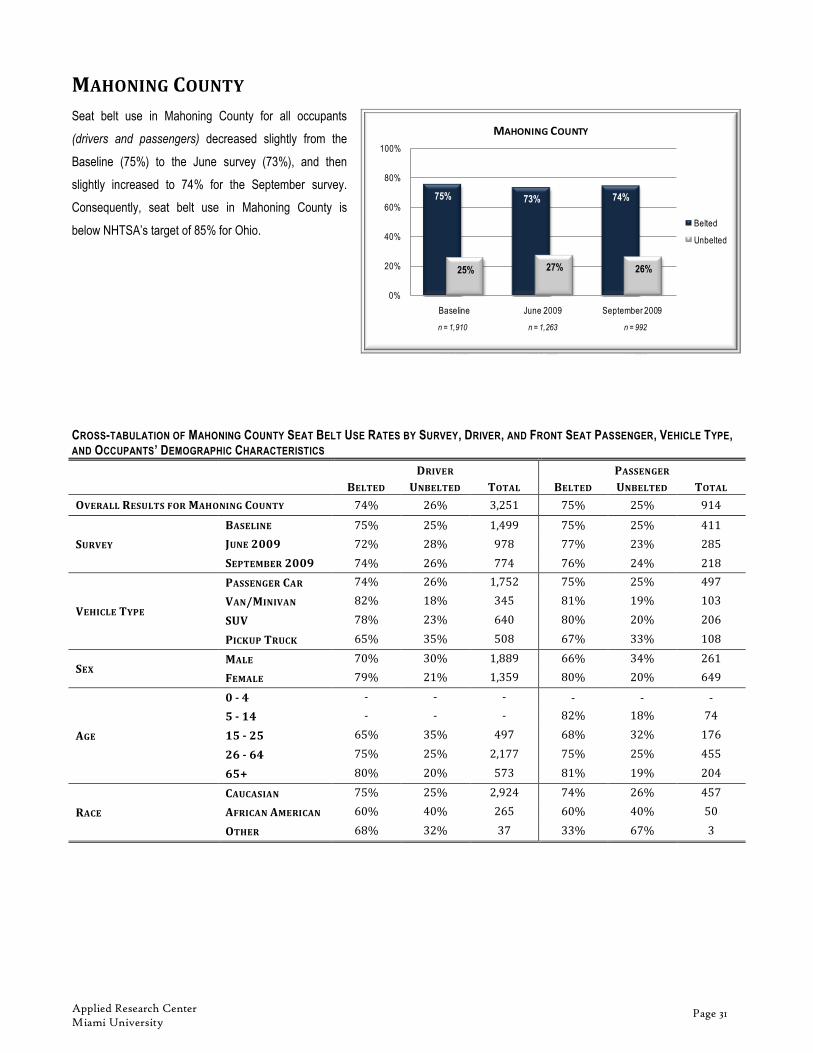
MAHONING COUNTY
Seat belt use in Mahoning County for all occupants
(drivers and passengers) decreased slightly from the
Baseline (75%) to the June survey (73%), and then
slightly increased to 74% for the September survey.
Consequently, seat belt use in Mahoning County is
below NHTSA’s target of 85% for Ohio.
CROSS-TABULATION OF MAHONING COUNTY SEAT BELT USE RATES BY SURVEY, DRIVER, AND FRONT SEAT PASSENGER, VEHICLE TYPE, AND OCCUPANTS’ DEMOGRAPHIC CHARACTERISTICS
DRIVER PASSENGER
BELTED UNBELTED TOTAL BELTED UNBELTED TOTAL
OVERALL RESULTS FOR MAHONING COUNTY 74% 26% 3,251 75% 25% 914
SURVEY
BASELINE 75% 25% 1,499 75% 25% 411
JUNE 2009 72% 28% 978 77% 23% 285
SEPTEMBER 2009 74% 26% 774 76% 24% 218
VEHICLE TYPE
PASSENGER CAR 74% 26% 1,752 75% 25% 497
VAN/MINIVAN 82% 18% 345 81% 19% 103
SUV 78% 23% 640 80% 20% 206
PICKUP TRUCK 65% 35% 508 67% 33% 108
SEX MALE 70% 30% 1,889 66% 34% 261
FEMALE 79% 21% 1,359 80% 20% 649
AGE
0 - 4 - - - - - -
5 - 14 - - - 82% 18% 74
15 - 25 65% 35% 497 68% 32% 176
26 - 64 75% 25% 2,177 75% 25% 455
65+ 80% 20% 573 81% 19% 204
RACE
CAUCASIAN 75% 25% 2,924 74% 26% 457
AFRICAN AMERICAN 60% 40% 265 60% 40% 50
OTHER 68% 32% 37 33% 67% 3
75% 73% 74%
25% 27% 26%
0%
20%
40%
60%
80%
100%
Baseline June 2009 September 2009
Belted
Unbelted
MAHONING COUNTY
n = 1,910 n = 1,263 n = 992

Applied Research Center Miami University
Page 32
MARION COUNTY
Seat belt usage in Marion County for all occupants
(drivers and passengers) decreased somewhat between
the 2009 Baseline and the June survey. The seat belt
usage rate then increased 11% during the September
survey (71%). However, the relatively small Baseline and
September samples make the results difficult to interpret.
Furthermore, observed seat belt use remains well below
NHTSA’s targeted usage rate of 85% for Ohio.
CROSS-TABULATION OF MARION COUNTY SEAT BELT USE RATES BY SURVEY, DRIVER, AND FRONT SEAT PASSENGER, VEHICLE TYPE, AND
OCCUPANTS’ DEMOGRAPHIC CHARACTERISTICS
DRIVER PASSENGER
BELTED UNBELTED TOTAL BELTED UNBELTED TOTAL
OVERALL RESULTS FOR MARION COUNTY 65% 35% 740 56% 44% 147
SURVEY
BASELINE 64% 36% 176 56% 44% 43
JUNE 2009 61% 39% 340 53% 47% 66
SEPTEMBER 2009 72% 28% 224 63% 37% 38
VEHICLE TYPE
PASSENGER CAR 70% 30% 369 63% 37% 76
VAN/MINIVAN 70% 30% 88 42% 58% 12
SUV 67% 33% 134 63% 37% 27
PICKUP TRUCK 46% 54% 148 41% 59% 32
SEX MALE 64% 36% 442 40% 60% 55
FEMALE 66% 34% 293 66% 34% 92
AGE
0 - 4 - - - 100% - 2
5 - 14 - - - 75% 25% 4
15 - 25 44% 56% 95 37% 63% 35
26 - 64 67% 33% 574 60% 40% 94
65+ 80% 20% 71 82% 18% 11
RACE
CAUCASIAN 65% 35% 692 59% 41% 134
AFRICAN AMERICAN 60% 40% 40 22% 78% 9
OTHER - 100% 1 - - -
62% 60%
71%
38% 40%
29%
0%
20%
40%
60%
80%
100%
Baseline June 2009 September 2009
Belted
Unbelted
MARION COUNTY
n = 219 n = 406 n = 262

Applied Research Center Miami University
Page 33
MEDINA COUNTY
Results shows that seat belt use in Medina County for all
occupants (drivers and passengers) decreased from
88% for the Baseline to 85% for the June survey and
then to 81% during the September survey period. This
decline in September put Medina County below
NHTSA’s target usage rate for Ohio of 85%. However,
the relatively smaller Baseline sample compared to
subsequent samples and the difference in size between
the June and September samples make results difficult
to interpret. Nevertheless, survey results indicate an
85% seat belt use rate is attainable for Medina County.
CROSS-TABULATION OF MEDINA COUNTY SEAT BELT USE RATES BY SURVEY, DRIVER, AND FRONT SEAT PASSENGER, VEHICLE TYPE, AND
OCCUPANTS’ DEMOGRAPHIC CHARACTERISTICS
DRIVER PASSENGER
BELTED UNBELTED TOTAL BELTED UNBELTED TOTAL
OVERALL RESULTS FOR MEDINA COUNTY 82% 18% 5,172 89% 11% 1,049
SURVEY
BASELINE 86% 14% 593 92% 8% 177
JUNE 2009 84% 16% 2,592 91% 9% 507
SEPTEMBER 2009 80% 20% 1,987 87% 13% 365
VEHICLE TYPE
PASSENGER CAR 83% 17% 2,634 88% 12% 504
VAN/MINIVAN 87% 13% 606 93% 7% 174
SUV 86% 14% 1,068 93% 7% 213
PICKUP TRUCK 74% 26% 845 85% 15% 150
SEX MALE 79% 21% 2,983 82% 18% 325
FEMALE 87% 13% 2,168 93% 7% 715
AGE
0 - 4 - - - 100% - 4
5 - 14 - - - 95% 5% 101
15 - 25 76% 24% 716 83% 17% 282
26 - 64 83% 17% 4,056 92% 8% 561
65+ 83% 17% 362 91% 9% 95
RACE
CAUCASIAN 82% 18% 5,021 90% 10% 1,027
AFRICAN AMERICAN 74% 26% 80 67% 33% 15
OTHER 73% 27% 11 67% 33% 3
88% 85%81%
13% 15%19%
0%
20%
40%
60%
80%
100%
Baseline June 2009 September 2009
Belted
Unbelted
MEDINA COUNTY
n = 770 n = 3,099 n = 2,352

Applied Research Center Miami University
Page 34
MIAMI COUNTY
Observed seat belt use in Miami County for all
occupants (drivers and passengers) declined
significantly between the Baseline (91%) and the June
survey (80%). This decrease brought Miami County well
below NHTSA’s target usage rate of 85% for Ohio. It
should be noted that Baseline findings for this county are
based on relatively few observations; furthermore, no
September surveys from this county were submitted for
analysis.
CROSS-TABULATION OF MIAMI COUNTY SEAT BELT USE RATES BY SURVEY, DRIVER, AND FRONT SEAT PASSENGER, VEHICLE TYPE, AND
OCCUPANTS’ DEMOGRAPHIC CHARACTERISTICS
DRIVER PASSENGER
BELTED UNBELTED TOTAL BELTED UNBELTED TOTAL
OVERALL RESULTS FOR MIAMI COUNTY 82% 18% 1,173 78% 22% 127
SURVEY
BASELINE 90% 10% 174 96% 4% 25
JUNE 2009 81% 19% 999 74% 27% 102
SEPTEMBER 2009 - - - - - -
VEHICLE TYPE
PASSENGER CAR 84% 16% 537 80% 20% 61
VAN/MINIVAN 91% 9% 127 94% 6% 16
SUV 88% 12% 236 89% 11% 18
PICKUP TRUCK 70% 30% 273 59% 41% 32
SEX MALE 77% 23% 660 70% 30% 57
FEMALE 89% 11% 511 84% 16% 70
AGE
0 - 4 - - - - - -
5 - 14 - - - 80% 20% 20
15 - 25 72% 28% 149 64% 36% 25
26 - 64 84% 16% 940 79% 21% 62
65+ 83% 18% 80 89% 11% 19
RACE
CAUCASIAN 82% 18% 1,116 77% 23% 118
AFRICAN AMERICAN 78% 22% 37 83% 17% 6
OTHER 90% 10% 10 100% - 3
91%
80%
10%20%
0%
20%
40%
60%
80%
100%
Baseline June 2009
Belted
Unbelted
n = 199 n = 1,101
MIAMI COUNTY
Applied Research Center Miami University
Page 35
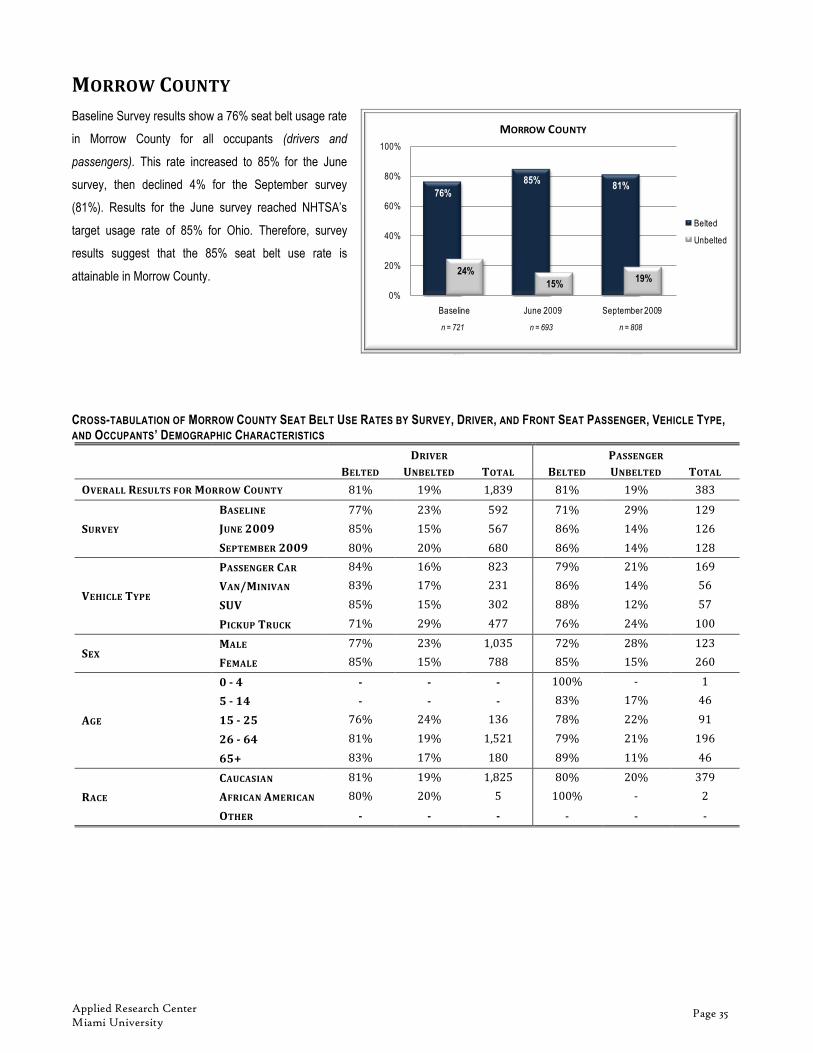
MORROW COUNTY
Baseline Survey results show a 76% seat belt usage rate
in Morrow County for all occupants (drivers and
passengers). This rate increased to 85% for the June
survey, then declined 4% for the September survey
(81%). Results for the June survey reached NHTSA’s
target usage rate of 85% for Ohio. Therefore, survey
results suggest that the 85% seat belt use rate is
attainable in Morrow County.
CROSS-TABULATION OF MORROW COUNTY SEAT BELT USE RATES BY SURVEY, DRIVER, AND FRONT SEAT PASSENGER, VEHICLE TYPE, AND OCCUPANTS’ DEMOGRAPHIC CHARACTERISTICS
DRIVER PASSENGER
BELTED UNBELTED TOTAL BELTED UNBELTED TOTAL
OVERALL RESULTS FOR MORROW COUNTY 81% 19% 1,839 81% 19% 383
SURVEY
BASELINE 77% 23% 592 71% 29% 129
JUNE 2009 85% 15% 567 86% 14% 126
SEPTEMBER 2009 80% 20% 680 86% 14% 128
VEHICLE TYPE
PASSENGER CAR 84% 16% 823 79% 21% 169
VAN/MINIVAN 83% 17% 231 86% 14% 56
SUV 85% 15% 302 88% 12% 57
PICKUP TRUCK 71% 29% 477 76% 24% 100
SEX MALE 77% 23% 1,035 72% 28% 123
FEMALE 85% 15% 788 85% 15% 260
AGE
0 - 4 - - - 100% - 1
5 - 14 - - - 83% 17% 46
15 - 25 76% 24% 136 78% 22% 91
26 - 64 81% 19% 1,521 79% 21% 196
65+ 83% 17% 180 89% 11% 46
RACE
CAUCASIAN 81% 19% 1,825 80% 20% 379
AFRICAN AMERICAN 80% 20% 5 100% - 2
OTHER - - - - - -
76%
85%81%
24%
15%19%
0%
20%
40%
60%
80%
100%
Baseline June 2009 September 2009
Belted
Unbelted
MORROW COUNTY
n = 721 n = 693 n = 808

Applied Research Center Miami University
Page 36
PICKAWAY COUNTY
Seat belt use in Pickaway County for all occupants
(drivers and passengers) decreased by 12% between
the Baseline (79%) and the June survey (67%). This
pattern continued as the rate dropped another 2% from
the June (67%) to September survey (65%). These
results show that Pickaway County is below NHTSA’s
target usage rate of 85% for Ohio. In addition, survey
results should be viewed with caution due to the
relatively small number of Baseline observations.
CROSS-TABULATION OF PICKAWAY COUNTY SEAT BELT USE RATES BY SURVEY, DRIVER, AND FRONT SEAT PASSENGER, VEHICLE TYPE, AND OCCUPANTS’ DEMOGRAPHIC CHARACTERISTICS
DRIVER PASSENGER
BELTED UNBELTED TOTAL BELTED UNBELTED TOTAL
OVERALL RESULTS FOR PICKAWAY COUNTY 68% 32% 1,049 64% 36% 205
SURVEY
BASELINE 79% 21% 168 77% 23% 31
JUNE 2009 67% 33% 466 63% 37% 99
SEPTEMBER 2009 65% 35% 415 60% 40% 75
VEHICLE TYPE
PASSENGER CAR 70% 30% 466 70% 30% 93
VAN/MINIVAN 76% 24% 93 89% 11% 9
SUV 71% 29% 178 67% 33% 39
PICKUP TRUCK 61% 39% 310 50% 50% 64
SEX MALE 67% 33% 642 58% 42% 88
FEMALE 71% 29% 402 69% 31% 116
AGE
0 - 4 - - - 50% 50% 2
5 - 14 - - - 100% - 2
15 - 25 58% 42% 178 55% 45% 44
26 - 64 70% 30% 771 66% 34% 125
65+ 78% 22% 94 71% 29% 31
RACE
CAUCASIAN 68% 32% 1,038 63% 37% 200
AFRICAN AMERICAN 100% - 3 100% - 2
OTHER 100% - 2 100% - 1
79%
67% 65%
21%
34% 36%
0%
20%
40%
60%
80%
100%
Baseline June 2009 September 2009
Belted
Unbelted
PICKAWAY COUNTY
n = 199 n = 565 n = 490
Applied Research Center Miami University
Page 37
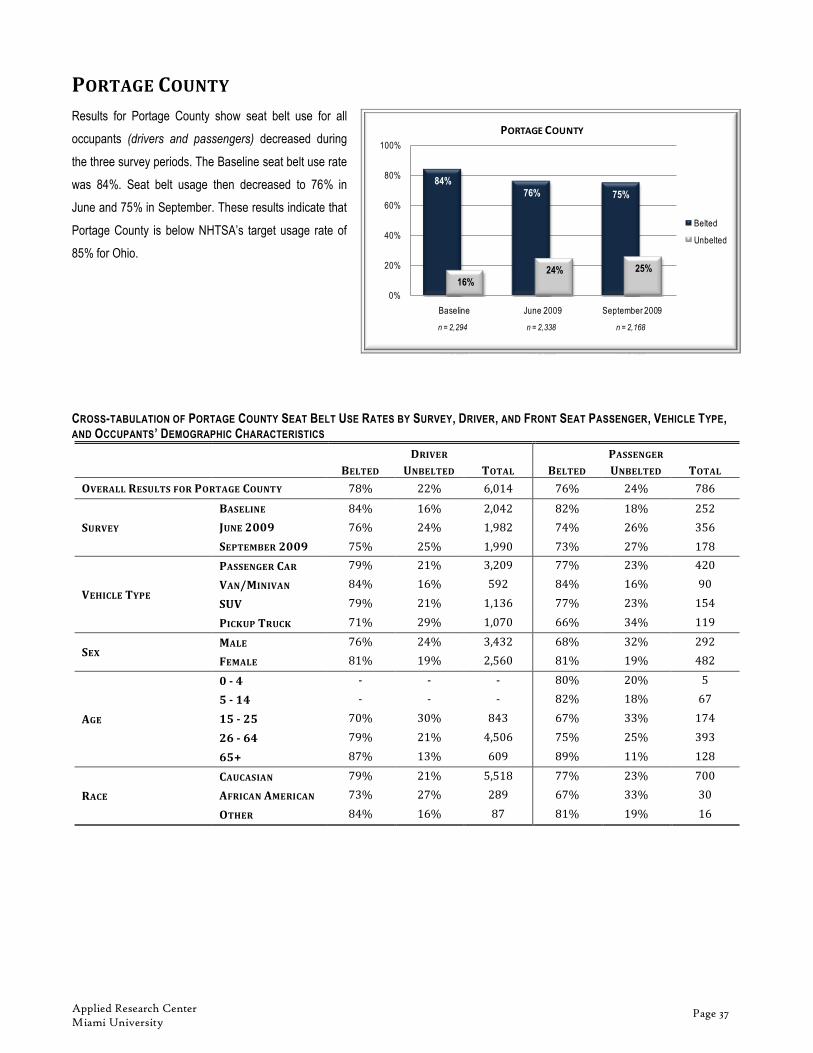
PORTAGE COUNTY
Results for Portage County show seat belt use for all
occupants (drivers and passengers) decreased during
the three survey periods. The Baseline seat belt use rate
was 84%. Seat belt usage then decreased to 76% in
June and 75% in September. These results indicate that
Portage County is below NHTSA’s target usage rate of
85% for Ohio.
CROSS-TABULATION OF PORTAGE COUNTY SEAT BELT USE RATES BY SURVEY, DRIVER, AND FRONT SEAT PASSENGER, VEHICLE TYPE, AND OCCUPANTS’ DEMOGRAPHIC CHARACTERISTICS
DRIVER PASSENGER
BELTED UNBELTED TOTAL BELTED UNBELTED TOTAL
OVERALL RESULTS FOR PORTAGE COUNTY 78% 22% 6,014 76% 24% 786
SURVEY
BASELINE 84% 16% 2,042 82% 18% 252
JUNE 2009 76% 24% 1,982 74% 26% 356
SEPTEMBER 2009 75% 25% 1,990 73% 27% 178
VEHICLE TYPE
PASSENGER CAR 79% 21% 3,209 77% 23% 420
VAN/MINIVAN 84% 16% 592 84% 16% 90
SUV 79% 21% 1,136 77% 23% 154
PICKUP TRUCK 71% 29% 1,070 66% 34% 119
SEX MALE 76% 24% 3,432 68% 32% 292
FEMALE 81% 19% 2,560 81% 19% 482
AGE
0 - 4 - - - 80% 20% 5
5 - 14 - - - 82% 18% 67
15 - 25 70% 30% 843 67% 33% 174
26 - 64 79% 21% 4,506 75% 25% 393
65+ 87% 13% 609 89% 11% 128
RACE
CAUCASIAN 79% 21% 5,518 77% 23% 700
AFRICAN AMERICAN 73% 27% 289 67% 33% 30
OTHER 84% 16% 87 81% 19% 16
84%76% 75%
16%24% 25%
0%
20%
40%
60%
80%
100%
Baseline June 2009 September 2009
Belted
Unbelted
PORTAGE COUNTY
n = 2,294 n = 2,338 n = 2,168

Applied Research Center Miami University
Page 38
RICHLAND COUNTY
Richland County demonstrated a slight decrease for all
occupants (drivers and passengers) in seat belt use over
the 2009 observation period. The Baseline rate was 85%
which decreased to 84% during the June survey and
then 82% during the September survey. Consequently,
survey results are at or just below the 85% usage rate
established for Ohio. Therefore, survey results suggest
the 85% seat belt use goal is attainable in Richland
County.
CROSS-TABULATION OF RICHLAND COUNTY SEAT BELT USE RATES BY SURVEY, DRIVER, AND FRONT SEAT PASSENGER, VEHICLE TYPE, AND OCCUPANTS’ DEMOGRAPHIC CHARACTERISTICS
DRIVER PASSENGER
BELTED UNBELTED TOTAL BELTED UNBELTED TOTAL
OVERALL RESULTS FOR RICHLAND COUNTY 85% 15% 8,252 80% 20% 1,722
SURVEY
BASELINE 85% 15% 3,640 82% 18% 755
JUNE 2009 85% 15% 2,223 81% 19% 487
SEPTEMBER 2009 84% 16% 2,389 75% 25% 480
VEHICLE TYPE
PASSENGER CAR 85% 15% 4,073 78% 22% 835
VAN/MINIVAN 88% 12% 947 87% 13% 261
SUV 90% 10% 1,578 88% 12% 300
PICKUP TRUCK 78% 22% 1,654 73% 27% 326
SEX MALE 82% 18% 4,667 72% 28% 710
FEMALE 89% 11% 3,581 86% 14% 1010
AGE
0 - 4 - - - 33% 67% 3
5 – 14 - - - 81% 19% 124
15 – 25 77% 23% 1,217 67% 33% 381
26 – 64 86% 14% 5,929 82% 18% 860
65+ 86% 14% 1,103 89% 11% 348
RACE
CAUCASIAN 86% 14% 7,445 82% 18% 1,513
AFRICAN AMERICAN 71% 29% 682 66% 34% 172
OTHER 75% 25% 111 71% 29% 31
85% 84% 82%
15% 16% 18%
0%
20%
40%
60%
80%
100%
Baseline June 2009 September 2009
Belted
Unbelted
RICHLAND COUNTY
n = 4,395 n = 2,710 n = 2,869

Applied Research Center Miami University
Page 39
ROSS COUNTY
The seat belt usage rate in Ross County for all
occupants (drivers and passengers) remained generally
consistent overall between the 2009 Baseline (74%) and
the June (76%) and September (76%) surveys.
Therefore, Ross County seat belt use is below NHTSA’s
targeted usage rate of 85% for Ohio.
CROSS-TABULATION OF ROSS COUNTY SEAT BELT USE RATES BY SURVEY, DRIVER, AND FRONT SEAT PASSENGER, VEHICLE TYPE, AND
OCCUPANTS’ DEMOGRAPHIC CHARACTERISTICS
DRIVER PASSENGER
BELTED UNBELTED TOTAL BELTED UNBELTED TOTAL
OVERALL RESULTS FOR ROSS COUNTY 75% 25% 5,111 72% 28% 633
SURVEY
BASELINE 74% 26% 1,816 70% 30% 308
JUNE 2009 76% 24% 1,736 72% 28% 212
SEPTEMBER 2009 75% 25% 1,559 79% 21% 113
VEHICLE TYPE
PASSENGER CAR 76% 24% 2,595 77% 23% 325
VAN/MINIVAN 83% 17% 513 70% 30% 81
SUV 79% 21% 870 77% 23% 84
PICKUP TRUCK 67% 33% 1,132 59% 41% 143
SEX MALE 70% 30% 2,927 58% 42% 227
FEMALE 82% 18% 2,178 80% 20% 404
AGE
0 – 4 - - - 50% 50% 2
5 – 14 - - - 83% 17% 29
15 – 25 64% 36% 137 59% 41% 49
26 – 64 76% 24% 4,804 72% 28% 500
65+ 79% 21% 132 76% 24% 46
RACE
CAUCASIAN 76% 24% 4,966 72% 28% 612
AFRICAN AMERICAN 57% 43% 75 50% 50% 8
OTHER - - - - - -
74% 76% 76%
26% 24% 24%
0%
20%
40%
60%
80%
100%
Baseline June 2009 September 2009
Belted
Unbelted
ROSS COUNTY
n = 2,124 n = 1,948 n = 1,672

Applied Research Center Miami University
Page 40
SCIOTO COUNTY
The 2009 Baseline rate indicated that 85% of all observed
occupants (drivers and passengers) in the county were
belted. The number of observed occupants that were
belted decreased to 62% in the September survey.
According to the data collected in the September survey,
Scioto County is well below NHTSA’s targeted usage rate
of 85% for Ohio. It should be noted, however, that
Baseline survey results are based on a relatively few
observations. No data for this county were submitted for
the September survey.
CROSS-TABULATION OF SCIOTO COUNTY SEAT BELT USE RATES BY SURVEY, DRIVER, AND FRONT SEAT PASSENGER, VEHICLE TYPE, AND
OCCUPANTS’ DEMOGRAPHIC CHARACTERISTICS
DRIVER PASSENGER
BELTED UNBELTED TOTAL BELTED UNBELTED TOTAL
OVERALL RESULTS FOR SCIOTO COUNTY 68% 32% 413 60% 40% 131
SURVEY
BASELINE 86% 14% 71 82% 18% 22
JUNE 2009 64% 36% 342 55% 45% 109
SEPTEMBER 2009 - - - - - -
VEHICLE TYPE
PASSENGER CAR 74% 26% 185 65% 35% 52
VAN/MINIVAN 74% 26% 46 68% 32% 19
SUV 66% 34% 41 64% 36% 14
PICKUP TRUCK 58% 42% 139 47% 53% 45
SEX MALE 69% 31% 280 41% 59% 49
FEMALE 69% 31% 127 70% 30% 79
AGE
0 - 4 - - - 100% - 4
5 - 14 - - - 100% - 3
15 - 25 59% 41% 63 46% 54% 28
26 - 64 69% 31% 323 55% 45% 82
65+ 80% 20% 25 100% - 9
RACE
CAUCASIAN 68% 32% 402 58% 42% 121
AFRICAN AMERICAN 100% - 2 75% 25% 4
OTHER - - - - - -
85%
62%
15%
38%
0%
20%
40%
60%
80%
100%
Baseline June 2009
Belted
Unbelted
SCIOTO COUNTY
n = 93 n = 451

Applied Research Center Miami University
Page 41
SENECA COUNTY
Survey results illustrate that the seat belt usage rate in
Seneca County for all occupants (drivers and
passengers) fluctuated over the observation period. The
Baseline showed a 92% seat belt usage rate which
decreased to 77% for the June survey and then rose to
83% for the September survey. Seneca County started
above NHTSA’s targeted usage rate of 85% for Ohio, but
then fell below this rate for the last two surveys. It should
be noted that these findings are based on a relatively low
and fluctuating number of observations.
CROSS-TABULATION OF SENECA COUNTY SEAT BELT USE RATES BY SURVEY, DRIVER, AND FRONT SEAT PASSENGER, VEHICLE TYPE, AND OCCUPANTS’ DEMOGRAPHIC CHARACTERISTICS
DRIVER PASSENGER
BELTED UNBELTED TOTAL BELTED UNBELTED TOTAL
OVERALL RESULTS FOR SENECA COUNTY 83% 17% 517 82% 18% 97
SURVEY
BASELINE 92% 8% 102 90% 10% 19
JUNE 2009 77% 23% 177 77% 23% 30
SEPTEMBER 2009 82% 18% 238 83% 17% 48
VEHICLE TYPE
PASSENGER CAR 84% 16% 274 80% 20% 50
VAN/MINIVAN 83% 17% 59 63% 38% 8
SUV 90% 10% 79 95% 5% 20
PICKUP TRUCK 74% 26% 104 84% 16% 19
SEX MALE 81% 19% 256 82% 18% 34
FEMALE 84% 16% 258 83% 17% 63
AGE
0 - 4 - - - - 100% 1
5 - 14 - - - 88% 13% 8
15 - 25 80% 20% 70 78% 22% 23
26 - 64 82% 18% 392 84% 16% 50
65+ 88% 12% 49 92% 8% 13
RACE
CAUCASIAN 83% 17% 477 90% 10% 86
AFRICAN AMERICAN 75% 25% 16 33% 67% 6
OTHER 77% 23% 22 - 100% 2
92%
77%83%
8%23%
18%
0%
20%
40%
60%
80%
100%
Baseline June 2009 September 2009
Belted
Unbelted
SENECA COUNTY
n = 121 n = 207 n = 286
Applied Research Center Miami University
Page 42
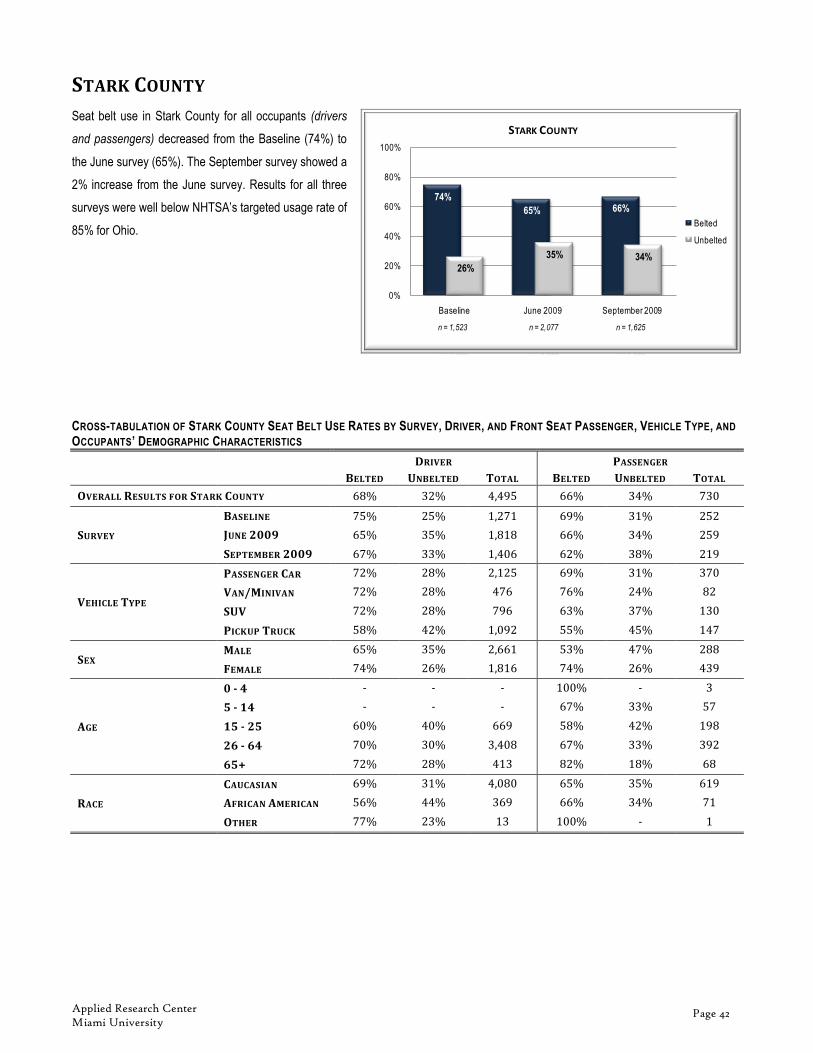
STARK COUNTY
Seat belt use in Stark County for all occupants (drivers
and passengers) decreased from the Baseline (74%) to
the June survey (65%). The September survey showed a
2% increase from the June survey. Results for all three
surveys were well below NHTSA’s targeted usage rate of
85% for Ohio.
CROSS-TABULATION OF STARK COUNTY SEAT BELT USE RATES BY SURVEY, DRIVER, AND FRONT SEAT PASSENGER, VEHICLE TYPE, AND
OCCUPANTS’ DEMOGRAPHIC CHARACTERISTICS
DRIVER PASSENGER
BELTED UNBELTED TOTAL BELTED UNBELTED TOTAL
OVERALL RESULTS FOR STARK COUNTY 68% 32% 4,495 66% 34% 730
SURVEY
BASELINE 75% 25% 1,271 69% 31% 252
JUNE 2009 65% 35% 1,818 66% 34% 259
SEPTEMBER 2009 67% 33% 1,406 62% 38% 219
VEHICLE TYPE
PASSENGER CAR 72% 28% 2,125 69% 31% 370
VAN/MINIVAN 72% 28% 476 76% 24% 82
SUV 72% 28% 796 63% 37% 130
PICKUP TRUCK 58% 42% 1,092 55% 45% 147
SEX MALE 65% 35% 2,661 53% 47% 288
FEMALE 74% 26% 1,816 74% 26% 439
AGE
0 - 4 - - - 100% - 3
5 - 14 - - - 67% 33% 57
15 - 25 60% 40% 669 58% 42% 198
26 - 64 70% 30% 3,408 67% 33% 392
65+ 72% 28% 413 82% 18% 68
RACE
CAUCASIAN 69% 31% 4,080 65% 35% 619
AFRICAN AMERICAN 56% 44% 369 66% 34% 71
OTHER 77% 23% 13 100% - 1
74%
65% 66%
26%
35% 34%
0%
20%
40%
60%
80%
100%
Baseline June 2009 September 2009
Belted
Unbelted
STARK COUNTY
n = 1,523 n = 2,077 n = 1,625

Applied Research Center Miami University
Page 43
SUMMIT COUNTY
Summit County results show that seat belt use among all
occupants (drivers and passengers) gradually, but
significantly, decreased between the Baseline (76%),
June (67%), and September surveys (64%). Summit
County is well below NHTSA’s targeted usage rate of
85% for Ohio. It should be noted that the number of
observations were relatively low and fluctuated during
the surveys.
CROSS-TABULATION OF SUMMIT COUNTY SEAT BELT USE RATES BY SURVEY, DRIVER, AND FRONT SEAT PASSENGER, VEHICLE TYPE, AND
OCCUPANTS’ DEMOGRAPHIC CHARACTERISTICS
DRIVER PASSENGER
BELTED UNBELTED TOTAL BELTED UNBELTED TOTAL
OVERALL RESULTS FOR SUMMIT COUNTY 69% 31% 941 62% 38% 232
SURVEY
BASELINE 76% 24% 229 76% 24% 55
JUNE 2009 69% 31% 266 60% 40% 70
SEPTEMBER 2009 65% 35% 446 57% 43% 107
VEHICLE TYPE
PASSENGER CAR 67% 33% 551 66% 34% 143
VAN/MINIVAN 74% 26% 99 77% 23% 30
SUV 74% 26% 194 49% 51% 39
PICKUP TRUCK 63% 38% 96 45% 55% 20
SEX MALE 67% 33% 533 61% 39% 104
FEMALE 71% 29% 403 64% 36% 128
AGE
0 – 4 - - - - 100% 1
5 – 14 - - - 78% 22% 23
15 – 25 60% 40% 161 51% 49% 68
26 – 64 70% 30% 696 63% 37% 117
65+ 79% 21% 82 82% 18% 22
RACE
CAUCASIAN 75% 25% 715 68% 32% 168
AFRICAN AMERICAN 49% 51% 211 46% 54% 59
OTHER 64% 36% 11 75% 25% 4
76%
67%64%
24%
33%36%
0%
20%
40%
60%
80%
100%
Baseline June 2009 September 2009
Belted
Unbelted
SUMMITCOUNTY
n = 284 n = 336 n = 553

Applied Research Center Miami University
Page 44
TRUMBULL COUNTY
Seat belt use in Trumbull County for all occupants
(drivers and passengers) showed a substantial change
between the Baseline survey (79%) and the June survey
(71%). The usage rate remained at 71% during the
September survey. The results show that Trumbull
County is well below NHTSA’s goal of an 85% usage
rate for Ohio.
CROSS-TABULATION OF TRUMBULL COUNTY SEAT BELT USE RATES BY SURVEY, DRIVER, AND FRONT SEAT PASSENGER, VEHICLE TYPE, AND OCCUPANTS’ DEMOGRAPHIC CHARACTERISTICS
DRIVER PASSENGER
BELTED UNBELTED TOTAL BELTED UNBELTED TOTAL
OVERALL RESULTS FOR TRUMBULL COUNTY 74% 26% 3,459 67% 33% 641
SURVEY
BASELINE 78% 22% 946 83% 17% 52
JUNE 2009 72% 28% 1,350 67% 33% 346
SEPTEMBER 2009 72% 28% 1,163 64% 36% 243
VEHICLE TYPE
PASSENGER CAR 75% 25% 1,973 70% 30% 365
VAN/MINIVAN 78% 22% 317 68% 32% 69
SUV 75% 25% 585 66% 34% 118
PICKUP TRUCK 66% 34% 578 58% 42% 86
SEX MALE 71% 29% 1,988 61% 39% 240
FEMALE 77% 23% 1,462 71% 29% 397
AGE
0 - 4 - - - 100% - 2
5 - 14 - - - 78% 22% 60
15 - 25 69% 31% 192 64% 36% 132
26 - 64 73% 27% 2,931 64% 36% 345
65+ 83% 17% 296 77% 23% 92
RACE
CAUCASIAN 75% 25% 3,213 69% 31% 593
AFRICAN AMERICAN 57% 43% 176 48% 52% 31
OTHER 67% 33% 6 50% 50% 2
79%71% 71%
21%29% 29%
0%
20%
40%
60%
80%
100%
Baseline June 2009 September 2009
Belted
Unbelted
TRUMBULL COUNTY
n = 998 n = 1,696 n = 1,406

Applied Research Center Miami University
Page 45
UNION COUNTY
The seat belt usage rate in Union County for all
occupants (drivers and passengers) was consistent
between the Baseline survey (89%) and the June survey
(89%), but decreased slightly during the September
survey to 87%. Results for Union County indicate that
the usage rate during the entire 2009 survey period was
above the 85% target established by NHTSA’s for Ohio.
CROSS-TABULATION OF UNION COUNTY SEAT BELT USE RATES BY SURVEY, DRIVER, AND FRONT SEAT PASSENGER, VEHICLE TYPE, AND
OCCUPANTS’ DEMOGRAPHIC CHARACTERISTICS
DRIVER PASSENGER
BELTED UNBELTED TOTAL BELTED UNBELTED TOTAL
OVERALL RESULTS FOR UNION COUNTY 88% 12% 5,565 90% 10% 410
SURVEY
BASELINE 89% 11% 1,737 89% 11% 103
JUNE 2009 89% 11% 1,881 91% 9% 185
SEPTEMBER 2009 87% 13% 1,947 91% 9% 122
VEHICLE TYPE
PASSENGER CAR 90% 10% 2,835 91% 9% 225
VAN/MINIVAN 92% 8% 659 93% 7% 68
SUV 93% 7% 1,082 95% 5% 66
PICKUP TRUCK 75% 25% 989 80% 20% 51
SEX MALE 84% 16% 3,147 81% 19% 143
FEMALE 93% 7% 2,406 96% 4% 254
AGE
0 - 4 - - - 100% - 2
5 - 14 - - - 91% 9% 23
15 - 25 81% 19% 588 83% 17% 78
26 - 64 89% 11% 4,256 89% 11% 140
65+ 87% 13% 697 94% 6% 90
RACE
CAUCASIAN 88% 12% 5,423 90% 10% 285
AFRICAN AMERICAN 90% 10% 67 75% 25% 4
OTHER 98% 3% 40 100% - 4
89% 89% 87%
11% 11% 13%0%
20%
40%
60%
80%
100%
Baseline June 2009 September 2009
Belted
Unbelted
UNION COUNTY
n = 1,840 n = 2,066 n = 2,069

Applied Research Center Miami University
Page 46
WASHINGTON COUNTY
Seat belt usage in Washington County for all occupants
(drivers and passengers) decreased between the 2009
Baseline survey (91%) and the June survey (85%).
Even with the decline in seat belt usage rates,
Washington County remained at or above NHTSA’s
targeted usage rate of 85% for Ohio. These results
should be viewed with caution due to the low number of
observations. No September surveys for this county
were submitted for analysis.
CROSS-TABULATION OF WASHINGTON COUNTY SEAT BELT USE RATES BY SURVEY, DRIVER, AND FRONT SEAT PASSENGER, VEHICLE
TYPE, AND OCCUPANTS’ DEMOGRAPHIC CHARACTERISTICS
DRIVER PASSENGER
BELTED UNBELTED TOTAL BELTED UNBELTED TOTAL
OVERALL RESULTS FOR WASHINGTON COUNTY 90% 10% 141 84% 16% 75
SURVEY
BASELINE 90% 10% 70 93% 7% 41
JUNE 2009 90% 10% 71 74% 26% 34
SEPTEMBER 2009 - - - - - -
VEHICLE TYPE
PASSENGER CAR 92% 8% 78 87% 13% 46
VAN/MINIVAN 92% 8% 12 100% - 4
SUV 87% 13% 23 91% 9% 11
PICKUP TRUCK 86% 14% 28 64% 36% 14
SEX MALE 88% 12% 81 61% 39% 31
FEMALE 93% 7% 59 100% - 44
AGE
0 - 4 - - - 100% - 13
5 - 14 - - - 71% 29% 7
15 - 25 68% 32% 28 56% 44% 16
26 - 64 93% 7% 74 88% 12% 25
65+ 100% - 36 100% - 14
RACE
CAUCASIAN 88% 12% 82 82% 18% 60
AFRICAN AMERICAN 100% - 14 100% - 7
OTHER 92% 8% 13 83% 17% 6
91%85%
9%15%
0%
20%
40%
60%
80%
100%
Baseline June 2009
Belted
Unbelted
WASHINGTON COUNTY
n = 111 n = 105

Applied Research Center Miami University
Page 47
WAYNE COUNTY
Survey results in Wayne County for all occupants
(drivers and passengers) showed a 5% decrease from
the Baseline survey (80%) to the June survey (75%).
Wayne County is below NHTSA’s targeted usage rate of
85% for Ohio. No September surveys for this county
were submitted for analysis.
CROSS-TABULATION OF WAYNE COUNTY SEAT BELT USE RATES BY SURVEY, DRIVER, AND FRONT SEAT PASSENGER, VEHICLE TYPE, AND
OCCUPANTS’ DEMOGRAPHIC CHARACTERISTICS
DRIVER PASSENGER
BELTED UNBELTED TOTAL BELTED UNBELTED TOTAL
OVERALL RESULTS FOR WAYNE COUNTY 79 21 2,480 74 26 706
SURVEY
BASELINE 81 19 1,332 80 20 376
JUNE 2009 77 23 1,148 68 32 330
SEPTEMBER 2009 - - - - - -
VEHICLE TYPE
PASSENGER CAR 82% 18% 1,230 75% 25% 350
VAN/MINIVAN 83% 17% 301 75% 25% 102
SUV 80% 20% 453 82% 18% 127
PICKUP TRUCK 69% 31% 494 64% 36% 127
SEX MALE 76% 24% 1,324 68% 32% 244
FEMALE 83% 17% 1,151 77% 23% 462
AGE
0 - 4 - - - 100% - 1
5 - 14 - - - 72% 28% 103
15 - 25 75% 25% 463 71% 29% 145
26 - 64 80% 20% 1,710 73% 27% 321
65+ 81% 19% 305 83% 17% 135
RACE
CAUCASIAN 79% 21% 2,437 74% 26% 689
AFRICAN AMERICAN 71% 29% 28 58% 42% 12
OTHER 90% 10% 10 100% - 5
80%75%
20%25%
0%
20%
40%
60%
80%
100%
Baseline June 2009
Belted
Unbelted
WAYNE COUNTY
n = 1,708 n = 1,478

Applied Research Center Miami University
Page 48
WILLIAMS COUNTY
The seat belt usage rate in Williams County for all
occupants (drivers and passengers) remained the same
between the June survey (82%) and the September
survey (82%). While close, these results are below
NHTSA’s targeted usage rate of 85% for Ohio.
Consequently, results indicate the 85% seat belt use rate
is attainable in Williams County.
CROSS-TABULATION OF WILLIAMS COUNTY SEAT BELT USE RATES BY SURVEY, DRIVER, AND FRONT SEAT PASSENGER, VEHICLE TYPE, AND OCCUPANTS’ DEMOGRAPHIC CHARACTERISTICS
DRIVER PASSENGER
BELTED UNBELTED TOTAL BELTED UNBELTED TOTAL
OVERALL RESULTS FOR WILLIAMS COUNTY 81% 19% 8,969 85% 15% 1,393
SURVEY
BASELINE 81% 19% 4,018 85% 15% 603
JUNE 2009 81% 19% 2,050 85% 15% 411
SEPTEMBER 2009 82% 18% 2,901 87% 13% 379
VEHICLE TYPE
PASSENGER CAR 84% 16% 4,096 88% 12% 650
VAN/MINIVAN 85% 15% 1,184 87% 13% 238
SUV 86% 14% 1,431 87% 13% 215
PICKUP TRUCK 72% 28% 2,251 77% 23% 287
SEX MALE 77% 23% 5,154 77% 23% 496
FEMALE 87% 13% 3,766 90% 10% 892
AGE
0 - 4 - - - 94% 6% 16
5 - 14 - - - 94% 6% 116
15 - 25 75% 25% 1,104 74% 26% 231
26 - 64 82% 18% 6,490 85% 15% 720
65+ 84% 16% 1,350 90% 10% 305
RACE
CAUCASIAN 81% 19% 8,789 85% 15% 1,346
AFRICAN AMERICAN 74% 26% 50 92% 8% 12
OTHER 80% 20% 91 76% 24% 21
81% 82% 82%
19% 18% 18%
0%
20%
40%
60%
80%
100%
Baseline June 2009 September 2009
Belted
Unbelted
WILLIAMS COUNTY
n = 4,621 n = 2,461 n = 3,280

Applied Research Center Miami University
Page 49
WOOD COUNTY
Seat belt use in Wood County for all occupants (drivers
and passengers) increased from the Baseline survey
(84%) to the June survey (89%). The September survey
decreased to 88%, however, this is above NHTSA’s 85%
usage rate established for Ohio. Therefore, the 85% seat
belt use rate was attained in Wood County.
CROSS-TABULATION OF WOOD COUNTY SEAT BELT USE RATES BY SURVEY, DRIVER, AND FRONT SEAT PASSENGER, VEHICLE TYPE, AND
OCCUPANTS’ DEMOGRAPHIC CHARACTERISTICS
DRIVER PASSENGER
BELTED UNBELTED TOTAL BELTED UNBELTED TOTAL
OVERALL RESULTS FOR WOOD COUNTY 87% 13% 1,759 88 12 385
SURVEY
BASELINE 84% 16% 339 82% 18% 61
JUNE 2009 88% 12% 648 89% 11% 174
SEPTEMBER 2009 88% 12% 772 88% 12% 150
VEHICLE TYPE
PASSENGER CAR 87% 13% 881 89% 11% 188
VAN/MINIVAN 91% 9% 189 89% 11% 54
SUV 92% 8% 403 88% 13% 96
PICKUP TRUCK 80% 20% 282 80% 20% 46
SEX MALE 84% 16% 960 73% 27% 106
FEMALE 91% 9% 796 93% 7% 277
AGE
0 - 4 - - - 50% 50% 2
5 - 14 - - - 100% - 27
15 - 25 82% 18% 427 77% 23% 109
26 - 64 89% 11% 1,186 90% 10% 204
65+ 91% 9% 141 98% 2% 42
RACE
CAUCASIAN 87% 13% 1,597 87% 13% 357
AFRICAN AMERICAN 84% 16% 64 86% 14% 14
OTHER 86% 14% 84 93% 7% 14
84%89% 88%
17% 11% 12%0%
20%
40%
60%
80%
100%
Baseline June 2009 September 2009
Belted
Unbelted
WOOD COUNTY
n = 400 n = 822 n = 922