‘OHANA BROS. Business Summary...
21
‘OHANA BROS. Business Summary Brief INTRODUCTION ‘Ohana Bros. Island Style Chips & Popcorn is a unique mall impulse snack retail concept that features freshly made potato chips, gourmet popcorn, “island” fries and authentic Hawaiian shave ice – all handmade from scratch, right in front of the customer using 100% all natural ingredients. Q: Why hasn’t anyone innovated, combined and packaged the most popular snack food items; popcorn, chips and fries together under an exciting mall retail brand? Q: Why is, or should, the “savory snack” marketplace be primarily dominated by two soft pretzel players (Auntie Anne’s / Wetzels Pretzels) to the tune of a combined $548 million per year in sales? Fact: Over 1,100 shopping malls in the U.S. alone present a “First -To-Market” opportunity for Ohana Bros. Fact: Each ‘Ohana Bros. retail store is projected to generate a 30% profitability margin on annual sales of $500,000. Capitalization for each unit averages $300,000. Fact: This is the best tasting popcorn, chips, fries and Hawaiian shave ice you will ever taste! Q: Are you in? Then read on.
Transcript of ‘OHANA BROS. Business Summary...

‘OHANA BROS.
Business Summary
Brief
INTRODUCTION
‘Ohana Bros. Island Style Chips & Popcorn is a unique mall
impulse snack retail concept that features freshly made potato
chips, gourmet popcorn, “island” fries and authentic Hawaiian
shave ice – all handmade from scratch, right in front of the
customer using 100% all natural ingredients.
Q: Why hasn’t anyone innovated, combined and packaged the
most popular snack food items; popcorn, chips and fries together
under an exciting mall retail brand?
Q: Why is, or should, the “savory snack” marketplace be
primarily dominated by two soft pretzel players (Auntie Anne’s /
Wetzels Pretzels) to the tune of a combined $548 million per year
in sales?
Fact: Over 1,100 shopping malls in the U.S. alone present a
“First-To-Market” opportunity for Ohana Bros.
Fact: Each ‘Ohana Bros. retail store is projected to generate a
30% profitability margin on annual sales of $500,000.
Capitalization for each unit averages $300,000.
Fact: This is the best tasting popcorn, chips, fries and Hawaiian
shave ice you will ever taste!
Q: Are you in? Then read on.


THE BUSINESS OPPORTUNITY
THE “Impulse Snack” MARKETPLACE
High Growth in “Impulse Snack” Category:
o Auntie Anne’s Soft Pretzels - $441 million in sales 2012 with over 1,200 locations
o Wetzels Pretzels - $107 million in sales in 2012 with over 250 stores
o New York Fries - $65 million in sales with over 190 locations
o Doc Popcorn - $7.2 million in sales with over 77 retail outlet locations, started just 3 years ago in
2009 with $1 million in sales.
Revenue Generation: Annual gross revenue figures for “Impulse Snack” category retailers’ can
average anywhere from $250,000 to $750,000. One Auntie Anne’s Pretzel location in Hayward, CA
averages $950,000 per year in sales.
Franchiseable: The highly scalable ‘Ohana Bros. business model meets or is positioned to meet the key “franchisability” criteria established by the IFranchise Group:
o Credibility
o Differentiation
o Transferability of Knowledge
o Adaptability
o Refined and successful prototype operations -
o Documented Systems
o Affordability
o Return on Investment
o Market trends and conditions
o Capital
o Commitment to relationships
o Strength of management

CONSUMER DEMAND / TRENDS
Who doesn’t like popcorn, potato chips or fries? According to Snack Foods: A Global Business Report, from Global Industry Analysts, the worldwide demand for snack foods is likely to hit US $334 billion by
2015, with a sales volume of almost 50,000 thousand tons.1
Potato chips are the top pick in salty snacks among all age groups and remain the largest segment with
$6.8 billion in sales in 2010.
Popcorn was the fifth highest “salty snack” with $3.2 billion in sales in 2010.
The most preferred foods by men, women, college kids, and children less than seven years old2:
o Men: Hamburger, French Fries, Pizza
o Women: French Fries, Hamburger, Pizza
o Students: French Fries, Hamburger, Pizza
o Kids: French Fries, Pizza, Hamburger
French Fries are the food jewel in the more than 31,000 McDonalds restaurants
“I just got have it!” (or Why Humans Love Popcorn and Chips)
o Taste Hedonics (salt, sugar, and umami)
o Dynamic Contrast (food arousal and surprise)
o Evoked Qualities (when food sensory properties evoke past memories)
o Food Pleasure Equation (Food Pleasure = sensation + macronutrients)
o Caloric Density (humans like food with a CD of about 5.0)
o Emulsion Theory (taste buds love foods in emulsified forms)
One of the latest emerging movements in gourmet and specialty foods in the U.S. is currently found in the increased demand for more “artisanal” food items which are often high-quality, wholesome, often
natural, created by hand, in small production environments. Consumers are more conscious of what
goes into their foods as well as how it’s made.
1 THE WORLD OF FOOD INGREDIENTS DECEMBER 2011 Article: A Snacking Snapshot by Rachel Zemser
2 Dr. Liz Sloan, Sloan Trends

OPPORTUNITIES
Shopping Malls: There are currently over 1,100 shopping malls3 in the U.S., more than 100 in
California alone. The current consensus amongst mall ownership groups is that there is a “void” in new
and exciting retail concepts, especially in the “impulse savory snack” category. ‘Ohana Bros. Mgmt.
Group has been courted (already!) by major mall ownership groups such as Westfield Shopping
Centers, General Growth Properties (GGP), Taubman and Rouse Properties to be in their malls.
First-Mover Advantage: Despite the fact that fries, chips and popcorn remain the most popular snack
food items, there are currently no QSR concepts that have either “innovated” or combined all three of
these snack items together under one retail brand. ‘Ohana Bros. has the opportunity to be a “First-
Mover” in this category to combine all three snack items. Additionally, Hawaiian shave ice has not
been by and large introduced to the mainland yet.
Merge Snack Offerings. Comparative “single-item offering” business models; New York Fries (NYF), Doc Popcorn, Wetzels Pretzels, Auntie Anne’s Pretzels, Bahama Bucs Hawaiian Shave Ice, and
Spudniks Potato Chips have proven that there is a high demand for “impulse snack” offerings as these
retailers are prominent in malls and retail shopping centers. ‘Ohana Bros. has merged four highly
successful snack business models under one great brand:
3 Shopping Centers defined as malls with greater than 400,000 gross leasable square footage.
SHAVE ICE: Ulelani’s
Bahama Bucs
Lanis
Kukuis
POPCORN: Doc Popcorn
Garretts
Cornology
Kettlepop
Cornucopia
CHIPS: Billy Goat
Gourmet Chip Co.
Spudniks
Maui Chips
FRIES: New York Fries
Heavenly Fries
Boise Fry Company
Potato Corner
Pommes Frites
Fragmented “impulse snack” Marketplace: Generally, aside from the snack food category “soft pretzels” retailers, the “impulse snack” marketplace is highly fragmented with only the popcorn retailer
Doc Popcorn starting to establish a market presence in malls.
Secondary Retail Channels: This highly scalable business model is perfectly positioned to expand to
these possible retail distribution channels:
Sports Venues
Airports
Popular tourists locations: Bourbon Street, LA, Pier 39 SF, Old Towne, S.D. , etc.
Amusement Parks and Attractions
Mobile Carts: o State and County Fairs
o Corporate Events
o Farmers Markets
FINANCIAL
The ‘Ohana Bros. business model is highly profitable – average 25-30% profitability on projected average annual sales of $500,000, 15-20% COGS.
Highly Scalable for Franchising and or company expansion
ROI – Each ‘Ohana Bros. Island Style Chips& Popcorn retail unit can be capitalized for as little as $300,000.
Low Break-Even Point ($736 Average Sales Per Day)
Minimal waste as products are made to order
Impulse “savory snack” items which at the average price point of $5-8 is not affected by the economy or falls into “discretionary” spending categories for the consumers.
Retail stores can be operated by two to three individuals with minimal skill sets.
FACT SHEET
Business Type:
Retail food serving impulse “savory snacks items; freshly prepared seasoned chips and “island fries” with
choice of delicious dipping sauces, freshly popped seasoned and candied popcorn and Hawaiian-style shave ice
with over a dozen natural, homemade flavors to top.
Average In-Line Store Size: 850 – 1,200 square feet +/- In-Line
Average Unit Capitalization: $300,000 - $355,000
Projected Annual Sales: $450,000 to $500,000 per year
Sales Break Even: $23,184 per month ($736 per day) Note: Does not include Corporate
Overhead and Debt Service
Profitability: Target 30% on EBITDA projection of $150,000
Performa: Gross Revenues: $500,000
COGS (217,000)
Gross Profit $282,920
Operating Expenses (132,624)
Net Operating Income $150,296 *
*Does not include overhead or debt service

BUSINESS OVERVIEW
Under Phase I of a 5-year strategic growth plan, ‘Ohana Bros. Management Group,
LLC will construct, develop and operate its prototype in-line retail store at the
Sunvalley Mall which is located in the city of Concord in the San Francisco Bay Area
commencing September 2013. The goal is once proven concept has been established its
primary growth platform will include both company-owned units and a franchising
development program
Each in-line retail unit will be consists of approximately 850-1,000 +/- square feet.
Each ‘Ohana Bros. retail unit will be themed under the brand name which represents a
fusion of California and Hawaiian culture; relaxed, casual, home-styled and crafted flavorings. Customers will
be attracted to not only the great variety of snacks but the whole "'Ohana Bros.” brand which is based on four
founding pillars; quality products, exuding the “aloha” spirit, having a hell of a lot of fun with each other and
the customers, and finally on the ‘Ohana Bros., the two alter egos of the founders who are surfing globe trotters,
searching the world over for the perfect spices and taste combinations to flavor their snacks.
Revenue will be generated primarily from the sales of on-site, freshly prepared and seasoned chips fresh cut
“island fries,” freshly popped seasoned and candied popcorn, and Hawaiian-style shave ice. Sales are
anticipated to be approximately $450,000- $500,000 per retail store stabilized per year and to increase at an
average annual rate of 5% per year in the first five years of operation. Secondary revenue will be generated
through e-commerce of Ohana Bros. potato chips, popcorn, and Ohana Bros. branded merchandise.
Our primary customers will be drawn from the center’s primary trade area population (see trade areas per each
mall location in Business section of business plan). Customers shopping each mall location will purchase
‘Ohana Bros. chips, popcorn, island fries, shave ice and other products on an impulse basis during their
shopping trip, or as a dessert treat upon completing a meal at one of many eatery options within the mall.
Ownership also anticipates that many patrons will make the retail unit a favored destination due to name
recognition and product quality.
The ‘Ohana Bros. retail brand is truly a “first mover advantage” concept with no direct competition which
combines all three “snack and treat” categories; chips, island fries, popcorn, and shave ice. Similar “savory
snack” alternatives such as soft pretzel retailers Auntie’s Pretzels, Wetzels Pretzels, Potato Corner, Bahama
Bucs (shave ice) and popcorn retailer, Doc Popcorn, do vie for market share, however, these types of savory
snacks lack the overall taste appeal and “addictive” affects ‘Ohana Bros. snack items offer. Competition for
Hawaiian-style shave ice are limited as well as there are no direct food retailers selling these specific types of
dessert items.
Each retail store project costs are projected to be approximately $300,000 - $350,000 which includes tenant
improvements, site prep, equipment, lease deposits, starting inventory, supplies, and working capital.
Based on a preliminary timetable it is anticipated that from submission of prospective tenant improvement
application to real estate ownership, it takes approximately 120 days before a store’s grand opening.

THE ‘OHANA BROS. DIFFERENCE
Reason #1: Fresh Made
We assure freshness by utilizing artisan techniques making every item fresh from scratch by hand right in front
of the customer. Popcorn is popped hourly, potatoes washed, soaked, sliced, cut and fried to order and our
shave ice is hand shaved, shaped, drizzled and topped right in front of your eyes. How can you get fresher than
that? Bags of potatoes, jars of popcorn and blocks of ice are just waiting to be turned into awesome munchies.

Reason #2: Quality Ingredients
‘Ohana Bros. uses only the finest ingredients. We work directly with trusted family farms, vendors and
suppliers assuring only the highest quality ingredients.
All our toppings, drizzles, dips and sauces are prepared on-site
Our seasonings do not contain MSG, artificial flavoring
Our potatoes are the highest quality Russet potato
Our popcorn is non-GMO
Our seasonings do not contain any MSG, chemical additives or preservatives
Our shave ice is made from 100% purified water
Our shave ice syrups are made of pure cane sugar, natural concentrates, extracts, fruit purees with no artificial flavorings or colorings (which also turn your tongue strange colors)
Reason #3: Custom Crafted Orders
Although we have great “recommended” combinations that are tried and true customers can choose from three
snack options; popcorn, potato chips and fries then have the option of a variety of 6 seasonings plus numerous
toppings and drizzles – making their own special treat. Nothing is pre-packaged or waiting under heat lamps
other than our fresh and seasoned potato chips.
Reason #4: Value
Gram for gram we pride ourselves in giving our customers the highest possible value by keeping our prices as
low as possible while offering generous portions. We don’t fill up chip bags with gasses or nitrogen which
makes people feel ripped off nor do we charge exorbitant prices for “just popcorn” or “just ice.” Just the
superior taste of our munchies alone makes people feel they received a great value.
Reason #5: Better for You
Ok, we realize that anything is excess is “not good for you,” but when you are going to treat yourself to life’s
indulgences, at ‘Ohana Bros. you can be assured that we do our best to make sure your body will not be
bombarded by “bad stuff” - artificial colorings, flavoring or additives. We use only use Rice Bran Oil for frying
our chips and fries which contains no trans-fats and is hypoallergenic.
Across the Board:
Gluten Free
No HFCS
No Trans Fats
No Artificial additives, colorings or flavorings
No MSG

Reason #6: Innovation
Our true innovation has everything to do with transforming these ordinary snack items into amazing
“munchies” creations. We do this with our incredible seasonings, mouth -watering drizzles, toppings, and
dipping sauces – allowing the customer to experience a variety of unique “taste” combinations.
Before ‘Ohana Bros.: After ‘Ohana Bros.:

Reason #7: The Retail Experience
For our retail guest experience we created what we call “Island Style” hospitality which combines food-
theatre, cool décor, music and customer engagement by our employees who embrace an “aloha” style vibe
which is fun, loving and sincere.
Figure 1 - Hand sliced potato chips

‘OHANA BROS. “MUNCHIES” OFFERINGS
Rocky Road To Hana Topped Popcorn
Mango Chile Lime Chips
Loaded Baked Potato Island Fries
Combination Popcorn Tin
Rio Habanero Seasoned Popcorn
Caramel and Candied Popcorn

Hawaiian Shave Ice
Hawaiian Shave Ice
Thai Topped Chips
Homemade Artisan Shaved Ice Syrups
Ohana Bros. “Travels” Cone Liner
Natural Sodas

‘Ohana Bros. Island Style Chips & Popcorn Brand Packaging

’OHANA BROS. RETAIL STORE RENDERINGS – SUNVALLEY Mall, Concord California

SALES COMPARABLES – Mall Snack Retailers
Gross revenue sales figures for similar “savory snack” or dessert
types of offerings are usually not published and available. The sales
figures below were obtained through extensive interviews with
franchise representatives, leasing agents and any available data
researched through Google searches over the internet. The main
direct and indirect industry food retailers are listed below along with
the estimated annual sales figures:
Retailer Annual $ Monthly
$
Daily $
‘Ohana Bros.(Pro forma) $500,000 $41,697 $1,300
Auntie Annes’s Pretzels
(National average)
$516,409 $43,034 $1,415
Auntie Annes’s Pretzels
(Westfield)
$650,000 $54,166 $1,805
Auntie Annes’s Pretzels
Sunvalley Mall
$550,000 $45,833 $1,527
Wetzels Pretzels (Kiosk)
Sunvalley Mall
$296,000 $24,666 $822
Wetzels Pretzels (In-Line)
Sunvalley Mall
$525,000 $43,750 $1,458
Doc Popcorn (store avge) $350,000 $29,166 $959
Popcornopolis (Roseville) $500,000 $41,666 $1,388
Cinnabon – Sunvalley Mall $470,000 $39,166 $1,305
Mrs. Fields Cookies
(Sunvalley Mall)
$425,000 $35,417 $1,180
Bahama Bucs (Shave Ice)
National store averages
$357,611 $29,800 $993
Rocky Mtn. Chocolate
(SVM)
$300,000 $25,000 $833
Haagan Dazs Ice Cream $600,000 $50,000 $1,644
THE INDUSTRY
Savory Snacks
The “salty snack” industry includes potato chips, corn chips, tortilla
chips, ready-to-eat-popcorn (except candy-coated), pork rinds, and
potato sticks. According to Snack Foods: A Global Business Report,
from Global Industry Analysts, the worldwide demand for snack foods
is likely to hit US $334 billion by 2015, with a sales volume of almost
50,000 thousand tons.4
The dietary trend in the 2000’s toward healthier eating did not affect
the snack category of foods as much as anticipated, as approximately
one-third of the population regularly ate snacks in place of a meal.
Single-serve and other “on the go” packaging was lifting sales by
catering to the demands of a faster-paced lifestyle.
Key Industry Points:
Sales of salty snacks are at an all-time high, having actually
peaked during the recession. Sales slowed in 2010 as the
national focus shifted to health and nutrition, but the category is
expected to pick up throughout 2011-2015.
Potato chips remain the largest segment with $6.8 billion in sales in 2010; this segment shows the most willingness to
develop new flavors to impress the young market.
Popcorn was the fifth highest “salty snack” with $3.2 billion in sales in 2010.
Potato chips are the top pick in salty snacks among all age
groups. Plantain chips are picking up, with popularity among
the 18-34 age group and low-income homes.
Asian and Hispanic populations have been buying more salty snacks in the past year; this bodes well for the category, as
these are some of the fastest growing ethnic populations,
according to the U.S. Census Bureau.
4 THE WORLD OF FOOD INGREDIENTS DECEMBER 2011 Article: A Snacking Snapshot by Rachel Zemser
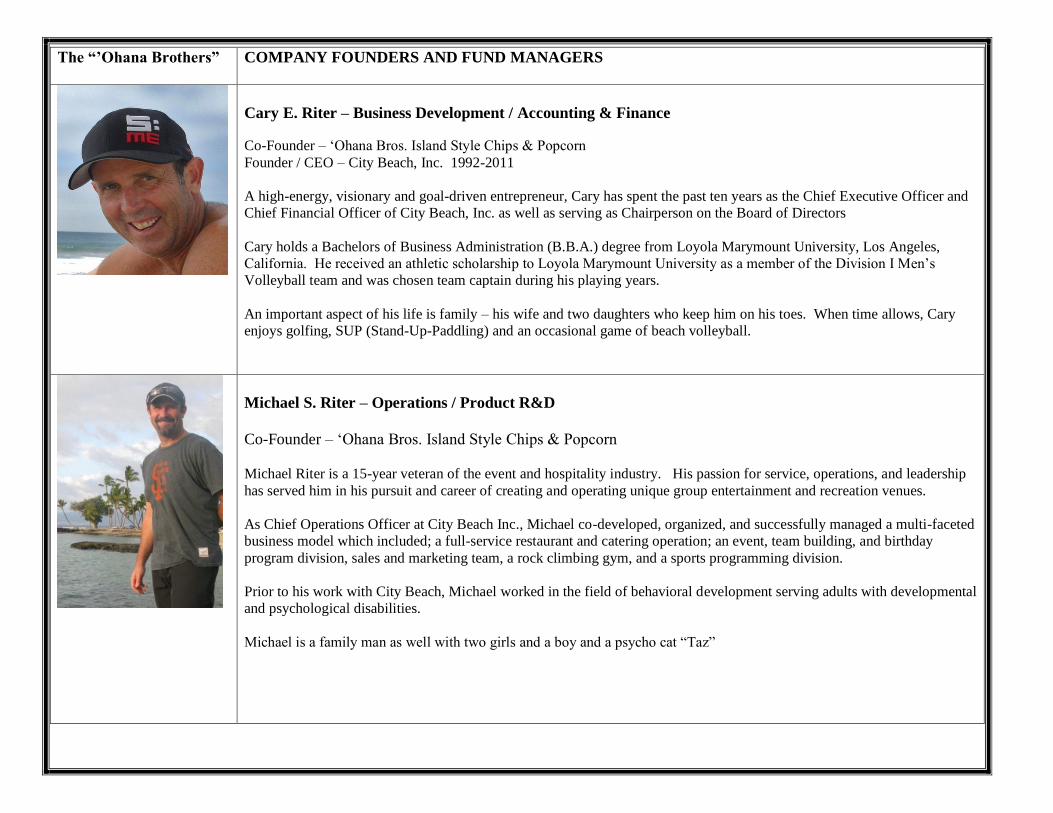
The “’Ohana Brothers” COMPANY FOUNDERS AND FUND MANAGERS
Cary E. Riter – Business Development / Accounting & Finance
Co-Founder – ‘Ohana Bros. Island Style Chips & Popcorn
Founder / CEO – City Beach, Inc. 1992-2011
A high-energy, visionary and goal-driven entrepreneur, Cary has spent the past ten years as the Chief Executive Officer and
Chief Financial Officer of City Beach, Inc. as well as serving as Chairperson on the Board of Directors
Cary holds a Bachelors of Business Administration (B.B.A.) degree from Loyola Marymount University, Los Angeles,
California. He received an athletic scholarship to Loyola Marymount University as a member of the Division I Men’s
Volleyball team and was chosen team captain during his playing years.
An important aspect of his life is family – his wife and two daughters who keep him on his toes. When time allows, Cary
enjoys golfing, SUP (Stand-Up-Paddling) and an occasional game of beach volleyball.
Michael S. Riter – Operations / Product R&D
Co-Founder – ‘Ohana Bros. Island Style Chips & Popcorn
Michael Riter is a 15-year veteran of the event and hospitality industry. His passion for service, operations, and leadership
has served him in his pursuit and career of creating and operating unique group entertainment and recreation venues.
As Chief Operations Officer at City Beach Inc., Michael co-developed, organized, and successfully managed a multi-faceted
business model which included; a full-service restaurant and catering operation; an event, team building, and birthday
program division, sales and marketing team, a rock climbing gym, and a sports programming division.
Prior to his work with City Beach, Michael worked in the field of behavioral development serving adults with developmental
and psychological disabilities.
Michael is a family man as well with two girls and a boy and a psycho cat “Taz”

SOURCES & USES - SCHEDULE
Phase I - 3 Sites Site #1 Site #2 Site #3 Total
Sunvalley Mall TBD TBD Phase I
Total
Sources
Equity / Crowdfunding 360,000.00$ 200,000$ 200,000$ 760,000$
Debt 100,000.00$ 150,000$ 150,000$ 400,000$
Total Sources: 460,000.00$ 350,000$ 350,000$ 1,160,000$
Site Capital Uses:
Fabrication / Improvements 195,000$ 195,000$ 195,000$ 585,000$
Site Survey 1,500$ 1,500$ 1,500$ 4,500$
Engineering 4,250$ 4,250$ 4,250$ 12,750$
Architectural 14,000$ 14,000$ 14,000$ 42,000$
Special Inspections 1,000$ 1,000$ 1,000$ 3,000$
Permits & Fees 6,000$ 6,000$ 6,000$ 18,000$
Opening / Training 2,500$ 2,500$ 2,500$ 7,500$
Professional Fees (Legal / Acctg) 3,500$ 3,500$ 3,500$ 10,500$
Registrations (Trademarks, State, etc.) 500$ 500$ 500$ 1,500$
Pre-Paid Expenses (Insurance, Phone) 1,300$ 1,300$ 1,300$ 3,900$
Equipment 70,000$ 70,000$ 70,000$ 210,000$
Licenses - Business, health, etc. 150$ 150$ 150$ 450$
Working Capital 40,000$ 40,000$ 40,000$ 120,000$
Inventory - Starting Food / Packaging 5,800$ 5,800$ 5,800$ 17,400$
Mktg / Branding 4,500$ 4,500$ 4,500$ 13,500$
Total Site Capitalization 350,000$ 350,000$ 350,000$ 1,050,000$
Start-Up / Overhead
Salaries:
Managing Members 85,000$ -$ -$ 85,000$
Supervisor 4,000$ -$ -$ 4,000$
G&A - (software, supplies, printing, gas) 1,500$ -$ -$ 1,500$
Travel / Meals 2,000$ -$ -$ 2,000$
State Taxes (LLC) 800$ -$ -$ 800$
R&D 6,700$ -$ -$ 6,700$
Rent 10,000$ -$ -$ 10,000$
Total Start-Up / Overhead 110,000$ -$ -$ 110,000$
Projected Total Uses 460,000$ 350,000$ 350,000$ 1,160,000$

'Ohana Bros. "Island Style Chips & Popcorn"
Site: Prototype Total Yr 1 Total Yr 2 Total Yr 3 Year 4 Year 5
Annual Annual Annual Annual Annual
Gross Revenue:
Chips:
Seasoned - 1 dip 37,234$ 39,096$ 41,051$ 43,103$ 45,258$
Seasoned - 2 dips 52,475$ 55,098$ 57,853$ 60,746$ 63,783$
Popcorn: -$ -$ -$ -$ -$
1 lb 36,413$ 38,233$ 40,145$ 42,152$ 44,260$
2 lb 73,008$ 76,658$ 80,491$ 84,516$ 88,742$
5 lb 76,658$ 80,491$ 84,516$ 88,742$ 93,179$
Island Fries -$ -$ -$ -$ -$
Large 45,995$ 48,295$ 50,710$ 53,245$ 55,907$
Shave Ice: -$ -$ -$ -$ -$
16 oz. 31,028$ 32,580$ 34,209$ 35,919$ 37,715$
Drinks: -$ -$ -$ -$ -$
Slurry 16,062$ 16,865$ 17,708$ 18,593$ 19,523$
Soft Drink - Med 18,069$ 18,973$ 19,922$ 20,918$ 21,964$
Soft Drink - Lg 29,203$ 30,663$ 32,197$ 33,806$ 35,497$
H2O refills 2,190$ 2,300$ 2,415$ -$ -$
Island Style: -$ -$ -$ -$ -$
Chips 27,378$ 28,747$ 30,184$ 31,693$ 33,278$
Popcorn 27,378$ 28,747$ 30,184$ 31,693$ 33,278$
Island Fries 27,378$ 28,747$ 30,184$ 31,693$ 33,278$
Dips: -$ -$ -$ -$ -$
Cold -$ -$ -$ -$ -$
Hot -$ -$ -$ -$ -$
Miscellaneous: -$ -$ -$ -$ -$
Sports Bottle -$ -$ -$ -$ -$
Aloha Bracelets -$ -$ -$ -$ -$
Total Revenue 500,470$ 525,493$ 551,768$ 576,821$ 605,662$
COGS 41,706$ 43,791$ -$ -$ -$
F&B Chips:
Seasoned 5,169$ 5,427$ 5,699$ 5,984$ 6,283$
Seasoned 9,491$ 9,966$ 10,464$ 10,987$ 11,536$
Popcorn: -$ -$ -$ -$ -$
1 lb 5,289$ 5,554$ 5,832$ 5,540$ 5,817$
2 lb 10,495$ -$ -$ -$ -$
5 lb 10,075$ 10,579$ 11,108$ 11,663$ 12,246$
Island Fries -$ -$ -$ -$ -$
Large 7,009$ 7,359$ 7,727$ 8,114$ 8,519$
Shave Ice: -$ -$ -$ -$ -$
16 oz. 4,125$ 4,331$ 4,548$ 4,775$ 5,014$
Drinks: -$ -$ -$ -$ -$
Slurry 2,475$ 2,599$ 2,729$ 2,772$ 2,911$
Soft Drink - Med 2,694$ 2,829$ 2,970$ 3,119$ 3,275$
Soft Drink - Lg 4,307$ 4,523$ 4,749$ 4,986$ 5,236$
Island Style: -$ -$ -$ -$ -$
Chips 5,388$ 5,657$ 5,940$ 6,237$ 6,549$
Popcorn 5,388$ 5,657$ 5,940$ 6,237$ -$
Island Fries 5,388$ 5,657$ 5,940$ 6,237$ 6,549$
Dips: -$ -$ -$ -$ -$
Cold -$ -$ -$ -$ -$
Hot -$ -$ -$ -$ -$
Miscellaneous: -$ -$ -$ -$ -$
Sampling 5,516$ 5,792$ 6,081$ 6,385$ 6,704$
Waste 5,516$ 5,792$ 6,081$ 6,385$ 6,704$
O'hana Bros Merchandise -$ -$ -$ -$ -$
Total F&B 88,325$ 81,722$ 85,808$ 89,422$ 87,344$
Credit Card Fees 8,758$ 9,196$ 9,656$ 10,094$ 10,599$
Paper Supplies 5,005$ 5,255$ 5,518$ 5,768$ 6,057$
Payroll: 99,450$ 102,434$ 105,507$ 108,672$ 111,932$
Payroll Taxes 10,940$ 11,268$ 11,606$ 12,186$ 12,795$
Workers Comp 4,609$ 4,609$ 4,609$ 4,609$ 4,609$
Benefits -$ -$ -$ -$ -$
Total Payroll 114,998$ 118,310$ 121,721$ 125,467$ 129,336$
-$ -$ -$ -$ -$
Total COGS 217,086$ 214,483$ 222,703$ 230,751$ 233,336$
Gross Profit 283,383$ 311,010$ 329,065$ 346,070$ 372,326$
Gross Margin 57% 59% 60% 60% 61%
Operating Expenses
Rent (includes electricity of $8.01/sq.ft./yr) 60,661$ 61,369$ 62,596$ 63,848$ 65,125$
CAM 30,745$ 32,282$ 33,896$ 35,591$ 37,370$
RE Taxes 3,906$ 3,984$ 4,064$ 4,145$ 4,228$
Promotional Charge / year 4,936$ 5,183$ 5,442$ 5,714$ 6,000$
Water / Sewer -$ -$ -$ -$ -$
Insurance 4,018$ 4,018$ 4,018$ 4,018$ 4,018$
-$ -$ -$ -$ -$
Storage
Repairs & Maintenance (includes cleaning supplies) 3,000$ 3,090$ 3,183$ 3,278$ 3,377$
Liability Insurance 545$ 561$ 548$ 564$ 581$
Personal Property Insurance 300$ 309$ 318$ 328$ 338$
Supplemental Mgr 15,600$ 16,068$ 16,550$ 17,047$ 17,558$
Payroll Load 15% 2,340$ 2,410$ 2,483$ 2,483$ 2,483$
Utilities - Gas 4,800$ 4,944$ 5,092$ 5,245$ 5,402$
Telephone AT&T - POS 600$ 618$ 637$ 656$ 675$
Licenses & permits Health, Business, etc. 300$ 306$ 312$ 318$ 325$
Equipment Leases POS 828$ 828$ 828$ 828$ 828$
Uniforms 1,200$ 1,203$ 1,203$ 1,239$ 1,276$
Total Expenses 133,778$ 137,173$ 141,169$ 145,301$ 149,583$
Net Operating Income 149,605$ 173,838$ 187,897$ 200,769$ 222,743$
30% 33% 34% 35% 37%

'Ohana Bros. "Island Style Chips and Popcorn"
Fund I - Combined Total Yr 1 Total Yr 2 Year 3 Total Yr 4 Year 5 Year 6
Annual Annual Annual Annual Annual Annual
Gross Revenue:
Site #1 500,470$ 520,489$ 541,308$ 562,961$ 585,479$ 608,898$
Site #2 250,235$ 520,489$ 541,308$ 562,961$ 585,479$ 608,898$
Site #3 -$ 520,489$ 541,308$ 562,961$ 585,479$ 608,898$
Site #4 -$ 346,992$ 541,308$ 562,961$ 585,479$ 608,898$
Site #5 -$ 173,496$ 541,308$ 562,961$ 585,479$ 608,898$
Site #6 -$ -$ 541,308$ 562,961$ 585,479$ 608,898$
Site #7 -$ -$ 360,872$ 562,961$ 585,479$ 608,898$
Site #8 -$ -$ 180,436$ 562,961$ 585,479$ 608,898$
Site #9 -$ -$ -$ 562,961$ 585,479$ 608,898$
Site #10 -$ -$ -$ 375,307$ 585,479$ 608,898$
Site #11 -$ -$ -$ 187,654$ 585,479$ 608,898$
Site #12 -$ -$ -$ -$ 585,479$ 608,898$
Site #13 -$ -$ -$ -$ 390,319$ 608,898$
Site #14 -$ -$ -$ -$ 195,160$ 608,898$
Site #15 -$ -$ -$ -$ 195,160$ 608,898$
Total Gross Revenue: 750,705$ 2,081,955$ 3,789,157$ 5,629,605$ 7,611,226$ 8,524,573$
Cost of Goods:
Site #1 (217,086)$ (225,770)$ (234,801)$ (244,193)$ (253,960)$ (264,119)$
Site #2 (108,543)$ (225,770)$ (234,801)$ (244,193)$ (253,960)$ (264,119)$
Site #3 -$ (225,770)$ (234,801)$ (244,193)$ (253,960)$ (264,119)$
Site #4 -$ (150,513)$ (234,801)$ (244,193)$ (253,960)$ (264,119)$
Site #5 -$ (75,257)$ (234,801)$ (244,193)$ (253,960)$ (264,119)$
Site #6 -$ -$ (234,801)$ (244,193)$ (253,960)$ (264,119)$
Site #7 -$ -$ (156,534)$ (244,193)$ (253,960)$ (264,119)$
Site #8 -$ -$ (78,267)$ (244,193)$ (253,960)$ (264,119)$
Site #9 -$ -$ -$ (244,193)$ (253,960)$ (264,119)$
Site #10 -$ -$ -$ (162,795)$ (253,960)$ (264,119)$
Site #11 -$ -$ -$ (81,398)$ (253,960)$ (264,119)$
Site #12 -$ -$ -$ -$ (253,960)$ (264,119)$
Site #13 -$ -$ -$ -$ (169,307)$ (264,119)$
Site #14 -$ -$ -$ -$ (84,653)$ (264,119)$
Site #15 -$ -$ -$ -$ (84,653)$ (264,119)$
Total COGS (325,630)$ (903,080)$ (1,643,605)$ (2,441,927)$ (3,301,486)$ (3,697,664)$
Gross Profit
Site #1 283,383$ 746,259$ 306,507$ 318,768$ 331,518$ 344,779$
Site #2 141,692$ 746,259$ 306,507$ 318,768$ 331,518$ 344,779$
Site #3 -$ 746,259$ 306,507$ 318,768$ 331,518$ 344,779$
Site #4 -$ 497,506$ 306,507$ 318,768$ 331,518$ 344,779$
Site #5 -$ 248,753$ 306,507$ 318,768$ 331,518$ 344,779$
Site #6 -$ -$ 306,507$ 318,768$ 331,518$ 344,779$
Site #7 -$ -$ 204,338$ 318,768$ 331,518$ 344,779$
Site #8 -$ -$ 102,169$ 318,768$ 331,518$ 344,779$
Site #9 -$ -$ -$ 318,768$ 331,518$ 344,779$
Site #10 -$ -$ -$ 212,512$ 331,518$ 344,779$
Site #11 -$ -$ -$ 106,256$ 331,518$ 344,779$
Site #12 -$ -$ -$ -$ 331,518$ 344,779$
Site #13 -$ -$ -$ -$ 221,012$ 344,779$
Site #14 -$ -$ -$ -$ 110,506$ 344,779$
Site #15 -$ -$ -$ -$ 110,506$ 344,779$
Total Gross Profit 425,075$ 2,985,034$ 2,145,552$ 3,187,678$ 4,309,740$ 4,826,909$
Operating Expenses
Site #1 (132,627)$ (137,933)$ (143,450)$ (149,188)$ (155,155)$ (161,362)$
Site #2 (66,314)$ (137,933)$ (143,450)$ (149,188)$ (155,155)$ (161,362)$
Site #3 -$ (137,933)$ (143,450)$ (149,188)$ (155,155)$ (161,362)$
Site #4 -$ (91,955)$ (143,450)$ (149,188)$ (155,155)$ (161,362)$
Site #5 -$ (45,978)$ (143,450)$ (149,188)$ (155,155)$ (161,362)$
Site #6 -$ -$ (143,450)$ (149,188)$ (155,155)$ (161,362)$
Site #7 -$ -$ (95,633)$ (149,188)$ (155,155)$ (161,362)$
Site #8 -$ -$ (47,817)$ (149,188)$ (155,155)$ (161,362)$
Site #9 -$ -$ -$ (149,188)$ (155,155)$ (161,362)$
Site #10 -$ -$ -$ (99,459)$ (155,155)$ (161,362)$
Site #11 -$ -$ -$ (49,729)$ (155,155)$ (161,362)$
Site #12 -$ -$ -$ -$ (155,155)$ (161,362)$
Site #13 -$ -$ -$ -$ (103,437)$ (161,362)$
Site #14 -$ -$ -$ -$ (51,718)$ (161,362)$
Site #15 -$ -$ -$ -$ (51,718)$ (161,362)$
Total Operating Expenses (198,941)$ (551,730)$ (1,004,149)$ (1,491,879)$ (2,017,020)$ (2,259,063)$
Net Operating Income
Site #1 150,756$ 156,786$ 163,058$ 169,580$ 176,363$ 183,418$
Site #2 75,378$ 156,786$ 163,058$ 169,580$ 176,363$ 183,418$
Site #3 -$ 156,786$ 163,058$ 169,580$ 176,363$ 183,418$
Site #4 -$ 104,524$ 163,058$ 169,580$ 176,363$ 183,418$
Site #5 -$ 52,262$ 163,058$ 169,580$ 176,363$ 183,418$
Site #6 -$ -$ 163,058$ 169,580$ 176,363$ 183,418$
Site #7 -$ -$ 108,705$ 169,580$ 176,363$ 183,418$
Site #8 -$ -$ 54,353$ 169,580$ 176,363$ 183,418$
Site #9 -$ -$ -$ 169,580$ 176,363$ 183,418$
Site #10 -$ -$ -$ 113,053$ 176,363$ 183,418$
Site #11 -$ -$ -$ 56,527$ 176,363$ 183,418$
Site #12 -$ -$ -$ -$ 176,363$ 183,418$
Site #13 -$ -$ -$ -$ 117,575$ 183,418$
Site #14 -$ -$ -$ -$ 58,788$ 183,418$
Site #15 -$ -$ -$ -$ 58,788$ 183,418$
Total Net Operating Income 226,134$ 627,145$ 1,141,403$ 1,695,799$ 2,351,508$ 2,751,264$

FUND TERMS - ‘OHANA BROS. FUND I, LLC
Phase I Funding Round
Sunvalley Mall, Concord, CA
Investment $360,000
Fund Vehicle Limited Liability Company with Manager-Managed Operating Agreement
Investment Period 5-Years for Preferred Return terms
Management Fee Asset Management Fee shall be 4% of gross revenues per annum commencing
year three.
Return Investment Members: Investment Members will contribute $360,000 to
capitalization. Prior to any distributions to any Operating Members,
Investment Members will receive 100% of cash distributions5 until such
time that the investor member receives two (2X) times their original
investment. Afterwards, the cash distribution percentage will be allocated
according to each member’s percentage in this LLC.
Operating Members: Once Investment Members received 2X their
original investment, the cash distributions will be allocated to members
according to each member’s percentage interest in this LLC.
Participation Investments are made through our subscription and operating agreements
Individual investors minimum commitment is $10,000
5 Cash distributions are defined as cash remaining after debt service and reserves.