Offshore Wind: Director, EMEA Utilities Pierre Georges ...
13
Sept. 21, 2021 Massimo Schiavo, Director, EMEA Utilities Pierre Georges, Senior Director, EMEA Utilities Aneesh Prabhu, Senior Director, North America Power And Energy Maria Vinokur, Associate, EMEA Capital Goods Offshore Wind: Powering A Net Zero Economy Exploring the growth potential for the European and U.S. offshore wind industry
Transcript of Offshore Wind: Director, EMEA Utilities Pierre Georges ...

Sept. 21, 2021
Massimo Schiavo, Director, EMEA Utilities Pierre Georges, Senior Director, EMEA Utilities Aneesh Prabhu, Senior Director, North America Power And EnergyMaria Vinokur, Associate, EMEA Capital Goods
Offshore Wind: Powering A Net Zero Economy Exploring the growth potential for the European and U.S. offshore wind industry

Contents
2
Key Takeaways 3
European Offshore Wind Will Continue To Lead Global Growth 4
Despite Some Pressure in 2021… 5
…Offshore Wind Costs Will Decline Further In Europe 6
Offshore Wind Is Still Uneconomical In The U.S. 7
Complex Projects And Harsh Operating Environments Mean High Risks 8
Wind Turbine Manufacturers Will Need To Balance Growth And Sustainability 9
A Deep Dive By Region And Sector 10
Related Research 11
Analytical Contacts 12

Key Takeaways
– Small, growing fast, unavoidable--Offshore wind will be instrumental as the EU and U.S. aims for 2050 carbon neutrality. Today, it accounts for only 3% of the European electricity mix and remains marginal elsewhere. We expect global installed capacity will surpass 180GW by 2030 (6x more than today).
– A European lead--With 25GW of installed capacity at year-end 2020, Europe accounted for 72% of the global offshore wind market, with S&P Global Platts Analytics expecting the region to account for 60% in 2030.
– More cost competitive--Offshore wind is gradually closing the cost gap in Europe with other technologies, with prices in nearshore bottom-fixed wind auctions in the North Sea falling close to $50/MWh including transmission costs. We expect costs to continue to fall in the next decade.
– U.S. market taking off--Offshore wind still currently lacks competitiveness in the U.S., but economics are improving. Our estimate for the levelized cost of energy without the benefit of any investment tax credit is about $85/MWh.
– Risks remain high--Despite a generally good track record so far, we continue to see construction and operating risks as high, including erosion of offshore wind installations, weather-related effects on wind developers’ internal return rate, and supply chain disruptions.
– Defining sustainable growth for wind turbine manufacturers--The challenge is finding the right balance between allocating sufficient resources to achieve internal sustainable targets while accelerating growth. We are focusing on five ESG factors, notably the shortage of skilled labor, sustainability of supply chains, contribution to the circular economy, health and safety, and community engagement.

Europe And The U.K. Had 25 GW Of Installed Offshore Wind Capacity At End-2020
European Offshore Wind Will Continue To Lead Global Growth
− New European environmental targets are aiming at upping installed capacity to more than 100GW by 2030, from 25GW today. To achieve carbon neutrality in 2050, Europe may need to increase installed capacity by at least 400GW, which we believe can only happen with the emergence of floating offshore wind.
− European utilities, including Orsted, RWE, Vattenfall, Iberdrola, EnBW, EDF, SSE, and Eneco are set to remain leaders in global offshore wind development (outside China) in the next five years, given an existing market share of more than 45% and a robust global pipeline of more than 29GW until 2025.
− Europe will remain the global leader in wind turbine manufacturing, with Siemens Gamesa Renewable Energy and Vestas that have until now supplied 88% of existing offshore wind online capacity and are involved in 84% of offshore wind projects under construction.
4
0
2
4
6
8
10
12
U.K. Germany Netherlands Belgium Denmark
GW
GW--Gigawatt. Source: S&P Global Ratings.

Surging Commodity Prices In 2021 So Far Could Lift Renewable Installation Costs By Up To 5%
Despite Some Pressure in 2021…
− Falling costs--The levelized cost of energy for offshore wind in Europe has almost halved over the past decade and is set to continue falling, yet at a decelerated pace.
− Temporary hiccup--Due to the fourfold increase in logistics costs and commodity inflation, prices of key metals (steel and copper) used in renewables plants have hit historical highs recently. Renewable installation costs could increase by up to 5% in 2021, according to S&P Global Platts Analytics.
− Turbine manufacturers hit the most--On top of commodity price inflation, the ramp-up of costs within the 5.0x platform harmed the earnings of wind turbine manufacturers.
5
(1)
0
1
2
3
4
5
0
1,000,000
2,000,000
3,000,000
4,000,000
5,000,000
6,000,000
2015 2016 2017 2018 2019 2020 2021
%
Tota
l ins
tall
ed c
ost (
$/M
W)
Offshore (left scale) Offshore percentage change (right scale)
MW--Megawatt. Source: S&P Global Ratings.

Key drivers for future cost reduction:
Wind Turbines Are Becoming Larger And More Powerful As Demand IncreasesTechnology evolution by size and power output: 2010-2024
…Offshore Wind Costs Will Decline Further In Europe
− The adoption of more efficient engineering, procurement, and construction practices, which hinge on a more efficient and more mature supply chain in Europe.
− Larger project size, allowing for greater economies of scale.
− Further streamlining of operations and maintenance, with, for example, greater recourse to digital monitoring and use of drones for visual inspections.
− A further increase in turbine size: new turbines of 12MW-15MW promise to achieve capacity factors close to 60% (before wake losses), according to WindEurope.
6
Source: SGRE, Vestas, MINGYANG Smart Energy.
2010
4MW
117m
2021
10MW
164m
2022-2024F
16MW
236m
2019
8MW
167m

U.S. Offshore Wind State Mandates April 2018 U.S. Offshore Wind State Mandates September 2021
Offshore Wind Is Still Uneconomical In The U.S., But Costs Could Go Down
7
Source: S&P Global Ratings. Source: S&P Global Ratings.
– The levelized cost of energy remains uneconomical in the U.S., at more than $85 per MWh ($65/MWh with a tax credit), compared with those of competing technologies.
– The potential for declining costs from technological innovations is substantial, as seen in Europe. This is also supported by offshore wind getting to scale, with about 29GW of wind procurement targets established to date, which compares with just 8GW in mid-2018. The Biden administration has set a nationwide goal of 30GW by 2030 and 110GW by 2050.
– We continue to see execution risks with the potential for timeline delays due to the complex nature of projects that have seasonal timing restrictions and multiple parallel processes, notably with a less mature supply chain than Europe.
2.4, 30%
3.5, 43%
1.6, 20%
0.2, 2% 0.4, 5% 0, 0%
NY NJ MA CT VA MD RI NC
9.0, 31%
7.0, 24%3.2, 11%
2.3, 8%
2.5, 8%
1.2, 4%
1.1, 4% 2.8, 10%
NY NJ MA CT VA MD RI NC

Complex Projects And Harsh Operating Environments Mean High Risks
8
Recently emerging risks ffffffffff
Supply chaindisruption
As offshore wind developers take steps to diversify their operations in other regions of the world, exposure to supply chain disruptions increases. New supply chains need to be built, either because of transportation issues or because of legal requirements for a high share of local content. Today, the supply chain is based mostly in Europe. As offshore wind developers diversity internationally, they become exposed to less mature suppliers, which could lead to risks related to increased cost uncertainties, operating disruptions, and bottlenecks.
Weather-relatedeffects on IRR
Weather-related effects a potential hindrance to wind developers’ internal rate of return. In October 2019, Orsted revised its anticipated unlevered internal rate of return for several projects in Europe and Taiwan to 7.0%-8.0%, from 7.5%-8.5%, because of an underestimation of wake and blockage effects.
Erosion risk
Erosion of offshore wind installations, given the harsh environment in the open seas, where weather conditions can be more extreme than onshore, underwater operations are becoming more hazardous, and salt can deteriorate installed components. In April 2021, Orsted announced that cables connected to wind farms were damaged as they scraped rocks on the seabed, requiring investment of Danish krone (DKK) 3 billion (about €400 million) until 2022 to repair them. We note that some of Orsted's offshore wind farms have been operating for almost a decade now, with our understanding of Vattenfall and RWE also experiencing similar issues, albeit at smaller scale.
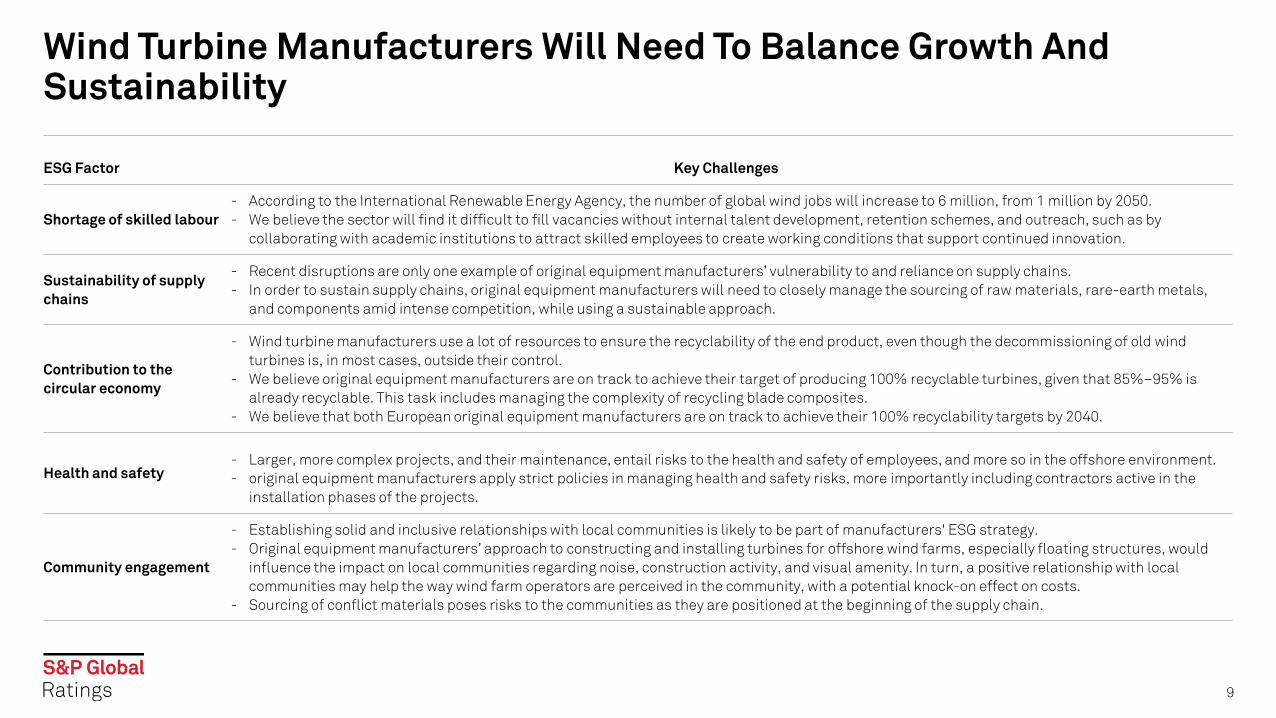
Wind Turbine Manufacturers Will Need To Balance Growth And Sustainability
ESG Factor Key Challenges
Shortage of skilled labour- According to the International Renewable Energy Agency, the number of global wind jobs will increase to 6 million, from 1 million by 2050.- We believe the sector will find it difficult to fill vacancies without internal talent development, retention schemes, and outreach, such as by
collaborating with academic institutions to attract skilled employees to create working conditions that support continued innovation.
Sustainability of supply chains
- Recent disruptions are only one example of original equipment manufacturers’ vulnerability to and reliance on supply chains. - In order to sustain supply chains, original equipment manufacturers will need to closely manage the sourcing of raw materials, rare-earth metals,
and components amid intense competition, while using a sustainable approach.
Contribution to the circular economy
- Wind turbine manufacturers use a lot of resources to ensure the recyclability of the end product, even though the decommissioning of old wind turbines is, in most cases, outside their control.
- We believe original equipment manufacturers are on track to achieve their target of producing 100% recyclable turbines, given that 85%–95% is already recyclable. This task includes managing the complexity of recycling blade composites.
- We believe that both European original equipment manufacturers are on track to achieve their 100% recyclability targets by 2040.
Health and safety- Larger, more complex projects, and their maintenance, entail risks to the health and safety of employees, and more so in the offshore environment.- original equipment manufacturers apply strict policies in managing health and safety risks, more importantly including contractors active in the
installation phases of the projects.
Community engagement
- Establishing solid and inclusive relationships with local communities is likely to be part of manufacturers' ESG strategy. - Original equipment manufacturers’ approach to constructing and installing turbines for offshore wind farms, especially floating structures, would
influence the impact on local communities regarding noise, construction activity, and visual amenity. In turn, a positive relationship with local communities may help the way wind farm operators are perceived in the community, with a potential knock-on effect on costs.
- Sourcing of conflict materials poses risks to the communities as they are positioned at the beginning of the supply chain.
9

A Deep Dive By Region And Sector
10
Here's a list of the articles published:
European Offshore Wind Will Continue To Lead Global Growth Massimo Schiavo and Pierre Georges
The Energy Transition: Offshore Wind Picks Up Aneesh Prabhu
Europe's Renewable Energy Ambitions LiftWind Turbine Makers' Prospects Maria Vinokur
Related Research
– Ratings On Six European Integrated Utilities Affirmed Amid Accelerated Energy Transition; One Outlook Now Negative, Feb. 17, 2021
– The Energy Transition: ESG Concerns Are Starting To Present Capital Market Challenges To North American Energy Companies, June 14, 2021
– Write-Downs, While Eye-Catching, Are Not The Largest Issue Facing Oil And Gas Supermajors, Aug. 3, 2020
– The Energy Transition: Is Offshore Wind Done Or Going For Other Bids? , Feb. 18, 2020
– Energy Transition: Renewable Energy Matures With Blossoming Complexity, Nov. 8, 2019
11

Analytical Contacts
12
Pierre Georges
Paris
+33-14-420-6735
Massimo Schiavo
Paris
+33-14-420-6718
Maria Vinokur
Madrid
+44-20-7176-3727
Aneesh Prabhu
New York
+1-212-438-1285

13
Copyright © 2021 by Standard & Poor’s Financial Services LLC. All rights reserved.
No content (including ratings, credit-related analyses and data, valuations, model, software or other application or output therefrom) or any part thereof (Content) may be modified, reverse engineered, reproduced or distributed in any form by any means, or stored in a database or retrieval system, without the prior written permission of Standard & Poor's Financial Services LLC or its affiliates (collectively, S&P). The Content shall not be used for any unlawful or unauthorized purposes. S&P and any third-party providers, as well as their directors, officers, shareholders, employees or agents (collectively S&P Parties) do not guarantee the accuracy, completeness, timeliness or availability of the Content. S&P Parties are not responsible for any errors or omissions (negligent or otherwise), regardless of the cause, for the results obtained from the use of the Content, or for the security or maintenance of any data input by the user. The Content is provided on an "as is" basis. S&P PARTIES DISCLAIM ANY AND ALL EXPRESS OR IMPLIED WARRANTIES, INCLUDING, BUT NOT LIMITED TO, ANY WARRANTIES OF MERCHANTABILITY OR FITNESS FOR A PARTICULAR PURPOSE OR USE, FREEDOM FROM BUGS, SOFTWARE ERRORS OR DEFECTS, THAT THE CONTENT'S FUNCTIONING WILL BE UNINTERRUPTED, OR THAT THE CONTENT WILL OPERATE WITH ANY SOFTWARE OR HARDWARE CONFIGURATION. In no event shall S&P Parties be liable to any party for any direct, indirect, incidental, exemplary, compensatory, punitive, special or consequential damages, costs, expenses, legal fees, or losses (including, without limitation, lost income or lost profits and opportunity costs or losses caused by negligence) in connection with any use of the Content even if advised of the possibility of such damages.
Credit-related and other analyses, including ratings, and statements in the Content are statements of opinion as of the date they are expressed and not statements of fact. S&P's opinions, analyses, and rating acknowledgment decisions (described below) are not recommendations to purchase, hold, or sell any securities or to make any investment decisions, and do not address the suitability of any security. S&P assumes no obligation to update the Content following publication in any form or format. The Content should not be relied on and is not a substitute for the skill, judgment and experience of the user, its management, employees, advisors and/or clients when making investment and other business decisions. S&P does not act as a fiduciary or an investment advisor except where registered as such. While S&P has obtained information from sources it believes to be reliable, S&P does not perform an audit and undertakes no duty of due diligence or independent verification of any information it receives. Rating-related publications may be published for a variety of reasons that are not necessarily dependent on action by rating committees, including, but not limited to, the publication of a periodic update on a credit rating and related analyses.
To the extent that regulatory authorities allow a rating agency to acknowledge in one jurisdiction a rating issued in another jurisdiction for certain regulatory purposes, S&P reserves the right to assign, withdraw, or suspend such acknowledgement at any time and in its sole discretion. S&P Parties disclaim any duty whatsoever arising out of the assignment, withdrawal, or suspension of an acknowledgment as well as any liability for any damage alleged to have been suffered on account thereof.
S&P keeps certain activities of its business units separate from each other in order to preserve the independence and objectivity of their respective activities. As a result, certain business units of S&P may have information that is not available to other S&P business units. S&P has established policies and procedures to maintain the confidentiality of certain nonpublic information received in connection with each analytical process.
S&P may receive compensation for its ratings and certain analyses, normally from issuers or underwriters of securities or from obligors. S&P reserves the right to disseminate its opinions and analyses. S&P's public ratings and analyses are made available on its Web sites, www.standardandpoors.com (free of charge), and www.spcapitaliq.com (subscription) and may be distributed through other means, including via S&P publications and third-party redistributors. Additional information about our ratings fees is available at www.standardandpoors.com/usratingsfees.
Australia: S&P Global Ratings Australia Pty Ltd holds Australian financial services license number 337565 under the Corporations Act 2001. S&P Global Ratings' credit ratings and related research are not intended for and must not be distributed to any person in Australia other than a wholesale client (as defined in Chapter 7 of the Corporations Act).
STANDARD & POOR'S, S&P and RATINGSDIRECT are registered trademarks of Standard & Poor's Financial Services LLC.
spglobal.com/ratings