Offshore market outlook - marinemoney.com · Snapshot of offshore utilization and dayrate...
14
Offshore market outlook Marine Money Offshore – China Offshore Finance Forum 25 June 2015 Please refer to important disclosures at the end of this document Andy Yeo Direct: +65 64 08 98 10 Email: [email protected]
Transcript of Offshore market outlook - marinemoney.com · Snapshot of offshore utilization and dayrate...

Offshore market outlook
Marine Money Offshore – China Offshore Finance Forum
25 June 2015
Please refer to important disclosures at the end of this document
Andy Yeo
Direct: +65 64 08 98 10 Email: [email protected]

2
Rio de Janeiro
Oslo (HQ), Stockholm, Copenhagen, Helsinki,
New York
Singapore
Calgary
Los Angeles
Aberdeen
Stavanger, Trondheim, Malmö
Perth
London
Houston
Paris
Pareto Securities short introduction
Pareto’s offices and selected international clients Capital raised across the Oil Service sector* (2006-14)
Selected Pareto transactions
2,9183,567
314971
2,8602,060
3,446 3,4762,380
4,683
1,090
1,235624
1,7482,710
707 522
223
0
1,000
2,000
3,000
4,000
5,000
6,000
7,000
8,000
2006 2007 2008 2009 2010 2011 2012 2013 2014
Bond Equity
USDm
7,601
4,658
1,549 1,595
4,608 4,770
4,153 3,999
2,602
*Includes only drilling, supply and subsea sectors
January 2014
Sole Lead Arranger
5-year senior secured fixed rate bonds
USD 725m
March 2013
Sole Lead Manager
5 year senior secured bond
USD 575m
June 2014
Private placement of shares
USD 200m
Joint Lead Manager
April 2014
Joint Financial Advisor
Sale of company to Mermaid Marine
Australia Ltd.
USD 566m
March 2013
Joint Lead Manager
5 year senior unsecured bond
NOK 1,800m
June 2015
Joint Lead Manager
Public placement of shares
USD 200m
December 2013
Joint Lead Manager
6 year senior unsecured bond
USD 400m
November 2013
Global Coordinator & Sole Bookrunner
Private placement of shares
USD 250m

3
Offshore market developments over the last year
Brent price (per bbl): USD 114 (25 Jun 2014), USD 47 (14 Jan 2015), USD 60-65 (current)
OilCos cut E&P spending; expected to be down ~15% p.a. in 2015E and potentially flat in 2016E
Very limited new contract awards in the offshore sector
Increasing number of early contract terminations and contract renegotiations
Utilization and dayrates hit across the offshore sectors
4
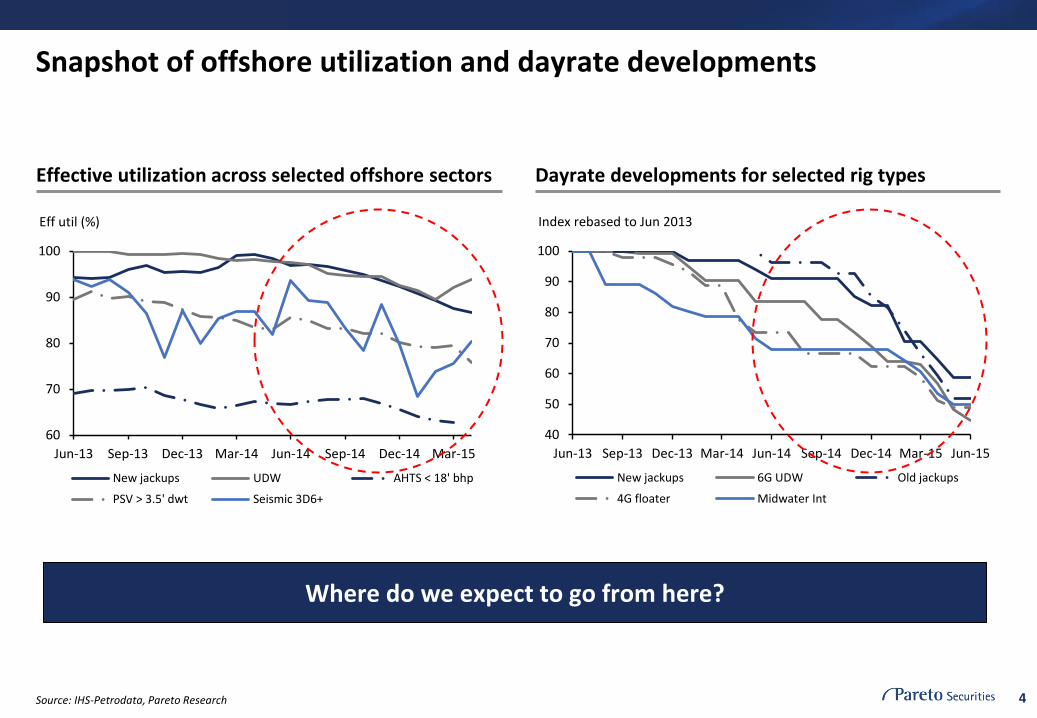
60
70
80
90
100
Jun-13 Sep-13 Dec-13 Mar-14 Jun-14 Sep-14 Dec-14 Mar-15
New jackups UDW AHTS < 18' bhp
PSV > 3.5' dwt Seismic 3D6+
Eff util (%)
Snapshot of offshore utilization and dayrate developments
Effective utilization across selected offshore sectors Dayrate developments for selected rig types
Source: IHS-Petrodata, Pareto Research
Where do we expect to go from here?
40
50
60
70
80
90
100
Jun-13 Sep-13 Dec-13 Mar-14 Jun-14 Sep-14 Dec-14 Mar-15 Jun-15
New jackups 6G UDW Old jackups
4G floater Midwater Int
Index rebased to Jun 2013
5 *Spread cost vares widely from well to well and based on the type of work Source: Pareto Research
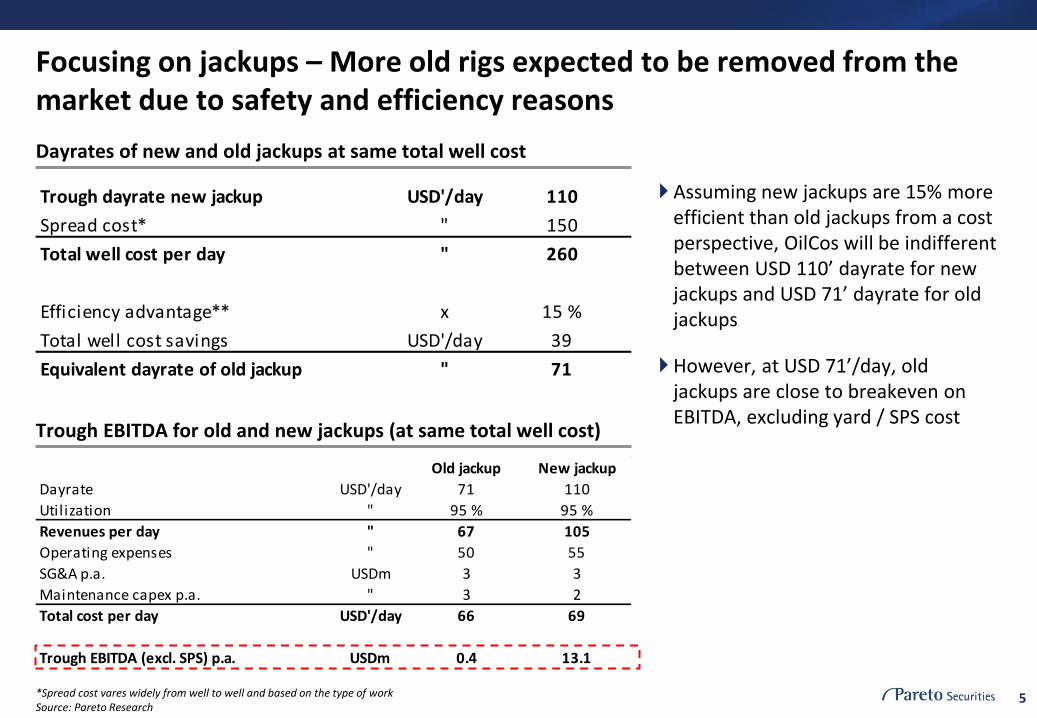
Focusing on jackups – More old rigs expected to be removed from the market due to safety and efficiency reasons
Dayrates of new and old jackups at same total well cost
Assuming new jackups are 15% more efficient than old jackups from a cost perspective, OilCos will be indifferent between USD 110’ dayrate for new jackups and USD 71’ dayrate for old jackups
However, at USD 71’/day, old jackups are close to breakeven on EBITDA, excluding yard / SPS cost
Trough dayrate new jackup USD'/day 110
Spread cost* " 150
Total well cost per day " 260
Efficiency advantage** x 15 %
Total well cost savings USD'/day 39
Equivalent dayrate of old jackup " 71
Trough EBITDA for old and new jackups (at same total well cost)
Old jackup New jackup
Dayrate USD'/day 71 110
Utilization " 95 % 95 %
Revenues per day " 67 105
Operating expenses " 50 55
SG&A p.a. USDm 3 3
Maintenance capex p.a. " 3 2
Total cost per day USD'/day 66 69
Trough EBITDA (excl. SPS) p.a. USDm 0.4 13.1
6
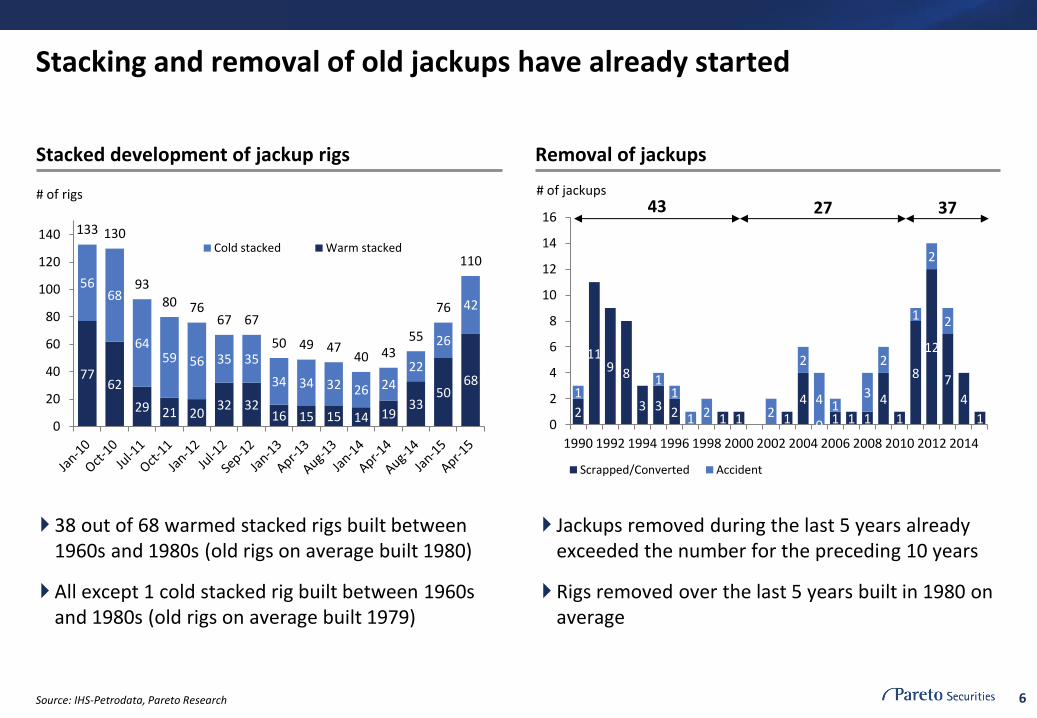
Stacking and removal of old jackups have already started
Source: IHS-Petrodata, Pareto Research
Stacked development of jackup rigs Removal of jackups
2
119 8
3 3 2 1 1 1
4
0 1 1 1
4
1
8
12
7
4
1
11
1
1 2 2
2
4 13
2
1
2
2
0
2
4
6
8
10
12
14
16
1990 1992 1994 1996 1998 2000 2002 2004 2006 2008 2010 2012 2014
Scrapped/Converted Accident
# of jackups
37 27 43
38 out of 68 warmed stacked rigs built between 1960s and 1980s (old rigs on average built 1980)
All except 1 cold stacked rig built between 1960s and 1980s (old rigs on average built 1979)
Jackups removed during the last 5 years already exceeded the number for the preceding 10 years
Rigs removed over the last 5 years built in 1980 on average
7762
29 21 2032 32
16 15 15 14 1933
5068
5668
6459 56 35 35
34 34 32 26 2422
26
42
133 130
9380 76
67 67
50 49 4740 43
55
76
110
0
20
40
60
80
100
120
140Cold stacked Warm stacked
# of rigs
7
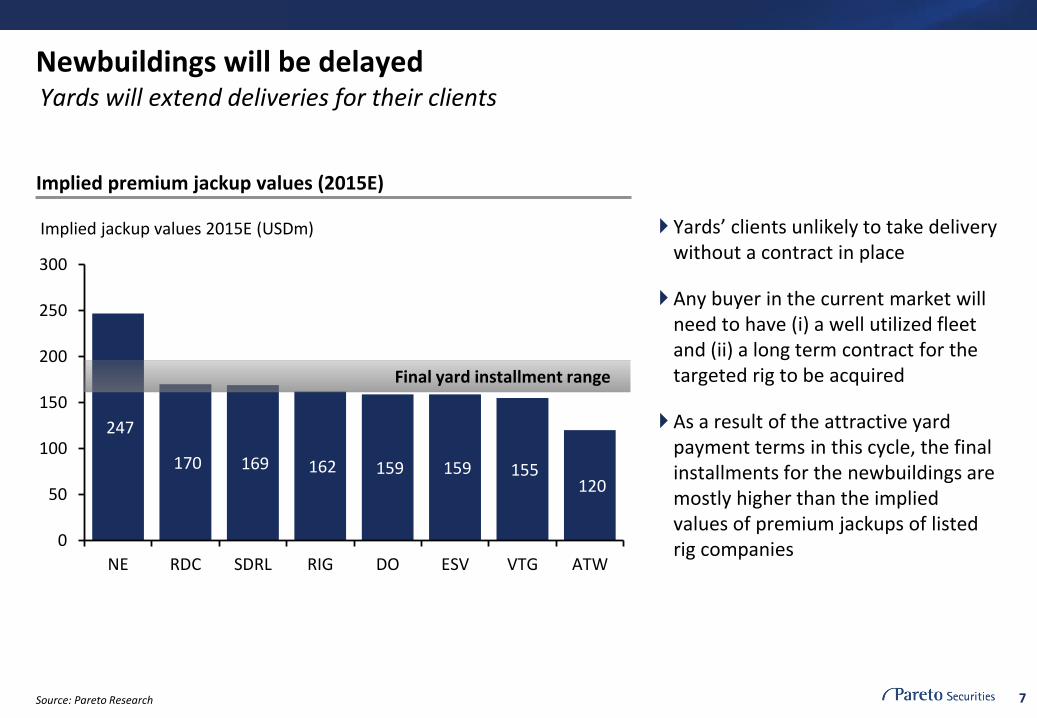
Newbuildings will be delayed
Implied premium jackup values (2015E)
Yards’ clients unlikely to take delivery without a contract in place
Any buyer in the current market will need to have (i) a well utilized fleet and (ii) a long term contract for the targeted rig to be acquired
As a result of the attractive yard payment terms in this cycle, the final installments for the newbuildings are mostly higher than the implied values of premium jackups of listed rig companies
247
170 169 162 159 159 155 120
0
50
100
150
200
250
300
NE RDC SDRL RIG DO ESV VTG ATW
Implied jackup values 2015E (USDm)
Source: Pareto Research
Final yard installment range
Yards will extend deliveries for their clients
8
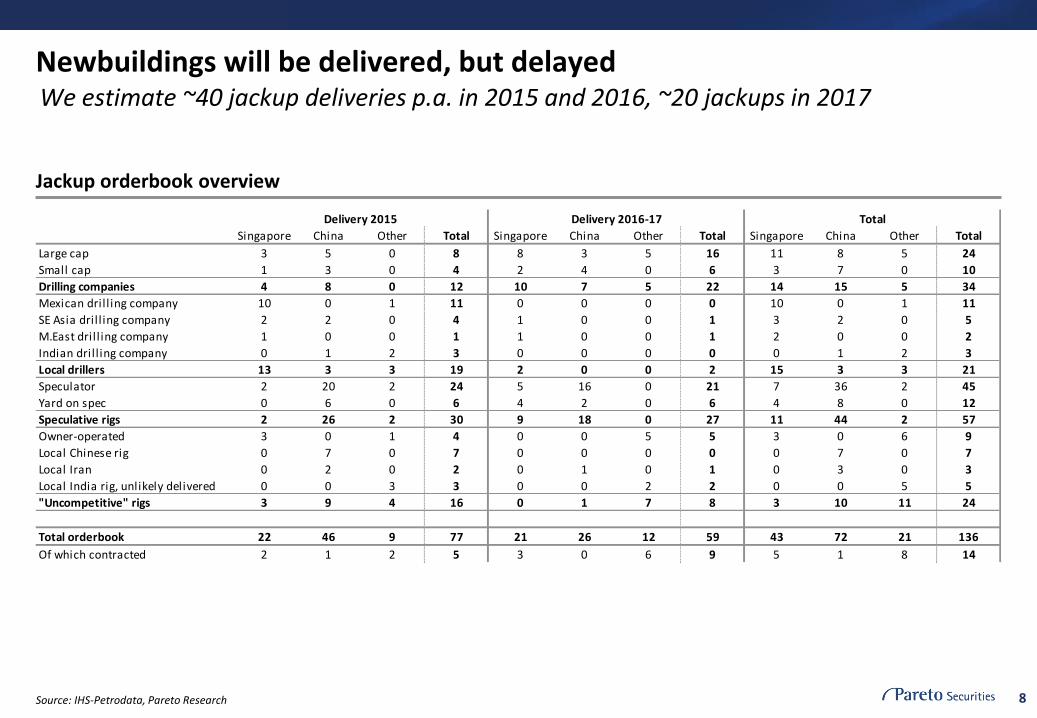
Newbuildings will be delivered, but delayed
Jackup orderbook overview
Singapore China Other Total Singapore China Other Total Singapore China Other Total
Large cap 3 5 0 8 8 3 5 16 11 8 5 24
Small cap 1 3 0 4 2 4 0 6 3 7 0 10
Drilling companies 4 8 0 12 10 7 5 22 14 15 5 34
Mexican dril l ing company 10 0 1 11 0 0 0 0 10 0 1 11
SE Asia dril l ing company 2 2 0 4 1 0 0 1 3 2 0 5
M.East dril l ing company 1 0 0 1 1 0 0 1 2 0 0 2
Indian dril l ing company 0 1 2 3 0 0 0 0 0 1 2 3
Local drillers 13 3 3 19 2 0 0 2 15 3 3 21
Speculator 2 20 2 24 5 16 0 21 7 36 2 45
Yard on spec 0 6 0 6 4 2 0 6 4 8 0 12
Speculative rigs 2 26 2 30 9 18 0 27 11 44 2 57
Owner-operated 3 0 1 4 0 0 5 5 3 0 6 9
Local Chinese rig 0 7 0 7 0 0 0 0 0 7 0 7
Local Iran 0 2 0 2 0 1 0 1 0 3 0 3
Local India rig, unlikely delivered 0 0 3 3 0 0 2 2 0 0 5 5
"Uncompetitive" rigs 3 9 4 16 0 1 7 8 3 10 11 24
Total orderbook 22 46 9 77 21 26 12 59 43 72 21 136
Of which contracted 2 1 2 5 3 0 6 9 5 1 8 14
Delivery 2015 Delivery 2016-17 Total
Source: IHS-Petrodata, Pareto Research
We estimate ~40 jackup deliveries p.a. in 2015 and 2016, ~20 jackups in 2017

9
Lower demand expected in the shorter term
Jackup supply / demand summary
Source: IHS-Petrodata, Pareto Research
320 324 342 358 367 371 373 371 385 396 420 422 421 411 392 370 352
77 62 29 21 20 32 32 16 15 1514 19 33 50 68 80
7556 68 64 59 56 35 35 34 34 32 26 24 22 26 42 66 139
50%
60%
70%
80%
90%
100%
050
100150200250300350400450500550
Contracted Warm stacked Cold stacked Marketed utilization
# of rigs
Driven by South East Asia due to high fleet growth over the past decade
10
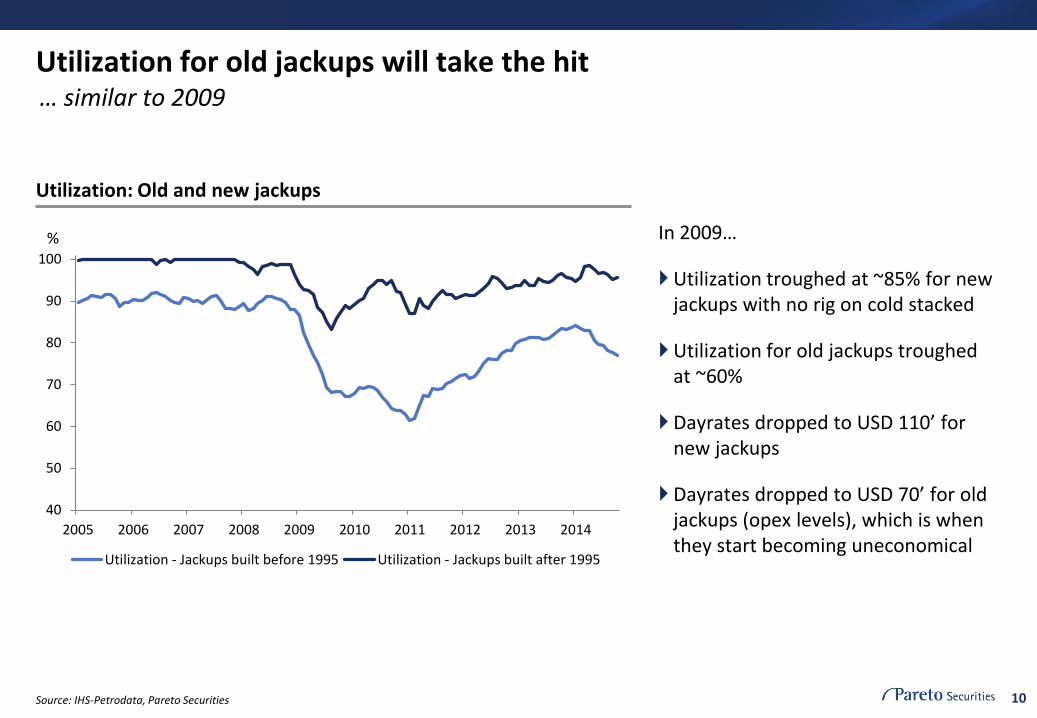
Utilization for old jackups will take the hit
Source: IHS-Petrodata, Pareto Securities
Utilization: Old and new jackups
In 2009…
Utilization troughed at ~85% for new jackups with no rig on cold stacked
Utilization for old jackups troughed at ~60%
Dayrates dropped to USD 110’ for new jackups
Dayrates dropped to USD 70’ for old jackups (opex levels), which is when they start becoming uneconomical
40
50
60
70
80
90
100
2005 2006 2007 2008 2009 2010 2011 2012 2013 2014
Utilization - Jackups built before 1995 Utilization - Jackups built after 1995
%
… similar to 2009

11
The positive news: Costs are down 25+% the past year
Source: Pareto Research
Maria cost down ~15% from December Kaombo cost down ~20% in 2014
USD 70/bbl is the new USD 100/bbl
SURFSURF
Equipment
Equipment
Rigs
Rigs
Other
Other
0
500
1,000
1,500
2,000
2,500
Old New
USDm
SURF SURF
FPSO
FPSO
Equipment
Equipment
Umbilicals
Umbilicals
Rigs
Rigs
Other
Other
0
2,000
4,000
6,000
8,000
10,000
12,000
14,000
16,000
18,000
20,000
Old New
USDm

12
There is plenty of capital available, ready to invest at the right price
USD 200m equity raised via registered direct offering
Uses of net proceeds: Working capital and general corporate purposes
Launch date 2 June 2015, completion date 3 June 2015
Placement price: USD 7/share, 13% discount to last close
Geographical split on demand: 67% US, 15% UK, 18% others
Ocean Rig’s recent equity raise is a very good example
The key is to be able to differentiate from peers (e.g. valuation, structure, etc.)

13
Summary
The current offshore market is challenging
However, demand will recover, driven initially by lower development / breakeven costs for OilCo’s; USD 70/bbl is the new USD 100/bbl
Supply must adjust to balance the market; restructuring has started for some
Capital is available for companies with modern assets with the right structure and price

14
Contact details
www.paretosec.com | Bloomberg: PASE (go) | Reuters: PARETO
Oslo (Norway) Pareto Securities AS Dronning Mauds gate 3 PO Box 1411 Vika N-0115 Oslo NORWAY Tel: +47 22 87 87 00
Stavanger (Norway) Pareto Securities AS Haakon VIIs gate 8 PO Box 163 N-4001 Stavanger NORWAY Tel: +47 51 83 63 00
Trondheim (Norway) Pareto Securities AS Nordre gate 11 PO Box 971 Sentrum N-7410 Trondheim NORWAY Tel: +47 21 50 74 60
Malmö (Sweden) Pareto Securities AB Stortorget 13 S-211 22 Malmö SWEDEN Tel: +46 40 750 20
Rio de Janeiro (Brazil) Pareto Securities Ltda Av. Presidente Wilson 231, 9° andar Rio de Janeiro, RJ 20030-021 BRAZIL Tel: +55 21 3578-5620
Stockholm (Sweden) Pareto Securities AB Berzelii Park 9 PO Box 7415 S-103 91 Stockholm SWEDEN Tel: +46 8 402 50 00
Helsinki (Finland) Pareto Securities Oy Aleksanterinkatu 44, 6th floor FI-00100 Helsinki FINLAND Tel: +358 9 8866 6000
Copenhagen (Denmark) Pareto Securities AS Copenhagen Branch Bredgade 30 DK-1260 Copenhagen DENMARK Tel: +45 78 73 48 00
Perth (Australia) Pareto Securities Pty Ltd Level 24 77 St Georges Tce Perth, Western Australia AUSTRALIA, 6000 Tel: +61 8 6141 3366
Singapore Pareto Securities Pte Ltd 16 Collyer Quay #27-02 Income at Raffles Singapore 049318 SINGAPORE Tel: +65 6408 9800
London (UK) Pareto Securities Ltd 8 Angel Court London EC2R 7HJ UNITED KINGDOM Tel: +44 20 7786 4370
New York (US) Pareto Securities Inc 150 East 52nd Street, 29th floor New York NY 10022 USA Tel: +1 212 829-4200
Houston (US) Pareto Securities Inc 8 Greenway Plaza, Suite 818 Houston, TX 77046 USA Tel: +1 832 831-1895
Aberdeen (UK) Pareto Securities Ltd 46 Carden Place Aberdeen, AB10 1UP UNITED KINGDOM Tel: +44 1224 433466
Los Angeles (US) Pareto Securities Inc 9465 Wilshire Blvd, Suite 300 Beverly Hills, CA 90212 USA Tel: +1 424 284 4000
Calgary (Canada) Pareto Securities AS, Calgary Branch Suite 2600, 144 – 4 Avenue SW Calgary AB T2P 3N4 CANADA Tel: +1 403 398 2177
Paris (France) Pareto Securities AS, Paris Branch 11 BD Jean Mermoz 92200 Neuilly Sur Seine FRANCE Tel: +33 141921234