Offsets in Defense Trade in Defense... · The official U.S. government policy on offsets in defense...
21
Offsets in Defense Trade Prepared by U.S. Department of Commerce [The following material is extracted from the seventh annual report (July 2003) on offsets in defense trade prepared pursuant to Section 309 of the Defense Production Act of 1950 1 (DPA), as amended. This report covers offset agreements and offset transactions entered into from 1993 through 2000. Some of the footnotes and tables have been omitted from this excerpt; however, the footnote and table numbers remain the same as in the original document. The complete report is available at the following web site: http://www .bax.doc.gov/DefenseIndustrialBasePrograms/ OSIES/of fsets/7thOf fsetsReport.htm . ] Executive Summary The Department of Commerce’s Bureau of Industry and Security (BIS), 2 has been delegated responsibility for preparing the reports required under Section 309. This report is prepared after analyzing offset data reported to the Department of Commerce by U.S. defense firms, in compliance with regulations established under Section 309 of the DPA. To assess the impact of offsets in defense trade, the Department of Commerce obtained data from U.S. defense firms involved in defense offsets. 1993-2000 Offset Activity Total offset activity during 1993 to 2000 can be measured by the number and value of new offset agreements entered into between U.S. defense contractors and foreign governments, and the number and value of individual offset transactions carried out in fulfillment of offset agreements during the eight-year reporting period. Offset Agreements, 2000 U.S. defense contractors reported entering into twenty-five new offset agreements with ten different countries in 2000. The new offset agreements had a total value of $5.1 billion, and accounted for 89.7 percent of total U.S. defense export contract values ($5.7 billion). In comparison with the previous seven years, offset agreements as a percentage of total defense export contract sales were highest in 2000. In 2000, European nations received offsets equal to 116 percent of the total export values, the highest offset percentage on record for any single year of the eight-year reporting period. For non- European nations, the offset percentage was 50 percent in 2000. Offset Agreements, 1993-2000 U.S. companies reported entering into 345 offset agreements with thirty-two countries during the time period from 1993 to 2000. U.S. companies reported export sales of 177 different defense systems or subsystems with a total value of $48.6 billion. Offset agreements related to those export contracts were valued at $29.8 billion, or 61 percent of the export contract value. Sales of aerospace defense systems (i.e., aircraft, engines, and missiles) were valued at $42.8 billion and accounted for nearly 90 percent of the total export contracts. On a regional basis, Europe accounted for only 47 percent of total U.S. defense export contracts, while new offset agreements with Europe accounted for more than 70 percent of total offset agreements (by value). Asia and the Middle East each accounted for 14 percent of new offset agreements, and the Americas accounted for two percent. Non-European countries accounted for approximately one-third of new offset agreements (by value) but 53 percent of the The DISAM Journal, Summer 2004 33 _______________________________________ 1 Codified at 50 U.S.C. app.§ 2099 (2000). 2 On April 18, 2002, the Bureau of Export Administration changed its name to the Bureau of Industry and Security.
Transcript of Offsets in Defense Trade in Defense... · The official U.S. government policy on offsets in defense...

Offsets in Defense Trade Prepared by U.S. Department of Commerce
[The following material is extracted from the seventh annual report (July 2003) on offsets indefense trade prepared pursuant to Section 309 of the Defense Production Act of 19501 (DPA), asamended. This report covers offset agreements and offset transactions entered into from 1993through 2000. Some of the footnotes and tables have been omitted from this excerpt; however,the footnote and table numbers remain the same as in the original document. The complete reportis available at the following web site: http://www.bax.doc.gov/DefenseIndustrialBasePrograms/OSIES/offsets/7thOffsetsReport.htm. ]
Executive Summary
The Department of Commerce’s Bureau of Industry and Security (BIS),2 has been delegatedresponsibility for preparing the reports required under Section 309. This report is prepared afteranalyzing offset data reported to the Department of Commerce by U.S. defense firms, incompliance with regulations established under Section 309 of the DPA. To assess the impact ofoffsets in defense trade, the Department of Commerce obtained data from U.S. defense firmsinvolved in defense offsets.
1993-2000 Offset Activity
Total offset activity during 1993 to 2000 can be measured by the number and value of newoffset agreements entered into between U.S. defense contractors and foreign governments, andthe number and value of individual offset transactions carried out in fulfillment of offsetagreements during the eight-year reporting period.
Offset Agreements, 2000
U.S. defense contractors reported entering into twenty-five new offset agreements with tendifferent countries in 2000. The new offset agreements had a total value of $5.1 billion, andaccounted for 89.7 percent of total U.S. defense export contract values ($5.7 billion). Incomparison with the previous seven years, offset agreements as a percentage of total defenseexport contract sales were highest in 2000.
In 2000, European nations received offsets equal to 116 percent of the total export values, thehighest offset percentage on record for any single year of the eight-year reporting period. For non-European nations, the offset percentage was 50 percent in 2000.
Offset Agreements, 1993-2000
U.S. companies reported entering into 345 offset agreements with thirty-two countries duringthe time period from 1993 to 2000. U.S. companies reported export sales of 177 different defensesystems or subsystems with a total value of $48.6 billion. Offset agreements related to thoseexport contracts were valued at $29.8 billion, or 61 percent of the export contract value. Sales ofaerospace defense systems (i.e., aircraft, engines, and missiles) were valued at $42.8 billion andaccounted for nearly 90 percent of the total export contracts.
On a regional basis, Europe accounted for only 47 percent of total U.S. defense exportcontracts, while new offset agreements with Europe accounted for more than 70 percent of totaloffset agreements (by value). Asia and the Middle East each accounted for 14 percent of newoffset agreements, and the Americas accounted for two percent. Non-European countriesaccounted for approximately one-third of new offset agreements (by value) but 53 percent of the
The DISAM Journal, Summer 200433
_______________________________________1 Codified at 50 U.S.C. app.§ 2099 (2000).2 On April 18, 2002, the Bureau of Export Administration changed its name to the Bureau of Industry and Security.
total value of defense export contracts. While the non-European nations had higher defenseexport contract totals, Europe had a much greater offset impact on U.S. industry because of thehigher offset percentages required by European purchasers.
Offset Transactions, 2000
U.S. companies reported offset transactions with a total actual value of $1.7 billion – downeight percent from the 1999 total of $1.8 billion, and the lowest total actual transaction valuereported in any of the eight years. A decrease in offset transactions in 2000 was anticipatedbecause of a drop in defense sales and offset agreements in previous years. However, increasinglevels of defense sales (and higher related offset percentages) in 2000 likely will lead to more newoffset agreements and, thus, an increase in offset transactions in the future.
Offset Transactions, 1993-2000
During the reporting period, U.S. companies reported 4,425 offset transactions executed inthirty-five countries. These offset transactions were related to 227 defense systems under existingoffset agreements. The actual value of the offset transactions from 1993 to 2000 was just under$18 billion.
Conclusions
The defense environment changed in the 1990s, reflecting both the general retrenchment ofmilitary expenditures and tougher offset policies and enforcement worldwide. In recent years,offsets have become more important in winning procurements and, ultimately, in access toforeign markets by U.S. companies. Offset agreements with values exceeding 100 percent of thetotal export contract value are occurring regularly; in fact, 100 percent seems to be the baseline.
From the U.S. perspective, Europe is clearly the central focus of offset activity, dominatingboth new offset agreements and the number of offset transactions with U.S. companies. Because90 percent of offset agreements are aerospace-related, concerns about the competitiveness of U.S.aerospace prime contractors and the aerospace infrastructure have increased.
Using data submitted by industry and data from the Bureau of the Census, BIS estimatesoffsets maintained 41,666 work-years annually in the U.S. defense industry between 1993 and2000. However, the data reported by U.S. companies also show that offsets displaced 9,688 work-years annually in the lower-tier companies that are suppliers or subcontractors to large U.S.defense companies.
The U.S. aerospace trade surplus fell from its all-time high of $40 billion in 1998 toapproximately $27 billion in 2000. Imports of aerospace products have increased rapidly in thelast decade for a number of reasons, including offsets. Offset agreements calling for aerospacesubcontracting arrangements lead to increased imports, to the extent that they result in U.S. primecontractors importing subcontracted parts and systems rather than relying on domestic sources.Aerospace-related imports have increased regardless of the state of the market and despite the factthat the United States spends more on aerospace research and development than any other nation.
In the coming year, using authorities granted under the DPA, the Department of Commerce iscommitted to work with U.S. industry, the Department of Defense and other agencies, and foreigngovernments to analyze the impact of offsets on all parties. The Department of Commerce doesnot encourage or regulate the use of offsets in defense trade, and recognizes that offsets aremarket distorting. However, we also recognize that offsets are a part of the current internationaldefense trade environment. We will seek ways to mitigate the negative effect of offsets oncompetition. Our goal is to support the U.S. defense industry and to ensure a robust and vibrantindustrial base at all levels.
The DISAM Journal, Summer 2004 34

Background
Legislation and Regulations
In 1984, the Congress enacted amendments to the DPA, which included the addition ofSection 309 addressing offsets in defense trade.3 Section 309 of the Defense Production Act(DPA) required the President to submit an annual report on the impact of offsets on the U.S.defense industrial base to the Congress’s then-Committee on Banking, Finance, and UrbanAffairs of the House of Representatives4 and the Committee on Banking, Housing, and UrbanAffairs of the Senate.
Initially, the Office of Management and Budget coordinated the interagency process ofpreparing the report for the Congress. Other agencies involved in the process included theDepartments of Commerce, Defense, Labor, State, and Treasury, and the Office of the
U.S. Trade Representative
In 1992, Section 309 of the DPA was amended, and the Secretary of Commerce was given theresponsibility of preparing the report for the Congress, on the President’s behalf, and was directedto function as the President’s Executive Agent for carrying out responsibilities under Section 309of the DPA.5
Under section 309, the Secretary of Commerce is authorized to develop and administer theregulations necessary to collect offsets data from U.S. defense exporters. The Secretary ofCommerce delegated this authority to the Bureau of Industry and Security, which published itsfirst offsets regulations in the Federal Registerin 1994.6
The 1992 amendments to Section 309 of the DPA made other changes to the offset datacollection process. The amendments lowered the offset agreement reporting threshold from $50million to $5 million for U.S. firms entering into foreign defense sales contracts subject to offsetagreements. Under the regulations, firms report all offset transactions for which they receiveoffset credits of $250,000 or more. Every year, U.S. companies report offset agreement andtransaction data for the previous calendar year to BIS. The data elements collected each year fromindustry are listed in Section 701.4 of the Department’s offset regulations.
The Official U.S. Government Policy
The official U.S. government policy on offsets in defense trade was developed by aninteragency offset team. The policy was announced by the President in April 1990, in a statementissued by the White House Press Secretary.7 In 1992, it was set forth as a Policy of Congress asfollows:
• In General
Recognizing that certain offsets for military exports are economically inefficient andmarket distorting, and mindful of the need to minimize the adverse effects of offsets in military
The DISAM Journal, Summer 200435
_______________________________________________3 See Pub. L. 98-265, April 17, 1984 , 98 Stat. 149. 4 Section 309 of the Defense Production Actwas amended in 2001 to change the name of the House committee tothe “Committee on Financial Services of the House of Representatives.” The annual report must be provided to theCommittee on Banking, Finance, and Urban Affairs of the Senate as well. See 50 U.S.C. app. § 2099(a)(1).
5 See Pub. L. 102-558, Oct. 28, 1992 , 106 Stat. 4198; see also Part IV of Executive Order No. 12919, 59 FederalRegulation 29525(June 3, 1994).
6 See 59 Federal Regulation 61796, December 2, 1994 , codified at 15 C.F.R. § 701.7 Congress incorporated this policy statement into law with the Defense Production Act Amendments of 1992(Pub.L. 102-558, Title I, Part C, § 123, 106 Stat. 4198).
exports while ensuring that the ability of United States firms to compete for military export salesis not undermined, it is the policy of the Congress that:
•• No agency of the United States government shall encourage, enter directlyinto, or commit United States firms to any offset arrangement in connection with the sale ofdefense goods or services to foreign governments;
•• United States government funds shall not be used to finance offsets in securityassistance transactions, except in accordance with policies and procedures that were in existenceon March 1, 1992;
•• Nothing in this section shall prevent agencies of the United States governmentfrom fulfilling obligations incurred through international agreements entered into before March1, 1992; and
•• The decision whether to engage in offsets, and the responsibility fornegotiating and implementing offset arrangements, reside with the companies involved.
• Presidential Approval of Exceptions
It is the policy of the Congress that the President may approve an exception to thepolicy stated in subsection (a) after receiving the recommendation of the National SecurityCouncil.
• Consultation
It is the policy of the Congress that the President shall designate the Secretary ofDefense to lead, in coordination with the Secretary of State, an interagency team to consult withforeign nations on limiting the adverse effects of offsets in defense procurement. The Presidentshall transmit an annual report on the results of these consultations to the Congress as part of thereport required under section 309(a) of the DPA.
In 1999, the offset policy was supplemented by provisions contained in the DefenseOffsets Disclosure Act of 1999.8 Congress made the following findings:
• A fair business environment is necessary to advance international trade, economicstability, and development worldwide, is beneficial for American workers and businesses, and isin the United States national interest.
• In some cases, mandated offset requirements can cause economic distortions ininternational defense trade and undermine fairness and competitiveness, and may cause particularharm to small- and medium-sized businesses.
• The use of offsets may lead to increasing dependence on foreign suppliers for theproduction of United States weapons systems.
• The offset demands required by some purchasing countries, including some closeallies of the United States, equal or exceed the value of the base contract they are intended tooffset, mitigating much of the potential economic benefit of the exports.
• Offset demands often unduly distort the prices of defense contracts.
• In some cases, United States contractors are required to provide indirect offsets whichcan negatively impact nondefense industrial sectors.
The DISAM Journal, Summer 2004 36
_______________________________________________8 See Pub. L. No. 106-113, Div. B, § 1000(a)(7) 113 Stat. 1536, 1510A-500 to 1501A-505 (1999) (enacting into lawSubtitle D of Title XII of Division B of H.R. 3427 (113 Stat. 1501A-500) as introduced on November 17, 1999)(found at 50 U.S.C. Appx. § 2099, History; Ancillary Laws and Directives).

• Unilateral efforts by the United States to prohibit offsets may be impractical in thecurrent era of globalization and would severely hinder the competitiveness of the United Statesdefense industry in the global market.
The Defense Offsets Disclosure Act of 1999continues with the following declaration ofpolicy:
It is the policy of the United States to monitor the use of offsets in internationaldefense trade, to promote fairness in such trade, and to ensure that foreignparticipation in the production of United States weapons systems does not harm theeconomy of the United States.
Offsets Terminology
There are several basic terms used in discussions of offsets in defense trade.
• Offsets
Compensation practices required as a condition of purchase in either government-to-government or commercial sales of defense articles and/or defense services as defined by theArms Export Control Act(22 U.S.C. §2751, et seq.) and the International Traffic in ArmsRegulations(22 C.F.R. § 120-130).
• Direct Offsets
Contractual arrangements that involve defense articles and services referenced in thesales agreement for military exports. These transactions are directly related to the defense itemsor services exported by the defense firm and are usually in the form of co-production,subcontracting, technology transfer, training, production, licensed production, or financingactivities.
• Indirect Offsets
Contractual arrangements that involve defense goods and services unrelated to theexports referenced in the sales agreement. These transactions are not directly related to thedefense items or services exported by the defense firm. The kinds of offsets that are consideredindirect include purchases, investment, training, financing activities, marketing/exportingassistance, and technology transfer.
• Co-production
Overseas production based upon government-to-government agreement that permits aforeign government or producer(s) to acquire the technical information to manufacture all or partof a U.S. origin defense article. Co-production includes government-to-government licensedproduction, but excludes licensed production based upon direct commercial arrangements by U.S.manufacturers.
• Licensed Production
Overseas production of a U.S.-origin defense article based upon transfer of technicalinformation under direct commercial arrangements between a U.S. manufacturer and a foreigngovernment or producer.
• Subcontractor Production
Overseas production of a part or component of a U.S.-origin defense article. Thesubcontract does not necessarily involve license of technical information and is usually a directcommercial arrangement between the defense prime contractor and a foreign producer.
The DISAM Journal, Summer 200437

• Overseas Investment
Investment arising from an offset agreement, often taking the form of capitaldedicated to establishing or expanding a subsidiary or joint venture in the foreign country.
• Technology Transfer
Transfer of technology that occurs as a result of an offset agreement and that may takethe form of research and development conducted abroad, technical assistance provided to thesubsidiary or joint venture of overseas investment, or other activities under direct commercialarrangement between the defense prime contractor and a foreign entity.
Countries and Regions
For ease of analysis, and in some cases to protect company confidentiality, countries andcountry groups actively requiring offsets in connection with purchases of U.S. defense systemsduring the 1993-2000 period were divided into four geographic regions:
• Europe,
• The Middle East and Africa,
• North and South America, and;
• Asia.
The countries found in each region are listed in Table 1-1.Table 1-1 Purchasing Countries and Groups Requiring Offsets Agreements, by Region
Europe Middle East and AfricaAustria EgyptBelgium IsraelCzech Republic KuwaitDenmark Saudi ArabiaEPG - The European Participating Group South Africa
(Belgium, The Netherlands, Norway) United Arab EmiratesTurkeyFinland North and South AmericaFrance BrazilGermany CanadaGreeceItaly AsiaLuxembourg AustraliaNorth Atlantic Treaty Organization IndonesiaThe Netherlands MalaysiaNorway New ZealandPortugal SingaporeSlovenia South KoreaSpain TaiwanSweden ThailandSwitzerlandUnited Kingdom
Source: U.S. Department of Commerce/BIS Offsets Database
The DISAM Journal, Summer 2004 38

Statistical Overview
Each year BIS gropples with classifying transactions correctly. In some cases, companies donot provide enough information to BIS so that it may correctly categorize the transactions. Theresult is a growing category called miscellaneous, which is now the fourth largest category ofoffsets after technology transfer.
Miscellaneous offsets include marketing assistance, various studies, administrative costs,such as office expenses and travel, grants of various kinds, and many other incidentals, all valuedat $1.6 billion. Further review indicated marketing assistance includes brokering and advertising,although the specific action is not always clear. Brokering means a foreign purchase by a firmother than the exporter and would normally be classified as a purchase (indirect offset). A studycould be reclassified as technology transfer, although both the exporter and the foreign entity maybenefit. BIS will continue to try to resolve these ambiguities for next year’s report.
A summary of offsets activity for 1993 through 2000 is provided in Table 2-1.
Table 2-1General Summary of Offsets Activity
(in $ millions)Offset Agreements
Export Offset Percent DefenseYear Value Value Offset Companies Agreements Countries Systems
1993 $13,957.0 $4,806.7 34.44% 18 30 17 271994 $4,792.4 $2,048.7 42.75% 18 49 20 381995 $7,402.0 $6,034.1 81.52% 19 45 18 331996 $2,987.8 $2,270.7 76.00% 15 50 19 321997 $5,822.8 $3,831.8 65.81% 13 57 19 421998 $3,257.8 $1,846.6 56.68% 11 44 17 341999 $4,681.4 $3,851.4 82.27% 10 45 11 362000 $5,653.1 $5,072.6 89.73% 7 25 12 18Total $48,554.3 $29,762.7 61.30% 37 345 32 177
Offset TransactionsActual Credit Defense
Year Value Value Multiplier Companies Transactions Countries Systems
1993 $1,815.1 $2,162.1 1.191 24 440 27 601994 $1,891.1 $2,161.5 1.143 21 550 26 571995 $2,713.7 $3,390.8 1.250 20 670 27 691996 $2,731.5 $3,098.9 1.135 21 623 26 721997 $2,725.5 $3,276.2 1.202 18 577 26 591998 $2,364.8 $2,684.6 1.135 19 582 30 651999 $2,080.4 $2,824.1 1.358 13 512 25 632000 $1,671.5 $1,942.0 1.162 13 471 24 60Total $17,993.5 $21,540.3 1.197 40 4425 35 226
Source: BIS Offsets Database
Types of Offset Transactions
Table 2-2 shows offset transactions by type of offset, as well as the percentage distribution ofeach type of offset for each year from 1993 to 2000. Table 2-2 also shows the total actual andcredit values of the offset transactions for each year. The percentage difference between the actual
The DISAM Journal, Summer 200439
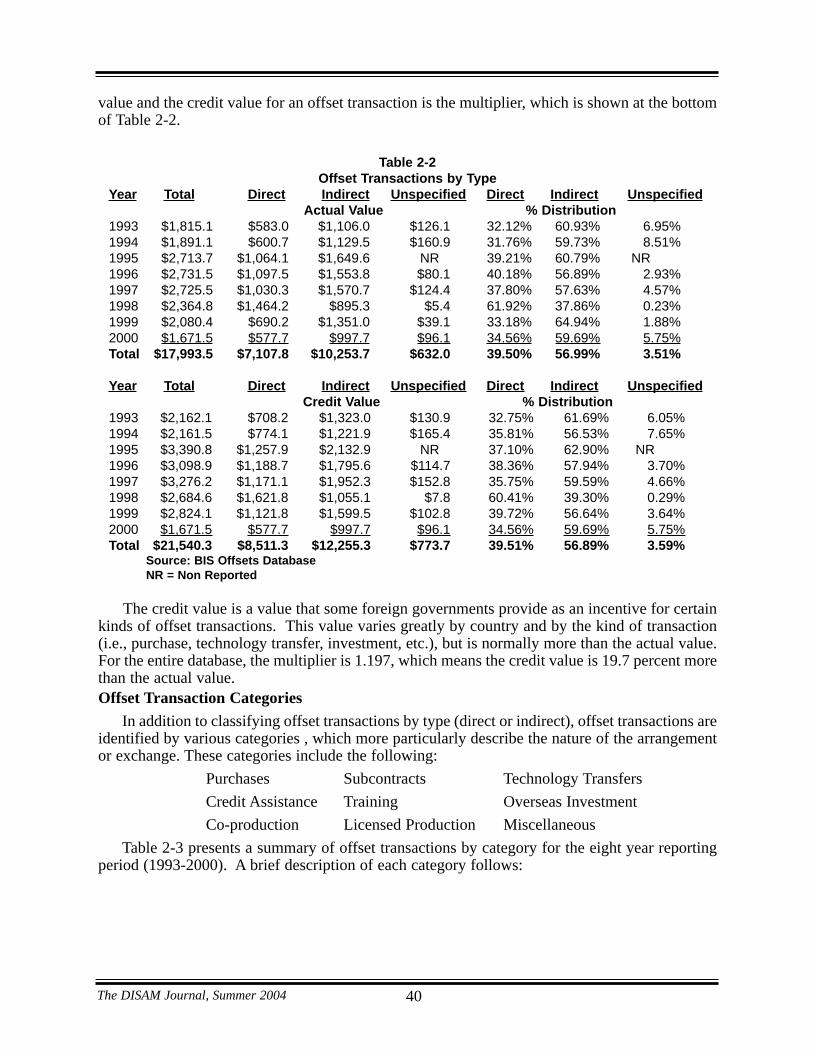
value and the credit value for an offset transaction is the multiplier, which is shown at the bottomof Table 2-2.
Table 2-2Offset Transactions by Type
Year Total Direct Indirect Unspecified Direct Indirect UnspecifiedActual Value % Distribution
1993 $1,815.1 $583.0 $1,106.0 $126.1 32.12% 60.93% 6.95%1994 $1,891.1 $600.7 $1,129.5 $160.9 31.76% 59.73% 8.51%1995 $2,713.7 $1,064.1 $1,649.6 NR 39.21% 60.79% NR1996 $2,731.5 $1,097.5 $1,553.8 $80.1 40.18% 56.89% 2.93%1997 $2,725.5 $1,030.3 $1,570.7 $124.4 37.80% 57.63% 4.57%1998 $2,364.8 $1,464.2 $895.3 $5.4 61.92% 37.86% 0.23%1999 $2,080.4 $690.2 $1,351.0 $39.1 33.18% 64.94% 1.88%2000 $1,671.5 $577.7 $997.7 $96.1 34.56% 59.69% 5.75%Total $17,993.5 $7,107.8 $10,253.7 $632.0 39.50% 56.99% 3.51%
Year Total Direct Indirect Unspecified Direct Indirect UnspecifiedCredit Value % Distribution
1993 $2,162.1 $708.2 $1,323.0 $130.9 32.75% 61.69% 6.05%1994 $2,161.5 $774.1 $1,221.9 $165.4 35.81% 56.53% 7.65%1995 $3,390.8 $1,257.9 $2,132.9 NR 37.10% 62.90% NR1996 $3,098.9 $1,188.7 $1,795.6 $114.7 38.36% 57.94% 3.70%1997 $3,276.2 $1,171.1 $1,952.3 $152.8 35.75% 59.59% 4.66%1998 $2,684.6 $1,621.8 $1,055.1 $7.8 60.41% 39.30% 0.29%1999 $2,824.1 $1,121.8 $1,599.5 $102.8 39.72% 56.64% 3.64%2000 $1,671.5 $577.7 $997.7 $96.1 34.56% 59.69% 5.75%Total $21,540.3 $8,511.3 $12,255.3 $773.7 39.51% 56.89% 3.59%
Source: BIS Offsets DatabaseNR = Non Reported
The credit value is a value that some foreign governments provide as an incentive for certainkinds of offset transactions. This value varies greatly by country and by the kind of transaction(i.e., purchase, technology transfer, investment, etc.), but is normally more than the actual value.For the entire database, the multiplier is 1.197, which means the credit value is 19.7 percent morethan the actual value.Offset Transaction Categories
In addition to classifying offset transactions by type (direct or indirect), offset transactions areidentified by various categories , which more particularly describe the nature of the arrangementor exchange. These categories include the following:
Purchases Subcontracts Technology Transfers
Credit Assistance Training Overseas Investment
Co-production Licensed Production Miscellaneous
Table 2-3 presents a summary of offset transactions by category for the eight year reportingperiod (1993-2000). A brief description of each category follows:
The DISAM Journal, Summer 2004 40
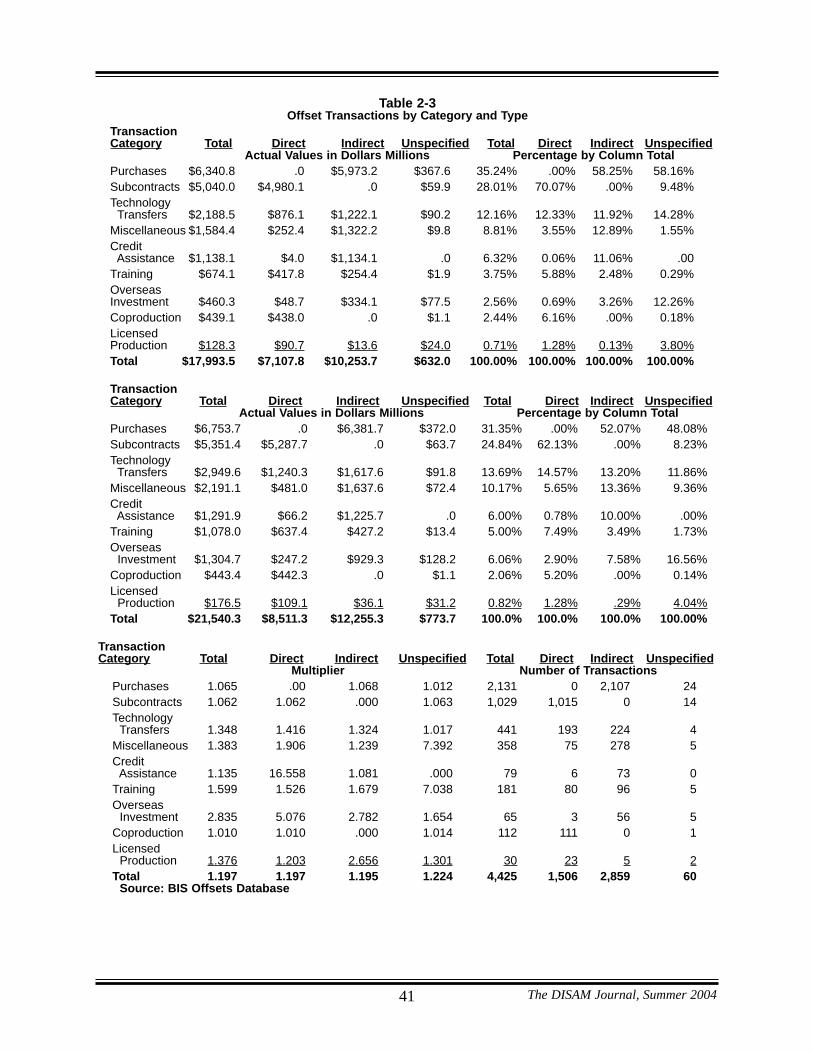
Table 2-3Offset Transactions by Category and Type
TransactionCategory Total Direct Indirect Unspecified Total Direct Indirect Unspecified
Actual Values in Dollars Millions Percentage by Column TotalPurchases $6,340.8 .0 $5,973.2 $367.6 35.24% .00% 58.25% 58.16%Subcontracts $5,040.0 $4,980.1 .0 $59.9 28.01% 70.07% .00% 9.48%Technology
Transfers $2,188.5 $876.1 $1,222.1 $90.2 12.16% 12.33% 11.92% 14.28%Miscellaneous $1,584.4 $252.4 $1,322.2 $9.8 8.81% 3.55% 12.89% 1.55%Credit
Assistance $1,138.1 $4.0 $1,134.1 .0 6.32% 0.06% 11.06% .00Training $674.1 $417.8 $254.4 $1.9 3.75% 5.88% 2.48% 0.29%OverseasInvestment $460.3 $48.7 $334.1 $77.5 2.56% 0.69% 3.26% 12.26%Coproduction $439.1 $438.0 .0 $1.1 2.44% 6.16% .00% 0.18%LicensedProduction $128.3 $90.7 $13.6 $24.0 0.71% 1.28% 0.13% 3.80%Total $17,993.5 $7,107.8 $10,253.7 $632.0 100.00% 100.00% 100.00% 100.00%
TransactionCategory Total Direct Indirect Unspecified Total Direct Indirect Unspecified
Actual Values in Dollars Millions Percentage by Column TotalPurchases $6,753.7 .0 $6,381.7 $372.0 31.35% .00% 52.07% 48.08%Subcontracts $5,351.4 $5,287.7 .0 $63.7 24.84% 62.13% .00% 8.23%Technology
Transfers $2,949.6 $1,240.3 $1,617.6 $91.8 13.69% 14.57% 13.20% 11.86%Miscellaneous $2,191.1 $481.0 $1,637.6 $72.4 10.17% 5.65% 13.36% 9.36%Credit
Assistance $1,291.9 $66.2 $1,225.7 .0 6.00% 0.78% 10.00% .00%Training $1,078.0 $637.4 $427.2 $13.4 5.00% 7.49% 3.49% 1.73%Overseas
Investment $1,304.7 $247.2 $929.3 $128.2 6.06% 2.90% 7.58% 16.56%Coproduction $443.4 $442.3 .0 $1.1 2.06% 5.20% .00% 0.14%Licensed
Production $176.5 $109.1 $36.1 $31.2 0.82% 1.28% .29% 4.04%Total $21,540.3 $8,511.3 $12,255.3 $773.7 100.0% 100.0% 100.0% 100.00%
TransactionCategory Total Direct Indirect Unspecified Total Direct Indirect Unspecified
Multiplier Number of TransactionsPurchases 1.065 .00 1.068 1.012 2,131 0 2,107 24Subcontracts 1.062 1.062 .000 1.063 1,029 1,015 0 14Technology
Transfers 1.348 1.416 1.324 1.017 441 193 224 4Miscellaneous 1.383 1.906 1.239 7.392 358 75 278 5Credit
Assistance 1.135 16.558 1.081 .000 79 6 73 0Training 1.599 1.526 1.679 7.038 181 80 96 5Overseas
Investment 2.835 5.076 2.782 1.654 65 3 56 5Coproduction 1.010 1.010 .000 1.014 112 111 0 1Licensed
Production 1.376 1.203 2.656 1.301 30 23 5 2Total 1.197 1.197 1.195 1.224 4,425 1,506 2,859 60
Source: BIS Offsets Database
The DISAM Journal, Summer 200441
Purchases result in overseas production of goods or services usually for export to the UnitedStates. Purchases are always classified as indirect offsets to distinguish them from subcontractsbecause the purchases are of items unrelated to the exported defense system. During the timeperiod from 1993 to 2000, purchases represented 35.2 percent of the value of all offsettransactions. Purchases had a low multiplier of 1.065. The U.S. exporter does not always makethe purchase. They can also involve brokering and marketing assistance that result in purchasesby a third party.
Subcontracts result in overseas production of goods or services for use in the production oroperation of a U.S. exported defense system subject to an offset agreement. Subcontracts arealways classified as direct offsets. They are typically a contractual arrangement between the U.S.prime contractor and a foreign producer. During the reporting period, subcontracts represented 28percent of the value of all offset transactions, and 70 percent of the value of all direct offsets. Likepurchases, subcontracts had a low multiplier 1.062.
Technology transfer includes research and development conducted abroad, exchangeprograms for personnel, data exchanges, integration of machinery and equipment into arecipient’s production facility, technical assistance, education and training, manufacturing know-how, and licensing and patent sharing. Technology transfer, as used here, is normallyaccomplished under a commercial arrangement between the U.S. prime contractor and a foreigncompany. A major subcontractor may also accomplish the technology transfer on behalf of theU.S. prime contractor. During the reporting period, 40 percent of technology transfers wereclassified as direct offsets and 60 percent were classified as indirect offsets. Altogether,technology transfers accounted for approximately 12 percent of the value of all offsettransactions. The multiplier for technology transfers was 1.348.
Credit assistance includes direct loans, brokered loans, loan guarantees, assistance inachieving favorable payment terms, credit extensions, and lower interest rates. Approximately 6.3percent of the value of total offset transactions during the period from 1993 to 2000 (or $1.14billion) were characterized as credit assistance. Credit assistance is nearly always classified as anindirect offset transaction. (Only $4 million of the credit assistance transactions were classifiedas direct offsets during the reporting period). The multiplier for credit assistance was 1.135.
Training relates to the production, maintenance, or actual use of the exported defense systemor a component thereof. Training may be required in areas such as computers, foreign languageskills, engineering capabilities, or management. This category can be classified as either direct orindirect offset transactions, although more than 60 percent of the value of training during thereporting period was classified as a direct offset transaction. Training accounts for only 3.75percent of the total value of offset transactions. The multiplier for training was 1.599.
Overseas investments arising from offset agreements have the highest aggregate multiplier(2.834) of any category of offset transactions, indicating the desire of foreign governments togarner foreign investment. However, overseas investments account for only 2.7 percent of thevalue of all offset transactions, which may reflect its undesirability to U.S. prime contractors. Itis also interesting to note that 43 of the 64 overseas investment transactions reported for 1993through 2000 received no extra credit at all (i.e., had a multiplier of 1 or less). OverseasInvestments sometimes took the form of capital invested to establish or expand a subsidiary orjoint venture in the foreign country, but investments in third-party facilities also were reported(and such investments received the highest multiplier). Overseas investments usually wereclassified as indirect offsets; only 10 percent of overseas investment transactions were classifiedas direct.
The DISAM Journal, Summer 2004 42

Co-production is overseas production based upon a government-to-government agreementthat permits a foreign government or producer to acquire the technical information tomanufacture all or part of a U.S.-origin defense system. Co-production is always classified as adirect offset. It includes government-to-government licensed production, but excludes licensedproduction based upon direct commercial arrangements by U.S. manufacturers. All co-productionreported for 1993 to 2000 was for component parts or equipment used in larger defense systems,and virtually all co-production reported during this period was aerospace-related. During thereporting period, co-production accounted for 2.4 percent of the value of offset transactions andhad a multiplier of only 1.010 the lowest among all offset transaction categories.
Past co-production transactions have involved duplicating major production facilities inforeign countries (at the expense of the foreign government) for the assembly of entire defensesystems, such as aircraft. Co-production arrangements of this kind generally impose the highestcost penalty on the foreign government of any category: after co-producing the items directlyrelated to the defense system purchased, the production facilities can sit idle for lack of contractsto fulfill. Some countries pressure prime contractors for assembly contracts related to future salesto third countries.
Licensed production is overseas production of a U.S.-origin defense article. Licensedproduction differs from co-production in that it is based on direct commercial arrangementsbetween a U.S. manufacturer and a foreign entity as opposed to a government-to-governmentagreement. In addition, licensed production virtually always involves a part or component for adefense system, rather than a complete defense system. Licensed production is the smallestamong the offset categories, accounting for only 0.7 percent of the total value of offsettransactions. The multiplier for licensed production was 1.376.
Countries and Regions
For ease of analysis, and in some cases to protect company confidentiality, countries activelyrequiring offsets in connection with defense export sales during the 1993-2000 period werecategorized into four geographic regions: Europe, North and South America, the Middle East andAfrica, and Asia. The countries found in each region, together with the aggregate percentageoffsets required and the multiplier for each country, are shown in Table 2-5.
The DISAM Journal, Summer 200443

Table 2-5Countries with Offset Agreements and Transactions By Region
Country Percent Offsets MultiplierEurope
Austria W 1.000Belgium W 1.002Czech Republic W WDenmark 100.0% 1.114Finland W 1.071France W 1.722Germany 100.0% 1.000Greece 111.4% 2.129Italy 98.5% 1.000Luxembourg NR WNetherlands 124.1% 1.280Norway 99.7% 1.363Portugal 27.9% 2.186Slovenia W NRSpain 91.6% 1.273Sweden 103.9% 1.141Switzerland 77.9% 1.008United Kingdom 90.0% 1.007Regional total 92.3% 1.156
Middle East and AfricaEgypt NR WIsrael 50.8% 1.037Kuwait 30.3% WSaudi Arabia 34.9% 1.000South Africa W NRTurkey 58.8% 1.086United Arab Emirates 55.3% 2.333Region Total 44.0% 1.139
AsiaAustralia 35.1% 1.045Indonesia NR 1.213Malaysia 37.3% 1.118New Zealand W WSingapore W 2.352South Korea 40.8% 1.412Taiwan 20.6% 2.306Thailand 24.9% WRegion Total 26.2% 1.499
North and South AmericaBrazil W WCanada 89.7% 1.010Region total 90.8% 1.013
Notes NR = Non ReportedW = Withheld to Protect Company Proprietary Information.
Source: BIS Offsets Database
The DISAM Journal, Summer 2004 44

Impact of Offsets on the U.S. Defense Industrial Base
Defense Preparedness
Offsets enhance the defense preparedness of the United States in several ways. Exports andthe revenue generated by export sales are crucial to producers of U.S. defense systems and, byextension, to U.S. foreign policy and economic interests; almost all purchasers of U.S. defensesystems require offset agreements as a condition of the sale. Exports of major defense systemshelp defray high overhead costs for the U.S. producer and help maintain production facilities andexpertise, should they be needed to respond to a national emergency. Exports also provideadditional business to many U.S. subcontractors and lower-tier suppliers, promoteinteroperability of weapon systems between the United States and allied countries, and addpositively to U.S. international account balances. An offset package, particularly one with a highproportion of subcontracting or purchases, can undo or reduce many of these benefits.
However, offsets also can have negative effects on the nation’s defense preparedness and thebroader U.S. economy. Viewed in isolation, offsets often reduce spending in the United States andincrease spending and investment in foreign countries. U.S. subcontractors displaced throughdirect offsets by foreign suppliers are among the groups most directly affected by offsets. Suchdirect offsets create foreign competitors for U.S. industry and run the risk of increasing theproliferation of technology to third countries. Moreover, with indirect offsets outpacing directoffsets 60 to 40 percent, the defense industrial base may not bear the full impact of offsets.
Employment
Offsets also affect employment levels in the defense sector. Although it is difficult to preciselydetermine the impact of offset agreements and transactions on employment in the U.S. defensesector, BIS has developed a reliable estimate by using employment data collected by the Bureauof the Census. Given that sales of aerospace weapon systems account for nearly 90 percent of thevalue of defense exports connected with offset agreements, this method appears to provide areliable estimate.
For the period from1993 to 2000, industry reported approximately $48.6 billion in defenseexport contracts with an offset agreement attached. According to the Annual Survey ofManufactures,9 the value added per employee for the aerospace product and parts manufacturingindustry in 2000 was $145,802. Dividing this figure into the defense export sales total results ina total of 333,329 work-years that were supported over the eight-year period by defense exportsassociated with offset agreements, or approximately 41,666 work-years annually.
However, by their very nature, subcontracting and purchasing offset transactions are mostlikely to shift sales from U.S. suppliers to overseas firms. Other categories of offset transactions,in the short or long run, can shift sales from U.S. suppliers as well. To be conservative, BIS basesits estimate of employment impacts only on subcontracting and purchasing transactions. Between1993 and 2000, subcontracting transactions were valued at $5 billion and purchasing transactionswere valued at $6.3 billion, for a total of $11.3 billion for the period, or an average of $1.41billion per year in displaced sales. Dividing $1.41 billion by $145,802 (the value added by eachworker in the aerospace industry in 2000) results in the loss of approximately 77,502 work-yearsover the eight-year period, or 9,688 work-years annually. Based on these calculations, it appearsthat offset agreements and transactions had a net positive effect on employment in the defensesector during the period from 1993 to 2000.
The DISAM Journal, Summer 200445
_______________________________________________9 See the U.S. Census Bureau website at http://www.census.gov/prod/www/abs/industry.html.

Offset Agreements Activity 1993-2000
Overview
From 1993 to 2000, 37 U.S. firms reported entering into 345 offset agreements with a totalvalue of $29.8 billion. These offset agreements were made with foreign purchasers in 32 differentcountries and were associated with defense export contracts valued at $48.6 billion. The exportsinvolved 177 U.S. weapon systems. The value of the offset agreements represented 61.3 percentof the total value of the related export contracts during the entire reporting period.10 The averageterm for completing the offset agreements was 111 months, or slightly more than nine years.11
The percentage of offset agreements to export contracts (by value) reached a new high in 2000 of89.7 percent, eclipsing the previous high of 82.3 from 1999. The lowest percentage was recordedin 1993 at 34.4 percent.
The annual values of defense export contracts and offset agreements (including offsetpercentages) are presented in Chart 4-1. In a sharp upward trend, the value of the offsetagreements as a percentage of the value of defense export contracts increased an average ofapproximately six percent per year over the eight-year reporting period.12
The DISAM Journal, Summer 2004 46
_______________________________________________10 The figure of 61.3 percent is weighted to the annual values of export contracts and agreements. An unweightedaverage can be calculated by averaging the annual percentages of offsets. The unweighted result was 66.1 percent. 11 A weighted average was calculated based on the value and term of each offset agreement. 12 The percent increase was calculated using a linear least-squares function of only the annual percent values.
$16
$14
$12
$10
$8
$6
$4
$2
$0
100%
90%
80%
70%
60%
50%
40%
30%
20%
10%
0%
34.4%
42.7%
76.0%81.5%
65.8%
56.7%
82.3%
89.7%
$4.8
$14.0
$4.8
$2.0
$7.4
$6.0
$3.0$2.3
$5.8
$3.8$3.3
$1.8
$4.7$3.9
$5.7
$3.1
1993 1994 1995 1996 1997 1998 1999 2000
Export Contracts Offset Agreements Percent Offsets
Source: BIS Offsets Database
$Billions PercentOffsets
Percent Offsets(right scale)
Chart 4 - 1 Reported Export Contracts and Offset Agreements Annually, 1993-2000 (in $ billions)

Offsets Concentration
The data reported by U.S. companies show that a small number of companies, countries, andweapon systems dominated offset agreements during the reporting period. The top five U.S.companies (of thirty-seven companies reporting data on offsets) accounted for 80.5 percent of thedefense export contracts and 81.4 percent of the offset agreements during the reporting period.This high level of market concentration reflects the high costs of modern defense systems and thesmall number of firms that produce them. Due to the complexity and expense involved, only alarge, multi-disciplined company could produce and deliver modern defense systems. In addition,each exporter company coordinated the activities of hundreds, if not thousands, of subcontractorsand suppliers that contributed to the systems production, as well as the work of thousands ofemployees.
Offsets also appear to be concentrated in a few purchaser countries. The top five countries (ofa total of 32 involved in the reported offset activity) accounted for 58.4 percent of the totaldefense system purchases and 55.6 percent of the total offset agreements. The top 10 countriesrepresented 78.7 percent of defense system purchases and 79.2 percent of the offset agreements.The fact that relatively few countries accounted for the bulk of offset activity indicates thatrelatively few countries were in the market for big-ticket defense equipment. Most countriescannot afford these systems. By dominating offset activity, these few countries also dominatedthe impact offsets have on the U.S. defense industrial base. In addition, these countries set avisible standard for offset demands for other countries to imitate.
The data reported by U.S. companies also show that specific defense systems were in highdemand overseas. The top five weapon systems (of the 177 weapon systems sold) were allaircraft. These exports accounted for 45.6 percent of the value of all export contracts and 39.2percent of the offset agreements during the reporting period. The top 10 defense systemsaccounted for 61.5 percent of the export contracts and 59.4 percent of the offset agreementsduring the reporting period. These data show once again that big-ticket items such as aircraftconstituted the bulk of offset activity.
Regional Distributions
European countries dominated offset activity during the reporting period. Europe aloneaccounted for more than 70 percent of offset agreements during the reporting period, while at thesame time accounting for less than 50 percent of the value of U.S. defense export contracts. Asiancountries ranked a distant second in both categories, accounting for only 14 percent of offsetagreements and 33 percent of related U.S. export contract values. Middle Eastern and Africancountries also had significant shares, accounting for nearly 14 percent of offset agreements and19 percent of U.S. export contract business. Countries in North and South America ( Canada andBrazil) were less significant, accounting for approximately one percent of the value of both offsetagreements and related U.S. defense export contracts. Chart 4-2 shows regional totals of U.S.defense export contracts and offset agreements for 1993 to 2000.
Are Offset Demands Increasing?
The data appear to show that offset demands are not only increasing, but more countriesoutside of Europe are demanding greater offsets. One reason for this is that the supply of defensesystems greatly exceeds the demand for such items. In the last decade, shrinking worldwidedefense expenditures and the overcrowding in the defense supplier sector have forced defenseindustries in many nations to consolidate. Overcapacity still plagues the defense sector, includingin the United States, as governments have been slow to retrench.
The DISAM Journal, Summer 200447

However, as sales opportunities narrowed, competition for such sales became more intense.Because one element of competitiveness is the offset package, U.S. suppliers are forced to offergreater offsets to win sales. In addition, foreign purchasing governments are under pressure tosustain their indigenous defense companies and, accordingly, are demanding more offsets. Higherthan normal overhead related to low levels of capacity utilization in defense industries coupledwith competitive pressures on prices have also squeezed corporate profits. While the need toexport has grown stronger, so has the exporters’ willingness to meet foreign purchasers’ offsetdemands.
In recent years, the world economy has been sluggish, with historically higher unemploymentin the last decade notably in Europe and Japan. These conditions drained national treasuries and,therefore, significant public outlays for foreign-made weapon systems become are controversial,which leads to higher offset demands to deflect political pressure.
In addition, many countries now have formalized their offset requirements by establishing aminimum percentage for offsets at which to begin negotiations. In these situations, competingfirms must design a winning offset package based on the desirability of the defense system, theirability to deliver offsets, and past offset performances. Many U.S. defense systems, such asaircraft and missiles, have an edge in the international market because of their superiorperformance capabilities. This alone may make U.S. exports the first choice of the foreignpurchasing government and may actually help keep offsets at or near a minimum. However, theactual content of the offset package often is very desirable and helps close the deal. By this logic,less desirable weapon systems would pay an offset premium, thereby driving up offsets and
The DISAM Journal, Summer 2004 48
Europe
Asia
Mid-East/Africa
N. and S. America
$0 $5 $10 $15 $20 $25
Offset Agreements
Export Contracts
Source: BIS Offsets Database
Chart 4 - 2Regional Totals of Export Contracts and Offset Agreements
1993-2000 (in $ billions)

further enhancing the foreign government’s bargaining position with respect to all potentialsellers.
Offset demand in Eastern European countries is another factor leading to a rise in overalloffset percentages. Poland’s announced intention to purchase a fighter aircraft with a requirementof offsets of up to 200 percent of the value of the contract underscores a desire on the part ofCentral and Eastern European countries to use offsets as a policy tool for economic development.While this percentage is high, developmental offsets (i.e., those calling for direct investment,credit assistance, and technology transfer) usually warrant higher multiplies, which soften the realimpact of offsets on the U.S. defense industrial base. Nonetheless, it appears offset demands inCentral and Eastern Europe will be high in the future.
In conclusion, Western Europe may be nearing a ceiling in offset demands, which moderatesthe degree offsets can be increased. The rest of the world has plenty of room to grow and hasshown signs of demanding more offsets. With Western European producers providing morecompetition to U.S. firms in the future, offsets are almost certain to increase in other regions ofthe world.
Aerospace Offset Issues
Offsets affect the U.S. aerospace industry more than any other major economic sector. Theseoffsets have been documented in detail in previous offset reports.18 Since aerospace-relatedexports made up the majority of export sales and related offset agreements reported, the impactof offsets on the aerospace industry is a good indicator of the effect of offsets on the industrialcompetitiveness and trade of the United States as a whole.
Imports of aerospace products into the United States have increased rapidly in the last decadefor a variety of reasons, one of which is the increase in aerospace-related offsets. Aerospace-related imports have increased in both strong and weak economies and despite the fact that theUnited States spends more on defense and commercial aerospace research and development thanany other nation. As shown in Chart 6-1, aerospace imports increased from $12.2 billion in 1993to $28 billion, an all time high in 2000. Aerospace exports dropped from an all time high of $64.1billion in 1998 to $54.7 billion in 2000.
The U.S. aerospace trade surplus reached an all time high of $40 billion in 1998, but thendeclined to approximately $27 billion in 2000. In the same two-year cycle, aerospace importsgrew by nearly 21 percent.19
Importance of Export Markets
To highlight the importance of the export market for U.S. aerospace companies, more thanhalf of the unit sales of newly built military aircraft were exported during the eight-year reportingperiod of 1993 to 2000. Table 6-1 compares aircraft acquired by the U.S. Department of Defensefor use by the armed services with military aircraft exports. During the eight year reportingperiod, Defense Department acquisitions exceeded exports in only one year 1994. In 1997,military aircraft exports were more than double U.S. acquisitions. Overall, during the reportingperiod, military exports were nearly 57 percent of total unit sales.
The DISAM Journal, Summer 200449
_______________________________________________18 See e.g., “ U.S. Department of Commerce Report,” Offsets in Defense Trade, October 1999, pages 35-55.
19 See Aerospace Industries Association publication, Aerospace Facts and Figures, 2001/2002 (and prior editions)

Table 6-1Importance of Defense Aircraft Exports(Number of Newly Constructed Aircraft)
Export asTotal Military Aircraft Acquisition Military Aircraft Exports Percent of
Year Total U.S. Defense Total FMS Direct Total1993 955 437 518 146 372 54.2%1994 764 418 346 69 277 45.3%1995 811 354 457 108 349 56.4%1996 558 242 316 106 210 56.6%1997 488 151 337 181 156 69.1%1998 418 149 269 175 94 64.4%1999 359 133 226 114 112 63.0%2000 333 138 195 42 153 58.6%Totals 4,686 2,022 2,664 941 1,723 56.9%
Note: FMS = Foreign Military Sales.Direct = Direct Exports by U.S. Defense Firms.
Source: Aerospace Industries Association, Aerospace Facts and Figures, various issues.
Tr ends in Aerospace
The aerospace infrastructure is becoming more global. Although the United States continuesto maintain its position in first-tier integrator companies, global sourcing at the second and lowertiers is rising rapidly as an acceptable option, more so in the commercial area than in the military.In the last decade, some of the advantages of local sourcing, such as cost reductions in
The DISAM Journal, Summer 2004 50
$70
$60
$50
$40
$30
$20
$10
$01993 1994 1995 1996 1997 1998 1999 2000
Exports Imports
$Billions
Chart 6-1International Trade in Aircraft, Aircraft Engines, and Parts
1993-2000 (in $ billions)

communications and transportation, have faded. In addition, many important aerospacetechnologies are available worldwide. Many European firms are technically comparable andsome superior to U.S. firms in the production of various critical components, includinggearboxes, ball screws, bearings, fasteners, forgings, investment castings, aluminum, dieselengines, machine tools, ejection seats, and steel. Other important trends in the U.S. aerospaceindustry are as follows:
• The U.S. aerospace industry which occupies a major industrial and strategic positionin the U.S. economy is not a growth sector. The constant dollar value of aerospace productionactually declined 18 percent relative to the Gross Domestic Product and 14 percent relative to allU.S. manufacturing from 1993 to 2000.
• U.S. prime contractors are becoming more specialized in the research, design,integration, and final assembly of aircraft. More work and responsibility is being shifted to majorsub-assemblers, who have their own set of suppliers. The competition among major sub-assemblers, who provide major sub-components such as gas turbine engines, electrical systems,hydraulics, and cockpits, is fierce and leading to more global sourcing outside of the UnitedStates.
• U.S. aerospace parts and components suppliers showed virtually no growth inproductivity over the last 15 years. This is likely a result of declining sales, under-utilizedcapacity, antiquated defense procurement processes, and pricing pressures from overseascompetitors, as well as pressure from customers.
• Most new aerospace business is outside the United States. For the next 5-10 years,approximately two-thirds of the commercial aerospace market is forecast to be outside the UnitedStates . This will almost certainly lead to greater foreign sourcing and will pressure lower-tierU.S. suppliers to consider selling internationally.
• Foreign ownership of U.S. aerospace part and component suppliers continues toincrease. Foreign ownership usually leads to more imports initially, at least until the foreignowner becomes established in the United States.
Aerospace Offsets
The following points highlight the effects of offsets on the aerospace industry during the 1993to 2000 reporting period:
• The U.S. aerospace industry represents the major target of offset activity. Aerospacesystem export contracts totaled $42.8 billion (89 percent of all exports related to offsets) andaccounted for $25.9 billion of the offset agreements (87 percent of the agreement total).
• Transactions involving aerospace products and services totaled (at least) $11.27billion, or 62.6 percent of the value of all transactions for the eight-year reporting period. (Inaddition, 10-15 percent of the transactions classified as unspecified may also be aerospace items.)
• Approximately 58 percent ($6.53 billion) of the aerospace transactions were classifiedas direct offset transactions; 37 percent ($4.15 billion) were indirect; and five percent ($586million) were unspecified. Also, 42 percent ($4.75 billion) of the offset transactions werecategorized as subcontracts; 26 percent ($2.95 billion) as purchases; and 14 percent ($1.56billion) as technology transfers. These three categories combined accounted for 82 percent of thetotal value of aerospace-related offset transactions.
• Aerospace parts trade has expanded rapidly and the U.S. aerospace industry maintainsa surplus in parts trade. Imports of parts and components for aircraft and aircraft engines into theUnited States more than doubled, from $5.8 billion in 1993 to $11.8 billion in 2000. This includes
The DISAM Journal, Summer 200451

both civilian and military items. Exports of parts and components also grew, from $13.8 to $23.7billion an expansion of 72 percent during the reporting period.
• Offsets impacted both military and commercial aerospace markets. Aerospacesubcontractor companies normally supply both military and commercial parts.
• Offsets played a significant role in the increase of aircraft and engine parts imports.Military part and component imports rose 82 percent from $2.23 in 1993 to $4.1 billion in 2000.The eight-year total was $25.4 billion. Over the same period, aerospace subcontracts (directoffsets) totaled $4.75 billion (i.e., 18.7 percent of the total military parts imports).
• An additional $2.95 billion of aerospace offsets were purchases (indirect offsets).Adding purchases and subcontracts together, the resulting figure of $7.69 billion represents 10.75percent of total part and component imports of $71.5 billion (civilian $46.1 billion and military$25.4 billion) for the period.20
• Offsets may permanently displace U.S. companies in certain circumstances. It is afallacy to think of offsets as one-time events that end once an offset agreement is completed. Aforeign offset recipient can continue selling product in the United States long after the initialoffset transactions are completed. In addition, technology transfers, training, credit assistance,and other offset transactions can bolster the capabilities of foreign vendors and contribute toimports as well, but to an extent that is not yet known. In sum, it appears that the total impact ofaerospace offsets is greater than the nominal value of the offsets.
Foreign vendors also can use offsets to gain entry into the U.S. market to supplement marketsin their home countries. This expands their sales base and helps them compete, potentiallydisplacing American suppliers in both commercial and military markets.
Defense downsizing increased the average age of military aircraft in the U.S. fleet. Thisshifted subcontractor work toward replacement and repair parts. Offset agreements associatedwith the purchase of off-the-shelf aircraft provide an opportunity for foreign vendors to supplyparts and components (direct offsets) for aircraft destined for the host country, and an additionalopportunity to compete in the existing U.S. (and foreign) replacement markets (indirect offsets).
Conclusions
The defense world changed in the 1990s, reflecting both retrenchment of militaryexpenditures and tougher offset policies and enforcement by governments worldwide. Offsetshave risen to a more prominent status in determining competitions and ultimately access toforeign markets. Offset agreements exceeding 100 percent are occurring with increasingfrequency and, in one case, exceeded 300 percent. From the U.S. perspective, Europe is clearlythe central focus of offset activity, dominating both offset agreements and offset transactions withU.S. companies. Because 90 percent of offset agreements are aerospace-related, concerns aboutU.S. prime contractors and the aerospace infrastructure have increased.
BIS estimates that during the period, offsets maintained an average of 41,666 jobs per year indefense system exporting industries but cost 9,688 jobs per year in the lower-tier supplier base.Based on these conservative calculations, offset agreements and transactions had a net positiveeffect on employment.
The DISAM Journal, Summer 2004 52
_______________________________________________20 The $2.95 billion in indirect offsets includes military and civilian applications, although the split is not known.If treated as all civilian, the ratio to total civilian imports is still only about 6 percent. This implies that the majorityof civilian imports are manufactured by competitive foreign firms, many of whom may have benefited from offsetsin the past.

The U.S. aerospace trade surplus fell from its all time high of $40 billion in 1998 to about $27billion in 2000. Imports of aerospace products have increased rapidly in the last decade for anumber of reasons, including offsets. Aerospace-related imports have increased in both up anddown market cycles despite the fact that the United States spends more on aerospace research anddevelopment than any other nation a factor that should make U.S. products very competitive inworld markets.
In this report, Commerce has not identified any specific recommendations for remedial actionconcerning offsets in defense trade. No other government agency has offered alternative findingsand recommendations. However, in the coming year, using authorities granted under the DPA,Commerce is committed to work with U.S. industry, the Department of Defense and otheragencies, and foreign governments to analyze the impact of offsets on all parties and to seek waysto mitigate their effect on competition. Our goal is to support the U.S. defense industry and toensure a robust and vibrant industrial base.
The DISAM Journal, Summer 200453