Official web site of the U.S. Health Resources & Services ...
60
- - - --- --- --- ====== - -=._-_- = ------- --- ==--=== -- --- .=::: -===- ------ -- ===== ---=- -=== - --- --- --- -- -- --- COUNCIL ON GRADUATE MEDICAL EDUCATION Second Report • The Financial Status of Teaching Hospitals • The U nd_errepresentation of Minorities in Medicine DEPARTMENT OF HEALTH AND HUMAN SERVICES Public Health Service Health Resources and Services Administration
Transcript of Official web site of the U.S. Health Resources & Services ...

- -- --- ------====== - -=._-_- = ------- ---==--=== -- --- .=::: -===- ------ --===== ---=- -===
----------
-------
COUNCIL ON GRADUATE MEDICAL EDUCATION
Second Report •
The Financial Status of Teaching Hospitals
• The U nd_errepresentation of Minorities in Medicine
DEPARTMENT OF HEALTH AND HUMAN SERVICES Public Health Service
Health Resources and Services Administration

HEAL TH RESOURCES AND SERVICES ADMl_NISTRATION
"HRSA-Helping Build A Healthier Nation"
The Health Resources and Services Administration has leadership responsibility in the U.S. Public Health Service for health service and resource issues. HRSA pursues its objectives by: • Supporting states and communities in deliver
ing health care to underserved residents, mothers and children and other groups;
• Participating in the campaign against AIDS; • Serving as a focal point for federal organ trans
plant activities; • Providing leadership in improving health profes
sions training; • Tracking the supply of health professionals and
monitoring their competence through operation of a nationwide data bank on malpractice claims and· sanctions; and
• Monitoring developments affecting health facilities, especially those in rural areas.

COUNCIL ON GRADUATE MEDICAL EDUCATION
Second Report •
The Financial Status of Teaching Hospitals
• The Underrepresentation of Minorities in Medicine
DHHS Publication No. (HRS-P-DM) 90-1
DEPARTMENT OF HEALTH AND HUMAN SERVICES Public Health Service
I-Iealth Resources and Services Administration Bureau of Health Professions
Division of Medicine

The views expressed in this document are solely those of the Council on Graduate Medical Education and do not
necessarily represent the views of the Health Resources and Services Administration
or the U.S. Government
. ':;
'I

DEPARTMENT OF HEALTH & HUMAN SERVICES
August 1, 1990
The Honorable Louis W. Sullivan, M.D. Secretary of Health and Human Services Washington, D.C. 20201
Dear Mr. Secretary:
Public Health Service
Health Resources and Services Administration
Rockville MD 20857
I am pleased to transmit to you the second report of the Council on Graduate Medical Education (COGME) in accordance with Part H, Section 799 of Title VII of the Public Health Service Act as amended by Public Law 99-272. This report contains 12 reconmendations on issues related to (1) the financial status of teaching hospitals; and (2) the widerrepresentation of minorities in medicine.
The Council decided to undertake an indepth review of the financial status of teaching hospitals because of an increasing amount of anecdotal evidence that certain teaching hospitals are experiencing financial difficulty. The Council believes that teaching hospital financial problems have the potential to affect the quality and operations of graduate medical education (GME) programs and the number of GME programs available to train future physicians.
The ·second critical issue dealt with in this report is the Wlderrepresentation in medicine of many of the Nation's minorities. This topic was also dealt with in the First Report of the Council but we feel it is important enough to warrant re-emphasis. Even as the proportion of minorities in the general population is increasing, their proportion among physicians in practice, research, and medical education remains well below that of the general population. This results in a dual deficiency for society: minorities are Wlderserved in part because of shortages of minority physicians; and the participation of minorities in medical careers is well below the national average.
Since its inception, the CoWlcil has received excellent staff assistance and support from the Health Resources and Services Administration of the Public Health Service. As stated in its First Report, COGME members believe that the deliberations leading to the Second Report continue to be hampered by data and resource limitations under which the Council has operated. Accordingly, the Council continues to believe that "annual authorization and appropriation levels of $1.5 million should be provided to COGME to assure that adequate resources are available to support its analytic agenda and meet its necessary staff and meeting expenses." We sincerely hope that this reconmendation will be given favorable consideration.
On behalf of the Council, I want to thank you for providing us with the opportunity to date to participate in the deliberations on the issues surrounding tmdergraduate and graduate medical education and to offer our recorrmendations to the Department of Health and Human Services and to the Congress. We hope that this report and subsequent Cotmcil reports will provide the guidance you need in addressing these National issues and concerns.
Respectfully submitted,
N~a.v'~ Neal A. Vanselow, M.D. Chairperson Cotmcil on Graduate Medical Education

DEPARTMENT OF HEALTH & HUMAN SERVICES
August 1, 1990
The Bonarable Edward M. Kennedy Chairman, Conrnittee on Labor and Human Resources Un!ted States Senate Washington, D.C. 20510
Dear Mr. Chairman:
Public Health Service
Health Resources and Services Administration
Rockville MD 20857
I am pleased to transmit to you the second report of the Council on Graduate Medical Education (COGME) in accordance with Part H, Section 799 of Title VII of the Public Health Service Act as amended by Public Law 99-272. This report contains 12 recoonendations on issues related to (1) the financial status of teaching hospitals; and (2) the underrepresentation of minorities in medicine.
The Council decided to undertake an indepth review of the financial status of teaching hospitals because of an increasing amount of anecdotal evidence that certain teaching hospitals are experiencing financial difficulty. The Council believes that teaching hospital financial problems have the potential to affect the quality and operations of graduate medical education (GME) programs and the number of GME programs available to train future physicians.
The second critical issue dealt with in this report is the underrepresentation in medicine of many of the Nation's minorities. This topic was .also dealt with in the First Report of the Council but we feel it is important enough to warrant re-emphasis. Even as the proportion of minorities in the general population is increasing, their proportion among physicians in practice, research, and medical education remains well below that of the general population. This results in a dual deficiency for society: minorities are underserved in part because of shortages of minority physicians; and the participation of minorities in medical careers is well below the national average.
Since its inception, the Council has received excellent staff assistance and support from the Health Resources and Services Administration of the Public Health Service. As stated in its First Report, COGME members believe that the deliberations leading to the Second Report continue to be hampered by data and resource limitations under which the Council has operated. Accordingly, the Council continues to believe that 11annual authorization and appropriation levels of $1.5 million should be provided to COGME to assure that adequate resources are available to support its analytic agenda and meet its necessary staff and meeting expenses." We sincerely hope that this reconrnendation will be given favorable consideration.
On behalf of the Council, I want to thank you for providing ua with the opportunity to date to participate in the deliberations on the isSues surrounding Wldergraduate and graduate medical education and to offer our reconanendations to the Department of Health and Human Services and to the Congress. We hope that this report and subsequent Council reports will provide the guidance you need in addressing these National issues and concerns.
Respectfully submitted,
~u-ea.i/~ Neal A. Vanselow, M.D. Chairperson Council on Graduate Medical Education

DEPARTMENT OF HEALTH & HUMAN SERVICES
August 1, 1990
The Honorable Orrin G. Batch RaQking Minority Member Comnittee on Labor and Bwoan Resource United States Senate Washington, D.C. 20510
Dear Senator Hatch:
Public Health Service
Health Resources and Services Administration
Rockville MD 20857
I am pleased to transmit to you the second report of the Council on Graduate Medical Education (COGME) in accordance with Part H·, Section 799 of Title VII of the Public Health Service Act as amended by Public Law 99-272. This report contains 12 reconnendations on issues related to (1) the financial status of teaching hospitals; and (2) the underrepresentation of minorities in medicine.
The Council decided to undertake an indepth review of the financial status of teaching hospitals because of an increasing amount of anecdotal evidence that certain teaching hospitals are experiencing financial difficulty. The Council believes that teaching hospital financial problems have the potential to affect the quality and operations of graduate medical education (GME) programs and the number of GME programs available to train future physicians.
The second critical issue dealt with in this report is the underrepresentation in medicine of many of the Nation's minorities. This topic was also dealt with in the First Report of the Council but we feel it is important enough to warrant re-emphasi_s, Even as the proportion of minorities in the general population is increasing, their proportion among physicians in practice, research, and medical education remains well below that of the general population. This results in a dual deficiency for society: minorities are underserved in part because of shortages of minority physicians; and the participation of minorities in medical careers is well below the national average.
Since its inception, the Council has received excellent staff assistance and support from the Health Resources and Services Administration of the Public Health Service. As stated in its First Report, COGME members believe that the deliberations leading to the Second Report continue to be hampered by data and resource limitations under which the Council has operated. Accordingly, the Council continues to believe that "annual authorization and appropriation levels of $1.5 million should be provided to COGME to assure that adequate resources are available to support its analytic agenda and meet its necessary staff and meeting expenses." We sincerely hope that this recomnendation will be given favorable consideration.
On behalf of the Council, I want to thank you for providing us with the opportunity to date to participate in the deliberations on the issues surr.ounding tmdergraduate and graduate medical education and to offer our recoDIDendations to the Department of Health and Human Services and to the Congress. We hope that th~s .report and subsequent Co\lllcil reports will provide the guidance you need in addressing these National issues and concerns.
Respectfully submitted,
rJ~e<.J~ Neal A. Vanselow, M.D. Chairperson Council on Graduate Medical Education

DEPARTMENT OF HEALTH & HUMAN SERVICES Public Health Service
August 1,.1990
The Honorable Lloyd M. Bentsen Chtirman, Co11D1ittee on Finance United States Senate Washington, D.C. 20510
Dear Mr. Chairman:
Health Resources and Services Administration
Rockville MD 20857
I am pleased to transmit to you the second report of the Council on Graduate Medical Education (COGME) in accordance with Part H, Section 799 of Title VII of the Public Health Service Act as amended by Public Law 99-272. This report contains 12 reconnendations on issues related to (1) the financial status of teaching hospitals; and (2) the widerrepresentation of minorities in medicine.
The Council decided to \Uldertake an indepth review of the financial status of teaching hospitals because of an increasing amount of anecdotal evidence that certain teaching hospitals are experiencing financial difficulty. The Cowicil believes that teaching hospital financial problems have the potential to affect the quality and operations of graduate medical education (GME) programs and the number of GME programs available to train future physicians.
The second critical issue dealt with in this report is the underrepresentation in medicine of many of th_e Nation's minorities. This topic was also dealt with in the First Report of the Cowicil but we feel it is important enough to warrant re-emphasis. Even as the proportion of minorities in the general population is increasing, their proportion among physicians in practice, research, and medical education remains well below that of the general population. This results in a dual deficiency for society: minorities are widerserved in part beca,use of shortages of minority physicians; and the participation of minorities in medical careers is well below the national average.
Since its inception, the Council has received excellent staff assistance and support from the Health Resou_rces and Services Administration of the Public Health Service. As state_d in its First Report, COGME members believe that the deliberations leading to the Second Report continue ~o 1 be hampered by data and resource limita.tions under which the Council has operated. Accordingly, the Council continues to believe that "annual ,, authorization and appropriation levels of $1.5 million should be · provided to COGME to assure that adequate resources are available to support its analytic agenda and meet its necessary staff and meeting expenses." We sincerely hope that this recoD1Dendation will be given favorable consideration.
On behalf of the Cowicil, I want to thank you for providing us with the opportwiity to date to participate in the deliberations on the issues surrounding wtdergraduate and gradua~e medical education and to offer our recolIIDendations to the Department of Health and Hwnan Services an_d to the Congress. We hope that this report and Subsequent COwtcil reports will provide the guidance y~u ne~d in addressing these Natiqnal issues and concerns. - ·
Respectfully submitted,
fliuJ(,(.v~ Neal A. Vanselow, M.D. Chairperson CoWlcil on Graduate Medical Education

DEPARTMENT OF HEALTH & HUMAN SERVICES Public Health Service
August 1, 1990
The Honorable Bob Packwood ~king Minority Member COD1Dittee on Finance United States Senate Washington, D.C. 20510
Dear Senator Packwood:
Health Resources and Services Administration
Rockville MD 20857
I am pleased to transmit to you the second report of the Council on Graduate Medical Education (COGME) in accordance with Part H, Section 799 of Title VII of the Public Health Service Act as amended by Public Law 99-272. This report contains 12 recoDJ:Dendations on issues related to (1) the financial status of teaching hospitals; and (2) the underrepresentation of minorities in medicine.
The Council decided to undertake an indepth review of the financial status of teaching hospitals because of an increasing amount of anecdotal evidence that certain teaching hospitals are experiencing financial difficulty. The Council believes that teaching hospital financial problems have the potential to affect the quality and operations of graduate medical education (GME) programs and the number of GME programs available to train future physicians.
The second critical issue dealt with in this report is the underrepresentation in medicine of many of the Nation's minorities. This topic was also dealt with in the First Report of the Council but we feel it is important enough to warrant re-emphasis. Even as the proportion of minorities in the general population is increasingt their proportion among physicians in practice, research, and medical education remains well below that of the general population. This results in a dual deficiency for society: minorities are underserved in part because of shortages of minority physicians; and the participation of minorities in medical careers is well below the national average.
Since its inception, the Council has received excellent staff assistance and support from the Health Resources and Services Administration of the Public Health Service. As stated in its First Report, COGME members believe that the deliberations leading to the Second Report continue to be hampered by data and resource limitations under which the Council has operated. AccordinSly, the Council continues to believe that "annual authorization and appropriation levels of $1.5 million should be provided to COGME to assure that adequate resources are available to support its analytic agenda and meet its necessary staff and meeting expenses .. " We sincerely hope that this recorrmendation will be given f'vorable consideration.
On behalf of the Co1D1cil, I want to thank you for providing U8 with the opport1D1ity to date to participate in the deliberations on the issues surrounding undergraduate and graduate medical education and to offer our. reconnendations to the Department of Health and Hwnan Services and to the Congress. We hope that this report and subsequent Council reports will provide the guidance you need in addressing these National issues and concerns.
Respectfully submitted,
Nwa.J~ Neal A. Vanselow, M.D. Chairperson Council on Graduate Medical Education

DEPARTMENT OF HEALTH &. HUMAN SERVICES
August 1, 1990
The Honorable John D. Dingell Choirman, Conrnittee on Energy and Co111Derce Bouse of Representatives Washington, D.C. 20201
Dear Mr. Chairman:
Public Heahh Service
Health Resources and Services Administration
Rockville MD 20857
I am pleased to transmit to you the second report of the Council on Graduate Medical Education (COGME) in accordance with Part H, Section 799 of Title VII of the Public Health Service Act as amended by Public Law 99-272. This report contains 12 recOlllDendations on issues related to (l)·the financial status of teaching hospitals; and (2) the underrepresentation of minorities in medicine.
The Council decided to undertake an indepth review of the financial status of teaching hospitals because of an increasing amount of anecdotal evidence that certain teaching hospitals are experiencing financial difficulty. The Council believes that teaching hospital financial problems have the potential to affect the quality and operations of graduate medical education (GME) programs and the number of GM:E programs available to train future physicians.
The second critical issue dealt with in this report is the underrepresentation in medicine of many of the Nation's minorities. This topic was also dealt with in the First Report of the Council but we feel it is important enough to warrant re-emphasis. Even as the proportion of minorities in the general population is increasing, their proportion among physicians in practice, research, and medical education remains well below that of the general population. This results in a dual deficiency for society: minorities are underserved in part because of shortages of minority physicians; and the participation of minorities in medical careers is well below the national average.
Since its inception, the Council has received excellent staff assistance and support from the Health Resources and Services Administration of the Public ·Health Service. As stated in its First Report, COGME members believe that the deliberations leading to the Second Report continue to be hampered by data and resource limitations under which the Council has operated. Accordingly, the Council continues to believe that "annual authorization and appropriation levels of $1.S million should be provided to COGME to assure that adequate resources are available to support its analytic agenda and meet its necessary staff and meeting expenses." We sincerely hope that this recott'fllendation will be given favorable consideration.
On behalf of the Council, I want to thank you for providing wi with the opportunity to date to participate in the deliberations on the issues surroWlding undergraduate and graduate medical education and to offer our recomnendations to the Department of Health and Human Services and to the Congress. We hope that this report and subsequent Council reports will provide the guidance you need in addressing these National issues and concerns.
Respectfully submitted,
N«£a.. J~ Neal A. Vanselow, M.D. Chairperson Council on Graduate Medical Education

DEPARTMENT OF HEALTH & HUMAN SERVICES Public Health Service
August 1, 1990
The Honorable Norman F. Lent Ran~ing Minority Member Coamittee on Energy and Cotmierce Rouse of Representatives Washington, D.C. 20201
Dear Mr. Lent:
Health Resources and Services Administration
Rockville MD 20857
I am pleased to transmit to you the second report of the Council on Graduate Medical Education (COGME) in accordance with Part H, Section 799 of Title VII of the Public Health Service Act as amended by Public Law 99-272. This report contains 12 reco111nendations on issues related to (1) the financial status of teaching hospitals; and (2) the Wlderrepresentation of minorities in medicine.
The Council decided to undertake an indepth review of the financial status of teaching hospitals because of an increasing amount of anecdotal evidence that certain teaching hospitals a~e experiencing financial difficulty. The Council believes that teaching hospital financial problems have the potential to affect the quality and operations of graduate medical education (GME) programs and the number of GME programs available to train future physicians.
The second critical issue dealt with in this report is the underrepresentation in medicine of many of the Nation's minorities. This topic was also dealt with in the First Report of the Cowicil but we feel it is important enough to warrant re-emphasis. Even as the proportion of minorities in the general population is increasing, their proportion among physicians in practice, research, and medical education remains well below that of the general population. This results in a dual deficiency for society: minorities are underserved in part because of shortages of minority physicians; and the participation of minorities in medical careers is well below the national average.
Since its inception, the Council has received excellent staff assistance and support from the Health Resources and Services Administration of the Public Health Service. As stated in its First Report, COGME members believe that the deliberations leading to the Second Report continue to be hampered by data and resource limitations under which the Cowicil has operated. Accordingly, the Council continues to believe that "annual authorization and appropriation levels of $1.5 million should be provided to COGME to assure that adequate resources are available to support its analytic agenda and meet its necessary staff and meeting expenses. 11 We sincerely hope that this reconnendation will be given favorable consideration.
On behalf of the Council, I want to thank rou for providing ua with the opportunity to date to participate in the deliberations on the issues Surrounding undergraduate and graduate medical education and to offer our reconm1endations to the Department of Health and Human Services and to the Congress. We hope that this report and subsequent Council reports will provide the guidance you need in addressing these National issues and concerns.
Respectfully submitted,
Nu£a.J~ Neal A. Vanselow, M.D. Chairperson Council on Graduate Medical Education
DEPARTMENT OF HEALTH &. HUMAN SERVICES
August 1, 1990
The Honorable Dan Rostenkowski Cheirman, CoDlnittee on Ways and Means Rouse of Representatives Washington, D.c. 20515
Dear Mr. Chairman:
Public Health Service
Health Resources and Services Administration
Rockville MD 20857
I am pleased to transmit to you the second report of the Council on Graduate,Medical Education (COGME) in accordance with Part H, Section 799 of Title VII of the Public Health Service Act as amended by Public Law 99-272. This report contains 12 reconrnendations on issues related to (1) the financial status of teaching hospitals; and (2) the underrepresentation of minorities in medicine.
The Council decided to undertake an indepth review of the financial status of teaching hospitals because of an increasing amount of anecdotal evidence that certain teaching·hospitals are experiencing financial difficulty. The Council believes that teaching hospital financial problems have the potential to affect the quality and operations of graduate medical education (CME) programs and the number of GME programs available to train future physicians.
The second critical issue dealt with in this report is the underrepresentation in medicine of many of the Nation's minorities. This topic was also dealt with in the First Report of the Council but we feel it is important enough to warrant re-emphasis. Even as the proportion of minorities in the general population is increasing, their proportion among physicians in practice, research, and medical education remains well below that of the general population. This results in a dual deficiency-for society: minorities are underserved in part because of shortages of minority physicians; and the participation of minorities in medical careers is well below the national average.
Since its inception, the Council has received excellent staff assistance and support from the Health Resources and Services Administration of the Public Health Service. As stated in its First Report, COGME members believe that the deliberations leading to the Second Report continue to be hampered by data and resource limitations under which the Council has operated. Accordingly, the Council continues to believe that 0 annual authorization and appropriation levels of $1.5 million should be provided to COGME to assure that adequate resources are available to support its-analytic agenda and meet its necessary staff and meeting expenses." We sincerely hope that this recoDIDendation will be given favorable consideration.
On behalf of the Council, I want to thank you for providing us with, the opportunity to date to participate in the deliberations on the issues surrounding undergraduate and graduate medical education and to offer our recolllllendations to the Department of Health and Human Services and to the· congress. ·we hope that this report and.subsequent Council reports will provide the guidance you need in addressing these National issues and concerns.
Respectfully submitted,
f\fu..tq, J~ Neal A. Vanselow, M.D. Chairperson Council on Graduate Medical Education

DEPARTMENT OF HEALTH & HUMAN SERVICES Public Heahh Service
August 1, 1990
The Honorable John J. Duncan Raoking Minority Member COU1Dittee on Ways and Means Bouse of Representatives Washington, D.C. 20515
Dear Mr. Duncan:
Health Resources and Services Administration
Rockville MD 20857
I am pleased to transmit to you the second report of the Council on Graduate Medical Education (COGME) in accordance with Part Ht Section 799 of Title VII of the Public Health Service Act as amended by Public Law 99-272. This report contains 12 recoDIDendations on issues related to (1) the financial status of teaching hospitals; and (2) the underrepresentation of minorities in medicine.
The Cotmcil decided to Wldertake an indepth review of the financial status of teaching hospitals because of an increasing amount of anecdotal evidence that certain teaching hospitals are experiencing financial difficulty. The Council believes that teaching hospital financial problems have the potential to affect the quality and operations of graduate medical education (GME) programs and the number of GME programs available to train future physicians.
The second critical issue dealt with in this report is the underrepresentation in medicine of many of the Nation's minorities. This topic was also dealt with in the First Report of the Council but we feel it is important enough to warrant re-emphasis. Even as the proportion of minorities in the general population is increasing, their proportion among physicians in practice, research, and medical education remains well below that of the general population. This results in a dual deficiency for society: minorities are underserved in part because of shortages of minority physicians;. and the participation of minorities in medical careers is well below the national average.
Since its inception, the Council has received excellent staff assistance and support from the Health Resources and Services Administration of the Public Health Service. As stated in its First Report, COGME members believe that the deliberations leading to the Second Report continue to be hampered by data and resource limitations under which the Council has operated. Accordingly, the Council continues to believe that "annual authorization and appropriation levels of $1.5 million.should be provided to COGME to assure that adequate resources are available to support its analytic agenda and meet its necessary staff and meeting expenses." We sincerely hope that this recoD1Dendation will be given favorable consideration.
On behalf of the Cotmcil, I want to thank you fo~ providing ua with the opportunity to date to participate in the deliberations on the issues surrounding undergraduate and graduate medical education and to offer our recoDEiendations to the Department of Health and Human Services and to the Congress. We hope that this report and subsequent Council reports will provide the guidance you need in addressing these National issues and concerns.
Respectfully submitted,
Nu£.C£.J~ Neal A. Vanselow, M.D. Chairperson Council on Graduate Medical Education

CHARGE TO THE COUNCIL
Title VII of the Public Health Service Act in Section 799(H), as amended by Public Law 99-272, required that the Council on Graduate Medical Education provide advice and make recommendations to the Secretary and to the Committees on Labor and Human Resources, and on Finance of the Senate and the Committees on Energy and Commerce, and on Ways and Means of the House of Representatives, with respect to:
(A) the supply and distribution of physicians in the United States;
(B) current and future shortages or excesses of physicians in medical and surgical specialties and subspecialties;
( C) issues relating to foreign medical school graduates;
(D) appropriate Federal policies with respect to the matters specified in (A), (B), and (C)· above, including policies conceruing changes in the financing of undergraduate and graduate medical education programs and changes in the types of medical education training in graduate medical education progra111s;
(E) appropriate efforts to be carried out by hospitals, schools of medicine, schools of osteopathy, and accrediting bodies with respect to the matters specified in (A), (B), and (C) above, including efforts for changes in undergraduate and graduate medical education programs; and
(F) deficiencies in, and needs ·for improvements in, existing. data bases concerning the supply and distribution of, and postgraduate training programs for, physicians in the United States and steps that should be taken to eliminate those deficiencies. The Council is to encourage entities providing graduate medical education to conduct activities to voluntarily achieve the recommendations of this Council under paragraph (E) above.

ACKNOWLEDGEMENT
The preparation of this Second Report of the Council on Graduate Medical Education (COGME) was assisted greatly by staff in the Health Resources and Services Administration. Donald L. Weaver, M.D., and subsequently Marilyn H. Gaston, M.D., Directors of the Division of Medicine, Bureau of Health Professions (BHPr), served as Executive Secretary to the Council. Although the Council members accept all responsibility for this report, the following professional staff members of the Division of Medicine were key to the development of this Report: F. Lawrence Clare, M.D., M.P.H.; Ronald L. Craig, M.S.W.; Jerald M. Katzoff; Donald M. Buysse, James M. Cultice, Carol S. Gleich, Ph.D., and Sharley L. Chen. Dona L. Harris, Ph.D., the Council's Scholar-In-Residence, and Idelle P. Smith, M.S.W., M.P.H., made special contributions to the report. Eva M. Stone ably served as the new Committee Management Assistant for the Council. Particular acknowledgement is given to the fine administrative support provided by John Heyob, Sherry S. Whipple, and Betty B. Hambleton. Special acknowledgement is extended to the staff, Office of the Director, Office of Data Analysis and Management, Howard V. Stambler, Director. Excellent secretarial assistance was provided by Penny Sandlin, Susan Sumner, Donna Breslyn, Lisa Flach, and Pat Harkins.
COUNCIL ON GRADUATE MEDICAL EDUCATION MEMBERSHIP
Neal A. Vanselow, M.D., Chairperson David Satcher, M.D., Ph.D., Vice Chairperson
Ms. Dipali V. Apte Medical Scholars Program University of Illinois
College of Medicine Urbana, Illinois
Through 9 /91
Lawrence U. Haspel, D.O. Executive Vice President,
Hospital Operations Chicago College of
Osteopathic Medicine Chicago, Illinois
Through 9 /91
William S. Hoffman, Ph.D. Director UAW Social Security Department Detroit, Michigan
Through 9 /92
Stuart J. Marylander Vice Chairman of the Board NU-Med, Inc. Encino, California
Through 9 /90
Harry L. Metcalf, M.D. President Highgate Medical Group Williamsville, New York
Through 9 /90
James A. Pittman, Jr., M.D. Dean University of Alabama, Birmingham School of Medicine Birmingham, Alabama
Through 9 /90
Pedro Ruiz, M.D. Department of Psychiatry Baylor University College of
Medicine Houston Texas
Through 9 /93
Cecil 0. Samuelson, Jr., M.D. Vice President for Health Sciences University of Utah Salt Lake City, Utah
Through 9 /91
David Satcher, M.D., Ph.D. President Meharry Medical College Nashville, Tennessee
Through 9 /93
Juereta P. Smith, R.N., J.D. Counselor
USAA Colorado Springs, Colorado
Through 9 /92
Margaret T. Stanley, M.HA. Administrator Washington State Health
Care Authority Olympia, Washington
Through 9 /92
Neal A. Vanselow, M.D. Chancellor Tulane University Medical Center New Orleans, Louisiana
Through 9 /91
Charles E. Windsor President and Chief Executive Officer St. Mary's Hospital
East St. Louis, Illinois Through 9 /93
George D. Zuidema, M.D. Vice Provost for Medical Affairs The University of Michigan Ann Arbor, Michigan
Through 9/92

COUNCIL ON GRADUATE.MEDICAL EDUCATION MEMBERSHIP
James 0. Mason, M.D., Dr.P.H. Assistant Secretary for Health Department of Health & Human Services Public Health Service Hubert H. Humphrey Building 200 Independence Avenue, S.W. Washington, D.C. 20201
Gail R. Wilensky, Ph.D. Administrator, Health Care
Financing Administration Department of Health & Human Services Hubert H. Humphrey Building 200 Independence Avenue, S.W. Washington, D.C. 20201
John A. Gronvall, M.D. Chief Medical Director Department of Veterans Affairs 810 Vermont Avenue, N.W. Washington, D.C. 20420
Designee of the Assistant Secretary for Health
Robert G. Harmon, M.D., M.P.H. Administrator Health Resources and Services
Administration Public Health Service Par klawn Building 5600 Fishers Lane Rockville, Maryland 20857
Designee of the Health Care Financing Administration
Robert G. Eaton Associate Administrator for
Program Development Health Care Financing Administration Hubert, H. Humphrey Building 200 Independence Avenue, S.W. Washington, D.C. 20201
Designee of the Department of Veterans Affairs
Peter F. Regan, M.D. Assistant Chief Medical Director
for Academic Affairs Department of Veterans Affairs 810 Vermont Avenue, N.W. Washington, D.C. 20420
Executive Secretary
Marilyn H. Gaston, M.D. Director, Division of Medicine Bureau of Health Professions Health Resources and Services
Administration 5600 Fishers Lane Rockville, Maryland 20857
FORMER MEMBERS THROUGH SEPTEMBER 1989
Rene R. Rodriguez, M.D. President Interamerican College of
Physicians and Surgeons New York, New York.
Michael E. Whitcomb, M.D; Dean University of Washington School ofMedicine Seattle, Washington

COUNCIL ON GRADUATE MEDICAL EDUCATION SUBCOMMITTEES
Neal A. Vanselow, M.D. Chairperson
David Satcher, M.D., Ph.D. Vice-Chairperson
Marilyn H. Gaston, M.D. Executive Secretary
Physician Manpower
George D. Zuidema, M.D., Chairoerson Robert G. Harmon, M.D. (ASH designee) William S. Hoffman, Ph.D. Harry L. Metcalf, M.D. Juereta P. Smith, R.N., J.D. Pedro Ruiz, M.D.
Staff liaison: J er aid Katz off Division of Medicine
Medical Education Programs and Financing
Cecil 0. Samuelson, Jr., M.D., Chairperson Dipali V. Apte Robert G. Eaton (HCFA designee) Lawrence U. Haspel, D.O. Stuart J. Marylander James A. Pittman, Jr., M.D. Peter F. Regan, M.D. (VA designee) Margaret T. Stanley, M.HA. Charles Windsor
Staff liaison: F. Lawrence Clare, M.D., M.P.H. Division of Medicine
Minority Representation in Medicine
David Satcher, M.D., Ph.D., Chairoerson Dipali V. Apte William S. Hoffman, Ph.D. Stuart J. Marylander Harry L. Metcalf, M.D. Pedro Ruiz, M.D. Juereta P. Smith, R.N., J.D.
Staff liaison: Ronald L. Craig, M.S.W. Division of Medicine

TABLE OF CONTENTS
I INTRODUCTION ........................................................ Page 1
OVERVIEW ........................................................ Page 1
PURPOSE .. .. .. .. .. .. .. .. .. .. .. .. .. .. .. .. .. .. .. .. .. .. .. .. .. .. .. .. Page 1
APPROACH ....................................................... Page 1
II SUMMARY OF CONCLUSIONS AND RECOMMENDATIONS ·. . . . . . . . . . . . . . . . . . . . . . . Page 3
FINANCIAL STATUS OF TEACHING HOSPITALS ........................... Page 3
MINORITY UNDERREPRESENTATION IN MEDICINE ........................ Page 5
III FINANCIAL STATUS OF TEACHING HOSPITALS ................................ Page 7
METHODOLOGY ................................................... Page 7
KEY FINDINGS ............................. , ...................... Page 7
CONCLUSIONS AND RECOMMENDATIONS ..•................................ Page 17
RELEVANT ARTICLES AND REPORTS ................................... Page 20
IV UNDERREPRESENTATION OF MINORITIES IN MEDICINE ......................... Page 21
MINORITY APPLICANT POOL ......................................... Page 21
MINORITY INDEBTEDNESS ............................................ Page 24
SHORTAGE OF MINORITY FACULTY IN MEDICAL SCHOOLS ................. Page 30
REFERENCES ..................................................... Page 33
INDIVIDUAL COMMENT BY THE HEALTH RESOURCES AND SERVICES ADMINISTRATION AND THE HEALTH CARE FINANCING ADMINISTRATION ............. Page 37

I. INTRODUCTION
OVERVIEW
The Council on Graduate Medical Education (COGME) is charged by law to provide recommendations concerning the adequacy of the current and future supply and distribution of physicians in the United States; issues relating to foreign medical graduates; appropriate Federal policies with respect to changes in the fmancing of undergraduate and graduate medical education ( GME) programs, and changes in the types of GME programs; appropriate efforts to be carried out by hospitals, schools of medicine, schools of osteopathy, and accrediting bodies with respect to physician supply adequacy and medical education programs; and deficiencies and needs for improvements in data bases concerning physician supply and distribution, and medical education programs in the United States. COGME works by obtaining data and information from expert testimony and contracted analyses, and discussions with experts in the field.
Clinical medical education and GME in the United States are centered in teaching hospitals which serve as a key resource for the nation. They provide leadership in biomedical training and research, access to health care for large minority and underserved populations in nearly all states, complex and intense care frequently not available elsewhere, and leadership in the quality of care provided to the American people. The financial status of teaching hospitals is a key factor in their ability to maintain the quality and thoroughness of training, the adequacy of the supply and distribution of physicians, high quality of care, and access to health care for many citizens who are underserved or in need of the most advanced levels of medical care. In addition, minority health status and adequate access to health care are strongly related to and dependent upon an increased number of minorities in the medical profession. More minority physicians must be trained to assume increased roles in academic medicine, clinical research, and the practice of medicine.
PURPOSE
The Council has become concerned over the last year with two areas pertinent to GME: evidence of a deteriorating financial status for many of the nation's teaching hospitals, and the continuing underrepresentation of minorities in medicine. Although reports leading to concerns about teaching hospital financial status have been sporadic or anecdotal, such difficulties have the potential to affect the quality and operations of GME programs, and the number of GME programs available to train future physicians. Based on data that had been received earlier from the Health Care Financing Administration (HCFA), the Prospective Payment Assessment Commission (ProPAC), the Congressional Budget Office, and others, COGME at its June 1989 meeting decided to engage a contractor to comprehensively analyze existing data on the financial status of teaching hospitals, and to consider issuing a special report on the subject.
The second critical consideration for the Council is the underrepresentation in medicine of many of the nation's minorities. Even as the proportion of minorities in the general population is increasing, their proportion in medicine remains well below that of the general population. This situation will worsen in the near future due to the steady decline in minority applications to medical schools since 1985. This results in a dual deficiency for society: minorities are underserved in part because of shortages of minority physicians, and the participation of minorities in professional careers is well below national averages.
APPROACH
To study the financial status of teaching hospitals, the Bureau of Health Professions (BHPr) and the Health Resources and Services Administration (HRSA) of the Department of Health and Human Services, and the Department of Veterans Affairs (DVA), commissioned Lewin/ICF, Inc., to analyze existing financial data and information on non-Federal and Veterans Administration teaching hospitals. The Lewin/ICF report was presented and discussed at a special meeting of COGME on November 2, 1989. Comments on the Lewin/ICF report were provided by organizations representing teaching hospitals and medical educators--the Association of American Medical Colleges (AAMC), the American Hospital Association (AHA), and the American Medical Association (AMA); third-party payers-HCFA for Medicare, the Blue Cross/Blue Shield Association, the Health Insurance Association of America, and the Group Health Association of America; ProPAC; and Frank A. Sloan, Ph.D. Their comments, reflected in the minutes for November 2 in Appendix E, have been taken into account in preparing the Council's report.
Following the meeting, a supplementary study was commissioned from Lewin/ICF to further analyze the variation in financial performance under Medicare. The results of this study were presented and discussed at the Council's meeting of January

29-31, 1990, and the data and statistics are presented in Appendix B in this report. In addition, a report on related data was provided by the AHA.
In June, 1990, Lewin/ICF provided revised projections of Medicare margins and related statistics. These are presented in Appendix C. The new statistics have been taken into account in the Council's final conclusions and recommendations.
To study the underrepresentation of minorities in medicine, the Division of Medicine requested a comprehensive range of .authorities in the field to provide expert presentations and data to COGME at a special meeting held on November 3, 1989. Their comments and information, reflected in the minutes for November 3 in Appendix F, have been incorporated in the report.
2
II. SUMMARY OF CONCLUSIONS AND RECOMMENDATIONS
FINANCIAL STATUS OF TEACHING HOSPITALS
A. HOSPITAL TOTAL MARGINS
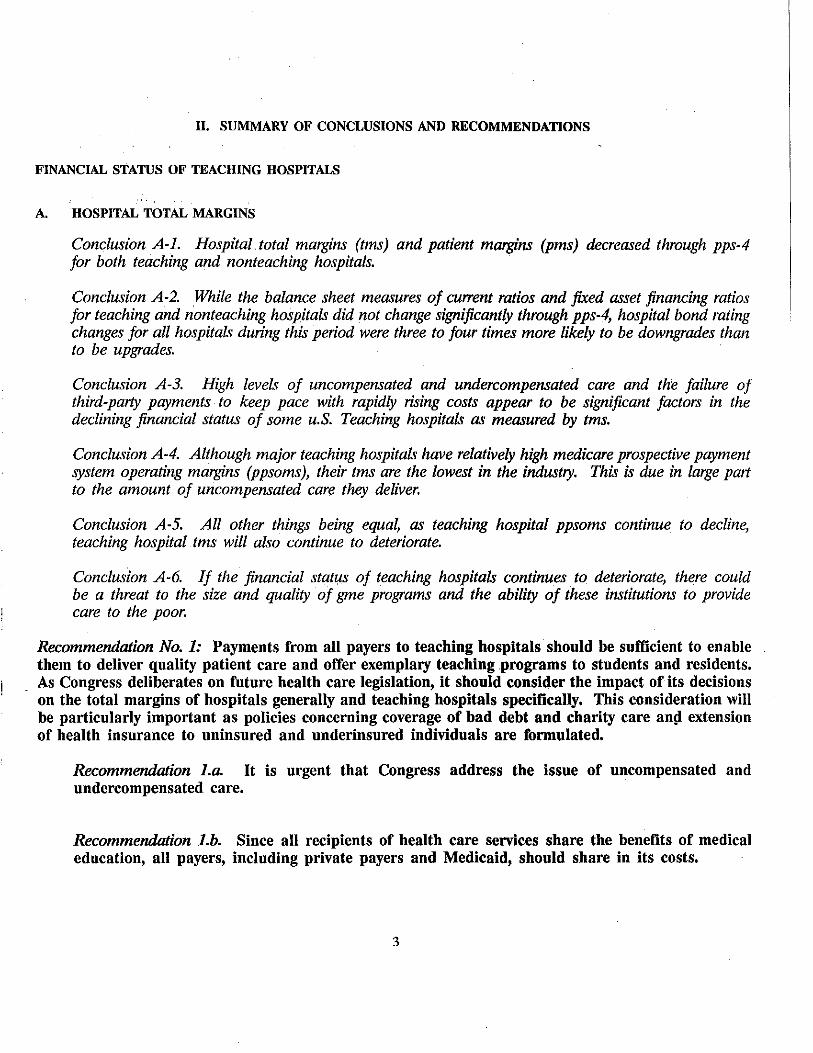
Conclusion A-1. Hospital total margins (tms) and patient margins (pms) decreased through pps-4 for both teaching and nonteaching hospitals.
Conclusion A.-2. .While the balance sheet measures of current ratios and fixed asset financing ratios for teaching and nonteaching hospitals did not change significantly through pps-4, hospital bond rating changes for all hospitals during this period were three to four times more likely to be downgrades than to be upgrades.
Conclusion A-3. High levels of uncompensated and undercompensated care and the failure of third-party payments to keep pace with rapidly rising costs appear to be significant factors in the declining financial status of some u.S. Teaching hospitals as measured by tms.
Conclusion A-4. Although major teaching hospitals have relatively high medicare prospective payment system operating margins (ppsoms), their tms are the lowest in the industry. This is due in large parl to the amount of uncompensated care they deliver.
Conclusion A-5. All other things being equal, as teaching hospital ppsoms continue to decline, teaching hos pit al tms will also continue to deteriorate.
Conclusion A-6. If the financial status of teaching hospitals continues to deteriorate, there could be a threat to the size and quality of gme programs and the ability of these institutions to provide care to the poor.
Recommendation No. 1: Payments from all payers to teaching hospitals should be sufficient to enable them to deliver quality patient care and offer exemplary teaching .programs to students and residents. As Congress deliberates on future health care legislation, it should consider the impact of its decisions on the total margins of hospitals generally and teaching hospitals specifically. This consideration will be particularly important as policies concerning coverage of bad debt and charity care an!l extension of health insurance to uninsured and underinsured individuals are formulated.
Recommendation 1.a. It is urgent that Congress address the issue of uncompensated and undercompensated care.
Recommendation 1.b. Since all recipients of health care services share the benefits of medical education, all payers, including private payers and Medicaid, should share in its costs.
3

Recommendation 1.c. Private payers should be strongly encouraged to pay their fair share of the costs of medical education.
Recommendation 1.d. Congress should require that all state Medicaid programs incorporate explicit and appropriate payments for medical education into their payment formulas.
Recommendation 1.e. Hospital margins, balance sheet measures, and other indicators of the financial status of teaching hospitals should be carefully monitored as more recent PPS data become available.
B. PPS OPERATING MARGINS
Conclusion B-1. PPS operating margins (PPSOM) for all hospitals and teaching hospitals have fallen steadily since the beginning of PPS.
Recommendation No. 2: Optimal national policy needs to balance budgetary concerns with health care policy concerns. Medicare payments should cover the costs associated with the provision of care to Medicare beneficiaries. To compensate for the increased risk associated with PPS, PPSOMs should be above zero on average across the nation's hospitals.
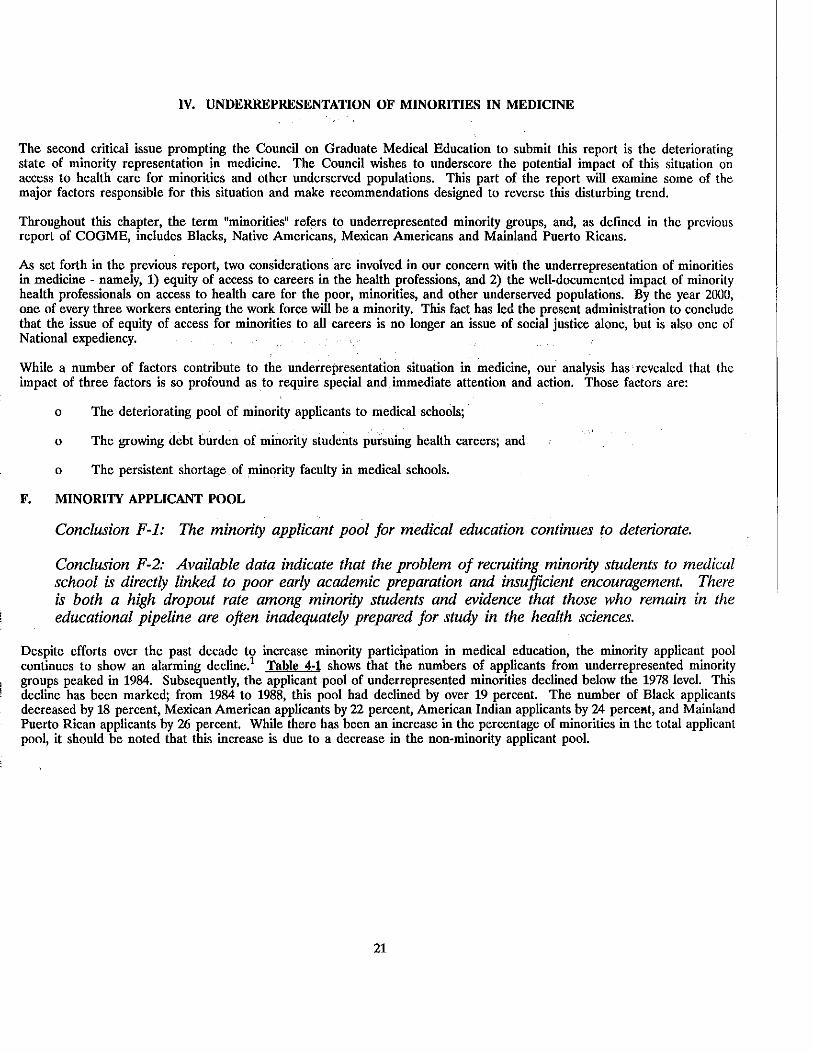
C. IMPACT OF THE INDIRECT MEDICAL EDUCATION ADJUSTMENT (IMEA)
Conclusion C-1. The PPSOMs of teaching hospitals are highly sensitive to changes in the indirect medical education adjustment factor (IMEA). If the IMEA were reduced to the levels recommended by the administration's FY 1991 budget, the average major teaching hospital PPS margin could drop into the negative range, and an increased number of teaching hospitals could have a negative PPS OM In the opinion of the Council, this would be an unacceptable outcome for Medicare payment policy.
Recommendation No. 3: In view of the deteriorating financial status of teaching hospitals, caution should be exercised in altering any one reimbursement component. Neither the indirect medical education adjustment of 7.7 percent nor direct medical education payments should be reduced from the current levels at this time. Future adjustments in the IMEA should be based upon information that includes data obtained from a continuous monitoring of teaching hospital finances.
D. VARIATION IN PPS OPERATING MARGIN AMONG HOSPITALS
Conclusion D-1. There is a wide and increasing variation in PPS operating margins among individual hospitals and across various types of hospitals and geographic areas.
Recommendation No. 4: Efforts should be made to determine the reasons for the wide and growing variation in PPS margins among individual teaching hospitals and among hospitals
4

located in various , regions of the country. The financial impact of PPS ultimately should be more closely equalized across the nation's hospitals. This implies both adequate levels of Medicare payment as called for in Recommendation No. 1, and an improved matching of PPS payments to the current cost structures of different types of hospitals and different geographic areas.
E. THE IMPORTANCE OF COST CONTROL EFFORTS
Conclusion E-1. Hospital PPSOMs are as much affected by hospital efforts to reduce costs as by PPS payment levels. Although many teaching hospitals have already taken clear and commendable steps to control their costs, continuing cost control efforts must be pursued vigorously.
Recommendation No. 5: The Congress and Administration should continue to support the basic principles of PPS as modified by the preceding recommendations.
MINORITY UNDERREPRESENTATION IN MEDICINE
F. MINORITY APPLICANT POOL
Conclusion F-1. The size of the minority applicant pool for medical education continues to decrease.
Conclusion F-2. Available data indicates that the problem of recruiting minority students to medical school is directly linked to poor early academic preparation and insuffieient encouragement. There is both a high dropout rate among minority students and evidence that those who remain in the educational pipeline are often inadequately prepared for study in the health sciences.
Recommendation No. 6: Emphasis should be placed on the development and support of programs which improve the size and quality of the minority applicant pool by focusing on early intervention (e.g., consortia of medical schools, public schools, and community organizations which work together to improve the educational pipeline).
Recommendation No., 7: Priority for Federal funding should be given to medical schools and teaching hospitals that have demonstrated success in the recruitment, enrollment, retention and graduation of underrepresented minority students.
G. MINORITY INDEBTEDNESS
Conclusion G-1: Minority students incur higher debt levels than majority students, and are more severely impacted by rising tuition costs and the decreasing availability of scholarships and other desirable forms of financial aid. If this situation continues it will exacerbate the decline in minority applicants to medical school and will further discourage minority students from choosing to practice in primary care specialties and in underserved areas.
Recommendation No. 8: The debt which minority students incur should be limited through adoption of a balanced strategy of scholarships, loan interest subsidies, and loan repayment programs. Medical schools should also be encouraged to develop innovative ways of reducing costs for minority students.
5

Recommendation No. 9: The Federal Government should provide more support in direct scholarships, and develop programs that match or otherwise stimulate scholarships from other public and private sources.
Recommendation No. 10: The National Health Service Corps should be expanded and should develop targeted opportunities for minority students.
H. SHORTAGE OF MINORITY FACULTY IN MEDICAL SCHOOLS
Conclusion H-1: Minorities are severely underrepresented on the faculties of U.S. medical schools. The Council believes that this underrepresentation has a negative effect on the recruitment, enrollment, retention and graduation of minority students and on the professional development of all medical students.
Recommendation No. 11: The Federal Government should develop and target for support programs that encourage minorities to pursue careers in academic medicine. Incentives should take the form of fellowships, loan forgiveness, loan repayment, and loan deferment.
Recommendation No. 12: The Federal government should provide support and incentives for medical schools that demonstrate success in recruiting and retaining minority faculty.
6

III. FINANCIAL STATUS OF TEACHING HOSPITALS
METHODOWGY
The primary indicators used by Lewin/ICF to analyze hospital financial viability were hospital margins. Three different margin measures are presented in this report: Prospective Payment System (PPS) operating margin (PPSOM), patient margin (PM) and total margin (TM). PPSOM measures the profit or loss resulting from the provision of acute inpatient hospital care to Medicare beneficiaries under the PPS; it is defmed as PPS operating revenues minus PPS operating costs divided by PPS operating revenues ((R-C)/R) expressed as a percentage. PPS margins include· total DRG case payments, outlier payments, and indirect teaching and disproportionate share adjustments. They do not include payments or costs for capital, direct medical education and kidney acquisition. PM measures the financial gain or loss from third-party payments against total hospital expenses. PM is defined as net patient revenues minus total expenses divided by net patient revenue. TM best reflects the overall financial condition of an institution because it includes all sources of revenue and expense. It is defined as total net revenue minus total expenses, divided by total net revenue.
The principal data used to develop financial measures for the report are derived from Medicare cost reports summarized on the Hospital Cost Report Information System tapes produced by HCFA. PPS statistics are presented in overlapping time frames known as "PPS Years"--PPS Year 1 (PPS-1), PPS-2, etc. Data for a PPS year are derived from hospital fiscal year cost reports that begin during a Federal Fiscal Year (FFY). Data spanning PPS-1 (which began in FFY 1984) through PPS-4 (approximately FFY 1987) were available from approximately 5,500 hospitals. In addition, these data were used to develop projections of PPSOM for PPS-5 through PPS-7 (FFY 1990). Supplementary data were provided by the AHA and the AAMC. In particular, the AHA data provided important detail on bad debt and charity care which were not available on the Medicare cost reports.
KEY FINDINGS
Total and Patient Margin Trends: Based on data it received, the Council believes that hospitals in general and teaching hospitals in particular have been affected by recent changes in the health care environment. The financial analysis explored TM (a measure reflecting profit or loss when all hospital revenues and expenses are considered) and PM (a measure comparing hospital net patient revenues to all hospital expenses) in all hospitals and in major and minor teaching hospitals1
over the time period between PPS-1 and PPS-4. These data reflect downward trends as shown below:
Hosnital Tvue/Measure PPS-1 PPS-4
All Hospitals TM 7.6% 3.5% PM 2.6 -2.1
Major Teaching TM 4.5 1.8 PM -5.6 -8.2
Minor Teaching TM 9.0 3.8 PM 4.3 -2.2
1. Major teaching hospitals are those that report an intern or resident-per-bed (IRB) ratio greater than or equal to 0,25. Minor teaching hospitals have an IRB ratio of less than 0.2.5.
7
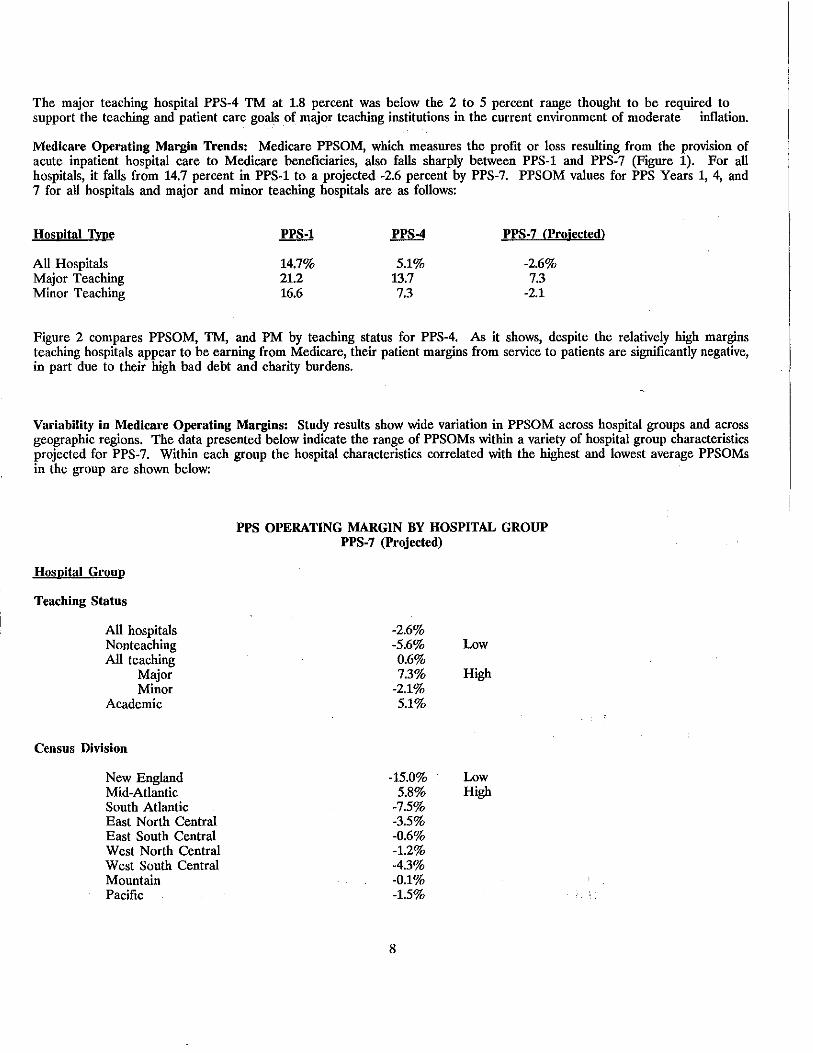
The major teaching hospital PPS-4 TM at 1.8 percent was below the 2 to 5 percent range thought to be required to support the teaching and patient care goals of major teaching institutions in the current environment of moderate inflation.
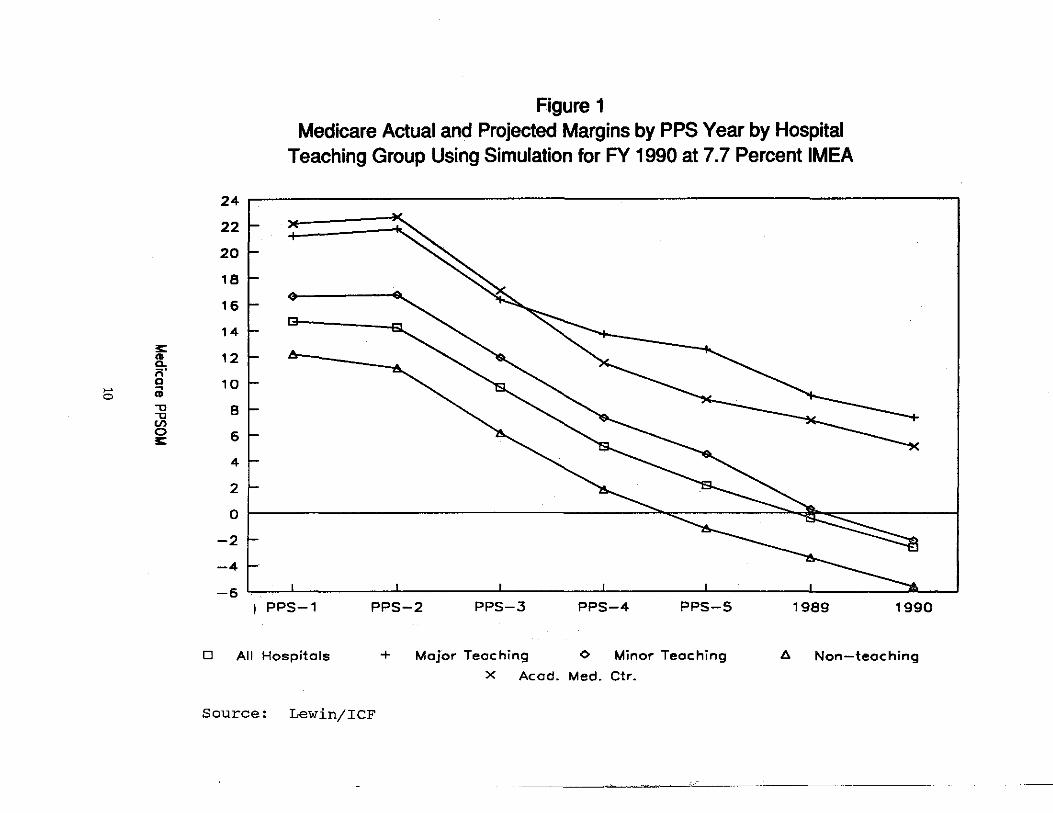
Medicare Operating Margin Trends: Medicare PPSOM, which measures the profit or loss resulting from the provision of acute inpatient hospital care to Medicare beneficiaries, also falls sharply between PPS-1 and PPS-7 (Figure 1). For all hospitals, it falls from 14.7 percent in PPS-1 to a projected -2.6 percent by PPS-7. PPSOM values for PPS Years 1, 4, and 7 for all hospitals and major and minor teaching hospitals are as follows:
Hospital Tvoe PPS-1 PPS-4 PPS-7 (Projected)
All Hospitals 14.7% 5.1% -2.6% Major Teaching 21.2 13.7 7.3 Minor Teaching 16.6 7.3 -2.1
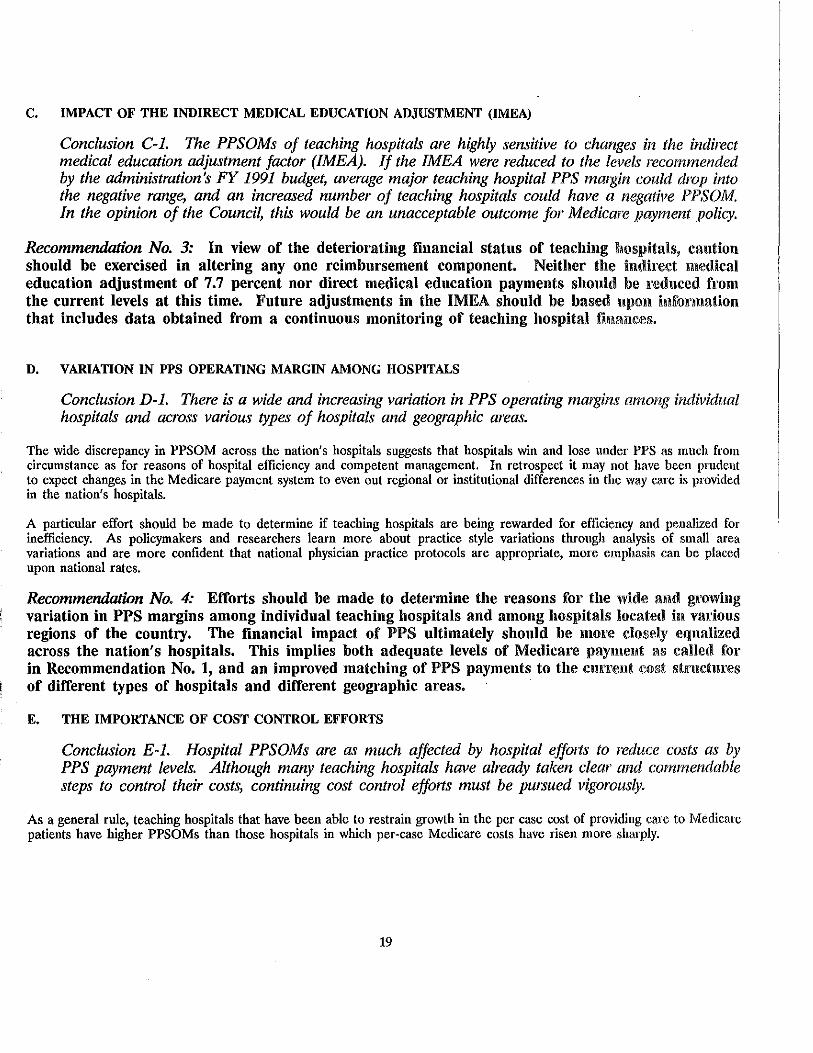
Figure 2 compares PPSOM, TM, and PM by teaching status for PPS-4. As it shows, despite the relatively high margins teaching hospitals appear to be earning from Medicare, their patient margins from service to patients are significantly negative, in part due to their high bad debt and charity burdens.
Variability in Medicare Operating Margins: Study results show wide variation in PPSOM across hospital groups and across geographic regions. The data presented below indicate the range of PPSOMs within a variety of hospital group characteristics projected for PPS-7. Within each group the hospital characteristics correlated with the highest and lowest average PPSOMs in the group are shown below:
Hospital Grouu
Teaching Status
All hospitals Nonteaching All teaching
Major Minor
Academic
Census Division
New England Mid-Atlantic South Atlantic East North Central East South Central West North Central West South Central Mountain Pacific
PPS OPERATING MARGIN BY HOSPITAL GROUP PPS-7 (Projected)
-2.6% -5.6% 0.6% 7.3%
-2.1% 5.1%
-15.0% 5.8%
-7.5% -3.5% -0.6% -1.2% -4.3% -0.1% -1.5%
8
Low
High
Low High

Hospital Gropp
Urban Bedslze
<100 100-404 405-685 >685
Rural Bedsize
Ownership
<100 100-169 >170
Church Voluntary Proprietary Government
Percent Medicare Days
> = 65 percent 50-64 percent 25-49 percent 0-24 percent
PPS OPERATING MARGIN BY HOSPITAL GROUP PPS-7 (Projected)
(Continued)
-2.7% -4.4% -0.7% 4.7%
-1.8% -5.9% -5.5%
-1.6% -3.1% -4.1% -0.5%
-7.7% -4.8% -1.6% 5.0%
Low
High
High Low
Low High
Low
High
The above figures indicate that nearly every group is projected to have negative PPSOM by PPS-7.
Percent of Hospitals with Negative PPSOM: By PPS-7, 55.6 percent of all hospitals are projected to have negative PPS margins. This statistic by teaching status for PPS Years 1 to 4 is as follows:
PPS-7 Hospital Tvne PPS-1 PPS-4 (Projected)
All hospitals 17.6% 44.5% 55.6% Major teaching 6.1% 16.6% 37.0% Minor teaching 6.6% 30.7% 58.2%
These projections indicate that by PPS-7 over one-third (37.0 percent) of the nation's major teaching institutions and almost three-fifths (58.2 percent) of the nation's minor teaching hospitals will not have their Medicare operating expenditures covered by their Medicare revenues.
9
3:: ~ ;;· a
>-' ~ O CD
"U "U
"' 0 £:
24
22
20
18
16
14
12
10
8
6
4
2
0
-2
-4
-6
Figure 1 Medicare Actual and Projected Margins by PPS Year by Hospital
Teaching Group Using Simulation for FY 1990 at 7.7 Percent IMEA
I PPS-1 PPS-2 PPS-3 PPS-4 PPS-5 1989 1990
D All Hospitals + Major Teaching <> Minor Teaching 6 Non-teaching
X Acod. Med. Ctr.
Source: Lewin/ICF

.... ....
;s: "' .a s 'U G> 0 G>
.a
Total Margin, PPS Margin and Patient Margin
16 (PPS Year 4)
14
12
10
8
6
4
2
0 I yx)d//l b(X)C/t1 r.rxyc1 1yy1cc1- ryxrccl KX)d//l I \:'l &::s:si ,,, \:'l \:;;;:I "(\I
-2
-4
-6
-8
-10
-12 '--~~--.~~~~-,-~~~~-r--~~~--,~~~~--,.-~~~~-.,--~~--' All Hospitals I All Teaching d Major-Teaching
Non-Teaching Aca emic Minor-Teaching Hospital Type
~ Total Margin ~ PPS Margin E;ss3 Patient Margin
Source: Lewin/ICF Payment Simulation Model

Percentile Distributions of PPSOM: Percentile margin statistics indicate the degr!'V to which margins vary across individual hospitals. For example, in PPS-7, 25 percent of the nation's hospitals are projected to have a PPSOM of less than -17.1 percent (the 25th percentile). The following statistics, also displayed in Figure 3, indicate PPSOM percentile trends for PPS Years 1 through 7 by teaching status:
PPS OPERATING MARGINS PERCENTILE DISTRIBUTION
Year/Hosnital Tvue 25th Median ~
PPS-1 All hospitals 2.8% 11.2% 17.7% Major teaching 12.7% 18.9% 25.1% Minor teaching 9.9% 15.2% 20.6%
PPS-2 Major teaching 13.3% 22.0% 28.0% Minor teaching 7.7% 14.8% 21.2%
PPS-3 Major teaching 6.3% 16.1% 22.6%
. Minor teaching 2.3% 9.7% 16.1%
PPS-4 All hospitals -8.7% 2.1% 10.9% Major teaching 5.7% 14.7% 20.7% Minor teaching -2.1% 4.5% 12.9%
PPS-5 All hospitals -11.6% -0.2% 10.0% Major teaching 3.1%. 11.1% 19.5% Minor teaching -6.8% 2.8% 11.3%
PPS-6 (Projected) All hospitals -14.4% -1.1% 11.1% Major teaching -6.1% 9.0% 20.6%
· Minor teaching -11.8% -0.7% 9.4%
PPS-7 (Projected) All hospitals -17.1% -2.7% 10.4% Major teaching -9.1% 7.7% 19.8% Minor teaching -14.8% -3.2% 7.2%
Source: Lewin/ICF Payment Simulation Model
By PPS-7, 25 percent of the .nation's major teaching hospitals are projected to have PPSOM of less than -9.1 percent. For minor teaching institutions th~· comparable statistic is-14.8 percent. The data suggest a high degree of Medicare underpayment for many of the Nation's teaching hospitals.
12

30
25
20
15
10 "lJ "lJ .... (/)
\H I 5 0 :c
0
-5
-10
-15
-20
Figure 3 Major and Minor Teaching Hospital 25th and 75th Percentile
PPS-OM Trends PPS-1 to PPS-5 (Actual) and FY 1989toFY1990 (Projected)
PPS-1 PPS-2
D Major - 75th %ile
Source: Lewin/ICF
PPS-3 PPS-4
+ Major - 25th %ile
A Minor - 25th %ile
PPS-5 1989
<> Minor - 75th %ile
1990


The Indirect Medical Education Adjustment (IMEA): Reduction in the IMEA from the current 7.7 percent to 3.5 percent or below could have a severe impact on the PPSOMs of major teaching hospitals and academic medical centers depending on the size of the reduction. Under the current IMEA, the average PPSOM for major teaching hospitals is projected to be 7.3 percent in PPS-7. However, if the IMEA were reduced to 3.5 percent, the projected average PPSOM for major teaching hospitals would decline to -4.4 percent in PPS-7.2 The range of projected PPSOM values under different IMEA assumptions is as follows:
Hosnital Tvne
All Hospitals Minor Teaching Major Teaching
PPS OPERATING MARGIN BY TEACHING STATUS (PPS-7) IMEA FACTORS
7.7%
-2.6% -2.1% 7.3%
-2.9% -2.5% 5.8%
6.6%
-3.3% -2.9% 4.6%
-4.8% -4.7% -1.6%
-5.5% -5.5% -4.4%
Balance Sheet Measures and Hospital Creditworthiness: Despite the decline in teaching and nonteaching hospital margins, a negative impact has not yet been observed on balance sheet measures such as the current ratio (CR) and the fixed asset financing ratio (FAFR). This finding reflects the ability of hospitals to maintain stability in these measures despite changes in short-term operating conditions. Nevertheless, hospital creditworthiness may have declined from 1983 to 1987; of the 20 percent of rated hospitals that received rating changes between 1983 and 1987, 80 percent received downgrades. The ratio of teaching hospital downgrades to upgrades was about 3:1 between 1983 and 1987, compared with a 4:1 ratio for all hospitals.
Bad Debt and Charity Care: In general, higher levels of bad debt and charity care are associated with lower TMs. The relationship of bad debt and charity care levels to TM was stronger for major teaching hospitals. Major teaching hospitals with the highest levels of bad debt and charity exhibited an average TM of 0.43 percent during calendar year 1988 compared with an average TM of 2.7 percent for major teaching hospitals with the lowest levels of bad debt and charity care.3
2. These projections assume that reductions in the IMEA would not be budget neutral. This is the assumption made in the Administrations's FY 1991 budget. Similar projections conducted by ProPAC assume budget neutrality and therefore show less severe PPSOM declines because savings obtained from IMFA reductions are redistributed back to all hospitals, including teaching institutions.
3. From AHA data as presented in the Lewin/ICF FJnal Report. See Table 9 on page 55 in Appendix A.
15

16

CONCLUSIONS AND RECOMMENDATIONS
A. HOSPITAL TOTAL MARGINS
Conclusion A-1. Hospital total margins (TMs) and patient margins (PMs) decreased through PPS-4 for both teaching and nonteaching hospitals.
~:
The Lewin/ICF analysis of Medicare cost report data shows average TM for all hospitals declining from 7.6 percent in PPS-1 to 3.5 percent in PPS-4. Average major teaching hospital TM declined from 4.5 percent to 1.8 percent over the same period. AHA annual survey data show a similar trend; average TM for all hospitals declined from 6,0 percent in the 1985 survey year, a period largely similar to PPS-1, to 3.3 percent for 1988, a period similar to PPS-4 (Appendix D).
Conclusion A-2. While the balance sheet measures of current ratios and fixed asset financing ratios for teaching and nonteaching hospitals did not change significantly through PPS-4, hospital bond rating changes for all hospitals during this period were three to four times more likely to be downgrades than to be upgrades.
It should be noted that financial analysts commonly review a large number of balance sheet and other factors in evaluating the financial health of hospitals. Rating changes are based on apparent changes in a hospital's finani:ial statements, utilization trends, and other relevant factors; the ratio of teaching hospital downgrades to upgrades was about 3:1 between 1983 and 1987, and 4:1 for all hospitals.
Conclusion A-3. High levels of uncompensated and undercompensated care and the failure of third-party payments to keep pace with rapidly rising costs appear to be significant factors in the declining financial status of some U.S. teaching hospitals as measured by TMs.
As many third party payers including Medicare are attempting to control hospital reimbursements, hospital revenue growth has not kept up with rising costs. At the same time, expectations that teaching hospitals will provide care to indigent patients is conflicting with their diminishing ability to shift the costs of this care to other payers.
Conclusion A-4. Although major teaching hospitals have relatively high Medicare Prospective Payment System operating margins (PPSOMs), their TMs are the lowest in the industry. This is due in large part to the amount of uncompensated care they deliver.
Conclusion A-5. All other things being equal, as teaching hospital PPSOMs continue to decline, teaching hospital TMs will also continue to deteriorate.
If this is allowed to happen, major teaching hospital total margins could very well fall significantly below the 2 to 5 percent range that expert testimony before COGME bas indicated as minimally consistent with the overall fmancial health of the nation's teaching institutions.
Conclusion A-6. If the financial status of teaching hospitals continues to deteriorate, there could be a threat to the size and quality of GME programs and the ability of these institutions to provide care to the poor.
17

Recommendation No. 1: Payments from all payers to teaching hospitals should be sufficient to enable them to deliver quality patient care and offer exemplary teaching programs to students and residents. As Congress deliberates on future health care legislation, it should consider the impact of its decisions on the total margins of hospitals generally and teaching hospitals specifically. This consideration will be particularly important as policies concerning coverage of bad debt and charity care and extension of health insurance to uninsured and underinsured individuals are formulated.
Recommendation 1.a. It is urgent that Congress address the issue of uncompensated and undercompensated care.
Recommendation l.b. Since all recipients of health care services share the benefits of medical education, all payers, including private payers and Medicaid, should share in its costs.
Recommendation 1.c. Private payers should be strongly encouraged to pay their fair share of the costs of medical education.
Recommendation 1.d. Congress should require that all state Medicaid programs incorporate explicit and appropriate payments for medical education into their payment formulas.
Recommendation l.e. Hospital margins, balance sheet measures, and other indicators of the financial status of teaching hospitals should be carefully monitored as more recent PPS data become available.
B. PPS OPERATING MARGINS
Conclusion B·l. PPS operating margins (PPSOM) for all hospitals and teaching hospitals have fallen steadily since the beginning of PPS.
The average PPSOM for all hospitals declined from a PPS-1 high of nearly 15 percent to a projected PPS-7 level of approximately -2.6 percent. By PPS-7, minor teaching hospital average PPSOM is also projected to be in the -2 percent range while major teaching hospital average PPSOM will be about 7.3 percent. Major teaching institutions are one of the few types of hospitals which may show positive earnings from Medicare during PPS-7.
Recommendation No. 2: Optimal national policy needs to balance budgetary concerns with health care policy concerns. · Medicare payments should cover the costs associated with the provision of care to Medicare beneficiaries. To compensate for the increased risk associated with PPS, PPSOMs should be above zero on average across the nation's hospitals.
The financial projections presented in this report provide more current information to guide the Congress in its determination of future PPS annual update factors. Projections presented herein contrast markedly with data from earlier years which suggest that hospitals in general and teaching hospitals in particular are being financially rewarded by PPS.
18
C. IMPACT OF THE INDIRECT MEDICAL EDUCATION ADJUSTMENT (IMEA)
Conclusion C-1. The PPSOMs of teaching hospitals are highly sensitive to changes in the indirect medical education adjustment factor (IMEA). If the IMEA were reduced to the levels recommended by the administration's FY 1991 budget, average major teaching hospital PPS margin could drop into the negative range, and an increased number of teaching hospitals could have a negatil'e PPSOM. In the opinion of the Council, this would be an unacceptable outcome for Medicare payment policy.
Recommendation No. 3: In view of the deteriorating financial status of teaching hospitals, caution should be exercised in altering any one reimbursement component. Neither the indirect medical education adjustment of 7.7 percent nor direct medical education payments should be reduced from the current levels at this time. Future adjustments in the IMEA should be based upon information that includes data obtained from a continuous monitoring of teaching hospital fiiMm~es.
D. VARIATION IN PPS OPERATING MARGIN AMONG HOSPITALS
Conclusion D-1. There is a wide and increasing variation in PPS operating margins among individual hospitals and across various types of hospitals and geographic areas.
The wide discrepancy in PPSOM across the nation's hospitals suggests that hospitals win and lose under PPS as much from circumstance as for reasons of hospital efficiency and competent management. In retrospect it may not have been prudent to expect changes in the Medicare payment system to even out regional or institutional differences in the way care is provided in the nation's hospitals.
A particular effort should be made to determine if teaching hospitals are being rewarded for efficiency and penalized for inefficiency. As policymakers and researchers learn more about practice style variations through analysis of small area variations and are more confident that national physician practice protocols are appropriate, more emphasis can be placed upon national rates.
Recommendation No. 4: Efforts should be made to determine the reasons for the wide amt grnvving variation in PPS margins among individual teaching hospitals and among hospitals located in various regions of the country. The financial impact of PPS ultimately should be moi·e closely equalized across the nation's hospitals. This implies both adequate levels of Medicare 1iayment as calle1l for in Recommendation No. 1, and an improved matching of PPS payments to the cm:Te11t cost structures of different types of hospitals and different geographic areas.
E. THE IMPORTANCE OF COST CONTROL EFFORTS
Conclusion E-1. Hospital PPSOMs are as much affected by hospital ef!01ts to reduce costs as by PPS payment levels. Although many teaching hospitals have already taken clear and commendable steps to control their costs, continuing cost control efforts must be pursued vigorously.
As a general rule, teaching hospitals that have been able to restrain growth in the per case cost of providing care to Medicare patients have higher PPSOMs than those hospitals in which per-case Medicare costs have risen more sharply.
19

Recommendation No. 5: The Congress and Administration should continue to support the basic principles of PPS as modified' by the preceding recommendations.
RELEVANT ARTICLES AND REPORTS
Lave JR: Hospital Reimbursement Under Medicare. Milbank Memorial Fund Quarterly/Health and Society, 62(2):251-268, 1984
Feder J, 'Hadley J, and Zuckerman S: How Did Medicare's Prospective Payment System Affect Hospitals? Special Article, N Engl J Med 317(14):867-873, 1987
Buchanan JR: Statement of the Coalition of Boston Teaching Hospitals before the Subcommittee on Health, Committee on Ways and Means, United States House of Representatives. Reprint, April 11, 1989.
Altman SH and Garfink CM: The Impact of the Federal Prospective Payment System on New York Hospitals. Bigel Institute for Health Policy, The Heller School, Brandeis University. Waltham, Massachusetts, 1989
Hadley J, Zuckerman S, and Feder J: Profits and Fiscal Pressure in the Prospective Payment System: Their Impacts on Hospitals. Inquiry 26:354-365, Fall, 1989
French HW (byline): "As a Hospital Grows, Debts Threaten It" New York Times, pages Bl and B6. Monday, December 18, 1989.
Sharp L and Rudolph BA. The Role of Minor Teaching Hospitals in Primary Care Manpower Development and Service Provision and Their Financial Viability Under PPS. Division of Medical Affairs, American Hospital Association, Chicago, Illinois, March 2, 1990
20
IV. UNDERREPRESENTATION OF MINORITIES IN MEDICINE
The second critical issue prompting the Council on Graduate Medical Education to submit this report is the deteriorating state of minority representation in medicine. The Council wishes to underscore the potential impact of this situation on access to health care for minorities and other underserved populations. This part of the report will examine some of the major factors responsible for this situation and make recommendations designed to reverse this disturbing trend.
Throughout this chapter, the term "minorities" refers to underrepresented minority groups, and, as defined in the previous report of COGME, includes Blacks, Native Americans, Mexican Americans and Mainland Puerto Ricans.
As set forth in the previous report, two considerations are involved in our concern with the underrepresentation of minorities in medicine - namely, 1) equity of access to careers in the health professions, and 2) the well-documented impact of minority health professionals on access to health care for the poor, minorities, and other underserved populations. By the year 2000, one of every three workers entering the work force will be a minority. This fact has led the present administration to conclude that the issue of equity of access for minorities to all careers is no longer an issue of social justice alone, but is also one of National expediency.
While a number of factors contribute to the underrepresentation situation in medicine, our analysis has revealed that the impact of three factors is so profound as to require special and immediate attention and action. Those factors are:
o The deteriorating pool of minority applicants to medical schools;
o The growing debt burden of minority students pursuing health careers; and
o The persistent shortage of minority faculty in .medical schools.
F. MINORITY APPLICANT POOL
Conclusion F-1: The minority applicant pool for medical education continues to deteriorate.
Conclusion F-2: Available data indicate that the problem of recruiting minority students to medical school is directly linked to poor early academic preparation and insufficient encouragement. There is both a high dropout rate among minority students and evidence that those who remain in the educational pipeline are often inadequately prepared for study in the health sciences.
Despite efforts over the past decade to increase minority participation in medical education, the minority applicant pool continues to show an alarming decline.1 Table 4-1 shows that the numbers of applicants from underrepresented minority groups peaked in 1984. Subsequently, the applicant pool of underrepresented minorities declined below the 1978 level. This decline has been marked; from 1984 to 1988, this pool had declined by over 19 percent. The number of Black applicants decreased by 18 percent, Mexican American applicants by 22 percent, American Indian applicants by 24 percent, and Mainland Puerto Rican applicants by 26 percent. While there has been an increase in the percentage of minorities in the total applicant pool, it should be noted that this increase is due to a decrease in the non-minority applicant pool.
21

Table 4-1 Number of Underrepresented Minority and Nonminority Medical School Applicants
By Entering Classes, 1978 to 1988
Race£Ethnicit;I 1978 1979 1980 1981 1982 1983 1984 1985 1986 1987 1988
Black American 2,564 2,599 2,594 2,644 2,600 2,558 2,620 2,428 2,388 2,203 2,160
American Indian 133 151 147 160 137 161 150 125 121 123 114
Mexican American 433 457 449 515 504 507 555 518 507 466 435
Mainland Puerto Rican 191 173 191 222 212 214 253 250 187 196 187
All underrepresented 3,321 3,380 3,381 3,541 3,453 3,440 3,578 3,321 3,203 2,988 2,896
All applicants 36,636 36,141 36,100 36,727 35,730 35,200 35,944 32,893 31,323 28,123 26,721
Source: Association of American Medical Colleges, Division of Minority Health, Facts and Figures V. June 1989
If the minority applicant pool continues to sluink, there may be an even greater shortage of minority physicians in the United States, particularly in relation to the proportion of minorities in the general population.2 This may result in still less access to health care for minorities and disadvantaged groups. Perhaps as great a problem lies in finding residency positions after graduation: 19.6 percent of American Indians did not match in the National Residency Matching Program in 1987.3
While there is no clear consensus regarding all the reasons which account for the disproportionately low numbers of minorities in the applicant pool, there is agreement that at least four factors contribute significantly to the problem: (a) lack of educational preparation, particularly in the sciences; (b) lack of role models and appropriate motivation; (c) lack of appropriate information and counseling at early stages in the educational process; and ( d) lower income levels in minority populations. A 1983 study prepared for the Association of Minority Health Professions Schools stated that barriers to increased enrollment of minorities in medicine include poor high school and college preparation in the sciences for many minority students, and lack of appropriate counseling for health professions careers.
In 1978, the AAMC Task Force on Minority Opportunities In Medicine indicated that the size and quality of the applicant pool are two of the most critical factors affecting future increases in the admission of minority students to medical schools. The report also concluded that future substantial increases in the quality of minority applicants will require more involvement by medical schools at the high school and college levels and that particular emphasis will have to be placed on recruitment, on academic and personal support systems at the college level, and on the role of the traditionally Black colleges.
Projected demographic trends suggest that, over the next two decades, Black and Hispanic population growth during the 1990s will result in approximately one-fourth of the population of junior high school students through college age groups being underrepresented minorities, primarily Black or Hispanic. This proportion will rise to about one-third by the year 2010. 5 The expected growth of minority populations and the ability of educational programs to meet their needs for education are factors that will affect the numbers that apply for medical school entry in future years.
The Educational "Pipeline"
The educational process is often described as a pipeline; students flow through educational experiences that begin with elementary school or earlier and culminate with completion of college. The applicant pool for entry into medical school is a product of this pipeline. A study by the National Science Foundation which tracked a 1977 high school class tluough the Natural Science/Engineering Pipeline graphically illustrates this concept (Figure 4). This particular path is especially pertinent in this discussion, since most medical school entrants have bachelors' degrees in the natural sciences.
22

Figure 4
Natural Science/Engineering" Pipeline: Following a Class from High School Through Graduate School
1977 high school sophomores 4,000,000 (100%)
1977 high school sophomores interested in NSE 730,000 (18%)
1979 high school seniors interested in NSE 590,000 (15%)
1980 college freshmen planning NSE degrees 340,000 (9%)
1984 NSE B.S. degrees 206,000 (1.5%)
1984 NSE graduate students 61,000 (1 % )
1986 NSE M.S. degrees 46,000 (1%)
1992 NSE Ph.D.s 9,700 (0.2%) b
a
b
Natural science/engineering (NSE) includes physical, n1athematical, and life sciences, and engineering, but not the social sciences.
National Science Foundation estimate, based on the historical rate in NSE of 5 percent of B.S. graduates going on for Ph.D.s.
NOTE: These National Science Foundation estimates indicate the general pattern of the NSE pipeline, but are not actual numbers of students in the pipeline. The estimates are based on data from the U.S. Department of Education-sponsored National Longitudinal Study of 19n Senior and high School and Beyond Study of 1980 Seniors.
SOURCE: National Science Foundation, The Science and Engineering Pipeline, PRA Report87-2, April 1987, p.3; and personal communication with National Science Foundation staff.
23

Minority students are at substantial risk of dropping out of school before obtaining a high school diploma. Hispanic students are at the highest risk of not completing high school. According to a report by the Department of Education released in September 1989, 35.7 percent of the nearly four million Hispanic students in the country dropped out before completing high school; in some metropolitan areas, this rate goes as high as 70 percent.4 In another study of the dropout rate in ten major cities in 1988, nearly one-third of Hispanic students dropped out before reaching the seventh grade; the dropout rate for black students was 14.8 ;ercent.5 Among Native Americans, the rate has declined slightly in recent years, but college enrollment has also declined.
Lower proportions of underrepresented minority high school graduates go to college after graduation from high school. A 1985 study conducted by the American Association of Colleges and Universities reported that between 1984 and 1988, the proportion of Black high school graduates going to college had declined by 11 percent, and Hispanic high school graduates had declined by 16 percent. Some of the reasons cited included the rising cost of education, higher admissions standards, reductions in financial aid, inability of minority families to pay for college expenses, and inadequate preparation. In 1988, only 25.0 percent of Black men and 30.5 percent of Black women went to college following high school graduation. Comparable percentages for Hispanics were 31.5 percent and 30.3 percent for men and women respectively, and for whites, 39.4 percent for men and 36.9 percent for women.6
As of 1987, Black Americans, Hispanics, and American Indians continued to be underrepresented among degree recipients compared with their enrollment levels in higher education. Black Americans made up 9.2 percent of all undergraduate college students but received only 5:7 percent of all bachelors' degrees in 1987. Hispanic Americans comprised 5.3 percent of the undergraduate population in 1986 but earned only 2.7 percent of all bachelors' degrees awarded that year. Similarly, American Indians comprised 0.8 percent of undergraduate college enrollment but received only 0.4 percent of all baccalaureate degrees in 1987.
Recommendation No. 6: Emphasis should be placed on the development and support of programs which improve the size and quality of the minority applicant pool by focusi~g on early intervention (e.g., consortia of medical schools, public schools, and community organizations which work together to improve the educational pipeline).
Recommendation No. 7: Priority for Federal funding should be given to medical schools and teaching hospitals that have demonstrated success in the recruitment, enrollment, retention and graduation of underrepresented minority students.
G. MINORITY INDEBTEDNESS
Conclusion G-1: Minority students incur higher debt levels than majority students, and are being more severely impacted by rising tuition costs and the decreasing availability of scholarships and other desirable forms of financial aid. If this situation continues it will exacerbate the decline in minority applicants to medical school and will further discourage minority students from choosing to practice in primary care specialties and in underserved areas.
The high cost of a medical education and the prospect of continued escalating debt loads are considered critical factors which have contributed to the decline in minority applicants to U.S. medical schools.
24
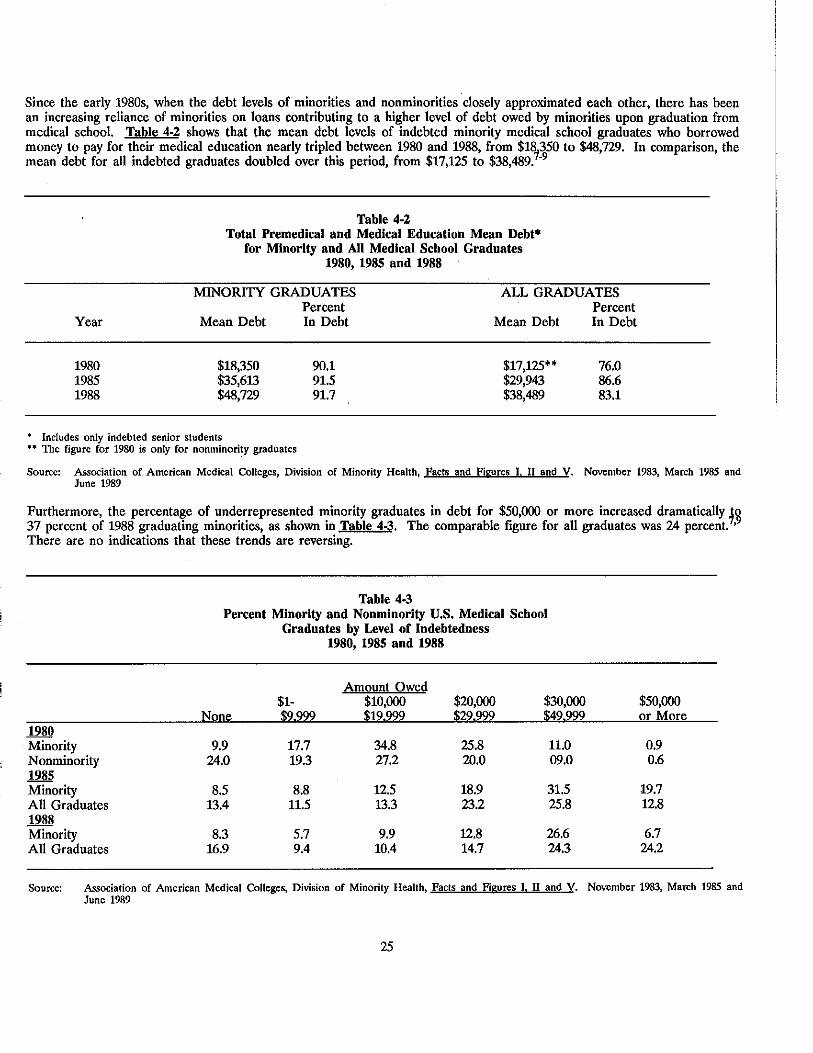
Since the early 1980s, when the debt levels of minorities and nonminorities closely approximated each other, there has been an increasing reliance of minorities on loans contributing to a higher level of debt owed by minorities upon graduation from medical school. Table 4-2 shows that the mean debt levels of indebted minority medical school graduates who borrowed money to pay for their medical education nearly tripled between 1980 and 1988, from $18
1350 to $48,729. In comparison, the
mean debt for all indebted graduates doubled over this period, from $17,125 to $38,489. -9
Table 4-2 Total Premedical and Medical Education Mean Debt*
for Minority and All Medical School Graduates 1980, 1985 and 1988
MINORITY GRADUATES ALL GRADUATES
Year Mean Debt
1980 $18,350 1985 $35,613 1988 $48,729
• Includes only indebted senior students •• The figure for 1980 is only for nonminori~y graduates
Percent In Debt
90.1 91.5 91.7
Mean Debt
$17,125** $29,943 $38,489
Percent In Debt
76.0 86.6 83.1
Source: Association of American Medical Colleges, Division of Minority Health, Facts and Figures I. II and V. November 1983, March 1985 and June 1989
Furthermore, the percentage of underrepresented minority graduates in debt for $50,000 or more increased dramatically ~o 37 percent of 1988 graduating minorities, as shown in Table 4-3. The comparable figure for all graduates was 24 percent. •9
There are no indications that these trends are reversing.
1980 Minority Nonminority 1985 Minority All Graduates 1988 Minority All Graduates
Table 4.3 Percent Minority and Nonminority U.S. Medical School
Graduates by Level of Indebtedness 1980, 1985 and 1988
Amount Owed $1- $10,000 $20,000 $30,000
None $9.999 $19.999 $29.999 $49.999
9.9 17.7 34.8 25.8 11.0 24.0 19.3 27.2 20.0 09.0
8.5 8.8 12.5 18.9 31.5 13.4 11.5 13.3 23.2 25.8
8.3 5.7 9.9 12.8 26.6 16.9 9.4 10.4 14.7 24.3
$50,000 or More
0.9 0.6
19.7 12.8
6.7 24.2
Source: Association of American Medical Colleges, Division of Minority Health, Facts and figures I. II and V. November 1983, March 1985 and June 1989
25

The high costs and the prospect of increasingly higher debts to obtain a medical education have a greater negative impact on students from economically disadvantaged backgrounds, many of whom are members of minority and ethnic groups that are underrepresented in the medical profession. Black Americans, American Indians, Mexican Americans and mainland Puerto Ricans, the minority groups most underrepresented within the medical profession, are the groups most likely to come from the lower er.onomic strata in the United States.
The inability of medical schools to attract increasing numbers of minority students into the medical profession because of financial and other inipediments will likely exacerbate current and future problems related to the poorer health status of Black and other minority components of the U.S. population, and impede the goal of achieving greater access to medical and health care services for medically nnderserved minority and disadvantaged groups.
Factol'S iill11iench11t1!1debtedness
Many factors influence the total amount of debt owed by medical students upon the completion of their education. In addition to the high and steadily increasing costs of tuition and other medical school educational expenses, these factors include premedical debt incurred by students for their undergraduate medical education; the accessibility of and types of scholarships and loans available to students; the costs of obtaining and repaying obligated loans; cultural values and practices, especially in regard to incurring debt; and characteristics of the student population such as age, marital status, student independence or dependence on their parents and their ability to access parental income.
Tuition, Fees, and O!h£r Medical School Exnenses
The cost of a medical school education ranks among the most expensive of health and other types of professional school training. Most medical schools increased tuition for first-year medical students by over 50 percent, in current dollars, during the first half of the 1980s. Over the ten-year period from 1980 to 1989, tuition increased two and one-half times for students attending private medical schools, more than three times for State residents enrolled in public schools, and almost four times for nonresidents attending such schools.10 During the past five years, average first year tuition increased 37.5 percent at private schools, and, at public schools, 53.0 percent for State residents and 70.8 percent for out-of-state residents entering their first year of studies. In 1989, average annual tuition was $17,783 at private schools; $5,935 for State residents attending State medical schools; and $14,089 for non-State residents (Table 4-4). The sharp increases in medical education costs through the 1980s are expected to continue into the 1990s.
Financial Assistance Awal'ded to Medical School Students
The AAMC reports that student demand for financial assistance continued to increase during the second half of the 1980s. Total financial assistance awarded to medical students increased by 41.8 percent, from $453.2 million in 1984 to $642.5 million · in 1987. Although scholarship assistance increased from $106 million in 1984 to $111.3 million in 1985, $130 million in 1986, and to $145 million in 1987, loans remained the major source of medical student financial assistance. A comparison of medical student support shows that loans represented 76 percent and 77 percent, respectively, of total financial aid in 1984 and in 1987. Between academic years 1986-87 to 1987-88, total financial assistance to medical students increased by 11.6 percent, from $575.5 million to $642.5 million.11•12
26

Table 4-4 Average Tuition, Fees and other Expenses for First Year
Medical Students, 1985-1986 and 1988-89
Public Medical Schools. Resident Tuition Student Fees All Other Expenses Average Costs
Public Medical Schools. Nonresident Tuition Student Fees All Other Expenses Average Costs
Private Medical Schools Tuition Student Fees All Other Expenses Average Costs
Includes tuition and Fees
1985-86
$ 3,890 389
7 342 $11, 621
$ 8,557 389
7 342 $16,288
$13,678 414
8 214 $22,306
• .. Includes room and board, books, equipment, supplies, transportation, and entertainment
Source: Association of American Medical Colleges, Section on Student Educational Programs. April 1986 and February 1989
1988-89
$ 5,935>~
8' 236>~* $14,171
8.236** $22,325
$17. 783>~
8 '852*>~ $26,635
Scholarships: Significant scholarship aid is required for low and middle income minority students if they are to consider medicine as a realistic career goal. In 1988, slightly over 82 percent of minority medical school graduates indicated they had received some form of scholarship assistance. Among 1988 minority graduates indicating the receipt of such aid, 62.4 percent indicated that they had received medical school-awarded scholarships. The average amount of these awards was $2,800 in 1987. Almost 39 percent received assistance from the second largest source, the National Medical Fellowships, Inc. About one-fifth of 1988 minority medical school graduates were awarded State scholarships.9
Although scholarship aid has increased overall, Federal service-obligated scholarship assistance awarded to minorities declined during the 1980s. The percent of minority graduates indicating they had received such aid dropped from 29 percent in 1980 to 22 percent in 1985, and 7.6 percent in 1988. Most of the decline in Federal service-obligated scholarship assistance can be attributed to reductions in the National Health Service Corps (NHSC) Scholarship program.13
•14
The NHSC was originally conceived as a Federal scholarship program which provided support to medical, osteopathic, and other health professions students in return for a period of obligated service in a designated health manpower shortage area. Eighty three percent of the 13,000 medical and other health science students who received NHSC scholarships have fulfilled their commitments through service in a shortage area. Over one quarter of these individuals were minorities. Of the small number of current obligors, 20 percent are Black and overall minority representation is 43 percent. The decreasing availability of scholarships, including NHSC scholarships, is cited as a factor contributing to the decrease in numbers of minorities seeking to enter medical schools (Simpson 1988).
27
'

Part of the decline in NHSC service-obligated support has been offset by the non-service commitment Exceptional Financial Need (EFN) scholarships and other smaller, non-Federal scholarships which usual!~ provide about $3,000 a year for support. In 1988, 7.5 percent of minority graduates reported receiving an EFN scholarship. 5
The Armed Forces Health Professions (AFHP) program is the largest single source of scholarship assistance. This program was established to obtain trained health professionals for the military services. The average annual amount of AFHP scholarships was $19,620 in 1987. The number of minority graduates who received an AFHP scholarship increased from 5.7 percent in 1980 to 6.8 percent in 1985, and declined to 5.5 percent of such graduates by 1988.
Loans: Although total scholarship and loan assistance support increased in the 1980s, the corresponding decline in health professioqs full scholarship support and constraints on the availability of low cost alternatives to financing a medical education during the past decade have contributed to the need for minorities to borrow more often, in larger amounts and at higher interest rates than in the past. As the availability of subsidized loans through the Health Professions Loan Program and the Guaranteed Student Loan Program have decreased, medical students have increasingly turned to the Health Educational Assistance Loan Program and other sources that charge market level interest.
The AAMC has reported that a follow-up assessment of accepted applicants who failed to matriculate in medical school in 1986 revealed that most of these potential medical school students matriculated in other types of professional schools. However, this study did not directly assess whether these students failed to enter medical school because of a lack of financial assistance, or because of a belief that they might not be able to repay their medical school debt (AAMC, 1987).
Increased enrollment of minorities in medical schools was greatest in the late 1960s and the 1970s during the period of full scholarship and readily available low interest loan assistance.15 Many observers believe that the insufficient availability of full scholarship support and low cost and/or subsidized loan options has contributed to changes in the sociodemographic and economic characteristics of students applying to and entering medical school over the past decade (Lloyd 1989, Simpson 1990).
A study which examined the effectiveness of the Federal Health Manpower Programs of the 1960s and 1970s in increasing access to medical school found that, regardless of ethnic background or race, students from socioeconomically disadvantaged families were able to enroll in even the most expensive medical schools and graduate without much more debt than students from families with more resources. The authors concluded that because these programs were successful in enabling economically disadvantaged individuals to enter medical school, their elimination would have a large negative impact on low-income individuals.IS'
Other studies did not demonstrate discernible effects of tuition differentials or increasing costs on minority applicants or medical school matriculants in past years. An earlier study had indicated that the availability of financial aid kept the minority applicant pool at a stable level during the later 1970s.16 A study supported by the Bureau of Health Professions (BHPr) and conducted by the AAMC which examined debt and other characteristics of 1983 senior medical students attending private and public medical schools found that there were no differences between minority and nonminority senior year debt levels among those who had entered public medical schools. However, the mean debt levels of minorities who had attended private medical schools was lower than that of nonminorities. The authors attributed this finding to the higher proportion of minority students who attended private medical schools durinft the peak years of the NHSC program and received these scholarships for all four years of their medical school education.13•
This AAMC study also showed that among students who received a scholarship, the amount of debt accumulated varied by the source of the award. The mean debt of 1983 seniors who were Federal (AFHP and NHSC) service-obligated scholarship recipients was $14,500. The mean debt of AFHP and NHSC scholarship recipients was about $11,700 less than that of State scholarship recipients and almost $15,000 less than those of students receiving other types of scholarships. This finding was attributed to the dollar amounts of Federal service-obligation scholarships which are substantially greater than State and other types of scholarships, leaving Federal scholarship recipients less in debt than their counterparts who received other types of scholarship assistance.8
Recommendation No. 8: The debt which minority students incur should be limited through adoption of a balanced strategy of scholarships, loan interest subsidies, and loan repayment programs. Medical schools should also be encouraged to develop innovative ways of reducing costs for minority students.
28

Recommendation No. 9: The Federal Government should provide more support in direct scholarships and develop programs that match or otherwise stimulate scholarships from other public and private sources.
Recommendation No. 10: The National Health Service Corps should be expanded and should develop targeted opportunities for minority students.
29

H. SHORTAGE OF MINORITY FACULTY IN MEDICAL SCHOOLS
Conclusion H-1: Minorities are severely underrepresented on the faculties of U.S. medical schools. The Council believes that this underrepresentation has a negative effect on both the recruitment, enrollment, and graduation of minority students and the professional development of all medical students.
As shown in Table 4-5, the percentage of underrepresented minority faculty in U.S. medical schools has remained low since 1975. Black faculty members have remained at 1.8 percent of medical school faculties; and Native Americans at 0.1 percent. There has been a slight increase from 0.2 percent to 0.3 percent of Mexican American faculty, and mainland Puerto Rican faculty has remained at 0.7 percent. Only 2.7 percent of all faculty were underrepresented minorities in 1975 and 1985. This percentage increased slightly to 2.9 percent in 1988.
Many minority faculty are employed by minority medical schools. In 1988, 195 of 1,103 Black faculty members (18 percent) were employed by Howard College of Medicine, Meharry Medical College, and Morehouse School of Medicine. This is a decrease from 24 percent in 1985, (225 of 950). This would indicate that there has been a slight increase in the number of Black faculty (6 percent) who are on the faculties of majori~ medical schools. This increase is important because over 80 percent of all Black students attend majority medical schools. 7
In 1982, 15.9 percent of minority medical school graduates listed teaching and research in basic or clinical sciences as their first career choice, 19 amounting to about 160 per year based on an estimated 1,000 minority graduates annually. However, as noted above, the percentage of minority faculty has changed very little since 1975. Had there been a net increase of 160 minority faculty in 1988, total minority faculty would have increased by almost 10 percent, based on a 1988 total of 1,700 underrepresented minority U.S. medical school faculty.
Table 4-5 Ethnic Distribution of U.S. Medical School Faculty
For Academic Years 1975, 1985, and 1988
1975 1985 1988 Ethnic Group Number Percent Number Percent Number Percent
White 33,345 82.0 43,564 83.0 49,441 82.1
Black American 733 1. 8 950 1. 8 1,103 1. 8 (265) (0.7) (225) (0.4) (195) (0.3)
American Indian 14 47 0.1 49 0.1 Underrepresented Hispanic 349 0.9 447 0.8 548 1.0
. (223} iQ..21 (270} iQ..21 (302} iQ..21 Total Underrepresented 1,096 2.7 1,444 2.7 1,700 2.9
Other* 3,622 8.9 4,571 8.7 5,351 8.9 Unknown 2,618 6.4 2,885 5.5 3,716 6.2
TOTAL 40,682 100.0 52,464 100.0 60,208 100.0
Less than 0.5 percent () Brackets show either the number of Black faculty members at Meharry College, Howard university College of Medicine, and Morehouse
School of Medicine; or the number of Puerto Rican and other Hispanic Faculty members on staff at medical schools in Puerto Rico. Includes C...ommonwealth Puerto Ricans, other Hispanics, and Asians.
Source: Association of An1erican Medical Colleges, 1985 and 1988.
30

Not only are there few minorities on the faculty of most medical schools, there are also few minorities in leadership positions, In a study looking at the numbers of Blacks in academic administrative positions at approximately 120 nonminority medical schools, there were no Black deans, only two Black chairs of internal medicine, and no Black chairmen of general surgery.18
Table 4-6 shows the distribution of U.S. medical school department chairs by ethnicity. Excluding the minority schools, there are only 59 (1.7 percent) of the 3,493 chairs belonging to underrepresented minority groups. The percentage increases to 3.1 % when including the minority schools (111 of 3,550).
Table 4-6 Ethnic Distribution of U.S. Medical School Department Chairs
EXCLUDING BLACK & TOTAL FACULTY PUERTO RICAN SCHOOLS
Ethnic Group Number Percent Number Percent American Indian 6 0 6 0 Asian 72 2.0 71 2.0 Black 57 2.0 27 1.0 Mexican American 4 0 4 0 Puerto Rican 44 1.0 22 1.0 Other Hispanics 28 1.0 24 1.0 White 3,154 89.0 3,154 90.0 Missing 185 5.0 185 5.0 TOTAL 3,550 100.0 3,493 100
(AAMC, 1990)
Many factors discourage minority students from pursuing careers in academic medicine. Among these are the failure of medical schools to encourage minority students to seek academic careers, lengthy training to enhance academic skills especially in research, and higher levels of indebtedness after completing medical school. Indebtedness has been associated with students selecting a clinical practice rather than an academic career. The AAMC concluded that minority graduates may need to generate income to pay back their educational loans.21
There are a number of programs designed to develop minority faculty, such as the Johnson Clinical Scholarship, the Markle Scholarship, the Macy Faculty Scholar Awards, the Minority Access to Research Careers (MARC), National Medical Fellowships, Inc., The Commonwealth Fund, Kaiser Scholars, and the recently (1988) established Robert Wood Johnson Minority Medical Faculty Development Program. However, more data are needed on what happens to students who participate in these programs, as well as to students expressing interest in academic careers.
In a survey of college professors, Fall 1987,22 it is reported that higher education also has low numbers of underrepresented minorities: 3 percent Black, 2 percent Hispanic, and 1 percent American Indian. Recognizing that it can be especially difficult for minority faculty to succeed in isolation, higher education is moving toward recruiting a critical mass (cluster hiring) to increase the number of minority faculty within departments and colleges. The literature clearly indicates that productive researchers need a network of colleagues to assure their success in an academic environment.23 There continues to be a need to increase the number of minority medical faculty, but also to provide faculty development opportunities to help minority faculty succeed in academic careers. Financial incentives could provide opportunities for minority residency-trained physicians interested in academic careers to take advanced academic training. Incentives include assistance in repaying medical school loans and fellowships to prepare potential faculty for academic careers.
Role modeling and mentoring are especially important in retaining and recruiting minority medical students.24•25 Medical
schools with high minority graduation rates have more minority faculty per student and lower faculty attrition rates (Luke, 1987). Therefore, an increase in the number of minority faculty must be an important part of any strategy to increase the number of underrepresented minorities pursuing medical careers.
31

There are also programs that provide support and incentives for medical schools with either demonstrated success or ability to develop focused programs in recruiting and retaining minority faculty. Examples are the Health Careers Opportunity Program (HCOP), the Centers for Excellence Program, and funding preferences for awarding Title VII Primary Care training grants.
Recommendation No. 11: The Federal Government should develop and target for support programs that encourage minorities to pursue careers in academic medicine. Incentives should take the form of fellowships, loan forgiveness, and loan repayment.
Recommendation No. 12: The Federal government should provide support and incentives for medical schools that have demonstrated success in recruiting and retaining minority faculty.
32

REFERENCES
Applicant Pool
1. Association of American Medical Colleges. Minority Students in Medical Education: Facts and Figures V. Section for Minority Affairs, Washington, D.C., June 1989.
2. U.S. Census, Series P-25, No. 95, 1989.
3. Ignace GL: Native Americans in Medicine. Presented to the Council on Graduate Medical Education, Rockville, Maryland, November 3, 1989.
4. Pinn-Wiggins V: Statement before the Council on Graduate Medical Education, Rockville, Maryland, November 3, 1989.
5. Aspira Association, Inc.: "Facing the Facts." Prepared for the Aspira Hispanic Community-Mobilization Dropout Prevention Project, Washington, D.C., 1989.
6. American Council on Education: Eighth Annual Status Report--Minorities in Higher Education. Washington, D.C., December, 1989.
Indebtedness
7. Association of American Medical Colleges. Minority Students in Medical Education: Facts and Figures. Office of Minority Affairs. Washington D.C., November 1983.
8. Association of American Medical Colleges. Minority Students in Medical Education: Facts and Figures II. Office of Minority Affairs, Washington, D.C., March 1985.
9. Association of American Medical Colleges. Minority Students in Medical Education: Facts and Figures V. Section for Minority Affairs, Washington, D.C., June 1989.
10. Association of American Medical Colleges. Unpublished data. Section on Student Educational Programs, Washington, D.C. Telecommunication February 1989.
11. American Medical Association. "87th Annual Report on Medical Education in the U.S.," Journal of the American Medical Association, Vol. 258, No. 8. August 28, 1987.
12. American Medical Association. "89th Annual Report on Medical Education in the U.S.," Journal of the American Medical Association, Vol. 262, No 8. August 25, 1989.
13. Association of American Medical Colleges. Study of How Medical Students Finance Their Education. Phase I Report. Washington, D.C., 1984.
14. Association of American Medical Colleges. Study of How Medical Students Finance Their Education. Final Report, Washington, D.C., 1986.
15. Bazzoli G et al., "Race and Socioeconomic Status in Medical School Choice and Indebtedness." Journal of Health Economics. 61:285-292, April 1986.
16. Yoder, SG: "The Influence of Economic Factors on Medical Students' Career Choices" in Medical Education and Societal Needs: A Planning Report for the Health Professions. Institute of Medicine, July 1983.
33

Minority Faculty
17. Frierson, Jr., HT: "The Status of Black Students in Medical Education. Journal of the National Medical Association, Vol 80, No. 4, 1988.
18. Wilson, DE 'Minorities and the Medical Profession: A Historical Perspective and Analysis of Current and Future Trends." Journal of the National Medical Association, Vol 78 No. 3, 1986.
19. Association of American Medical Colleges, Medical Student Graduation Questionnaire Survey, 1982.
20, Pinn-Wiggins, V: "Ongoing Challenges in Graduate Medical Education: The Underrepresented in Medicine and Interests Related to Basic Medical Research." Emerging Problems in Graduate Medical Education. U.S. Department of Health and Human Services, Health Resources and Services Administration, 1983.
21. Association of American Medical Colleges Task Force on Minority Student Opportunities in Medicine, June, 1978.
22. Chronicle of Higher Education, February 7, 1990, p. A.17.
23. Bland CJ and Schmitz CC: "Characteristics of the Successful Researcher and Implications for Faculty Development." Journal of Medical Education, Vol. 61, January, 1986.
24. Sullivan LW: "Minorities and Medical Education - The Crisis Worsens." Paper presented at the National Symposium on Strengthening Support Networks for Minorities in Health Science Careers. April, 1986.
25. Luke WL and Tudor CG: "Differential Analysis of U.S. Medical Schools with High and Low Minority Graduation Rates." Association of American Medical Colleges. Supported by Division of Medicine, Bureau of Health Professions, Health Resources and Services Administration, Department of Health and Human Services, 1987.
34
SUPPLEMENT Table of Contents--Appendices
A. Derron RA, Dobson A, Mechanic RE, and Watt JM. Analysis of the Financial Status of Teaching Hospitals. Final Report. Contract No. DHHS 282-88-0017, Delivery Order #3. Prepared for the Council on Graduate Medical Education. Lewin/ICF, March 8, 1990.
B. "An Analysis of Teaching Hospital Financial Status. Phase II." Supplemental report prepared by Lewin/ICF, February 9, 1990.
C. Updated Projections on Teaching Hospital Financial Status, Lewin/ICF, June 7, 1990.
D. "U.S. Registered Community Hospital Margins." American Hospital Association Hospital Data Center, June, 1990.
E. Council on Graduate Medical Education: Minutes of the Plenary Meeting of November 2, 1989, on the financial status of teaching hospitals. Division of Medicine, January, 1990.
F. Council on Graduate Medical Education: Minutes of the Plenary Meeting of November 3, 1989, on the underrepresentation of minorities in medicine. Division of Medicine, January, 1990.
NOTE ON THE APPENDICES
The Lewin/ICF data and analyses are provided in Appendices A, B, and C. Appendix A is the final version of Lewin/ICF's draft report presented to the Counril on November 2, 1989. Appendix B is a set of data from an additional analysis requested by the Council at the November 2 meeting and provided at the January 29-30, 1990, meeting. Appendix C presents a revision by Lewin/ICF of its projected Medicare margins and certain related statistics, which were presented to the Subcommittees and Council in June. The Council's final conclusions and recommendations were revised to take into account the new projections in Appendix C.
35


INDIVIDUAL COMMENT BY THE HEALTH RESOURCES AND SERVICES ADMINISTRATION
AND THE HEALTH CARE FINANCING ADMINISTRATION
37

Individual Conunentary Robert G. Eaton, HCFA Robert G. Harmon, M.D., HRSA COGME Members
As representatives of the Department of Health and Human Services (DHHS), we generally support COGME's efforts in its latest report to examine the financial status of teaching hospitals for signs of deterioration and to examine the continuing underrepresentation of minorities in medicine.
In regard to minorities in medicine, it is clear that there is still underrepresentation of minority physicians in practice, research, and education in the United States, and that creative efforts need to be undertaken by government, private industry, and the educational connnunity to increase the number of minority applicants qualified to enter and complete a medical education. Secretary Sullivan's Minority Health Initiative has proposed a number of activities to encourage greater participation of minorities in the health professions.
In regard to the Report on the Financial Study of Teaching Hospitals, we generally support the conclusions regarding the effect of the high levels of care given to the uninsured and underinsured on hospital total margins. Further, we recognize that the Medicare Prospective Payment System (PPS) has had an uneven financial impact on hospitals and we are examining refinements to the system that would achieve greater payment equity across classes of hospitals. We support as well the conclusion that hospital PPS margins are as much affected by hospital efforts to reduce costs as by PPS payment levels and thus hospitals must continue hospital cost containment efforts. However, as representatives of the Department, we want to state for the record the Administration's position on certain items contained in the report.
Since the inception of the Medicare prospective payment system, the Medicare operating margins for teaching hospitals have been substantially higher than those of any other class of hospital and have been significantly higher than the total margins for teaching hospitals. In this regard, the report indicates that in FY 1987 (PPS-4), hospitals on average experienced Medicare PPS operating margins of 5.1 percent and total margins of 3.5 percent. In contrast, hospitals with minor teaching programs had Medicare operating margins of 7.3 percent and total margins· of 3.8 percent while major teaching hospitals had average Medicare operating margins of 13.6 percent and total margins of 1.8 percent during FY 1987. These data clearly indicate that teaching hospitals are doing better under PPS than other classes of hospitals and, more importantly, that Medicare payments are subsidizing teaching hospitals.

Page 2 - Individual Commentary
However, the presentation of the data in the report could lead a casual reader to a mistaken conclusion that Medicare payments have contributed to the financial difficulties of teaching hospitals. One potentially misleading aspect is the use of the first year of PPS as the baseline for comparison. For example, patient margins and total margins during the first few years of PPS were at historically high levels for all categories of hospitals, largely because of the effects of PPS. Before 1980, patient revenue operating margins were near zero. They began to increase slowly thereafter, increasing from 0.3 percent in 1980 to 1 percent in 1983, the year before PPS went in to effect. In 1984, the patient margin, according to the report, rose to 2.6 percent (when the Medicare operating margin was 14.8 percent). Between 1980 and 1983, total revenue operating margins were at the 5 percent level; in 1984, total revenue operating margins increased to 7.6 percent. The report emphasizes that these margins have declined since the inception of PPS in 1984. However, the 1984 margins were at historically high levels largely because the average Medicare margin was 14.8 percent that year. Thus, 1984 is not a representative year for assessing the financial condition of hospitals under PPS.
The use of PPS-1 as the base year for comparing relative increases in Medicare revenues and costs could also be misleading since it does not reflect the experience during PPS-1 when average costs per case increased only 2.2 percent while payments increased 18.7 percent. Rather than reduce the PPS rates precipitously to account for the excessive payments, we chose to gradually reduce the payments through lower update factors. One result is that costs have risen more rapidly than PPS revenues in recent years. However, the cumulative increase in revenues kept pace with the cumulative increase in costs over the ·first five year of the PPS.
In the report's conclusions and recommendations, reliance is placed'on projected margins for FY 1990. These projections are very sensitive:to the assumptions in the simulation model regarding changes in case mix and costs per discharge. They have limited value for policy-making because we do not know the behavioral responses that hospitals will make to changes in payment. Teaching hospitals have successfully responded to the incentives of the PPS in the past and we assume that, if face<) with lower margins, they will take action to improve efficiency and co.ntrol increases in their operating costs.
At the same time, we recognize that hospitals are being asked to take additional financial risk through prospective payments from a number of payers including Medicare. We believe, as the report recommends, that the variablilty of financial performance of teaching hospitals under Medicare bears close watching and further study. It cannot currently be determined whether the variablilty is due to differences in efficiency or a combination of hospital cost structure and the design of the PPS.

Page 3 - Individual Connnentary
While the contributions to GME financing of payers other than Medicare could not be analyzed because of the lack of data, the report's emphasis on Medicare payments does not address the underlying issue of the appropriate levels of support for teaching hospital programs. We agree with the report that the viability of teaching hospitals should be viewed from the perspective of overall financial status and not just one component such as Medicare payments. In view of this and the fact that Medicare PPS margins are much higher than total margins in major teaching hospitals, we disagree with the reconnnendation that the indirect·medical education adjustment (IMEA) should not be reduced from the current levels'. ·PPS rates, and adjustments to those rates, are based on estimates of the resources required to furnish services to Medicare beneficiaries. They are not based on Medicare operating margins or any other single measure of financial status. Moreover, we do not believe that Medicare payments should be used to compensate hospitals for losses they sustain in their non-Medicare operation. Therefore, we believe it is reasonable to reduce the IMEA factor to a level shown by recent analyses to reflect more accurately the impact of teaching activities upon hospital costs. At the same time, we welcome an open and frank discussion of the appropriate vehicles for the federal government and other third party payers to pay teaching hospitals for the costs associated with their special missions.
Overall; we would like to compliment the Council on its work and on the dedication of its members.
Robert G. Harmon, M.D., M.P .H.
U.S. GOVERllMENT PRllfTING OFACE: 1900 0-W-344

DHHS Publication No. (HRS-P-DM) 90-1
DEPARTMENT OF HEALTH AND HUMAN SERVICES Public Health Service
Health Resources and Services Administration Bureau of Health Professions
Division of Medicine
, ..