Official Use Only Vietnam - jica.go.jp · Hyundai Corporation (Korea). Tomen Corporation (Japan),...
26
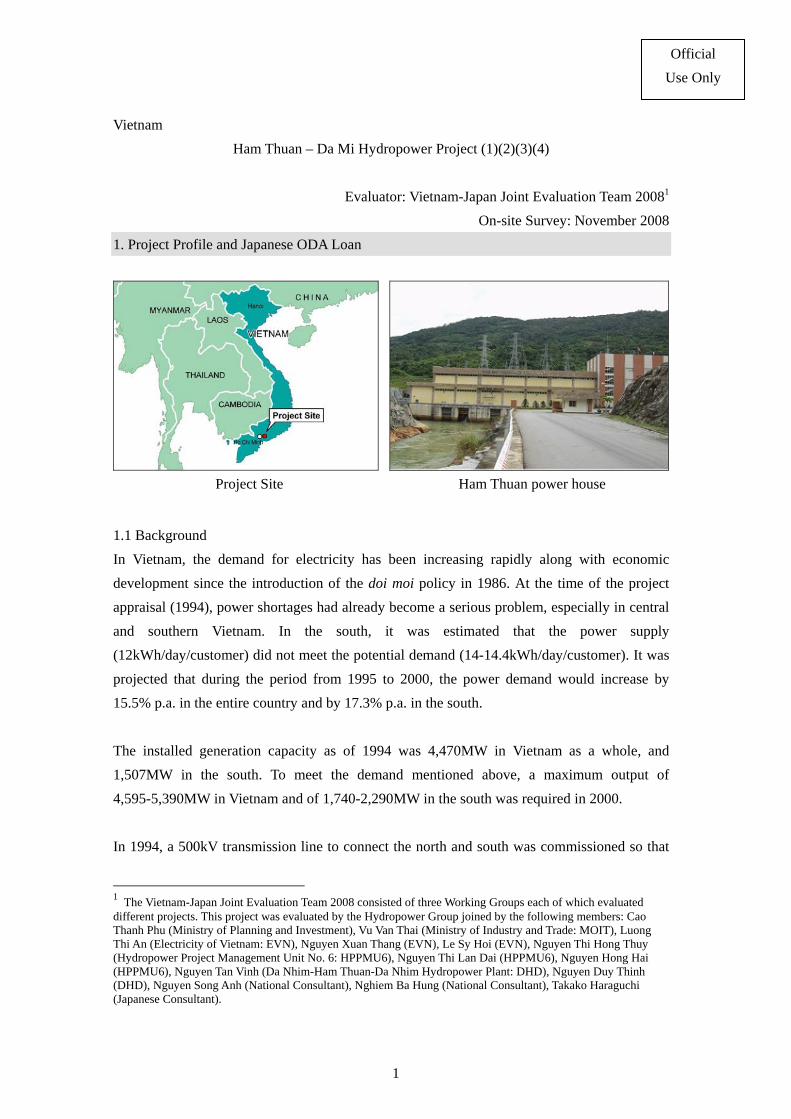
1 Vietnam Ham Thuan – Da Mi Hydropower Project (1)(2)(3)(4) Evaluator: Vietnam-Japan Joint Evaluation Team 2008 1 On-site Survey: November 2008 1. Project Profile and Japanese ODA Loan Project Site Ham Thuan power house 1.1 Background In Vietnam, the demand for electricity has been increasing rapidly along with economic development since the introduction of the doi moi policy in 1986. At the time of the project appraisal (1994), power shortages had already become a serious problem, especially in central and southern Vietnam. In the south, it was estimated that the power supply (12kWh/day/customer) did not meet the potential demand (14-14.4kWh/day/customer). It was projected that during the period from 1995 to 2000, the power demand would increase by 15.5% p.a. in the entire country and by 17.3% p.a. in the south. The installed generation capacity as of 1994 was 4,470MW in Vietnam as a whole, and 1,507MW in the south. To meet the demand mentioned above, a maximum output of 4,595-5,390MW in Vietnam and of 1,740-2,290MW in the south was required in 2000. In 1994, a 500kV transmission line to connect the north and south was commissioned so that 1 The Vietnam-Japan Joint Evaluation Team 2008 consisted of three Working Groups each of which evaluated different projects. This project was evaluated by the Hydropower Group joined by the following members: Cao Thanh Phu (Ministry of Planning and Investment), Vu Van Thai (Ministry of Industry and Trade: MOIT), Luong Thi An (Electricity of Vietnam: EVN), Nguyen Xuan Thang (EVN), Le Sy Hoi (EVN), Nguyen Thi Hong Thuy (Hydropower Project Management Unit No. 6: HPPMU6), Nguyen Thi Lan Dai (HPPMU6), Nguyen Hong Hai (HPPMU6), Nguyen Tan Vinh (Da Nhim-Ham Thuan-Da Nhim Hydropower Plant: DHD), Nguyen Duy Thinh (DHD), Nguyen Song Anh (National Consultant), Nghiem Ba Hung (National Consultant), Takako Haraguchi (Japanese Consultant). Official Use Only
-
Upload
hoangduong -
Category
Documents
-
view
217 -
download
0
Transcript of Official Use Only Vietnam - jica.go.jp · Hyundai Corporation (Korea). Tomen Corporation (Japan),...
1
Vietnam
Ham Thuan – Da Mi Hydropower Project (1)(2)(3)(4)
Evaluator: Vietnam-Japan Joint Evaluation Team 20081
On-site Survey: November 2008
1. Project Profile and Japanese ODA Loan
Project Site Ham Thuan power house
1.1 Background
In Vietnam, the demand for electricity has been increasing rapidly along with economic
development since the introduction of the doi moi policy in 1986. At the time of the project
appraisal (1994), power shortages had already become a serious problem, especially in central
and southern Vietnam. In the south, it was estimated that the power supply
(12kWh/day/customer) did not meet the potential demand (14-14.4kWh/day/customer). It was
projected that during the period from 1995 to 2000, the power demand would increase by
15.5% p.a. in the entire country and by 17.3% p.a. in the south.
The installed generation capacity as of 1994 was 4,470MW in Vietnam as a whole, and
1,507MW in the south. To meet the demand mentioned above, a maximum output of
4,595-5,390MW in Vietnam and of 1,740-2,290MW in the south was required in 2000.
In 1994, a 500kV transmission line to connect the north and south was commissioned so that
1 The Vietnam-Japan Joint Evaluation Team 2008 consisted of three Working Groups each of which evaluated different projects. This project was evaluated by the Hydropower Group joined by the following members: Cao Thanh Phu (Ministry of Planning and Investment), Vu Van Thai (Ministry of Industry and Trade: MOIT), Luong Thi An (Electricity of Vietnam: EVN), Nguyen Xuan Thang (EVN), Le Sy Hoi (EVN), Nguyen Thi Hong Thuy (Hydropower Project Management Unit No. 6: HPPMU6), Nguyen Thi Lan Dai (HPPMU6), Nguyen Hong Hai (HPPMU6), Nguyen Tan Vinh (Da Nhim-Ham Thuan-Da Nhim Hydropower Plant: DHD), Nguyen Duy Thinh (DHD), Nguyen Song Anh (National Consultant), Nghiem Ba Hung (National Consultant), Takako Haraguchi (Japanese Consultant).
Official
Use Only

2
power shortages in the south could be alleviated by supply from the north. Nevertheless, it was
projected that northern Vietnam would also run short of power in the near future due to rapid
economic development. In sum, even with power supply from other areas, the development of
large-scale power resources was necessary in the south.
1.2 Objective
The objective of the project was to meet the increasing power demand in southern Vietnam
and to enhance irrigation agriculture in Binh Thuan Province by the construction of two
hydropower plants (Ham Thuan and Da Mi) and related facilities along the La Nga River and
the Da Mi River of the Dong Nai River System, thereby contributing to the economic
development of the region.
Logical Framework Applied for Ex-Post Evaluation
Goal Economic development of the region
Purpose 1. To meet the increasing power demand in southern Vietnam
2. To enhance irrigation agriculture in Binh Thuan Province
Outcomes 1. Increase in power supply to the southern area
2. Supply irrigation water to Duc Linh and Tanh Linh districts, Binh Thuan province
Output 1. Ham Thuan Hydropower Plant (HP) 300MW
2. Da Mi Hydropower Plant (HP) 175MW
3. Transmission Lines (T/L) 110 kV and 220 kV
4. Substations (S/S) 110kV and 220kV
5. Consulting services
Input Total cost: 70,145 million Yen
(JBIC loan: 59.623 million Yen; GOV portion: 10,522 million Yen)
1.3 Borrower/ Executing Agency/ Implementing Agency
Borrower: The Government of the Socialist Republic of Vietnam (GOV)
Executing Agency: Power Company No. 2 (PC2) (Electricity of Vietnam (EVN) since
27 Jan. 1995)
Implementing Agency: Hydropower Project Management Unit No.6 (HPPMU6)
1.4 Outline of Loan Agreement
Phase 1 Phase 2 Phase 3 Phase 4
Loan Amount /
Disbursed Amount
17,092
Million Yen /
15,837
Million Yen
4,962 Million Yen
/ 4,796 Million
Yen
4,664Million Yen
/ 4,273 Million
Yen
24,893 Million
Yen / 9,884
Million Yen
3
Phase 1 Phase 2 Phase 3 Phase 4
Date of Exchange
of Notes / Date of
Loan Agreement
EN: April 18,
1995
LA: No. VNII-3
dated April 18,
1995
EN: March 29,
1996
LA: No. VNIII-3
dated March 29,
1996
EN: January, 1997
LA: No. VNIV-3
dated
March 26, 1997
EN: March 30,
1998
LA: No. VNV-3
dated March 30,
1998
Terms and
Conditions
- Interest Rate
- Repayment
Period
(Grace Period)
- Procurement
1.8 % p.a.
30 years
( 10 years)
General Untied
2.3 % p.a.
30 years
(10 years)
General Untied
2.3 % p.a.
30 years
(10 years)
General Untied
1.8 % p.a.
30 years
(10 years)
General Untied
Final
Disbursement Date
September 17,
2002
March 26,
2003
September12,
2004
July 25,
2005
Main Contractors
(over 1 billion JPY)
Tomen Corporation (Japan), Ansaldo Energia SPA (Italy), Fuji Electric Co.
Ltd. (Japan). Hitachi Zosen Corporation (Japan). Ssangyong Corp. (Korea).
Hyundai Corporation (Korea). Tomen Corporation (Japan), Hydraulic
Construction Company No.46 (Vietnam), Ssangyong Engineering &
Construction Co Ltd (Korea), Maeda Corporation (Japan). Kumagai Gumi
Co., Ltd. (Japan), Astaldi SPA. (Italy), Kukdong Engineering &
Construction Co Ltd (Korea). Nissho Iwai Corporation (Japan).
Consulting Services
(over 100 million JPY)
Electric Power Development (Japan), Nippon Koei (Japan).
Feasibility Study 1991 Government of Vietnam
2. Results of Evaluation
2.1 Relevance (Rating: a)
This project has been highly relevant to Vietnam’s national policies and development needs at
the time of both the appraisal and the ex-post evaluation.
2.1.1 Consistency with Vietnamese Development Policies
A high priority on power sector development is continuously seen in the Socio-Economic
Development Plans (SEDP) of both before and after the project. SEDP 1996-2000 (at the
appraisal or ex-ante evaluation stage) emphasized adding to and upgrading power resources
and networks in the Industrial Development Program and the Infrastructure Development
Program. SEDP 2006-2010 (at the ex-post evaluation stage) gives an even higher priority to
4
power sector development than was the case in 1996-2000: electricity is the sector that is first
mentioned in both industrial and infrastructure development plans. A priority on hydropower
development, which can utilize Vietnam’s natural resources and save generation costs, is also
stressed.
As for power sector development plans, The Power Sector Master Plan IV (for 1996-2000
with perspective up to 2010) planned to increase generation capacity from 4,435MW (1994) to
19,000MW (2010). At the ex-post evaluation stage, Power Sector Master Plan VI 2006-2015
plans to increase generation capacity from 12,357MW to 42,000MW through the construction
of power generation plants including 50 hydropower plants. As well as SEDP, hydropower
development is given a high priority in the Power Sector Master Plans.
2.1.2 Consistency with Needs
Table 1 shows basic indicators of power demand and supply at the ex-ante and ex-post
evaluation stages. High demand for power both before and after the project can justify the
necessity for the development of power resources in the south.
On the other hand, given the development of a high-voltage national transmission network,
electricity generated by the project is now supplied not only to the south but to the whole
country. Therefore, the need for the project is also shared nationwide.
Table 1: Basic power indicators
Indicator Ex-ante evaluation stage Ex-post evaluation stage
Power consumption and growth rate
Vietnam 9,198GWh (1994) 51,325GWh (2007) 14.7% p.a. (2000-2007)
South 4,248GWh (1994) 26,646GWh 17-20% p.a. (2000-2007)
Installed generation capacity
Vietnam 4,470MW (1994) 13,512MW (2007)
South 1,507MW (1994) 3,920MW (2007)
Demand forecast
Vietnam 15.5% p.a. (1995-2000) 14,640GWh 30,105GWh
17-20% p.a. (2006-2015)
South 17.3% p.a. (1995-2000) 7,000GWh 15,560GWh
Source: EVN
5
2.2 Efficiency (Rating: b)
While the actual project cost was lower than planned, the project duration was slightly longer
the planned. Therefore, the evaluation for efficiency is moderate.
2.2.1 Output
The project output was produced mostly as planned (see “Comparison of Original and Actual
Scope” on the last page of this report). This consisted of five main components: (i)
construction of the Ham Thuan hydropower plant with reservoir and dam; (ii) construction of
the Da Mi hydropower plant with reservoir and dam; (iii) construction of transmission lines;
(iv) expansion or construction of substations; (v) consulting services; and (vi) development of
resettlement sites. The summary of the output produced is as follows:
Specification of major project output:
・ Two hydropower plants with a designed capacity of 475MW: Ham Thuan plant with
300MW (150MW x 2 units); Da Mi plant with 175MW (87.5MW x 2 units)
・ Two reservoirs with a total volume of 836 million m3: Ham Thuan reservoir with 695
million m3; Da Mi reservoir with 141 million m3
・ Two main dams (rockfill dams): Ham Thuan main dam with a height of 93.5m; Da Mi
main dam with a height of 72m
・ Transmission lines: total 282.2km (171.2km of 220kV lines and 111km of 110kV lines)
・ Four substations (S/S) 110kV and 220kV with a total transformer capacity of 379MVA:
- Expansion of Bao Loc S/S (220/110/35kv – 63MVA and 110/22kV – 25MVA)
- Construction of Phan Thiet S/S (110/22kV – 2 x 25MVA)
- Construction of Duc Linh S/S (110/22kV – 16MVA)
- Construction of Long Thanh S/S (220/110kV – 250MVA)
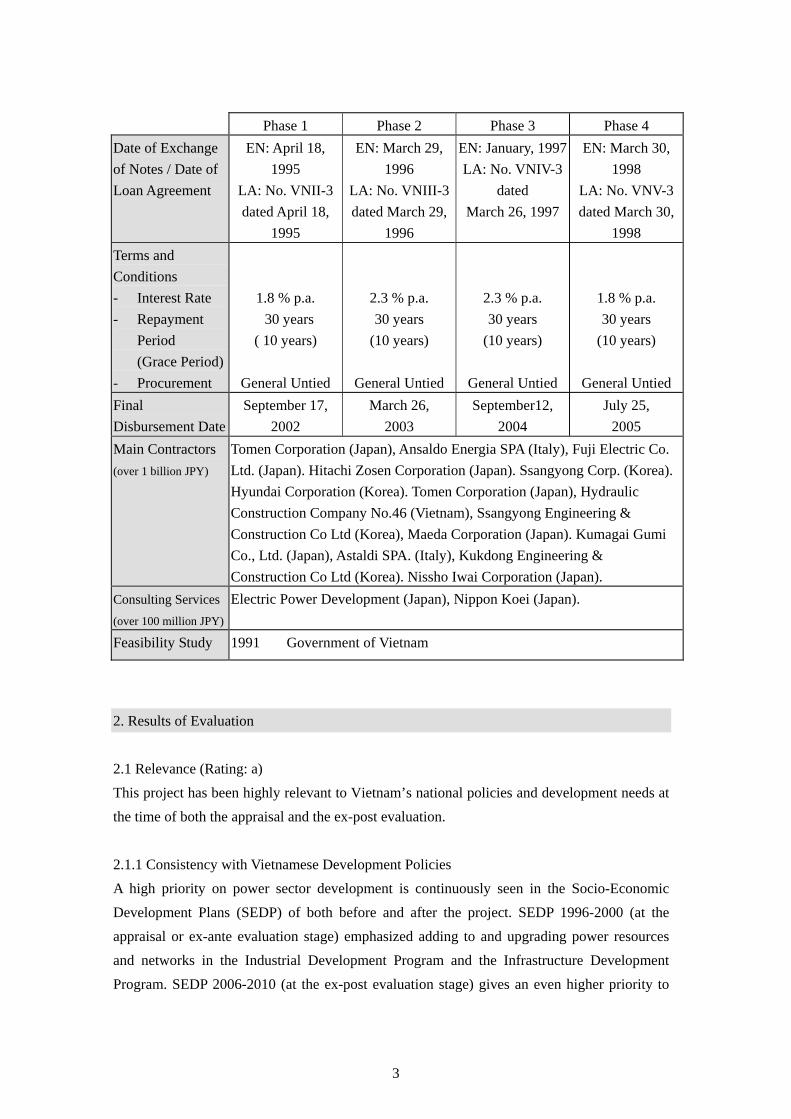
Ham Thuan Reservoir Da Mi main dam and water intake Hàm Thuan power house
As for differences to the original plan (as of the appraisal of Phase 1), the total length of
transmission line was shortened from 495km to 282.2km due to re-routing based on the
6
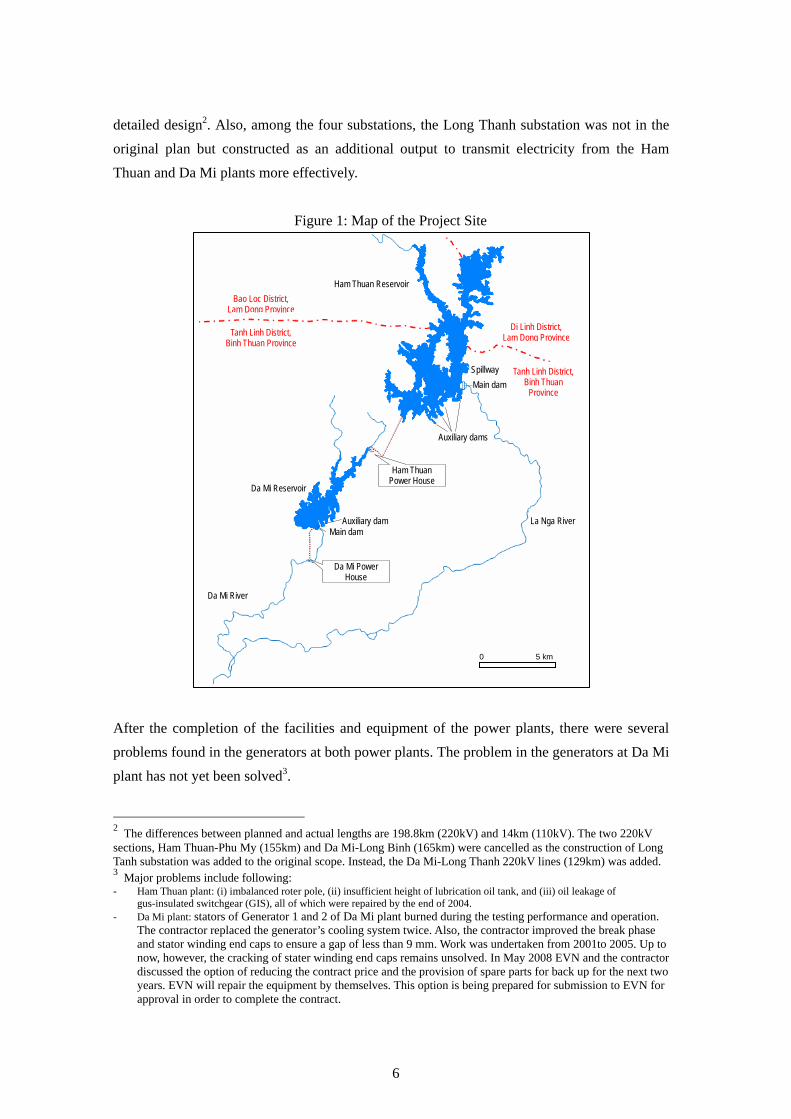
detailed design2. Also, among the four substations, the Long Thanh substation was not in the
original plan but constructed as an additional output to transmit electricity from the Ham
Thuan and Da Mi plants more effectively.
Figure 1: Map of the Project Site
After the completion of the facilities and equipment of the power plants, there were several
problems found in the generators at both power plants. The problem in the generators at Da Mi
plant has not yet been solved3.
2 The differences between planned and actual lengths are 198.8km (220kV) and 14km (110kV). The two 220kV sections, Ham Thuan-Phu My (155km) and Da Mi-Long Binh (165km) were cancelled as the construction of Long Tanh substation was added to the original scope. Instead, the Da Mi-Long Thanh 220kV lines (129km) was added. 3 Major problems include following: - Ham Thuan plant: (i) imbalanced roter pole, (ii) insufficient height of lubrication oil tank, and (iii) oil leakage of
gus-insulated switchgear (GIS), all of which were repaired by the end of 2004. - Da Mi plant: stators of Generator 1 and 2 of Da Mi plant burned during the testing performance and operation.
The contractor replaced the generator’s cooling system twice. Also, the contractor improved the break phase and stator winding end caps to ensure a gap of less than 9 mm. Work was undertaken from 2001to 2005. Up to now, however, the cracking of stater winding end caps remains unsolved. In May 2008 EVN and the contractor discussed the option of reducing the contract price and the provision of spare parts for back up for the next two years. EVN will repair the equipment by themselves. This option is being prepared for submission to EVN for approval in order to complete the contract.
La Nga River
Da Mi Power House
Ham Thuan Power House
Da Mi River
Ham Thuan Reservoir
Da Mi Reservoir
Main dam Auxiliary dam
Main dam
Auxiliary dams
Spillway
Bao Loc District, Lam Dong Province
Tanh Linh District, Binh Thuan Province
Di Linh District, Lam Dong Province
Tanh Linh District, Binh Thuan
Province
0 5 km
7
The consulting services were provided mostly as planned. The major task was assistance in
tender and construction supervision. No problem has been reported regarding the performance
of the consultants.
The development of resettlement sites (related to the construction of reservoirs and
transmission lines) is described in 2.4.3 Impact of Land Acquisition and Resettlement.
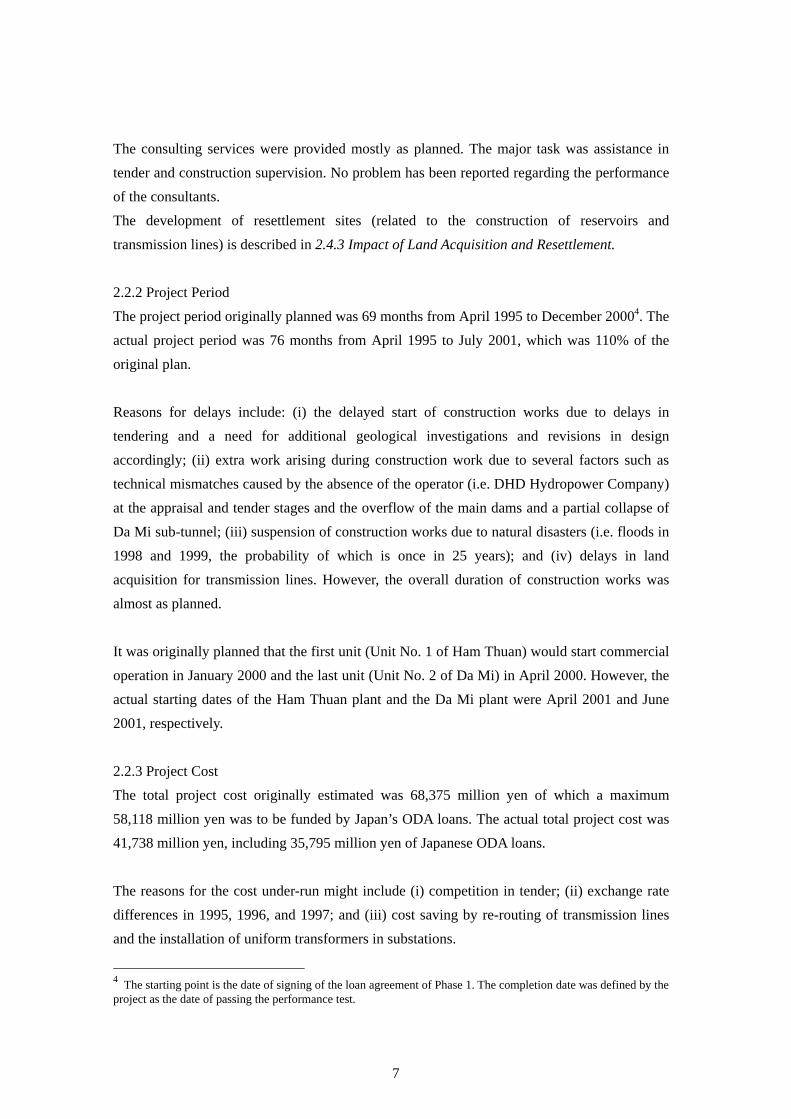
2.2.2 Project Period
The project period originally planned was 69 months from April 1995 to December 20004. The
actual project period was 76 months from April 1995 to July 2001, which was 110% of the
original plan.
Reasons for delays include: (i) the delayed start of construction works due to delays in
tendering and a need for additional geological investigations and revisions in design
accordingly; (ii) extra work arising during construction work due to several factors such as
technical mismatches caused by the absence of the operator (i.e. DHD Hydropower Company)
at the appraisal and tender stages and the overflow of the main dams and a partial collapse of
Da Mi sub-tunnel; (iii) suspension of construction works due to natural disasters (i.e. floods in
1998 and 1999, the probability of which is once in 25 years); and (iv) delays in land
acquisition for transmission lines. However, the overall duration of construction works was
almost as planned.
It was originally planned that the first unit (Unit No. 1 of Ham Thuan) would start commercial
operation in January 2000 and the last unit (Unit No. 2 of Da Mi) in April 2000. However, the
actual starting dates of the Ham Thuan plant and the Da Mi plant were April 2001 and June
2001, respectively.
2.2.3 Project Cost
The total project cost originally estimated was 68,375 million yen of which a maximum
58,118 million yen was to be funded by Japan’s ODA loans. The actual total project cost was
41,738 million yen, including 35,795 million yen of Japanese ODA loans.
The reasons for the cost under-run might include (i) competition in tender; (ii) exchange rate
differences in 1995, 1996, and 1997; and (iii) cost saving by re-routing of transmission lines
and the installation of uniform transformers in substations.
4 The starting point is the date of signing of the loan agreement of Phase 1. The completion date was defined by the project as the date of passing the performance test.
8
2.3 Effectiveness (Rating: a)
After the implementation process of the project, most of the expected outcome was completed
as planned. Therefore, effectiveness of the project is high.
2.3.1 Increase in Power Supply
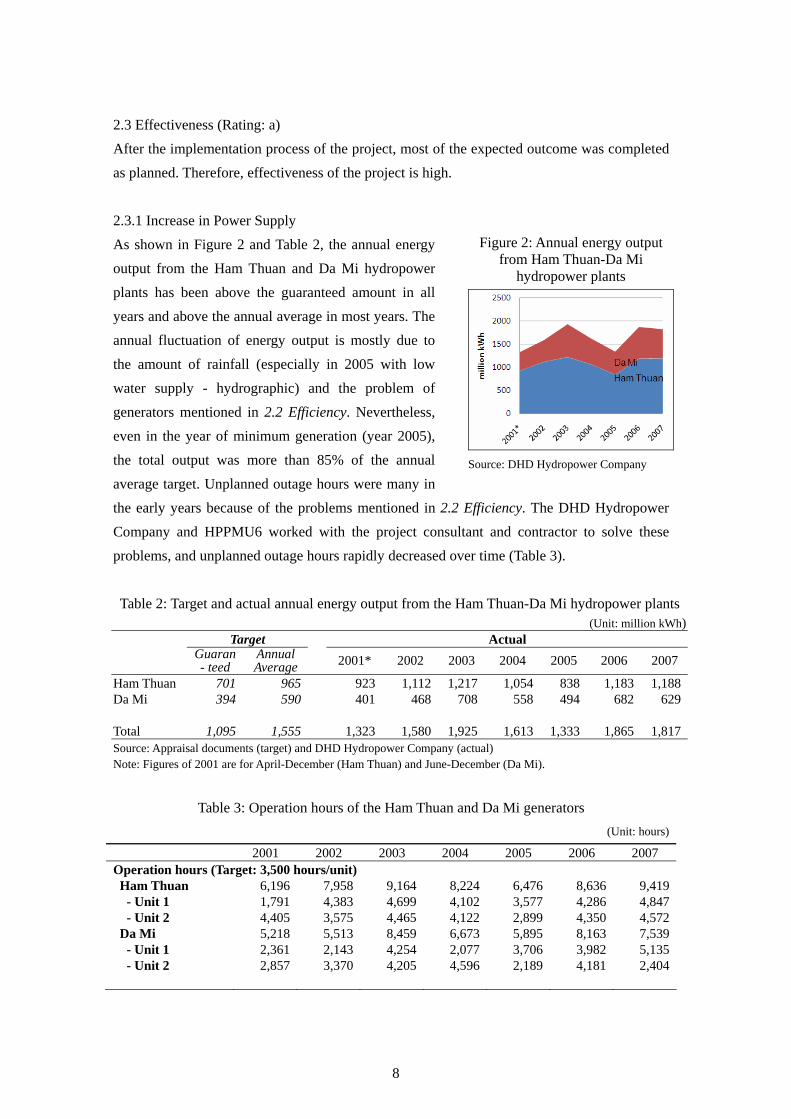
As shown in Figure 2 and Table 2, the annual energy
output from the Ham Thuan and Da Mi hydropower
plants has been above the guaranteed amount in all
years and above the annual average in most years. The
annual fluctuation of energy output is mostly due to
the amount of rainfall (especially in 2005 with low
water supply - hydrographic) and the problem of
generators mentioned in 2.2 Efficiency. Nevertheless,
even in the year of minimum generation (year 2005),
the total output was more than 85% of the annual
average target. Unplanned outage hours were many in
the early years because of the problems mentioned in 2.2 Efficiency. The DHD Hydropower
Company and HPPMU6 worked with the project consultant and contractor to solve these
problems, and unplanned outage hours rapidly decreased over time (Table 3).
Table 2: Target and actual annual energy output from the Ham Thuan-Da Mi hydropower plants(Unit: million kWh)
Target Actual Guaran
- teed Annual Average
2001* 2002 2003 2004 2005 2006 2007
Ham Thuan 701 965 923 1,112 1,217 1,054 838 1,183 1,188Da Mi 394 590 401 468 708 558 494 682 629 Total 1,095 1,555 1,323 1,580 1,925 1,613 1,333 1,865 1,817Source: Appraisal documents (target) and DHD Hydropower Company (actual) Note: Figures of 2001 are for April-December (Ham Thuan) and June-December (Da Mi).
Table 3: Operation hours of the Ham Thuan and Da Mi generators
(Unit: hours)
2001 2002 2003 2004 2005 2006 2007 Operation hours (Target: 3,500 hours/unit) Ham Thuan 6,196 7,958 9,164 8,224 6,476 8,636 9,419
- Unit 1 1,791 4,383 4,699 4,102 3,577 4,286 4,847- Unit 2 4,405 3,575 4,465 4,122 2,899 4,350 4,572
Da Mi 5,218 5,513 8,459 6,673 5,895 8,163 7,539 - Unit 1 2,361 2,143 4,254 2,077 3,706 3,982 5,135 - Unit 2 2,857 3,370 4,205 4,596 2,189 4,181 2,404
Figure 2: Annual energy output from Ham Thuan-Da Mi
hydropower plants
Source: DHD Hydropower Company
9
2001 2002 2003 2004 2005 2006 2007 Unplanned outage hours Ham Thuan 5,182 2,489 51 883 239 98 1
- Unit 1 3,237 1,924 10 368 126 28 0- Unit 2 1,945 565 41 515 113 70 1
Da Mi 3,757 8,005 3,838 7,486 4,232 545 185 - Unit 1 2,360 4,818 1,939 4,941 840 262 150
- Unit 2 1,397 3,187 1,899 2,545 3,392 283 795
Source: DHD Hydropower Company
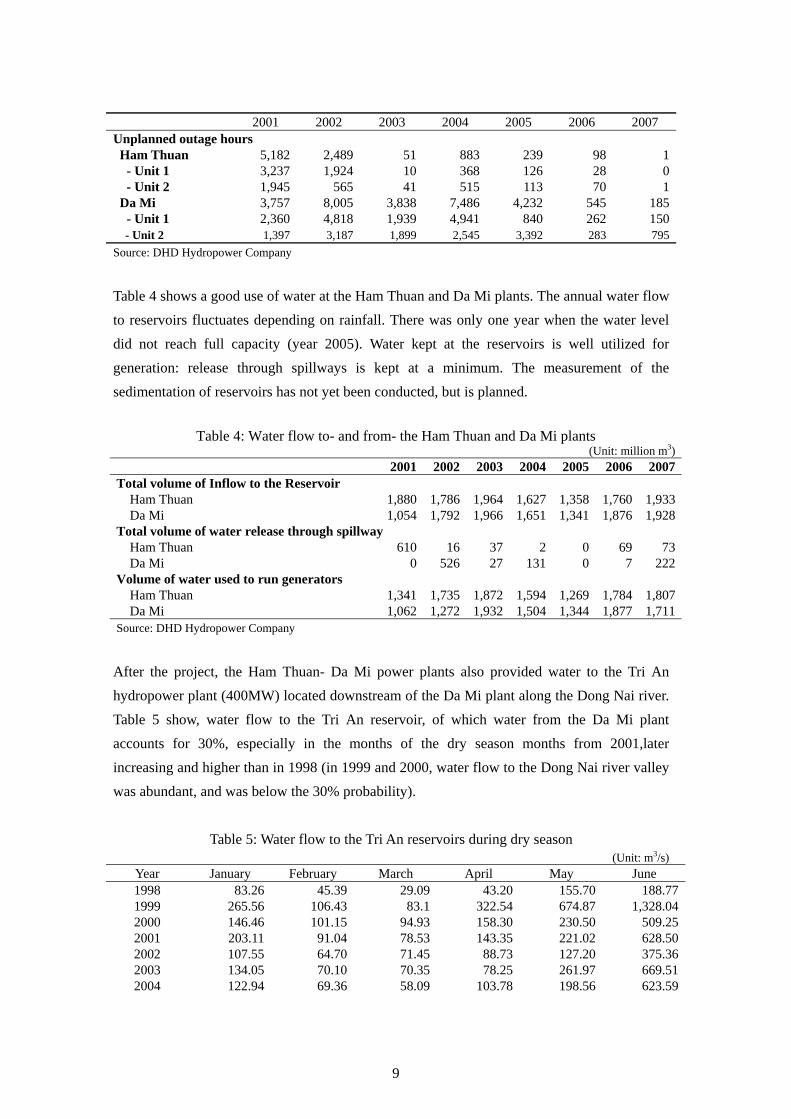
Table 4 shows a good use of water at the Ham Thuan and Da Mi plants. The annual water flow
to reservoirs fluctuates depending on rainfall. There was only one year when the water level
did not reach full capacity (year 2005). Water kept at the reservoirs is well utilized for
generation: release through spillways is kept at a minimum. The measurement of the
sedimentation of reservoirs has not yet been conducted, but is planned.
Table 4: Water flow to- and from- the Ham Thuan and Da Mi plants (Unit: million m3)
2001 2002 2003 2004 2005 2006 2007Total volume of Inflow to the Reservoir
Ham Thuan 1,880 1,786 1,964 1,627 1,358 1,760 1,933Da Mi 1,054 1,792 1,966 1,651 1,341 1,876 1,928
Total volume of water release through spillway Ham Thuan 610 16 37 2 0 69 73Da Mi 0 526 27 131 0 7 222
Volume of water used to run generators Ham Thuan 1,341 1,735 1,872 1,594 1,269 1,784 1,807Da Mi 1,062 1,272 1,932 1,504 1,344 1,877 1,711
Source: DHD Hydropower Company
After the project, the Ham Thuan- Da Mi power plants also provided water to the Tri An
hydropower plant (400MW) located downstream of the Da Mi plant along the Dong Nai river.
Table 5 show, water flow to the Tri An reservoir, of which water from the Da Mi plant
accounts for 30%, especially in the months of the dry season months from 2001,later
increasing and higher than in 1998 (in 1999 and 2000, water flow to the Dong Nai river valley
was abundant, and was below the 30% probability).
Table 5: Water flow to the Tri An reservoirs during dry season (Unit: m3/s)
Year January February March April May June 1998 83.26 45.39 29.09 43.20 155.70 188.771999 265.56 106.43 83.1 322.54 674.87 1,328.042000 146.46 101.15 94.93 158.30 230.50 509.252001 203.11 91.04 78.53 143.35 221.02 628.502002 107.55 64.70 71.45 88.73 127.20 375.362003 134.05 70.10 70.35 78.25 261.97 669.512004 122.94 69.36 58.09 103.78 198.56 623.59
10
Year January February March April May June 2005 64.46 48.89 123.04 72.13 160.02 269.862006 133.01 88.30 91.16 121.83 178.24 262.822007 222.05 56.37 80.74 114.75 263.04 327.03
Source: Tri An hydropower plant
2.3.2 Internal Rate of Return (IRR)
At the appraisal stage, the financial internal rate of return (FIRR) of the project was calculated
at 7.62%, taking investment cost, re-investment cost and operation and maintenance (O&M)
cost as the cost, and revenue from electricity sales as the benefit. For the ex-post evaluation,
FIRR was re-calculated using the actual figures of cost and benefit. The re-calculated FIRR
was 3.52%. This decrease might be because of a lower tariff than estimated at appraisal5. The
economic internal rate of return (EIRR) was not calculated at the appraisal stage.
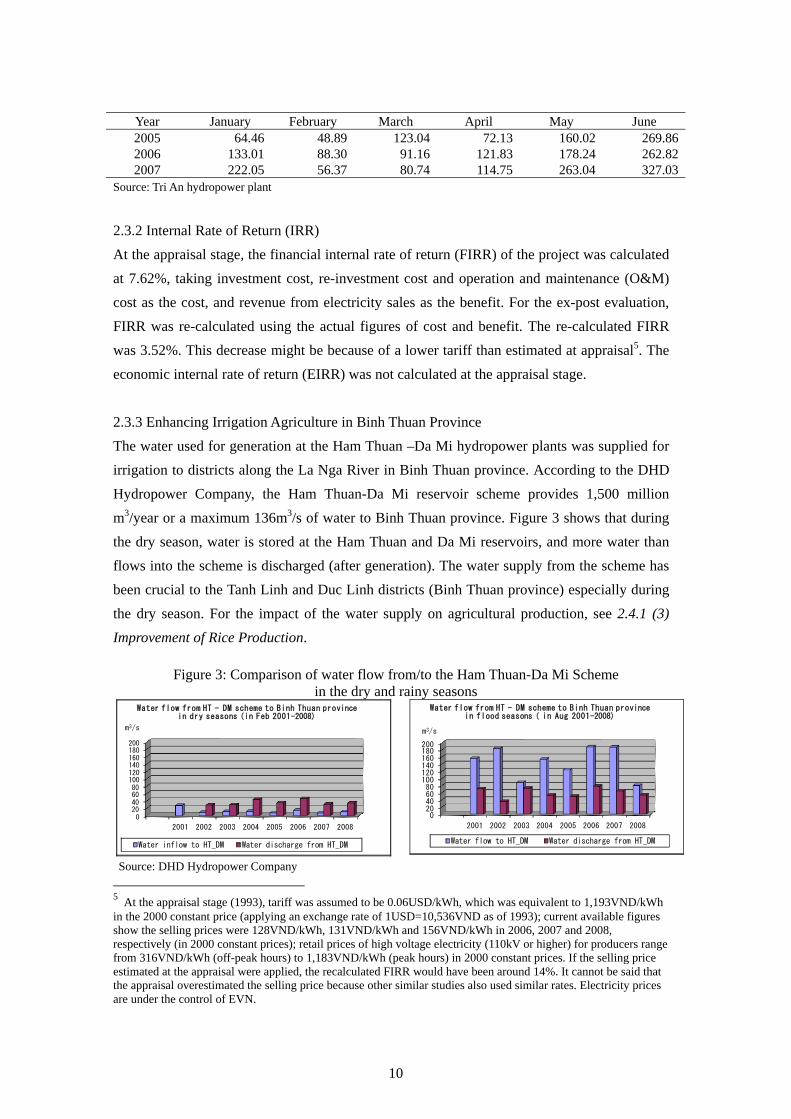
2.3.3 Enhancing Irrigation Agriculture in Binh Thuan Province
The water used for generation at the Ham Thuan –Da Mi hydropower plants was supplied for
irrigation to districts along the La Nga River in Binh Thuan province. According to the DHD
Hydropower Company, the Ham Thuan-Da Mi reservoir scheme provides 1,500 million
m3/year or a maximum 136m3/s of water to Binh Thuan province. Figure 3 shows that during
the dry season, water is stored at the Ham Thuan and Da Mi reservoirs, and more water than
flows into the scheme is discharged (after generation). The water supply from the scheme has
been crucial to the Tanh Linh and Duc Linh districts (Binh Thuan province) especially during
the dry season. For the impact of the water supply on agricultural production, see 2.4.1 (3)
Improvement of Rice Production.
Figure 3: Comparison of water flow from/to the Ham Thuan-Da Mi Scheme
in the dry and rainy seasons
020406080100120140160180200
2001 2002 2003 2004 2005 2006 2007 2008
m3/s
Water flow from HT - DM scheme to Binh Thuan province in dry seasons (in Feb 2001-2008)
Water inflow to HT_DM Water discharge from HT_DM
020406080
100120140160180200
2001 2002 2003 2004 2005 2006 2007 2008
m3/s
Water flow from HT - DM scheme to Binh Thuan province in flood seasons ( in Aug 2001-2008)
Water flow to HT_DM Water discharge from HT_DM
Source: DHD Hydropower Company
5 At the appraisal stage (1993), tariff was assumed to be 0.06USD/kWh, which was equivalent to 1,193VND/kWh in the 2000 constant price (applying an exchange rate of 1USD=10,536VND as of 1993); current available figures show the selling prices were 128VND/kWh, 131VND/kWh and 156VND/kWh in 2006, 2007 and 2008, respectively (in 2000 constant prices); retail prices of high voltage electricity (110kV or higher) for producers range from 316VND/kWh (off-peak hours) to 1,183VND/kWh (peak hours) in 2000 constant prices. If the selling price estimated at the appraisal were applied, the recalculated FIRR would have been around 14%. It cannot be said that the appraisal overestimated the selling price because other similar studies also used similar rates. Electricity prices are under the control of EVN.
11
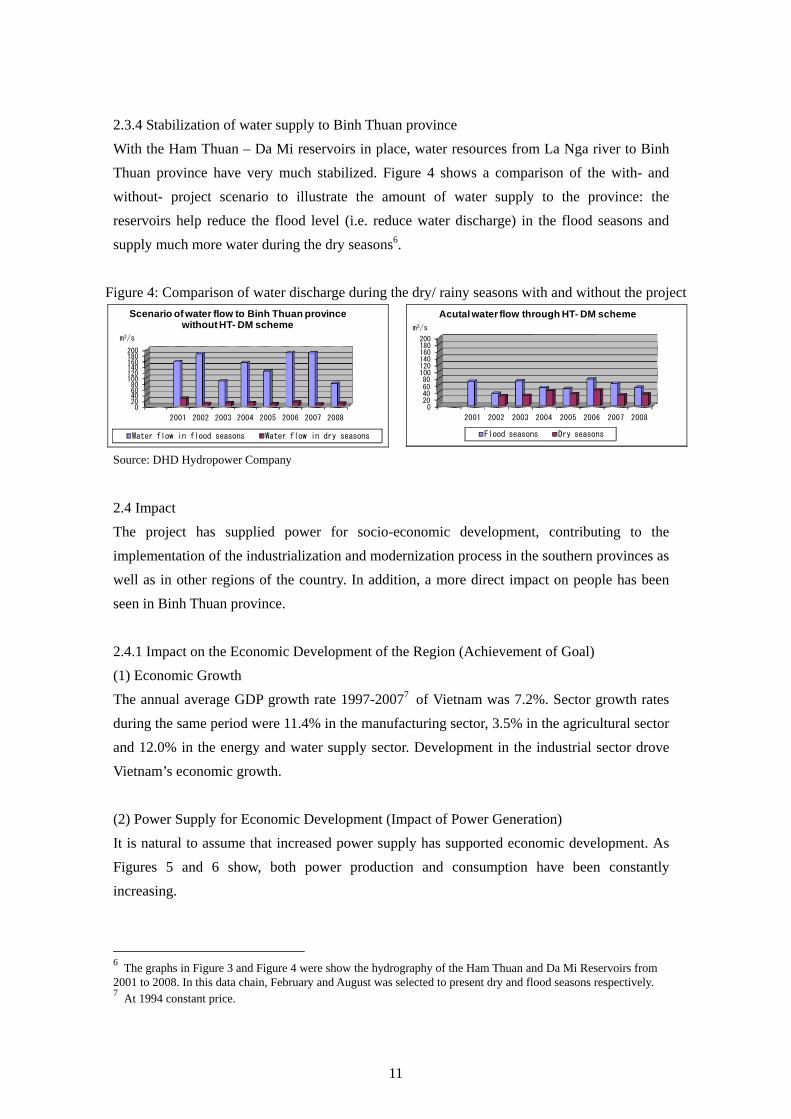
2.3.4 Stabilization of water supply to Binh Thuan province
With the Ham Thuan – Da Mi reservoirs in place, water resources from La Nga river to Binh
Thuan province have very much stabilized. Figure 4 shows a comparison of the with- and
without- project scenario to illustrate the amount of water supply to the province: the
reservoirs help reduce the flood level (i.e. reduce water discharge) in the flood seasons and
supply much more water during the dry seasons6.
Figure 4: Comparison of water discharge during the dry/ rainy seasons with and without the project
020406080100120140160180200
2001 2002 2003 2004 2005 2006 2007 2008
m3/s
Scenario of water flow to Binh Thuan province without HT- DM scheme
Water flow in flood seasons Water flow in dry seasons
020406080100120140160180200
2001 2002 2003 2004 2005 2006 2007 2008
m3/s
Acutal water flow through HT- DM scheme
Flood seasons Dry seasons
Source: DHD Hydropower Company
2.4 Impact
The project has supplied power for socio-economic development, contributing to the
implementation of the industrialization and modernization process in the southern provinces as
well as in other regions of the country. In addition, a more direct impact on people has been
seen in Binh Thuan province.
2.4.1 Impact on the Economic Development of the Region (Achievement of Goal)
(1) Economic Growth
The annual average GDP growth rate 1997-20077 of Vietnam was 7.2%. Sector growth rates
during the same period were 11.4% in the manufacturing sector, 3.5% in the agricultural sector
and 12.0% in the energy and water supply sector. Development in the industrial sector drove
Vietnam’s economic growth.
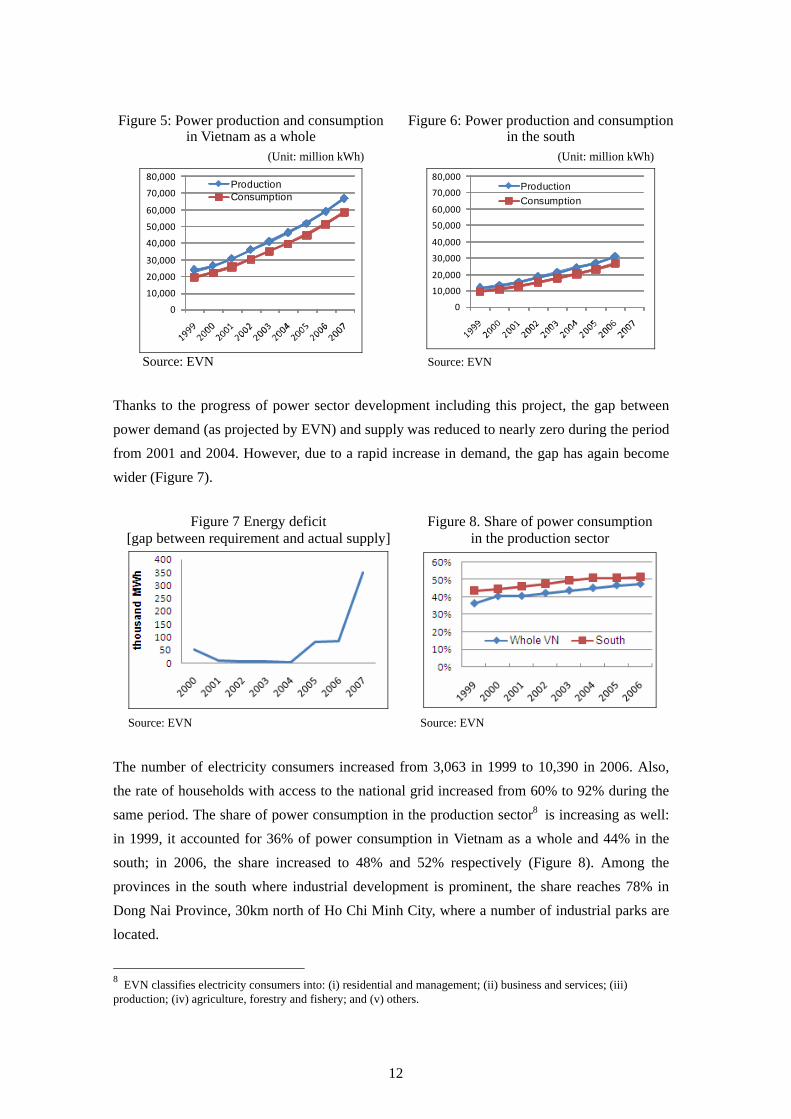
(2) Power Supply for Economic Development (Impact of Power Generation)
It is natural to assume that increased power supply has supported economic development. As
Figures 5 and 6 show, both power production and consumption have been constantly
increasing.
6 The graphs in Figure 3 and Figure 4 were show the hydrography of the Ham Thuan and Da Mi Reservoirs from 2001 to 2008. In this data chain, February and August was selected to present dry and flood seasons respectively. 7 At 1994 constant price.
12
Figure 5: Power production and consumption in Vietnam as a whole
Figure 6: Power production and consumption in the south
(Unit: million kWh)
0
10,000
20,000
30,000
40,000
50,000
60,000
70,000
80,000ProductionConsumption
(Unit: million kWh)
0
10,000
20,000
30,000
40,000
50,000
60,000
70,000
80,000Production
Consumption
Source: EVN Source: EVN
Thanks to the progress of power sector development including this project, the gap between
power demand (as projected by EVN) and supply was reduced to nearly zero during the period
from 2001 and 2004. However, due to a rapid increase in demand, the gap has again become
wider (Figure 7).
Figure 7 Energy deficit [gap between requirement and actual supply]
Figure 8. Share of power consumption in the production sector
Source: EVN Source: EVN
The number of electricity consumers increased from 3,063 in 1999 to 10,390 in 2006. Also,
the rate of households with access to the national grid increased from 60% to 92% during the
same period. The share of power consumption in the production sector8 is increasing as well:
in 1999, it accounted for 36% of power consumption in Vietnam as a whole and 44% in the
south; in 2006, the share increased to 48% and 52% respectively (Figure 8). Among the
provinces in the south where industrial development is prominent, the share reaches 78% in
Dong Nai Province, 30km north of Ho Chi Minh City, where a number of industrial parks are
located.
8 EVN classifies electricity consumers into: (i) residential and management; (ii) business and services; (iii) production; (iv) agriculture, forestry and fishery; and (v) others.
13
As power generated at the Ham Thuan-Da Mi hydropower plants is sent to the national grid
through the 220kV transmission network, benefits of this project reach the entire country and
contribute to the increase in power supply mentioned above. Using data on power production,
it can be calculated that electricity output from the Ham Thuan-Da Mi hydropower plants
accounted for 3.6% of the power generated in the whole country or 7.0% of the power
generated in the south in 2006. Also, the population benefiting from this project can be
calculated at approximately 3 million people by dividing the output from the Ham Thuan-Da
Mi hydropower plants by per capita power consumption (609kWh in 2006).
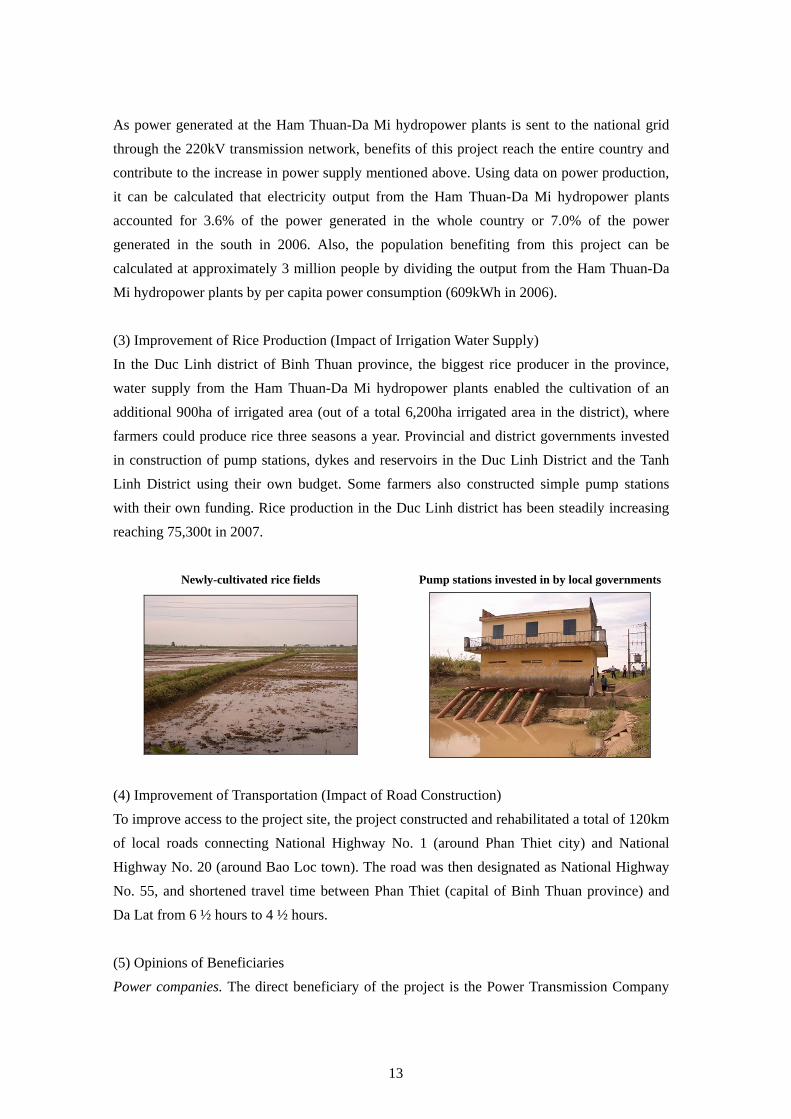
(3) Improvement of Rice Production (Impact of Irrigation Water Supply)
In the Duc Linh district of Binh Thuan province, the biggest rice producer in the province,
water supply from the Ham Thuan-Da Mi hydropower plants enabled the cultivation of an
additional 900ha of irrigated area (out of a total 6,200ha irrigated area in the district), where
farmers could produce rice three seasons a year. Provincial and district governments invested
in construction of pump stations, dykes and reservoirs in the Duc Linh District and the Tanh
Linh District using their own budget. Some farmers also constructed simple pump stations
with their own funding. Rice production in the Duc Linh district has been steadily increasing
reaching 75,300t in 2007.
Newly-cultivated rice fields Pump stations invested in by local governments
(4) Improvement of Transportation (Impact of Road Construction)
To improve access to the project site, the project constructed and rehabilitated a total of 120km
of local roads connecting National Highway No. 1 (around Phan Thiet city) and National
Highway No. 20 (around Bao Loc town). The road was then designated as National Highway
No. 55, and shortened travel time between Phan Thiet (capital of Binh Thuan province) and
Da Lat from 6 ½ hours to 4 ½ hours.
(5) Opinions of Beneficiaries
Power companies. The direct beneficiary of the project is the Power Transmission Company
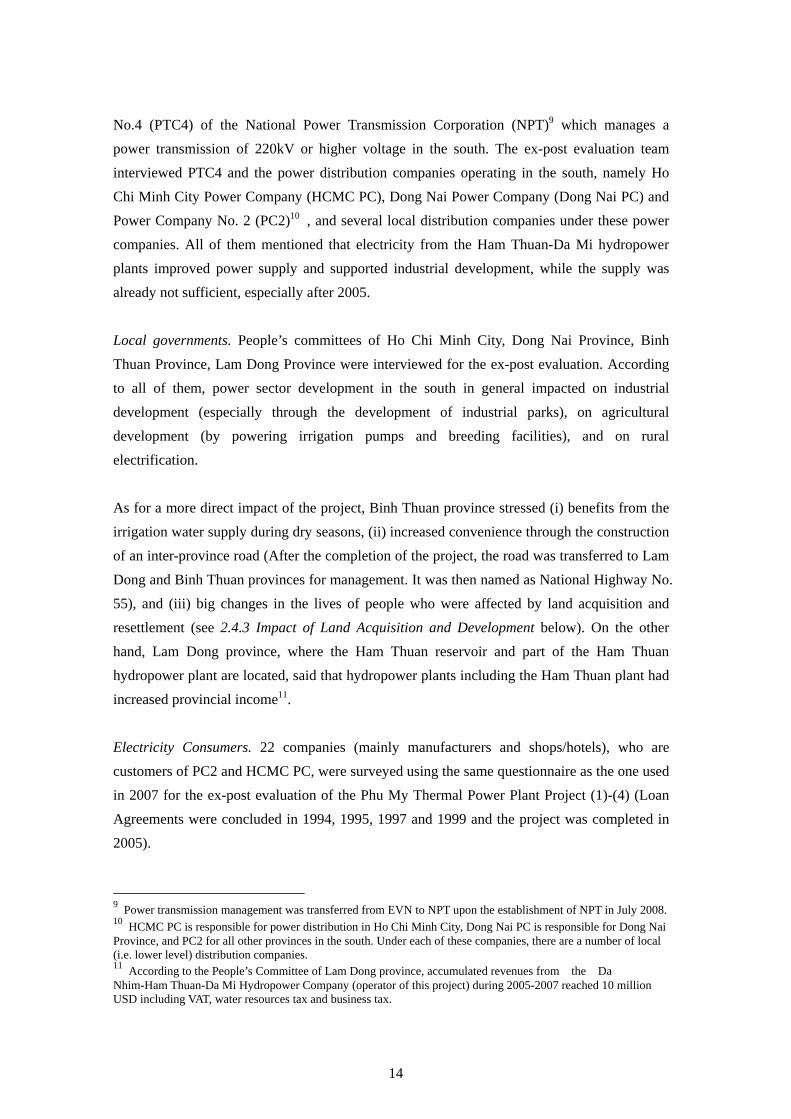
14
No.4 (PTC4) of the National Power Transmission Corporation (NPT)9 which manages a
power transmission of 220kV or higher voltage in the south. The ex-post evaluation team
interviewed PTC4 and the power distribution companies operating in the south, namely Ho
Chi Minh City Power Company (HCMC PC), Dong Nai Power Company (Dong Nai PC) and
Power Company No. 2 (PC2)10 , and several local distribution companies under these power
companies. All of them mentioned that electricity from the Ham Thuan-Da Mi hydropower
plants improved power supply and supported industrial development, while the supply was
already not sufficient, especially after 2005.
Local governments. People’s committees of Ho Chi Minh City, Dong Nai Province, Binh
Thuan Province, Lam Dong Province were interviewed for the ex-post evaluation. According
to all of them, power sector development in the south in general impacted on industrial
development (especially through the development of industrial parks), on agricultural
development (by powering irrigation pumps and breeding facilities), and on rural
electrification.
As for a more direct impact of the project, Binh Thuan province stressed (i) benefits from the
irrigation water supply during dry seasons, (ii) increased convenience through the construction
of an inter-province road (After the completion of the project, the road was transferred to Lam
Dong and Binh Thuan provinces for management. It was then named as National Highway No.
55), and (iii) big changes in the lives of people who were affected by land acquisition and
resettlement (see 2.4.3 Impact of Land Acquisition and Development below). On the other
hand, Lam Dong province, where the Ham Thuan reservoir and part of the Ham Thuan
hydropower plant are located, said that hydropower plants including the Ham Thuan plant had
increased provincial income11.
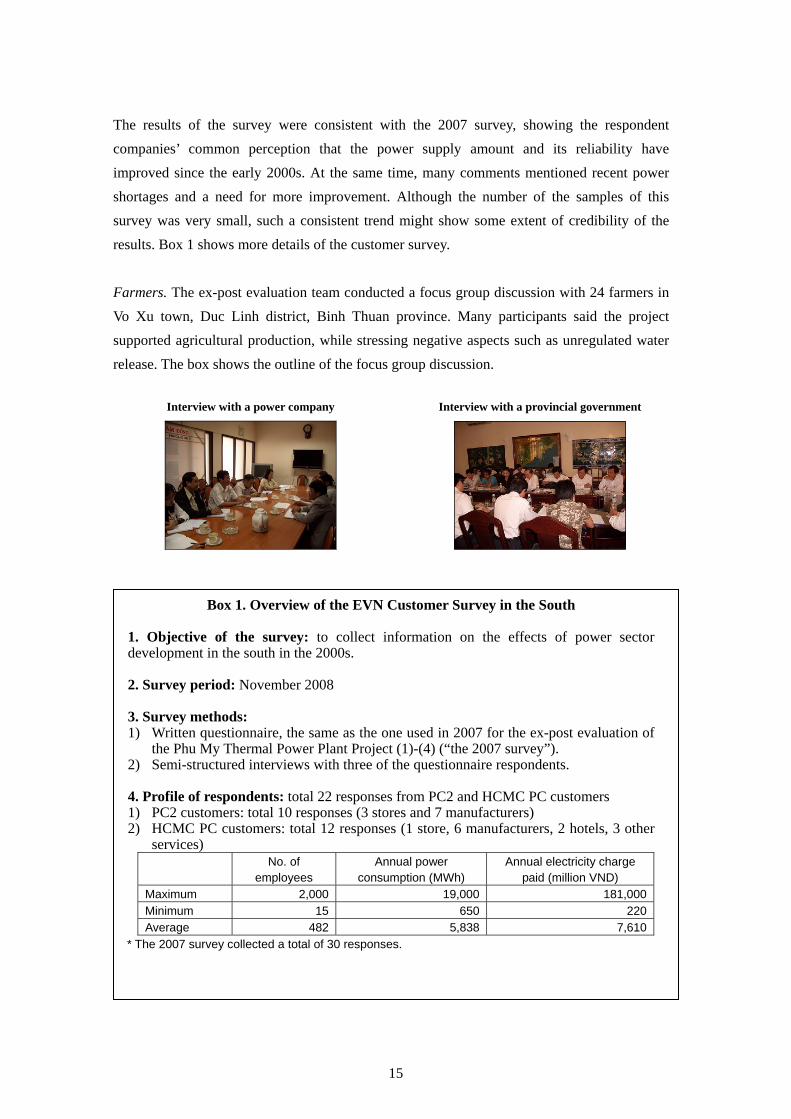
Electricity Consumers. 22 companies (mainly manufacturers and shops/hotels), who are
customers of PC2 and HCMC PC, were surveyed using the same questionnaire as the one used
in 2007 for the ex-post evaluation of the Phu My Thermal Power Plant Project (1)-(4) (Loan
Agreements were concluded in 1994, 1995, 1997 and 1999 and the project was completed in
2005).
9 Power transmission management was transferred from EVN to NPT upon the establishment of NPT in July 2008. 10 HCMC PC is responsible for power distribution in Ho Chi Minh City, Dong Nai PC is responsible for Dong Nai Province, and PC2 for all other provinces in the south. Under each of these companies, there are a number of local (i.e. lower level) distribution companies. 11 According to the People’s Committee of Lam Dong province, accumulated revenues from the Da Nhim-Ham Thuan-Da Mi Hydropower Company (operator of this project) during 2005-2007 reached 10 million USD including VAT, water resources tax and business tax.
15
The results of the survey were consistent with the 2007 survey, showing the respondent
companies’ common perception that the power supply amount and its reliability have
improved since the early 2000s. At the same time, many comments mentioned recent power
shortages and a need for more improvement. Although the number of the samples of this
survey was very small, such a consistent trend might show some extent of credibility of the
results. Box 1 shows more details of the customer survey.
Farmers. The ex-post evaluation team conducted a focus group discussion with 24 farmers in
Vo Xu town, Duc Linh district, Binh Thuan province. Many participants said the project
supported agricultural production, while stressing negative aspects such as unregulated water
release. The box shows the outline of the focus group discussion.
Interview with a power company Interview with a provincial government
Box 1. Overview of the EVN Customer Survey in the South 1. Objective of the survey: to collect information on the effects of power sector development in the south in the 2000s. 2. Survey period: November 2008 3. Survey methods: 1) Written questionnaire, the same as the one used in 2007 for the ex-post evaluation of
the Phu My Thermal Power Plant Project (1)-(4) (“the 2007 survey”). 2) Semi-structured interviews with three of the questionnaire respondents. 4. Profile of respondents: total 22 responses from PC2 and HCMC PC customers 1) PC2 customers: total 10 responses (3 stores and 7 manufacturers) 2) HCMC PC customers: total 12 responses (1 store, 6 manufacturers, 2 hotels, 3 other
services) No. of
employees Annual power
consumption (MWh) Annual electricity charge
paid (million VND) Maximum 2,000 19,000 181,000 Minimum 15 650 220 Average 482 5,838 7,610
* The 2007 survey collected a total of 30 responses.
16
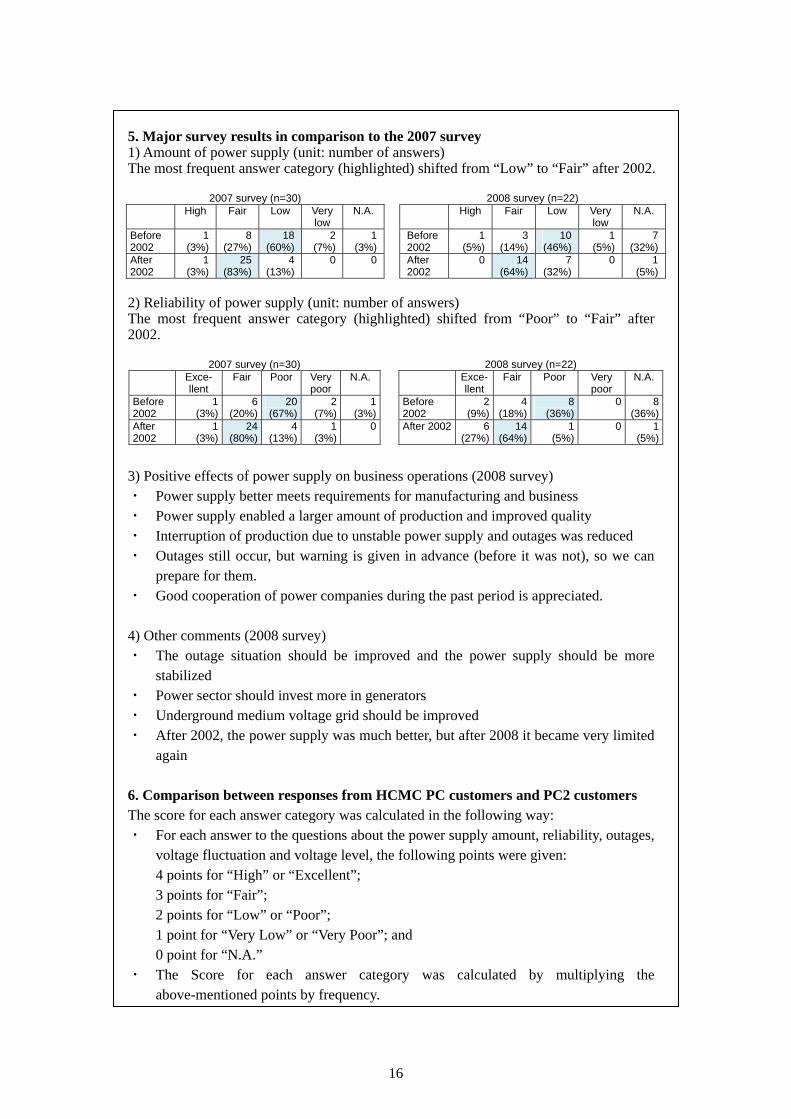
5. Major survey results in comparison to the 2007 survey 1) Amount of power supply (unit: number of answers) The most frequent answer category (highlighted) shifted from “Low” to “Fair” after 2002.
2007 survey (n=30) 2008 survey (n=22)
High Fair Low Very low
N.A. High Fair Low Very low
N.A.
Before 2002
1 (3%)
8 (27%)
18 (60%)
2(7%)
1(3%)
Before 2002
1(5%)
3(14%)
10 (46%)
1 (5%)
7(32%)
After 2002
1 (3%)
25 (83%)
4 (13%)
0 0 After 2002
0 14(64%)
7 (32%)
0 1(5%)
2) Reliability of power supply (unit: number of answers) The most frequent answer category (highlighted) shifted from “Poor” to “Fair” after 2002.
2007 survey (n=30) 2008 survey (n=22) Exce-
llent Fair Poor Very
poorN.A. Exce-
llentFair Poor Very
poor N.A.
Before 2002
1 (3%)
6 (20%)
20 (67%)
2(7%)
1(3%)
Before 2002
2(9%)
4(18%)
8 (36%)
0 8(36%)
After 2002
1 (3%)
24 (80%)
4 (13%)
1(3%)
0 After 2002 6(27%)
14(64%)
1 (5%)
0 1(5%)
3) Positive effects of power supply on business operations (2008 survey) ・ Power supply better meets requirements for manufacturing and business ・ Power supply enabled a larger amount of production and improved quality ・ Interruption of production due to unstable power supply and outages was reduced ・ Outages still occur, but warning is given in advance (before it was not), so we can
prepare for them. ・ Good cooperation of power companies during the past period is appreciated. 4) Other comments (2008 survey) ・ The outage situation should be improved and the power supply should be more
stabilized ・ Power sector should invest more in generators ・ Underground medium voltage grid should be improved ・ After 2002, the power supply was much better, but after 2008 it became very limited
again 6. Comparison between responses from HCMC PC customers and PC2 customers The score for each answer category was calculated in the following way: ・ For each answer to the questions about the power supply amount, reliability, outages,
voltage fluctuation and voltage level, the following points were given: 4 points for “High” or “Excellent”; 3 points for “Fair”; 2 points for “Low” or “Poor”; 1 point for “Very Low” or “Very Poor”; and 0 point for “N.A.”
・ The Score for each answer category was calculated by multiplying the above-mentioned points by frequency.
17
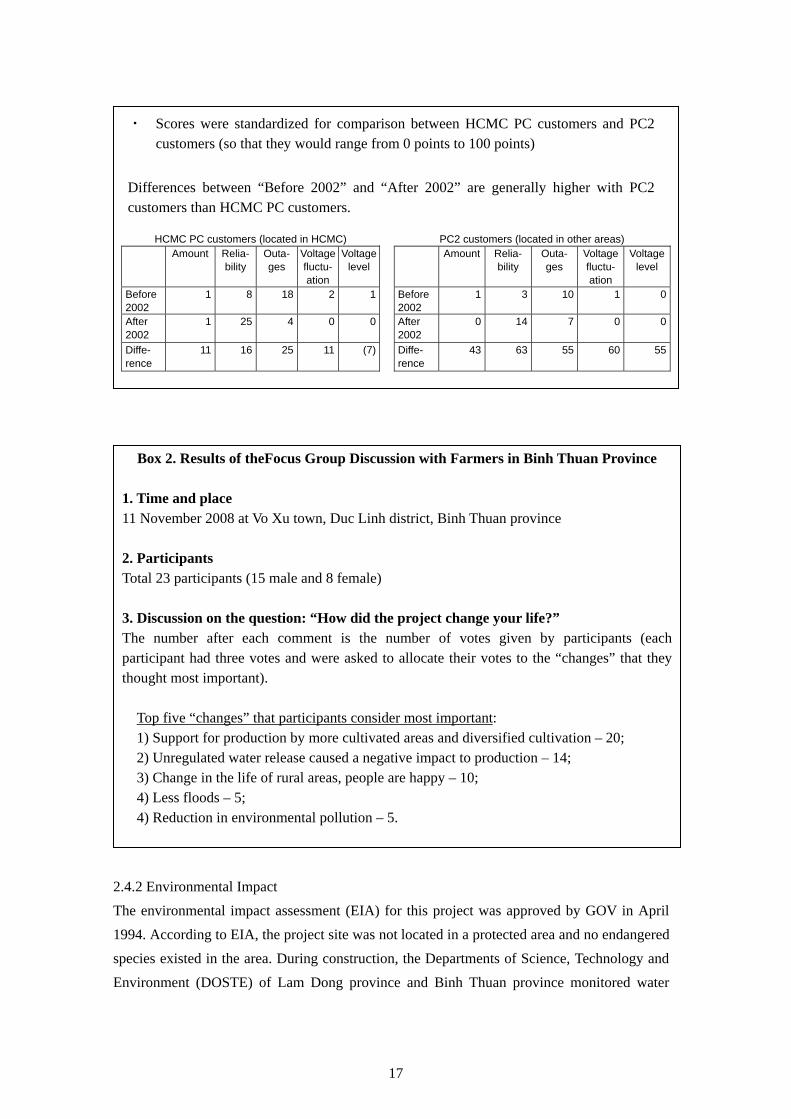
・ Scores were standardized for comparison between HCMC PC customers and PC2 customers (so that they would range from 0 points to 100 points)
Differences between “Before 2002” and “After 2002” are generally higher with PC2 customers than HCMC PC customers.
HCMC PC customers (located in HCMC) PC2 customers (located in other areas) Amount Relia-
bility Outa- ges
Voltage fluctu- ation
Voltage level
Amount Relia- bility
Outa- ges
Voltage fluctu- ation
Voltage level
Before 2002
1 8 18 2 1 Before 2002
1 3 10 1 0
After 2002
1 25 4 0 0 After 2002
0 14 7 0 0
Diffe- rence
11 16 25 11 (7) Diffe- rence
43 63 55 60 55
2.4.2 Environmental Impact
The environmental impact assessment (EIA) for this project was approved by GOV in April
1994. According to EIA, the project site was not located in a protected area and no endangered
species existed in the area. During construction, the Departments of Science, Technology and
Environment (DOSTE) of Lam Dong province and Binh Thuan province monitored water
Box 2. Results of theFocus Group Discussion with Farmers in Binh Thuan Province 1. Time and place 11 November 2008 at Vo Xu town, Duc Linh district, Binh Thuan province 2. Participants Total 23 participants (15 male and 8 female) 3. Discussion on the question: “How did the project change your life?” The number after each comment is the number of votes given by participants (each participant had three votes and were asked to allocate their votes to the “changes” that they thought most important).
Top five “changes” that participants consider most important: 1) Support for production by more cultivated areas and diversified cultivation – 20; 2) Unregulated water release caused a negative impact to production – 14; 3) Change in the life of rural areas, people are happy – 10; 4) Less floods – 5; 4) Reduction in environmental pollution – 5.
18
quality, air quality, noise level and vibration level once a month. After the hand-over, the DHD
Hydropower Company has been monitoring water, air, noise and vibration once a year.
According to the results of monitoring and interviews with the provincial governments and the
DHD Hydropower Company, no environmental problem has been detected.
2.4.3 Impact of Land Acquisition and Resettlement
(1) Affected Areas and Population
A total of 6,827ha of land was acquired for the project: 3,144ha for reservoirs, 3,175ha for the
power plants, 64ha for roads and 444ha for transmission lines and substations12. Accordingly,
a total of 3,209 households were affected and thus compensated/assisted by the project:
- 823 households moved out of the reservoir areas. Among them, 150 households moved
to the resettlement site in the La Da commune, Ham Thuan Bac district, Binh Thuan
province, which was developed by the project, and others moved to nearby districts in
the same province such as Bao Lam district and Di Linh district. Most of these had
already moved out of the reservoir areas when the project appraisal was conducted13.
- 345 households removed their houses from land acquired for transmission lines and
substations.
- Some part of the land, trees and crops of the remaining 2,041 households was affected.
(2) Compensation and Support by the Project
The project provided the following compensation and/or support to people affected, with close
consultation with the local authority:
- For 150 households in La Da commune: the building of (i) 150 houses (main house,
kitchen and poultry house) and 3ha of cultivation area next to each house, (ii) 1 clinic,
(iii) 1 primary school, (iv) a commune road, and (v) irrigation schemes. Cash payment
was not made.
- For people who moved to the Loc Nam commune, the Bao Lam commune and the Hoa
Bac commune, Di Linh district: 30.4 billion VND for the building of irrigation schemes
(including 1 reservoir/dam for the irrigation of 100-140ha for each district) and a total
12.9 billion VND for support in moving and agriculture.
- For people affected by land acquisition for transmission lines and substations: 44.5
billion VND in cash as compensation.
12 No planned figures are mentioned in appraisal documents. 13 Residents around the reservoir areas belong to the K’ho tribe, an ethnic minority group, who had traditionally practiced shifting cultivation. Among the affected people, 66 households had already been resettled in the La Da commune, where their relatives had lived, and 84 households were identified as additional subjects for resettlement. As those 84 households wanted to move to the La Da commune, the project prepared 150 houses, including ones for people who had moved in earlier to avoid conflicts between new and old settlers.
19
HPPMU6 still has close communication with the commune, district and provincial
governments to follow-up on the above-mentioned infrastructure.
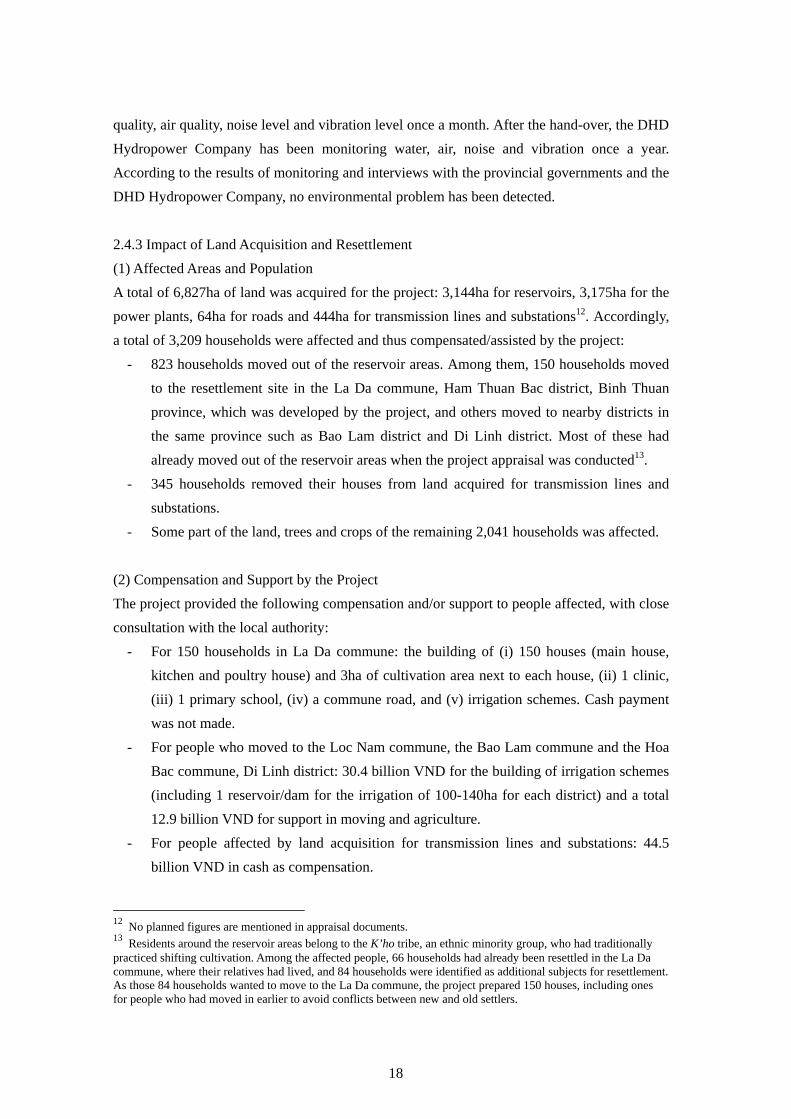
(3) Impact of Land Acquisition and Resettlement
Basic indicators. Statistics from the La Da commune show significant changes in many
aspects of people’s lives after the project developed the commune as the resettlement site
(Table 5).
Table 5: Basic statistics of the La Da commune (resettlement site) Before the project (1995) After the project (2007)
Total area 11,212ha
Population 600 households (K’ho tribe)
Household electrification rate 0% 100%
Access to clean water 0% 100%
Household motorcycle ownership rate 13% 70%
Household TV ownership rate 12% 90%
Per capita food consumption 89kg/year 320kg/year
Cultivated area 7,673ha 1,700ha
Cropping season per year 1 2-3
Livestock head 200 head Over 1,000 head
Number of children per family Sometimes 13 4
Number of primary schools 2 3 (*)
Number of secondary schools 1 1
Number of health clinics 0 1(*)
Source: La Da commune People’ Committee Note: Additional primary schools and health clinics are the ones constructed by the project.
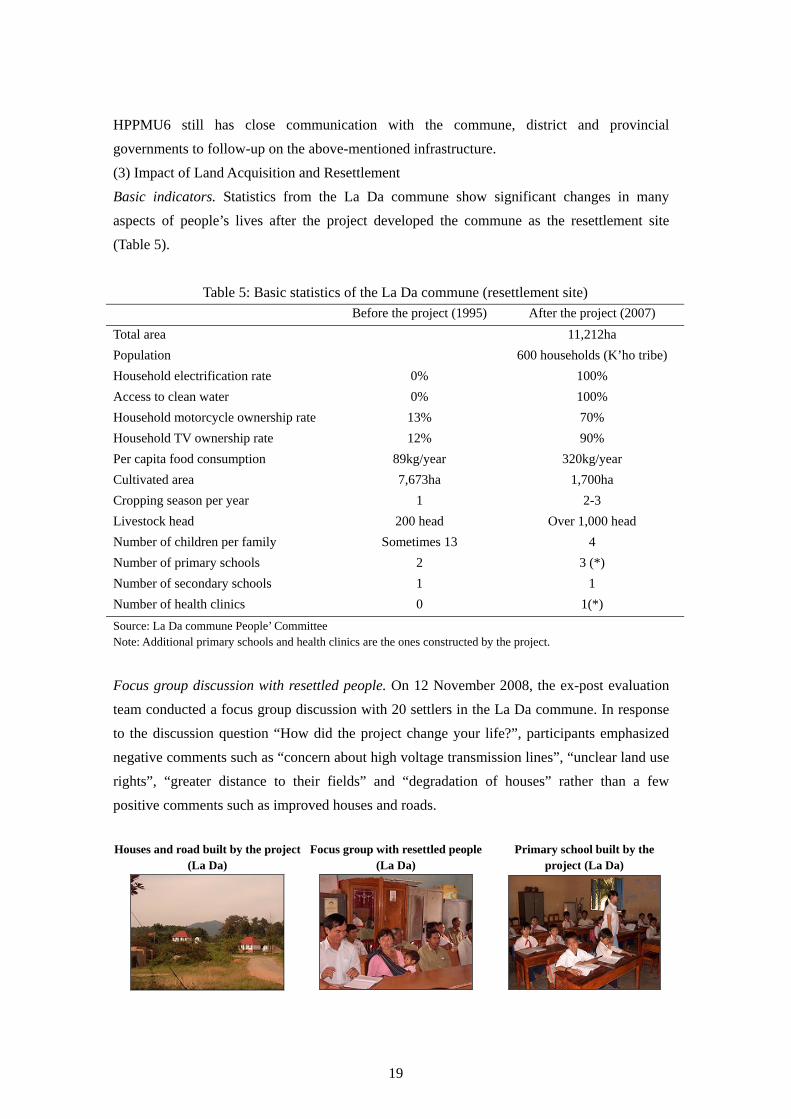
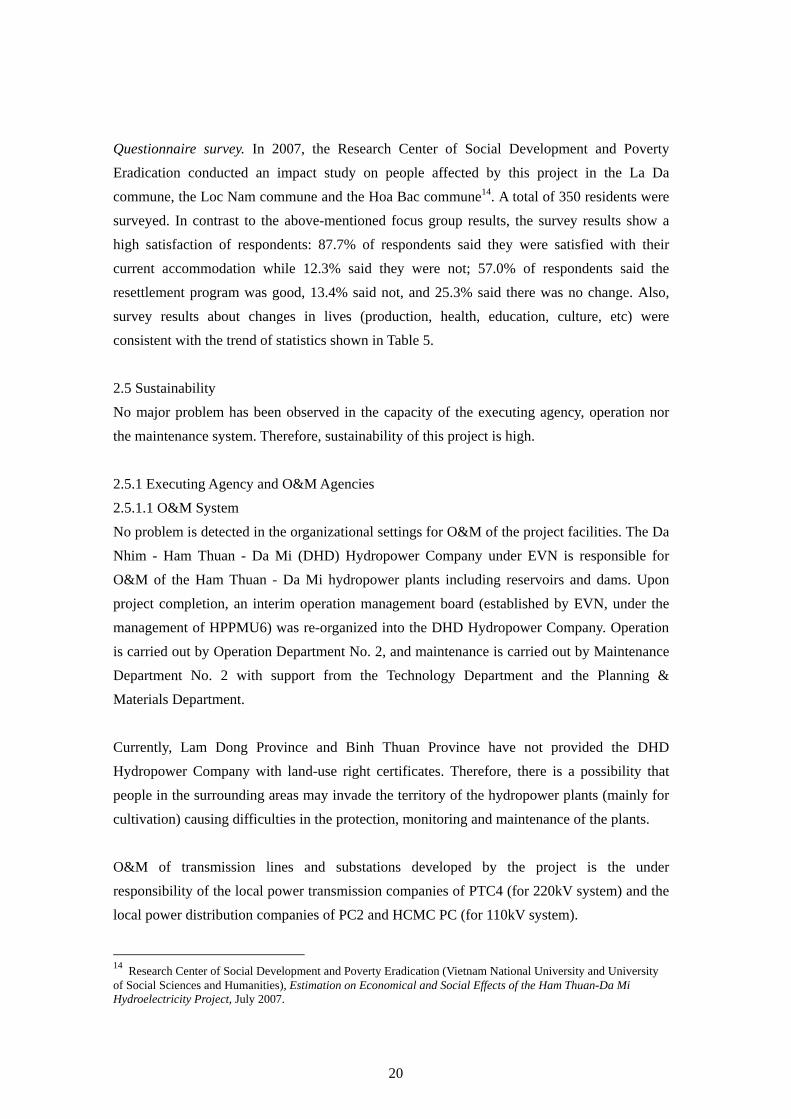
Focus group discussion with resettled people. On 12 November 2008, the ex-post evaluation
team conducted a focus group discussion with 20 settlers in the La Da commune. In response
to the discussion question “How did the project change your life?”, participants emphasized
negative comments such as “concern about high voltage transmission lines”, “unclear land use
rights”, “greater distance to their fields” and “degradation of houses” rather than a few
positive comments such as improved houses and roads.
Houses and road built by the project
(La Da) Focus group with resettled people
(La Da) Primary school built by the
project (La Da)
20
Questionnaire survey. In 2007, the Research Center of Social Development and Poverty
Eradication conducted an impact study on people affected by this project in the La Da
commune, the Loc Nam commune and the Hoa Bac commune14. A total of 350 residents were
surveyed. In contrast to the above-mentioned focus group results, the survey results show a
high satisfaction of respondents: 87.7% of respondents said they were satisfied with their
current accommodation while 12.3% said they were not; 57.0% of respondents said the
resettlement program was good, 13.4% said not, and 25.3% said there was no change. Also,
survey results about changes in lives (production, health, education, culture, etc) were
consistent with the trend of statistics shown in Table 5.
2.5 Sustainability
No major problem has been observed in the capacity of the executing agency, operation nor
the maintenance system. Therefore, sustainability of this project is high.
2.5.1 Executing Agency and O&M Agencies
2.5.1.1 O&M System
No problem is detected in the organizational settings for O&M of the project facilities. The Da
Nhim - Ham Thuan - Da Mi (DHD) Hydropower Company under EVN is responsible for
O&M of the Ham Thuan - Da Mi hydropower plants including reservoirs and dams. Upon
project completion, an interim operation management board (established by EVN, under the
management of HPPMU6) was re-organized into the DHD Hydropower Company. Operation
is carried out by Operation Department No. 2, and maintenance is carried out by Maintenance
Department No. 2 with support from the Technology Department and the Planning &
Materials Department.
Currently, Lam Dong Province and Binh Thuan Province have not provided the DHD
Hydropower Company with land-use right certificates. Therefore, there is a possibility that
people in the surrounding areas may invade the territory of the hydropower plants (mainly for
cultivation) causing difficulties in the protection, monitoring and maintenance of the plants.
O&M of transmission lines and substations developed by the project is the under
responsibility of the local power transmission companies of PTC4 (for 220kV system) and the
local power distribution companies of PC2 and HCMC PC (for 110kV system).
14 Research Center of Social Development and Poverty Eradication (Vietnam National University and University of Social Sciences and Humanities), Estimation on Economical and Social Effects of the Ham Thuan-Da Mi Hydroelectricity Project, July 2007.
21
2.5.1.2 O&M Technical Capacity
The technical capacity of O&M staff is basically sufficient, although there are some areas
where they need to rely on suppliers for repair.
The Operation Department of the DHD Hydropower Company has 48 staff including 12
Engineers. The Maintenance Department has 42 staff including 20 Engineers. According to
DHD, the number and qualifications of the staff are sufficient for the O&M of most project
facilities. As for training, 30 staff members of the Hydropower Company were trained by
manufacturers and suppliers during the project. After completion, the Hydropower Company
has continuously provided in-service training for its O&M staff. O&M activities are carried
out according to the established procedures based upon O&M documents or equipment
suppliers.
Most of the maintenance works are carried out by the DHD Hydropower Company themselves,
but some must still be outsourced to a manufacturer who sells genuine equipment and services
(e.g., Governor systems, excitation control systems from suppliers), which might affect timely
maintenance and repair.
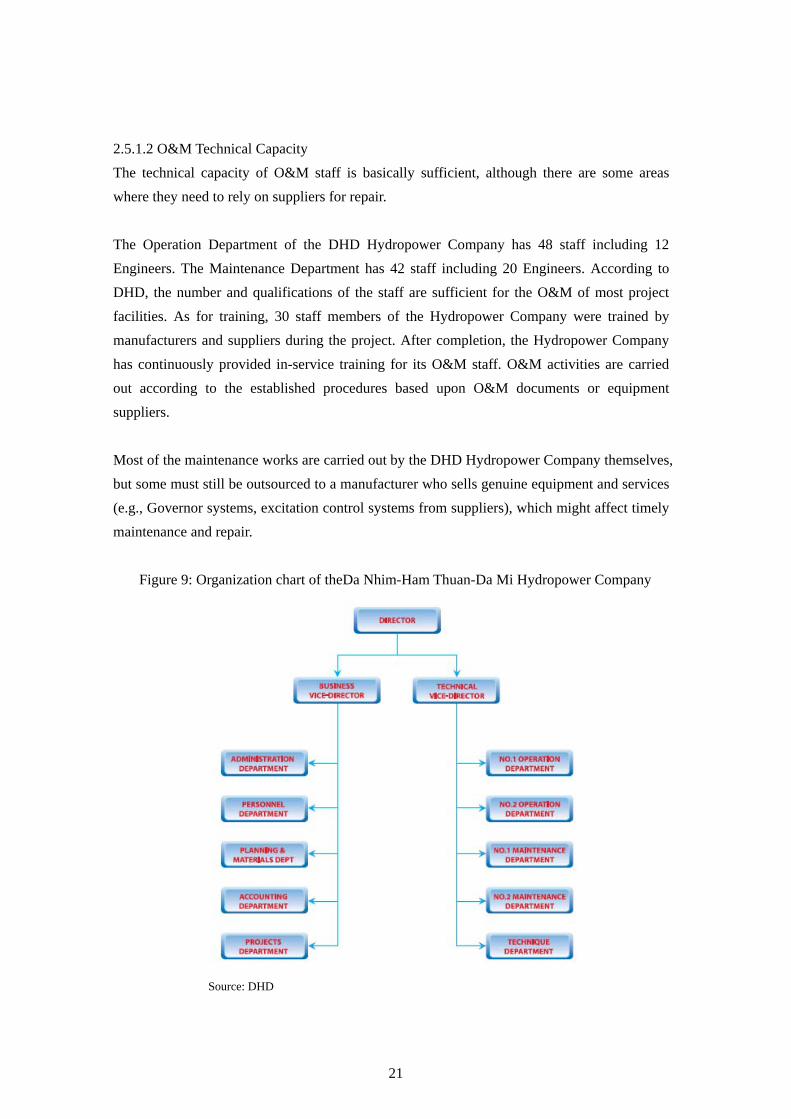
Figure 9: Organization chart of theDa Nhim-Ham Thuan-Da Mi Hydropower Company
Source: DHD
22
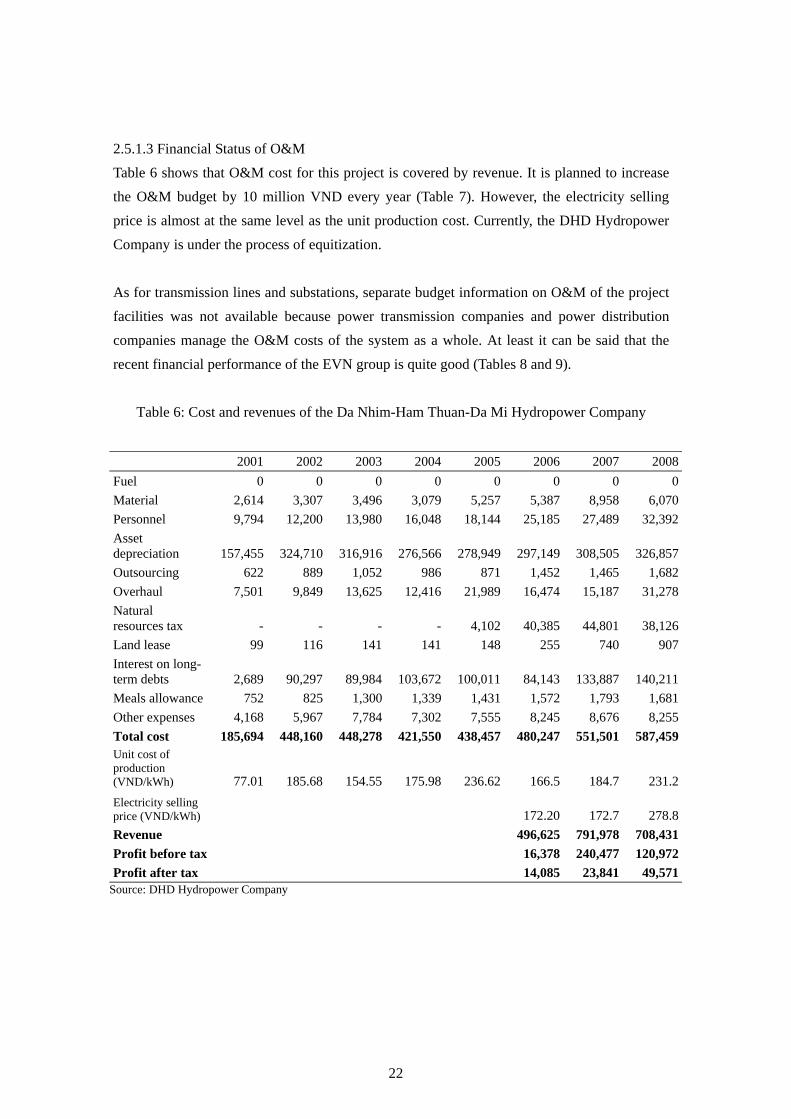
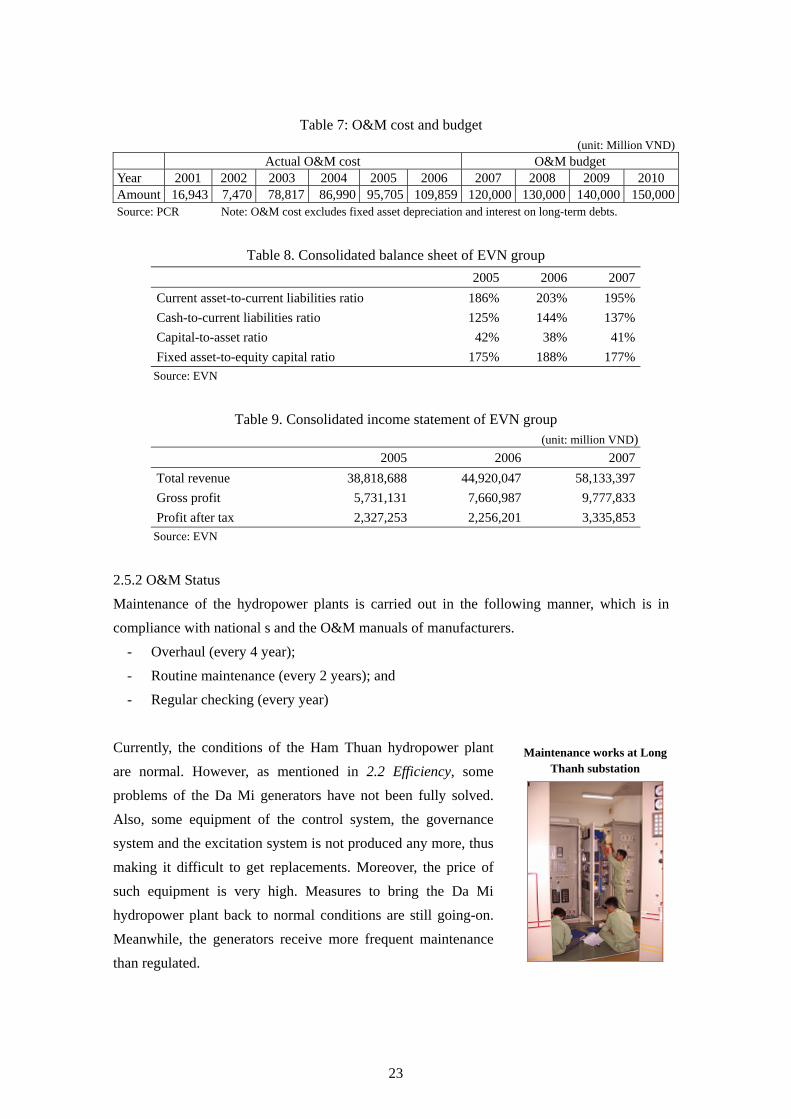
2.5.1.3 Financial Status of O&M
Table 6 shows that O&M cost for this project is covered by revenue. It is planned to increase
the O&M budget by 10 million VND every year (Table 7). However, the electricity selling
price is almost at the same level as the unit production cost. Currently, the DHD Hydropower
Company is under the process of equitization.
As for transmission lines and substations, separate budget information on O&M of the project
facilities was not available because power transmission companies and power distribution
companies manage the O&M costs of the system as a whole. At least it can be said that the
recent financial performance of the EVN group is quite good (Tables 8 and 9).
Table 6: Cost and revenues of the Da Nhim-Ham Thuan-Da Mi Hydropower Company
2001 2002 2003 2004 2005 2006 2007 2008
Fuel 0 0 0 0 0 0 0 0
Material 2,614 3,307 3,496 3,079 5,257 5,387 8,958 6,070
Personnel 9,794 12,200 13,980 16,048 18,144 25,185 27,489 32,392
Asset depreciation 157,455 324,710 316,916 276,566 278,949 297,149 308,505 326,857
Outsourcing 622 889 1,052 986 871 1,452 1,465 1,682
Overhaul 7,501 9,849 13,625 12,416 21,989 16,474 15,187 31,278
Natural resources tax - - - - 4,102 40,385 44,801 38,126
Land lease 99 116 141 141 148 255 740 907
Interest on long- term debts
2,689
90,297 89,984 103,672 100,011 84,143
133,887 140,211
Meals allowance 752 825 1,300 1,339 1,431 1,572 1,793 1,681
Other expenses 4,168 5,967 7,784 7,302 7,555 8,245 8,676 8,255
Total cost 185,694 448,160 448,278 421,550 438,457 480,247 551,501 587,459Unit cost of production (VND/kWh) 77.01 185.68 154.55 175.98 236.62 166.5 184.7 231.2
Electricity selling price (VND/kWh)
172.20 172.7 278.8
Revenue 496,625 791,978 708,431
Profit before tax 16,378 240,477 120,972
Profit after tax 14,085 23,841 49,571Source: DHD Hydropower Company
23
Table 7: O&M cost and budget (unit: Million VND)
Actual O&M cost O&M budget Year 2001 2002 2003 2004 2005 2006 2007 2008 2009 2010 Amount 16,943 7,470 78,817 86,990 95,705 109,859 120,000 130,000 140,000 150,000Source: PCR Note: O&M cost excludes fixed asset depreciation and interest on long-term debts.
Table 8. Consolidated balance sheet of EVN group
2005 2006 2007
Current asset-to-current liabilities ratio 186% 203% 195%
Cash-to-current liabilities ratio 125% 144% 137%
Capital-to-asset ratio 42% 38% 41%
Fixed asset-to-equity capital ratio 175% 188% 177%
Source: EVN
Table 9. Consolidated income statement of EVN group (unit: million VND)
2005 2006 2007
Total revenue 38,818,688 44,920,047 58,133,397
Gross profit 5,731,131 7,660,987 9,777,833
Profit after tax 2,327,253 2,256,201 3,335,853 Source: EVN
2.5.2 O&M Status
Maintenance of the hydropower plants is carried out in the following manner, which is in
compliance with national s and the O&M manuals of manufacturers.
- Overhaul (every 4 year);
- Routine maintenance (every 2 years); and
- Regular checking (every year)
Currently, the conditions of the Ham Thuan hydropower plant
are normal. However, as mentioned in 2.2 Efficiency, some
problems of the Da Mi generators have not been fully solved.
Also, some equipment of the control system, the governance
system and the excitation system is not produced any more, thus
making it difficult to get replacements. Moreover, the price of
such equipment is very high. Measures to bring the Da Mi
hydropower plant back to normal conditions are still going-on.
Meanwhile, the generators receive more frequent maintenance
than regulated.
Maintenance works at Long Thanh substation
24
3. Conclusion, Lessons Learned and Recommendations
3.1 Conclusion
From the findings described above, this project can be evaluated at highly satisfactory.
3.2 Lessons Learned
(1) Project preparation
・ Land acquisition and compensation were carried out well due to the support of local
authorities and related agencies. Especially, the provision of land use rights, crops and
forestry products for the protection of forests was timely, with the assistance of GOV and
local authorities. The following considerations taken by the project could become good
practices for future projects:
- Encouraging people to understand government policies on hydropower construction;
- Creation of favorable conditions in land acquisition as follows:
+ After the land inventory is finalized with local people, local authorities allowed
the contractors/sub-contractors to start construction.
+ A task force was established to handle the forest tree issue in acquiring land in a
timely manner for construction.
+ The compensation and support scheme was quickly appraised and approve to
speed-up disbursement to tlocal people.
+ All obstacles were solved in a timely manner by the local authorities.
- Maintenance of a regular good relationship with the province, district and commune
People Committees, in a spirit of cooperation and collaboration to fulfill the tasks.
- All obstacles should be discussed and solved with mutual understanding and
concerns based upon the government’s policies and regulations.
- Minimization of the use of official letters and report (if not necessary). The use of
these management tools is always time consuming and ineffective.
・ Geology conditions were different from the survey & investigation even according to
procedure – random sampling. Surveys should have been done in better way (i.e. by
increasing the number of investigation drills) to avoid delays due to re-investigation and
re-design at the construction stage.
(2) Implementation
・ With the participation of operation agencies in the construction stage (i.e. as a member of
the interim operation management board), experience was enriched for O&M. Future
projects could follow this good practice as a means to improve sustainability.
(3) Operation and maintenance
・ Incorporate technical transfer. In the construction of hydropower plant projects, if
25
financial conditions allow, the investor could consider buying technology and know-how
of manufacturing as well as copy rights (technology transfer) for key equipment such as:
the governor system, excitation system, control system and protection control system.
Technology transfer would help a project be less dependent on the original equipment
supplier and minimize operation stoppages.
3.3 Recommendations
(1) Completion of all project components
・ The DHD Hydropower Company should continue measures to solve the problems of the
Da Mi generators seeking advice from HPPMU6.
(2) Improvement of the operation system
・ Lam Dong and Binh Thuan should quickly provide land use rights to the Ham Thuan-Da
Mi hydropower plant so that the power plants and related facilities can be properly
operated and maintained without encroachment by people in the surrounding areas.
26
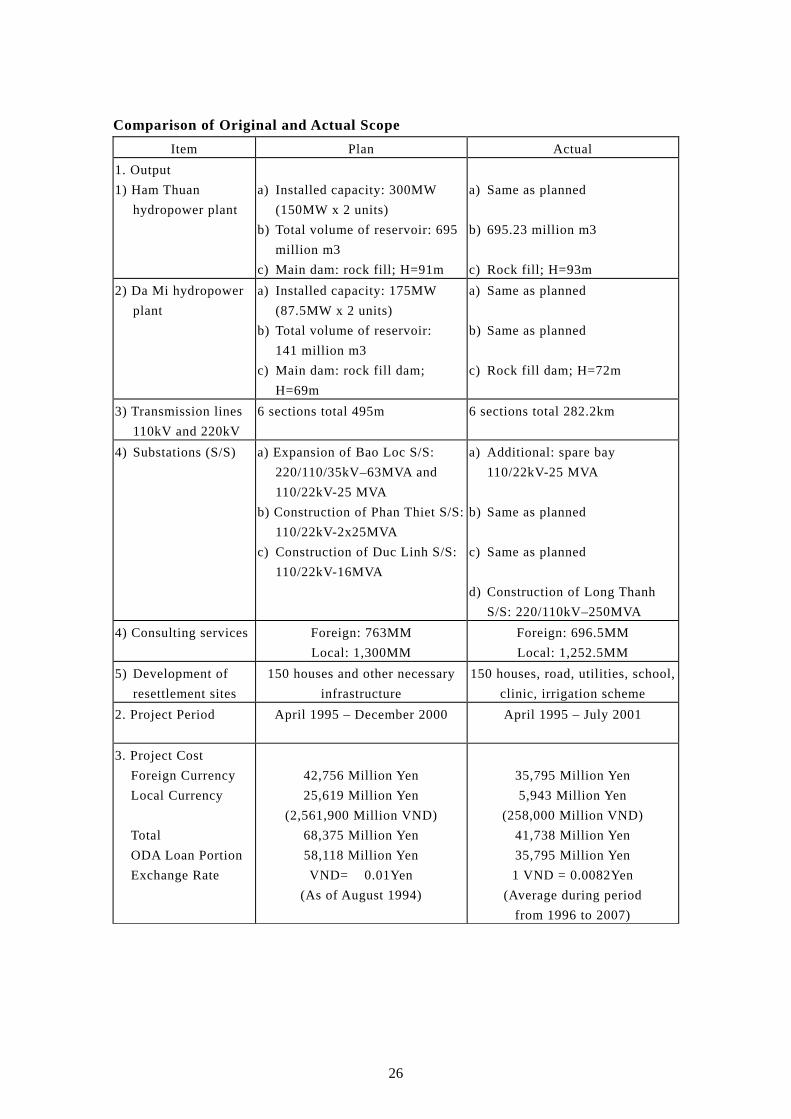
Comparison of Original and Actual Scope
Item Plan Actual
1. Output
1) Ham Thuan
hydropower plant
a) Installed capacity: 300MW
(150MW x 2 units)
b) Total volume of reservoir: 695
million m3
c) Main dam: rock fill; H=91m
a) Same as planned
b) 695.23 million m3
c) Rock fill; H=93m
2) Da Mi hydropower
plant
a) Installed capacity: 175MW
(87.5MW x 2 units)
b) Total volume of reservoir:
141 million m3
c) Main dam: rock fill dam;
H=69m
a) Same as planned
b) Same as planned
c) Rock fill dam; H=72m
3) Transmission lines
110kV and 220kV
6 sections total 495m
6 sections total 282.2km
4) Substations (S/S) a) Expansion of Bao Loc S/S:
220/110/35kV–63MVA and
110/22kV-25 MVA
b) Construction of Phan Thiet S/S:
110/22kV-2x25MVA
c) Construction of Duc Linh S/S:
110/22kV-16MVA
a) Additional: spare bay
110/22kV-25 MVA
b) Same as planned
c) Same as planned
d) Construction of Long Thanh
S/S: 220/110kV–250MVA
4) Consulting services Foreign: 763MM
Local: 1,300MM
Foreign: 696.5MM
Local: 1,252.5MM
5) Development of
resettlement sites
150 houses and other necessary
infrastructure
150 houses, road, utilities, school,
clinic, irrigation scheme
2. Project Period
April 1995 – December 2000 April 1995 – July 2001
3. Project Cost
Foreign Currency
Local Currency
Total
ODA Loan Portion
Exchange Rate
42,756 Million Yen
25,619 Million Yen
(2,561,900 Million VND)
68,375 Million Yen
58,118 Million Yen
VND= 0.01Yen
(As of August 1994)
35,795 Million Yen
5,943 Million Yen
(258,000 Million VND)
41,738 Million Yen
35,795 Million Yen
1 VND = 0.0082Yen
(Average during period
from 1996 to 2007)