Official PDF , 164 pages
164
December 2014 FHM – Technical review and support Jakarta Flood Management System Including Sunter, Cakung, Marunda and upper Cideng Ciliwung diversions and Cisadane Final Report – phase 2 Public Disclosure Authorized Public Disclosure Authorized Public Disclosure Authorized Public Disclosure Authorized Public Disclosure Authorized Public Disclosure Authorized Public Disclosure Authorized Public Disclosure Authorized
-
Upload
truongcong -
Category
Documents
-
view
227 -
download
2
Transcript of Official PDF , 164 pages

December 2014
FHM – Technical review and support Jakarta Flood Management System Including Sunter, Cakung, Marunda and upper Cideng
Ciliwung diversions and Cisadane
Final Report – phase 2
Pub
lic D
iscl
osur
e A
utho
rized
Pub
lic D
iscl
osur
e A
utho
rized
Pub
lic D
iscl
osur
e A
utho
rized
Pub
lic D
iscl
osur
e A
utho
rized
Pub
lic D
iscl
osur
e A
utho
rized
Pub
lic D
iscl
osur
e A
utho
rized
Pub
lic D
iscl
osur
e A
utho
rized
Pub
lic D
iscl
osur
e A
utho
rized
WB406484
Typewritten Text
95806
Technical review and support Jakarta
Flood Management System
Final Report - phase 2
© Deltares, 2014

December 2014, Final Report - Phase 2
Technical review and support Jakarta Flood Management System
i
Contents
1 Introduction 1 1.1 Background 1 1.2 Introduction to the project 2 1.3 Polder systems 2 1.4 Project Tasks 4 1.5 Report outline 5
2 Kamal / Tanjungan polder 7 2.1 Description of the area 7 2.2 Pump scheme alternatives 8
2.2.1 A1 – Kamal and Tanjungan as separate systems, no additional storage 9 2.2.2 A2 – Combined Kamal and Tanjungan system, storage reservoir 45 ha 12 2.2.3 A3 – Kamal-Tanjungan with 90 ha storage 14
2.3 Verification with the hydraulic model and JEDI Synchronization 15 2.3.1 Introduction 15 2.3.2 Results 16 2.3.3 Impact of creation of western lake NCICD 18
2.4 Synchronization with other hydraulic infrastructure 19
3 Lower Angke / Karang polder 20 3.1 Description of the area 20 3.2 Pump scheme alternatives 21
3.2.1 B1 – Lower Angke/Karang, no additional storage 22 3.2.2 B2A – Lower Angke/Karang, new reservoir at Lower Angke 23 3.2.3 B2B – Lower Angke/Karang, 30 ha waduk and 12 ha emergency storage 25 3.2.4 B3 – as B2B, but with all possible green area as emergency storage 27 3.2.5 B4 –Splitting the polder in two parts, no additional storage 29 3.2.6 B5 –Splitting the polder area in two parts, additional storage 33 3.2.7 Other possible options 37
3.3 Verification with the hydraulic model and JEDI Synchronization 37 3.3.1 Introduction 37 3.3.2 Results 38 3.3.3 Impact of creation of western lake NCICD 40
3.4 Synchronization with other hydraulic infrastructure 41
4 Marina/Sentiong polder 42 4.1 Description of the area 42 4.2 Pump scheme alternatives 44
4.2.1 C1 – Marina/Sentiong, no additional storage 45 4.2.2 C2 – Marina/Sentiong and Sunter Utara, no additional storage 47 4.2.3 C3 – Marina/Sentiong and Sunter Utara extra open space 49 4.2.4 C4 – Marina/Sentiong, including Sunter Utara and a Marina retention 51 4.2.5 C5 – Marina/Sentiong, as C2 plus continuous 70 m
3/s Ciliwung Lama 53
4.2.6 C6 – Marina/Sentiong, as C5, but inflow Ciliwung Lama after local rainfall 55 4.3 Verification with the hydraulic model and JEDI Synchronization 57
4.3.1 Introduction 57 4.3.2 Results 59

ii
December 2014, Final Report - Phase 2
Technical review and support Jakarta Flood Management System
4.3.3 Impact of creation of western lake NCICD 60 4.4 Synchronization with other hydraulic infrastructure 60
5 Sunter polder 63 5.1 Description of the area 63
5.1.1 Introduction 63 5.2 Pump scheme alternatives 64
5.2.1 Sunter drain outlet 64 5.2.2 Sunter drain design 64
5.3 Verification with the hydraulic model and JEDI synchronisation 65 5.3.1 Introduction and results 65 5.3.2 NCICD developments 65 5.3.3 Catchment boundaries and connections 66
6 Cakung polder 67 6.1 Description of the area 67 6.2 Pump scheme alternatives 69
6.2.1 Cakung drain outlet 69 6.2.2 Cakung drain design 69
6.3 Verification with the hydraulic model and JEDI synchronisation 70 6.3.1 Introduction and results 70 6.3.2 Cakung Lama system 71 6.3.3 Secondary systems 71
6.4 Alternatives for further development under future scenarios, including NCICD 72 6.4.1 No plan integration: increasing pump-capacity to 250m
3/s 72
6.4.2 Using 445ha retention pond to extend retention volume 72 6.4.3 Integrate pump scheme in NCICD phase 3 72
7 Marunda polder 74 7.1 Description of the area 74 7.2 Pump scheme alternatives 75
8 Upper Cideng - Setiabudi 76 8.1 Introduction 76 8.2 Modelling 79 8.3 Conclusions 81
9 Review of the proposed Ciliwung-BKT and Cisadane diversions 82 9.1 Diverting flow from the Ciliwung 82
9.1.1 Ciliwung – BKT diversion 83 9.1.2 New flood strategy for the Ciliwung – BKB system 84 9.1.3 Katu Lampa – Cisadane diversion 84
9.2 Ciliwung-BKT diversion 84 9.2.1 Introduction 84 9.2.2 Improvements required at the BKT and Cipinang 85 9.2.3 Diversion capacities 87 9.2.4 Effect of diversions on Ciliwung and Banjir Kanal Timur water levels 88 9.2.5 Towards “equal distribution” 92 9.2.6 Prefer ability of alternative 93
9.3 Alternatif Diversion Channel (Sudetan) Ciliwung - BKT 94
December 2014, Final Report - Phase 2
Technical review and support Jakarta Flood Management System
iii
9.3.1 Ciliwung (Jembatan Kampung Melayu) – Banjir Kanal Timur (Jl. Basuki
Rachmad) 94 9.3.2 Opsi Pembuatan Sudetan Ciliwung-Banjir Kanal Timur 97 9.3.3 Opsi Alternatif Outlet Diversion 99 9.3.4 Pengaruh sudetan alternatif 1 pada muka air Ciliwung dan Banjir Kanal Timur
103 9.4 Preliminary review Ciliwung – Cisadane diversion 107
9.4.1 Diversion Katu Lampa-BKT, Nikken 1997 107 9.4.2 Diversion Katu Lampa-Cisadane, Deltares 2014 110
10 Extension of the Jakarta FHM modelling framework 116 10.1 History of Jakarta FHM modelling framework 2007 – 2013 116 10.2 The Jakarta SOBEK modelling system 118 10.3 The Jakarta FHM- modelling framework 118
10.3.1 Overview 118 10.3.2 The rainfall-runoff model 119 10.3.3 The 1D-2D Flow schematization 120
10.4 Extension with Cisadane and Bekasi river systems 121 10.4.1 First overview of the Cisadane and surrounding catchment 121 10.5.1 Model setup 123 10.5.2 Model calibration 123 10.5.3 First overview of the Bekasi and surrounding catchment 125 10.5.4 Model setup 126 10.5.5 Model calibration 126
11 Updating JFM and FMIS databases 128 11.1 Processing of Digital Elevation Map 128 11.2 Description of Lidar based DEM 128
11.2.1 Origin of retrieve data 128 11.2.2 Projection and datum 128 11.2.3 Review on filtering 129
11.3 Comparison of Lidar with 1D geometry 131 11.4 Lidar derivatives 131
11.4.1 Streamlines for sub-catchment delineation 131 11.4.2 Updating the FHM framework databases 132
Appendix A – Methodology 134
Appendix B – Sobek and the Jakarta FHM framework 149


December 2014, Final Report - Phase 2
Technical review and support Jakarta Flood Management System
1
1 Introduction
1.1 Background
Greater Jakarta is the political and economic centre of Indonesia. With an estimated
population of over 28 million, it accounts for a quarter of the nation’s non-oil GDP. The
Province of Jakarta (Daerah Khusus Ibukota or DKI) lies in the delta of the Ciliwung River and
has a population of about 10 million. About 40% of the city is below sea level and large areas
are flooded during the rainy season each year.
Especially severe floods occurred in February 2002, February 2007, and again in January
2013 and 2014, when more than 25% of Jakarta was inundated, flooding up to a depth of 5
meters in places, causing deaths and displacing of more than 100,000 inhabitants. The
economic costs were significantly higher considering loss of life, health costs, and disruption
to trade and industry.
The severity of floods in the capital has become a national issue given the huge financial
losses and the impacts on communities in the greater Jakarta area. For this reason, the
Ministry of Public Works and the provincial government of DKI Jakarta are jointly embarking
on an extensive flood management initiatives.
DKI and the Ministry of Public Works has designed and prepared a program to normalize and
improve the existing canal system by returning it to original design through Central
Government and DKI Jakarta own sources as well as Bank’s financing through Jakarta
Urgent Flood Mitigation Project/Jakarta Emergency Dredging Initiatives Project (JUFMP/JEDI
Project). The dredging initiatives will transcend beyond structural works to ensure that there
are proper additional measures to build capacity through programs, studies, and technical
assistance in order to address the problems comprehensively, especially in terms of
sustainability for ensuring long-lasting flood management systems known as non-structural
measures.
The sustainable effort of flood mitigation in Jakarta require substantial financing for
investment, rehabilitation, operation and maintenance (O&M), and non-structural measures
including capacity building, programing, improvement of technology and institutional
arrangement. Especially on construction and O&M, sufficient financing strategy and
availability will be the key for flood mitigation effort in Jakarta.
The ongoing subsidence of Jakarta is causing problems for the water system of Jakarta. The
plans for sea defence developed in JCDS (Jakarta Coastal Defence Study) are now being
worked out in the NCICD (National Capital Integrated Coastal Development) project.
However, the sea defence is not the only problem related to subsidence. The subsidence also
poses problems for the drainage system of large parts of northern Jakarta. The drainage is at
present mostly by gravity, but this is getting more and more difficult due to the sinking of the
land. Therefore large parts of Jakarta need to become polder systems like the existing Pluit
polder. The water level will be controlled by pumps which pump the drainage water to the
Java Sea. This study is focussing on the design of the layout of these new polder systems.

Technical review and support Jakarta Flood Management System
December 2014, Final Report - Phase 2
2
1.2 Introduction to the project
Currently there are many plans and substantial activities prepared and undertaken by many
different organizations and projects regarding the countermeasures to reduce floods in
Jakarta. It includes activities in the main and primary water system such as normalization,
rehabilitation and dredging through JUFMP/JEDI, improved operation of Eastern Banjir (flood)
Canal (EBC), shortcuts of Ciliwung to EBC and Cisadane, Sunter, Pesanggrahan and Angke
rehabilitation. Many retention lakes (waduks) are being restored and new retentions lakes will
be implemented. To guide and optimize these works a new flood strategy is being discussed
to minimize the upstream flows to the Western Banjir (flood) Canal (WBC) and to maximize
these flows towards the newly built EBC, including adjusted operation of Manggarai and
Karet.
The new Ciliwung diversion strategy also supports the phasing of the implementation of the
coastal defence/development works which are currently being designed through the National
Capital Integrated Coastal Development (NCICD) project. Urgent upgrade of the current
Jakarta Coastal Defence is currently under preparation through Phase A of NCICD and will
be implemented over the next three years. Under the phase A implementation the current
coastal defence (the coastal sea dike) will be heightened and strengthened. The larger
drainage channels like Cengkareng Drain, Cakung Drain, West and East Flood Channels will
most probably stay open through strengthening and heightening of their inland dikes, the
smaller channels like Kamal Drain, Lower Angke, Muara Karang, Marina and Sentiong Drains
will be closed off from the sea as no space is available to increase and heighten the inner
dikes. These closures require new pump/polder schemes to be able to manage and pump out
the local rainfall in the areas.
To counteract the effects of ongoing subsidence and implement the NCICD phase A
infrastructure, DKI is currently preparing the implementation of 5 new pumping/polder
schemes to improve critical flood conditions in the western and central low-lying Northern
parts of Jakarta. Similar pumping schemes will soon be develop to cover and protect also the
eastern areas of northern Jakarta.
This project concentrates on developing the outlines of the 5 new pumping/polder schemes
and their possible impact on proposed JEDI designs. The new pumping schemes are
overlapping with part of the JUFMP/JEDI and thus synchronization synchronisation is
required.
These new pumping schemes will close of the northern parts of Jakarta from the sea,
lowering the water levels inside the polder schemes such that the local drainage systems can
be restored and floods from local and from sea intrusion be lowered. The creation of these
polders is in line with / part of the Phase A requirements of NCICD. In the rest of the report it
is assumed that Phase A of NCICD will be implement as scheduled (completion before 2018).
1.3 Polder systems
Large parts of Jakarta, previously draining under gravity to the Java Sea (Laut Java),
currently need to be transformed to pumped/polder systems to counteract subsidence and
match the requirements for NCICD Phase A; systems draining to downstream water bodies
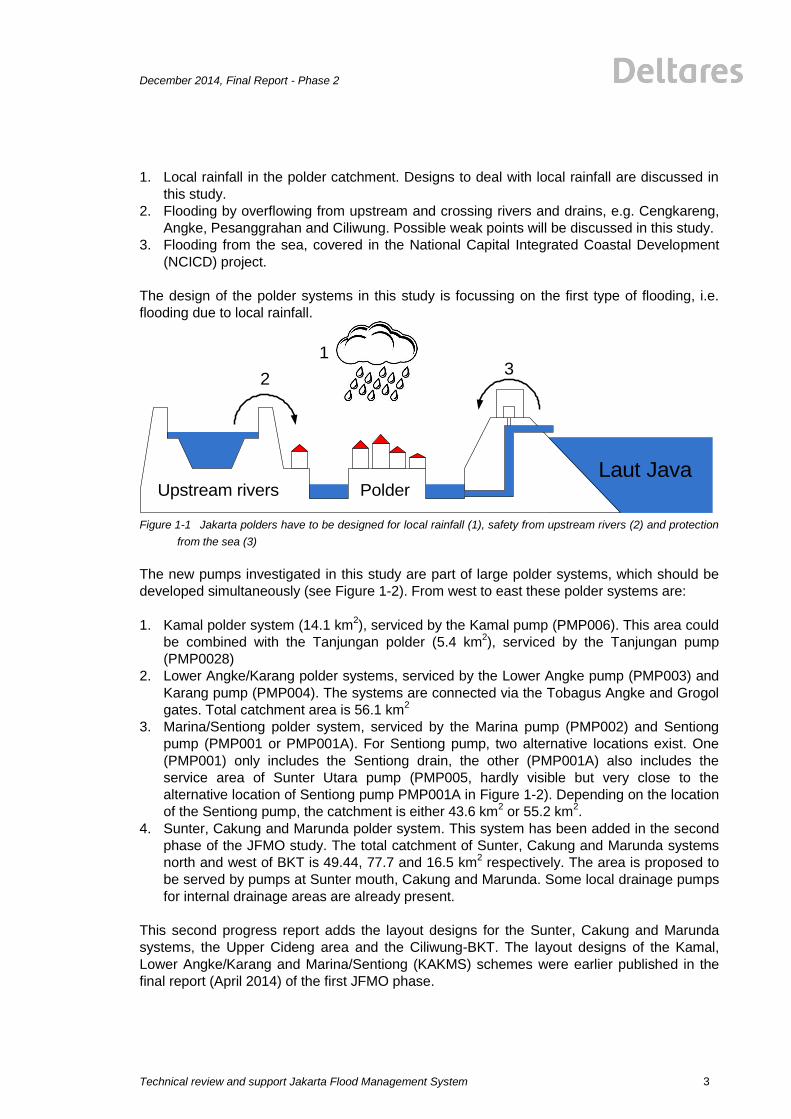
by pumps. Polders can be flooded in three ways (see Figure 1-1):
December 2014, Final Report - Phase 2
Technical review and support Jakarta Flood Management System
3
1. Local rainfall in the polder catchment. Designs to deal with local rainfall are discussed in
this study.
2. Flooding by overflowing from upstream and crossing rivers and drains, e.g. Cengkareng,
Angke, Pesanggrahan and Ciliwung. Possible weak points will be discussed in this study.
3. Flooding from the sea, covered in the National Capital Integrated Coastal Development
(NCICD) project.
The design of the polder systems in this study is focussing on the first type of flooding, i.e.
flooding due to local rainfall.
Figure 1-1 Jakarta polders have to be designed for local rainfall (1), safety from upstream rivers (2) and protection
from the sea (3)
The new pumps investigated in this study are part of large polder systems, which should be
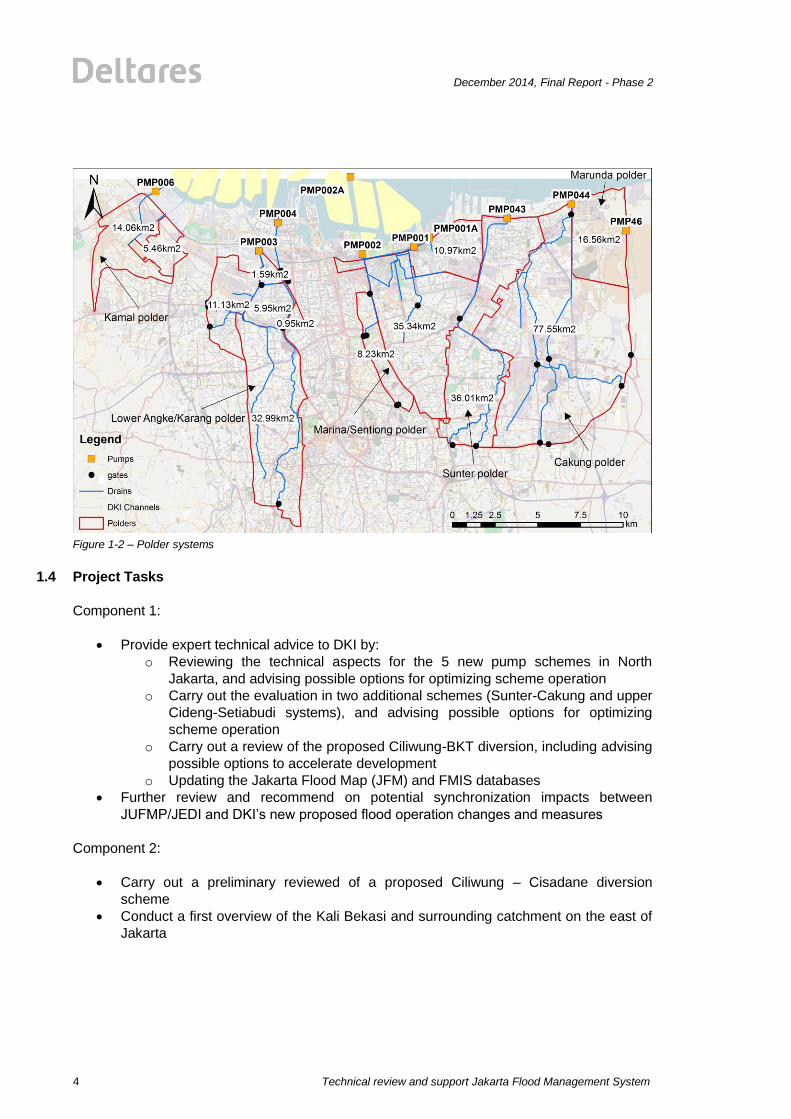
developed simultaneously (see Figure 1-2). From west to east these polder systems are:
1. Kamal polder system (14.1 km2), serviced by the Kamal pump (PMP006). This area could
be combined with the Tanjungan polder (5.4 km2), serviced by the Tanjungan pump
(PMP0028)
2. Lower Angke/Karang polder systems, serviced by the Lower Angke pump (PMP003) and
Karang pump (PMP004). The systems are connected via the Tobagus Angke and Grogol
gates. Total catchment area is 56.1 km2
3. Marina/Sentiong polder system, serviced by the Marina pump (PMP002) and Sentiong
pump (PMP001 or PMP001A). For Sentiong pump, two alternative locations exist. One
(PMP001) only includes the Sentiong drain, the other (PMP001A) also includes the
service area of Sunter Utara pump (PMP005, hardly visible but very close to the
alternative location of Sentiong pump PMP001A in Figure 1-2). Depending on the location
of the Sentiong pump, the catchment is either 43.6 km2 or 55.2 km
2.
4. Sunter, Cakung and Marunda polder system. This system has been added in the second
phase of the JFMO study. The total catchment of Sunter, Cakung and Marunda systems
north and west of BKT is 49.44, 77.7 and 16.5 km2 respectively. The area is proposed to
be served by pumps at Sunter mouth, Cakung and Marunda. Some local drainage pumps
for internal drainage areas are already present.
This second progress report adds the layout designs for the Sunter, Cakung and Marunda
systems, the Upper Cideng area and the Ciliwung-BKT. The layout designs of the Kamal,
Lower Angke/Karang and Marina/Sentiong (KAKMS) schemes were earlier published in the
final report (April 2014) of the first JFMO phase.
Laut JavaUpstream rivers Polder
1
23
Technical review and support Jakarta Flood Management System
December 2014, Final Report - Phase 2
4
Figure 1-2 – Polder systems
1.4 Project Tasks
Component 1:
Provide expert technical advice to DKI by:
o Reviewing the technical aspects for the 5 new pump schemes in North
Jakarta, and advising possible options for optimizing scheme operation
o Carry out the evaluation in two additional schemes (Sunter-Cakung and upper
Cideng-Setiabudi systems), and advising possible options for optimizing
scheme operation
o Carry out a review of the proposed Ciliwung-BKT diversion, including advising
possible options to accelerate development
o Updating the Jakarta Flood Map (JFM) and FMIS databases
Further review and recommend on potential synchronization impacts between
JUFMP/JEDI and DKI’s new proposed flood operation changes and measures
Component 2:
Carry out a preliminary reviewed of a proposed Ciliwung – Cisadane diversion
scheme
Conduct a first overview of the Kali Bekasi and surrounding catchment on the east of
Jakarta
December 2014, Final Report - Phase 2
Technical review and support Jakarta Flood Management System
5
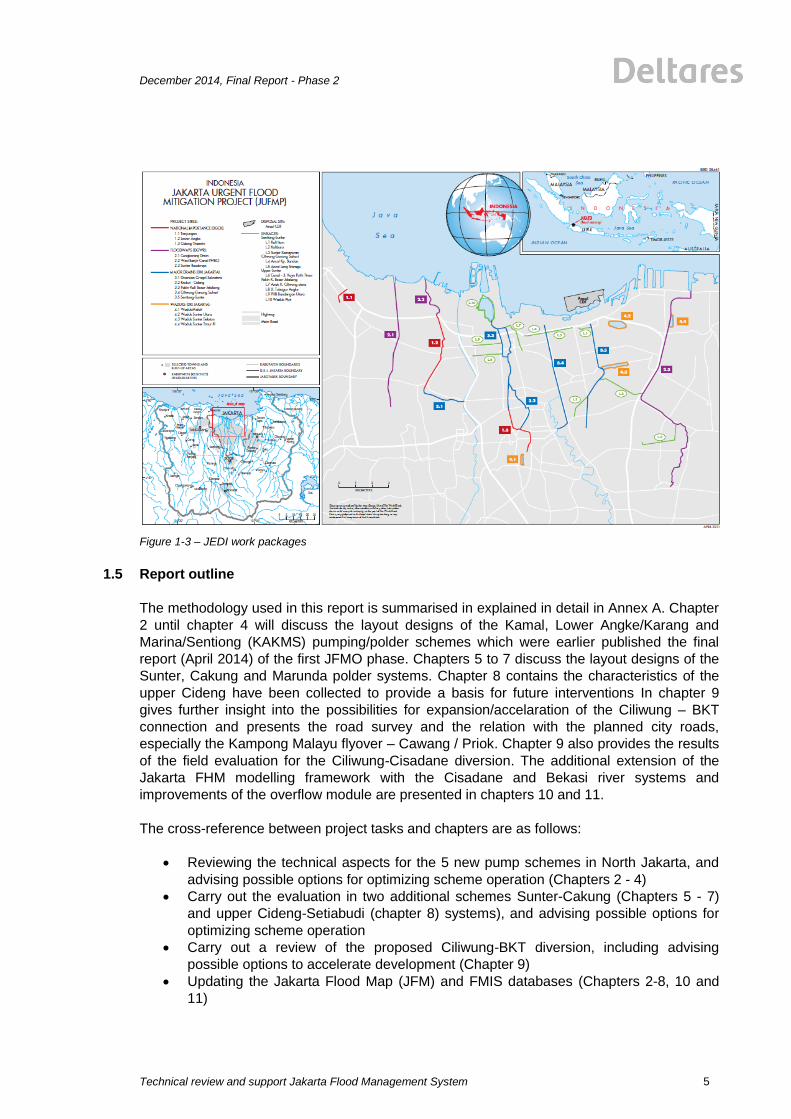
Figure 1-3 – JEDI work packages
1.5 Report outline
The methodology used in this report is summarised in explained in detail in Annex A. Chapter
2 until chapter 4 will discuss the layout designs of the Kamal, Lower Angke/Karang and
Marina/Sentiong (KAKMS) pumping/polder schemes which were earlier published the final
report (April 2014) of the first JFMO phase. Chapters 5 to 7 discuss the layout designs of the
Sunter, Cakung and Marunda polder systems. Chapter 8 contains the characteristics of the
upper Cideng have been collected to provide a basis for future interventions In chapter 9
gives further insight into the possibilities for expansion/accelaration of the Ciliwung – BKT
connection and presents the road survey and the relation with the planned city roads,
especially the Kampong Malayu flyover – Cawang / Priok. Chapter 9 also provides the results
of the field evaluation for the Ciliwung-Cisadane diversion. The additional extension of the
Jakarta FHM modelling framework with the Cisadane and Bekasi river systems and
improvements of the overflow module are presented in chapters 10 and 11.
The cross-reference between project tasks and chapters are as follows:
Reviewing the technical aspects for the 5 new pump schemes in North Jakarta, and
advising possible options for optimizing scheme operation (Chapters 2 - 4)
Carry out the evaluation in two additional schemes Sunter-Cakung (Chapters 5 - 7)
and upper Cideng-Setiabudi (chapter 8) systems), and advising possible options for
optimizing scheme operation
Carry out a review of the proposed Ciliwung-BKT diversion, including advising
possible options to accelerate development (Chapter 9)
Updating the Jakarta Flood Map (JFM) and FMIS databases (Chapters 2-8, 10 and
11)

Technical review and support Jakarta Flood Management System
December 2014, Final Report - Phase 2
6
Further review and recommend on potential synchronization impacts between
JUFMP/JEDI and DKI’s new proposed flood operation changes and measures
(Chapters 2-8)
Carry out a preliminary reviewed of a proposed Ciliwung – Cisadane diversion
scheme (Chapter 9)
Conduct a first overview of the Kali Bekasi and surrounding catchment on the east of
Jakarta (Chapter 10)
December 2014, Final Report - Phase 2
Technical review and support Jakarta Flood Management System
7
2 Kamal / Tanjungan polder
2.1 Description of the area
The Kamal-Tanjungan area is located in the north-western edge of DKI, close to Sukarno-
Hatta airport and Tangerang. The Kamal catchment is estimated at 14.1 km2. The kali Kamal
is draining by gravity to the sea at the moment. During high tide the sea water comes in and
overflows the river banks, causing some flooding. Construction is ongoing near Kamal
Stadium to create a wide discharge channel and using sheet piles to protect the area. A
pumping station is planned near the stadium to drain the area.
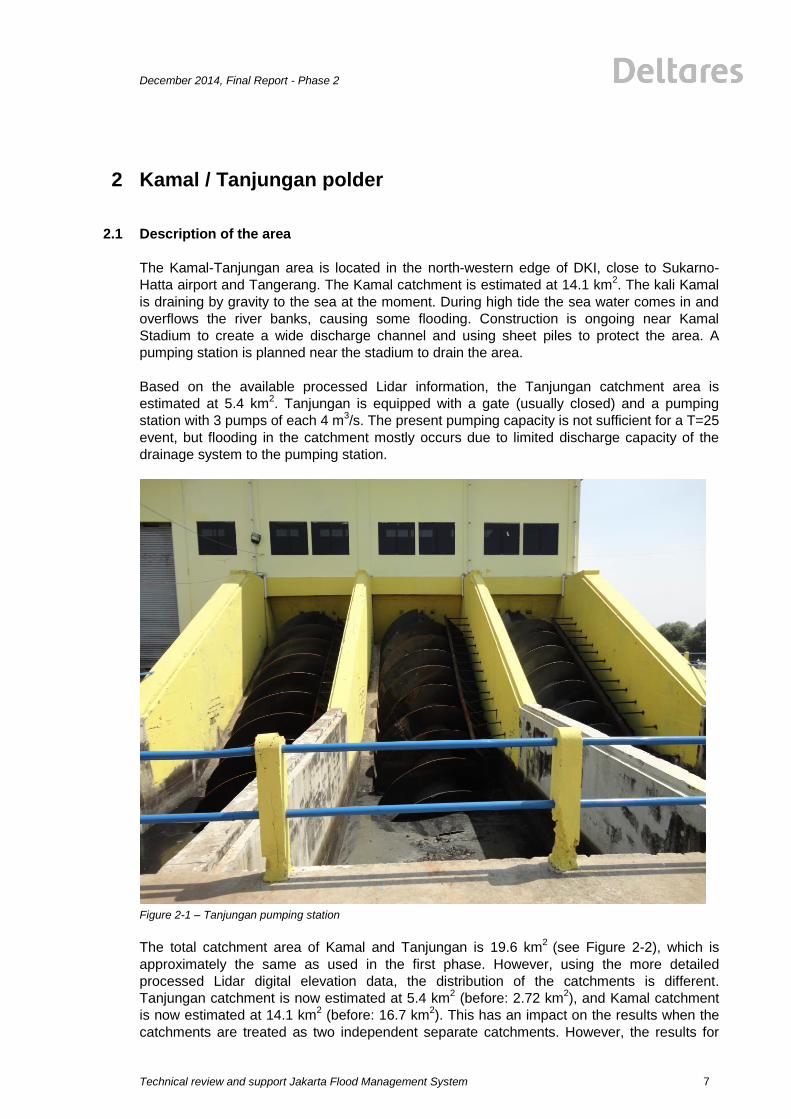
Based on the available processed Lidar information, the Tanjungan catchment area is
estimated at 5.4 km2. Tanjungan is equipped with a gate (usually closed) and a pumping
station with 3 pumps of each 4 m3/s. The present pumping capacity is not sufficient for a T=25
event, but flooding in the catchment mostly occurs due to limited discharge capacity of the
drainage system to the pumping station.
Figure 2-1 – Tanjungan pumping station
The total catchment area of Kamal and Tanjungan is 19.6 km2
(see Figure 2-2), which is
approximately the same as used in the first phase. However, using the more detailed
processed Lidar digital elevation data, the distribution of the catchments is different.
Tanjungan catchment is now estimated at 5.4 km2 (before: 2.72 km
2), and Kamal catchment
is now estimated at 14.1 km2 (before: 16.7 km
2). This has an impact on the results when the
catchments are treated as two independent separate catchments. However, the results for

Technical review and support Jakarta Flood Management System
December 2014, Final Report - Phase 2
8
the cases with a common reservoir (waduk) are almost the same as the results of the first
phase.
Figure 2-2 – Kamal and Tanjungan catchment (area within the black lines)
The Kamal Muara area north of the toll road to the airport, between Tanjungan pumping
station and the road to Kamal stadium, is mainly in use for aquaculture (tambaks) and only
sparsely inhabited. The city is at the moment busy implementing the policy to create more
green space and water retention areas. It seems very well possible and it is very much in line
with this policy to create water retention area north of the airport toll road.
2.2 Pump scheme alternatives
Different pump schemes (varying in storage) will be discussed in this chapter:
A1. Kamal and Tanjungan as separate polder systems with pumps, no additional storage
(In the next table, this is indicated as A1-K for Kamal and A1-T for Tanjungan)
A2. Kamal-Tanjungan as a combined system, with a common storage of 45 ha
A3. Kamal-Tanjungan as a combined system, with a common storage of 90 ha
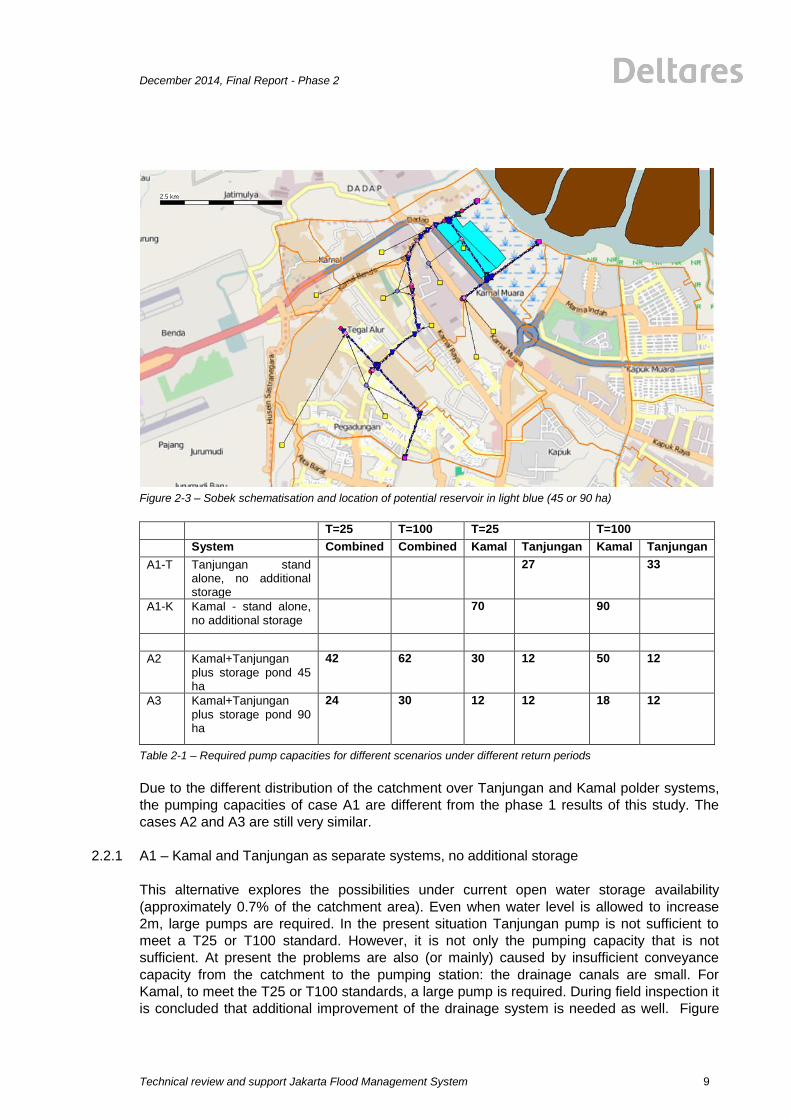
These options are schematised using the following schematisation, which already contains
the storage area. Depending on the alternative, the storage area is closed (option A1) or set
at a size of 45 or 90 ha.
The estimated required pump capacities using the water balance under different return
periods for all alternatives is shown in the table below.
December 2014, Final Report - Phase 2
Technical review and support Jakarta Flood Management System
9
Figure 2-3 – Sobek schematisation and location of potential reservoir in light blue (45 or 90 ha)
T=25 T=100 T=25 T=100
System Combined Combined Kamal Tanjungan Kamal Tanjungan
A1-T Tanjungan stand alone, no additional storage
27 33
A1-K Kamal - stand alone, no additional storage
70 90
A2 Kamal+Tanjungan plus storage pond 45 ha
42 62 30 12 50 12
A3 Kamal+Tanjungan plus storage pond 90 ha
24 30 12 12 18 12
Table 2-1 – Required pump capacities for different scenarios under different return periods
Due to the different distribution of the catchment over Tanjungan and Kamal polder systems,
the pumping capacities of case A1 are different from the phase 1 results of this study. The
cases A2 and A3 are still very similar.
2.2.1 A1 – Kamal and Tanjungan as separate systems, no additional storage
This alternative explores the possibilities under current open water storage availability
(approximately 0.7% of the catchment area). Even when water level is allowed to increase
2m, large pumps are required. In the present situation Tanjungan pump is not sufficient to
meet a T25 or T100 standard. However, it is not only the pumping capacity that is not
sufficient. At present the problems are also (or mainly) caused by insufficient conveyance
capacity from the catchment to the pumping station: the drainage canals are small. For
Kamal, to meet the T25 or T100 standards, a large pump is required. During field inspection it
is concluded that additional improvement of the drainage system is needed as well. Figure
Technical review and support Jakarta Flood Management System
December 2014, Final Report - Phase 2
10
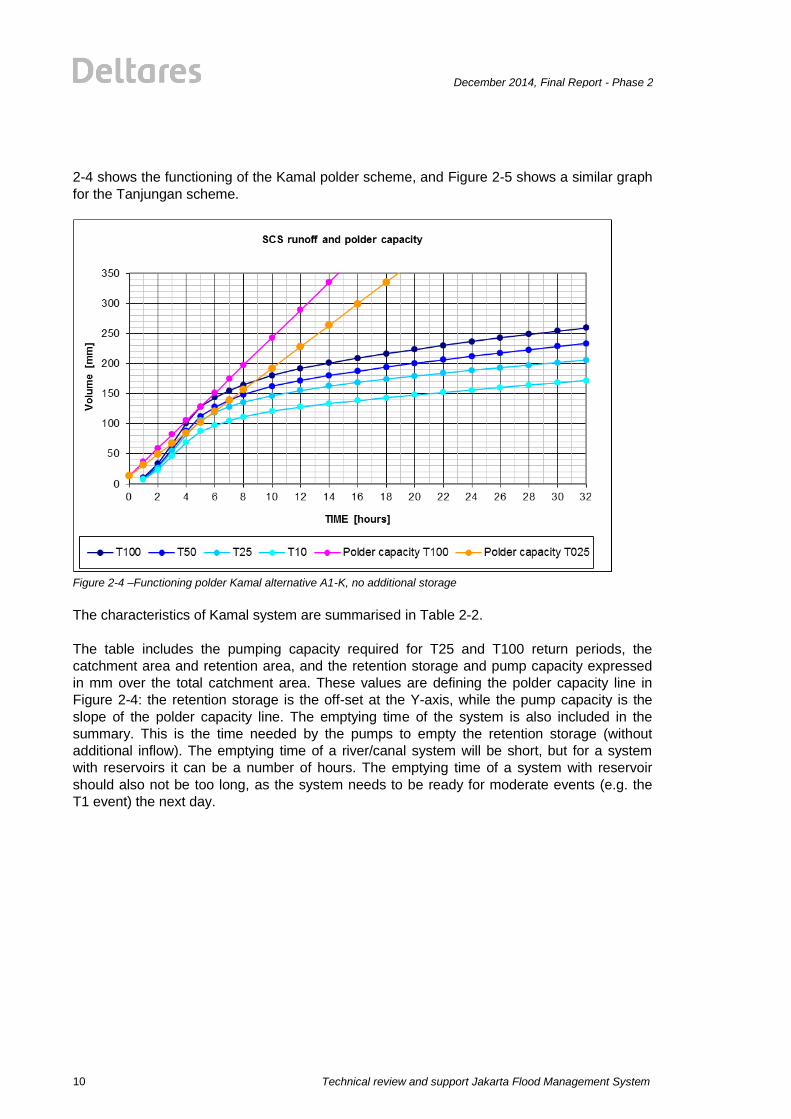
2-4 shows the functioning of the Kamal polder scheme, and Figure 2-5 shows a similar graph
for the Tanjungan scheme.
Figure 2-4 –Functioning polder Kamal alternative A1-K, no additional storage
The characteristics of Kamal system are summarised in Table 2-2.
The table includes the pumping capacity required for T25 and T100 return periods, the
catchment area and retention area, and the retention storage and pump capacity expressed
in mm over the total catchment area. These values are defining the polder capacity line in
Figure 2-4: the retention storage is the off-set at the Y-axis, while the pump capacity is the
slope of the polder capacity line. The emptying time of the system is also included in the
summary. This is the time needed by the pumps to empty the retention storage (without
additional inflow). The emptying time of a river/canal system will be short, but for a system
with reservoirs it can be a number of hours. The emptying time of a system with reservoir
should also not be too long, as the system needs to be ready for moderate events (e.g. the
T1 event) the next day.

December 2014, Final Report - Phase 2
Technical review and support Jakarta Flood Management System
11
Table 2-2 – Characteristics of Kamal system, alternative A1-K (no additional storage, big pump)
Figure 2-5 –Functioning polder Tanjungan alternative A1-T, no additional storage
Alternative A1-K
Kamal, stand alone system
T100 T25
Pump capacity Kamal 90 70 m3/s
Retention area 9.4 ha
Total catchment 14.1 km2
Max. retention volume 0.19 Mm3
In mm over total catchment area: T100 T25
retention storage 13 13 mm
pump capacity 22.98 17.87 mm/hour
Storage emptying time 0.6 0.7 hours

Technical review and support Jakarta Flood Management System
December 2014, Final Report - Phase 2
12
Table 2-3 – Characteristics of Tanjungan system, alternative A1-T (no additional storage, bigger pump)
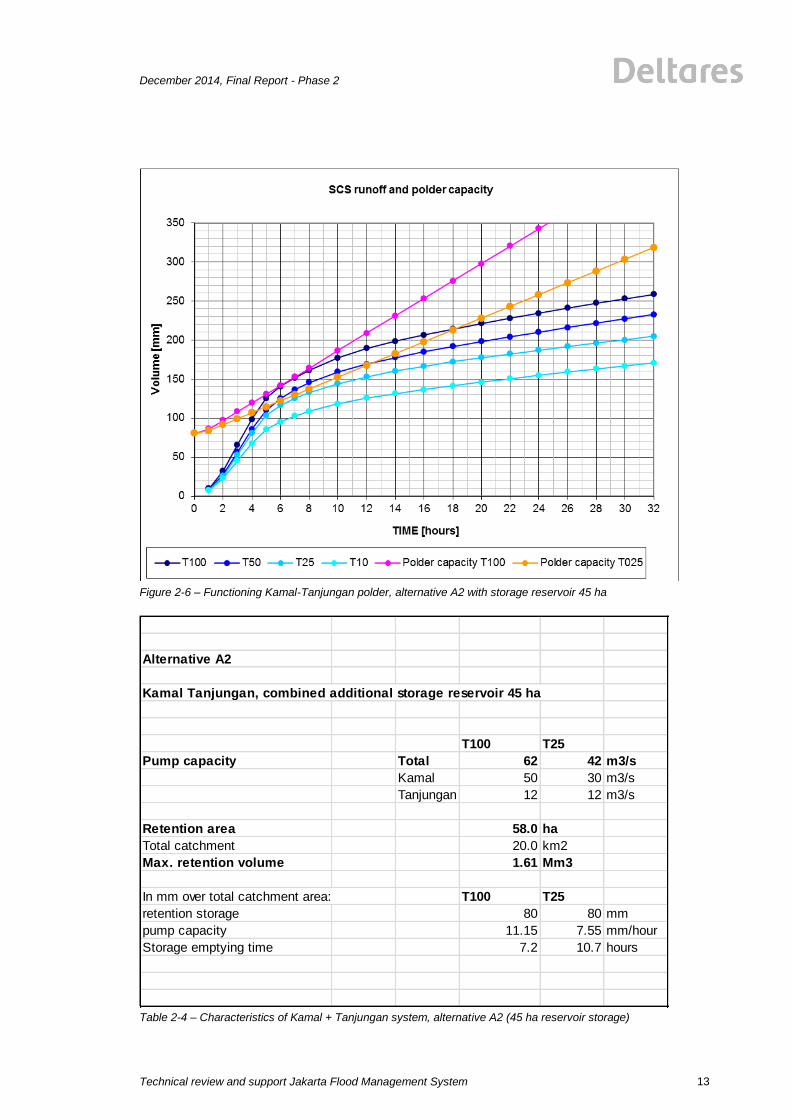
2.2.2 A2 – Combined Kamal and Tanjungan system, storage reservoir 45 ha
In this alternative an extra reservoir of 45 ha is included at the Kamal Muara (see Figure 2-3).
Note that this reservoir also increases the catchment area of the pumping stations with this
amount. The allowed level fluctuation in the reservoir is about 2 m, but with proper alignments
up to 3 m could be allowed. Both Kamal pumping station and Tanjungan pumping station will
be connected to this reservoir of 45 ha. Tanjungan already has an existing pumping station
(capacity 12 m3/s), so the additional pumping capacity can be created at Kamal pumping
station. The required total pumping capacity is 42 (T25) or 62 m3/s (T100). Figure 2-6 shows
the capacity of the combined Kamal-Tanjungan polder system. Table 2-4 summarises the
results.
Alternative A1-T
Tanjungan, stand alone system
T100 T25
Pump capacity Tanjungan 33 27 m3/s
Retention area 3.6 ha
Total catchment 5.5 km2
Max. retention volume 0.07 Mm3
In mm over total catchment area: T100 T25
retention storage 13 13 mm
pump capacity 21.74 17.78 mm/hour
Storage emptying time 0.6 0.8 hours
December 2014, Final Report - Phase 2
Technical review and support Jakarta Flood Management System
13
Figure 2-6 – Functioning Kamal-Tanjungan polder, alternative A2 with storage reservoir 45 ha
Table 2-4 – Characteristics of Kamal + Tanjungan system, alternative A2 (45 ha reservoir storage)
Alternative A2
Kamal Tanjungan, combined additional storage reservoir 45 ha
T100 T25
Pump capacity Total 62 42 m3/s
Kamal 50 30 m3/s
Tanjungan 12 12 m3/s
Retention area 58.0 ha
Total catchment 20.0 km2
Max. retention volume 1.61 Mm3
In mm over total catchment area: T100 T25
retention storage 80 80 mm
pump capacity 11.15 7.55 mm/hour
Storage emptying time 7.2 10.7 hours
Technical review and support Jakarta Flood Management System
December 2014, Final Report - Phase 2
14
The required pumping capacities are much lower than in case A1 (stand-alone Kamal and
Tanjungan). The emptying time of the reservoir is between 7 and 11 hours, which is
acceptable.
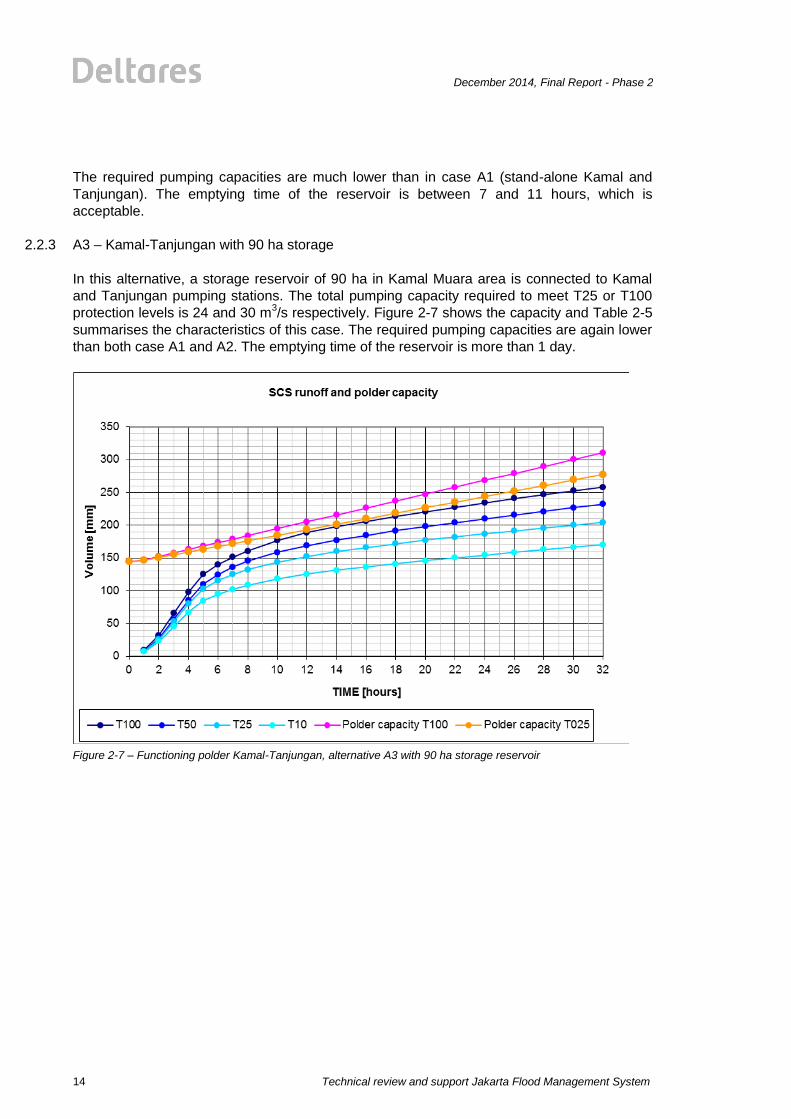
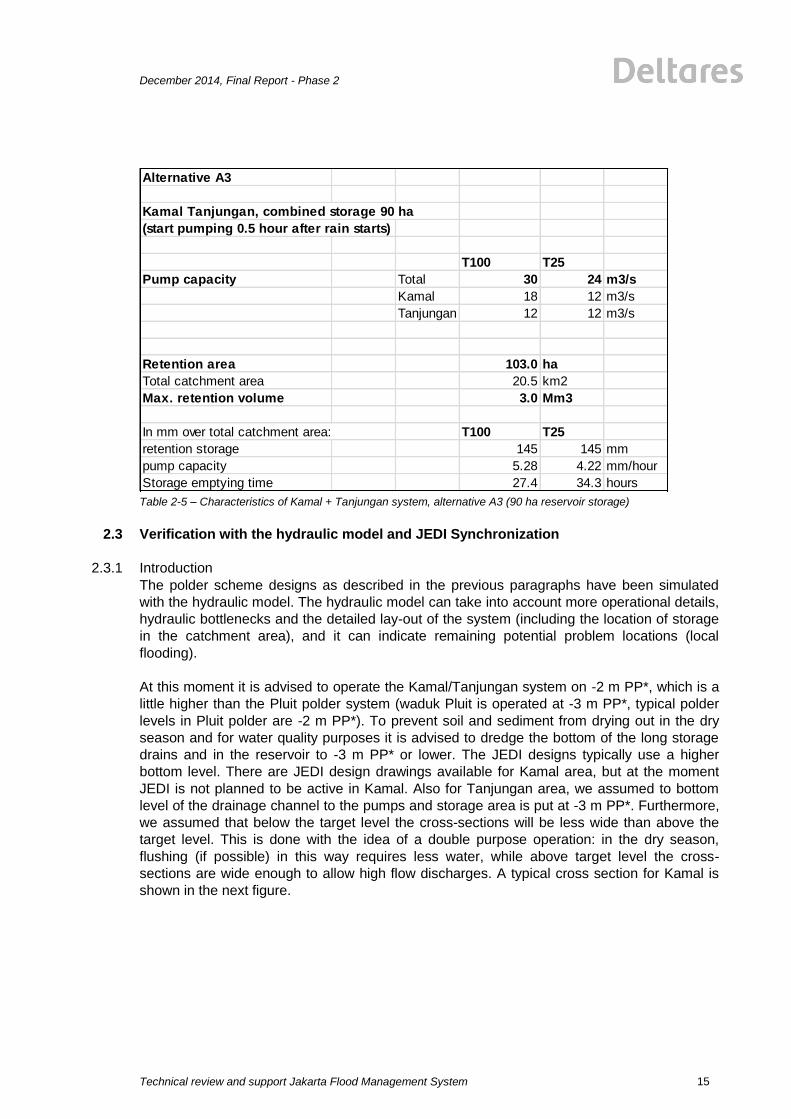
2.2.3 A3 – Kamal-Tanjungan with 90 ha storage
In this alternative, a storage reservoir of 90 ha in Kamal Muara area is connected to Kamal
and Tanjungan pumping stations. The total pumping capacity required to meet T25 or T100
protection levels is 24 and 30 m3/s respectively. Figure 2-7 shows the capacity and Table 2-5
summarises the characteristics of this case. The required pumping capacities are again lower
than both case A1 and A2. The emptying time of the reservoir is more than 1 day.
Figure 2-7 – Functioning polder Kamal-Tanjungan, alternative A3 with 90 ha storage reservoir
December 2014, Final Report - Phase 2
Technical review and support Jakarta Flood Management System
15
Table 2-5 – Characteristics of Kamal + Tanjungan system, alternative A3 (90 ha reservoir storage)
2.3 Verification with the hydraulic model and JEDI Synchronization
2.3.1 Introduction
The polder scheme designs as described in the previous paragraphs have been simulated
with the hydraulic model. The hydraulic model can take into account more operational details,
hydraulic bottlenecks and the detailed lay-out of the system (including the location of storage
in the catchment area), and it can indicate remaining potential problem locations (local
flooding).
At this moment it is advised to operate the Kamal/Tanjungan system on -2 m PP*, which is a
little higher than the Pluit polder system (waduk Pluit is operated at -3 m PP*, typical polder
levels in Pluit polder are -2 m PP*). To prevent soil and sediment from drying out in the dry
season and for water quality purposes it is advised to dredge the bottom of the long storage
drains and in the reservoir to -3 m PP* or lower. The JEDI designs typically use a higher
bottom level. There are JEDI design drawings available for Kamal area, but at the moment
JEDI is not planned to be active in Kamal. Also for Tanjungan area, we assumed to bottom
level of the drainage channel to the pumps and storage area is put at -3 m PP*. Furthermore,
we assumed that below the target level the cross-sections will be less wide than above the
target level. This is done with the idea of a double purpose operation: in the dry season,
flushing (if possible) in this way requires less water, while above target level the cross-
sections are wide enough to allow high flow discharges. A typical cross section for Kamal is
shown in the next figure.
Alternative A3
Kamal Tanjungan, combined storage 90 ha
(start pumping 0.5 hour after rain starts)
T100 T25
Pump capacity Total 30 24 m3/s
Kamal 18 12 m3/s
Tanjungan 12 12 m3/s
Retention area 103.0 ha
Total catchment area 20.5 km2
Max. retention volume 3.0 Mm3
In mm over total catchment area: T100 T25
retention storage 145 145 mm
pump capacity 5.28 4.22 mm/hour
Storage emptying time 27.4 34.3 hours

Technical review and support Jakarta Flood Management System
December 2014, Final Report - Phase 2
16
Figure 2-8 –Typical double purpose cross-section
The calculations with the hydraulic model have been made using JEDI design cross-sections,
and using improved cross-sections (deeper double purpose canals) which reduce the
maximum water levels and increase the discharge capacity to the pumps.
2.3.2 Results
The calculations with the JEDI design cross sections show that the Kamal pump system
without storage and with designed pump capacity according to the water balance, will still
face large-scale flooding. The calculation with improved cross-sections (deeper than the
original cross-section, and only downstream a little wider) shows that the design pumping
capacity is in principle indeed sufficient to control the water level, but shows that additionally
improvement of cross-sections on top of the JEDI design is really necessary.
Figure 2-9 shows the bottom levels according to JEDI-design and as proposed by this study
for Kamal. Also the maximum water levels from cases A1 and A3 are shown. Figure 2-9
shows the bottom levels together with the computed maximum water levels for the T25 and
T100 return period for Kamal and Tanjungan system. The results show a number of things:
The maximum water level rise computed by the hydraulic model is more than 2 m. In
the calculations a lowest pump operation level of –1.8 m PP* has been used, while
the maximum computed water level upstream of Kamal pumping station with
improved cross-sections is 0.5 to 0.6 m PP* depending on the return period. The
maximum water level rise is thus 2.5 m, while the water balance used allowed 2 m
rise only.
The difference in water level between the JEDI design and improved cross-sections is
quite large.
Still, also with the improved cross-sections, in the upstream area some local flooding
will occur due to limited discharge capacity.

December 2014, Final Report - Phase 2
Technical review and support Jakarta Flood Management System
17
Figure 2-9 –Bottom levels (JEDI and improved) and T100 water levels, Kamal
The computed water levels in the storage reservoir Kamal-Tanjungan for the cases with a
storage reservoir of 45 or 90 ha are shown in the next figure for both the T25 and T100
events. The graph shows that the water level is rising from -1.8 m PP* up to a maximum level
of about +0.5 m PP*. The emptying time of the reservoir is much larger for the 90 ha reservoir
than for the 45 ha reservoir.
Figure 2-10 –Water levels in the storage reservoir for cases A2 (45 ha) and A3 (90 ha)
In the graph, the water levels for the 45 ha reservoir are in red (T100) and blue (T25), while
the water levels for the 90 ha reservoir are in grey (T25) and green (T100).
C50 F15:W.level up mean 1-TanjunganPump C51 F15:W.level up mean 1-TanjunganPump C53 F15:W.level up mean 1-TanjunganPump
C54 F15:W.level up mean 1-TanjunganPump
06-01-2013
00:00:00
05-01-2013
12:00:00
05-01-2013
00:00:00
04-01-2013
12:00:00
04-01-2013
00:00:00
03-01-2013
12:00:00
03-01-2013
00:00:00
02-01-2013
12:00:00
02-01-2013
00:00:00
01-01-2013
12:00:00
01-01-2013
00:00:00
C50 F
15:W
.level up m
ean [
m A
D]
0.8
0.6
0.4
0.2
0
-0.2
-0.4
-0.6
-0.8
-1
-1.2
-1.4
-1.6
-1.8
-2
*
Technical review and support Jakarta Flood Management System
December 2014, Final Report - Phase 2
18
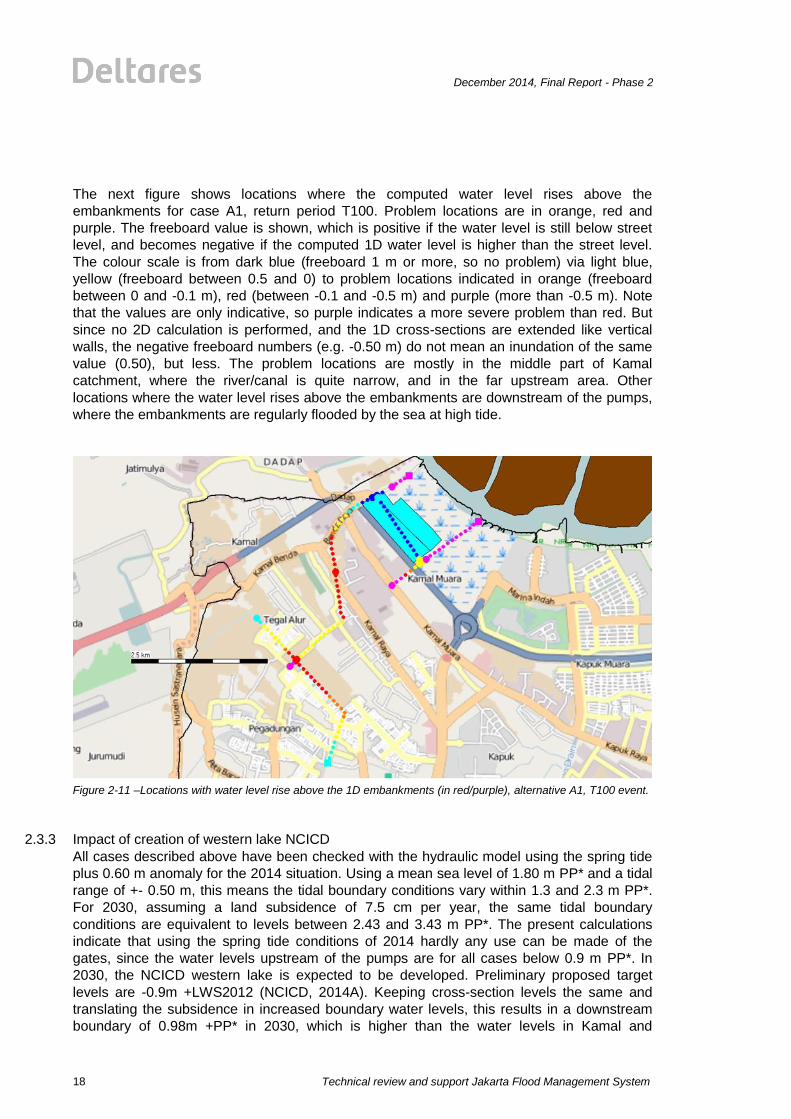
The next figure shows locations where the computed water level rises above the
embankments for case A1, return period T100. Problem locations are in orange, red and
purple. The freeboard value is shown, which is positive if the water level is still below street
level, and becomes negative if the computed 1D water level is higher than the street level.
The colour scale is from dark blue (freeboard 1 m or more, so no problem) via light blue,
yellow (freeboard between 0.5 and 0) to problem locations indicated in orange (freeboard
between 0 and -0.1 m), red (between -0.1 and -0.5 m) and purple (more than -0.5 m). Note
that the values are only indicative, so purple indicates a more severe problem than red. But
since no 2D calculation is performed, and the 1D cross-sections are extended like vertical
walls, the negative freeboard numbers (e.g. -0.50 m) do not mean an inundation of the same
value (0.50), but less. The problem locations are mostly in the middle part of Kamal
catchment, where the river/canal is quite narrow, and in the far upstream area. Other
locations where the water level rises above the embankments are downstream of the pumps,
where the embankments are regularly flooded by the sea at high tide.
Figure 2-11 –Locations with water level rise above the 1D embankments (in red/purple), alternative A1, T100 event.
2.3.3 Impact of creation of western lake NCICD
All cases described above have been checked with the hydraulic model using the spring tide
plus 0.60 m anomaly for the 2014 situation. Using a mean sea level of 1.80 m PP* and a tidal
range of +- 0.50 m, this means the tidal boundary conditions vary within 1.3 and 2.3 m PP*.
For 2030, assuming a land subsidence of 7.5 cm per year, the same tidal boundary
conditions are equivalent to levels between 2.43 and 3.43 m PP*. The present calculations
indicate that using the spring tide conditions of 2014 hardly any use can be made of the
gates, since the water levels upstream of the pumps are for all cases below 0.9 m PP*. In
2030, the NCICD western lake is expected to be developed. Preliminary proposed target
levels are -0.9m +LWS2012 (NCICD, 2014A). Keeping cross-section levels the same and
translating the subsidence in increased boundary water levels, this results in a downstream
boundary of 0.98m +PP* in 2030, which is higher than the water levels in Kamal and

December 2014, Final Report - Phase 2
Technical review and support Jakarta Flood Management System
19
Tanjungan system. This means the pumps will still be needed after the western lake is
created.
2.4 Synchronization with other hydraulic infrastructure
The other relevant development for Kamal and Tanjungan area is the planning of Cengkareng
II drain. It is said that one of the possible alignments for Cengkareng II is on the boundary of
DKI and Tangerang, where Cengkareng II ends up in Kamal area. This could interfere with
the Kamal drainage system. However, at the moment of writing of this report no further details
about the status of Cengkareng II designs are available yet.
An important sensitivity is the distribution of catchment area over Kamal and Tanjungan
catchments. In the present report the distribution is different from the phase 1 report, based
on extracting local drain directions from the detailed DEM data. The catchment subdivision
according to the 2m DEM sometimes crosses some main drains (according to the available
shape file of DKI channels). Additional field work is useful to check the catchment area and
flow direction in drains. But for now, the present estimates are the best available. For case
A1, where Tanjungan and Kamal serve separate catchments, this other subdivision has an
impact on the computed required pumping capacities. Since Kamal catchment is reduced,
and Tanjungan catchment increased, pumping capacity at Kamal can be smaller, and should
be larger at Tanjungan. For cases A2 and A3, with a combined reservoir of 45 or 90 ha, the
pumping capacity is hardly influenced by the distribution of the catchments.

Technical review and support Jakarta Flood Management System
December 2014, Final Report - Phase 2
20
3 Lower Angke / Karang polder
3.1 Description of the area
The area to be converted into the Lower Angke / Karang polder will be 56.1 km2 in total (see
Figure 3-1). In the south, the upstream boundary is defined by the Grogol – Pesanggrahan
diversion (sudetan), bypassing the upper Grogol and most upstream part of the Sekretaris
(not in figure below; see Figure 1-2). The lower Grogol and the part of the Sekretaris
downstream of the sudetan currently drain via the Grogol-Sekretaris interceptor (GroSec in
Figure 3-1) towards the Lower Angke, where it enters the Muara Angke. At this location, the
Lower Angke pump is planned.
The Grogol-Sekretaris interceptor and Lower Angke can be separated from the Karang
system with the Tobagus Angke (TA) and Grogol gates. In that case, the area East of the TA
gate and North of the Grogol gate will discharge via a siphon under the BKB and the kali
Karang to Java Bay. Kali Karang is separated from Pluit polder (an area serviced by Pompa
Duri), with the Karang gate. Also the idea of a pump at Mookervaart (into Cengkareng drain)
came up.
Figure 3-1 – Lower Angke/Karang polder

December 2014, Final Report - Phase 2
Technical review and support Jakarta Flood Management System
21
3.2 Pump scheme alternatives
In all alternatives it is assumed that the operation of Pompa Lower Angke, Pompa Karang
and the Tobagus Angke and Grogol gates is optimized for optimal use of storage in the
surface water systems. The capacity of the siphon in the Grogol under passing the West
Banjir Canal (BKB) poses a limitation in the maximum pump capacity of the Karang pump.
According to Nedeco (1973) the capacity of the siphon is 60 m3/s. It is not known whether the
capacity is upgraded after 1973. We therefore assume the 60 m3/s capacity still holds for the
design conditions.
Different pump schemes (varying in storage) will be discussed in this chapter:
B1. Lower Angke/Muara Karang, using the main system only for storage
B2A. Lower Angke/Muara Karang system with additional 30 ha reservoir in Lower Angke
B2B. Lower Angke/Muara Karang system with 30 ha reservoir and 12 ha emergency space
B3. Lower Angke/Muara Karang
B4 As B1, but split the area into two separate polders, both without additional storage:
B4N Northern part of Lower Angke/Muara Karang polder
B4S Southern part of polder: GroSec, Mookervaart.
B5 As B4, split the area into two separate polders, both with additional storage:
B4N Northern part of polder, with waduk Lower Angke 30 ha
B4N-G Northern part of polder, with green open space emergency storage
B4S-G Southern part of polder: GroSec, Mookervaart with emergency storage.
Finally, also the option of an emergency connection with the upgraded Pluit polder system is
discussed.
The estimated required pump capacities by the water balance under different return periods
for all alternatives are shown in the table below.
T=25 T=100 T=25 T=100
System Combined Combined Lower Angke Karang Lower Angke Karang
B1 Lower Angke Muara Karang, no additional storage
155 205 95 60 145 60
B2A Lower Angke Muara Karang, plus local waduk 30 ha
125 180 65 60 120 60
B2B Lower Angke Muara Karang, plus local waduk + open space emergency storage
120 170 60 60 110 60
B3 Lower Angke Muara Karang, plus additional available storage
100 150 40 60 90 60
B4N Northern LA polder, no additional storage
29 47 9 20 22 25
Technical review and support Jakarta Flood Management System
December 2014, Final Report - Phase 2
22
T=25 T=100 T=25 T=100
System Combined Combined Lower Angke Karang Lower Angke Karang
B4S Southern LA polder (GroSec, Mookervaart), no additional storage, pump at Mookervaart
145 190
B5N as B4N, with waduk Lower Angke 30 ha
14 29 4 10 9 20
B5N-G as B4N, with green storage 41 ha
18 33 8 10 13 20
B5S-G As B4S, with green storage 9 ha, pump at Mookervaart
140 185
Table 3-1 – Required pump capacities for different scenarios under different return periods
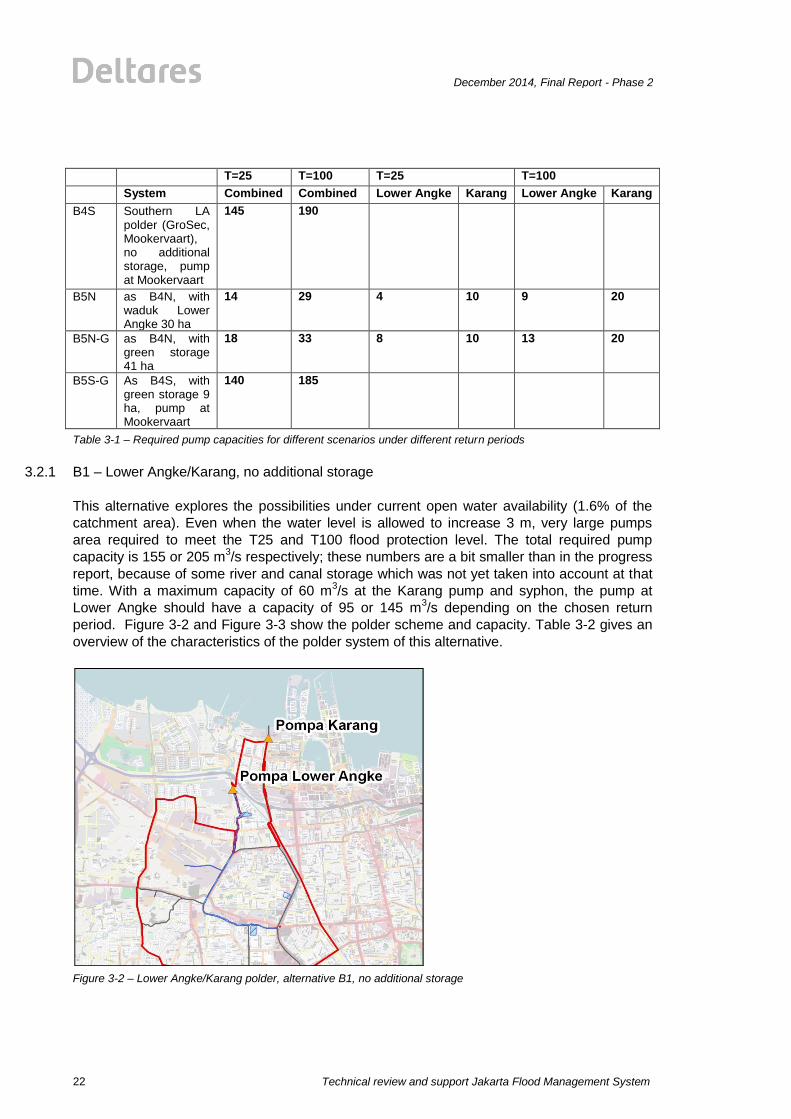
3.2.1 B1 – Lower Angke/Karang, no additional storage
This alternative explores the possibilities under current open water availability (1.6% of the
catchment area). Even when the water level is allowed to increase 3 m, very large pumps
area required to meet the T25 and T100 flood protection level. The total required pump
capacity is 155 or 205 m3/s respectively; these numbers are a bit smaller than in the progress
report, because of some river and canal storage which was not yet taken into account at that
time. With a maximum capacity of 60 m3/s at the Karang pump and syphon, the pump at
Lower Angke should have a capacity of 95 or 145 m3/s depending on the chosen return
period. Figure 3-2 and Figure 3-3 show the polder scheme and capacity. Table 3-2 gives an
overview of the characteristics of the polder system of this alternative.
Figure 3-2 – Lower Angke/Karang polder, alternative B1, no additional storage
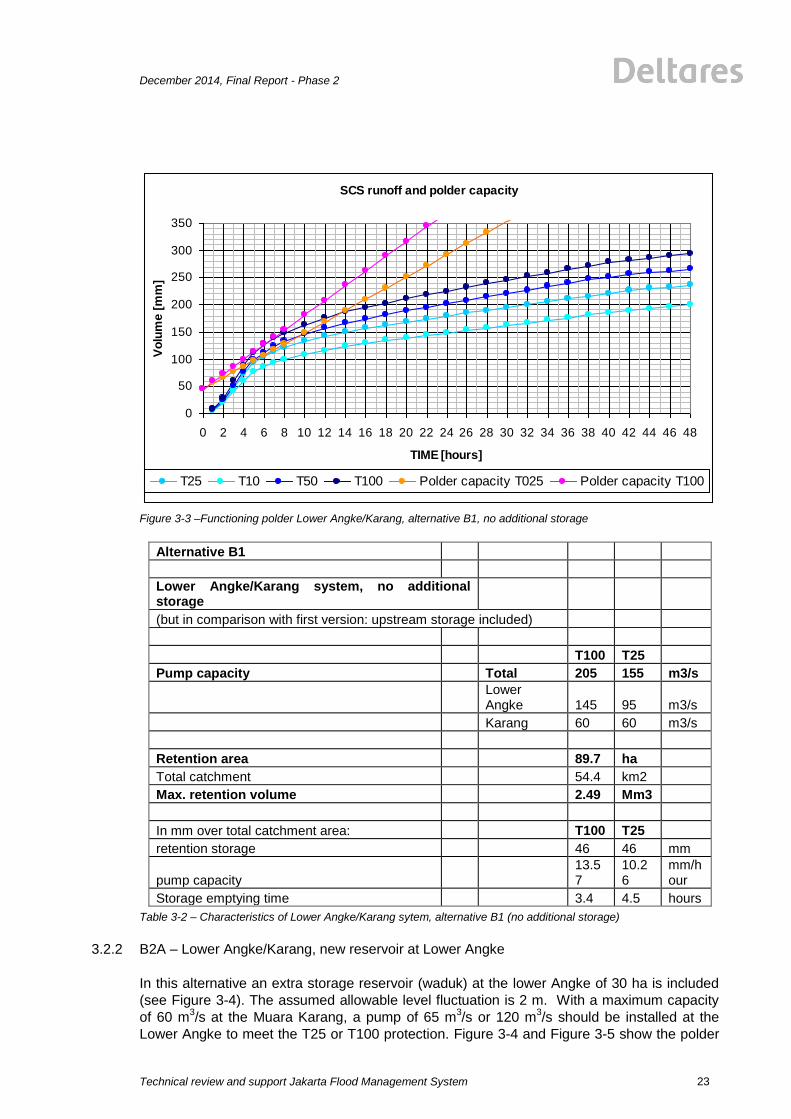
December 2014, Final Report - Phase 2
Technical review and support Jakarta Flood Management System
23
Figure 3-3 –Functioning polder Lower Angke/Karang, alternative B1, no additional storage
Alternative B1
Lower Angke/Karang system, no additional storage
(but in comparison with first version: upstream storage included)
T100 T25
Pump capacity Total 205 155 m3/s
Lower Angke 145 95 m3/s
Karang 60 60 m3/s
Retention area 89.7 ha
Total catchment 54.4 km2
Max. retention volume 2.49 Mm3
In mm over total catchment area: T100 T25
retention storage 46 46 mm
pump capacity 13.57
10.26
mm/hour
Storage emptying time 3.4 4.5 hours
Table 3-2 – Characteristics of Lower Angke/Karang sytem, alternative B1 (no additional storage)
3.2.2 B2A – Lower Angke/Karang, new reservoir at Lower Angke
In this alternative an extra storage reservoir (waduk) at the lower Angke of 30 ha is included
(see Figure 3-4). The assumed allowable level fluctuation is 2 m. With a maximum capacity
of 60 m3/s at the Muara Karang, a pump of 65 m
3/s or 120 m
3/s should be installed at the
Lower Angke to meet the T25 or T100 protection. Figure 3-4 and Figure 3-5 show the polder
SCS runoff and polder capacity
0
50
100
150
200
250
300
350
0 2 4 6 8 10 12 14 16 18 20 22 24 26 28 30 32 34 36 38 40 42 44 46 48
TIME [hours]
Vo
lum
e [
mm
]
T25 T10 T50 T100 Polder capacity T025 Polder capacity T100

Technical review and support Jakarta Flood Management System
December 2014, Final Report - Phase 2
24
scheme and the capacity of the polder. Table 3-3 summarises the characteristics of the
polder in this alternative.
Figure 3-4 – Location of 30 ha storage reservoir at Lower Angke, alternative B2A
Figure 3-5 – Functioning polder Lower Angke/Karang, alternative B2A, 30 ha reservoir at Lower Angke
SCS runoff and polder capacity
0
50
100
150
200
250
300
350
0 2 4 6 8 10 12 14 16 18 20 22 24 26 28 30 32 34 36 38 40 42 44 46 48
TIME [hours]
Vo
lum
e [
mm
]
T25 T10 T50 T100 Polder capacity T025 Polder capacity T100
Storage

December 2014, Final Report - Phase 2
Technical review and support Jakarta Flood Management System
25
Table 3-3 – Characteristics of Lower Angke/Karang sytem, alternative B2A (30 ha additional reservoir)
Alternative B2A
Lower Angke/Karang system
Additional storage 30 ha Lower Ange waduk
T100 T25
Pump capacity Total 180.0 125 m3/s
Lower Angke 120 65 m3/s
Karang 60 60 m3/s
Retention area 119.7 ha
Total catchment 54.4 km2
Max. retention volume 3.09 Mm3
In mm over total catchment area: T100 T25
retention storage 57 57 mm
pump capacity 11.91 8.27 mm/hour
Storage emptying time 4.8 6.9 hours
3.2.3 B2B – Lower Angke/Karang, 30 ha waduk and 12 ha emergency storage
In comparison to B2A, not only a 30 ha reservoir with 2 m level variation is included, but this
reservoir is connected with additionally 12 ha open space. On this open space we assume 1
m depth of water is allowed in emergency conditions. The additional 12 ha emergency space
reduces the required pump capacity with about 5 m3/s. Figure 3-6 shows the location of the
30 ha reservoir at Lower Angke and the 12 ha emergency storage. Figure 3-7 shows the
polder scheme and capacity. The characteristics of the system in this alternative are
summarised in the next table.
Figure 3-6 – 30 ha reservoir at Lower Angke, and 12 ha emergency storage

Technical review and support Jakarta Flood Management System
December 2014, Final Report - Phase 2
26
Figure 3-7 – Functioning polder – 30 ha storage at Lower Angke pump and emergency storage
Alternative B2B
Lower Angke/Karang system with waduk 30 ha as B2A
Additionally 12 ha emergency storage (1m)
T100 T25
Pump capacity Total 170 120 m3/s
Lower Angke 110 60 m3/s
Karang 60 60 m3/s
Retention area 131.7 ha
Total catchment area 54.4 km2
Max. retention volume 3.2 Mm3
In mm over total catchment area: T100 T25
retention storage 59 59 mm
pump capacity 11.25 7.94 mm/hour
Storage emptying time 5.2 7.4 hours
Table 3-4 –Lower Angke/Karang system, alternative B2B (=B2A + 12 ha open emergency storage)
SCS runoff and polder capacity
0
50
100
150
200
250
300
350
0 2 4 6 8 10 12 14 16 18 20 22 24 26 28 30 32 34 36 38 40 42 44 46 48
TIME [hours]
Vo
lum
e [
mm
]
T25 T10 T50 T100 Polder capacity T025 Polder capacity T100

December 2014, Final Report - Phase 2
Technical review and support Jakarta Flood Management System
27
3.2.4 B3 – as B2B, but with all possible green area as emergency storage
A number of other green space emergency storage areas has been identified. It will be a
challenge to realise all these storages, but the calculation was made to check how much
pumping capacity this would save. The allowed water depth is set at 1 m. The additional 50
ha emergency space reduces the required pump capacity with about 20 m3/s.
Figure 3-8 shows the additional retention areas. Figure 3-9 shows the polder scheme and
capacity. Table 3-5 shows the characteristics of the Lower Angke/Karang polder for this
alternative.
Figure 3-8 – Additional retention areas in Lower Angke, alternative B3

Technical review and support Jakarta Flood Management System
December 2014, Final Report - Phase 2
28
Figure 3-9 – Functioning polder Lower Angke, alternative B3 = B2B plus 50 ha additional emergency storage
Alternative B3
Lower Angke/Karang system as B2B, plus all other green emergency storage (1m)
T100 T25
Pump capacity Total 150 100 m3/s
Lower Angke 90 40 m3/s
Karang 60 60 m3/s
Retention area 182.4 ha
Total catchment 54.4 km2
Max. retention volume 3.72 Mm3
In mm over total catchment area: T100 T25
retention storage 68 68 mm
pump capacity 9.93 6.62 mm/hour
Storage emptying time 6.9 10.3 hours
Table 3-5 – Characteristics of Lower Angke/Karang system, alternative B3 (B2B + 50 ha extra emergency storage)
SCS runoff and polder capacity
0
50
100
150
200
250
300
350
0 2 4 6 8 10 12 14 16 18 20 22 24 26 28 30 32 34 36 38 40 42 44 46 48
TIME [hours]
Vo
lum
e [
mm
]
T25 T10 T50 T100 Polder capacity T025 Polder capacity T100
December 2014, Final Report - Phase 2
Technical review and support Jakarta Flood Management System
29
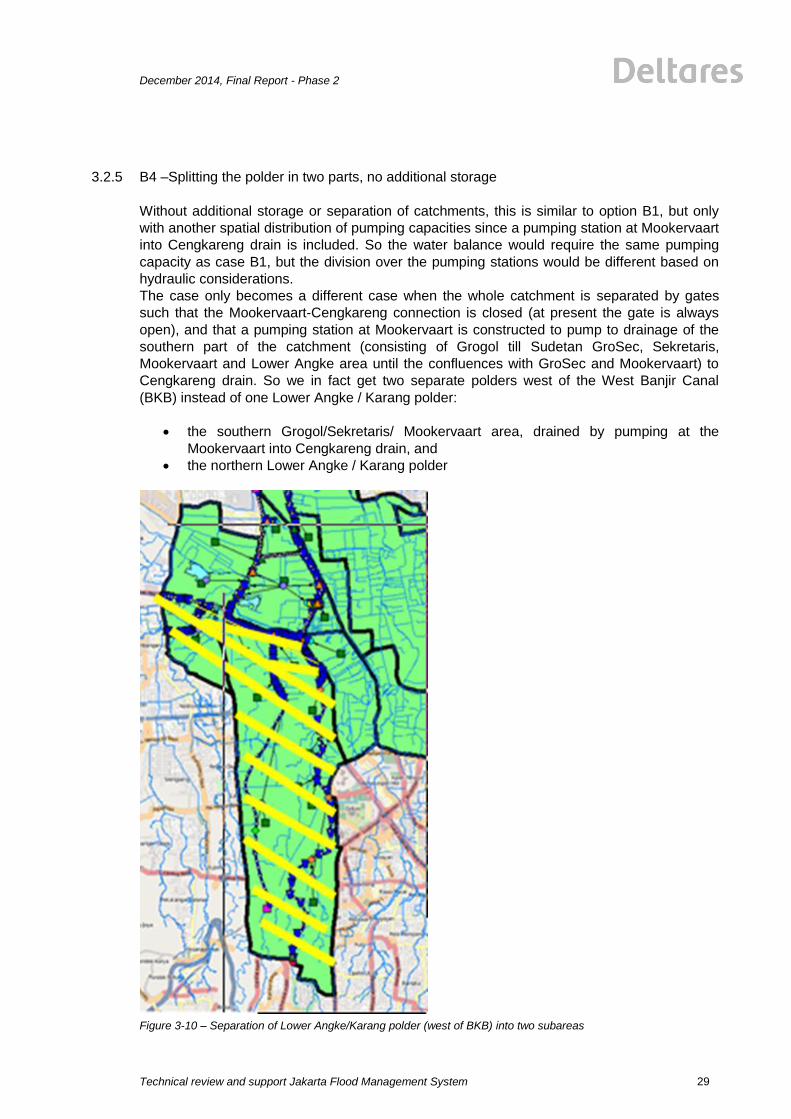
3.2.5 B4 –Splitting the polder in two parts, no additional storage
Without additional storage or separation of catchments, this is similar to option B1, but only
with another spatial distribution of pumping capacities since a pumping station at Mookervaart
into Cengkareng drain is included. So the water balance would require the same pumping
capacity as case B1, but the division over the pumping stations would be different based on
hydraulic considerations.
The case only becomes a different case when the whole catchment is separated by gates
such that the Mookervaart-Cengkareng connection is closed (at present the gate is always
open), and that a pumping station at Mookervaart is constructed to pump to drainage of the
southern part of the catchment (consisting of Grogol till Sudetan GroSec, Sekretaris,
Mookervaart and Lower Angke area until the confluences with GroSec and Mookervaart) to
Cengkareng drain. So we in fact get two separate polders west of the West Banjir Canal
(BKB) instead of one Lower Angke / Karang polder:
the southern Grogol/Sekretaris/ Mookervaart area, drained by pumping at the
Mookervaart into Cengkareng drain, and
the northern Lower Angke / Karang polder
Figure 3-10 – Separation of Lower Angke/Karang polder (west of BKB) into two subareas
Technical review and support Jakarta Flood Management System
December 2014, Final Report - Phase 2
30
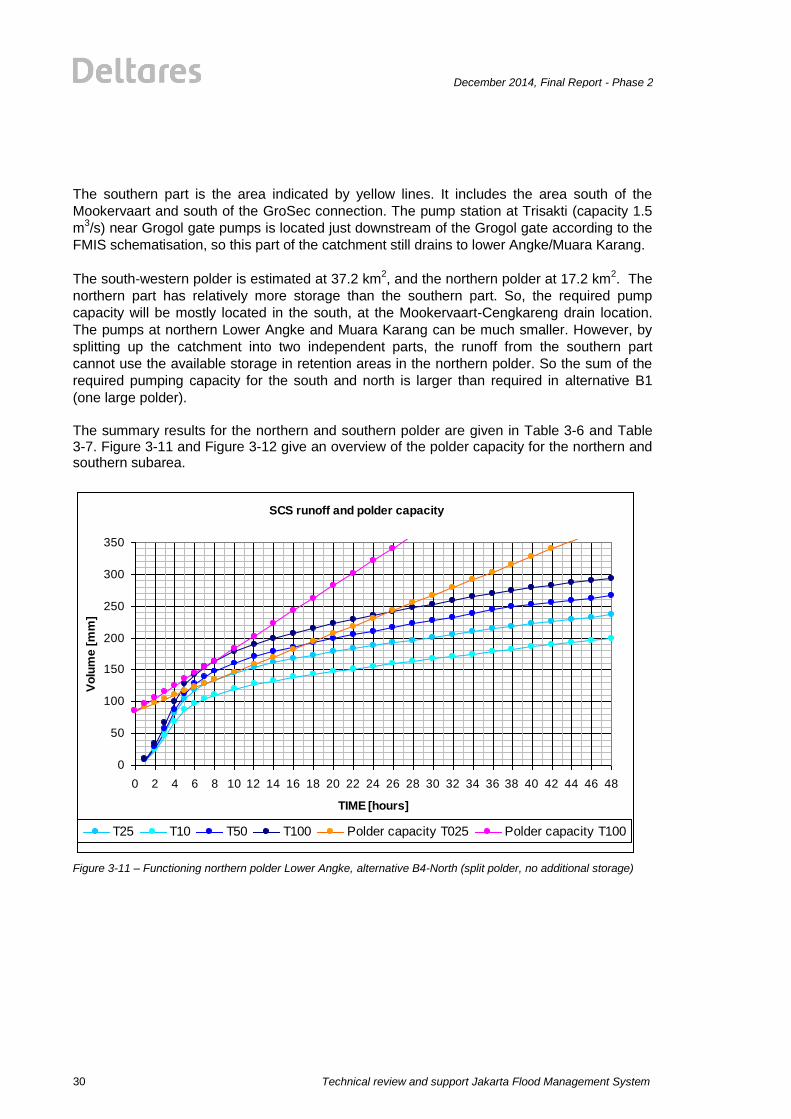
The southern part is the area indicated by yellow lines. It includes the area south of the
Mookervaart and south of the GroSec connection. The pump station at Trisakti (capacity 1.5
m3/s) near Grogol gate pumps is located just downstream of the Grogol gate according to the
FMIS schematisation, so this part of the catchment still drains to lower Angke/Muara Karang.
The south-western polder is estimated at 37.2 km2, and the northern polder at 17.2 km
2. The
northern part has relatively more storage than the southern part. So, the required pump
capacity will be mostly located in the south, at the Mookervaart-Cengkareng drain location.
The pumps at northern Lower Angke and Muara Karang can be much smaller. However, by
splitting up the catchment into two independent parts, the runoff from the southern part
cannot use the available storage in retention areas in the northern polder. So the sum of the
required pumping capacity for the south and north is larger than required in alternative B1
(one large polder).
The summary results for the northern and southern polder are given in Table 3-6 and Table 3-7. Figure 3-11 and Figure 3-12 give an overview of the polder capacity for the northern and southern subarea.
Figure 3-11 – Functioning northern polder Lower Angke, alternative B4-North (split polder, no additional storage)
SCS runoff and polder capacity
0
50
100
150
200
250
300
350
0 2 4 6 8 10 12 14 16 18 20 22 24 26 28 30 32 34 36 38 40 42 44 46 48
TIME [hours]
Vo
lum
e [
mm
]
T25 T10 T50 T100 Polder capacity T025 Polder capacity T100
December 2014, Final Report - Phase 2
Technical review and support Jakarta Flood Management System
31
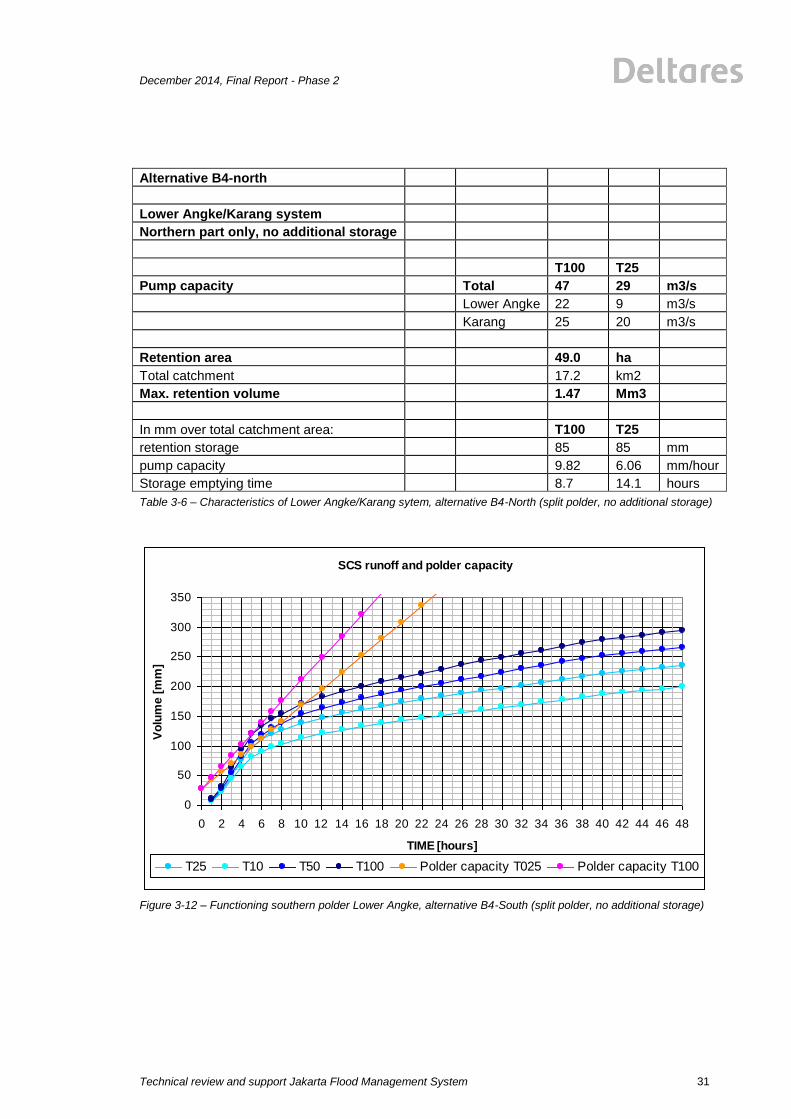
Alternative B4-north
Lower Angke/Karang system
Northern part only, no additional storage
T100 T25
Pump capacity Total 47 29 m3/s
Lower Angke 22 9 m3/s
Karang 25 20 m3/s
Retention area 49.0 ha
Total catchment 17.2 km2
Max. retention volume 1.47 Mm3
In mm over total catchment area: T100 T25
retention storage 85 85 mm
pump capacity 9.82 6.06 mm/hour
Storage emptying time 8.7 14.1 hours
Table 3-6 – Characteristics of Lower Angke/Karang sytem, alternative B4-North (split polder, no additional storage)
Figure 3-12 – Functioning southern polder Lower Angke, alternative B4-South (split polder, no additional storage)
SCS runoff and polder capacity
0
50
100
150
200
250
300
350
0 2 4 6 8 10 12 14 16 18 20 22 24 26 28 30 32 34 36 38 40 42 44 46 48
TIME [hours]
Vo
lum
e [
mm
]
T25 T10 T50 T100 Polder capacity T025 Polder capacity T100
Technical review and support Jakarta Flood Management System
December 2014, Final Report - Phase 2
32
Alternative B4-south
Lower Angke/Karang system south (Grosec, Mookervaart)
No additional storage, Pump from Mookervaart to Cengkareng
T100 T25
Pump capacity Total 190 145 m3/s
Mookervaart 190 145 m3/s
Retention area 40.7 ha
Total catchment area 37.2 km2
Max. retention volume 1.0 Mm3
In mm over total catchment area: T100 T25
retention storage 27 27 mm
pump capacity 18.40 14.04 mm/hour
Storage emptying time 1.5 2.0 hours
Table 3-7 – Characteristics of Lower Angke/Karang sytem, alternative B4-South (split polder, no additional storage)
Another question which remains to be answered is whether the Cengkareng drain can handle
the additional amount of water coming from the southern polder through the pumping stations
at the Mookervaart.
At present, the gate from Mookervaart to Cengkareng drain is open and cannot be closed.
This means that during high tide Cengkareng water may flow into the Mookervaart, while
during low tide Mookervaart already drains to Cengkareng. According to maps of PU,
Cengkareng drain design flow (Q50) is 566 m3/s, while the present maximum flow is about
300-340 m3/s. However, FMIS simulations in cases without tide and without inflow from the
Mookervaart to Cengkareng show a much lower flow at Cengkareng gate (150-180 m3/s) and
already a very full Cengkareng drain, with some local flooding. So it is doubtful whether
Cengkareng can handle such big additional flows from the GroSec-Mookervaart system. This
requires further analysis.

December 2014, Final Report - Phase 2
Technical review and support Jakarta Flood Management System
33
Figure 3-13 – Information on Cengkareng drain from PU map
If Cengkareng drain cannot handle the additional flow, an option would be the future
Cengkareng II drain, taking the upstream Angke flow which at present flows through
Cengkareng drain. However, this option will take several years to be realised since there are
no solid and agreed plans for Cengkareng II yet.
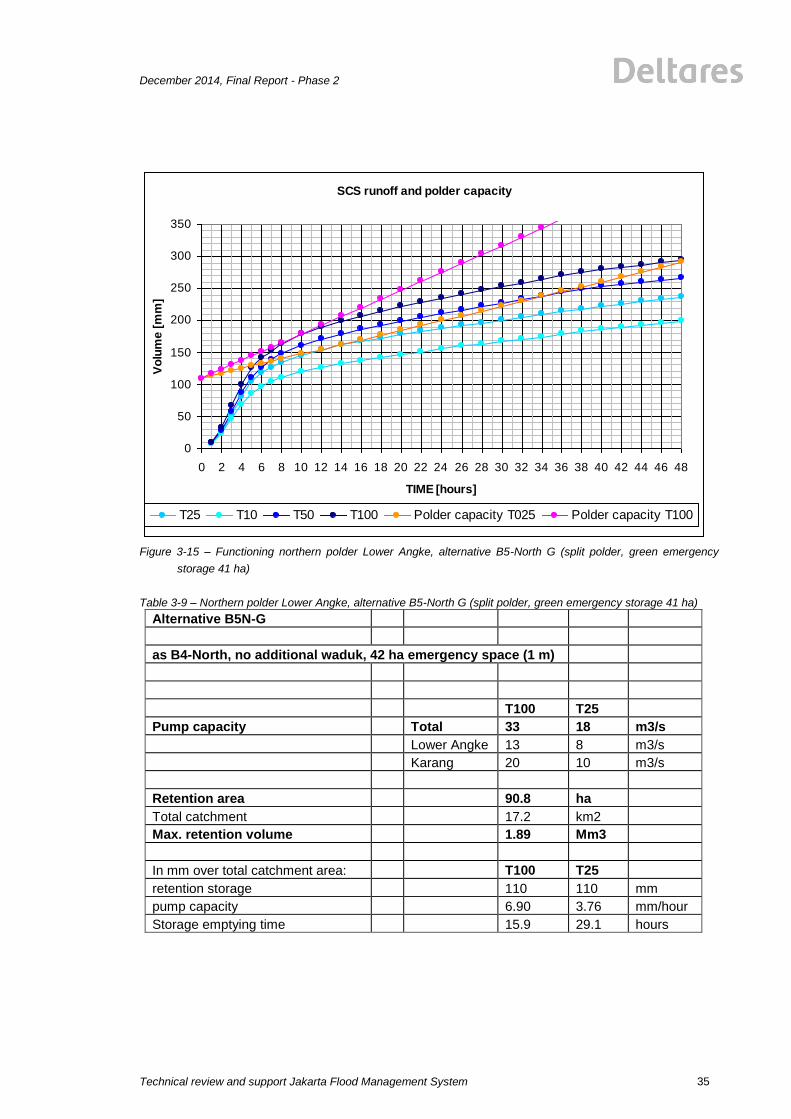
3.2.6 B5 –Splitting the polder area in two parts, additional storage
This option is similar to option B4, but now with additional storage. For the northern polder,
the options are the identified reservoir area of 30 ha or a smaller version of this reservoir, or
some green space emergency storage areas (41 ha). To see the maximum effect on the
required pumping capacity, the 30 ha size reservoir is selected. For the southern polder, there
is one additional green space emergency storage area (9 ha). The emergency storage areas
are already indicated in Figure 3-8 for alternative B3. The results are given in Figure 3-14 to
Figure 3-16 and in Table 3-8 to Table 3-10.

Technical review and support Jakarta Flood Management System
December 2014, Final Report - Phase 2
34
Figure 3-14 – Functioning northern polder Lower Angke, alternative B5-North A (split polder, reservoir 30 ha)
Alternative B5N-A
as B4-North, with additional waduk 30 ha (2 m)
T100 T25
Pump capacity Total 29 14 m3/s
Lower Angke 9 4 m3/s
Karang 20 10 m3/s
Retention area 79.0 ha
Total catchment 17.2 km2
Max. retention volume 2.07 Mm3
In mm over total catchment area: T100 T25
retention storage 120 120 mm
pump capacity 6.06 2.93 mm/hour
Storage emptying time 19.8 41.1 hours
Table 3-8 – Characteristics of Lower Angke/Karang sytem, alternative B5-North A (split polder, reservoir 30 ha)
SCS runoff and polder capacity
0
50
100
150
200
250
300
350
0 2 4 6 8 10 12 14 16 18 20 22 24 26 28 30 32 34 36 38 40 42 44 46 48
TIME [hours]
Vo
lum
e [
mm
]
T25 T10 T50 T100 Polder capacity T025 Polder capacity T100
December 2014, Final Report - Phase 2
Technical review and support Jakarta Flood Management System
35
Figure 3-15 – Functioning northern polder Lower Angke, alternative B5-North G (split polder, green emergency
storage 41 ha)
Table 3-9 – Northern polder Lower Angke, alternative B5-North G (split polder, green emergency storage 41 ha)
Alternative B5N-G
as B4-North, no additional waduk, 42 ha emergency space (1 m)
T100 T25
Pump capacity Total 33 18 m3/s
Lower Angke 13 8 m3/s
Karang 20 10 m3/s
Retention area 90.8 ha
Total catchment 17.2 km2
Max. retention volume 1.89 Mm3
In mm over total catchment area: T100 T25
retention storage 110 110 mm
pump capacity 6.90 3.76 mm/hour
Storage emptying time 15.9 29.1 hours
SCS runoff and polder capacity
0
50
100
150
200
250
300
350
0 2 4 6 8 10 12 14 16 18 20 22 24 26 28 30 32 34 36 38 40 42 44 46 48
TIME [hours]
Vo
lum
e [
mm
]
T25 T10 T50 T100 Polder capacity T025 Polder capacity T100
Technical review and support Jakarta Flood Management System
December 2014, Final Report - Phase 2
36
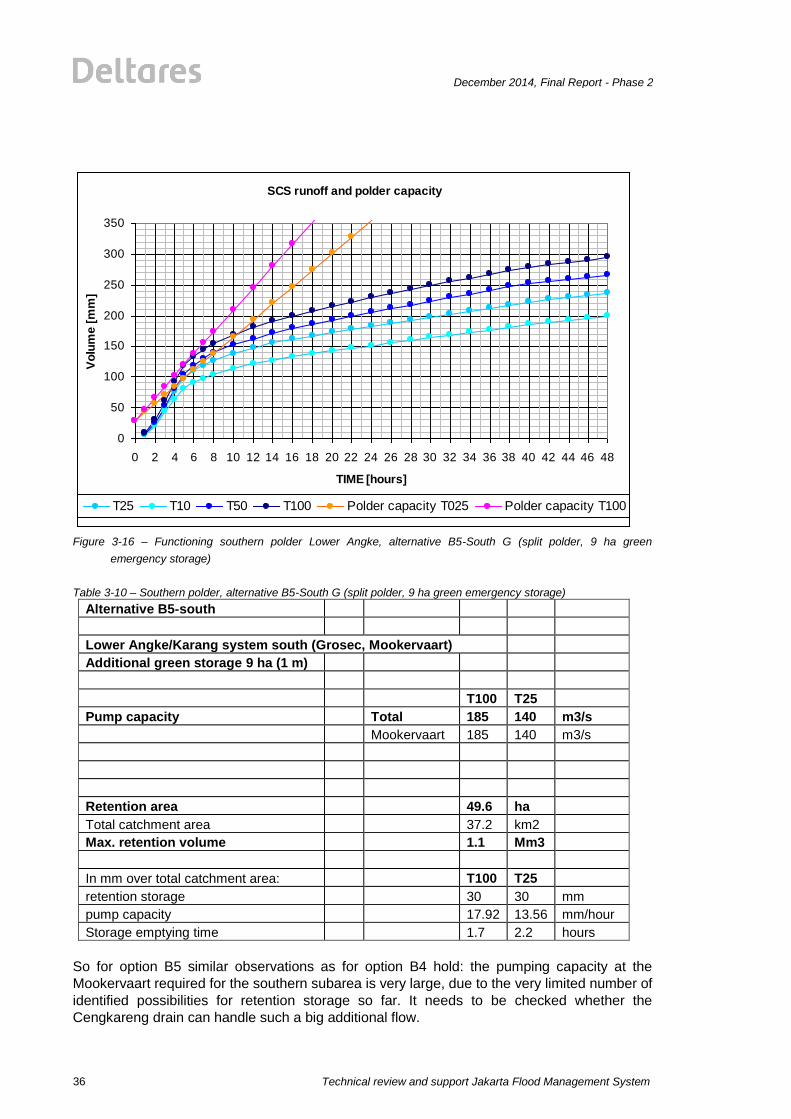
Figure 3-16 – Functioning southern polder Lower Angke, alternative B5-South G (split polder, 9 ha green
emergency storage)
Table 3-10 – Southern polder, alternative B5-South G (split polder, 9 ha green emergency storage)
Alternative B5-south
Lower Angke/Karang system south (Grosec, Mookervaart)
Additional green storage 9 ha (1 m)
T100 T25
Pump capacity Total 185 140 m3/s
Mookervaart 185 140 m3/s
Retention area 49.6 ha
Total catchment area 37.2 km2
Max. retention volume 1.1 Mm3
In mm over total catchment area: T100 T25
retention storage 30 30 mm
pump capacity 17.92 13.56 mm/hour
Storage emptying time 1.7 2.2 hours
So for option B5 similar observations as for option B4 hold: the pumping capacity at the
Mookervaart required for the southern subarea is very large, due to the very limited number of
identified possibilities for retention storage so far. It needs to be checked whether the
Cengkareng drain can handle such a big additional flow.
SCS runoff and polder capacity
0
50
100
150
200
250
300
350
0 2 4 6 8 10 12 14 16 18 20 22 24 26 28 30 32 34 36 38 40 42 44 46 48
TIME [hours]
Vo
lum
e [
mm
]
T25 T10 T50 T100 Polder capacity T025 Polder capacity T100
December 2014, Final Report - Phase 2
Technical review and support Jakarta Flood Management System
37
3.2.7 Other possible options
The standard operation of the polder systems (Lower Angke/Muara Karang, Marina/Sentiong)
would be to have the polders work as separate polder systems. It would however be possible
to connect neighbouring polders with the already existing Pluit polder, to be more flexible in
case of emergencies. The polders could be connected by having a (movable) gate in
between. Making such a connection is possible since the operational levels of the new
polders are all put at the same levels as Pluit operational levels. The most obvious connection
is at the Muara Karang area, since this is immediately adjacent to Pluit.
Currently DKI is installing new pumps in Pluit polder (at Pasar Ikan, Melati, and Pluit), thus
extending the Pluit pumping capacity considerably. After installing these additional pumps the
capacity of the Pluit polder should be sufficient, assuming proper maintenance of the pumps,
hydraulic infrastructure, sea defence and BKB levees. Especially the large pump capacity at
Pluit reservoir could be easily connected to the Muara Karang, connecting both systems. In
this way the systems can assist each other, since the probability of having a design event at
the same time in both catchments is less than the return period of the design event. So this
connection could work in two directions:
When the Pluit system is overloaded (heavy rainfall or emergency), the Karang pump
can be used to help draining the Pluit system;
When the Lower Angke/Karang system is overloaded and storage is available in the
Pluit system, water can be discharged to Pluit reservoir and the excess pump
capacity at Pluit can be used to drain the Lower Angke/Karang system.
The connection of different systems could be already taken into account in the design of the
pump capacities, and would reduce the overall total pumping capacity to be installed. We
therefore recommend to further analyse the option to connect the polder systems.
3.3 Verification with the hydraulic model and JEDI Synchronization
3.3.1 Introduction
At this moment it is advised to operate the Lower Angke/Karang system on -2 m PP*. To
prevent soil and sediment from drying out in the dry season and for water quality purposes it
is advised to dredge the bottom of the long storage drains to at least -3 m PP*, where the
JEDI designs use a higher bottom level. Figure 3-17 shows bottom levels according as
designed and as required.
When looking at the Lower Angke drain in alternative B1 (no additional storage), the water
balance calculations indicate a very high required pumping capacity required in T100 at
Lower Angke. As explained in Appendix A, the discharge capacity of a canal can be
estimated using the Manning equation. When using the bottom level of -3 m PP*, a Manning
roughness coefficient of 0.04 s.m-1/3
and a slope of 10 cm/km, a discharge capacity of 160
m3/s requires a rectangular canal of 40 m and depth of 6 m, or a canal of 50 m and a depth of
5 m. The Lower Angke width is about 40 m, so with a bottom level at -3 m PP* this would
require sheet piles (with capping of 1 m) up to +4 m PP*. So, when assuming no additional
storage in the system, the discharge capacity is barely enough and already needs very deep
canals (or high sheet piles) just to be able to convey the design flow.
In the hydraulic model we used both a pump and a gate at Lower Angke and Muara Karang.
The gate will allow additional discharge when the water levels in the polder are very high,
Technical review and support Jakarta Flood Management System
December 2014, Final Report - Phase 2
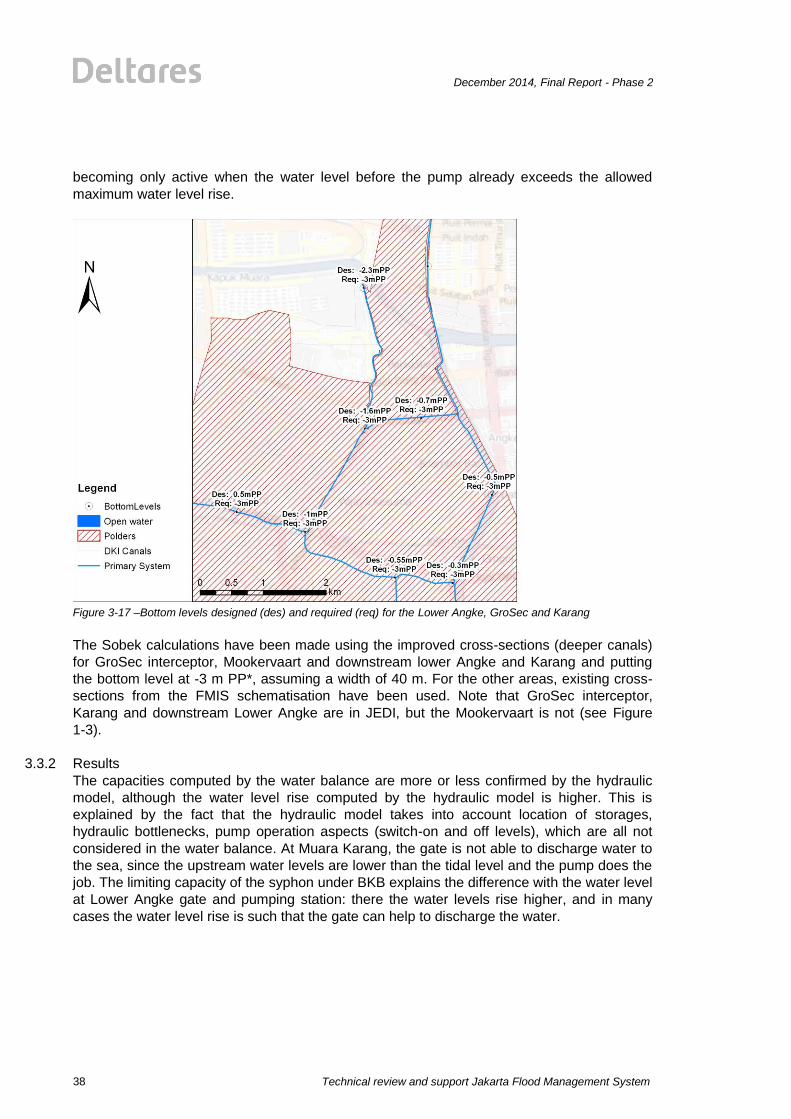
38
becoming only active when the water level before the pump already exceeds the allowed
maximum water level rise.
Figure 3-17 –Bottom levels designed (des) and required (req) for the Lower Angke, GroSec and Karang
The Sobek calculations have been made using the improved cross-sections (deeper canals)
for GroSec interceptor, Mookervaart and downstream lower Angke and Karang and putting
the bottom level at -3 m PP*, assuming a width of 40 m. For the other areas, existing cross-
sections from the FMIS schematisation have been used. Note that GroSec interceptor,
Karang and downstream Lower Angke are in JEDI, but the Mookervaart is not (see Figure
1-3).
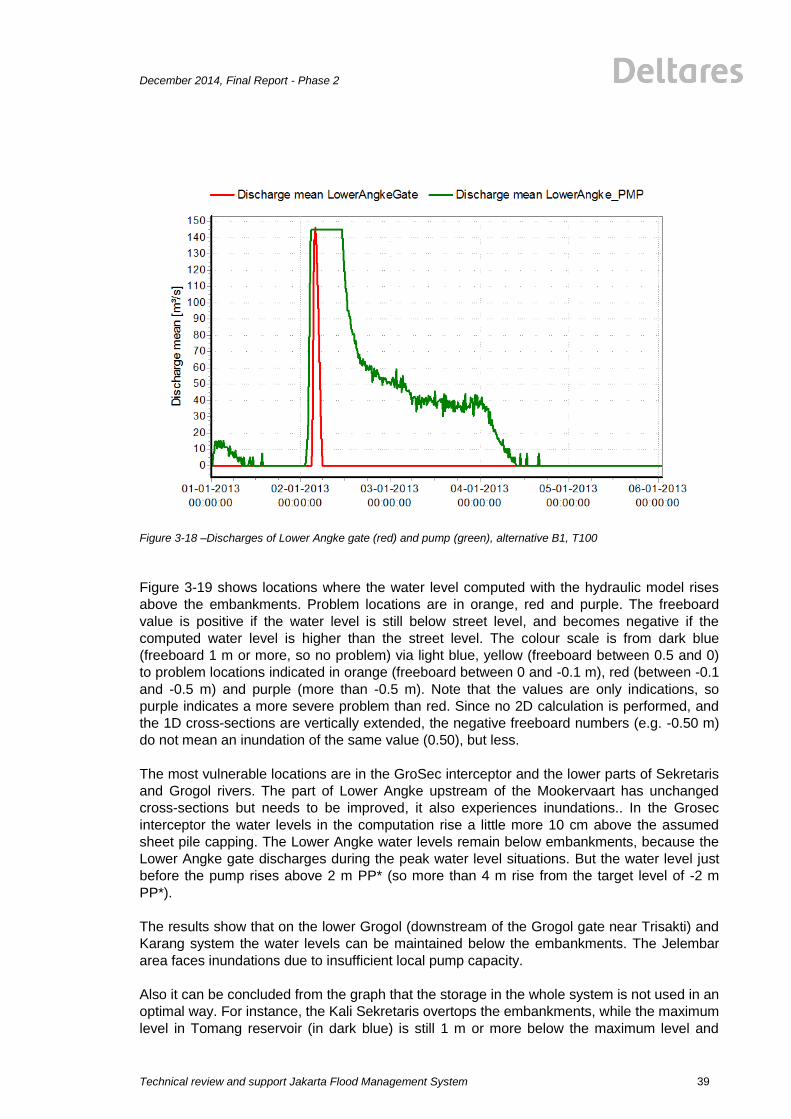
3.3.2 Results
The capacities computed by the water balance are more or less confirmed by the hydraulic
model, although the water level rise computed by the hydraulic model is higher. This is
explained by the fact that the hydraulic model takes into account location of storages,
hydraulic bottlenecks, pump operation aspects (switch-on and off levels), which are all not
considered in the water balance. At Muara Karang, the gate is not able to discharge water to
the sea, since the upstream water levels are lower than the tidal level and the pump does the
job. The limiting capacity of the syphon under BKB explains the difference with the water level
at Lower Angke gate and pumping station: there the water levels rise higher, and in many
cases the water level rise is such that the gate can help to discharge the water.
December 2014, Final Report - Phase 2
Technical review and support Jakarta Flood Management System
39
Figure 3-18 –Discharges of Lower Angke gate (red) and pump (green), alternative B1, T100
Figure 3-19 shows locations where the water level computed with the hydraulic model rises
above the embankments. Problem locations are in orange, red and purple. The freeboard
value is positive if the water level is still below street level, and becomes negative if the
computed water level is higher than the street level. The colour scale is from dark blue
(freeboard 1 m or more, so no problem) via light blue, yellow (freeboard between 0.5 and 0)
to problem locations indicated in orange (freeboard between 0 and -0.1 m), red (between -0.1
and -0.5 m) and purple (more than -0.5 m). Note that the values are only indications, so
purple indicates a more severe problem than red. Since no 2D calculation is performed, and
the 1D cross-sections are vertically extended, the negative freeboard numbers (e.g. -0.50 m)
do not mean an inundation of the same value (0.50), but less.
The most vulnerable locations are in the GroSec interceptor and the lower parts of Sekretaris
and Grogol rivers. The part of Lower Angke upstream of the Mookervaart has unchanged
cross-sections but needs to be improved, it also experiences inundations.. In the Grosec
interceptor the water levels in the computation rise a little more 10 cm above the assumed
sheet pile capping. The Lower Angke water levels remain below embankments, because the
Lower Angke gate discharges during the peak water level situations. But the water level just
before the pump rises above 2 m PP* (so more than 4 m rise from the target level of -2 m
PP*).
The results show that on the lower Grogol (downstream of the Grogol gate near Trisakti) and
Karang system the water levels can be maintained below the embankments. The Jelembar
area faces inundations due to insufficient local pump capacity.
Also it can be concluded from the graph that the storage in the whole system is not used in an
optimal way. For instance, the Kali Sekretaris overtops the embankments, while the maximum
level in Tomang reservoir (in dark blue) is still 1 m or more below the maximum level and

Technical review and support Jakarta Flood Management System
December 2014, Final Report - Phase 2
40
Tomang is pumping at full capacity. In case the Kali Sekretaris is full it might be better to store
water first in Tomang temporarily, while storage is still available.
The results of the hydraulic model show that alternative B1 (no additional storage) requires
deep canals and high sheet piles, but also indicates that the operation of the structures like
Grogol gate, Tobagus Angke gate, and the distribution of Jelembar area drainage (by pump
or gravity) needs to be further optimised.
An option to alleviate the high required discharge capacity at the Lower Angke could be to
install part of the pumping capacity at the Mookervaart–Cengkareng junction. In that situation
part of the flow will be through the Mookervaart to Cengkareng, thus reducing the required
discharge capacity at the Lower Angke. The details of this option require further analysis with
the hydraulic model
The assumed 60 m3/s capacity of the siphon of Lower Karang under the West Banjir Canal
(BKB) is confirmed by the hydraulic model. The hydraulic model also shows a large head loss
of up to 2 m over the siphon during the flood peak.
Figure 3-19 –Locations where water level rises above the 1D embankments, alternative B1, T100 event.
3.3.3 Impact of creation of western lake NCICD
All cases described above have been checked with the hydraulic model using the spring tide
plus 0.60 m anomaly for the 2014 situation. Using a mean sea level of 1.80 m PP* and a tidal
range of +- 0.50 m, this means the tidal boundary conditions vary within 1.3 and 2.3 m PP*.
For 2030, assuming a land subsidence of 7.5 cm per year, the same tidal boundary
conditions are equivalent to levels between 2.43 and 3.43 m PP*. The present calculations
indicate that using the spring tide conditions of 2014 at Muara Karang no use can be made of
the gates, since the water levels upstream of the pumps are for all cases below 0 m PP*.
However, at Lower Angke pump and gate the water levels rise much higher (and more than
desired) and the gate can still be used using the 2014 tidal boundary conditions during peak
water levels. This difference is because of the syphon before the pumping station at Muara

December 2014, Final Report - Phase 2
Technical review and support Jakarta Flood Management System
41
Karang with limited discharge capacity, causing the water levels at Muara Karang to be lower
than at Lower Angke pumping station. In 2030, the NCICD western lake is expected to be
developed. Preliminary proposed target levels are -0.9m +LWS2012 (NCICD, 2014A). This
translates to a downstream boundary of 0.98m +PP* in 2030, which is higher than the water
levels at Muara Karang, but still lower than peak water levels at lower Angke. This means the
pumps will still be needed after the western lake is created, but the gate at lower Angke can
still be used after creation of the western lake.
3.4 Synchronization with other hydraulic infrastructure
As mentioned in a previous paragraph, connecting the Lower Angke/Muara Karang polder
system to the Pluit polder system is an option which needs further analysis. The operational
levels used in the Lower Angke/Muara Karang system are higher than the operational water
levels of Pluit reservoir. This means that if Lower Angke / Muara Karang system experiences
flood conditions while Pluit does not, Pluit could help alleviate flood conditions in the Muara
Karang area. For the Lower Angke / Muara Karang system alternatives B4 and B5 a further
analysis of Cengkareng drain capacity is important, as well as possible plans for
implementing Cengkareng II.
From the Sobek hydraulic calculations it is concluded that the required high discharge
capacity at the Lower Angke, especially in the B1 alternative, results in high required
maximum depths. Installing part of the pumping capacity at the Mookervaart will reduce the
required downstream depths, but this is only possible if Cengkareng drain capacity allows
this.
The siphon at the crossing of Karang with BKB forms a hydraulic bottle-neck with a large
head loss during flood peaks.
Another conclusion is that some use of local storage may be optimised, since the Karang
system seemed ok, while in the Lower Angke system the water level rises much higher.. It is
therefore advised to check the operation of the gates in the system (Grogol gate, Tobagus
Angke gate), and to check the operation of local pumps (Jelembar, Trisakti and others) and
check if a smart operation of the local pumps can reduce the pressure on the Lower Angke
system.
During normal conditions, due to the operational level of about -2 m PP*, some area which is
now pumped may be drained by gravity. However, in flood conditions the local pumps will be
needed.
An important structure is on the upstream boundary of the polder in Pondok Indah, where the
upper Grogol is flowing via the sudetan to Pesanggrahan river. It is absolutely necessary for
the Lower Angke/Karang system that the flood waters from upper Grogol are diverted to
Pesanggrahan and Cengkareng drain (as assumed in the polder design), since the Lower
Angke/Karang system cannot handle additional inflow from the upper Grogol during flood
conditions.
Technical review and support Jakarta Flood Management System
December 2014, Final Report - Phase 2
42
4 Marina/Sentiong polder
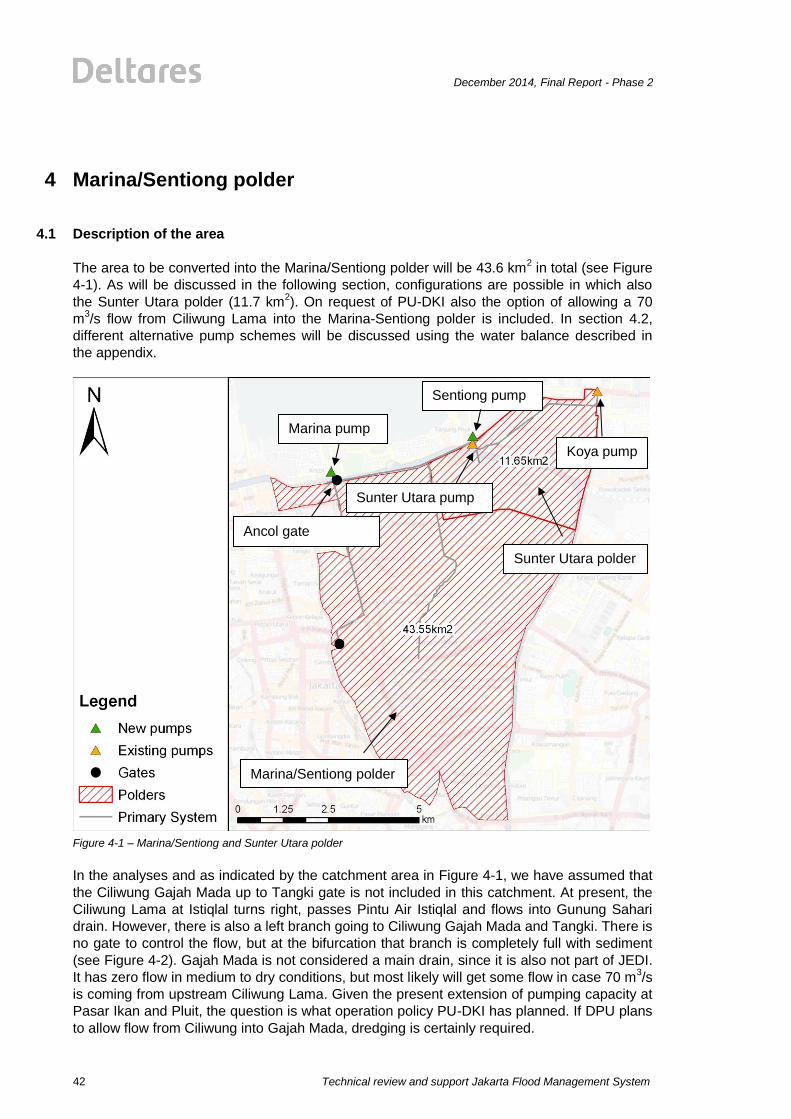
4.1 Description of the area
The area to be converted into the Marina/Sentiong polder will be 43.6 km2 in total (see Figure
4-1). As will be discussed in the following section, configurations are possible in which also
the Sunter Utara polder (11.7 km2). On request of PU-DKI also the option of allowing a 70
m3/s flow from Ciliwung Lama into the Marina-Sentiong polder is included. In section 4.2,
different alternative pump schemes will be discussed using the water balance described in
the appendix.
Figure 4-1 – Marina/Sentiong and Sunter Utara polder
In the analyses and as indicated by the catchment area in Figure 4-1, we have assumed that
the Ciliwung Gajah Mada up to Tangki gate is not included in this catchment. At present, the
Ciliwung Lama at Istiqlal turns right, passes Pintu Air Istiqlal and flows into Gunung Sahari
drain. However, there is also a left branch going to Ciliwung Gajah Mada and Tangki. There is
no gate to control the flow, but at the bifurcation that branch is completely full with sediment
(see Figure 4-2). Gajah Mada is not considered a main drain, since it is also not part of JEDI.
It has zero flow in medium to dry conditions, but most likely will get some flow in case 70 m3/s
is coming from upstream Ciliwung Lama. Given the present extension of pumping capacity at
Pasar Ikan and Pluit, the question is what operation policy PU-DKI has planned. If DPU plans
to allow flow from Ciliwung into Gajah Mada, dredging is certainly required.
Marina/Sentiong polder
Sunter Utara polder
Sunter Utara pump
Koya pump
Marina pump
Sentiong pump
Ancol gate
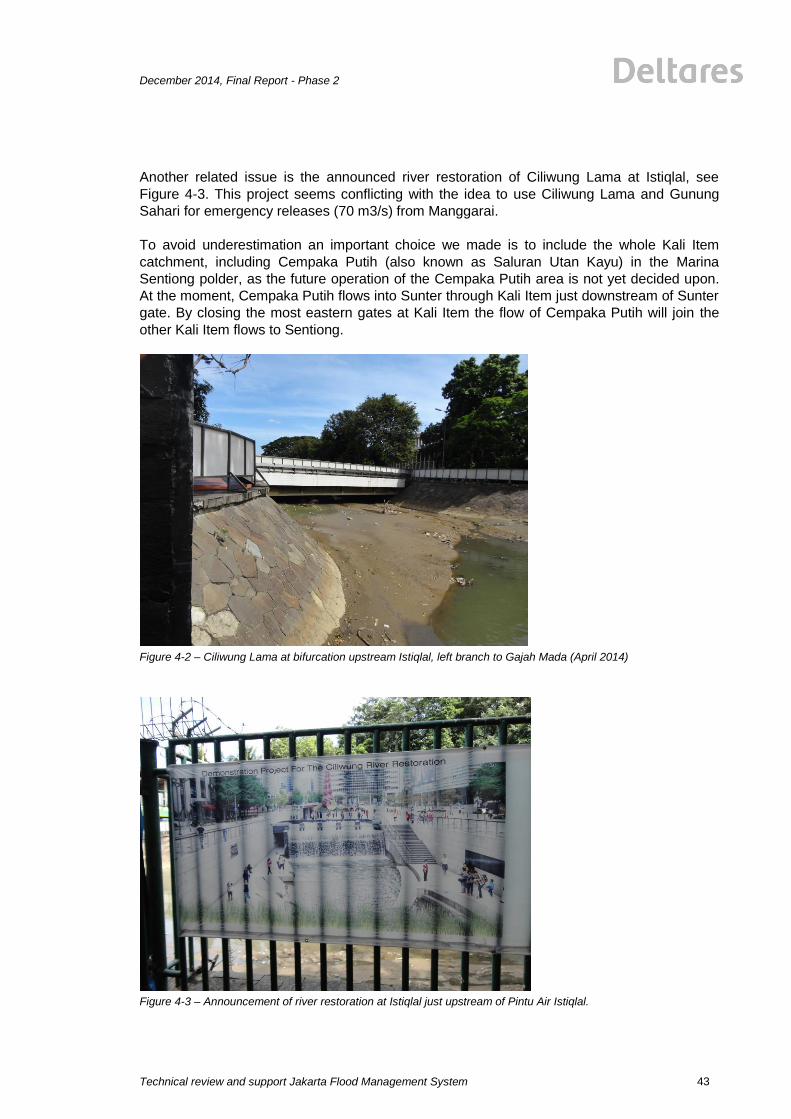
December 2014, Final Report - Phase 2
Technical review and support Jakarta Flood Management System
43
Another related issue is the announced river restoration of Ciliwung Lama at Istiqlal, see
Figure 4-3. This project seems conflicting with the idea to use Ciliwung Lama and Gunung
Sahari for emergency releases (70 m3/s) from Manggarai.
To avoid underestimation an important choice we made is to include the whole Kali Item
catchment, including Cempaka Putih (also known as Saluran Utan Kayu) in the Marina
Sentiong polder, as the future operation of the Cempaka Putih area is not yet decided upon.
At the moment, Cempaka Putih flows into Sunter through Kali Item just downstream of Sunter
gate. By closing the most eastern gates at Kali Item the flow of Cempaka Putih will join the
other Kali Item flows to Sentiong.
Figure 4-2 – Ciliwung Lama at bifurcation upstream Istiqlal, left branch to Gajah Mada (April 2014)
Figure 4-3 – Announcement of river restoration at Istiqlal just upstream of Pintu Air Istiqlal.
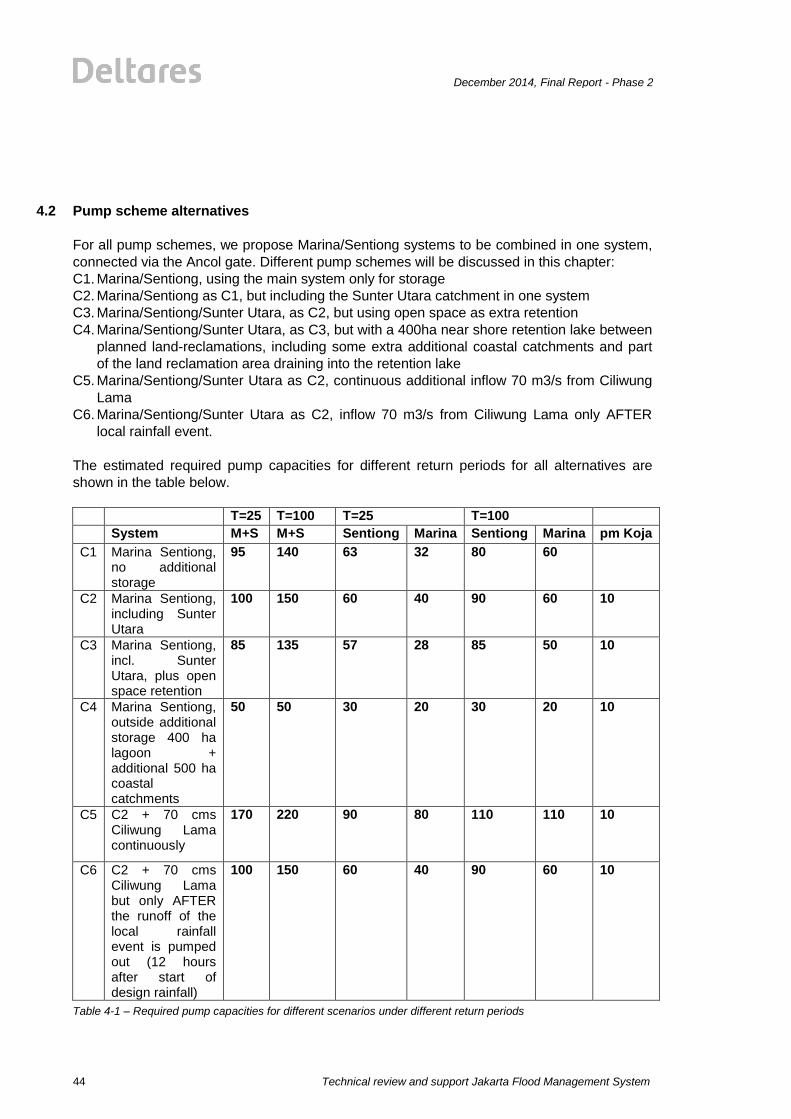
Technical review and support Jakarta Flood Management System
December 2014, Final Report - Phase 2
44
4.2 Pump scheme alternatives
For all pump schemes, we propose Marina/Sentiong systems to be combined in one system,
connected via the Ancol gate. Different pump schemes will be discussed in this chapter:
C1. Marina/Sentiong, using the main system only for storage
C2. Marina/Sentiong as C1, but including the Sunter Utara catchment in one system
C3. Marina/Sentiong/Sunter Utara, as C2, but using open space as extra retention
C4. Marina/Sentiong/Sunter Utara, as C3, but with a 400ha near shore retention lake between
planned land-reclamations, including some extra additional coastal catchments and part
of the land reclamation area draining into the retention lake
C5. Marina/Sentiong/Sunter Utara as C2, continuous additional inflow 70 m3/s from Ciliwung
Lama
C6. Marina/Sentiong/Sunter Utara as C2, inflow 70 m3/s from Ciliwung Lama only AFTER
local rainfall event.
The estimated required pump capacities for different return periods for all alternatives are
shown in the table below.
T=25 T=100 T=25 T=100
System M+S M+S Sentiong Marina Sentiong Marina pm Koja
C1 Marina Sentiong, no additional storage
95 140 63 32 80 60
C2 Marina Sentiong, including Sunter Utara
100 150 60 40 90 60 10
C3 Marina Sentiong, incl. Sunter Utara, plus open space retention
85 135 57 28 85 50 10
C4 Marina Sentiong, outside additional storage 400 ha lagoon + additional 500 ha coastal catchments
50 50 30 20 30 20 10
C5 C2 + 70 cms Ciliwung Lama continuously
170 220 90 80 110 110 10
C6 C2 + 70 cms Ciliwung Lama but only AFTER the runoff of the local rainfall event is pumped out (12 hours after start of design rainfall)
100 150 60 40 90 60 10
Table 4-1 – Required pump capacities for different scenarios under different return periods
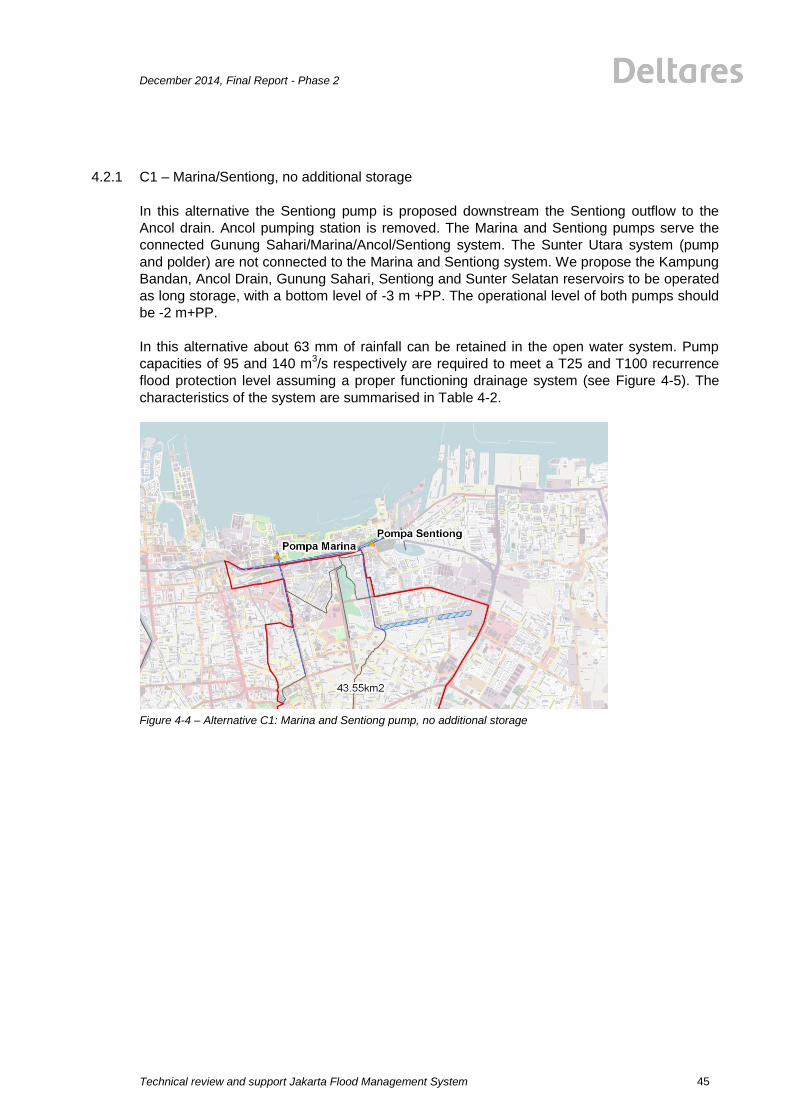
December 2014, Final Report - Phase 2
Technical review and support Jakarta Flood Management System
45
4.2.1 C1 – Marina/Sentiong, no additional storage
In this alternative the Sentiong pump is proposed downstream the Sentiong outflow to the
Ancol drain. Ancol pumping station is removed. The Marina and Sentiong pumps serve the
connected Gunung Sahari/Marina/Ancol/Sentiong system. The Sunter Utara system (pump
and polder) are not connected to the Marina and Sentiong system. We propose the Kampung
Bandan, Ancol Drain, Gunung Sahari, Sentiong and Sunter Selatan reservoirs to be operated
as long storage, with a bottom level of -3 m +PP. The operational level of both pumps should
be -2 m+PP.
In this alternative about 63 mm of rainfall can be retained in the open water system. Pump
capacities of 95 and 140 m3/s respectively are required to meet a T25 and T100 recurrence
flood protection level assuming a proper functioning drainage system (see Figure 4-5). The
characteristics of the system are summarised in Table 4-2.
Figure 4-4 – Alternative C1: Marina and Sentiong pump, no additional storage

Technical review and support Jakarta Flood Management System
December 2014, Final Report - Phase 2
46
Figure 4-5 – C1: Polder designs to meet T25 and T100 requirements
Alternative C1
Marina Sentiong, only present storage, additional pumps
T100 T25
Pump capacity Total 140.0 95 m3/s
Marina 60 32 m3/s
Sentiong 80 63 m3/s
Retention area 93.0 ha
Total catchment 43.6 km2
Max. retention volume 2.76 Mm3
In mm over total catchment area: T100 T25
retention storage 63 63 mm
pump capacity 11.56 7.85 mm/hour
Storage emptying time 5.5 8.1 hours
Table 4-2 – Characteristics of Marina/Sentiong alternative C1 (no additional storage)
The distribution of the pumping capacity over Marina and Sentiong is flexible, since they are
connected by a wide (improved) Ancol drain. Looking at the catchment sizes, it is most logical
to have Sentiong pump larger than Marina pump (say ratio 2:1). However, there is already a
plan available for a pump at Marina of 60 m3/s. So for the T100 return period, Marina is put at
this capacity. The emptying time of the full retention storage in the canals is a few hours.
SCS runoff and polder capacity
0
50
100
150
200
250
300
350
0 2 4 6 8 10 12 14 16 18 20 22 24 26 28 30 32
TIME [hours]
Vo
lum
e [
mm
]
T100 T50 T25T10 Polder capacity T100 Polder capacity T025

December 2014, Final Report - Phase 2
Technical review and support Jakarta Flood Management System
47
4.2.2 C2 – Marina/Sentiong and Sunter Utara, no additional storage
In this alternative, Sentiong pump is placed at the coastline defined by NCICD (Figure 4-6)
and will – also in the future – discharge to the sea (whereas Marina pump will discharge into
the western lake). In this way the Sunter Utara polder, including the Sunter Utara reservoir,
will be included with Marina/Sentiong into one large polder of 55.3 km2. Pump capacities of
Marina/Sentiong of 100 m3/s and 150 m
3/s are required to meet a T25 and T100 recurrence
flood protection level, assuming a proper functioning drainage system. The Sunter Utara
polder and reservoir are in this case drained by Sentiong pump, together with Koja pump in
the north-eastern corner of Sunter Utara. Koja pump is planned to be increased from the
present capacity of 3 m3/s to 10 m
3/s. The latter value is taken into account in the
computations.
Figure 4-6 – Alternative C2, Marina/Sentiong and Sunter Utara system combined

Technical review and support Jakarta Flood Management System
December 2014, Final Report - Phase 2
48
Figure 4-7 – Alternative C2, more detailed view of location of Sentiong and Sunter Utara; in alternative C2, Sentiong
pump is put at the location mentioned as Option 2.
Figure 4-8 – C2: Marina-Sentiong polder designs to meet T25 and T100 requirements
Including the Sunter Utara catchment means an additional inflow to the Marina Sentiong
system, so it is expected that the water balance will indicate that a higher capacity of the
Marina/Sentiong pumps is needed. The increase is however relatively small, 5 to 10 m3/s
SCS runoff and polder capacity
0
50
100
150
200
250
300
350
0 2 4 6 8 10 12 14 16 18 20 22 24 26 28 30 32 34 36
TIME [hours]
Vo
lum
e [
mm
]
T100 T50 T25T10 Polder capacity T025 Polder capacity T100
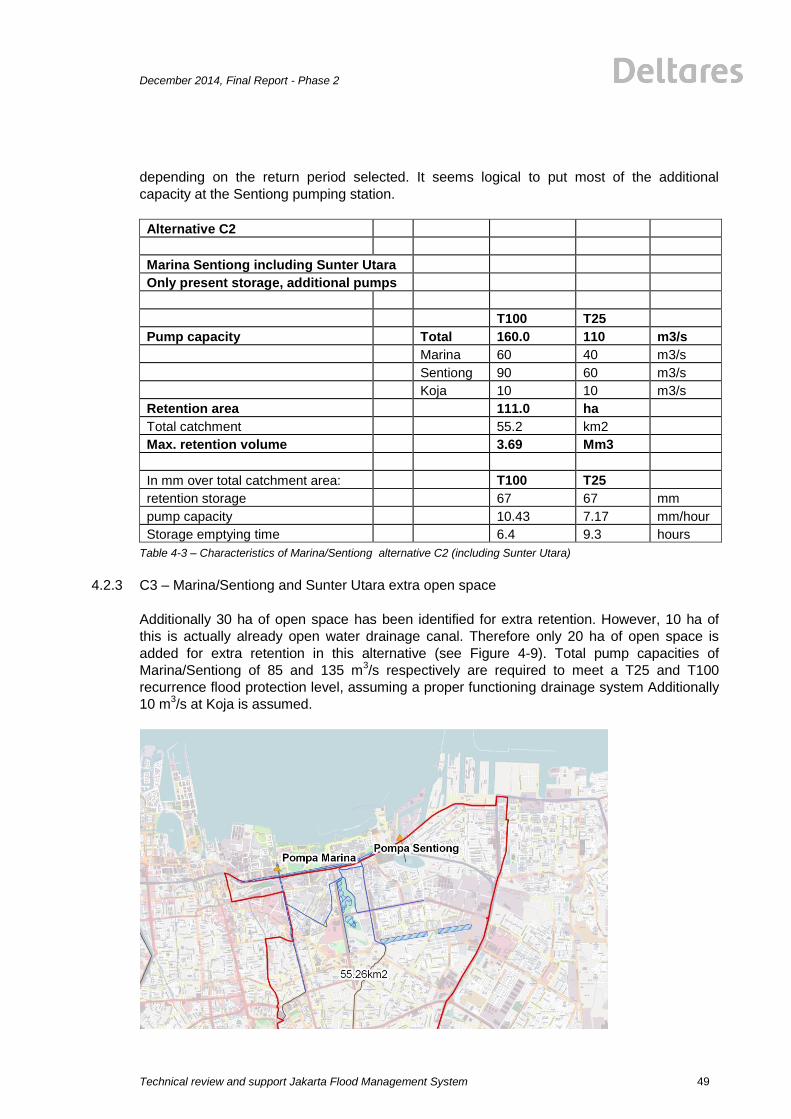
December 2014, Final Report - Phase 2
Technical review and support Jakarta Flood Management System
49
depending on the return period selected. It seems logical to put most of the additional
capacity at the Sentiong pumping station.
Alternative C2
Marina Sentiong including Sunter Utara
Only present storage, additional pumps
T100 T25
Pump capacity Total 160.0 110 m3/s
Marina 60 40 m3/s
Sentiong 90 60 m3/s
Koja 10 10 m3/s
Retention area 111.0 ha
Total catchment 55.2 km2
Max. retention volume 3.69 Mm3
In mm over total catchment area: T100 T25
retention storage 67 67 mm
pump capacity 10.43 7.17 mm/hour
Storage emptying time 6.4 9.3 hours
Table 4-3 – Characteristics of Marina/Sentiong alternative C2 (including Sunter Utara)
4.2.3 C3 – Marina/Sentiong and Sunter Utara extra open space
Additionally 30 ha of open space has been identified for extra retention. However, 10 ha of
this is actually already open water drainage canal. Therefore only 20 ha of open space is
added for extra retention in this alternative (see Figure 4-9). Total pump capacities of
Marina/Sentiong of 85 and 135 m3/s respectively are required to meet a T25 and T100
recurrence flood protection level, assuming a proper functioning drainage system Additionally
10 m3/s at Koja is assumed.
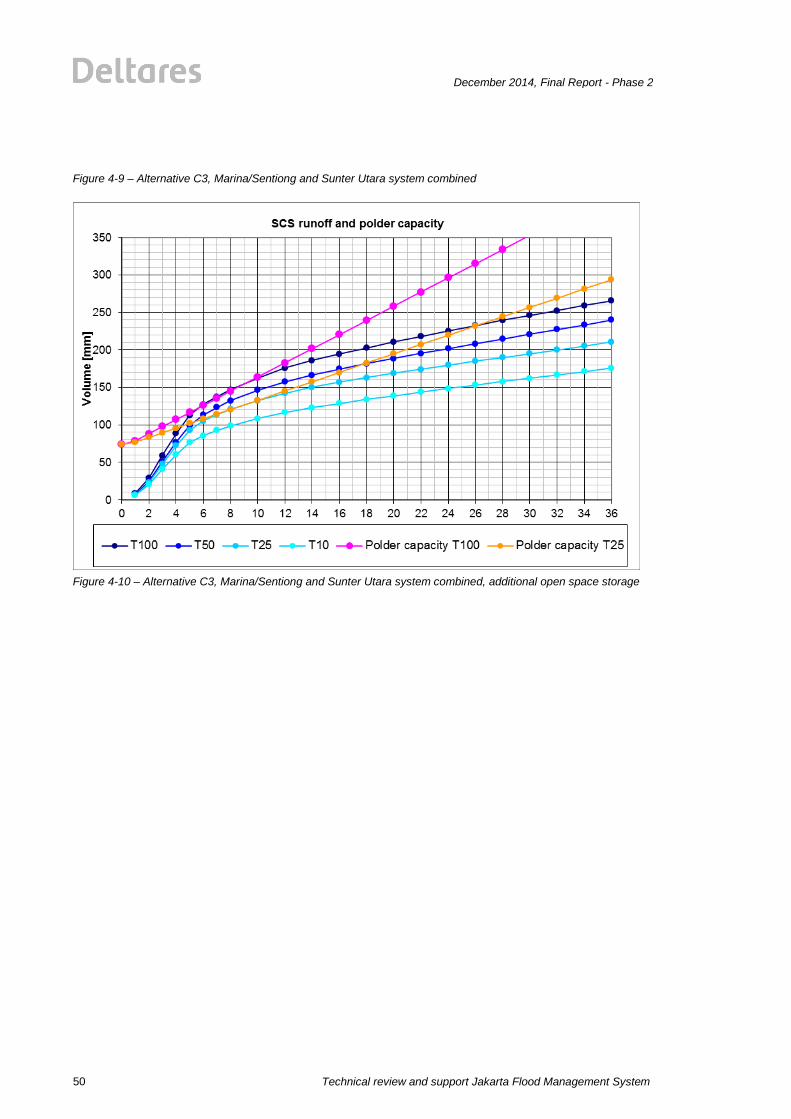
Technical review and support Jakarta Flood Management System
December 2014, Final Report - Phase 2
50
Figure 4-9 – Alternative C3, Marina/Sentiong and Sunter Utara system combined
Figure 4-10 – Alternative C3, Marina/Sentiong and Sunter Utara system combined, additional open space storage
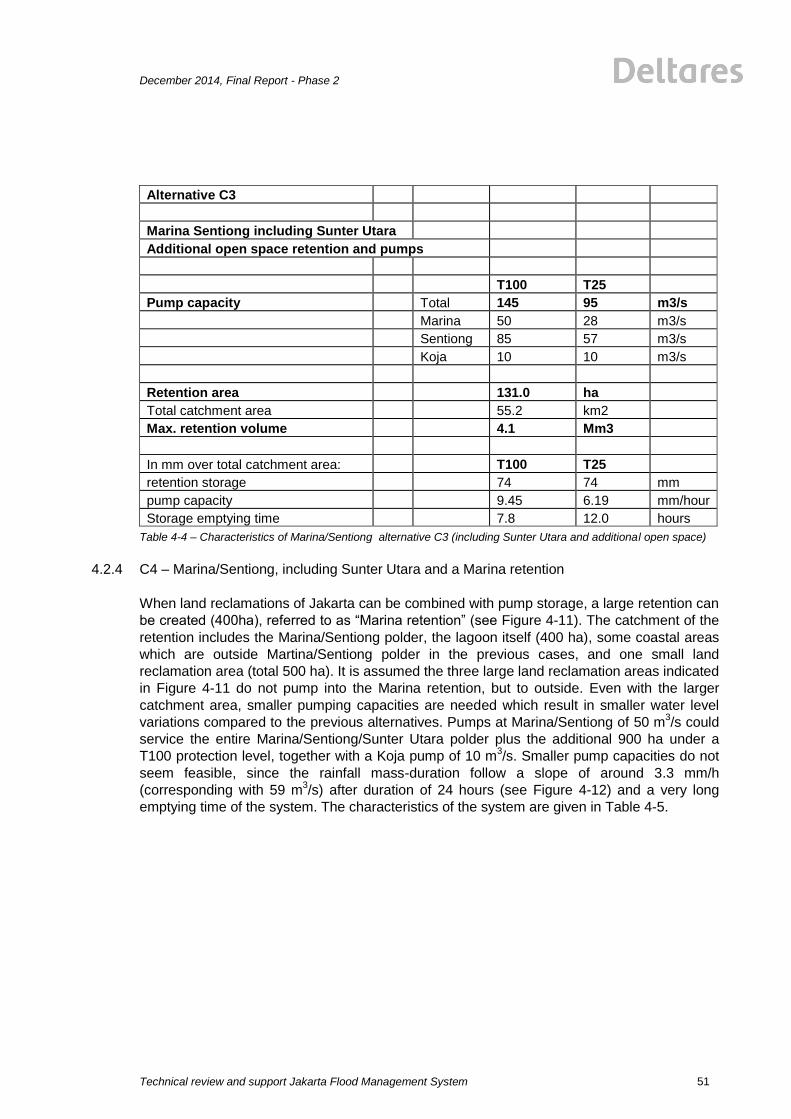
December 2014, Final Report - Phase 2
Technical review and support Jakarta Flood Management System
51
Alternative C3
Marina Sentiong including Sunter Utara
Additional open space retention and pumps
T100 T25
Pump capacity Total 145 95 m3/s
Marina 50 28 m3/s
Sentiong 85 57 m3/s
Koja 10 10 m3/s
Retention area 131.0 ha
Total catchment area 55.2 km2
Max. retention volume 4.1 Mm3
In mm over total catchment area: T100 T25
retention storage 74 74 mm
pump capacity 9.45 6.19 mm/hour
Storage emptying time 7.8 12.0 hours
Table 4-4 – Characteristics of Marina/Sentiong alternative C3 (including Sunter Utara and additional open space)
4.2.4 C4 – Marina/Sentiong, including Sunter Utara and a Marina retention
When land reclamations of Jakarta can be combined with pump storage, a large retention can
be created (400ha), referred to as “Marina retention” (see Figure 4-11). The catchment of the
retention includes the Marina/Sentiong polder, the lagoon itself (400 ha), some coastal areas
which are outside Martina/Sentiong polder in the previous cases, and one small land
reclamation area (total 500 ha). It is assumed the three large land reclamation areas indicated
in Figure 4-11 do not pump into the Marina retention, but to outside. Even with the larger
catchment area, smaller pumping capacities are needed which result in smaller water level
variations compared to the previous alternatives. Pumps at Marina/Sentiong of 50 m3/s could
service the entire Marina/Sentiong/Sunter Utara polder plus the additional 900 ha under a
T100 protection level, together with a Koja pump of 10 m3/s. Smaller pump capacities do not
seem feasible, since the rainfall mass-duration follow a slope of around 3.3 mm/h
(corresponding with 59 m3/s) after duration of 24 hours (see Figure 4-12) and a very long
emptying time of the system. The characteristics of the system are given in Table 4-5.

Technical review and support Jakarta Flood Management System
December 2014, Final Report - Phase 2
52
Figure 4-11 – Alternative C4, “Marina lagoon retention”
Figure 4-12 –C4: Alternative “Marina lagoon retention”
Pompa Marina

December 2014, Final Report - Phase 2
Technical review and support Jakarta Flood Management System
53
Table 4-5 – Characteristics of Marina/Sentiong alternative C4 with ‘Marina lagoon retention’
4.2.5 C5 – Marina/Sentiong, as C2 plus continuous 70 m3/s Ciliwung Lama
As mentioned in chapter 1, the general design principle of the polders is to cut off inflow from
upstream rivers completely and to design the polder storages and pumping capacity for the
polder as a separate system. However, for the Marina/Sentiong system PU-DKI asked to also
include the possibility of handling a 70 m3/s inflow from the Ciliwung Lama which is desired
during flood conditions on the Ciliwung river.
Designing the polder storage and pump capacity such that both a local 1:100 year event can
be handled at the same time as an inflow of 70 m3/s from the Ciliwung Lama of course
means that the polder system is designed for a much more severe event than the 1:100 year
local rainfall event.
Another option would be to optimize the gate operation of the Ciliwung Lama gate. This would
mean that in periods without local rainfall in Marina/Sentiong polder, but with a Ciliwung flood,
the Ciliwung Lama gate is opened to alleviate floods on the Ciliwung. And the gate should be
closed as soon as heavy rain is expected on the local polder catchment, and can be opened
when the water levels due to the local rainfall event are back to normal. With the available
Jakarta FEWS system and forecasts such operational management seems to be already
possible.
In case C5 we indicate the consequences of designing the Marina-Sentiong polder (including
Sunter Utara) such that it can also handle an additional continuous 70 m3/s inflow from the
Ciliwung Lama gate.
Not surprisingly, it is found that in this case basically the required capacities of the C2 case
are increased with an amount of 70 m3/s.
To allow a flow of 70 m3/s through Ciliwung Lama without local flooding still requires some
improvement of cross-sections on Ciliwung Lama.
Alternative C4
Marina Sentiong&SunterUtara, outside additional storage 400 ha lagoon
T100 T25
Pump capacity Total 60.0 60 m3/s
Marina 20 20 m3/s
Sentiong 30 30 m3/s
Koja 10 10 m3/s
Retention area 513.0 ha
Total catchment 64.2 km2
Max. retention volume 10.24 Mm3
In mm over total catchment area: T100 T25
retention storage 159 159 mm
pump capacity 3.36 3.36 mm/hour
Storage emptying time 47.4 47.4 hours

Technical review and support Jakarta Flood Management System
December 2014, Final Report - Phase 2
54
Figure 4-13 – Alternative C5, “C2 + Ciliwung Lama continuous 70 m3/s”
Alternative C5
Marina Sentiong including Sunter Utara
Additionally 70 cms Ciliwung Lama Gate continuously
(so also during local rainfall event)
T100 T25
Pump capacity Total 230 180 m3/s
Marina 110 80 m3/s
Sentiong 110 90 m3/s
Koja 10 10 m3/s
Retention area 111.0 ha
Total catchment 55.2 km2
Max. retention volume 3.69 Mm3
In mm over total catchment area: T100 T25
retention storage 67 67 mm
pump capacity 14.99 11.73 mm/hour
Storage emptying time 4.5 5.7 hours
Table 4-6 – Characteristics of Marina/Sentiong alternative C5 with Ciliwung Lama gate continously open
For the T100 case, and even distribution of the pumping capacities over Marina (110) and
Sentiong (110) gives a maximum water level of about +1.30 m PP*. In view of NCICD coastal
developments with the future lagoon one might consider not having a pumping station
(Sentiong) pumping to the sea, but concentrate all at Marina (which can be assisted by a gate
in case of the western lake). In this case, the water level at Sentiong which be higher. During
SCS runoff and polder capacity
0
100
200
300
400
500
0 2 4 6 8 10 12 14 16 18 20 22 24 26 28 30 32
TIME [hours]
Vo
lum
e [
mm
]
T100 T50 T25T10 Polder capacity T025 Polder capacity T100

December 2014, Final Report - Phase 2
Technical review and support Jakarta Flood Management System
55
the T100 the maximum water level at Sentiong is +1.60 m PP*, which is 30 cm higher than
the maximum water level at Marina (+1.30 m PP*), as shown by the following graph.
Figure 4-14 – Water levels at Sentiong (blue) and Marina (red), in case all pump capacity put at Marina
4.2.6 C6 – Marina/Sentiong, as C5, but inflow Ciliwung Lama after local rainfall
As mentioned in the discussion of alternative C5, another option is to operate the
Marina/Sentiong system such that it can handle a 1:25 or 1:100 local rainfall event, but not at
simultaneously with a flow from Ciliwung Lama gate during the design event (only sufficient
time before or after the local rainfall event). In case C6 we therefore design the polder system
such that it can handle a 70 m3/s inflow over Ciliwung Lama, but only a number of hours after
the design event. We chose to allow the Ciliwung inflow to start only 12 hours after the start of
the design rainfall event.
W.level up mean MarinaPump W.level up mean SentiongPump
04-01-2013
00:00:00
03-01-2013
18:00:00
03-01-2013
12:00:00
03-01-2013
06:00:00
03-01-2013
00:00:00
02-01-2013
18:00:00
02-01-2013
12:00:00
02-01-2013
06:00:00
02-01-2013
00:00:00
01-01-2013
18:00:00
01-01-2013
12:00:00
01-01-2013
06:00:00
01-01-2013
00:00:00
W.level up m
ean [
m A
D]
1.6
1.4
1.2
1
0.8
0.6
0.4
0.2
0
-0.2
-0.4
-0.6
-0.8
-1
-1.2
-1.4
-1.6
-1.8
-2
-2.2
-2.4
-2.6
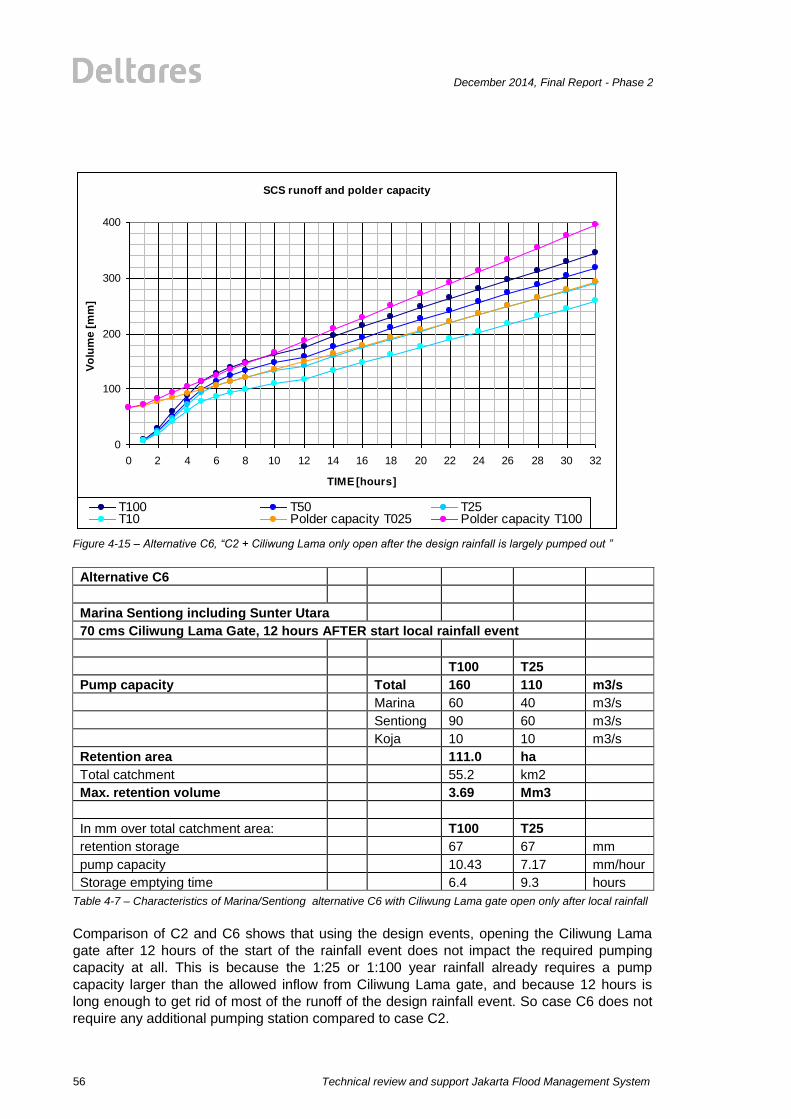
Technical review and support Jakarta Flood Management System
December 2014, Final Report - Phase 2
56
Figure 4-15 – Alternative C6, “C2 + Ciliwung Lama only open after the design rainfall is largely pumped out ”
Alternative C6
Marina Sentiong including Sunter Utara
70 cms Ciliwung Lama Gate, 12 hours AFTER start local rainfall event
T100 T25
Pump capacity Total 160 110 m3/s
Marina 60 40 m3/s
Sentiong 90 60 m3/s
Koja 10 10 m3/s
Retention area 111.0 ha
Total catchment 55.2 km2
Max. retention volume 3.69 Mm3
In mm over total catchment area: T100 T25
retention storage 67 67 mm
pump capacity 10.43 7.17 mm/hour
Storage emptying time 6.4 9.3 hours
Table 4-7 – Characteristics of Marina/Sentiong alternative C6 with Ciliwung Lama gate open only after local rainfall
Comparison of C2 and C6 shows that using the design events, opening the Ciliwung Lama
gate after 12 hours of the start of the rainfall event does not impact the required pumping
capacity at all. This is because the 1:25 or 1:100 year rainfall already requires a pump
capacity larger than the allowed inflow from Ciliwung Lama gate, and because 12 hours is
long enough to get rid of most of the runoff of the design rainfall event. So case C6 does not
require any additional pumping station compared to case C2.
SCS runoff and polder capacity
0
100
200
300
400
0 2 4 6 8 10 12 14 16 18 20 22 24 26 28 30 32
TIME [hours]
Vo
lum
e [
mm
]
T100 T50 T25T10 Polder capacity T025 Polder capacity T100
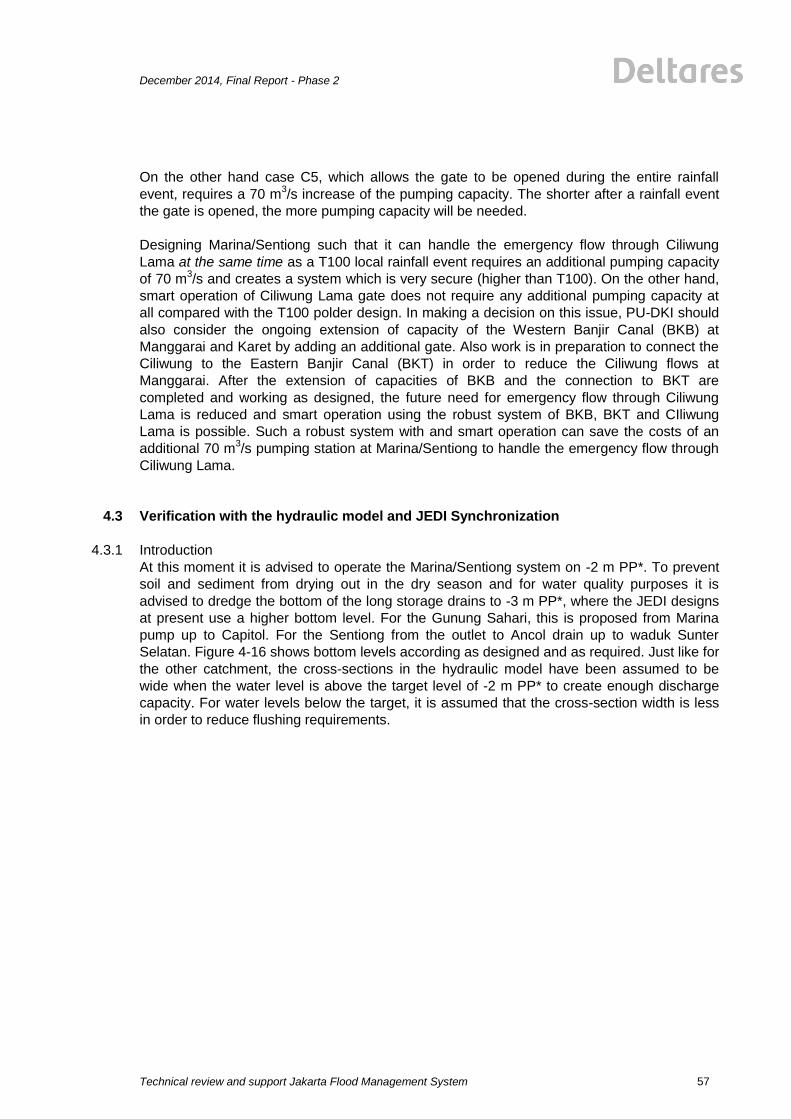
December 2014, Final Report - Phase 2
Technical review and support Jakarta Flood Management System
57
On the other hand case C5, which allows the gate to be opened during the entire rainfall
event, requires a 70 m3/s increase of the pumping capacity. The shorter after a rainfall event
the gate is opened, the more pumping capacity will be needed.
Designing Marina/Sentiong such that it can handle the emergency flow through Ciliwung
Lama at the same time as a T100 local rainfall event requires an additional pumping capacity
of 70 m3/s and creates a system which is very secure (higher than T100). On the other hand,
smart operation of Ciliwung Lama gate does not require any additional pumping capacity at
all compared with the T100 polder design. In making a decision on this issue, PU-DKI should
also consider the ongoing extension of capacity of the Western Banjir Canal (BKB) at
Manggarai and Karet by adding an additional gate. Also work is in preparation to connect the
Ciliwung to the Eastern Banjir Canal (BKT) in order to reduce the Ciliwung flows at
Manggarai. After the extension of capacities of BKB and the connection to BKT are
completed and working as designed, the future need for emergency flow through Ciliwung
Lama is reduced and smart operation using the robust system of BKB, BKT and CIliwung
Lama is possible. Such a robust system with and smart operation can save the costs of an
additional 70 m3/s pumping station at Marina/Sentiong to handle the emergency flow through
Ciliwung Lama.
4.3 Verification with the hydraulic model and JEDI Synchronization
4.3.1 Introduction
At this moment it is advised to operate the Marina/Sentiong system on -2 m PP*. To prevent
soil and sediment from drying out in the dry season and for water quality purposes it is
advised to dredge the bottom of the long storage drains to -3 m PP*, where the JEDI designs
at present use a higher bottom level. For the Gunung Sahari, this is proposed from Marina
pump up to Capitol. For the Sentiong from the outlet to Ancol drain up to waduk Sunter
Selatan. Figure 4-16 shows bottom levels according as designed and as required. Just like for
the other catchment, the cross-sections in the hydraulic model have been assumed to be
wide when the water level is above the target level of -2 m PP* to create enough discharge
capacity. For water levels below the target, it is assumed that the cross-section width is less
in order to reduce flushing requirements.
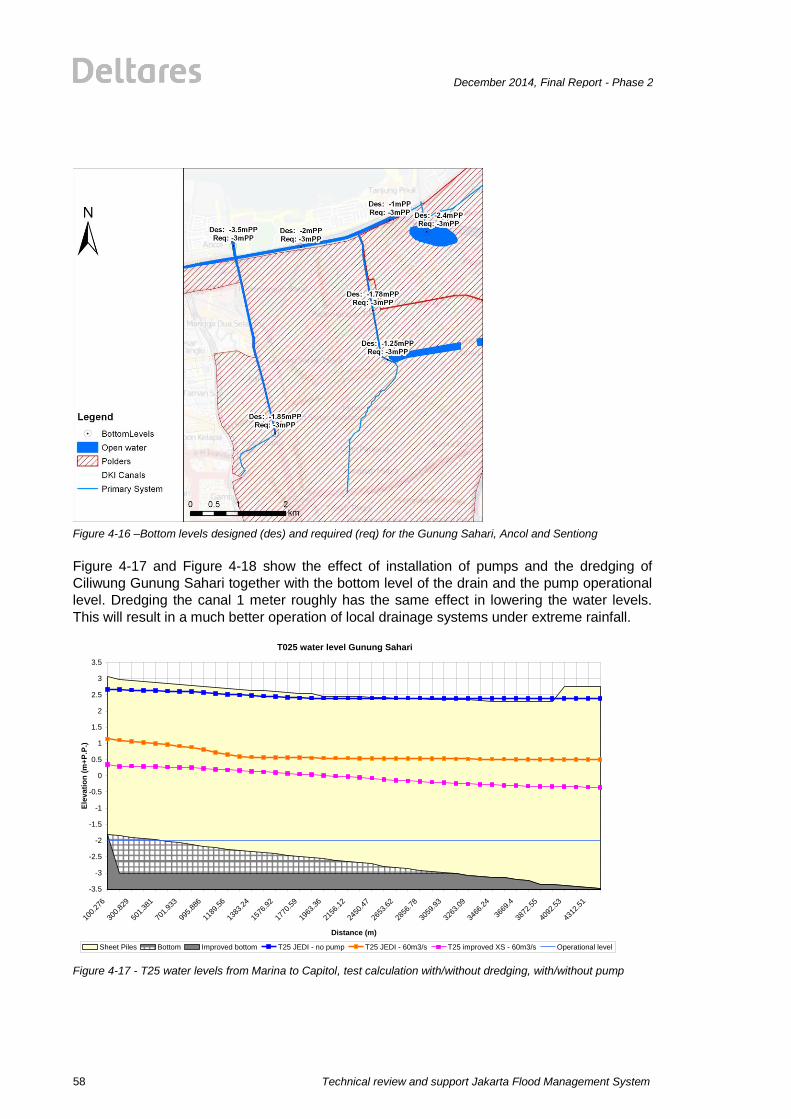
Technical review and support Jakarta Flood Management System
December 2014, Final Report - Phase 2
58
Figure 4-16 –Bottom levels designed (des) and required (req) for the Gunung Sahari, Ancol and Sentiong
Figure 4-17 and Figure 4-18 show the effect of installation of pumps and the dredging of
Ciliwung Gunung Sahari together with the bottom level of the drain and the pump operational
level. Dredging the canal 1 meter roughly has the same effect in lowering the water levels.
This will result in a much better operation of local drainage systems under extreme rainfall.
Figure 4-17 - T25 water levels from Marina to Capitol, test calculation with/without dredging, with/without pump
T025 water level Gunung Sahari
-3.5
-3
-2.5
-2
-1.5
-1
-0.5
0
0.5
1
1.5
2
2.5
3
3.5
100.
276
300.
829
501.
381
701.
933
995.
886
1189
.56
1383
.24
1576
.92
1770
.59
1963
.36
2156
.12
2450
.47
2653
.62
2856
.78
3059
.93
3263
.09
3466
.24
3669
.4
3872
.55
4092
.53
4312
.51
Distance (m)
Ele
vati
on
(m
+P
.P.)
Sheet Piles Bottom Improved bottom T25 JEDI - no pump T25 JEDI - 60m3/s T25 improved XS - 60m3/s Operational level
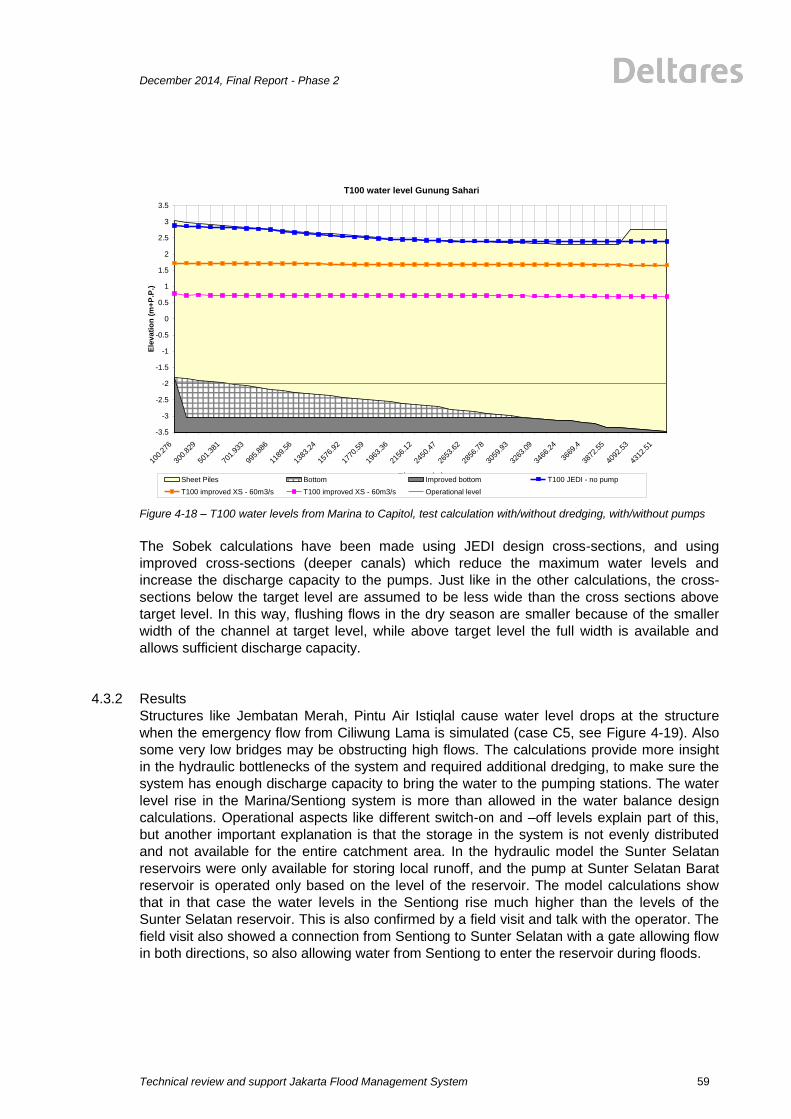
December 2014, Final Report - Phase 2
Technical review and support Jakarta Flood Management System
59
Figure 4-18 – T100 water levels from Marina to Capitol, test calculation with/without dredging, with/without pumps
The Sobek calculations have been made using JEDI design cross-sections, and using
improved cross-sections (deeper canals) which reduce the maximum water levels and
increase the discharge capacity to the pumps. Just like in the other calculations, the cross-
sections below the target level are assumed to be less wide than the cross sections above
target level. In this way, flushing flows in the dry season are smaller because of the smaller
width of the channel at target level, while above target level the full width is available and
allows sufficient discharge capacity.
4.3.2 Results
Structures like Jembatan Merah, Pintu Air Istiqlal cause water level drops at the structure
when the emergency flow from Ciliwung Lama is simulated (case C5, see Figure 4-19). Also
some very low bridges may be obstructing high flows. The calculations provide more insight
in the hydraulic bottlenecks of the system and required additional dredging, to make sure the
system has enough discharge capacity to bring the water to the pumping stations. The water
level rise in the Marina/Sentiong system is more than allowed in the water balance design
calculations. Operational aspects like different switch-on and –off levels explain part of this,
but another important explanation is that the storage in the system is not evenly distributed
and not available for the entire catchment area. In the hydraulic model the Sunter Selatan
reservoirs were only available for storing local runoff, and the pump at Sunter Selatan Barat
reservoir is operated only based on the level of the reservoir. The model calculations show
that in that case the water levels in the Sentiong rise much higher than the levels of the
Sunter Selatan reservoir. This is also confirmed by a field visit and talk with the operator. The
field visit also showed a connection from Sentiong to Sunter Selatan with a gate allowing flow
in both directions, so also allowing water from Sentiong to enter the reservoir during floods.
T100 water level Gunung Sahari
-3.5
-3
-2.5
-2
-1.5
-1
-0.5
0
0.5
1
1.5
2
2.5
3
3.5
100.
276
300.
829
501.
381
701.
933
995.
886
1189
.56
1383
.24
1576
.92
1770
.59
1963
.36
2156
.12
2450
.47
2653
.62
2856
.78
3059
.93
3263
.09
3466
.24
3669
.4
3872
.55
4092
.53
4312
.51
Distance (m)
Ele
vati
on
(m
+P
.P.)
Sheet Piles Bottom Improved bottom T100 JEDI - no pump
T100 improved XS - 60m3/s T100 improved XS - 60m3/s Operational level
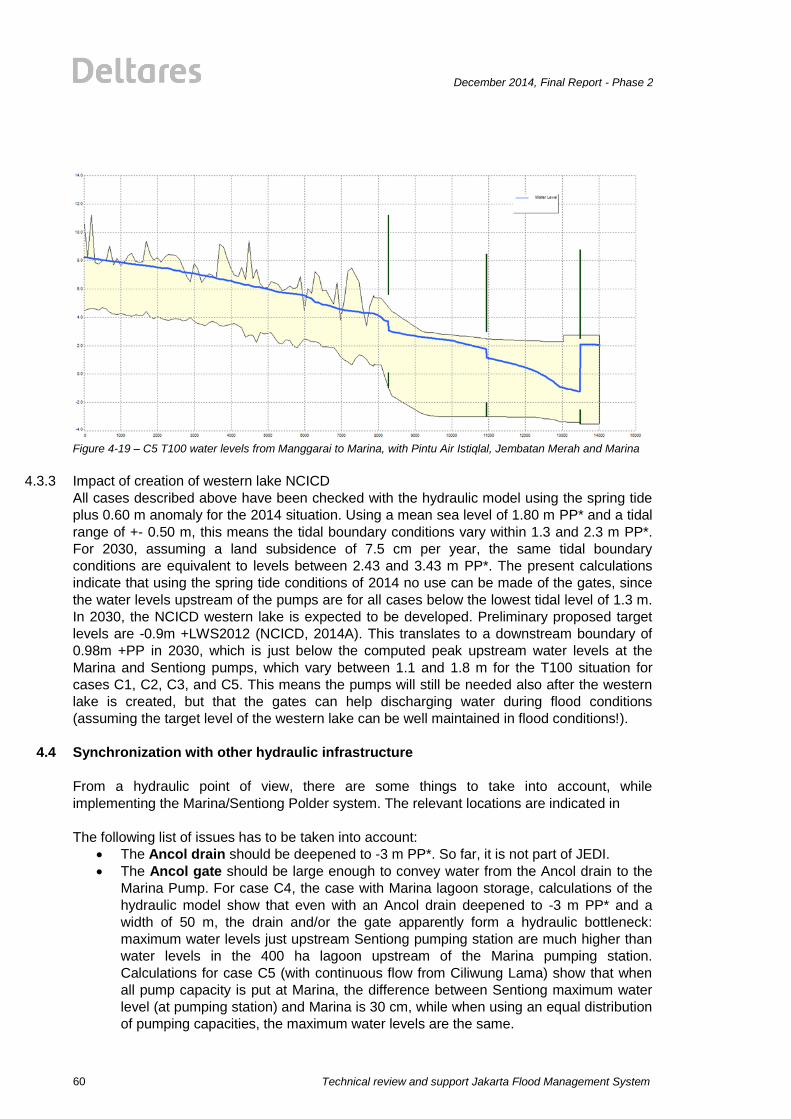
Technical review and support Jakarta Flood Management System
December 2014, Final Report - Phase 2
60
Figure 4-19 – C5 T100 water levels from Manggarai to Marina, with Pintu Air Istiqlal, Jembatan Merah and Marina
4.3.3 Impact of creation of western lake NCICD
All cases described above have been checked with the hydraulic model using the spring tide
plus 0.60 m anomaly for the 2014 situation. Using a mean sea level of 1.80 m PP* and a tidal
range of +- 0.50 m, this means the tidal boundary conditions vary within 1.3 and 2.3 m PP*.
For 2030, assuming a land subsidence of 7.5 cm per year, the same tidal boundary
conditions are equivalent to levels between 2.43 and 3.43 m PP*. The present calculations
indicate that using the spring tide conditions of 2014 no use can be made of the gates, since
the water levels upstream of the pumps are for all cases below the lowest tidal level of 1.3 m.
In 2030, the NCICD western lake is expected to be developed. Preliminary proposed target
levels are -0.9m +LWS2012 (NCICD, 2014A). This translates to a downstream boundary of
0.98m +PP in 2030, which is just below the computed peak upstream water levels at the
Marina and Sentiong pumps, which vary between 1.1 and 1.8 m for the T100 situation for
cases C1, C2, C3, and C5. This means the pumps will still be needed also after the western
lake is created, but that the gates can help discharging water during flood conditions
(assuming the target level of the western lake can be well maintained in flood conditions!).
4.4 Synchronization with other hydraulic infrastructure
From a hydraulic point of view, there are some things to take into account, while
implementing the Marina/Sentiong Polder system. The relevant locations are indicated in
The following list of issues has to be taken into account:
The Ancol drain should be deepened to -3 m PP*. So far, it is not part of JEDI.
The Ancol gate should be large enough to convey water from the Ancol drain to the
Marina Pump. For case C4, the case with Marina lagoon storage, calculations of the
hydraulic model show that even with an Ancol drain deepened to -3 m PP* and a
width of 50 m, the drain and/or the gate apparently form a hydraulic bottleneck:
maximum water levels just upstream Sentiong pumping station are much higher than
water levels in the 400 ha lagoon upstream of the Marina pumping station.
Calculations for case C5 (with continuous flow from Ciliwung Lama) show that when
all pump capacity is put at Marina, the difference between Sentiong maximum water
level (at pumping station) and Marina is 30 cm, while when using an equal distribution
of pumping capacities, the maximum water levels are the same.

December 2014, Final Report - Phase 2
Technical review and support Jakarta Flood Management System
61
The operation of Sunter Selatan Barat pump (Pompa Sunter Selatan) needs to be
optimised in the future polder system. In the present hydraulic calculations the pump
is still operated as it is now, but that results in a higher water level rise in the Sentiong
river system than in the Sunter Selatan reservoirs. By a smart pump operation more
water can be stored in the Sunter Selatan reservoirs, and the pressure on the
downstream Marina/Sentiong system gets less. An extreme case could be to have the
Sunter Selatan reservoirs also store excess water from upper Sentiong (as is
presently assumed in water balance). In normal situations with the new low
operational levels, the reservoirs could even discharge by gravity to Sentiong.
At the southern side of the catchment there are the Ciliwung river and Kali Baru
Timur. The polder is designed as a separate system, without inflow from the upstream
Ciliwung and Kali Baru Timur to reduce flood risk (see Figure 1-1), flood mechanism
2). For the Ciliwung Lama, an option to include up to 70 m3/s was included in two
alternatives. For the Kali Baru Timur however, we assume that the complete flow will
not flow into Marina-Sentiong polder. That is possible either by improving the present
gate diverting Kali Baru Timur water to Ciliwung, or by diverting the Kali Baru water to
the East Banjir Canal (BKT) together with the diversion of Ciliwung water to the BKT.
In case of revitalising the Ciliwung Lama and allow a flow of 70 m3/s at all times
without flooding, it is also advised to improve the cross-sections of Ciliwung Lama
(this is not part of JEDI).
Kampung Bandan pump will become totally obsolete as the area can be directly
serviced by the Marina pump.
The operation of secondary and tertiary Pompa Kartini and other pumps along the
Ciliwung Gunung Sahari should be optimised (just as the Sunter Selatan pump in
Sentiong system) in order to allow both good local drainage and to retain water when
possible to reduce the peak discharge into the Gunung Sahari long storage.
Kali Item can also be operated much more frequent via de Kali Item Sentiong gates.
Even at Sumur Batu pump it might be possible to operate under gravity more
frequently.
The layout of the Sunter Utara system to Koja pumping station is not studied in detail.
In the calculations for C2, C3, C4, C5, C6 we assumed the planned extension of the
pumping station from 3 to 10 m3/s will be realised. If not, the capacity at Sentiong
pumping station (which is also serving Sunter Utara area in these cases) needs to be
enlarged with this amount.
At Jl. Yos Sudarso there are two small pumping stations which pump water from
Marina/Sentiong polder into kali Sunter. The capacities are very small (total 1.25 m3/s)
and this has therefore not been considered in designing the desired pumping capacity
at Marina/Sentiong.
The analyses have been carried out assuming Ciliwung Gajah Mada is not part of the
catchment and that there is zero flow from Ciliwung Lama to Ciliwung Gajah Mada. If
70 m3/s emergency release from Manggarai to Ciliwung Lama is active, this
assumption is doubtful and would require a Ciliwung Gajah Mada gate to be realised.
Giving the installation of pumps at Pasar Ikan (and extension of pumps at Pluit) the
question has to be answered what the present or planned operation policy of PU-DKI
is: does PU-DKI want to reconnect Gajah Mada to Ciliwung Lama again? In that case
upgrading of Gajah Mada is necessary (and at the moment not included in JEDI).
Another related issue is the proposed river restoration project of Ciliwung Lama at
Istiqlal. This idea is conflicting with an emergency release through Ciliwung Lama,
passing Istiqlal to Gunung Sahari.

Technical review and support Jakarta Flood Management System
December 2014, Final Report - Phase 2
62
In general it is advised to make an inventory of small service pumps under control by DKI or
districts and review their operation. Pumps discharging to the long storage of Gunung Sahari,
Ancol and Sentiong can be equipped with gates for normal operation. Under extreme
conditions the pumps can be used as backup when gravity flow to the long storages from the
secondary drainage system is not possible.
Figure 4-20 Important locations in Marina-Sentiong catchment

December 2014, Final Report - Phase 2
Technical review and support Jakarta Flood Management System
63
5 Sunter polder
5.1 Description of the area
5.1.1 Introduction
The area to be converted into the Sunter polder is 39.44 km2 in total (see Figure 5-1). An area
of 15.5km2 can discharge under gravity to the upper reach of the Sunter drain. Remaining
watersheds have to be drained via small service pumps. Two watersheds between Cakung
and Sunter drain (total area 10.25 km2, see Figure 5-1) can be diverted to one of the two
polders, as the area is heavily under development. In this analysis we assume the area is
serviced via the Cakung polder. Furthermore, at present the Cempaka Putih (also known as
Saluran Utan Kayu) flows via the Kali Item gate near Jl. Yos Sudarso into the Sunter river just
downstream of Sunter gate at km 7.1. In the previous chapter this area has been included
with Kali Item in the Marina Sentiong polder.
Figure 5-1 - Sunter polder
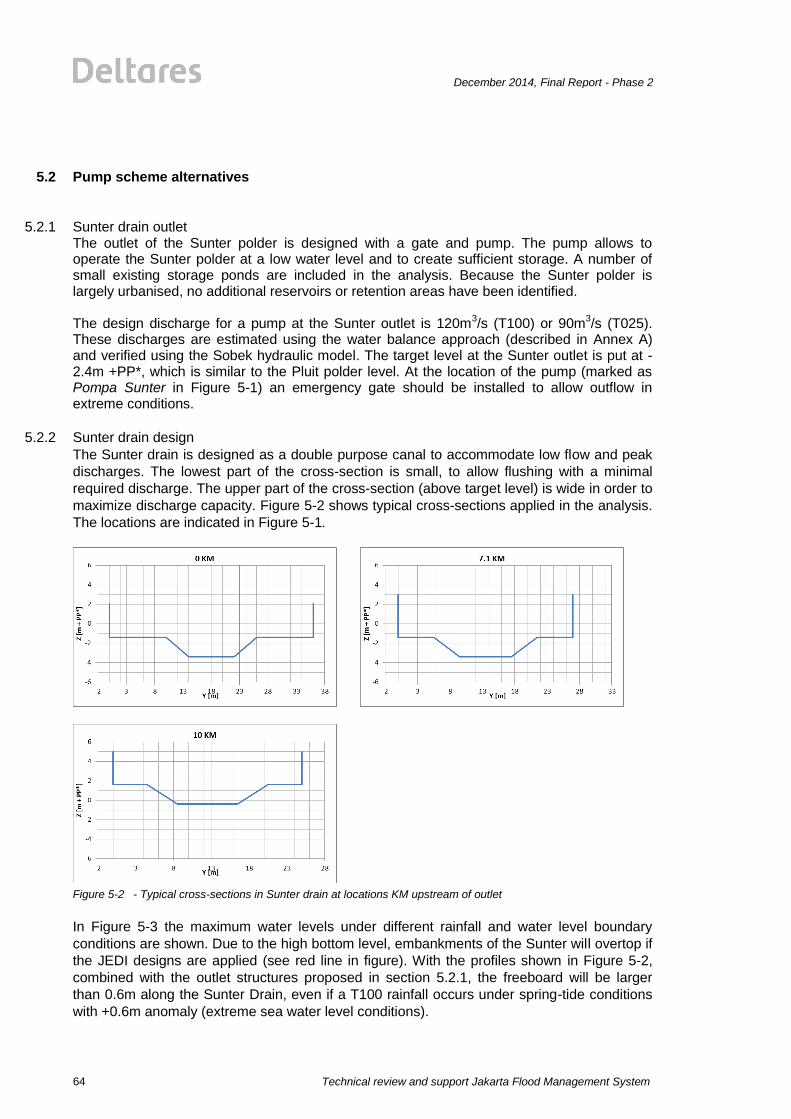
Technical review and support Jakarta Flood Management System
December 2014, Final Report - Phase 2
64
5.2 Pump scheme alternatives
5.2.1 Sunter drain outlet The outlet of the Sunter polder is designed with a gate and pump. The pump allows to operate the Sunter polder at a low water level and to create sufficient storage. A number of small existing storage ponds are included in the analysis. Because the Sunter polder is largely urbanised, no additional reservoirs or retention areas have been identified. The design discharge for a pump at the Sunter outlet is 120m
3/s (T100) or 90m
3/s (T025).
These discharges are estimated using the water balance approach (described in Annex A) and verified using the Sobek hydraulic model. The target level at the Sunter outlet is put at -2.4m +PP*, which is similar to the Pluit polder level. At the location of the pump (marked as Pompa Sunter in Figure 5-1) an emergency gate should be installed to allow outflow in extreme conditions.
5.2.2 Sunter drain design
The Sunter drain is designed as a double purpose canal to accommodate low flow and peak
discharges. The lowest part of the cross-section is small, to allow flushing with a minimal
required discharge. The upper part of the cross-section (above target level) is wide in order to
maximize discharge capacity. Figure 5-2 shows typical cross-sections applied in the analysis.
The locations are indicated in Figure 5-1.
Figure 5-2 - Typical cross-sections in Sunter drain at locations KM upstream of outlet
In Figure 5-3 the maximum water levels under different rainfall and water level boundary
conditions are shown. Due to the high bottom level, embankments of the Sunter will overtop if
the JEDI designs are applied (see red line in figure). With the profiles shown in Figure 5-2,
combined with the outlet structures proposed in section 5.2.1, the freeboard will be larger
than 0.6m along the Sunter Drain, even if a T100 rainfall occurs under spring-tide conditions
with +0.6m anomaly (extreme sea water level conditions).

December 2014, Final Report - Phase 2
Technical review and support Jakarta Flood Management System
65
5.3 Verification with the hydraulic model and JEDI synchronisation
5.3.1 Introduction and results
The cross-section design is adjusted to allow for low flushing requirements and high
discharge capacity during floods. In comparison with JEDI designs, also the last 7.1 km (from
Sunter gate till the river mouth) has been given a lower bed level than in the JEDI designs.
The bed level has been put at 1 m below target level, so at -3.4 m PP*. From Sunter gate in
upstream direction, a typical slope of 1 m per km has been used in the hydraulic model.
The lower bed level of course results in lower maximum water levels compared with
calculations using the JEDI design.
Figure 5-3 - Water levels under different boundary conditions. JFO profiles (‘bottom’ and ‘street level’) withT025
and T100 rainfall. Red line shows water-levels under T100 rainfall with JEDI design
5.3.2 NCICD developments
The case described above has been checked with the hydraulic model using the spring tide
plus 0.60 m anomaly for the 2014 situation. Using a mean sea level of 1.80 m PP* and a tidal
range of +- 0.50 m, this means the tidal boundary conditions vary within 1.3 and 2.3 m PP*.
The maximum water level at the river mouth, just before the pump and gate, is 0 m PP* as
shown in Figure 5-3. This means the water level is still far below the tidal low water level.
For 2030, assuming a land subsidence of 7.5 cm per year, the same tidal boundary
conditions are equivalent to levels between 2.43 and 3.43 m PP*, so the gate cannot be used
in normal conditions. At the moment it is foreseen that Sunter river will also in the future
discharge to the sea, and not into one of the NCICD coastal lakes. But even if that would be
the case, the proposed operational level of -0.9m +LWS2012 (NCICD, 2014A) corresponds
with a level of 0.98m +PP* in 2030, which would be higher than the water levels in the Sunter

Technical review and support Jakarta Flood Management System
December 2014, Final Report - Phase 2
66
system. This means the pumps will still be needed, also if Sunter is to be discharging into a
coastal lake.
5.3.3 Catchment boundaries and connections As mentioned in the description of Sunter polder, there is an area, indicated in grey in Figure 5-1, which at present drains into Sunter or Cakung drain. In the analyses is has been assumed this area drains to Cakung drain. This assumption has some influence on the distribution of the pumping capacities over Sunter and Cakung area, but does not change the total required capacity. The realisation of low target levels in the Cakung area will facilitate drainage of this area to Cakung. Another advantage is that for the Cakung drain there is a future option to drain into a large coastal retention lake, which can reduce the required pumping capacity considerably (see next chapter). The catchment of Saluran Utan Kayu (Cempaka Putih) which is at present flowing to Kali Sunter has been included in the Kali Item – Kali Sentiong catchment (see chapter 5). This catchment is 802 ha. This change requires another operation of the two gates in the eastern end of Kali Item: the eastern gate should be always closed, and the western gate of the two should be always open. Including this 802 ha always in Kali Sunter instead of Kali Sentiong will change the distribution of pump capacity over Sentiong and Sunter. Including it in Marina-Sentiong polder has the advantage that future use of a coastal retention lake is possible. For both areas, the catchment boundary may not be as strict as used for the present analysis. A well-functioning Jakarta FEWS system makes it possible to create a flexible connection between the polders at these locations, and to decide which connection to use depending on the actual situation.
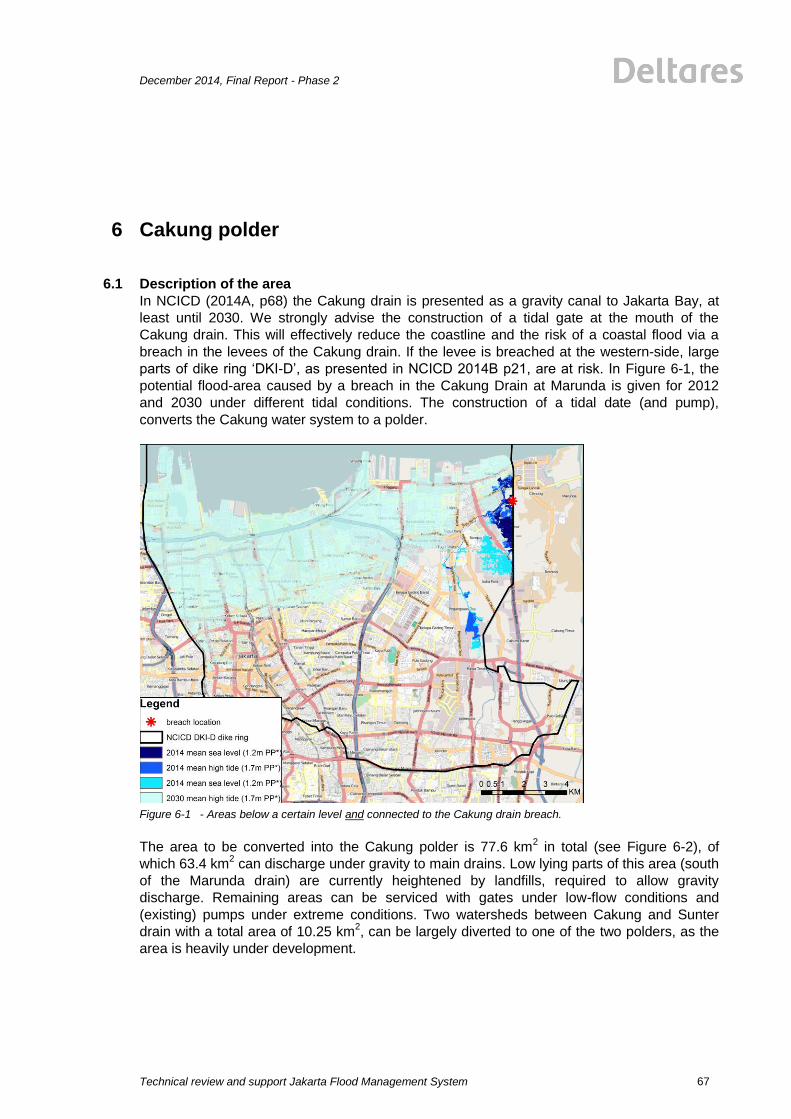
December 2014, Final Report - Phase 2
Technical review and support Jakarta Flood Management System
67
6 Cakung polder
6.1 Description of the area
In NCICD (2014A, p68) the Cakung drain is presented as a gravity canal to Jakarta Bay, at
least until 2030. We strongly advise the construction of a tidal gate at the mouth of the
Cakung drain. This will effectively reduce the coastline and the risk of a coastal flood via a
breach in the levees of the Cakung drain. If the levee is breached at the western-side, large
parts of dike ring ‘DKI-D’, as presented in NCICD 2014B p21, are at risk. In Figure 6-1, the
potential flood-area caused by a breach in the Cakung Drain at Marunda is given for 2012
and 2030 under different tidal conditions. The construction of a tidal date (and pump),
converts the Cakung water system to a polder.
Figure 6-1 - Areas below a certain level and connected to the Cakung drain breach.
The area to be converted into the Cakung polder is 77.6 km2 in total (see Figure 6-2), of
which 63.4 km2 can discharge under gravity to main drains. Low lying parts of this area (south
of the Marunda drain) are currently heightened by landfills, required to allow gravity
discharge. Remaining areas can be serviced with gates under low-flow conditions and
(existing) pumps under extreme conditions. Two watersheds between Cakung and Sunter
drain with a total area of 10.25 km2, can be largely diverted to one of the two polders, as the
area is heavily under development.
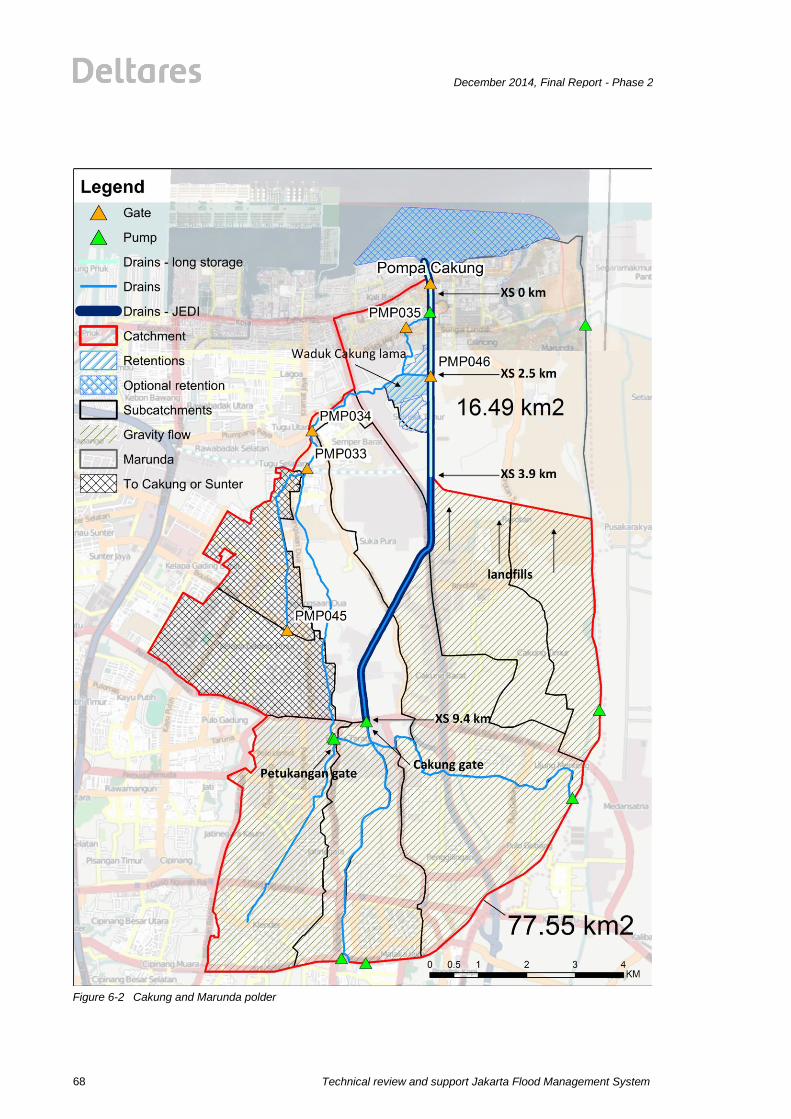
Technical review and support Jakarta Flood Management System
December 2014, Final Report - Phase 2
68
Figure 6-2 Cakung and Marunda polder

December 2014, Final Report - Phase 2
Technical review and support Jakarta Flood Management System
69
6.2 Pump scheme alternatives
The design discharge at the Cakung drain outlet is 250 m3/s (T100) or 200m
3/s (T025). These
discharges are estimated using the water balance (described in annex A) and verified by
calculations with the Sobek hydraulic model.
The pump strategy for the Cakung differs from other polder systems, due to the high design-
discharges at the Cakung drain outlet. Installing a 250 m3/s pump at the outlet is regarded
undesirable and should therefore be postponed as long as possible. The scheme for current
system conditions includes:
• A tidal gate, discharging the main flow during peak conditions. A pump to drain the
Cakung drain below mean sea level, providing retention storage (see section 6.2.1).
• A redesigned Cakung drain, to meet required storage and maximum discharge capacity
(see 6.2.2).
• Design principles for the Cakung Lama (see 6.3.2).
• Design principles for upstream watersheds (see 6.3.3).
The discharge capacity of the tidal gate will decrease as subsidence continues. The
combined structure (gate and pump), can therefore be developed in alternative strategies:
1 AS1: Increasing the pump capacity to 250m3/s, by increasing the amount of installed
pumps over time at the location of gates as the latter will become less effective over
time (see section 6.4.1).
2 AS2: The retention volume can be increased by construction of a 445 ha retention area
in combination with the current harbour expansion of Tanjung Priok (IPC, 2013) (see
section 6.4.2).
3 AS3: Cakung drain can become a gravity canal if NCICD phase C is completed (NCICD
2014A) (see section 6.4.3).
6.2.1 Cakung drain outlet
The location of the combined pump and gate can be found in Figure 6-2 (marked as ‘Pompa
Cakung’). The primary function of the pump is to meet the target level in the Cakung Drain:
-3.4m +PP*. Under these conditions (low flow), the entire Cakung polder can be serviced by a
pump with a maximum capacity of 20m3/s. The part of the Cakung drain between the planned
pump and Marunda drain should be converted to a pump-storage (see Figure 6-2). Under
peak-flow conditions, the systems main outlet can be a gate with a crest-width of 30m (6x5m).
The crest level is now assumed on -2.5m +PP*, the loss coefficient on 0.8.
6.2.2 Cakung drain design
The Cakung drain should be designed as a double purpose canal to accommodate low flow,
and peak discharges. The lowest part of the cross-section is small, to allow flushing with a
minimal required discharge. The upper part of the cross-section is wide, to maximize
discharge capacity. Figure 6-3 shows some typical cross-sections applied in the analysis for
the locations indicated in
The lowest part, between the pump and Marunda drain (cross sections 0KM till 3.9KM in
Figure 6-2) is flat and should serve as retention for the polder system. The bed level is lower
than proposed in JEDI, and the levee elevation is higher than proposed in JEDI. From
Marunda to Cakung Gate, both the bottom and levee elevations gradually change to meet the
JEDI design levels at the Cakung Gate. At the Cakung gate (9.4KM in Figure 6-2), the profile
bottom and levee elevation meet the elevations used in JEDI.

Technical review and support Jakarta Flood Management System
December 2014, Final Report - Phase 2
70
Figure 6-3 - Typical cross-sections in Cakung drain drain at locations KM upstream of outlet
6.3 Verification with the hydraulic model and JEDI synchronisation
6.3.1 Introduction and results
In Figure 6-4, maximum water levels under different rainfall and water level boundary
conditions are shown. Due to the high bottom level, embankments of the Cakung drain will
overtop if the JEDI designs are applied (see red line in figure). With the profiles shown in
Figure 6-3, combined with the outlet structures proposed in section 6.2.1, the freeboard will
be higher than 0.6m along the Cakung Drain, even if a T100 rainfall occurs under spring-tide
conditions and +0.6m anomaly.
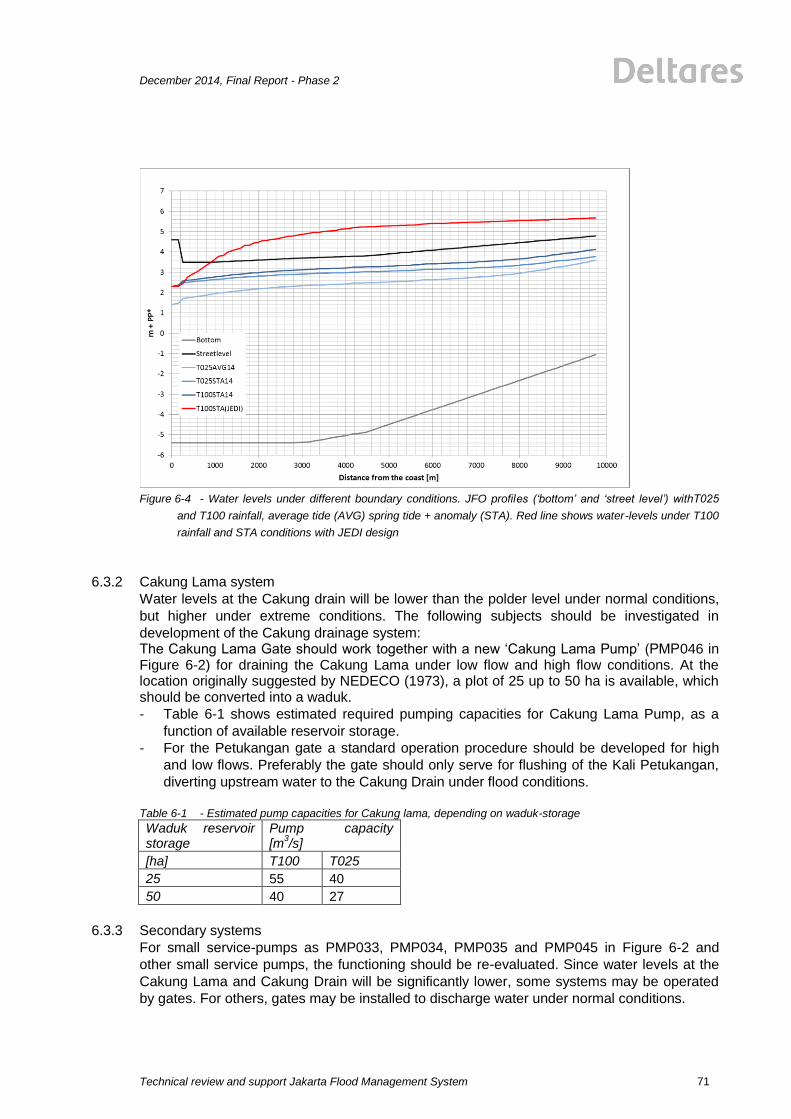
December 2014, Final Report - Phase 2
Technical review and support Jakarta Flood Management System
71
Figure 6-4 - Water levels under different boundary conditions. JFO profiles (‘bottom’ and ‘street level’) withT025
and T100 rainfall, average tide (AVG) spring tide + anomaly (STA). Red line shows water-levels under T100
rainfall and STA conditions with JEDI design
6.3.2 Cakung Lama system
Water levels at the Cakung drain will be lower than the polder level under normal conditions,
but higher under extreme conditions. The following subjects should be investigated in
development of the Cakung drainage system: The Cakung Lama Gate should work together with a new ‘Cakung Lama Pump’ (PMP046 in Figure 6-2) for draining the Cakung Lama under low flow and high flow conditions. At the location originally suggested by NEDECO (1973), a plot of 25 up to 50 ha is available, which should be converted into a waduk.
- Table 6-1 shows estimated required pumping capacities for Cakung Lama Pump, as a
function of available reservoir storage.
- For the Petukangan gate a standard operation procedure should be developed for high
and low flows. Preferably the gate should only serve for flushing of the Kali Petukangan,
diverting upstream water to the Cakung Drain under flood conditions.
Table 6-1 - Estimated pump capacities for Cakung lama, depending on waduk-storage
Waduk reservoir storage
Pump capacity [m
3/s]
[ha] T100 T025
25 55 40
50 40 27
6.3.3 Secondary systems
For small service-pumps as PMP033, PMP034, PMP035 and PMP045 in Figure 6-2 and
other small service pumps, the functioning should be re-evaluated. Since water levels at the
Cakung Lama and Cakung Drain will be significantly lower, some systems may be operated
by gates. For others, gates may be installed to discharge water under normal conditions.

Technical review and support Jakarta Flood Management System
December 2014, Final Report - Phase 2
72
6.4 Alternatives for further development under future scenarios, including NCICD
The design presented in paragraph 6.2 needs improvement to cope with the subsidence rates of Jakarta. If nothing is adjusted, the proposed gate will become less effective over time. Therefore extra measures are required. Three alternative development scenarios are developed depending on the possibility to integrate with the current extension of Tanjung Priok (IPC, 2013), or NCICD phase C (NCICD, 2014A). The T100 water level under the condition of spring tide and +0.6m anomaly are shown for all alternatives in Figure 6-6.
Note: subsidence between present and 2030 is estimated to be 1.13m (0.075m * 15years).
This is incorporated in analysis by heightening the downstream boundary rather than lowering
canal geometry.
6.4.1 No plan integration: increasing pump-capacity to 250m3/s
If no alternative development strategies can be found, the pump capacity can be gradually
increased from 20m3/s to 250m
3/s. This can be done at the expense of gates, of which the
capacity will reduce over time. Two gates of 5m are assumed to be present in 2030 to
discharge under low tidal conditions.
6.4.2 Using 445ha retention pond to extend retention volume
Currently Tanjung Priok harbour is extended (IPC, 2013). Part of the extension is a road
connecting the new harbour to the west-bank of Banjir Kanal Timur. Currently this road is
elevated to connect the Cakung drain with Jakarta Bay. If the road is built on a dike instead, a
waduk will be created of 445ha. A new pump of 80m3/s (target level 0.8 m+PP*) can be
installed. On the outlet of the Cakung, no adjustments are required on the description of
paragraph 6.2.
Figure 6-5 - New waduk space integrated in Tanjung Priok development
6.4.3 Integrate pump scheme in NCICD phase 3
If NCICD phase C is constructed target levels in Jakarta Bay will be -0.9m +LWS2012
(NCICD, 2014A). This translates to a downstream boundary at the Cakung outlet of 0.98 m
+PP* in 2030. If NCICD phase C will be constructed, no additional measures are required on
the design presented in paragraph 6.2. To bridge the time between present and construction
of phase C, additional measures may be required.

December 2014, Final Report - Phase 2
Technical review and support Jakarta Flood Management System
73
Figure 6-6 - Water levels under T100 rainfall and spring tide + anomaly (STA) boundary conditions for different
alternative scenarios.
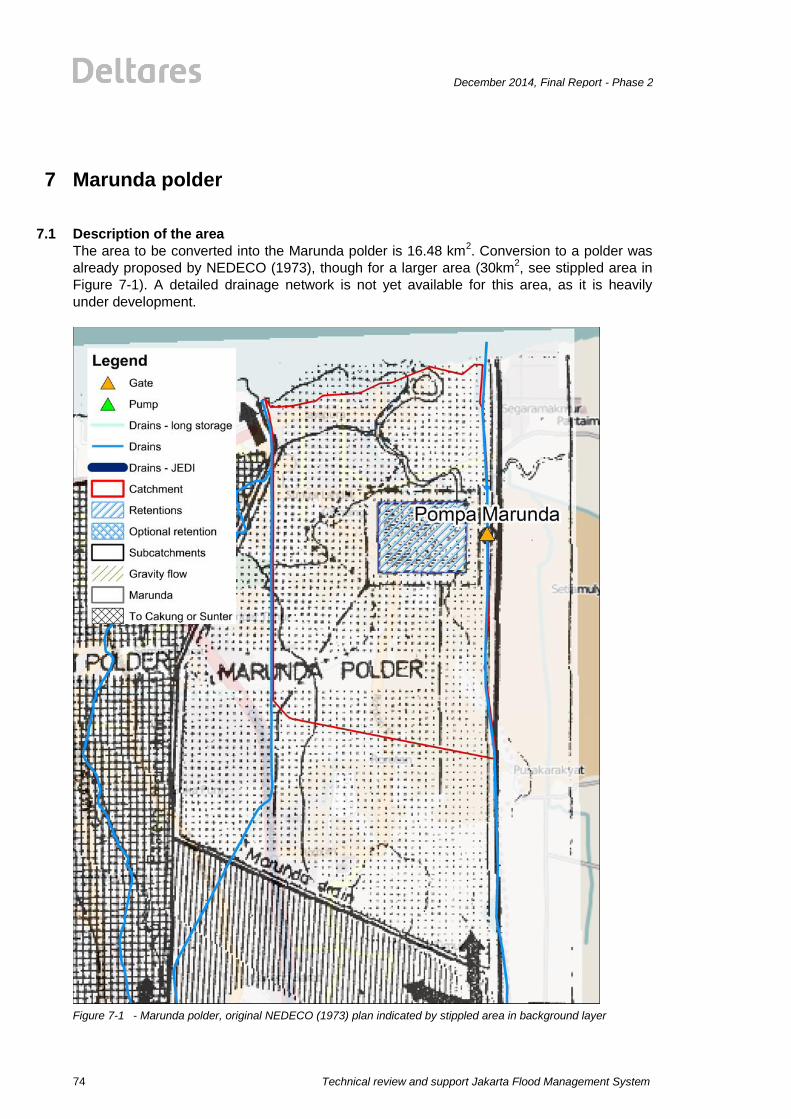
Technical review and support Jakarta Flood Management System
December 2014, Final Report - Phase 2
74
7 Marunda polder
7.1 Description of the area
The area to be converted into the Marunda polder is 16.48 km2. Conversion to a polder was
already proposed by NEDECO (1973), though for a larger area (30km2, see stippled area in
Figure 7-1). A detailed drainage network is not yet available for this area, as it is heavily
under development.
Figure 7-1 - Marunda polder, original NEDECO (1973) plan indicated by stippled area in background layer
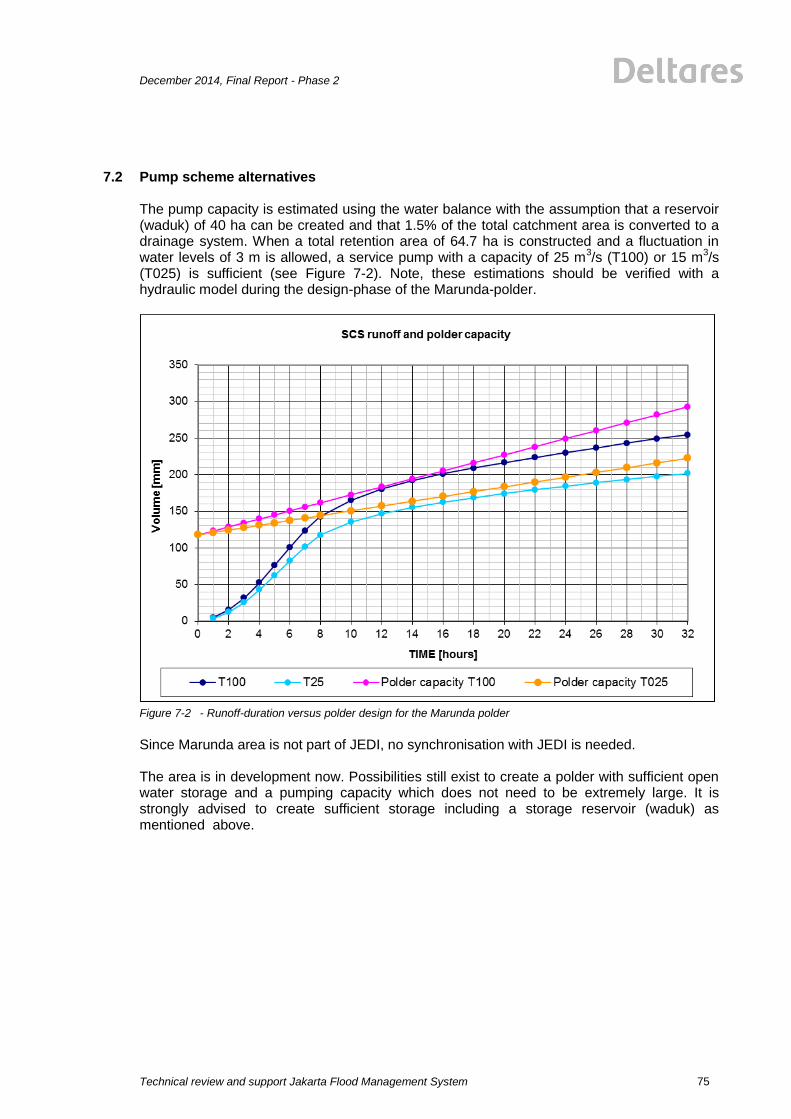
December 2014, Final Report - Phase 2
Technical review and support Jakarta Flood Management System
75
7.2 Pump scheme alternatives The pump capacity is estimated using the water balance with the assumption that a reservoir (waduk) of 40 ha can be created and that 1.5% of the total catchment area is converted to a drainage system. When a total retention area of 64.7 ha is constructed and a fluctuation in water levels of 3 m is allowed, a service pump with a capacity of 25 m
3/s (T100) or 15 m
3/s
(T025) is sufficient (see Figure 7-2). Note, these estimations should be verified with a hydraulic model during the design-phase of the Marunda-polder.
Figure 7-2 - Runoff-duration versus polder design for the Marunda polder
Since Marunda area is not part of JEDI, no synchronisation with JEDI is needed. The area is in development now. Possibilities still exist to create a polder with sufficient open water storage and a pumping capacity which does not need to be extremely large. It is strongly advised to create sufficient storage including a storage reservoir (waduk) as mentioned above.
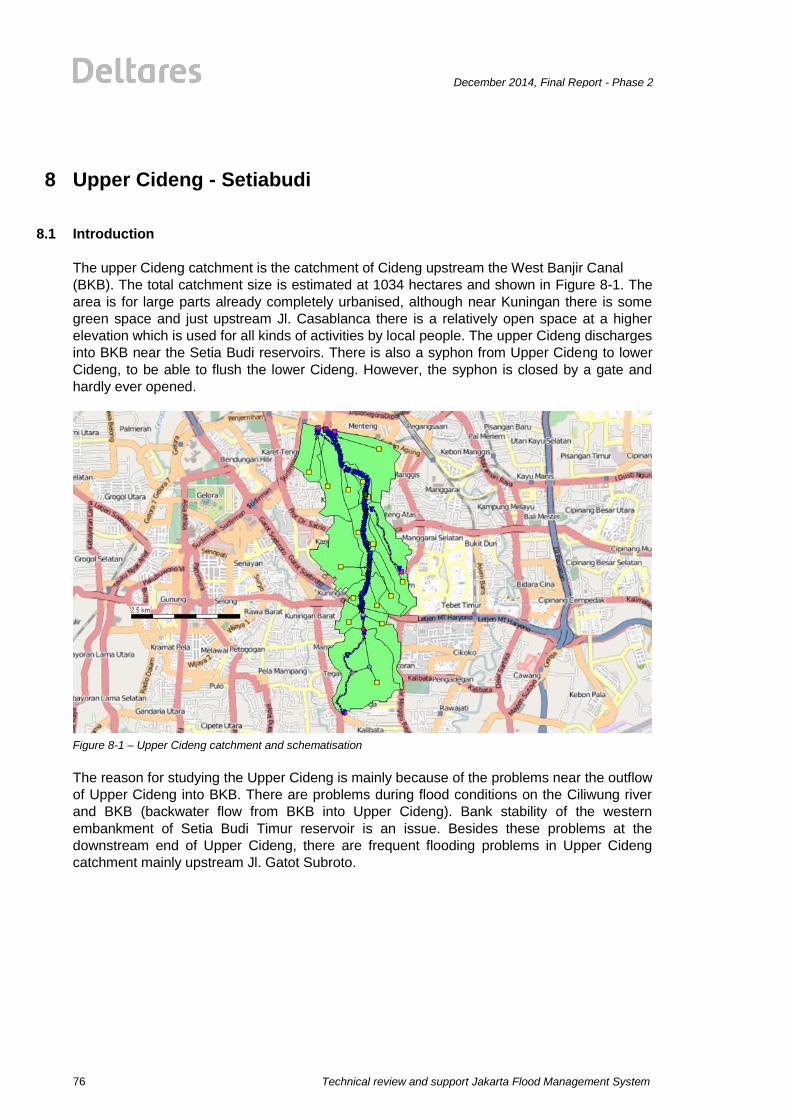
Technical review and support Jakarta Flood Management System
December 2014, Final Report - Phase 2
76
8 Upper Cideng - Setiabudi
8.1 Introduction
The upper Cideng catchment is the catchment of Cideng upstream the West Banjir Canal
(BKB). The total catchment size is estimated at 1034 hectares and shown in Figure 8-1. The
area is for large parts already completely urbanised, although near Kuningan there is some
green space and just upstream Jl. Casablanca there is a relatively open space at a higher
elevation which is used for all kinds of activities by local people. The upper Cideng discharges
into BKB near the Setia Budi reservoirs. There is also a syphon from Upper Cideng to lower
Cideng, to be able to flush the lower Cideng. However, the syphon is closed by a gate and
hardly ever opened.
Figure 8-1 – Upper Cideng catchment and schematisation
The reason for studying the Upper Cideng is mainly because of the problems near the outflow
of Upper Cideng into BKB. There are problems during flood conditions on the Ciliwung river
and BKB (backwater flow from BKB into Upper Cideng). Bank stability of the western
embankment of Setia Budi Timur reservoir is an issue. Besides these problems at the
downstream end of Upper Cideng, there are frequent flooding problems in Upper Cideng
catchment mainly upstream Jl. Gatot Subroto.
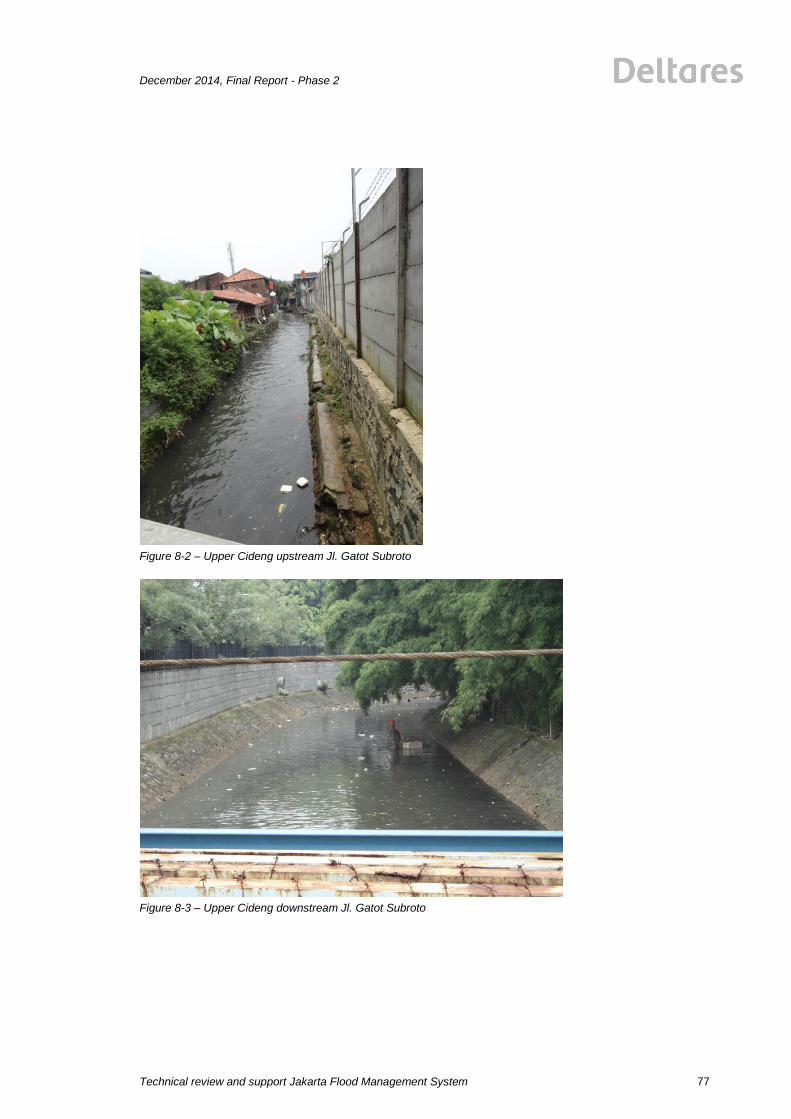
December 2014, Final Report - Phase 2
Technical review and support Jakarta Flood Management System
77
Figure 8-2 – Upper Cideng upstream Jl. Gatot Subroto
Figure 8-3 – Upper Cideng downstream Jl. Gatot Subroto
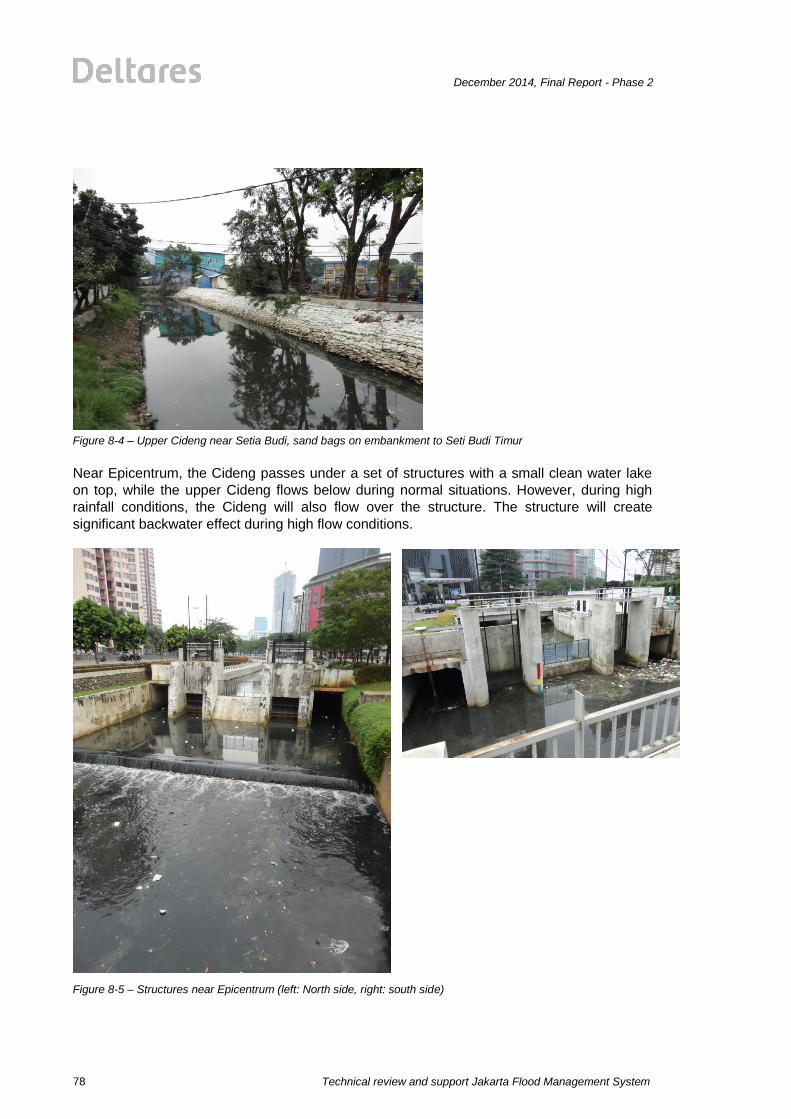
Technical review and support Jakarta Flood Management System
December 2014, Final Report - Phase 2
78
Figure 8-4 – Upper Cideng near Setia Budi, sand bags on embankment to Seti Budi Timur
Near Epicentrum, the Cideng passes under a set of structures with a small clean water lake
on top, while the upper Cideng flows below during normal situations. However, during high
rainfall conditions, the Cideng will also flow over the structure. The structure will create
significant backwater effect during high flow conditions.
Figure 8-5 – Structures near Epicentrum (left: North side, right: south side)

December 2014, Final Report - Phase 2
Technical review and support Jakarta Flood Management System
79
8.2 Modelling
The Upper Cideng area has been modelled in Sobek. For rainfall-runoff modelling the SCS
approach is applied. Given the present conditions and expected further densification, a curve
number of 95 has been used (same value as for the polders in Northern Jakarta). The rainfall
event with return period T100 has been used for analysis.
The water levels on BKB have been determined based on calculations with the full FMIS
2012 hydraulic model of Jakarta for the 2007 event, so without the Ciliwung-BKT connection,
but already with upgrading of BKB (dredging).
Figure 8-6 – Water levels at Latuharhari for the 2007 event using FMIS 2012 model
Based on this result, a downstream water level boundary condition of 7 m has been chosen
for the Upper Cideng model. A first reason is that the return period of a combined event of a
flood on the Ciliwung-BKB and a local rainfall event T100 is far more than 100 years.
Secondly, ongoing discussions on allowing an emergency flow from Manggarai through
CIliwung Lama, and making the connection of Ciliwung to the Eastern Banjir Canal (BKT) will
have a reducing effect on water levels at BKB. On the other hand, extending the discharge
capacity at Manggarai may increase the flow and water levels on BKB. All in all, a
downstream water level of 7 m at BKB is quite a high value.
The problems related to the stability of Setia Budi Timur embankments were observed with
very high water levels in BKB early this year. In order to prevent flow from BKB into the Upper
Cideng, a closable gate at the outlet of Upper Cideng to BKB is a simple option. Another
option is to raise en strengthen the embankments of the lower Upper Cideng for say 1-1.5 km
(the area influenced by backwater from BKB).
Several cross-section data were available from earlier projects. However, the exact data on
crest levels, width, opening height of the structures near Epicentrum was not available.
Calculations have been made without the structures and with these structures using
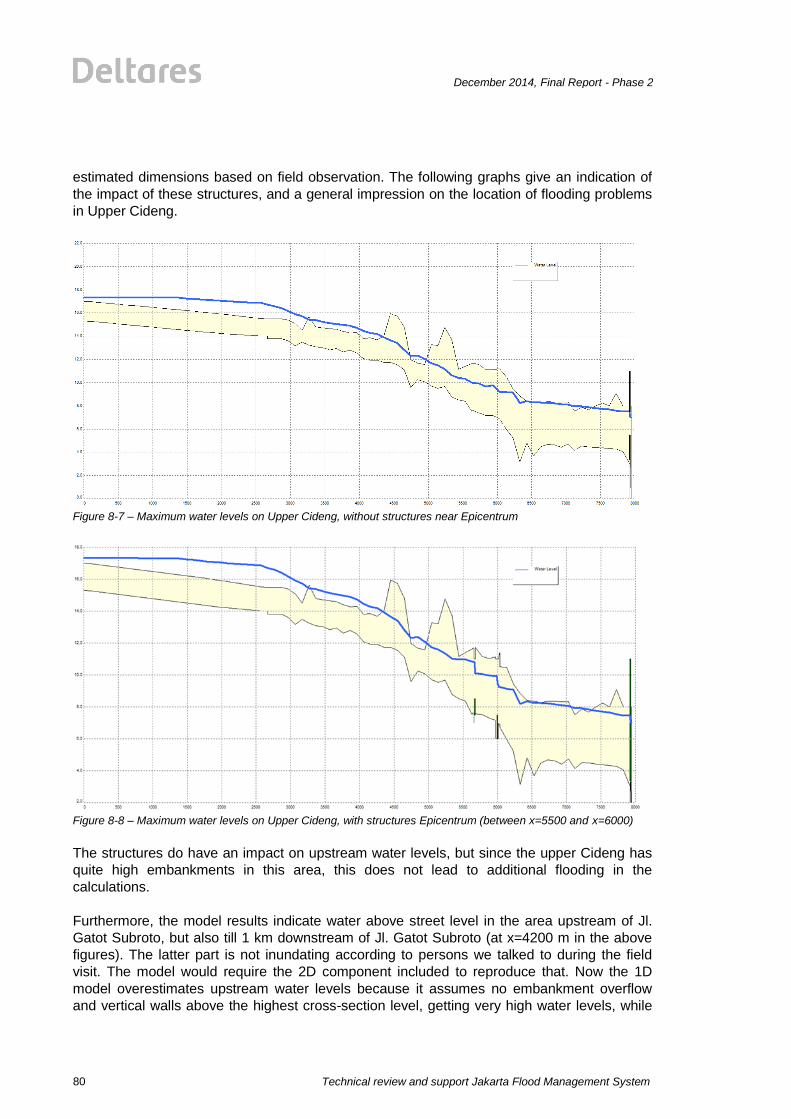
Technical review and support Jakarta Flood Management System
December 2014, Final Report - Phase 2
80
estimated dimensions based on field observation. The following graphs give an indication of
the impact of these structures, and a general impression on the location of flooding problems
in Upper Cideng.
Figure 8-7 – Maximum water levels on Upper Cideng, without structures near Epicentrum
Figure 8-8 – Maximum water levels on Upper Cideng, with structures Epicentrum (between x=5500 and x=6000)
The structures do have an impact on upstream water levels, but since the upper Cideng has
quite high embankments in this area, this does not lead to additional flooding in the
calculations.
Furthermore, the model results indicate water above street level in the area upstream of Jl.
Gatot Subroto, but also till 1 km downstream of Jl. Gatot Subroto (at x=4200 m in the above
figures). The latter part is not inundating according to persons we talked to during the field
visit. The model would require the 2D component included to reproduce that. Now the 1D
model overestimates upstream water levels because it assumes no embankment overflow
and vertical walls above the highest cross-section level, getting very high water levels, while

December 2014, Final Report - Phase 2
Technical review and support Jakarta Flood Management System
81
in reality there are large inundations, and water flows much slower to downstream of Jl. Gatot
Subroto.
The model also computes local inundations upstream of Jl. Casablanca (near x=4800), which
is in line with the field visit observations.
And, even with high downstream water level of 7 m in BKB, and a considerable head loss at
the outflow structure from Upper Cideng to BKB, the water levels in the lower reach of upper
Cideng hardly overflow when the embankments are raised to 8.0 m PP* or higher.
8.3 Conclusions
Based on the field visit and modelling of upper Cideng area the following conclusions can be
made:
• Local flooding problems occur in upper Cideng catchment especially upstream of Jl.
Gatot Subroto. The explanation is that the local drainage channels are quite narrow in
the upstream area, so the river has very little storage. Downstream of Jl. Gatot Subroto,
the river is much wider and only little flooding problems occur.
• The structures in upper Cideng river near Epicentrum cause significant backwater
effect. However, preliminary model calculations with estimated data (no actual data on
dimensions of the structures was available) show that the structures do not lead to
additional flooding since the river bed is relatively deep compared with the surface level
in that area.
• The upper Cideng area near Setia Budi reservoirs is influenced by high water levels in
the Western Banjir Canal (BKB). January 2014 this has led to stability problems of the
embankment of Setia Budi Timur reservoir. The embankments of the Setia Budi
reservoirs and Upper Cideng river need to be stabilised.
• Future development of the Ciliwung-BKT connection and the use of Ciliwung Lama
gate to divert part of Ciliwung floods will reduce BKB water levels. On the other hand,
the construction of an additional gate at Manggarai and Karet may increase the flows in
this stretch of BKB. Constructing a gate at the outlet of Upper Cideng to BKB can
prevent inflows from BKB into Cideng. Preliminary model calculations using a high water
level of +7 m PP* at BKB Latuharhari show that the discharge capacity of Upper Cideng
is large enough to handle a 1:100 year rainfall event, assuming the embankment levels
of the last 1.5 km of the upper Cideng are at least between 8.0 and 8.5 m PP*.

Technical review and support Jakarta Flood Management System
December 2014, Final Report - Phase 2
82
9 Review of the proposed Ciliwung-BKT and Cisadane diversions
9.1 Diverting flow from the Ciliwung
The evaluation of the January 2013 and 2014 floods clearly showed that diversion of water
from the Ciliwung away from BKB to other systems would most probably had prevented the
floods. A very effective diversion between the Ciliwung and the newly built BKT was identified
for the first time during the FHM project in 2007: the Ciliwung – BKT diversion. Another
potentially effective diversion was identified in the 90s (Nikken 1997): the Katu Lampa –
Cisadane diversion.
Figure 9-1 gives an indication of the location of both the Ciliwung – BKT and Katu Lampa –
Cisadane diversions in the Jakarta catchment area. When both diversions would be
implemented up to at least 400 m3/s can be diverted away from the Ciliwung before the peak
flows reach BKB, which will very significantly reduce the chance on flooding in the
downstream Ciliwung – BKB system, effectively improving the safety of people and
properties.
Figure 9-1, Overview of prosed Ciliwung diversions

December 2014, Final Report - Phase 2
Technical review and support Jakarta Flood Management System
83
9.1.1 Ciliwung – BKT diversion
Figure 9-2 shows part of the no regret measures proposed by FHM in 2007, including the
implementation of the East Banjir Channel (EBC or BKT) in combination with a connection to
BKT from Ciliwung. To allow for this connection the capacity of Cipinang – Sunter BKT stretch
had to be enlarged, to allow not only the high flows from the Cipinang, but also from the
Ciliwung. During the construction of BKT it was decided to follow the advice of FHM to
increase the capacity of the Cipinang – Sunter stretch to allow for a possible future
connection from Ciliwung. The BKT was completed in 2010 and is very effective in reducing
the floods in the eastern parts of Jakarta.
Figure 9-2, Proposed 'no regret' measures, FHM 2007
Due to the different hydrological characteristics of the Ciliwung and BKT catchments, it can
be shown that during high flow conditions on the Ciliwung, nearly always BKT is capable to
receive considerable flows from the Ciliwung. Also during the January 2013 floods, the BKT
system was virtually empty and most probably the floods would have been prevented with the
diversion from Ciliwung to BKT. For that reason the Government decided to immediately start
the preparation by re-evaluation of the hydraulics for the diversion.
In chapter 9.2 the evaluation and effectiveness of the Ciliwung – BKT diversion is presented.
It clearly shows that the diversion would bring great relieve to the BKT system without
compromising the drainage task of BKT. The construction of the diversion would immediate
optimize the investments of the BKT.
• Stepwise approach:
A. Cipinang-Sunter-Buaran-Cakung
(With increased Cipinang-Sunter capacity)
B. Finish EBC-NE stretch
C. Optimize Manggarai gate
D. Connect with Ciliwung
WBC EBC
Cakung
Sunter
Cipinang
Manggarai
Ciliwung
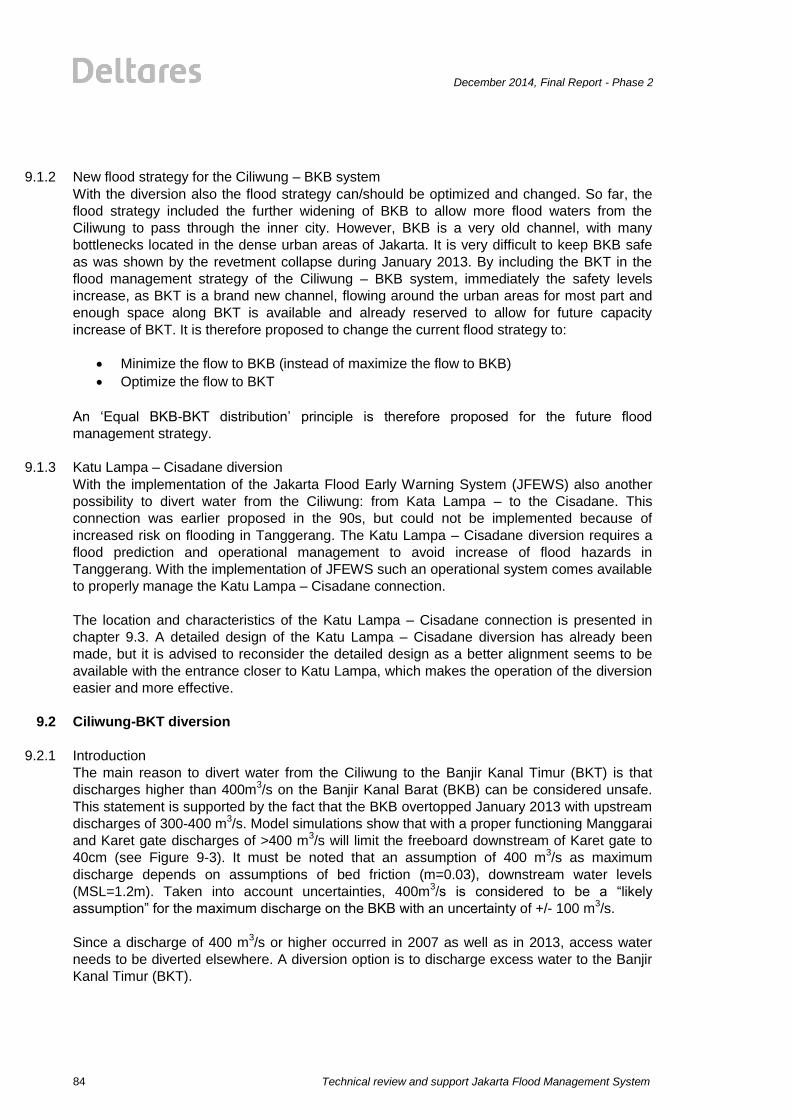
Technical review and support Jakarta Flood Management System
December 2014, Final Report - Phase 2
84
9.1.2 New flood strategy for the Ciliwung – BKB system
With the diversion also the flood strategy can/should be optimized and changed. So far, the
flood strategy included the further widening of BKB to allow more flood waters from the
Ciliwung to pass through the inner city. However, BKB is a very old channel, with many
bottlenecks located in the dense urban areas of Jakarta. It is very difficult to keep BKB safe
as was shown by the revetment collapse during January 2013. By including the BKT in the
flood management strategy of the Ciliwung – BKB system, immediately the safety levels
increase, as BKT is a brand new channel, flowing around the urban areas for most part and
enough space along BKT is available and already reserved to allow for future capacity
increase of BKT. It is therefore proposed to change the current flood strategy to:
Minimize the flow to BKB (instead of maximize the flow to BKB)
Optimize the flow to BKT
An ‘Equal BKB-BKT distribution’ principle is therefore proposed for the future flood
management strategy.
9.1.3 Katu Lampa – Cisadane diversion
With the implementation of the Jakarta Flood Early Warning System (JFEWS) also another
possibility to divert water from the Ciliwung: from Kata Lampa – to the Cisadane. This
connection was earlier proposed in the 90s, but could not be implemented because of
increased risk on flooding in Tanggerang. The Katu Lampa – Cisadane diversion requires a
flood prediction and operational management to avoid increase of flood hazards in
Tanggerang. With the implementation of JFEWS such an operational system comes available
to properly manage the Katu Lampa – Cisadane connection.
The location and characteristics of the Katu Lampa – Cisadane connection is presented in
chapter 9.3. A detailed design of the Katu Lampa – Cisadane diversion has already been
made, but it is advised to reconsider the detailed design as a better alignment seems to be
available with the entrance closer to Katu Lampa, which makes the operation of the diversion
easier and more effective.
9.2 Ciliwung-BKT diversion
9.2.1 Introduction
The main reason to divert water from the Ciliwung to the Banjir Kanal Timur (BKT) is that
discharges higher than 400m3/s on the Banjir Kanal Barat (BKB) can be considered unsafe.
This statement is supported by the fact that the BKB overtopped January 2013 with upstream
discharges of 300-400 m3/s. Model simulations show that with a proper functioning Manggarai
and Karet gate discharges of >400 m3/s will limit the freeboard downstream of Karet gate to
40cm (see Figure 9-3). It must be noted that an assumption of 400 m3/s as maximum
discharge depends on assumptions of bed friction (m=0.03), downstream water levels
(MSL=1.2m). Taken into account uncertainties, 400m3/s is considered to be a “likely
assumption” for the maximum discharge on the BKB with an uncertainty of +/- 100 m3/s.
Since a discharge of 400 m3/s or higher occurred in 2007 as well as in 2013, access water
needs to be diverted elsewhere. A diversion option is to discharge excess water to the Banjir
Kanal Timur (BKT).

December 2014, Final Report - Phase 2
Technical review and support Jakarta Flood Management System
85
Figure 9-3 – Water levels at the Banjir Kanal Barat (BKB) under 390 m3/s discharge at the Ciliwung and Krukut
From January 21st 2013 onward, Deltares is assisting PU with the analysis of four alternatives
(see Figure 9-4):
1. Alternative BBWSCC: Connects Ciliwung at Otista tiga, underpasses Kali Baru Timur and Cipinang and connects to the Banjir Kanal Timur (BKT) downstream the dropstructure at the Cipinang
2. Alternative Otista tiga (OT3): Connects to the Ciliwung at the same location as alternative BBWSCC. However, it connects directly to the Cipinang, shortening the trajectory with +/- 1km, but making it necessary to replace the Cipinang drop structure.
3. Alternative Casablanca: Connects to the Ciliwung at Jl Casablanca. It connects to the BKT at the same location as alternative BBWSCC. Jl Casablanca also overpasses the water supply line to Pejompongan.
4. Alternative Tarum Kanal Barat (TKB). It connects the Ciliwung and BKT at the Tarum Kanal Barat.
9.2.2 Improvements required at the BKT and Cipinang
Depending on the alternative improvements are necessary or suggested to the Banjir Kanal
Barat (BKT), see Figure 9-5:
- BKT improvement: For a stretch of +/- 1km the canal should be deepened with +/- 1 meter. This is only suggested for alternatives all alternatives and only when significant bypass discharges are reached (>50m
3/s)
- Removal of drop structure. If the diversion diverts from the Ciliwung to the Cipinang, the drop structure at the connection between the Cipinang and BKT should be removed. Note: the removal of the drop structure possibly requires an extra gate downstream of the lower Cipinang confluence if BKT water is used to flush the lower Cipinang. Removing the drop structure is required for alternatives OT3 and TKB
- Cipinang improvements. For alternatives OT3 and TKB the Cipinang should also be improved until the outlet of the diversion. Upstream the slope of the Cipinang should be gradually changed to meet bed levels, or a weir can be constructed similarly to present currently at the drop structure.
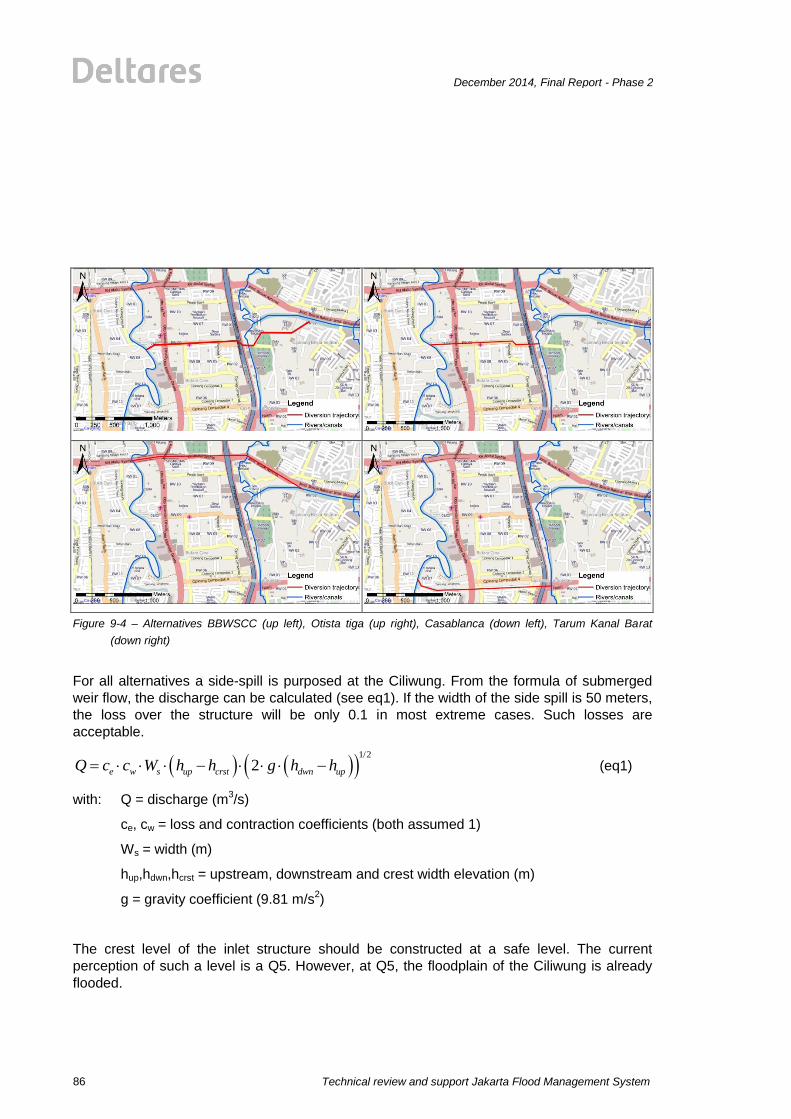
Technical review and support Jakarta Flood Management System
December 2014, Final Report - Phase 2
86
Figure 9-4 – Alternatives BBWSCC (up left), Otista tiga (up right), Casablanca (down left), Tarum Kanal Barat
(down right)
For all alternatives a side-spill is purposed at the Ciliwung. From the formula of submerged
weir flow, the discharge can be calculated (see eq1). If the width of the side spill is 50 meters,
the loss over the structure will be only 0.1 in most extreme cases. Such losses are
acceptable.
1/2
2e w s up crst dwn upQ c c W h h g h h (eq1)
with: Q = discharge (m3/s)
ce, cw = loss and contraction coefficients (both assumed 1)
Ws = width (m)
hup,hdwn,hcrst = upstream, downstream and crest width elevation (m)
g = gravity coefficient (9.81 m/s2)
The crest level of the inlet structure should be constructed at a safe level. The current
perception of such a level is a Q5. However, at Q5, the floodplain of the Ciliwung is already
flooded.

December 2014, Final Report - Phase 2
Technical review and support Jakarta Flood Management System
87
Figure 9-5 – Modifications BKT required for different alternatives
9.2.3 Diversion capacities
To divert water, three strategies have been discussed:
- Open cut; an open canal between the Ciliwung and BKT. Early studies (JFM1) already have shown that capacity of such a diversion is easily sufficient. Further analysis has not been conducted at this point, since space for constructing such diversion is generally considered too limited
- Tunnelling; an underground tunnel between Ciliwung and BKT. Depending the diameter required, the tunnel has to be dug several meters to 30 meters below the surface. Therefore it will always function as a siphon. Neglecting negative aspects such as sedimentation and captivation of air and trash inside the tunnel, a sufficient discharge capacity requires pipe diameters of (roughly) 2x6meters or 1x8 meters in diameter (see Figure 9-6).
- Box culverts; a concrete culvert placed in segments directly below the street surface. Such diversion will function similar to an open cut, until the water levels in the Ciliwung and BKT are higher than the top of the culverts. When water levels at Ciliwung and BKT are higher than the top of the culverts, the capacity is similar to that of a siphon. Assuming culvert diameters of 5X6 (width X height), two till three box culverts are required depending on the trajectory (see Table 9-1).
Weir 1 drop
Cipinang
BKT
Proposed
Outlet BBWSCC and Outlet
Outlet

Technical review and support Jakarta Flood Management System
December 2014, Final Report - Phase 2
88
Figure 9-6 – Discharge versus diameter for different alternatives
Table 9-1 – discharge capacity (m3/s) of tunnel diversions using box culverts under T=100 design. 1 Culvert is 5X6
meters.
The nature of the Ciliwung water system, high sedimentation rates and trash accumulation,
limit the possibilities of constructing diversions with siphons. Discharges plotted in Figure 9-4
are based on the assumption that there are no obstructions in the siphon. Siphons are very
sensitive to obstructions by captivation of air, accumulation of sediments and accumulation of
trash.
9.2.4 Effect of diversions on Ciliwung and Banjir Kanal Timur water levels
To significantly reduce the water levels at the Ciliwung a diversion with a capacity of
>150m3/s should be constructed. To underpin this number, system behaviour has been
analyzed using two eventas:
- The T100 design event. In this event, rainfall occurs in the entire catchment at the same
time. Figure 9-7 shows the relation between rainfall, peak discharge at the Ciliwung at MT
Haryono (just upstream of the diversion inlets) and the BKT.
- The 2007 event. This event represents the rainfall which led to the flooding of Jakarta city
in February 2007. This event is characterised by high rainfall intensities in the city prior to
extreme rainfall in the upper Ciliwung catchment.
Maximum tunnel discharge capacity under T=100 design
0
50
100
150
200
250
300
0 1 2 3 4 5 6 7 8 9 10Diameter (meter)
Dis
charg
e c
apacity (
m3/s
)
Capacity (BBWSCC alternative)
Capacity (Otista Tiga alternative)
Parameters:
Head difference: 3
Inlet loss coefficient: 1
Outlet loss coefficient: 1
Bend loss coefficient: 2
Under current situation Ciliwung
1 culvert 2 culverts 3 culverts
BBWSCC 70 140 210
OT3 77 153 230
TKB 79 158 237
Casablanca 64 129 193

December 2014, Final Report - Phase 2
Technical review and support Jakarta Flood Management System
89
Figure 9-7 – Relation between rainfall and discharge peaks on the Ciliwung and BKT
Effects on maximum water levels at the Ciliwung under T=100 design conditions, are given in
Figure 9-8. Analysis shows that for this particular event, the water level of the Ciliwung drops
with more than a meter when >140 m3/s is diverted from the Ciliwung to the BKT.
Effects of the diversion on maximum water levels on the Ciliwung are less, but in the same
order of magnitude, as shown in Figure 9-9. However, when maximum water levels are
compared with the canal embankment, it is clear that BKT capacity is sufficient to handle the
amount of discharge diverted in this particular event.
Figure 9-8 – Effect diversions on water levels of the Ciliwung (T=100)
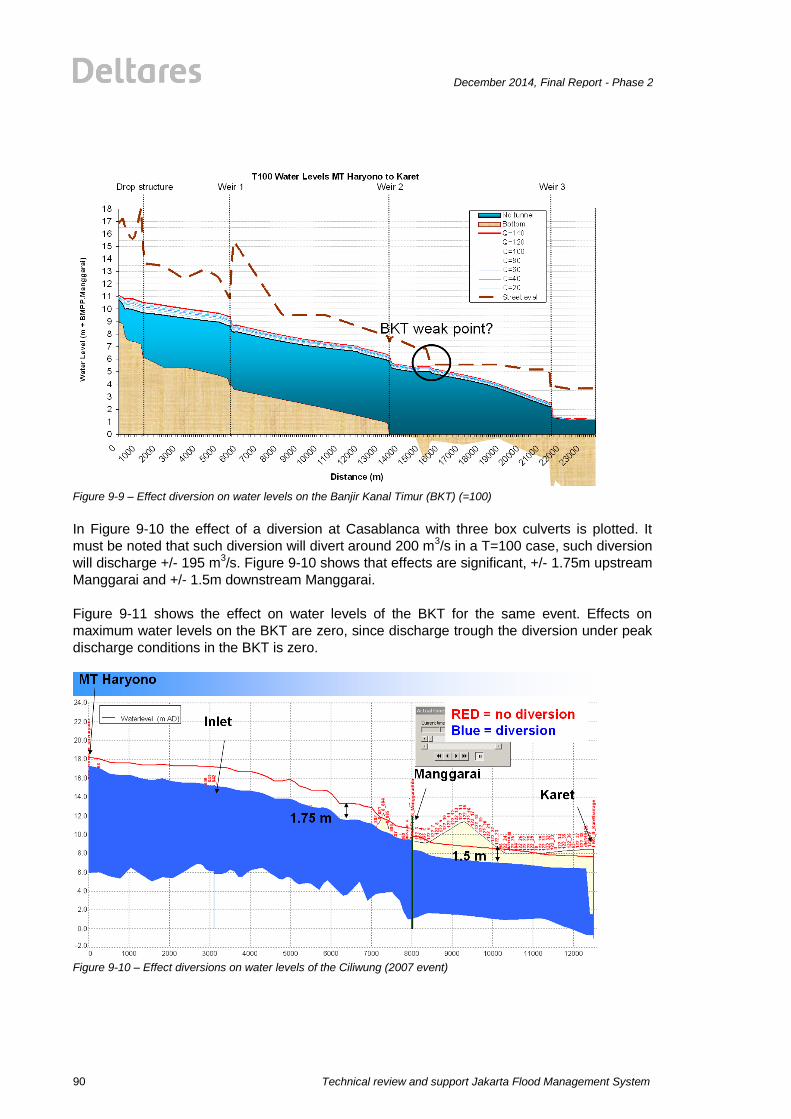
Technical review and support Jakarta Flood Management System
December 2014, Final Report - Phase 2
90
Figure 9-9 – Effect diversion on water levels on the Banjir Kanal Timur (BKT) (=100)
In Figure 9-10 the effect of a diversion at Casablanca with three box culverts is plotted. It
must be noted that such diversion will divert around 200 m3/s in a T=100 case, such diversion
will discharge +/- 195 m3/s. Figure 9-10 shows that effects are significant, +/- 1.75m upstream
Manggarai and +/- 1.5m downstream Manggarai.
Figure 9-11 shows the effect on water levels of the BKT for the same event. Effects on
maximum water levels on the BKT are zero, since discharge trough the diversion under peak
discharge conditions in the BKT is zero.
Figure 9-10 – Effect diversions on water levels of the Ciliwung (2007 event)

December 2014, Final Report - Phase 2
Technical review and support Jakarta Flood Management System
91
Figure 9-11 – Effect diversion on water levels on the Banjir Kanal Timur (BKT) (2007 event)
The effects on the Ciliwung and BKT discharges are shown in Figure 9-12 and Figure 9-13.
Peak discharge trough the Cilwiung lasts for a period of 2-3 days. Even before the peaks are
reached water is diverted to the BKT. The first peak of the Ciliwung coincides with a peak on
the BKT, which reduces the discharge to the diversion to zero. Therefore, the peak discharge
and corresponding water levels at the BKT are determined by discharge to the BKT from its
tributary rivers only. After the discharge peak at the BKT, with a duration of a few hours, has
passed, sufficient capacity is available to reduce the rest of the discharge peak at the
Ciliwung.
Figure 9-12 – Discharge distribution on Ciliwung (2007 event)
Discharge distribution Ciliwung at diversion outlet (2007 simulation)
Ciliwung discharge us diversion Ciliwung discharge ds divesion Diversion Discharge
9-2-20077-2-20075-2-20073-2-20071-2-200730-1-200728-1-200726-1-2007
Dis
cha
rge
(m
³/s)
460
440
420
400
380
360
340
320
300
280
260
240
220
200
180
160
140
120
100
80
60
40
20
0
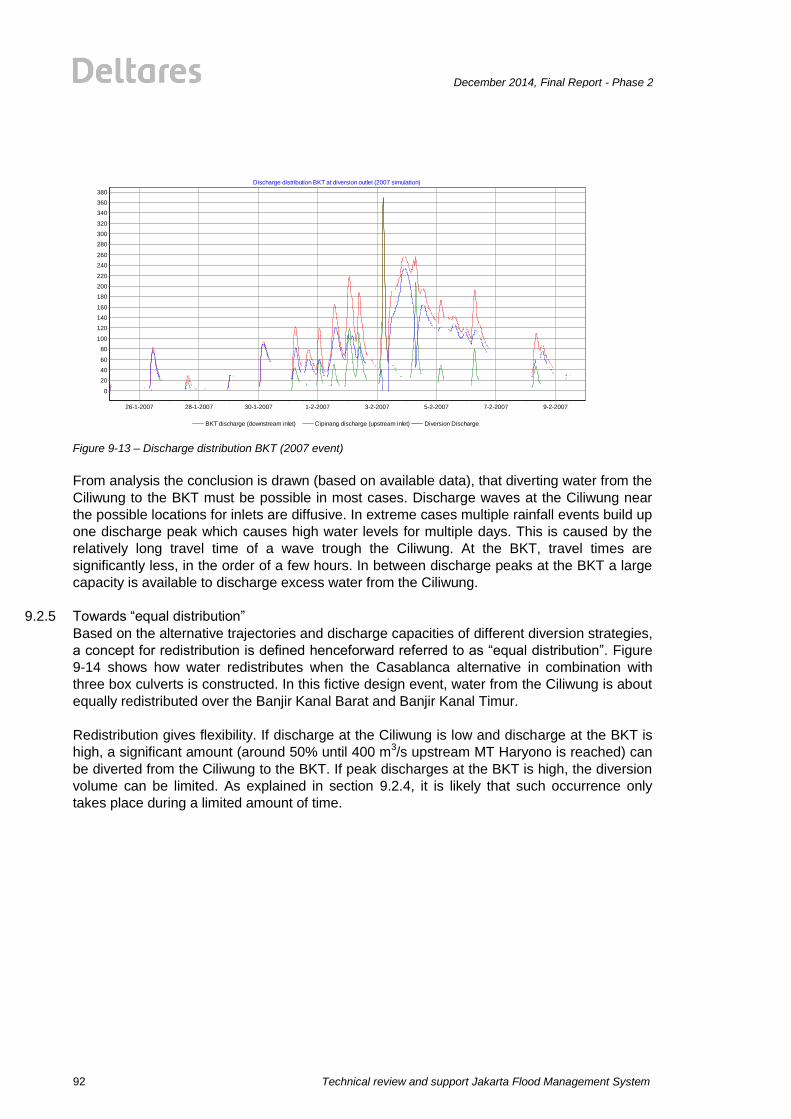
Technical review and support Jakarta Flood Management System
December 2014, Final Report - Phase 2
92
Figure 9-13 – Discharge distribution BKT (2007 event)
From analysis the conclusion is drawn (based on available data), that diverting water from the
Ciliwung to the BKT must be possible in most cases. Discharge waves at the Ciliwung near
the possible locations for inlets are diffusive. In extreme cases multiple rainfall events build up
one discharge peak which causes high water levels for multiple days. This is caused by the
relatively long travel time of a wave trough the Ciliwung. At the BKT, travel times are
significantly less, in the order of a few hours. In between discharge peaks at the BKT a large
capacity is available to discharge excess water from the Ciliwung.
9.2.5 Towards “equal distribution”
Based on the alternative trajectories and discharge capacities of different diversion strategies,
a concept for redistribution is defined henceforward referred to as “equal distribution”. Figure
9-14 shows how water redistributes when the Casablanca alternative in combination with
three box culverts is constructed. In this fictive design event, water from the Ciliwung is about
equally redistributed over the Banjir Kanal Barat and Banjir Kanal Timur.
Redistribution gives flexibility. If discharge at the Ciliwung is low and discharge at the BKT is
high, a significant amount (around 50% until 400 m3/s upstream MT Haryono is reached) can
be diverted from the Ciliwung to the BKT. If peak discharges at the BKT is high, the diversion
volume can be limited. As explained in section 9.2.4, it is likely that such occurrence only
takes place during a limited amount of time.
Discharge distribution BKT at diversion outlet (2007 simulation)
BKT discharge (downstream inlet) Cipinang discharge (upstream inlet) Diversion Discharge
9-2-20077-2-20075-2-20073-2-20071-2-200730-1-200728-1-200726-1-2007
Dis
cha
rge
(m
3/s
)
380
360
340
320
300
280
260
240
220
200
180
160
140
120
100
80
60
40
20
0
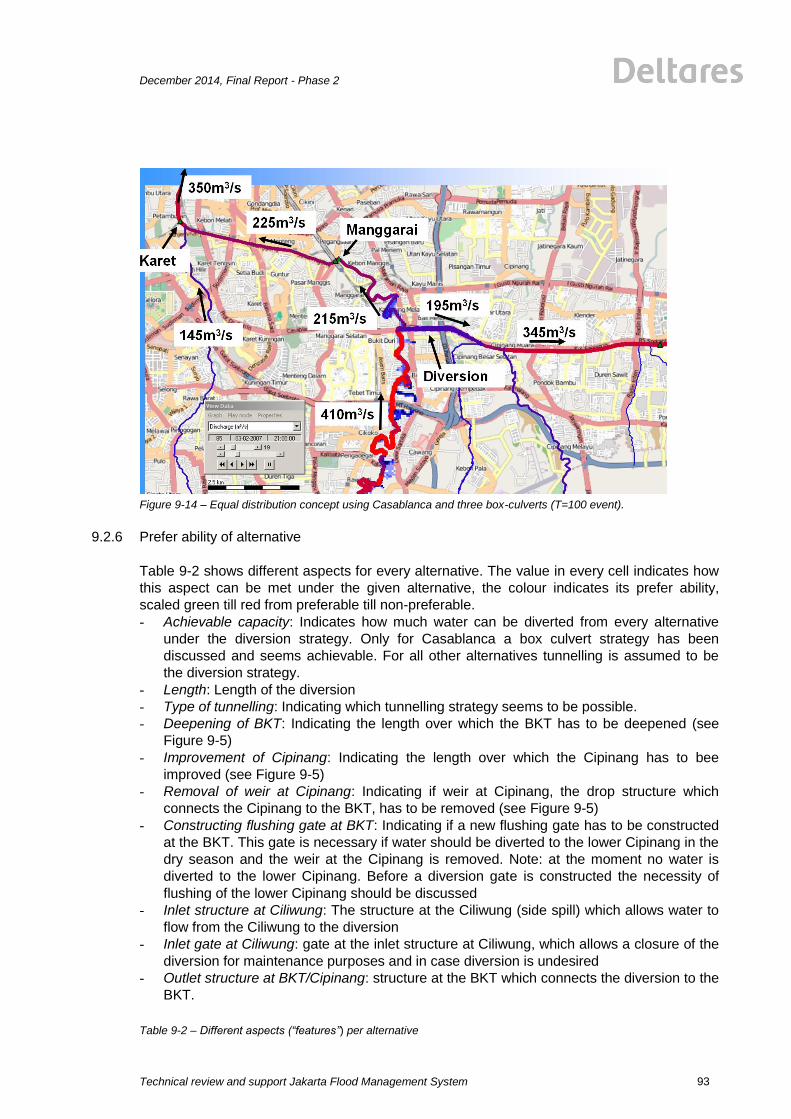
December 2014, Final Report - Phase 2
Technical review and support Jakarta Flood Management System
93
Figure 9-14 – Equal distribution concept using Casablanca and three box-culverts (T=100 event).
9.2.6 Prefer ability of alternative
Table 9-2 shows different aspects for every alternative. The value in every cell indicates how
this aspect can be met under the given alternative, the colour indicates its prefer ability,
scaled green till red from preferable till non-preferable.
- Achievable capacity: Indicates how much water can be diverted from every alternative
under the diversion strategy. Only for Casablanca a box culvert strategy has been
discussed and seems achievable. For all other alternatives tunnelling is assumed to be
the diversion strategy.
- Length: Length of the diversion
- Type of tunnelling: Indicating which tunnelling strategy seems to be possible.
- Deepening of BKT: Indicating the length over which the BKT has to be deepened (see
Figure 9-5)
- Improvement of Cipinang: Indicating the length over which the Cipinang has to bee
improved (see Figure 9-5)
- Removal of weir at Cipinang: Indicating if weir at Cipinang, the drop structure which
connects the Cipinang to the BKT, has to be removed (see Figure 9-5)
- Constructing flushing gate at BKT: Indicating if a new flushing gate has to be constructed
at the BKT. This gate is necessary if water should be diverted to the lower Cipinang in the
dry season and the weir at the Cipinang is removed. Note: at the moment no water is
diverted to the lower Cipinang. Before a diversion gate is constructed the necessity of
flushing of the lower Cipinang should be discussed
- Inlet structure at Ciliwung: The structure at the Ciliwung (side spill) which allows water to
flow from the Ciliwung to the diversion
- Inlet gate at Ciliwung: gate at the inlet structure at Ciliwung, which allows a closure of the
diversion for maintenance purposes and in case diversion is undesired
- Outlet structure at BKT/Cipinang: structure at the BKT which connects the diversion to the
BKT.
Table 9-2 – Different aspects (“features”) per alternative

Technical review and support Jakarta Flood Management System
December 2014, Final Report - Phase 2
94
Based the analysis in this report, in our point of view the Casablanca alternative should be the preferable alternative. Main reason is the type of tunnelling deemed possible and the fact that no modifications to the Cipinang river profile are necessary. Feasibility of this alternative should be studied further on (at least) the following aspects: - Mapping of conflicts with the Casablanca diversion and existing “underground”
infrastructure, such as electricity lines, water pipes, etc. - Traffic impacts of constructing box culverts under jl. Casablanca - Further detailing of the diversion itself, including detailed design of the inlet structure, gate
and outlet structure
9.3 Alternatif Diversion Channel (Sudetan) Ciliwung - BKT
9.3.1 Ciliwung (Jembatan Kampung Melayu) – Banjir Kanal Timur (Jl. Basuki Rachmad)
9.3.1.1 Deskripsi Umum
Permasalahan banjir Jakarta menjadi perhatian nasional terutama permasalahan banjir yang
diakibatkan oleh sungai Ciliwung dengan Banjir Kanal baratnya(BKB).
Pengembangan pembangunan Banjir Kanal barat selesai tahun 2009 dengan kapasitas
400m3/det di bagian Manggarai-Karet, 450m3/det di bagian Karet-muara Angke, 500m3/det
di bagian muara Angke-Laut, sedangkan pengembangan Pembangunan sungai Ciliwung
masih dalam taraf Perencanaan detail tahun 2013 mulai dari Manggarai sampai jalan Tol
Simatupang dan pelaksanaan fisiknya sedang dilaksanakan 2014 sampai 2016 dengan
kapasitas 400m3/det.
Dengan terbangunnya Banjir Kanal Timur(BKT) tahun 2011, memberikan pemikiran
pemanfaatan kapasitas BKT yang ada untuk dimanfaatkan menyalurkan debit banjir sungai
Ciliwung melalui potensi BKT dengan pembuatan sudetan berupa terowongan atau gorong-
gorong dari sungai Ciliwung ke BKT, hal ini sudah diantisipasi dengan satu opsi koneksi
Ciliwung-BKT dalam studi FHM Jakarta tahun 2007 oleh Deltares.
Secara umum Pembangunan Infrastruktur Penanggulangan Banjir Jakarta masih terfokus
dalam penanganan di bagian hilir yang menjadi prioritas di daerah pusat kota yang terletak di
bagian utara, sedangkan penanganan di bagian tengah dan hulu masih baru di mulai dengan
penanganan sungai Angke, sungai Pesanggrahan, sungai Sunter dan Ciliwung, yang tidak
diimbangi dengan penanganan drainasenya.

December 2014, Final Report - Phase 2
Technical review and support Jakarta Flood Management System
95
9.3.1.2 Sistem Penanggulangan Banjir Jakarta
Sistem Penanggulangan banjir Jakarta secara umum dapat dibagi menjadi dua bagian yaitu
dengan pengembangan sistem Flood Control dan sistem Drainase perkotaan. Sistem Flood
Control atau penanganan sungai-sungai utama mulai dari sungai Angke sampai sungai
Cakung, yang secara global dapat dibagi menjadi :
a. Sistem Cengkareng drain
b. Sistem Ciliwung dengan Banjir Kanal Barat
c. Sistem Banjir Kanal Timur
d. Sistem Cakung drain
e. Sistem Sunter bawah
f. Sistem Ciliwung bawah
g. Sistem Angke bawah
h. Sistem Sentiong
i. Sistem Polder seperti Pluit dll.
Secara umum sistem-sistem tersebut diatas berdiri sendiri dapat dilihat dalam Gambar 1.
Gamabar 1
Permasalahan yang terjadi untuk sungai Ciliwung dengan kejadian banjir yang relatif sering
disebabkan kapasitas sungai Ciliwung dengan BKB sudah tidak mampu menampung debit
banjir yang ada sehingga perlu penanganan dengan beberapa opsi seperti pembuatan
normalisasi sungai Ciliwung, Sudetan Ciliwung-BKT di Jakarta seperti di Otista 3 dengan
terowongan dengan kapasitas 60m3/det oleh BBWSCC atau Box culvert dengan kapasitas
150m3/det di Jembatan Kp.Melayu-BKT dan sudetan Ciliwung- Cisadane di Bogor berupa
terowongan dengan kapasitas 400m3/det, dapat dilihat dalam Gambar 2.
Gambar 2

Technical review and support Jakarta Flood Management System
December 2014, Final Report - Phase 2
96
9.3.1.3 Kondisi Banjir Kanal Timur
Setelah dibangunnya BKT tahun 2011 dengan kapasitas 270m3/det dibagian hulu,
350m3/det dibagian hilir, kejadian banjir yang terjadi akibat sungai Cipinang,sungai Sunter,
sungai Jatikramat, sungai Buaran dan sungai Cakung telah menyelesaikan masalah banjir di
bagian hilir BKT, tetapi masih menyisakan masalah banjir di bagian hulu BKT sungai-sungai
tersebut, karena masih dalam taraf pembangunan.
Dari aspek hidrologi, catchment area BKT relatif lebih hilir dan kecil (dapat dilihat dalam
Gambar 1), menyebabkan waktu konsentrasi relatif lebih cepat sehingga debit puncak BKT
sudah terlewati dan sungai Ciliwung dengan waktu konsentrasi yang lebih lama
menyebabkan kondisi debit BKT relatif sudah kecil diperkirakan 60m3/det. Dengan kapasitas
270m3/det dibagian hulu BKT cukup untuk menampung debit puncak sungai Ciliwung yang
datang kemudian dengan memanfaatkan kapasitas yang tersisa diperkirakan sebesar
210m3/det dengan 60m3/det dari sudetan Otista 3 dan 150m3/det dari sudetan Jembatan
Kp.Melayu-BKT dibawah jalan Abdullah Syafei-Kp.Melayu besar-Basuki Rachmat, dapat
ditingkatkan dari 210m3/det menjadi 320m3/det dengan memperbesar kapasitas BKT dari
Cipinang ke Jatikramat menjadi 320m3/det, dengan menghilangkan drop structure I dan II di
bagian hulu BKT, 1 m di drop structure I dan 2.2 m di drop structure II.
Dari kejadian banjir BKT setelah terbangunnya BKT pada kejadian tahun 2011-Januari 2014
lebih kurang lima kali kejadian banjir besar BKT dan sungai Ciliwung, dari data telemetri
menunjukan Banjir di BKT selalu lebih awal sehingga pada saat Banjir puncak Ciliwung
datang BKT dalam keadaan debit rendah sehingga dapat dimanfaatkan untuk menampung
sebagian debit puncak banjir sungai Ciliwung yang datang kemudian.
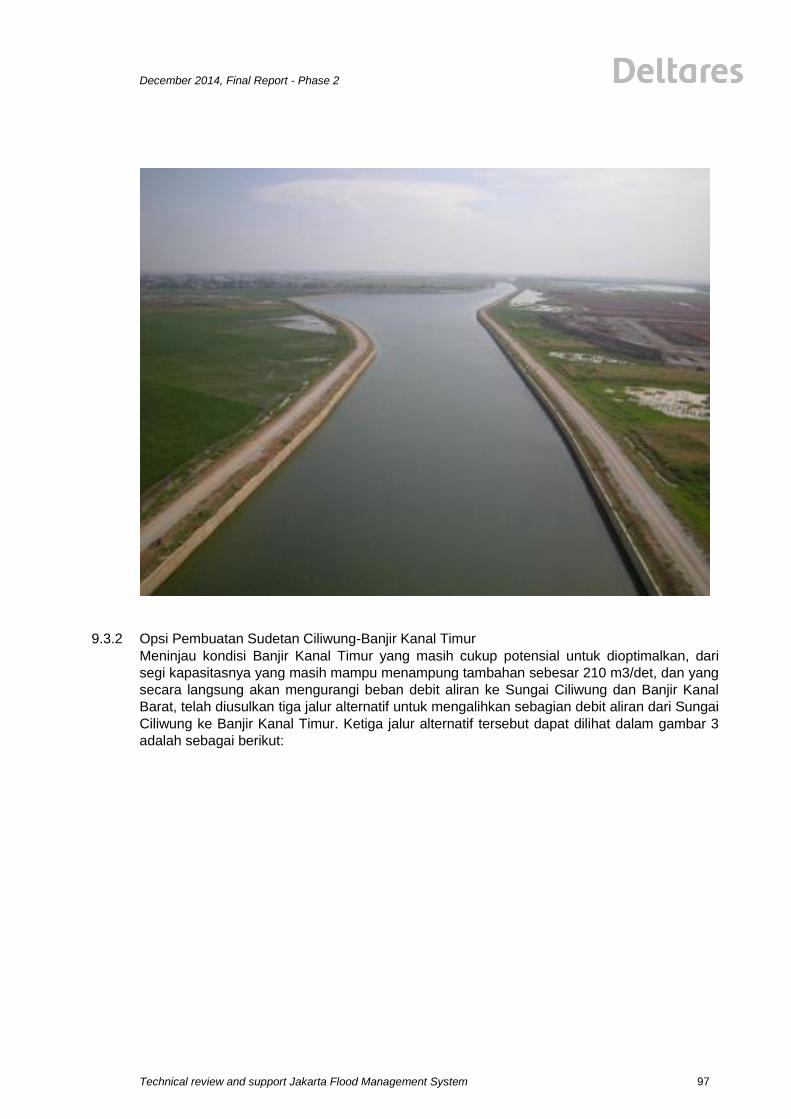
December 2014, Final Report - Phase 2
Technical review and support Jakarta Flood Management System
97
9.3.2 Opsi Pembuatan Sudetan Ciliwung-Banjir Kanal Timur
Meninjau kondisi Banjir Kanal Timur yang masih cukup potensial untuk dioptimalkan, dari
segi kapasitasnya yang masih mampu menampung tambahan sebesar 210 m3/det, dan yang
secara langsung akan mengurangi beban debit aliran ke Sungai Ciliwung dan Banjir Kanal
Barat, telah diusulkan tiga jalur alternatif untuk mengalihkan sebagian debit aliran dari Sungai
Ciliwung ke Banjir Kanal Timur. Ketiga jalur alternatif tersebut dapat dilihat dalam gambar 3
adalah sebagai berikut:

Technical review and support Jakarta Flood Management System
December 2014, Final Report - Phase 2
98
Gambar 3
Alternatif I
Ciliwung - Jembatan Kampung Melayu Banjir Kanal Timur (Jl. Basuki Rachmad)
Alternatif pertama yaitu mengalihkan debit aliran dari Sungai Ciliwung pada titik lokasi inlet
bermula di Jembatan Kampung Melayu dengan memanfaatkan jalur di bawah jalan raya
sekunder dari Jl. Abdullah Syafe’i ke Kp. Melayu Besar hingga Jl. Basuki Rachmad. Ada tiga
titik lokasi outlet yang memungkinkan dengan memanfaatkan Sungai Cipinang ke BKT atau
langsung menuju ke BKT. Peninjauan secara teknis dibahas lebih detail kemudian.
Alternatif II
Ciliwung - Jl. Otista Tiga Banjir Kanal Timur (Jl. Basuki Rachmad)
Ciliwung - Jl. Otista Tiga Cipinang - Banjir Kanal Timur (Jl. Basuki Rachmad)
Alternatif kedua yaitu mengalirkan debit aliran dari Sungai Ciliwung pada titik lokasi inlet
bermula di garis lurus perpotongan dari Sungai Ciliwung ke Jl. Otista 3 hingga menuju ke
Sungai Cipinang (melalui Jl. Pulomas Cawang hingga Jl. Kebon Nanas). Ada dua alternatif
lokasi outlet yaitu: (i) Jl. Otista Tiga dialirkan terlebih dahulu ke Sungai Cipinang lalu Banjir
Kanal Timur, dan (i) Jl. Otista Tiga langsung dialirkan ke Banjir Kanal Timur. Alternatif kedua
didesain dengan terowongan berupa pipa berdiameter 2x3.5 m dan kapasitas debit rencana
Q = 60 m3/detik.
Alternatif III
Ciliwung-West Tarum Canal Cipinang – Banjir Kanal Timur (Jl. Basuki Rachmad)
Alternatif ketiga sudetan adalah dengan memanfaatkan existing West Tarum Canal yang
pada rencana awalnya dibangun sebagai supply channel berasal dari Sungai Citarum (Jawa
Barat) ke WTP Pejompongan di Jakarta Pusat. Jadi, sebesar 80 % suplai air bersih untuk
Jakarta berasal dari Jatiluhur sementara 20 % dari air baku ditambahkan dari Sungai

December 2014, Final Report - Phase 2
Technical review and support Jakarta Flood Management System
99
Ciliwung. Sehingga sebagian aliran suplai air bersih dari Kali Malang (West Tarum Canal) ke
Cipinang disalurkan melalui pipa ke Sungai Ciliwung hingga ke Pejompongan di Jakarta
Pusat. Namun, saat ini pipa tersebut tidak lagi digunakan sebagai suplai air bersih sehingga
prasarana pipa Kali Malang-Cipinang-Ciliwung yang telah ada ini bisa dimanfaatkan dengan
alih fungsi untuk mengalirkan debit banjir sebaliknya dari Ciliwung ke Cipinang yang
diteruskan hingga ke Banjir Kanal Timur. Namun kapasitas pipa terbatas pada suplai air 20%
untuk wilayah Jakarta dari total kebutuhan sehingga diperkirakan kapasitas yang ada berkisar
19 m3/detik dan masih bisa ditingkatkan lagi.
Dari ketiga alternatif jalur Sudetan Ciliwung - Banjir Kanal Timur, alternatif II
(Ciliwung-Otista 3) menggunakan tunneltelah dimulai pelaksanaannya dan hingga kini
masih berjalan dengan pelaksana BBWSCC. Alternatif III melalui gorong-gorong
ujung kalimalang juga dapat membantu mengalihkan debit aliran Ciliwung namun
hingga saat ini masih sebatas kajian. Dengan additional inflow 60m3/det ke BKT
sementara kapasitas hulu BKT adalah 270 m3/detik, maka BKT masih dapat
menampung tambahan debit air masuk sebesar 210 m3/det.
Setelah melaksanakan beberapa kajian studi singkat, alternatif I (Ciliwung-
Kp.Melayu-BKT) denganbox-culvert diusulkan sebagai alternatif yang efektif dan
efisien untuk mengalihkan debit aliran Ciliwung dalam jumlah yang lebih besar (150-
200m3/detik).
9.3.3 Opsi Alternatif Outlet Diversion
Opsi alternative I memiliki lokasi inlet diversion yang cukup jelas yaitu di sebelah hulu
Jembatan Ciliwung di Kampung Melayu. Diusulkan tiga alternatif lokasi outlet point melihat
dari aspek ruang jalan dan pemanfaatan sungai Cipinang. Alternatif lokasi outlet point berikut
tinjauannya adalah sebagai berikut (Gambar 4):
(i) Alternatif-1: Jl. Abdullah Syafe’i – Jl. Basuki Rachmad – Drop Structure I
BKT
Ruas Jl.Basuki Rachmad yang bersebelahan BKT memiliki ruang jalan cukup tersedia untuk
pelaksanaan box-culvert dengan lebar sekitar 12 – 16 meter, jarak dari bawah Jl.Tol Cawang-
Priuk hingga S.Cipinang (Jl.Basuki Rachmad) sekitar 220 meter, jarak memanjang box-
culvert dari Sungai Cipinang (Jl.Basuki Rachmad) hingga drop structure I sekitar 800 meter.
(ii) Alternatif-2: Jl. Abdullah Syafe’i –Sungai Cipinang (Jl.Basuki Rachmad) –
BKT
Bagian awal ruas Jl.Basuki Rachmad masih cukup tersedia 12 meter dengan panjang 220
meter dari bawah Jl.Tol Cawang-Priuk hingga Sungai Cipinang (Jl.Basuki Rachmad),
kemudian box-culvert dihubungkan ke existing channel Sungai Cipinang ke Selatan hingga
BKT, penghematan konstruksi memanjang diversion, namun diperlukan sedikit penyesuaian
alur sungai di Sungai Cipinang.
(iii) Alternatif-3: Jl. Tol Cawang-Priuk – Jl. Basuki Rachmad –Drop Structure II
BKT
Ruas Jl.Basuki Rachmad yang bersebelahan BKT memiliki ruang jalan cukup tersedia untuk
pelaksanaan diversion (box-culvert) dengan lebar sekitar 12 – 16 meter, jarak dari bawah
Jl.Tol Cawang-Priuk hingga S.Cipinang (Jl.Basuki Rachmad) sekitar 220 meter, jarak

Technical review and support Jakarta Flood Management System
December 2014, Final Report - Phase 2
100
memanjang box-culvert dari Sungai Cipinang (Jl.Basuki Rachmad) hingga drop structure II
sekitar 1,5 kilometer.
Gambar 4
panjang box culvert keseluruhan tiap alternatif Alt 1=2.3km, Alt 2=2.1km, Alt 3=3.1km
Tinjauan Lapangan dan Hidraulik
Dalam kajian studi ini, telah dilakukan beberapa tahap investigasi:
Tinjauan Lapangan
Survey lapangan dilaksanakan dengan koordinasi Dinas Pekerjaan Umum DKI Jakarta
antara Sub-Dinas Bina Marga dan Sub-Dinas SDA untuk meninjau apakah lokasi dan akses
jalan pada wilayah tersebut memungkinkan untuk konstruksi box-culvert. Mengingat teknis
pelaksanaan akan dilakukan di bawah tanah, maka perlu diperhatikan lebar jalan sepanjang
lokasi Sudetan, jarak antara fondasi pilar (footing/pile cap)serta utilitas yang ada di bawah
tanah jalan layang Jl.KH.Abdullah Syafe’i (terutama transmisi pipeline air baku Cawang-
Pejompongan diameter 2x2m dan utilitas yang lain). DPU DKI sepakat pada kesimpulan
bersama bahwa konstruksi box-culvertalternative I Kp.Melayu (Ciliwung) – BKT
sudetanmemungkinkan untuk diimplementasikan, dapat dilihat dalam gambar 5
Inlet point
3 Alternatif outlet point
Alt 1 Alt 2
Alt 3

December 2014, Final Report - Phase 2
Technical review and support Jakarta Flood Management System
101
Gambar 5
Meskipun demikian, terdapat 5 titik utama tinjauan dari Kp.Melayu ke arah Jl. Basuki
Rachmad yang penting untuk diperhatikan dalam detail perencanaan teknis:
1. Penyempitan Kampung - Jalan sebelum Jl. Tol Cawang-Priuk
2. Persilangan pipa air baku (Pejompongan) di sebelah timur sungai Kalibaru
3. Persilangan jalur box-culvert dengan Jl. Tol Cawang-Priuk
4. Pertemuan jalur box-culvert dengan Sungai Kalibaru
5. Integrasi titik tumpu Pilar rencana Fly Over Tol baru yaitu ruas Kp.Melayu-Duri
pulo, Melayu-Sunter dan Bekasi-Cawang-Kp.Melayu, dapat dilihat dalam
gambar 6 berikut:
Gambar 6
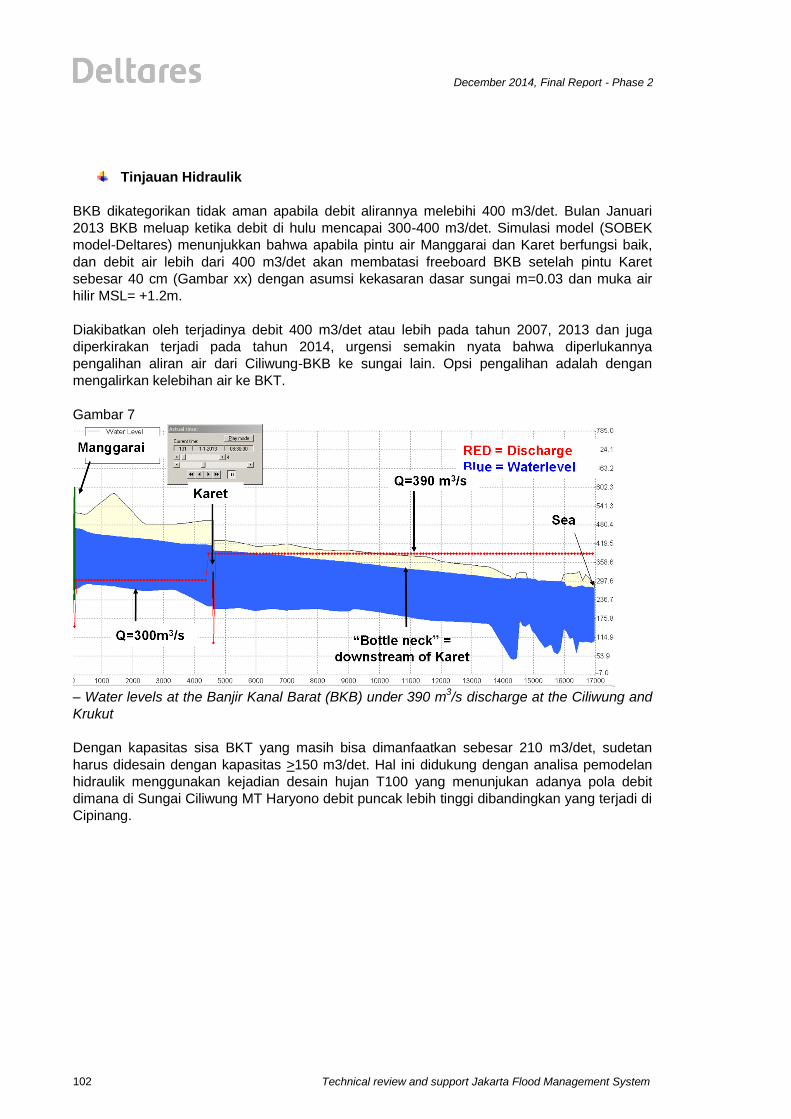
Technical review and support Jakarta Flood Management System
December 2014, Final Report - Phase 2
102
Tinjauan Hidraulik
BKB dikategorikan tidak aman apabila debit alirannya melebihi 400 m3/det. Bulan Januari
2013 BKB meluap ketika debit di hulu mencapai 300-400 m3/det. Simulasi model (SOBEK
model-Deltares) menunjukkan bahwa apabila pintu air Manggarai dan Karet berfungsi baik,
dan debit air lebih dari 400 m3/det akan membatasi freeboard BKB setelah pintu Karet
sebesar 40 cm (Gambar xx) dengan asumsi kekasaran dasar sungai m=0.03 dan muka air
hilir MSL= +1.2m.
Diakibatkan oleh terjadinya debit 400 m3/det atau lebih pada tahun 2007, 2013 dan juga
diperkirakan terjadi pada tahun 2014, urgensi semakin nyata bahwa diperlukannya
pengalihan aliran air dari Ciliwung-BKB ke sungai lain. Opsi pengalihan adalah dengan
mengalirkan kelebihan air ke BKT.
Gambar 7
– Water levels at the Banjir Kanal Barat (BKB) under 390 m
3/s discharge at the Ciliwung and
Krukut
Dengan kapasitas sisa BKT yang masih bisa dimanfaatkan sebesar 210 m3/det, sudetan
harus didesain dengan kapasitas >150 m3/det. Hal ini didukung dengan analisa pemodelan
hidraulik menggunakan kejadian desain hujan T100 yang menunjukan adanya pola debit
dimana di Sungai Ciliwung MT Haryono debit puncak lebih tinggi dibandingkan yang terjadi di
Cipinang.
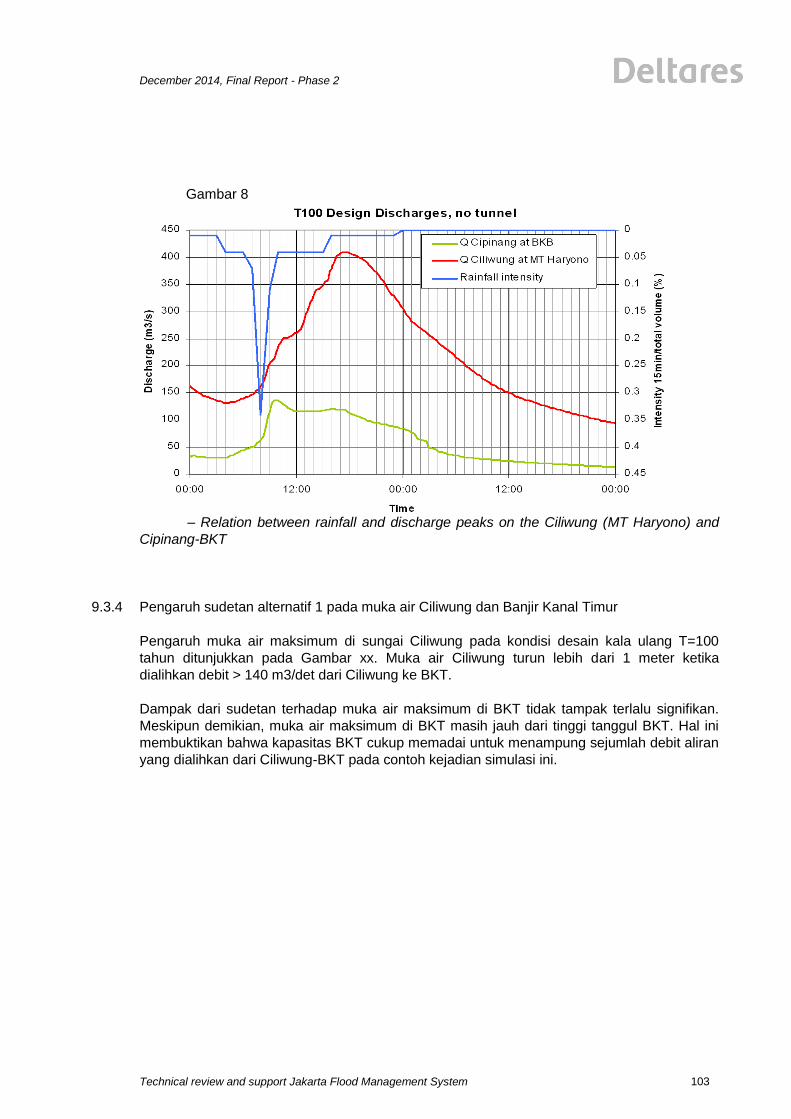
December 2014, Final Report - Phase 2
Technical review and support Jakarta Flood Management System
103
Gambar 8
– Relation between rainfall and discharge peaks on the Ciliwung (MT Haryono) and
Cipinang-BKT
9.3.4 Pengaruh sudetan alternatif 1 pada muka air Ciliwung dan Banjir Kanal Timur
Pengaruh muka air maksimum di sungai Ciliwung pada kondisi desain kala ulang T=100
tahun ditunjukkan pada Gambar xx. Muka air Ciliwung turun lebih dari 1 meter ketika
dialihkan debit > 140 m3/det dari Ciliwung ke BKT.
Dampak dari sudetan terhadap muka air maksimum di BKT tidak tampak terlalu signifikan.
Meskipun demikian, muka air maksimum di BKT masih jauh dari tinggi tanggul BKT. Hal ini
membuktikan bahwa kapasitas BKT cukup memadai untuk menampung sejumlah debit aliran
yang dialihkan dari Ciliwung-BKT pada contoh kejadian simulasi ini.

Technical review and support Jakarta Flood Management System
December 2014, Final Report - Phase 2
104
Gambar 9
– Effect diversions on water levels of the Ciliwung (T=100)
Gambar 10
– Effect diversion on water levels on the Banjir Kanal Timur (BKT) (=100)
**untuk mencapai kapasitas 150 m3/s 2 x (5 x 6) meter

December 2014, Final Report - Phase 2
Technical review and support Jakarta Flood Management System
105
Untuk ketiga alternatif tersebut, pengalihan debit aliran sungai Ciliwung akan digunakan
desain struktur hydraulic Box-Culvert dengan ukuran 5 x 6 meter.
Perkiraan kapasitas sudetan menggunakan Box Culvert dalam konteks kala ulang kejadian
T=100 tahunan untuk semua alternatif apabila terpasang 1, 2 atau 3 buah box adalah sbb:
Tabel 1
Pada Gambar 4 berikut dapat dilihat dampak sudetan alternatif 1 menggunakan 3 buah box-
culvert bahwa terjadi penurunan signifikan + 1.75m di hulu Manggarai dan + 1.5 m hilir
Manggarai. Gambar selanjutnya mengindikasikan bahwa muka air maksimum di BKT akan
sama tingginya dengan muka air maksimum ketika terjadi debit puncak hujan yang
mengalirkan aliran dari Sungai-sungai hulu ke BKT (Cipinang, Sunter, Buaran, Jati Kramat
dan Cakung).
6m
5m
Desain Debit Aliran
(m3/dtk) Lebar (m) Tinggi (m)
1 box culvert 64 5 6
2 box culverts 129 12 6
3 box culverts 193 18 6
Diversion-
Channel
Dimensi
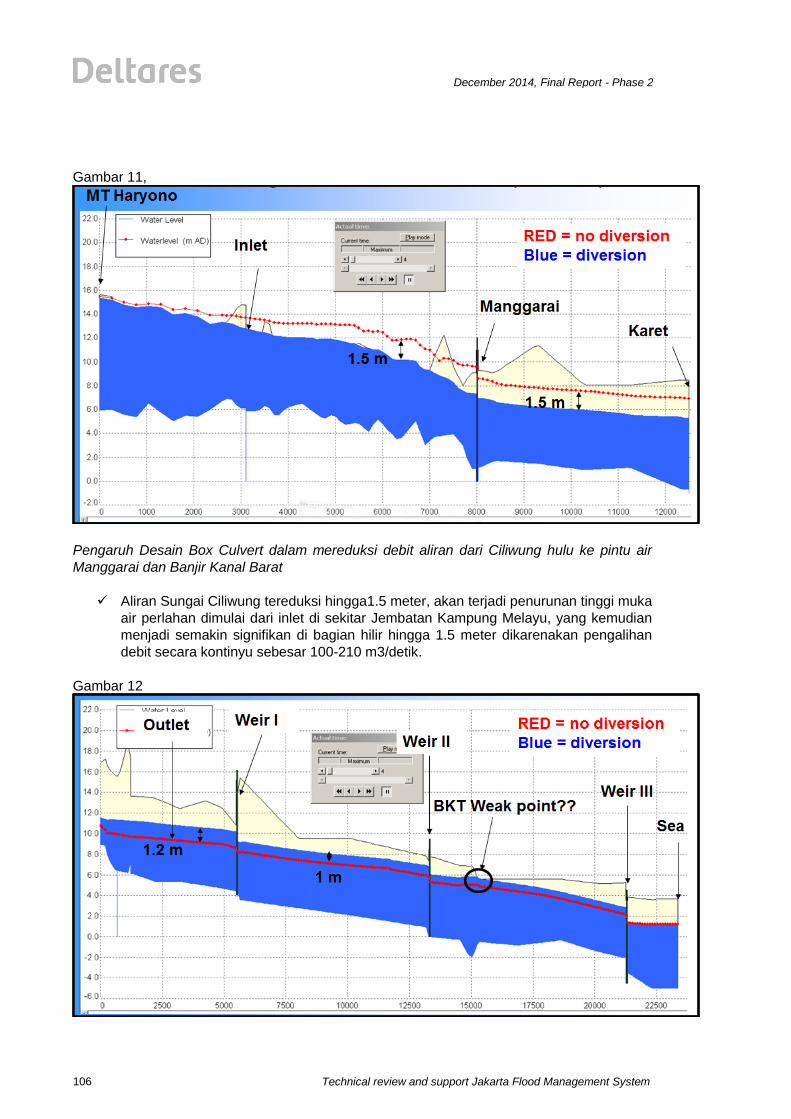
Technical review and support Jakarta Flood Management System
December 2014, Final Report - Phase 2
106
Gambar 11,
Pengaruh Desain Box Culvert dalam mereduksi debit aliran dari Ciliwung hulu ke pintu air
Manggarai dan Banjir Kanal Barat
Aliran Sungai Ciliwung tereduksi hingga1.5 meter, akan terjadi penurunan tinggi muka
air perlahan dimulai dari inlet di sekitar Jembatan Kampung Melayu, yang kemudian
menjadi semakin signifikan di bagian hilir hingga 1.5 meter dikarenakan pengalihan
debit secara kontinyu sebesar 100-210 m3/detik.
Gambar 12
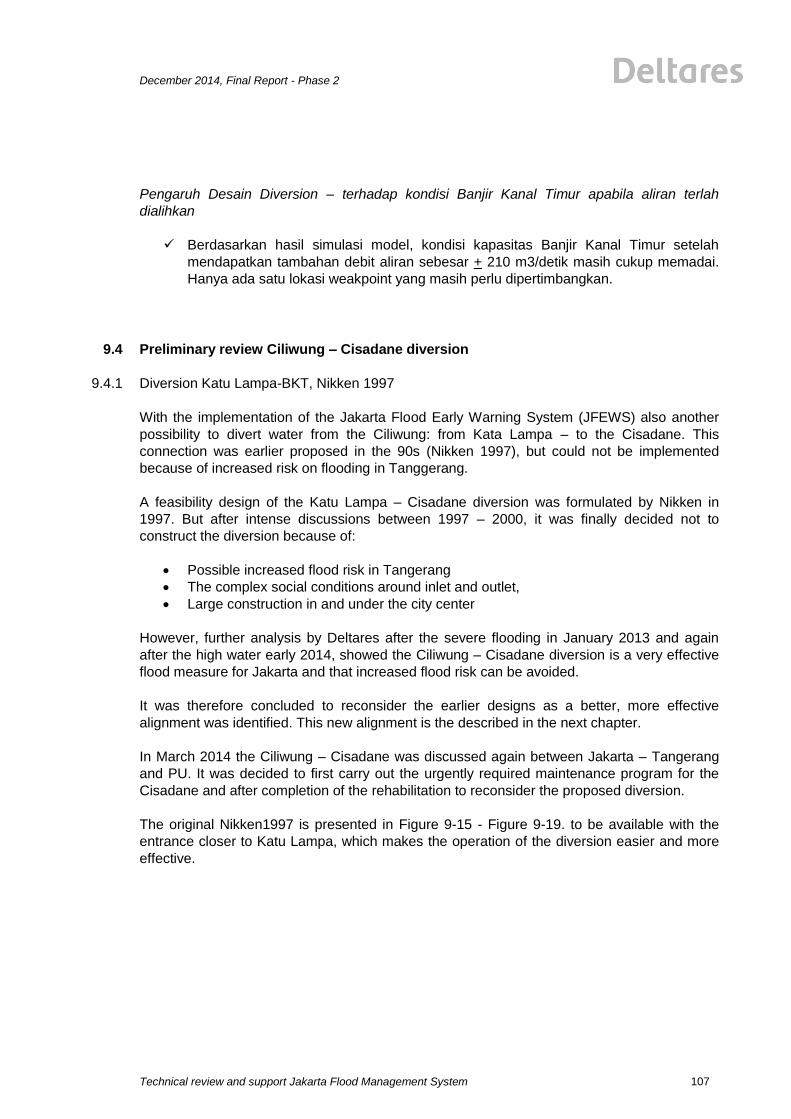
December 2014, Final Report - Phase 2
Technical review and support Jakarta Flood Management System
107
Pengaruh Desain Diversion – terhadap kondisi Banjir Kanal Timur apabila aliran terlah
dialihkan
Berdasarkan hasil simulasi model, kondisi kapasitas Banjir Kanal Timur setelah
mendapatkan tambahan debit aliran sebesar + 210 m3/detik masih cukup memadai.
Hanya ada satu lokasi weakpoint yang masih perlu dipertimbangkan.
9.4 Preliminary review Ciliwung – Cisadane diversion
9.4.1 Diversion Katu Lampa-BKT, Nikken 1997
With the implementation of the Jakarta Flood Early Warning System (JFEWS) also another
possibility to divert water from the Ciliwung: from Kata Lampa – to the Cisadane. This
connection was earlier proposed in the 90s (Nikken 1997), but could not be implemented
because of increased risk on flooding in Tanggerang.
A feasibility design of the Katu Lampa – Cisadane diversion was formulated by Nikken in
1997. But after intense discussions between 1997 – 2000, it was finally decided not to
construct the diversion because of:
Possible increased flood risk in Tangerang
The complex social conditions around inlet and outlet,
Large construction in and under the city center
However, further analysis by Deltares after the severe flooding in January 2013 and again
after the high water early 2014, showed the Ciliwung – Cisadane diversion is a very effective
flood measure for Jakarta and that increased flood risk can be avoided.
It was therefore concluded to reconsider the earlier designs as a better, more effective
alignment was identified. This new alignment is the described in the next chapter.
In March 2014 the Ciliwung – Cisadane was discussed again between Jakarta – Tangerang
and PU. It was decided to first carry out the urgently required maintenance program for the
Cisadane and after completion of the rehabilitation to reconsider the proposed diversion.
The original Nikken1997 is presented in Figure 9-15 - Figure 9-19. to be available with the
entrance closer to Katu Lampa, which makes the operation of the diversion easier and more
effective.
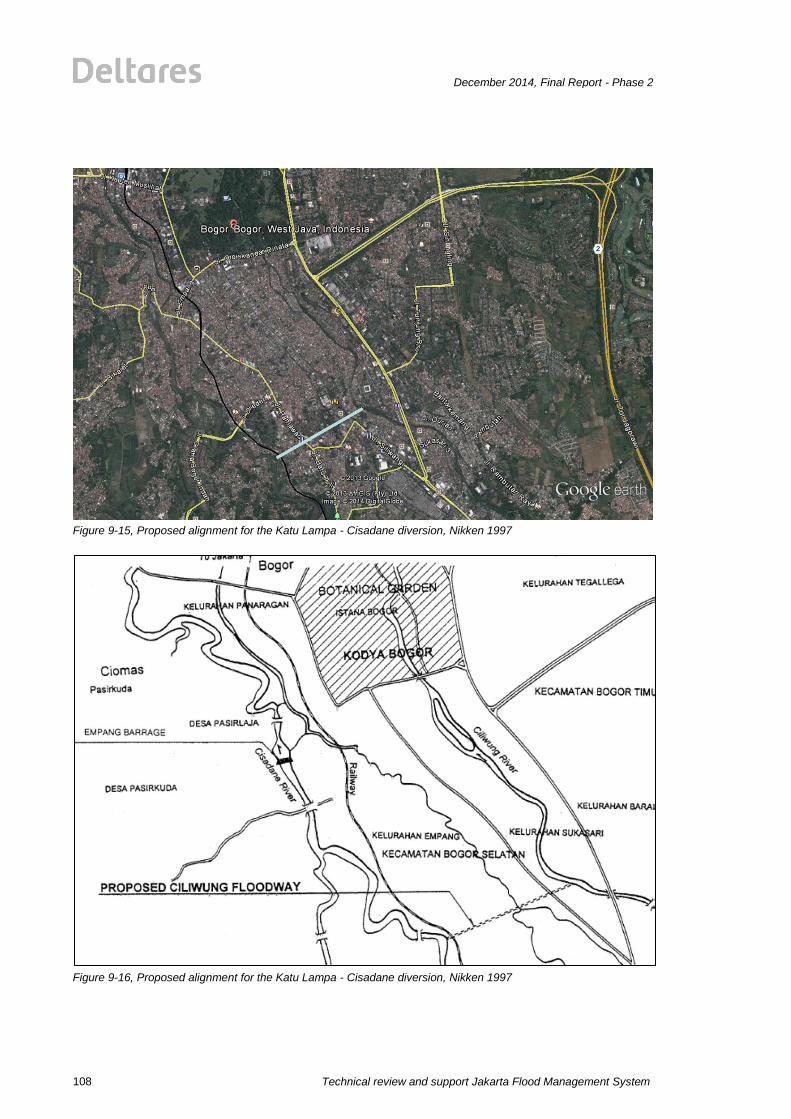
Technical review and support Jakarta Flood Management System
December 2014, Final Report - Phase 2
108
Figure 9-15, Proposed alignment for the Katu Lampa - Cisadane diversion, Nikken 1997
Figure 9-16, Proposed alignment for the Katu Lampa - Cisadane diversion, Nikken 1997

December 2014, Final Report - Phase 2
Technical review and support Jakarta Flood Management System
109
Figure 9-17, Proposed alignment for the Katu Lampa - Cisadane diversion, Nikken 1997
Figure 9-18, Proposed Inlet for the Katu Lampa - Cisadane diversion, Nikken 1997
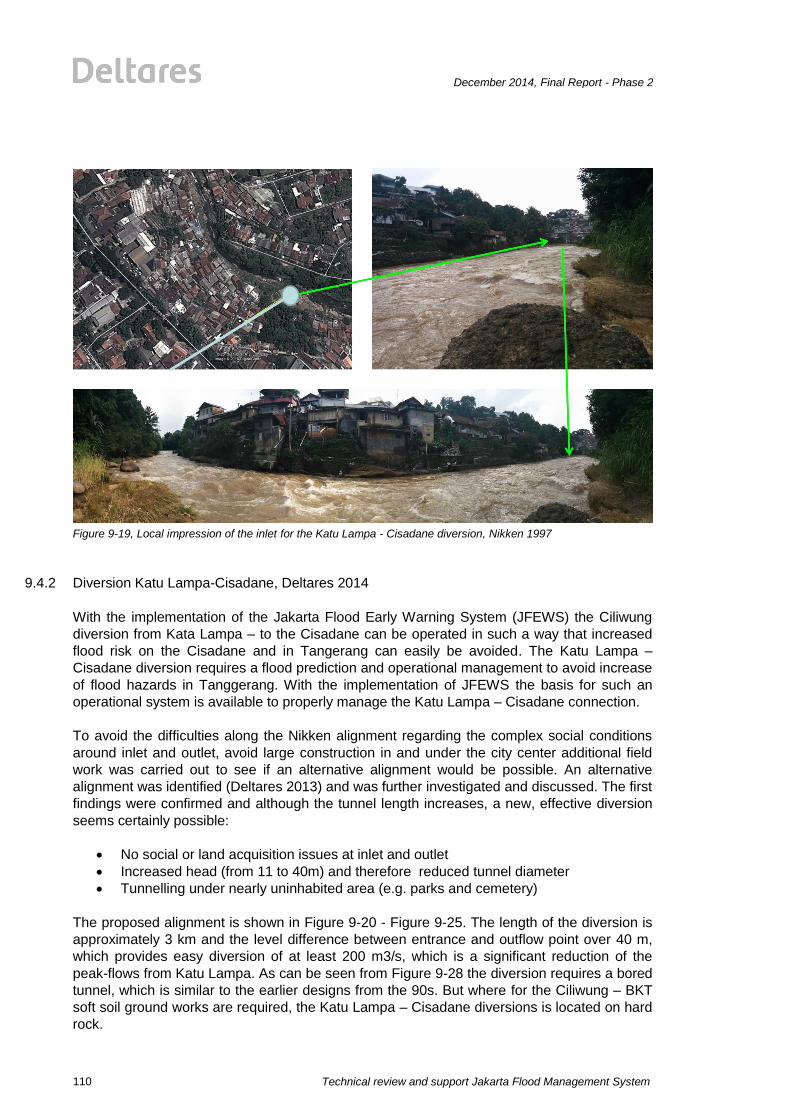
Technical review and support Jakarta Flood Management System
December 2014, Final Report - Phase 2
110
Figure 9-19, Local impression of the inlet for the Katu Lampa - Cisadane diversion, Nikken 1997
9.4.2 Diversion Katu Lampa-Cisadane, Deltares 2014
With the implementation of the Jakarta Flood Early Warning System (JFEWS) the Ciliwung
diversion from Kata Lampa – to the Cisadane can be operated in such a way that increased
flood risk on the Cisadane and in Tangerang can easily be avoided. The Katu Lampa –
Cisadane diversion requires a flood prediction and operational management to avoid increase
of flood hazards in Tanggerang. With the implementation of JFEWS the basis for such an
operational system is available to properly manage the Katu Lampa – Cisadane connection.
To avoid the difficulties along the Nikken alignment regarding the complex social conditions
around inlet and outlet, avoid large construction in and under the city center additional field
work was carried out to see if an alternative alignment would be possible. An alternative
alignment was identified (Deltares 2013) and was further investigated and discussed. The first
findings were confirmed and although the tunnel length increases, a new, effective diversion
seems certainly possible:
No social or land acquisition issues at inlet and outlet
Increased head (from 11 to 40m) and therefore reduced tunnel diameter
Tunnelling under nearly uninhabited area (e.g. parks and cemetery)
The proposed alignment is shown in Figure 9-20 - Figure 9-25. The length of the diversion is
approximately 3 km and the level difference between entrance and outflow point over 40 m,
which provides easy diversion of at least 200 m3/s, which is a significant reduction of the
peak-flows from Katu Lampa. As can be seen from Figure 9-28 the diversion requires a bored
tunnel, which is similar to the earlier designs from the 90s. But where for the Ciliwung – BKT
soft soil ground works are required, the Katu Lampa – Cisadane diversions is located on hard
rock.

December 2014, Final Report - Phase 2
Technical review and support Jakarta Flood Management System
111
Figure 9-20, Proposed alignment for the Katu Lampa - Cisadane diversion, Deltares 2014
Figure 9-21, Proposed entrance for the Katu Lampa - Cisadane diversion

Technical review and support Jakarta Flood Management System
December 2014, Final Report - Phase 2
112
Figure 9-22, Local impression Katu Lampa weir downstream
Figure 9-23, Local impression proposed entrance location A for the Katu Lampa - Cisadane diversion

December 2014, Final Report - Phase 2
Technical review and support Jakarta Flood Management System
113
Figure 9-24, Local impression proposed entrance location B for the Katu Lampa - Cisadane diversion
Figure 9-25, Proposed outflow point for the Katu Lampa - Cisadane diversion
Outflow
Cisadane
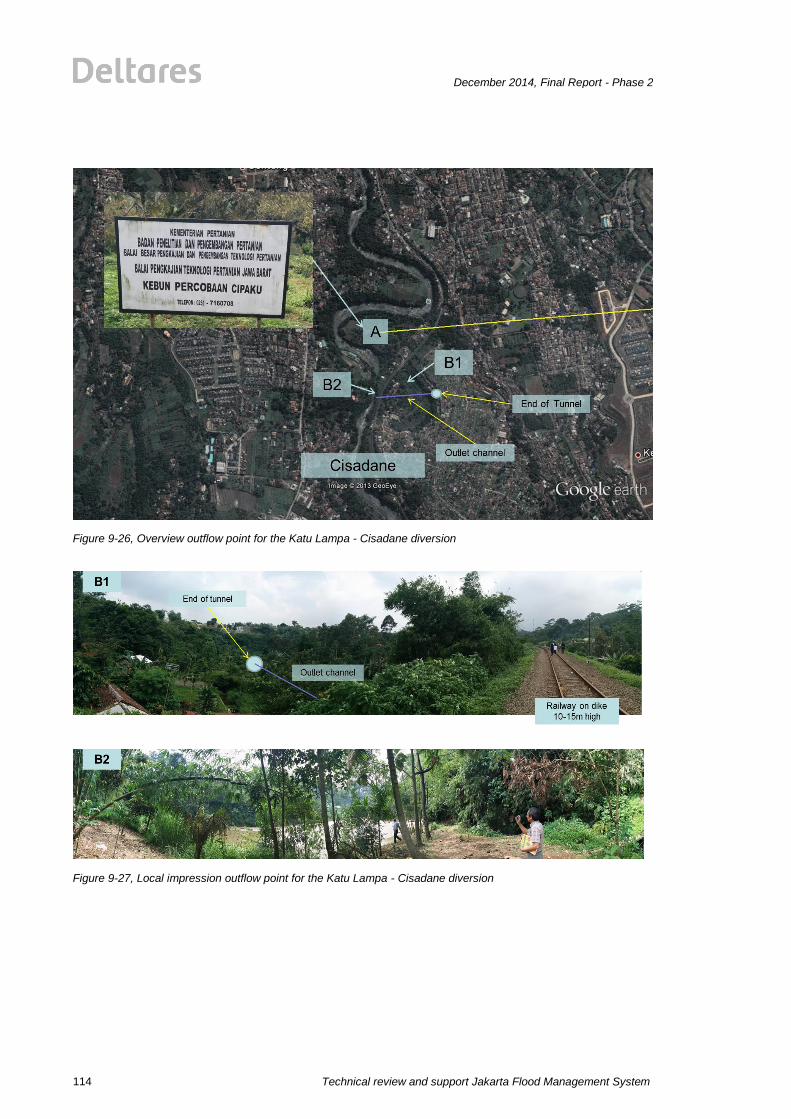
Technical review and support Jakarta Flood Management System
December 2014, Final Report - Phase 2
114
Figure 9-26, Overview outflow point for the Katu Lampa - Cisadane diversion
Figure 9-27, Local impression outflow point for the Katu Lampa - Cisadane diversion
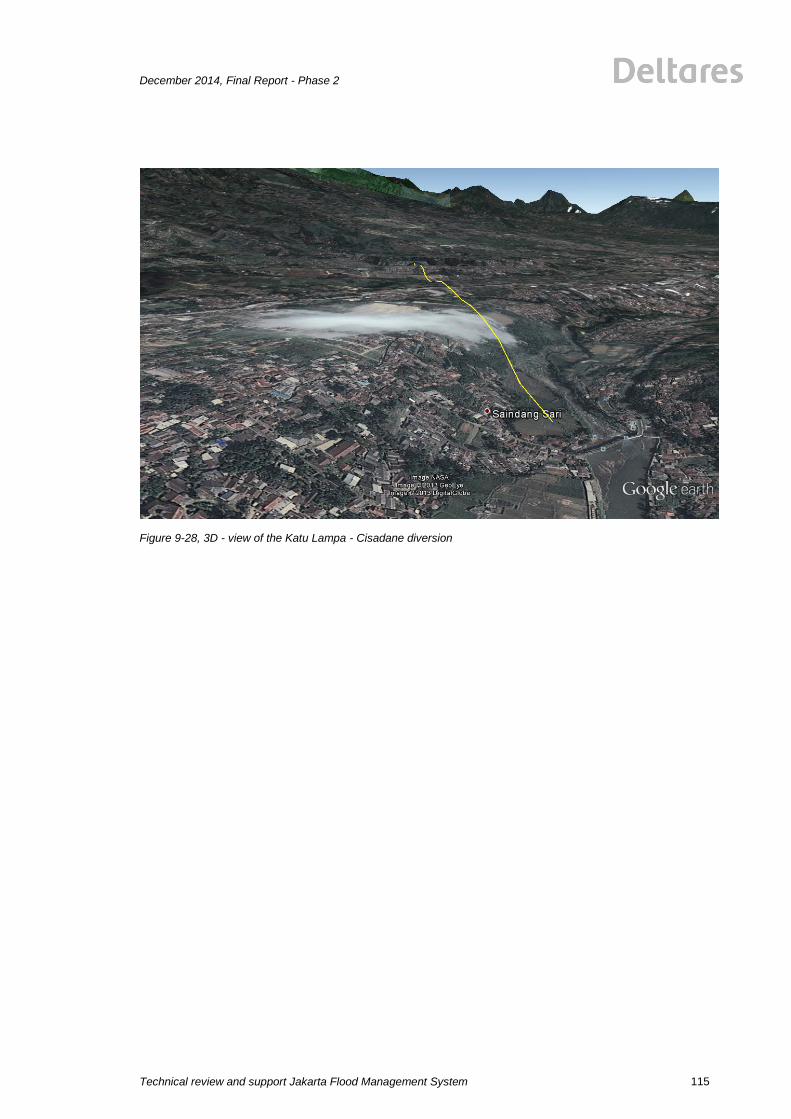
December 2014, Final Report - Phase 2
Technical review and support Jakarta Flood Management System
115
Figure 9-28, 3D - view of the Katu Lampa - Cisadane diversion

Technical review and support Jakarta Flood Management System
December 2014, Final Report - Phase 2
116
10 Extension of the Jakarta FHM modelling framework
Together with the Ciliwung-Cisadane diversion, also a maintenance/rehabilitation program is
proposed for the Cisadane river, to allow for the possible increased flow and also to restore
the design capacity (2000 m3/s) of the Cisadane and especially the Pasar Baru weir. Hereto,
the Cisadane is to be analysed for flood mitigation and operational purposes. Therefore it is
proposed to extent the Jakarta FHM framework with a hydrological\hydraulic model of the
Cisadane (see Figure 10-4). The following paragraphs first describe the development and
content of the Jakarta FHM modelling framework, followed by the approach to add the
Cisadane and Bekasi rivers.
10.1 History of Jakarta FHM modelling framework 2007 – 2013
After the severe floods of February 2007, as part of the non-structural Dutch Assistance
Jakarta Flood Management initiative (DA JFM), a new successful approach to assist Jakarta
in understanding and counteracting the floods was introduced. An important part of the
approach was developed through the "Flood Hazard Mapping (FHM)" projects (2007-2009)
During the three consecutive FHM projects a unique FHM modelling framework was
developed and further updated including the 13 crossing rivers and the complete major
drainage system of Jakarta.
The developed GIS based FHM modelling framework starts in the upper Panggrango - Gede
area and runs to the northern coastal area of Jakarta. It includes complete hydrology, land-
use, major river and drainage system and is capable to simulate floods in the complete DKI
area. During the Situ Situ Safety Inspection (S3I) study (2009), the FHM modelling framework
was further expanded to include all major Situ Situ upstream and in Jakarta. The FHM
modelling framework was further used and updated during the Jakarta Flood Readiness Scan
(JFRS) in 2011, the Flood Management Information System (FMIS) in 2012 and during the
evaluation of the January 2013 floods. As the FHM modelling framework was setup for use as
part of an online monitoring / flood early warning system (FEWS), the FHM modelling
framework was connected to the Jakarta Flood Early Warning System (JFEWS) during the
Joint Cooperation Program (JCP 2011-2012). In the FMIS project JFEWS was further
enhanced and implemented at the flood operation and disaster centres in Jakarta.
Many different parts of the Jakarta have been analysed and evaluated with the FHM
modelling framework since 2007. An overview of the projects and related reports is presented
in Table 10-1 in which the Jakarta FHM modelling framework was developed, maintained,
updated and extended.
Table 10-1, Overview of FHM and Hydraulic activities in Jakarta 2007 - 2013
Jakarta - FHM and Hydraulic Activities 2007 - 2013
Project Report nr
Project Title Relevant Report Title
FHM1
Flood Hazard Mapping 1 (2007)
1 Overview 16122007.pdf
2 Main Report 151207.pdf
3 Flood extent and Bottlenecks 151207.pdf

December 2014, Final Report - Phase 2
Technical review and support Jakarta Flood Management System
117
Jakarta - FHM and Hydraulic Activities 2007 - 2013
Project Report nr
Project Title Relevant Report Title
4 Hydraulics 151207.pdf
5 Hydrology and Sea Water Levels 15122007.pdf
6 Annex A, Sea Water Levels 15122007.pdf
7 Annex B, Discharge Measuring Stations 15122007.pdf
FHM2
Flood Hazard Mapping 2 (2008)
1 Overview 230309.pdf
2 FHM modelling framework 230309.pdf
3 HU database and FEMapping 230309.pdf
4 Jakarta Flood Early Warning System, Main 230309.pdf
5 Jakarta Flood Early Warning System, Appendix A 230309.pdf
6 Jakarta Flood Early Warning System, Appendix B 230309.pdf
7 Jakarta Flood Early Warning System, Appendix C 230309.pdf
FHM3
Flood Hazard Mapping 3 (2009)
1 01 Final Report.pdf
2 03 Evaluation Dredging in Jakarta.pdf
3 06 Evaluation Training Planning Unit with FHM Model.pdf
4 07 Long Term Rehabilitation & Maintenance Program.pdf
5 08 Inventory of Urban Drainage Systems in Pademangan Barat and Thamrin Monas.pdf
6 09 Performance Analysis Drainage System Sub catchment Jalan Thamrin Jakarta.pdf
7 10 Analysis Capacity Drainage System Pademangan Barat.pdf
8 14 GPS Based Flood Extent Mapping.pdf
S3I
Situ Situ Safety Inspection (2009)
1 Field inspection and investigation 270709.pdf
2 Safety inspection manual 270709.pdf
3 Short-term Action Plan 240709.pdf
4 Soil Investigation 270709.pdf
JFRS
Jakarta Flood Readiness Scan (2011 - 2012)
1 Jakarta Disaster Preparation December 2011.pdf
FMIS
Flood Management Information System (2012)
1 FMIS Main report 10022013.pdf
2 FMIS Annex A, FHM framework and measures 10022013.pdf
3 FMIS Annex B, Hydro-meteorological monitoring network Jakarta 10022013.pdf
4 FMIS Annex C, FMIS institutional framework 10022013.pdf
EA2013 FHM - Emergency Assistance Floods January 2013 (2013)
Technical review and support Jakarta Flood Management System
December 2014, Final Report - Phase 2
118
Jakarta - FHM and Hydraulic Activities 2007 - 2013
Project Report nr
Project Title Relevant Report Title
1 Jakarta Floods January 2013 - Emergency assistance - April 2013.pdf
10.2 The Jakarta SOBEK modelling system
SOBEK is the main hydrologic and hydraulic modelling software used for analyzing the
propagation of water through the Ciliwung catchment. It consists of modules that can be used
separately or combined. The available Sobek-modules cover a wide range of processes, from
rainfall-runoff, to 1D/2D hydrodynamics, to water quality processes and emissions. SOBEK is
developed in close co-operation with several organizations in the water sector, based on a
long history of developments of flow modelling in systems.
The first release, SOBEK-RE, was launched in the early nineties. Next, SOBEK-Urban was
developed as a tool for integral studies of the effects of precipitation and waste water
management in urban areas. Subsequently, SOBEK-Rural was developed for drainage and
irrigation studies in low lying areas and the associated water management. Finally, SOBEK-
RIVER was launched a few years ago, focusing entirely on the modelling of river systems.
Both the 1D- and 2D flow modules solve the full set of the de Saint-Venant equations. This
makes SOBEK ideally suited for difficult-to-model systems, as it can handle flow conditions
that other packages cannot: super-critical flow, transition from super- to sub-critical flow
(hydraulic jumps), and both wetting and drying of grid-cells. It comes equipped with a variety
of boundary conditions, wind effects, hydraulic structure descriptions, lateral flows and cross-
section descriptions.
10.3 The Jakarta FHM- modelling framework
10.3.1 Overview
In the Jakarta FHM modelling framework the following three SOBEK modules are used:
1. The hydrological rainfall runoff module (RR) that simulates the transformation of rainfall
to runoff for each river catchment, and thus computes the inflows into the one
dimensional hydraulic river module.
2. The one-dimensional hydraulic module (1D) that simulates the one-dimensional flow
(water levels and discharges) though the main rivers and the main drainage system.
3. The 2-dimensional hydraulic module (2D) that simulates the inundation pattern over the
project area from the locations where the one dimensional water courses are
overtopped. The results from this module are used to construct the flood hazard maps.

December 2014, Final Report - Phase 2
Technical review and support Jakarta Flood Management System
119
Figure 10-1 Overview of used Sobek Modules
10.3.2 The rainfall-runoff model
The rainfall-runoff model provides the 1D-flow model with runoff from the sub-catchments
using the following steps:
Step one simulates runoff from +/- 450 sub-catchments
(see Figure 10-2), based on rainfall data and sub-
catchment characteristics. The well-known Sacramento
model concept has been used for this purpose. The
Sacramento model can be used for both event-based and
year-round continuous simulations. For each sub-
catchment, main characteristics as surface area, land use,
slope, flow path length have been determined.
The second step in the modelling process is to connect the
computed runoff from the various sub-catchments to the 1D
river schematisation. For the upstream small rivers which
are not modelled in the 1D river model, the computed
runoff is routed in SOBEK-RR using the Muskingum
method to the outlet points of the catchments. At the outlet
1) simulation of runoff
using Sacramento
model (SOBEK-RR)
2) Hydrologic routing of
runoff towards main river
system using Muskingum
method (SOBEK-RR)
3) Hydraulic routing
through river
system towards sea
(SOBEK-1D)
Technical review and support Jakarta Flood Management System
December 2014, Final Report - Phase 2
120
points of the catchments, the computed runoff enters the 1D-river model as a lateral
discharge. From there onwards, the water is routed through the river system using the
hydraulic SOBEK-1D flow module.
The rainfall-runoff model has been calibrated during the JFM1 and JFM2 projects (Deltares,
2007-2009). During the FMIS project (Deltares, 2012), the parameters of the Sacramento
model have been adjusted for land-use changes in the Jabotabek area.
Figure 10-2 Sub-catchments in the Jakarta basin
10.3.3 The 1D-2D Flow schematization
Figure B.11-10 shows the hydraulic model of the drainage system as it was developed for the
Flood Management Information System (FMIS) December 2012. It contains all major rivers
and channels in the Jakarta area. Some aspects worth mentioning are:
• The 1D model consists of nodes and branches. The branches follow the alignment of
the drainage system. The nodes are objects that are placed on top of the branches.
They can represent for example surveyed cross-sections or structures (weirs, gates,
etc.).
• The hydraulic model simulates water levels/depths and discharges/velocities at grid
points. These grid points are defined by the computational grid. In the 1D model, the
user can manually specify the average distance between successive grid points. In the
2D model, this distance is set by the size of the grid elements.
• The 2D model consists of a rectangular DEM grid cells. The elevation in every grid cell
represents the average surface-level. The Jakarta model consists of two overlapping
grids: one with 100x100m grid cells, representing the entire flood-prone area, and one
nested grid with 50x50m cells, representing part of the Ciliwung River upstream of
Manggarai gate.
• SOBEK automatically connects the 1D and 2D grid points. This way, water will start to
flow from the 1D to the 2D domain as soon as the water level overtops the
embankments. Reverse flow is also possible: when 2D overland flow reaches a drain
modelled in 1D, it will enter that drain if the water level exceeds the embankment.
• The 1D model includes cross-sections, defining the river geometry. The data from these
cross-sections comes from a large number of different sources, using different survey
methods. Cross-sections are the most important data for 1D models, as they determine
the conveyance capacity of the system.
• Along the main river several large structures are used to regulate water during low and
peak flow conditions (e.g. Manggarai and Karet gate at the Banjir Kanal Barat). Most of
these structures are incorporated in the modelling framework.

December 2014, Final Report - Phase 2
Technical review and support Jakarta Flood Management System
121
• Most of the low-lying areas in Jakarta cannot drain into the sea by gravity as a result of
the continuous subsidence caused by compacting of the soils because of deep
groundwater abstractions. These low-lying areas usually drain into reservoirs (waduks),
from where the water is pumped to the main river system. Waduks and pumps are
included in the model.
• The combined schematization
was calibrated for the
January/February 2007 flood
event, and validated for the
January/February 2008 flood
event in the FHM1 and FHM2
studies (Deltares, 2007-2009).
• After the FHM1 and FHM2
studies the Banjir Kanal Timur
(BKT) was included in the
schematization for the Java
Flood Insurance studies
(Deltares, 2011), being the
flood mitigating measure with
the largest impact on the flood
patterns in the east of Jakarta.
• During the FMIS project
(Deltares, 2012), the major part
of the FHM framework has
been updated (as far as
possible) to the system state of
2012.
Figure 10-3 - Overview the FMIS hydraulic 1D & 2D flow model
10.4 Extension with Cisadane and Bekasi river systems
10.4.1 First overview of the Cisadane and surrounding catchment

Technical review and support Jakarta Flood Management System
December 2014, Final Report - Phase 2
122
Figure 10-4 Ciliwung-Cisadane diversion
Pasar Baru
Batu Beula
Diversion
December 2014, Final Report - Phase 2
Technical review and support Jakarta Flood Management System
123
10.5.1 Model setup
10.5.1.1 Hydrological model
It is proposed to develop a WFLOW-SBM hydrological model, which can be calibrated on the
discharge series of Batu Beula and Pasar Baru. For parameterization, WFLOW requires a:
- DEM, to be derived from SRTM (open data)
- Landuse, to be optained from BIG or open data
- Soil type, to be optained via FAO or Indonesian sources
WFLOW-SBM will provide discharge to be used in hydrological simulations of the Cisadane
river.
10.5.1.2 Hydraulic model
It is proposed to extent the Sobek 1D (possibly 2D) hydraulic model to the Cisadane river. For
that 1D geometry is required downstream of the Ciliwung-Cisadane diversion until the Java
sea. This geometry, together with the geometry of Pasar Baru gate should be projected in the
same X,Y,Z coordinate system as the FHM framework. Currently, TM3 zone 48.2 is used as
XY projection. As Z datum, the PP (peil priok) value of Pasar Rabo (BMPP60) is used.
10.5.2 Model calibration
The meteorological model requires meteorological data as boundary condition. These data
can sub-subsequently be derived from:
- AWS and manual rainfall gauges from BBWSCC and BMKG
- BMKG radar
- TRMM rainfall satellite
Most accurate rainfall products can be obtained by a combination of radar and rainfall
gauges, where gauged data is assimilated with radar to get the most accurate spatial-
temporal representation of rainfall events.
10.5.2.1 Batu Beula
Batu Beula can be used as an upstream calibration and validation location for the
hydrological and hydraulic model. PusAir (yearbook, 2009) published a discharge series for
Batu Beula found in Figure 10-4. For this year book water level recordings at the gauge was
converted to discharge using the rating curve:
Q=19.652(h+0.939)2.152
For this study we require the original water level (h) from BBWSCC and data from which the
rating curve is derived. Also, some extreme peaks and suspicious trends after 1985 should be
clarified. Preferably, the water level should also be referenced to the pp value of BMPP60 to
align with the FHM framework.

Technical review and support Jakarta Flood Management System
December 2014, Final Report - Phase 2
124
Figure 10-5 Batu Beula discharge series
10.5.2.2 Pasar Baru
This location (see Figure 10-6) should be used to calibrate the downstream part of the
hydrological-hydraulic model. At Pasar Baru reports are available with water level recordings
(upstream and downstream) and gate operations. These reports contain weir formula to
convert these water levels to discharges under gate operations. All these data should be
digitized to produce a series of water levels and discharges.
An automatic water level recorder (AWLR) is available from BBWSCC (see left side of Figure
10-6). These data should be obtained from BBWSCC together with its rating curve if
available. The crest level of the gate and staff gauges should be referenced to the pp value of
BMPP60.
Figure 10-6 Pasar Baru
Suspicious trends

December 2014, Final Report - Phase 2
Technical review and support Jakarta Flood Management System
125
10.5.3 First overview of the Bekasi and surrounding catchment
The Kali Bekasi is the first river on the East-side of the Ciliwung. For flood mitigation
purposes, it is proposed to extent the FHM framework including this river. By this, the
effectiveness of flood mitigation measures can be analysed. It is also possible to setup an
operational system dedicated to Bekasi flood operation.
Figure 10.7 Jakarta FHM modelling framework and the Bekasi
Pondok Mitra Lestari
Kali Bekasi
K. Bekasi
K. Cikeas
Bendung Bekasi
Technical review and support Jakarta Flood Management System
December 2014, Final Report - Phase 2
126
10.5.4 Model setup
10.5.4.1 Hydrological model
It is proposed to develop a WFLOW-SBM hydrological model, which can be calibrated at
Bendung Bekasi and Pondok Mitra Lestari. For parameterization, WFLOW requires a:
- DEM, to be derived from SRTM (open data)
- Landuse, to be optained from BIG or open data
- Soil type, to be optained via FAO or Indonesian sources
WFLOW-SBM will provide discharge to be used in hydrological simulations of the Bekasi river
catchment.
10.5.4.2 Hydraulic model
It is proposed to extent the Sobek 1D (possibly 2D) hydraulic model to the Bekasi river. For
that 1D geometries are required for all areas where floods should be analysed. This
geometry, together with the geometry of Pasar Baru gate should be projected in the same
X,Y,Z coordinate system as the FHM framework. Currently, TM3 zone 48.2 is used as XY
projection. As Z datum, the PP (peil priok) value of Pasar Rabo (BMPP60) is used.
10.5.5 Model calibration
The meteorological model requires meteorological data as boundary condition. These data
can sub-subsequently be derived from:
- AWS and manual rainfall gauges from BBWSCC and BMKG
- BMKG radar
- TRMM rainfall satellite
Most accurate rainfall products can be obtained by a combination of radar and rainfall
gauges, where gauged data is assimilated with radar to get the most accurate spatial-
temporal representation of rainfall events.
10.5.5.1 Pondok Mitra Lestari
This gauge is under authority of the province. It is not clear if it is automatic or a manual
gauge. It is downstream so most likely under tidal influence
10.5.5.2 Bendung Bekasi
This AWLR is under authority of BBWSCC, placed upstream a weir near upstream the West
Tarum Canal. From the 6Cis project a discharge series is available from 1972 to 1985.
Probably this series can be extended. Currently the AWLR is offline. The discharge series is
converted from water level to discharge using a rating curve, which needs to be obtained.
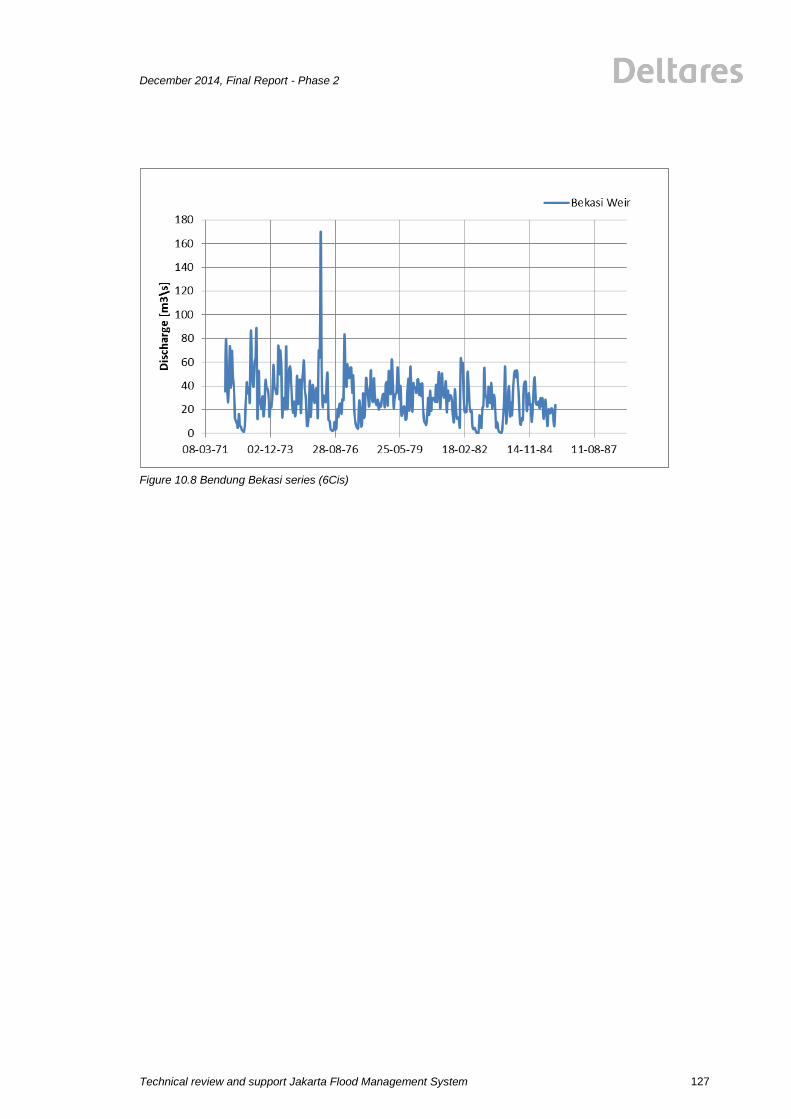
December 2014, Final Report - Phase 2
Technical review and support Jakarta Flood Management System
127
Figure 10.8 Bendung Bekasi series (6Cis)
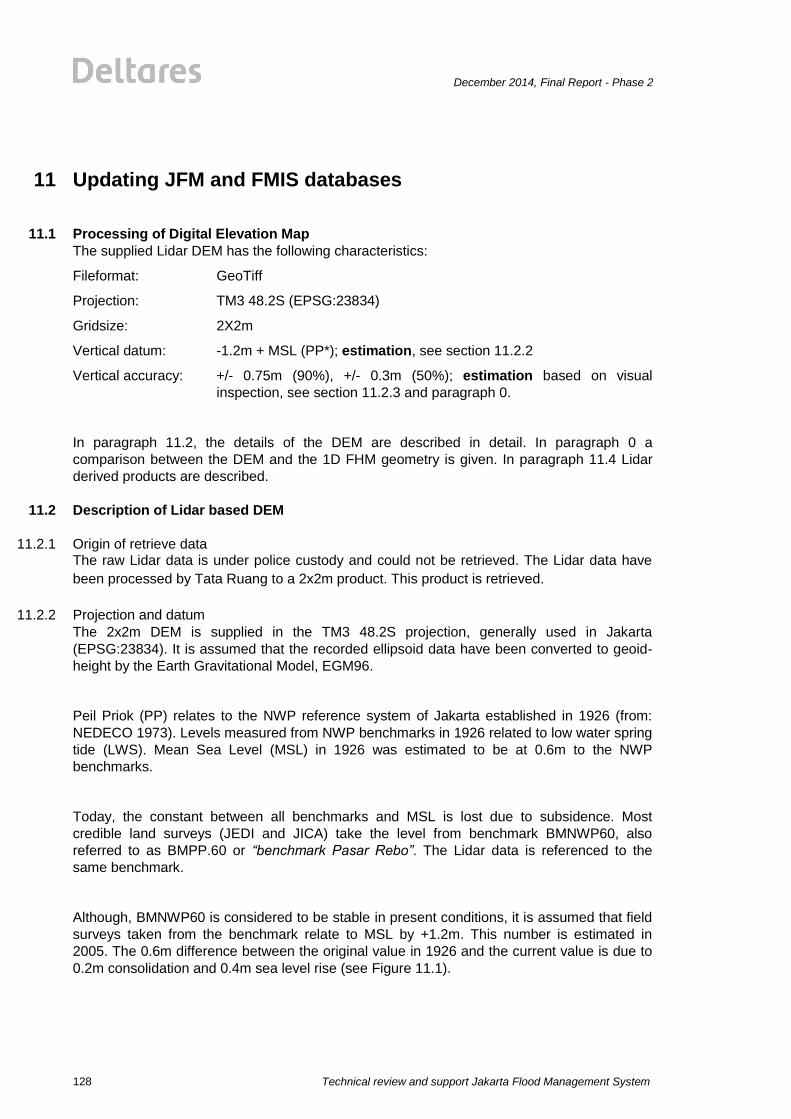
Technical review and support Jakarta Flood Management System
December 2014, Final Report - Phase 2
128
11 Updating JFM and FMIS databases
11.1 Processing of Digital Elevation Map
The supplied Lidar DEM has the following characteristics:
Fileformat: GeoTiff
Projection: TM3 48.2S (EPSG:23834)
Gridsize: 2X2m
Vertical datum: -1.2m + MSL (PP*); estimation, see section 11.2.2
Vertical accuracy: +/- 0.75m (90%), +/- 0.3m (50%); estimation based on visual
inspection, see section 11.2.3 and paragraph 0.
In paragraph 11.2, the details of the DEM are described in detail. In paragraph 0 a
comparison between the DEM and the 1D FHM geometry is given. In paragraph 11.4 Lidar
derived products are described.
11.2 Description of Lidar based DEM
11.2.1 Origin of retrieve data The raw Lidar data is under police custody and could not be retrieved. The Lidar data have
been processed by Tata Ruang to a 2x2m product. This product is retrieved.
11.2.2 Projection and datum
The 2x2m DEM is supplied in the TM3 48.2S projection, generally used in Jakarta
(EPSG:23834). It is assumed that the recorded ellipsoid data have been converted to geoid-
height by the Earth Gravitational Model, EGM96.
Peil Priok (PP) relates to the NWP reference system of Jakarta established in 1926 (from:
NEDECO 1973). Levels measured from NWP benchmarks in 1926 related to low water spring
tide (LWS). Mean Sea Level (MSL) in 1926 was estimated to be at 0.6m to the NWP
benchmarks.
Today, the constant between all benchmarks and MSL is lost due to subsidence. Most
credible land surveys (JEDI and JICA) take the level from benchmark BMNWP60, also
referred to as BMPP.60 or “benchmark Pasar Rebo”. The Lidar data is referenced to the
same benchmark.
Although, BMNWP60 is considered to be stable in present conditions, it is assumed that field
surveys taken from the benchmark relate to MSL by +1.2m. This number is estimated in
2005. The 0.6m difference between the original value in 1926 and the current value is due to
0.2m consolidation and 0.4m sea level rise (see Figure 11.1).
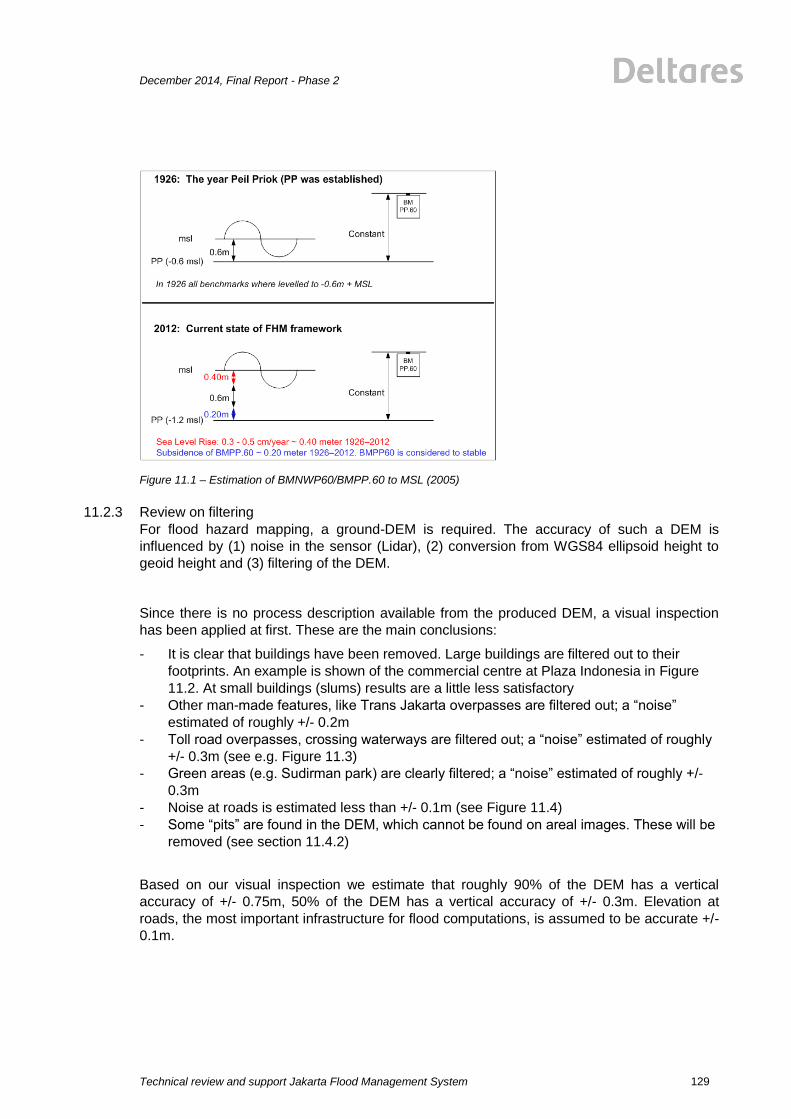
December 2014, Final Report - Phase 2
Technical review and support Jakarta Flood Management System
129
Figure 11.1 – Estimation of BMNWP60/BMPP.60 to MSL (2005)
11.2.3 Review on filtering
For flood hazard mapping, a ground-DEM is required. The accuracy of such a DEM is
influenced by (1) noise in the sensor (Lidar), (2) conversion from WGS84 ellipsoid height to
geoid height and (3) filtering of the DEM.
Since there is no process description available from the produced DEM, a visual inspection
has been applied at first. These are the main conclusions:
- It is clear that buildings have been removed. Large buildings are filtered out to their
footprints. An example is shown of the commercial centre at Plaza Indonesia in Figure
11.2. At small buildings (slums) results are a little less satisfactory
- Other man-made features, like Trans Jakarta overpasses are filtered out; a “noise”
estimated of roughly +/- 0.2m
- Toll road overpasses, crossing waterways are filtered out; a “noise” estimated of roughly
+/- 0.3m (see e.g. Figure 11.3)
- Green areas (e.g. Sudirman park) are clearly filtered; a “noise” estimated of roughly +/-
0.3m
- Noise at roads is estimated less than +/- 0.1m (see Figure 11.4)
- Some “pits” are found in the DEM, which cannot be found on areal images. These will be
removed (see section 11.4.2)
Based on our visual inspection we estimate that roughly 90% of the DEM has a vertical
accuracy of +/- 0.75m, 50% of the DEM has a vertical accuracy of +/- 0.3m. Elevation at
roads, the most important infrastructure for flood computations, is assumed to be accurate +/-
0.1m.
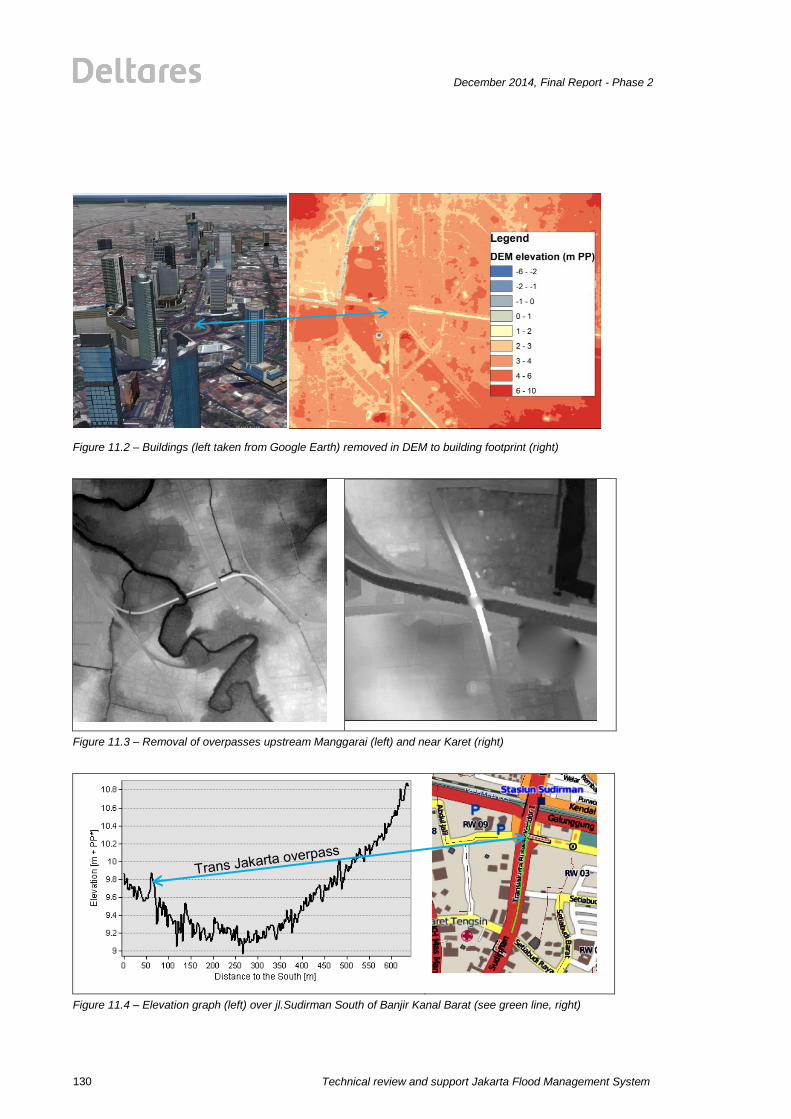
Technical review and support Jakarta Flood Management System
December 2014, Final Report - Phase 2
130
Figure 11.2 – Buildings (left taken from Google Earth) removed in DEM to building footprint (right)
Figure 11.3 – Removal of overpasses upstream Manggarai (left) and near Karet (right)
Figure 11.4 – Elevation graph (left) over jl.Sudirman South of Banjir Kanal Barat (see green line, right)
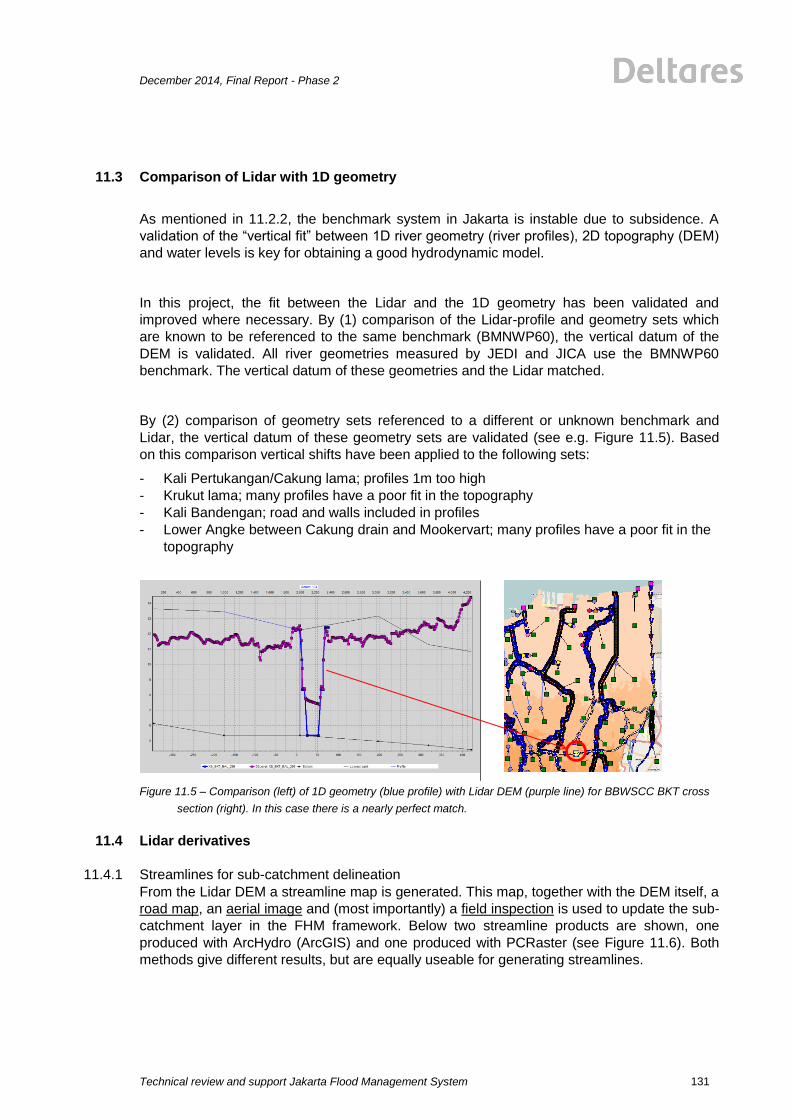
December 2014, Final Report - Phase 2
Technical review and support Jakarta Flood Management System
131
11.3 Comparison of Lidar with 1D geometry
As mentioned in 11.2.2, the benchmark system in Jakarta is instable due to subsidence. A
validation of the “vertical fit” between 1D river geometry (river profiles), 2D topography (DEM)
and water levels is key for obtaining a good hydrodynamic model.
In this project, the fit between the Lidar and the 1D geometry has been validated and
improved where necessary. By (1) comparison of the Lidar-profile and geometry sets which
are known to be referenced to the same benchmark (BMNWP60), the vertical datum of the
DEM is validated. All river geometries measured by JEDI and JICA use the BMNWP60
benchmark. The vertical datum of these geometries and the Lidar matched.
By (2) comparison of geometry sets referenced to a different or unknown benchmark and
Lidar, the vertical datum of these geometry sets are validated (see e.g. Figure 11.5). Based
on this comparison vertical shifts have been applied to the following sets:
- Kali Pertukangan/Cakung lama; profiles 1m too high
- Krukut lama; many profiles have a poor fit in the topography
- Kali Bandengan; road and walls included in profiles
- Lower Angke between Cakung drain and Mookervart; many profiles have a poor fit in the
topography
Figure 11.5 – Comparison (left) of 1D geometry (blue profile) with Lidar DEM (purple line) for BBWSCC BKT cross
section (right). In this case there is a nearly perfect match.
11.4 Lidar derivatives
11.4.1 Streamlines for sub-catchment delineation
From the Lidar DEM a streamline map is generated. This map, together with the DEM itself, a
road map, an aerial image and (most importantly) a field inspection is used to update the sub-
catchment layer in the FHM framework. Below two streamline products are shown, one
produced with ArcHydro (ArcGIS) and one produced with PCRaster (see Figure 11.6). Both
methods give different results, but are equally useable for generating streamlines.

Technical review and support Jakarta Flood Management System
December 2014, Final Report - Phase 2
132
Figure 11.6 – Streamline maps derived with ArcHydro (left) and PCRaster (right)
11.4.2 Updating the FHM framework databases
In the FHM framework a 1D hydraulic model is coupled to a 2D overland flow model. The 2D
model uses a 100m resolution DEM, with a more detailed 50m DEM around the Ciliwung, an
area of interest. With this setup it is not only important that the overland flow model DEM is
accurate, but also that it connects well to the profile elevations in the 1D hydraulic model. A
number of steps have been taken to arrive at the 2D model DEM based on the 2m Lidar
DEM.
1. Removal of errors in 2m DEM
o At locations where clear errors or undesired features are seen, they are marked
with polygons. The elevation inside these polygons is then corrected to a suitable
environmental value. An example of such a correction is a deep construction pit.
These deep features would affect the coarser aggregated DEM, as it would have
a large effect on the average elevation. However they are of a temporary nature
and do not represent the surface elevation, thus they are removed.
2. Aggregating 2m DEM to 50/100m based on average values
o The corrected 2m DEM from the previous step is used as the basis of the
aggregation. Since the 2m DEM is already filtered, the aggregation is based on
the average of the smaller cells inside the coarser cells. This step yields two DEM
files of the extent and resolution necessary for the model. However testing made
it apparent that further adaptation of both the DEM and the 1D hydraulic model is
necessary to take full advantage of the availability of the Lidar DEM for the FHM
framework.
3. Elevating 100m DEM at reaches to maximum of current value and 2.1m +PP* (coastal
flood level) and lowest embankment in 1D geometry.
o Water is exchanged between the 1D and 2D model at nodes, situated along
reaches. Special care must be taken to ensure the DEM elevation at these
exchange points is reasonable. It was found that in some canals near the sea the
100m DEM had values below the coastal flood level. Whether this is an
aggregation artefact or due to the DEM only measuring water level, a reasonable
minimum DEM elevation at these points is the coastal flood level. Therefore these
points were elevated. At locations where reliable lowest embankment levels are
known from nearby cross sections, and the DEM gave elevations below these
levels, the DEM was also elevated to these lowest embankment levels. The
magnitude and location of the changes in the elevation are illustrated in Figure
11.7.

December 2014, Final Report - Phase 2
Technical review and support Jakarta Flood Management System
133
Figure 11.7 – Resulting elevation difference from step 3 in 11.4.2

Technical review and support Jakarta Flood Management System
December 2014, Final Report - Phase 2
134
A Appendix A - Methodology
A.1 Introduction
This chapter describes the methodology used in Jakarta Flood Overview (JFO) to analyse
and design the pumping systems of the polders in northern Jakarta to handle local rainfall. In
analysis, the following components are used
Hydrology: design rainfall is translated to runoff serving as a boundary condition for
analysis
Water levels: frequently used reference levels are related and typical boundary
conditions for Jakarta Bay are derived
Water Balance: first estimates of sensible pump-schemes can be made by a water
balance: of storage and pump-capacity are derived by making a water balance
Hydraulics: improvements, using the FHM framework (Sobek).
A.2 Hydrology
A.2.1 General
For the hydrology the following steps are taken:
1. First, the design rainfall amounts used for analysis have to be determined. For that, a
comparison of NEDECO (1973), FHM (2007), S3I and FMIS is made.
2. Design rainfall has to be averaged over the catchment using Areal Reduction Factors
3. Average catchment rainfall has to be transformed to catchment runoff, which is the input
used for the design of pump capacity and storage.
A.2.2 Design rainfall
The hydrology used for designing the pumping schemes is based on the hydrology used in NEDECO, FHM, S3I
and FMIS. The station design rainfall with various duration and return periods is given in Table A 1 - Daily
and 24-hour rainfall according to different studies
. For the conversion between daily rainfall and 24 hour rainfall a factor of 1.12 is applied
(NEDECO, 1973).
T (years) Daily rainfall
24 hour rainfall NEDECO [1973] JICA [1996] FHM [2007]
2 100 98 108 111-122
10 159
25 189 192 184 208-217
50 212
100 234 238 231 261-269
Table A 1 - Daily and 24-hour rainfall according to different studies
From all studies, NEDECO 1973 still had the most comprehensive database of hourly and
daily rainfall. To derive rainfall-mass curves (see Figure A 1), 34 stations where available with
10 years of validated rainfall. It seems NEDECO is conservative, regarding the 24 hour
rainfall estimates (265 mm at T100 return period). When comparing the FHM mass-curve
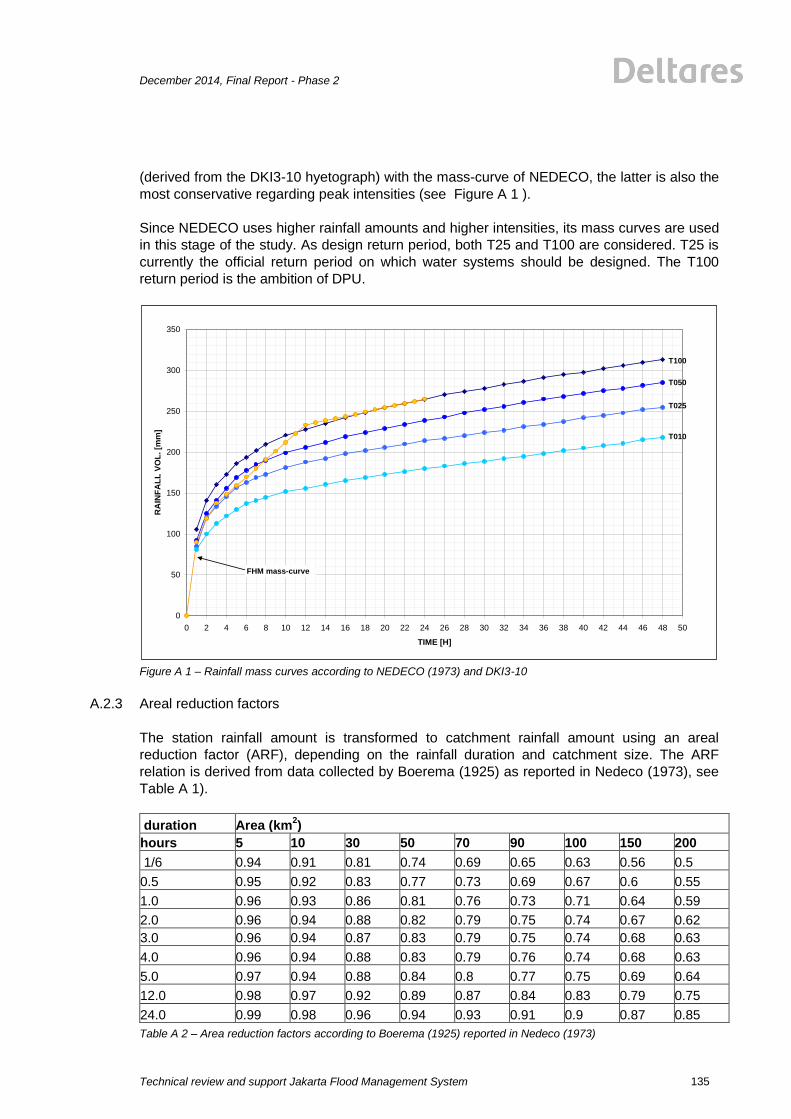
December 2014, Final Report - Phase 2
Technical review and support Jakarta Flood Management System
135
(derived from the DKI3-10 hyetograph) with the mass-curve of NEDECO, the latter is also the
most conservative regarding peak intensities (see Figure A 1 ).
Since NEDECO uses higher rainfall amounts and higher intensities, its mass curves are used
in this stage of the study. As design return period, both T25 and T100 are considered. T25 is
currently the official return period on which water systems should be designed. The T100
return period is the ambition of DPU.
Figure A 1 – Rainfall mass curves according to NEDECO (1973) and DKI3-10
A.2.3 Areal reduction factors
The station rainfall amount is transformed to catchment rainfall amount using an areal
reduction factor (ARF), depending on the rainfall duration and catchment size. The ARF
relation is derived from data collected by Boerema (1925) as reported in Nedeco (1973), see
Table A 1).
duration Area (km2)
hours 5 10 30 50 70 90 100 150 200
1/6 0.94 0.91 0.81 0.74 0.69 0.65 0.63 0.56 0.5
0.5 0.95 0.92 0.83 0.77 0.73 0.69 0.67 0.6 0.55
1.0 0.96 0.93 0.86 0.81 0.76 0.73 0.71 0.64 0.59
2.0 0.96 0.94 0.88 0.82 0.79 0.75 0.74 0.67 0.62
3.0 0.96 0.94 0.87 0.83 0.79 0.75 0.74 0.68 0.63
4.0 0.96 0.94 0.88 0.83 0.79 0.76 0.74 0.68 0.63
5.0 0.97 0.94 0.88 0.84 0.8 0.77 0.75 0.69 0.64
12.0 0.98 0.97 0.92 0.89 0.87 0.84 0.83 0.79 0.75
24.0 0.99 0.98 0.96 0.94 0.93 0.91 0.9 0.87 0.85
Table A 2 – Area reduction factors according to Boerema (1925) reported in Nedeco (1973)
0
50
100
150
200
250
300
350
0 2 4 6 8 10 12 14 16 18 20 22 24 26 28 30 32 34 36 38 40 42 44 46 48 50
TIME [H]
RA
INF
AL
L V
OL
. [m
m]
T100
T050
T025
T010
FHM mass-curve
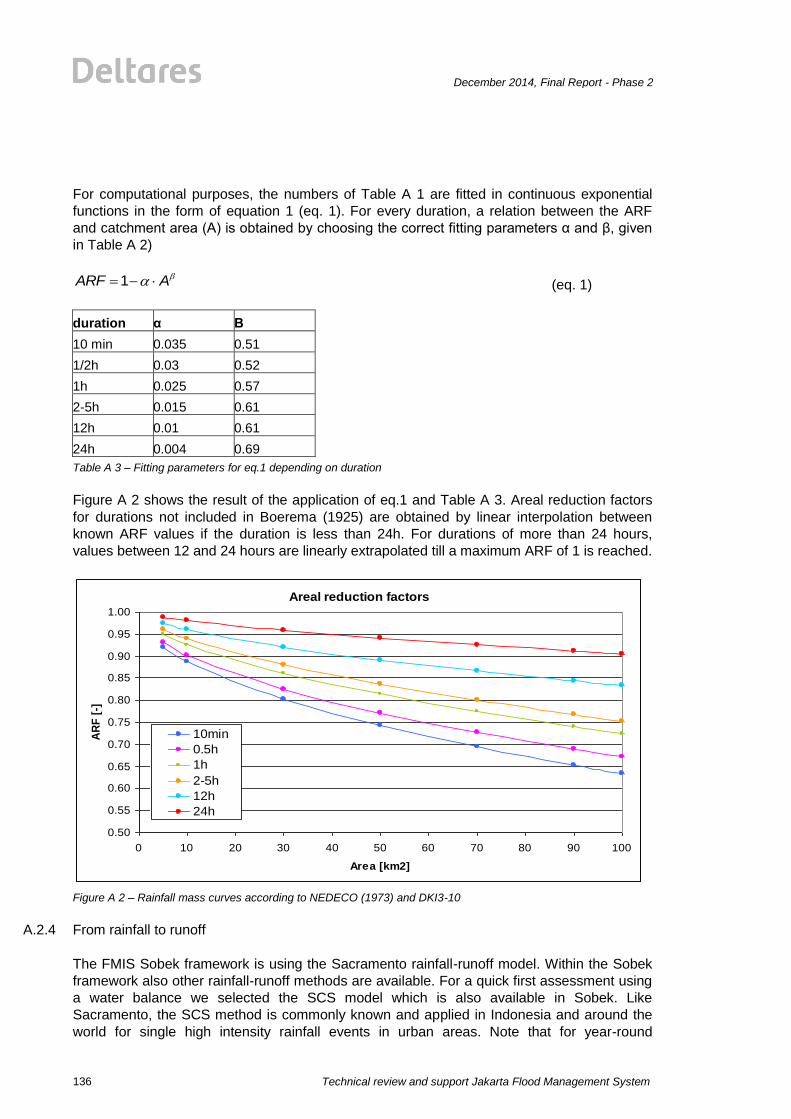
Technical review and support Jakarta Flood Management System
December 2014, Final Report - Phase 2
136
For computational purposes, the numbers of Table A 1 are fitted in continuous exponential
functions in the form of equation 1 (eq. 1). For every duration, a relation between the ARF
and catchment area (A) is obtained by choosing the correct fitting parameters α and β, given
in Table A 2)
1ARF A (eq. 1)
duration α Β
10 min 0.035 0.51
1/2h 0.03 0.52
1h 0.025 0.57
2-5h 0.015 0.61
12h 0.01 0.61
24h 0.004 0.69
Table A 3 – Fitting parameters for eq.1 depending on duration
Figure A 2 shows the result of the application of eq.1 and Table A 3. Areal reduction factors
for durations not included in Boerema (1925) are obtained by linear interpolation between
known ARF values if the duration is less than 24h. For durations of more than 24 hours,
values between 12 and 24 hours are linearly extrapolated till a maximum ARF of 1 is reached.
Figure A 2 – Rainfall mass curves according to NEDECO (1973) and DKI3-10
A.2.4 From rainfall to runoff
The FMIS Sobek framework is using the Sacramento rainfall-runoff model. Within the Sobek
framework also other rainfall-runoff methods are available. For a quick first assessment using
a water balance we selected the SCS model which is also available in Sobek. Like
Sacramento, the SCS method is commonly known and applied in Indonesia and around the
world for single high intensity rainfall events in urban areas. Note that for year-round
Areal reduction factors
0.50
0.55
0.60
0.65
0.70
0.75
0.80
0.85
0.90
0.95
1.00
0 10 20 30 40 50 60 70 80 90 100
Area [km2]
AR
F [
-]
10min
0.5h
1h
2-5h
12h
24h
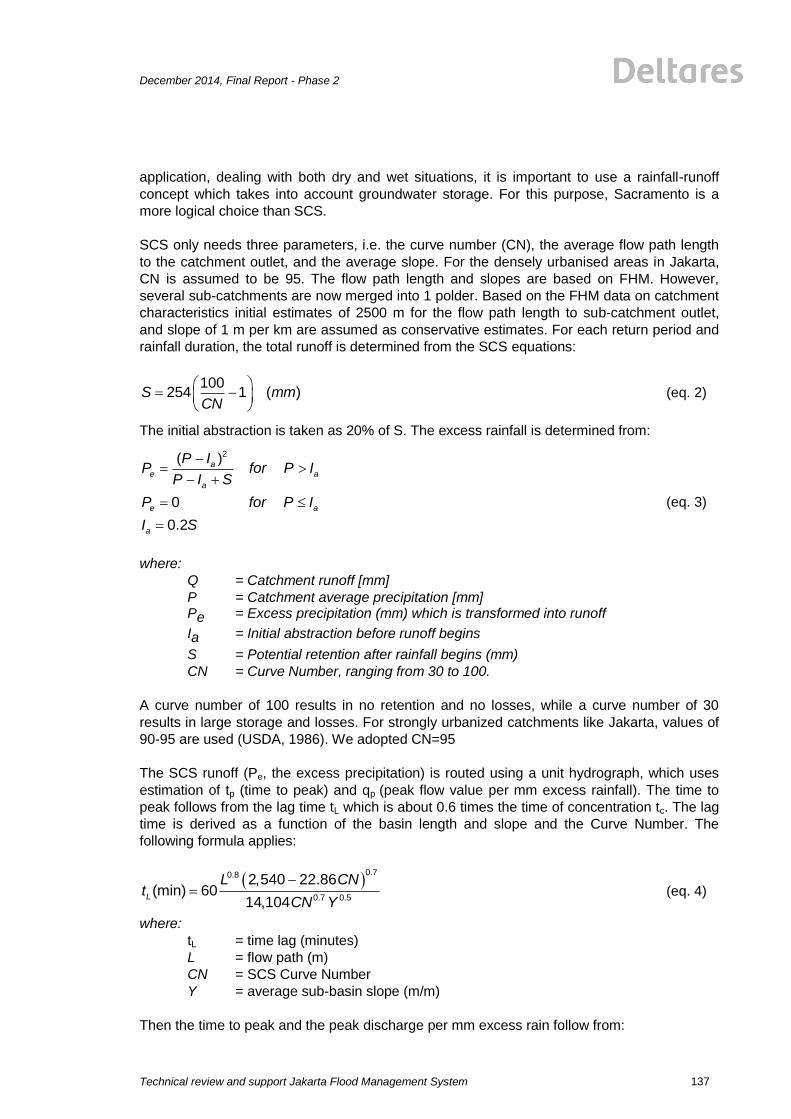
December 2014, Final Report - Phase 2
Technical review and support Jakarta Flood Management System
137
application, dealing with both dry and wet situations, it is important to use a rainfall-runoff
concept which takes into account groundwater storage. For this purpose, Sacramento is a
more logical choice than SCS.
SCS only needs three parameters, i.e. the curve number (CN), the average flow path length
to the catchment outlet, and the average slope. For the densely urbanised areas in Jakarta,
CN is assumed to be 95. The flow path length and slopes are based on FHM. However,
several sub-catchments are now merged into 1 polder. Based on the FHM data on catchment
characteristics initial estimates of 2500 m for the flow path length to sub-catchment outlet,
and slope of 1 m per km are assumed as conservative estimates. For each return period and
rainfall duration, the total runoff is determined from the SCS equations:
100254 1 ( )
S mm
CN (eq. 2)
The initial abstraction is taken as 20% of S. The excess rainfall is determined from:
2( )
0
0.2
ae a
a
e a
a
P IP for P I
P I S
P for P I
I S
(eq. 3)
where:
Q = Catchment runoff [mm]
P = Catchment average precipitation [mm] Pe = Excess precipitation (mm) which is transformed into runoff
Ia = Initial abstraction before runoff begins
S = Potential retention after rainfall begins (mm)
CN = Curve Number, ranging from 30 to 100.
A curve number of 100 results in no retention and no losses, while a curve number of 30
results in large storage and losses. For strongly urbanized catchments like Jakarta, values of
90-95 are used (USDA, 1986). We adopted CN=95
The SCS runoff (Pe, the excess precipitation) is routed using a unit hydrograph, which uses
estimation of tp (time to peak) and qp (peak flow value per mm excess rainfall). The time to
peak follows from the lag time tL which is about 0.6 times the time of concentration tc. The lag
time is derived as a function of the basin length and slope and the Curve Number. The
following formula applies:
0.70.8
0.7 0.5
2,540 22.86(min) 60
14,104
L
L CNt
CN Y (eq. 4)
where:
tL = time lag (minutes)
L = flow path (m)
CN = SCS Curve Number
Y = average sub-basin slope (m/m)
Then the time to peak and the peak discharge per mm excess rain follow from:

Technical review and support Jakarta Flood Management System
December 2014, Final Report - Phase 2
138
23
( )2
( )0.208 ( / ) /
( )
p L
p
p
Dt t hr
A kmq m s mm excess rain
t hr
(eq. 5)
where:
D = rainfall duration in computational procedure (hr)
tp = time to peak (hr)
The hydrograph will delay the runoff and reduce the peak runoff. Figure A 3 illustrates the
principle. First the station rainfall amount (black line) is converted to areal rainfall (purple line)
using the area reduction factor. Next, the reduced rainfall is converted to runoff (light blue) by
applying the SCS losses. Finally, the total runoff is routed using the unit hydrograph to
produce the routed runoff (dark blue).
Note: in this first estimation, we put the most intensive rainfall at the beginning. So the most
intensive rainfall falls within the first hour. Nedeco did not derive any hyetographs, giving the
distribution of rainfall mass during the day.
Figure A 3 – Transformation from rainfall to runoff, for an area of 25 km2.
Using the method described in the sections above, runoff-duration curves can be derived
using Nedeco (1973) rainfall, Boerema areal reduction factors and SCS rainfall-runoff routing.
Figure A 4 shows the T10, T25, T50 and T100 runoff-mass peaks which are used in the
“spread sheet method”, explained in section 0. Note, the runoff mass is only valid for the
chosen catchment area (in this case 40km2). Larger catchments, lead to lower average runoff
estimates.
From rainfall to runoff
0
50
100
150
200
250
300
350
0 6 12 18 24 30 36 42 48
Time (hours)
Rain
fall
, ru
no
ff (
mm
)
Rain
ARF*Rain
Total runoff
Routed runoff

December 2014, Final Report - Phase 2
Technical review and support Jakarta Flood Management System
139
Figure A 4 – Typical runoff mass curves for different return periods (catchment area is 40km2).
A.3 Water Levels
A.3.1 Reference levels
Within this document reference levels are expressed by default in m + PP*; which is the Peil
Priok level measured from bench mark Pasar Rebo (BMNWP60). At PU-DKI sea water levels
are measured at the Pasar Ikan (PI) staff gauge. With “Pluit” the staff gauge at pump house of
Pluit, waduk side, is indicated. LWS2012 refers to Low Water Spring tide in 2012, as used in
NCICD (2014A). In Table A 3 the estimated relation between all values is given.
Note: as subsidence and sea level rise continue, relation between all references will change.
Name Unit (m + XX) to MSL to PP*
Peil priok BMNWP60 PP* -1.2 0
Pasar Ikan PI -1.6 -0.4
Pluit Pluit -2.6 -1.4
LWS2012 (NCICD) LWS2012 -0.45 0.75
Table A 4 Correction to be applied for transfer of reference levels
PP*
Peil Priok (PP) relates to the NWP reference system of Jakarta established in 1926 (from:
NEDECO 1973). Levels measured from NWP benchmarks in 1926 related to low water spring
tide (LWS). Mean Sea Level (MSL) in 1926 was estimated to be at 0.6m to the NWP
benchmarks.
Although, BMNWP60 is considered to be stable in present conditions, it is assumed that field
surveys taken from the benchmark relate to MSL by +1.2m. This number is estimated in
SCS runoff and polder capacity
0
50
100
150
200
250
300
350
0 2 4 6 8 10 12 14 16 18 20 22 24 26 28 30 32 34 36 38 40 42 44 46 48
TIME [hours]
Vo
lum
e [
mm
]
T100 T50
T25 T10

Technical review and support Jakarta Flood Management System
December 2014, Final Report - Phase 2
140
2005. The 0.6m difference between the original value in 1926 and the current value is due to
0.2m consolidation and 0.4m sea level rise (see Figure A 5).
Figure A 5 – Estimation of BMNWP60/BMPP.60 to MSL (2005)
Pasar Ikan (PI) At Pasar Ikan long series of sea water level measurements are available (Figure A 6). From this series it has been estimated that the zero level of the Pasar Ikan staff gauge is at -1.6 m + PI.
Figure A 6 – Staff gauge reading at Pasar Ikan (PI), taken from Jakarta FEWS
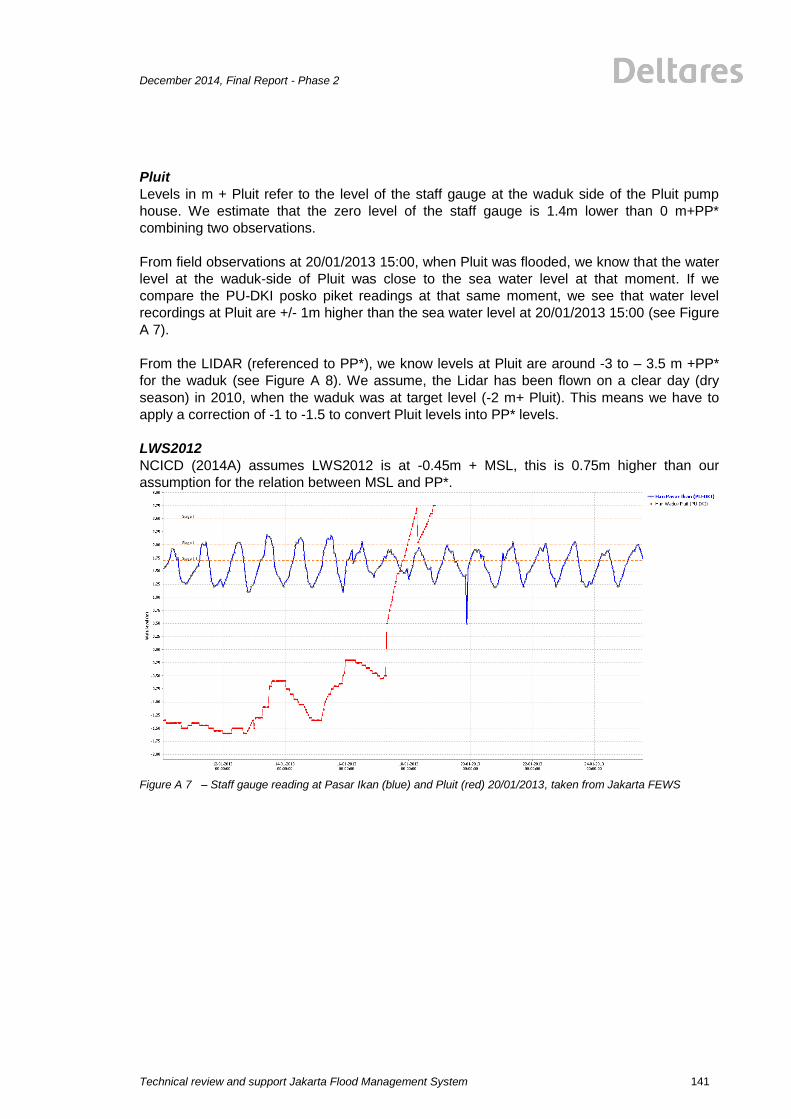
December 2014, Final Report - Phase 2
Technical review and support Jakarta Flood Management System
141
Pluit
Levels in m + Pluit refer to the level of the staff gauge at the waduk side of the Pluit pump
house. We estimate that the zero level of the staff gauge is 1.4m lower than 0 m+PP*
combining two observations.
From field observations at 20/01/2013 15:00, when Pluit was flooded, we know that the water
level at the waduk-side of Pluit was close to the sea water level at that moment. If we
compare the PU-DKI posko piket readings at that same moment, we see that water level
recordings at Pluit are +/- 1m higher than the sea water level at 20/01/2013 15:00 (see Figure
A 7).
From the LIDAR (referenced to PP*), we know levels at Pluit are around -3 to – 3.5 m +PP*
for the waduk (see Figure A 8). We assume, the Lidar has been flown on a clear day (dry
season) in 2010, when the waduk was at target level (-2 m+ Pluit). This means we have to
apply a correction of -1 to -1.5 to convert Pluit levels into PP* levels.
LWS2012
NCICD (2014A) assumes LWS2012 is at -0.45m + MSL, this is 0.75m higher than our
assumption for the relation between MSL and PP*.
Figure A 7 – Staff gauge reading at Pasar Ikan (blue) and Pluit (red) 20/01/2013, taken from Jakarta FEWS
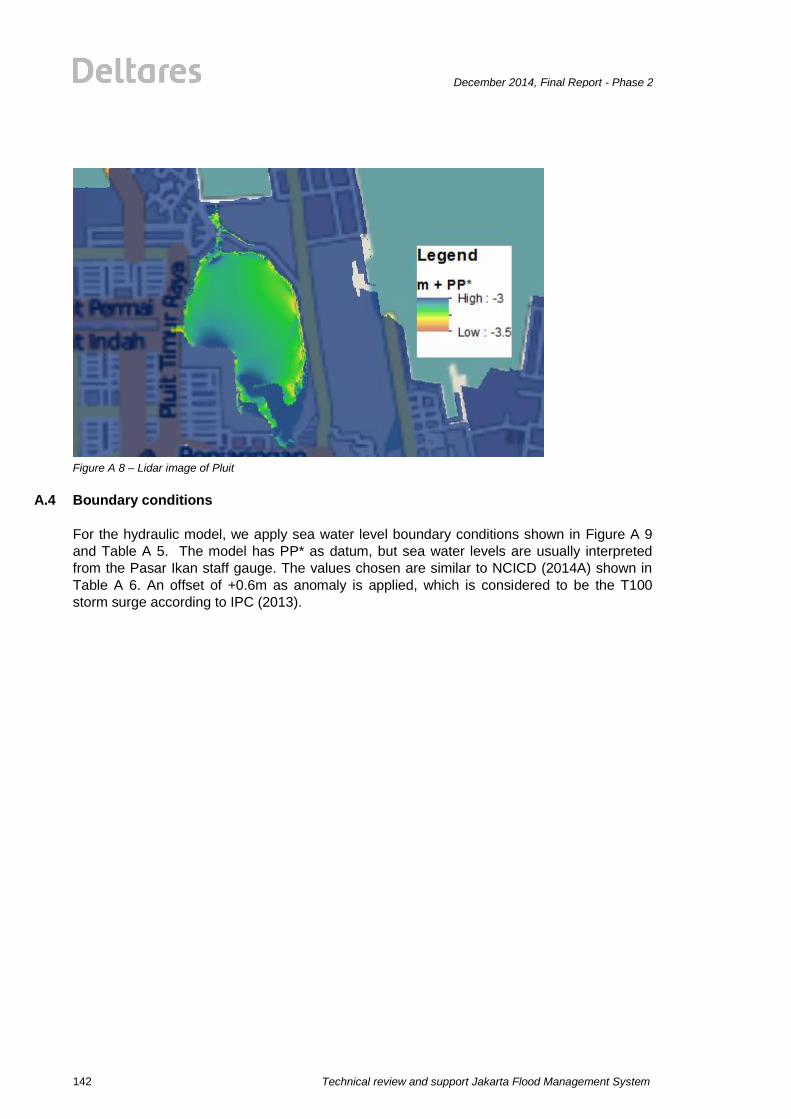
Technical review and support Jakarta Flood Management System
December 2014, Final Report - Phase 2
142
Figure A 8 – Lidar image of Pluit
A.4 Boundary conditions
For the hydraulic model, we apply sea water level boundary conditions shown in Figure A 9
and Table A 5. The model has PP* as datum, but sea water levels are usually interpreted
from the Pasar Ikan staff gauge. The values chosen are similar to NCICD (2014A) shown in
Table A 6. An offset of +0.6m as anomaly is applied, which is considered to be the T100
storm surge according to IPC (2013).

December 2014, Final Report - Phase 2
Technical review and support Jakarta Flood Management System
143
Figure A 9 – Time series boundary conditions available for Jakarta Flood Overview in m+ Pi (left) and m + PP*
(right)
Table A 5 Boundary conditions available for Jakarta Flood Overview
Stage Level [m + Pasar Ikan] [m + BMPP60]
High water spring tide + anomaly (2030) 3.8 3.4
High water spring tide + anomaly 2.7 2.3
High water spring tide 2.1 1.7
High water neap tide 1.8 1.4
Mean Sea Level 1.6 1.2
Low water neap tide 1.4 1
Low water spring tide 1.1 0.7
Low water spring tide + anomaly 1.7 1.3
Low water spring tide + anomaly (2030) 2.8 2.4
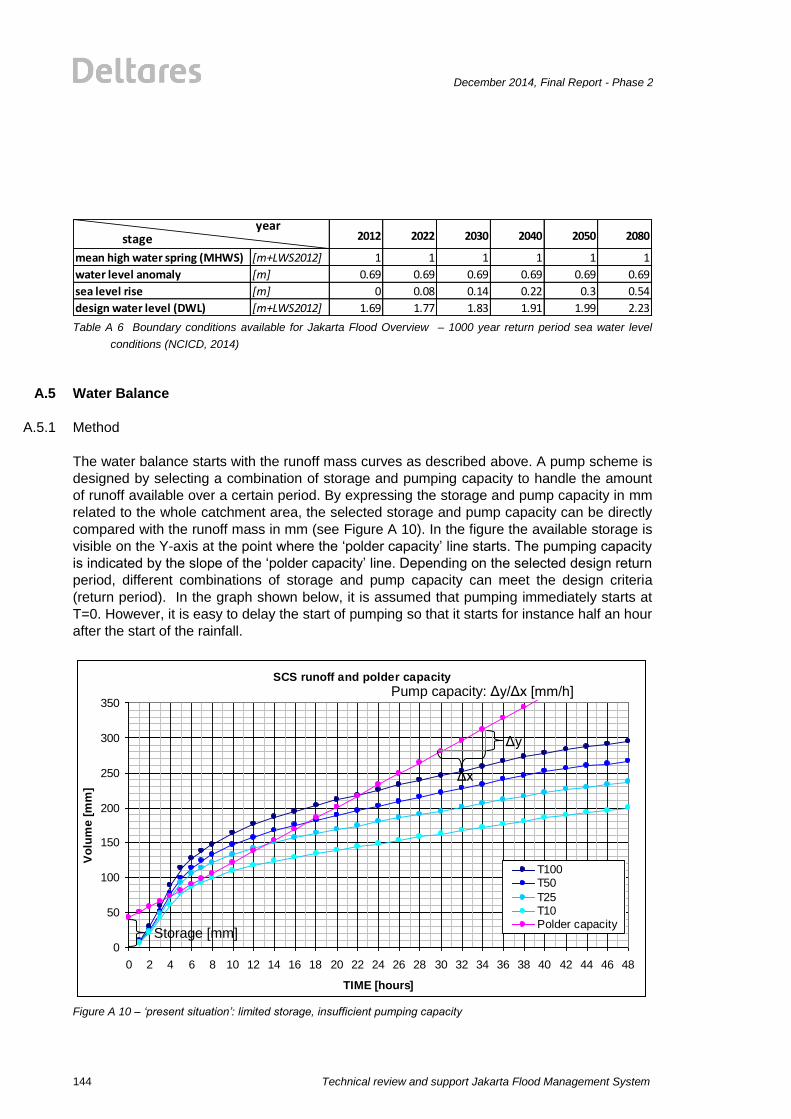
Technical review and support Jakarta Flood Management System
December 2014, Final Report - Phase 2
144
Table A 6 Boundary conditions available for Jakarta Flood Overview – 1000 year return period sea water level
conditions (NCICD, 2014)
A.5 Water Balance
A.5.1 Method
The water balance starts with the runoff mass curves as described above. A pump scheme is
designed by selecting a combination of storage and pumping capacity to handle the amount
of runoff available over a certain period. By expressing the storage and pump capacity in mm
related to the whole catchment area, the selected storage and pump capacity can be directly
compared with the runoff mass in mm (see Figure A 10). In the figure the available storage is
visible on the Y-axis at the point where the ‘polder capacity’ line starts. The pumping capacity
is indicated by the slope of the ‘polder capacity’ line. Depending on the selected design return
period, different combinations of storage and pump capacity can meet the design criteria
(return period). In the graph shown below, it is assumed that pumping immediately starts at
T=0. However, it is easy to delay the start of pumping so that it starts for instance half an hour
after the start of the rainfall.
Figure A 10 – ‘present situation’: limited storage, insufficient pumping capacity
2012 2022 2030 2040 2050 2080
[m+LWS2012] 1 1 1 1 1 1
[m] 0.69 0.69 0.69 0.69 0.69 0.69
[m] 0 0.08 0.14 0.22 0.3 0.54
design water level (DWL) [m+LWS2012] 1.69 1.77 1.83 1.91 1.99 2.23
stage year
mean high water spring (MHWS)
water level anomaly
sea level rise
SCS runoff and polder capacity
0
50
100
150
200
250
300
350
0 2 4 6 8 10 12 14 16 18 20 22 24 26 28 30 32 34 36 38 40 42 44 46 48
TIME [hours]
Vo
lum
e [
mm
]
T100T50
T25T10Polder capacity
Storage [mm]
Pump capacity: Δy/Δx [mm/h]
Δx
Δy

December 2014, Final Report - Phase 2
Technical review and support Jakarta Flood Management System
145
The existing storage can be directly determined from topography; all available surface water
serviced by the pump, multiplied by an allowed water level variation. The water level variation
is the difference between the operational level of the pump and a level at which no flooding
occurs in the polder (in principle including the secondary drainage system). In Jakarta (a
tropical region), a variation of 2 to 3 meters is allowed since storage space is limited and
rainfall intensities are high. For pump capacities, for now it is assumed that only pumps of 60-
80 m3/s can still be considered realistic (though large!!) to construct.
Assuming the existing given storage and realist pumps, it is very likely the preliminary design
graph is for any polder in Jakarta is similar to Figure A 10. In this (theoretical) case, the
system is only able to “absorb” runoff below T10 recurrence (the pink ‘polder capacity’ line is
always above the ‘T10’ light blue line). This means, flooding will occur with an average of
once every 10 years.
Using the water balance, a quick assessment can be made of the required combination and
pump capacity for different strategies like ‘maximise storage’ (see e.g. Figure A 11), ‘big
pumps’ (see e.g. Figure A 12) or other alternatives. Also the sensitivity of the system for the
selected design return period can be assessed. Important aspects for the selection of storage
and pump capacity are:
Hydraulic feasibility (what is possible from a hydrological and system hydraulics point
of view);
Social feasibility (creating large storage in urban area, requiring resettlement of a
large number of people can be very difficult); and
Financial feasibility (costs of creation of storage vs costs of large pumps).
The first (ambitious) goal is to design the polder systems such that events with return period
100 years can be handled. The designs are now typically using a return period T=25 years.
Figure A 11 – Polder optimization using “maximise storage approach”
SCS runoff and polder capacity
0
50
100
150
200
250
300
350
0 2 4 6 8 10 12 14 16 18 20 22 24 26 28 30 32 34 36 38 40 42 44 46 48
TIME [hours]
Vo
lum
e [
mm
]
T100T50
T25T10Polder capacity

Technical review and support Jakarta Flood Management System
December 2014, Final Report - Phase 2
146
Figure A 12 – Polder optimization using a “big pumps” strategy
A.5.2 Limitations
The water balance is a simple approach for quick assessment of different pumping schemes,
considering the total pump capacity and storage capacity of a polder. However, it is limited in
its use regarding hydrology and hydraulics:
It is limited in the consideration of rainfall runoff routing. In reality it is well possible that
travel times are larger or shorter than assumed, leading to changes in polder design.
It does not consider hydraulics (1). All assessed storage volume is assumed to be
available at any point in time. Hydraulic obstructions, preventing optimal use of storage
are not included. The detailed lay-out of the storage area related to the drainage
channels in catchment is not considered in this method, it just assumes all storage is
available. In the hydraulic model, the location of retention storages is taken into
account. For instance, in the hydraulic model (and in reality!) the Kali Sekretaris is
flowing next to Tomang reservoir and water can not enter the reservoir, while in the
method it is assumed it can.
The method does not consider hydraulics (2). All drains (primary and secondary) are
assumed to be able to convey the amount of runoff to the pump. Especially, when big
pumps are chosen, it is well possible drains are not able to convey the amount of water
supplied, resulting in empty canals downstream and flooding more upstream.
The water balance assumes pumping starts at full capacity immediately (or with a short
delay), while in the hydraulic model operational constraints are included like not
switching on all pumps at the same time, but one after each other, with different switch-
on and switch-off levels.
For this reason, promising alternatives should be checked with a full hydrological/hydraulic
model (the FHM Framework). In general, it can be expected that the hydraulic model will a
higher water level rise in retention areas than allowed the water balance. Or, to limit the water
level rise to a prescribed maximum, the pump capacities in the hydraulic model need to be a
SCS runoff and polder capacity
0
50
100
150
200
250
300
350
0 2 4 6 8 10 12 14 16 18 20 22 24 26 28 30 32 34 36 38 40 42 44 46 48
TIME [hours]
Vo
lum
e [
mm
]
T100T50
T25T10Polder capacity
December 2014, Final Report - Phase 2
Technical review and support Jakarta Flood Management System
147
little larger. In the verification calculations we checked whether the water levels computed in
the hydraulic model are still acceptable.
A.6 Verification using the FHM framework
A.6.1 Integrating hydrology and hydraulics using the FHM framework
As mentioned, the first estimate of the discharge capacity assumes uniform flow and no
backwater effect. However, the assumption of uniform flow is usually not met in polder
systems, and backwater effect cannot always be neglected. Therefore the available Sobek
hydraulic model is used to perform hydraulic calculations for the entire primary water system
of the polders. Sobek solves the full de Saint Venant equations and takes into account
backwater effects. Using the Sobek model we can verify whether the estimated storage
capacity and pumping capacity are sufficient, which operational levels are needed, and
whether the drainage system laid out according to JEDI has any hydraulic bottlenecks which
need to be resolved.
The default rainfall runoff boundary conditions differ in the FHM framework from the SCS
method, used in the water balance. Only for Kamal-Tanjungan area SCS is applied directly in
the framework, since it was not available in the framework yet. For all other areas,
Sacramento parameters and initial conditions have been set to meet the Rainfall-Runoff
response of the SCS method.
To summarise, important differences between the water balance and Sobek are:
The balance storage and pumping capacities are taken as first estimates for the more
detailed analysis in Sobek. The river and canal cross-sections are initially taken as
the cross-sections as they would be according to the JEDI design.
Sobek includes a hydraulic model of the main drainage canals and pump operation,
whereas the water balance does not. This is explained in the next 2 points.
The Sobek pumps do not immediately pump at full capacity (like the water balance),
but work with operational levels. A pump in Sobek is modelled using several stages
(or multiple pumps) with different switch-on and switch-off levels.
The Sobek hydraulic model takes into account the location of the retention areas in
the catchment. Some retention area might be available for a part of the catchment
only. For instance, the Tomang reservoir retention area is only for local drainage, not
for the upstream drainage already in Kali Sekretaris.
Sobek takes into account hydraulic bottlenecks in the drainage system modelled
using 1D-Flow. These hydraulic bottlenecks include locations where the discharge
conveyance capacity of the canals is not large enough (causing water levels to rise
above embankment levels), due to insufficient canal depth or width. The water
balance assumes the computed runoff is always available at the pumping station.
When Sobek-1D Flow shows that 1D-water levels rise above the embankments, a
combined Sobek1D2Dflow calculation can be made to analyse the inundation pattern.
The water balance does not check with embankment levels.
A.6.2 Integration of polder systems with JEDI packages
If canals are in one of the JEDI packages, the design drawings will be used as a primary
design for the canal geometry in the proposed polder system. If not, most recent surveys will

Technical review and support Jakarta Flood Management System
December 2014, Final Report - Phase 2
148
be used as a starting point. With the hydraulic model, we can determine how canal
geometries should be adjusted to be integrated in the proposed polder schemes.

December 2014, Final Report - Phase 2
Technical review and support Jakarta Flood Management System
149
B Appendix B: Sobek and the Jakarta FHM framework
B.1 Overview of FHM related activities 2007 – 2013
After the severe floods of February 2007, as part of the non-structural Dutch Assistance
Jakarta Flood Management initiative (DA JFM), a new successful approach to assist Jakarta
in understanding and counteracting the floods was introduced. An important part of the
approach was developed through the "Flood Hazard Mapping (FHM)" projects (2007-2009)
During the three consecutive FHM projects a unique FHM modelling framework was
developed and further updated including the 13 crossing rivers and the complete major
drainage system of Jakarta.
The developed GIS based FHM modelling framework starts in the upper Panggrango - Gede
area and runs to the northern coastal area of Jakarta. It includes complete hydrology, land-
use, major river and drainage system and is capable to simulate floods in the complete DKI
area. During the Situ Situ Safety Inspection (S3I) study (2009), the FHM modelling framework
was further expanded to include all major Situ Situ upstream and in Jakarta. The FHM
modelling framework was further used and updated during the Jakarta Flood Readiness Scan
(JFRS) in 2011, the Flood Management Information System (FMIS) in 2012 and during the
evaluation of the January 2013 floods. As the FHM modelling framework was setup for use as
part of an online monitoring / flood early warning system (FEWS), the FHM modelling
framework was connected to the Jakarta Flood Early Warning System (JFEWS) during the
Joint Cooperation Program (JCP 2011-2012). In the FMIS project JFEWS was further
enhanced and implemented at the flood operation and disaster centres in Jakarta.
Many different parts of the Jakarta have been analysed and evaluated with the FHM
modelling framework since 2007. An overview of the projects and related reports is presented
in Table B-11-1. Based on these projects a quick overview of main components and use of
the FHM modelling frame work is presented in chapters B.2 - B.6.
Table B-11-1, Overview of FHM and Hydraulic activities in Jakarta 2007 - 2013
Jakarta - FHM and Hydraulic Activities 2007 - 2013
Project Report nr
Project Title Relevant Report Title
FHM1
Flood Hazard Mapping 1 (2007)
1 Overview 16122007.pdf
2 Main Report 151207.pdf
3 Flood extent and Bottlenecks 151207.pdf
4 Hydraulics 151207.pdf
5 Hydrology and Sea Water Levels 15122007.pdf
6 Annex A, Sea Water Levels 15122007.pdf
7 Annex B, Discharge Measuring Stations 15122007.pdf
FHM2
Flood Hazard Mapping 2 (2008)
1 Overview 230309.pdf
2 FHM modelling framework 230309.pdf

Technical review and support Jakarta Flood Management System
December 2014, Final Report - Phase 2
150
Jakarta - FHM and Hydraulic Activities 2007 - 2013
Project Report nr
Project Title Relevant Report Title
3 HU database and FEMapping 230309.pdf
4 Jakarta Flood Early Warning System, Main 230309.pdf
5 Jakarta Flood Early Warning System, Appendix A 230309.pdf
6 Jakarta Flood Early Warning System, Appendix B 230309.pdf
7 Jakarta Flood Early Warning System, Appendix C 230309.pdf
FHM3
Flood Hazard Mapping 3 (2009)
1 01 Final Report.pdf
2 03 Evaluation Dredging in Jakarta.pdf
3 06 Evaluation Training Planning Unit with FHM Model.pdf
4 07 Long Term Rehabilitation & Maintenance Program.pdf
5 08 Inventory of Urban Drainage Systems in Pademangan Barat and Thamrin Monas.pdf
6 09 Performance Analysis Drainage System Sub catchment Jalan Thamrin Jakarta.pdf
7 10 Analysis Capacity Drainage System Pademangan Barat.pdf
8 14 GPS Based Flood Extent Mapping.pdf
S3I
Situ Situ Safety Inspection (2009)
1 Field inspection and investigation 270709.pdf
2 Safety inspection manual 270709.pdf
3 Short-term Action Plan 240709.pdf
4 Soil Investigation 270709.pdf
JFRS
Jakarta Flood Readiness Scan (2011 - 2012)
1 Jakarta Disaster Preparation December 2011.pdf
FMIS
Flood Management Information System (2012)
1 FMIS Main report 10022013.pdf
2 FMIS Annex A, FHM framework and measures 10022013.pdf
3 FMIS Annex B, Hydro-meteorological monitoring network Jakarta 10022013.pdf
4 FMIS Annex C, FMIS institutional framework 10022013.pdf
EA2013 FHM - Emergency Assistance Floods January 2013 (2013)
1 Jakarta Floods January 2013 - Emergency assistance - April 2013.pdf
B.2 The SOBEK modelling system
SOBEK is the main hydrologic and hydraulic modelling software used for analyzing the
propagation of water through the Ciliwung catchment. It consists of modules that can be used
separately or combined. The available Sobek-modules cover a wide range of processes, from
rainfall-runoff, to 1D/2D hydrodynamics, to water quality processes and emissions. SOBEK is
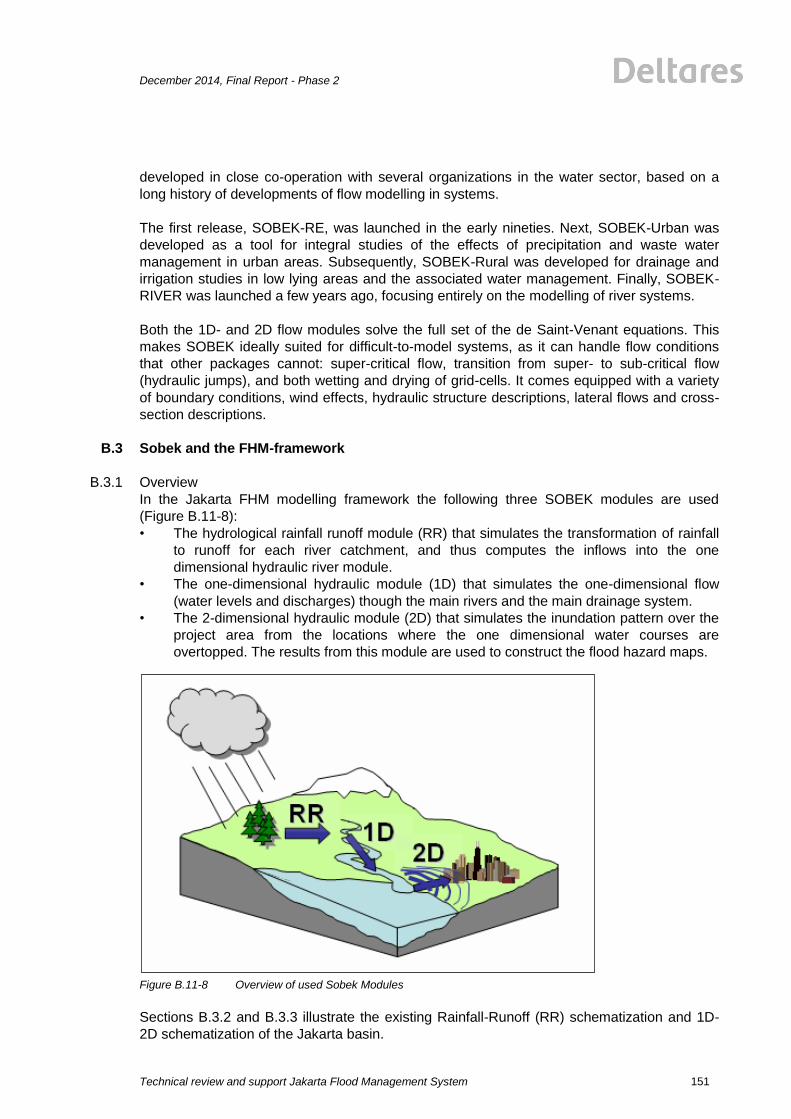
December 2014, Final Report - Phase 2
Technical review and support Jakarta Flood Management System
151
developed in close co-operation with several organizations in the water sector, based on a
long history of developments of flow modelling in systems.
The first release, SOBEK-RE, was launched in the early nineties. Next, SOBEK-Urban was
developed as a tool for integral studies of the effects of precipitation and waste water
management in urban areas. Subsequently, SOBEK-Rural was developed for drainage and
irrigation studies in low lying areas and the associated water management. Finally, SOBEK-
RIVER was launched a few years ago, focusing entirely on the modelling of river systems.
Both the 1D- and 2D flow modules solve the full set of the de Saint-Venant equations. This
makes SOBEK ideally suited for difficult-to-model systems, as it can handle flow conditions
that other packages cannot: super-critical flow, transition from super- to sub-critical flow
(hydraulic jumps), and both wetting and drying of grid-cells. It comes equipped with a variety
of boundary conditions, wind effects, hydraulic structure descriptions, lateral flows and cross-
section descriptions.
B.3 Sobek and the FHM-framework
B.3.1 Overview
In the Jakarta FHM modelling framework the following three SOBEK modules are used
(Figure B.11-8):
• The hydrological rainfall runoff module (RR) that simulates the transformation of rainfall
to runoff for each river catchment, and thus computes the inflows into the one
dimensional hydraulic river module.
• The one-dimensional hydraulic module (1D) that simulates the one-dimensional flow
(water levels and discharges) though the main rivers and the main drainage system.
• The 2-dimensional hydraulic module (2D) that simulates the inundation pattern over the
project area from the locations where the one dimensional water courses are
overtopped. The results from this module are used to construct the flood hazard maps.
Figure B.11-8 Overview of used Sobek Modules
Sections B.3.2 and B.3.3 illustrate the existing Rainfall-Runoff (RR) schematization and 1D-
2D schematization of the Jakarta basin.
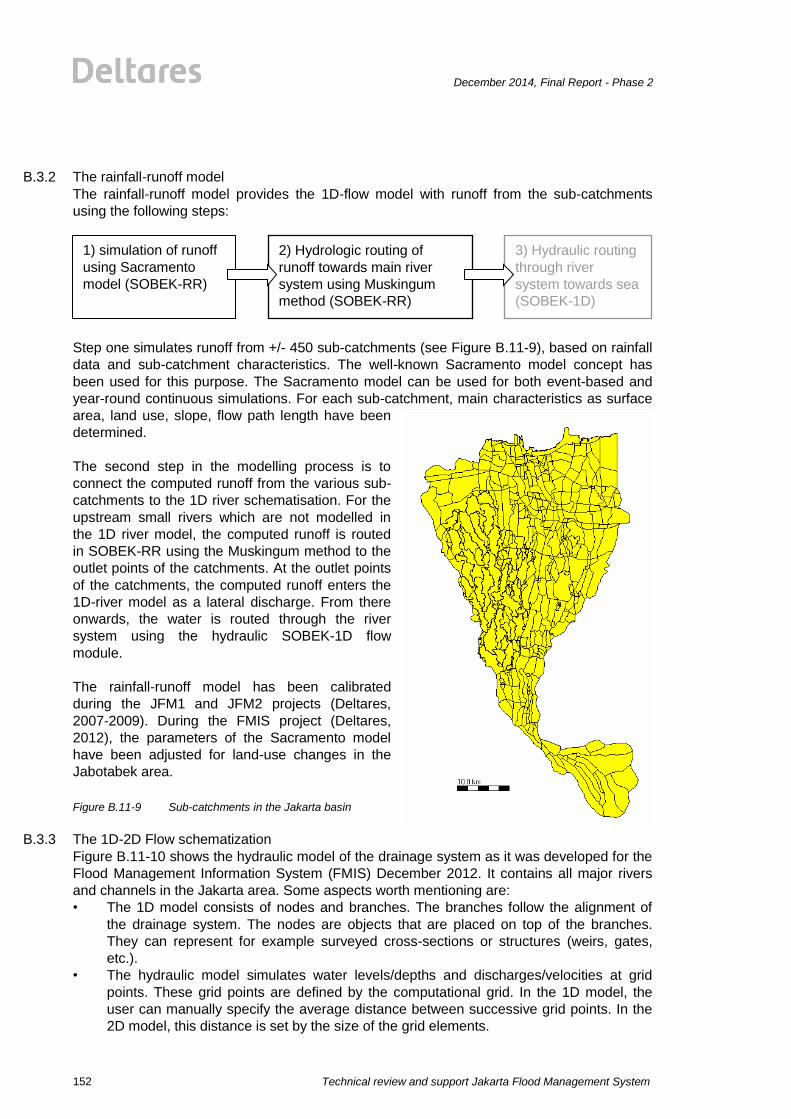
Technical review and support Jakarta Flood Management System
December 2014, Final Report - Phase 2
152
B.3.2 The rainfall-runoff model
The rainfall-runoff model provides the 1D-flow model with runoff from the sub-catchments
using the following steps:
Step one simulates runoff from +/- 450 sub-catchments (see Figure B.11-9), based on rainfall
data and sub-catchment characteristics. The well-known Sacramento model concept has
been used for this purpose. The Sacramento model can be used for both event-based and
year-round continuous simulations. For each sub-catchment, main characteristics as surface
area, land use, slope, flow path length have been
determined.
The second step in the modelling process is to
connect the computed runoff from the various sub-
catchments to the 1D river schematisation. For the
upstream small rivers which are not modelled in
the 1D river model, the computed runoff is routed
in SOBEK-RR using the Muskingum method to the
outlet points of the catchments. At the outlet points
of the catchments, the computed runoff enters the
1D-river model as a lateral discharge. From there
onwards, the water is routed through the river
system using the hydraulic SOBEK-1D flow
module.
The rainfall-runoff model has been calibrated
during the JFM1 and JFM2 projects (Deltares,
2007-2009). During the FMIS project (Deltares,
2012), the parameters of the Sacramento model
have been adjusted for land-use changes in the
Jabotabek area.
Figure B.11-9 Sub-catchments in the Jakarta basin
B.3.3 The 1D-2D Flow schematization
Figure B.11-10 shows the hydraulic model of the drainage system as it was developed for the
Flood Management Information System (FMIS) December 2012. It contains all major rivers
and channels in the Jakarta area. Some aspects worth mentioning are:
• The 1D model consists of nodes and branches. The branches follow the alignment of
the drainage system. The nodes are objects that are placed on top of the branches.
They can represent for example surveyed cross-sections or structures (weirs, gates,
etc.).
• The hydraulic model simulates water levels/depths and discharges/velocities at grid
points. These grid points are defined by the computational grid. In the 1D model, the
user can manually specify the average distance between successive grid points. In the
2D model, this distance is set by the size of the grid elements.
1) simulation of runoff
using Sacramento
model (SOBEK-RR)
2) Hydrologic routing of
runoff towards main river
system using Muskingum
method (SOBEK-RR)
3) Hydraulic routing
through river
system towards sea
(SOBEK-1D)

December 2014, Final Report - Phase 2
Technical review and support Jakarta Flood Management System
153
• The 2D model consists of a rectangular DEM grid cells. The elevation in every grid cell
represents the average surface-level. The Jakarta model consists of two overlapping
grids: one with 100x100m grid cells, representing the entire flood-prone area, and one
nested grid with 50x50m cells, representing part of the Ciliwung River upstream of
Manggarai gate.
• SOBEK automatically connects the 1D and 2D grid points. This way, water will start to
flow from the 1D to the 2D domain as soon as the water level overtops the
embankments. Reverse flow is also possible: when 2D overland flow reaches a drain
modelled in 1D, it will enter that drain if the water level exceeds the embankment.
• The 1D model includes cross-sections, defining the river geometry. The data from these
cross-sections comes from a large number of different sources, using different survey
methods. Cross-sections are the most important data for 1D models, as they determine
the conveyance capacity of the system.
• Along the main river several large structures are used to regulate water during low and
peak flow conditions (e.g. Manggarai and Karet gate at the Banjir Kanal Barat). Most of
these structures are incorporated in the modelling framework.
• Most of the low-lying areas in Jakarta cannot drain into the sea by gravity as a result of
the continuous subsidence caused by compacting of the soils because of deep
groundwater abstractions. These low-lying areas usually drain into reservoirs (waduks),
from where the water is pumped to the main river system. Waduks and pumps are
included in the model.
• The combined schematization was
calibrated for the January/February
2007 flood event, and validated for the
January/February 2008 flood event in
the FHM1 and FHM2 studies (Deltares,
2007-2009).
• After the FHM1 and FHM2 studies the
Banjir Kanal Timur (BKT) was included
in the schematization for the Java Flood
Insurance studies (Deltares, 2011),
being the flood mitigating measure with
the largest impact on the flood patterns
in the east of Jakarta.
• During the FMIS project (Deltares,
2012), the major part of the FHM
framework has been updated (as far as
possible) to the system state of 2012.
Figure B.11-10 - Overview the FMIS hydraulic 1D &
2D flow model

Technical review and support Jakarta Flood Management System
December 2014, Final Report - Phase 2
154
B.4 Rainfall-Runoff
B.4.1 The Sacramento concept
Since the FHM2 studies (Deltares, 2009A) the rainfall-runoff processes in the FHM-
framework are described with the Sacramento concept as implemented into Sobek. This
concept is explained in detail in Appendix B.1. A first estimate or typical range of the
parameters is given in Appendix B.2. The FHM design storm rainfall events are extensively
described in Annex A.
The Sacramento concept is a significant improvement in describing hydrological processes of
the Ciliwung catchment compared to practices in previous studies (DKI 3-9 and DKI 3-10,
2005 and Deltares, 2007). In standard practice rainfall is “converted” to runoff by the rational
or curve-number method. Sacramento converts rainfall into runoff by taking into account all
significant hydrological processes in a conceptual manner.
An example of an important process to take into account is base flow. In the Ciliwung, flood
events are usually preceded by days of intensive rainfall. In such days, the hydrological
system of the Ciliwung is “filled up” by infiltrating water, resulting in a significant base-flow.
During the flood event this base-flow is accumulated with direct runoff to a peak discharge.
Therefore, peak discharges under these conditions can be better described using the
Sacramento concept than the rational method.
Figure B.11-11 - Runoff distribution hydrological unit 3909
B.4.2 Muskingum routing
Not always the outlet of a catchment is adjacent to a river discretized in 1D canal flow. At
locations in rivers or streams where geometrical data (cross sections) are available or water
levels are irrelevant, runoff is routed using Muskingum routing (McCarthy, 1938). In Appendix
B.3 the concept of Muskingum routing and default parameter choices are explained.
B.4.3 FHM RR discretization
The Ciliwung catchment is discretized in sub-catchments for which area-average rainfall (mm)
is converted to area-average runoff (mm). Over the years (2007 – 2012) the amount of
catchments have slightly changed due to changes in the water system and 1D2D river
Runoff hydrological unit 3909
Baseflow (mm) Direct runoff impervious area [mm]
5-2-20075-2-20074-2-20074-2-20073-2-20073-2-20072-2-20072-2-20071-2-20071-2-200731-1-200731-1-2007
1.1
1
0.9
0.8
0.7
0.6
0.5
0.4
0.3
0.2
0.1
0
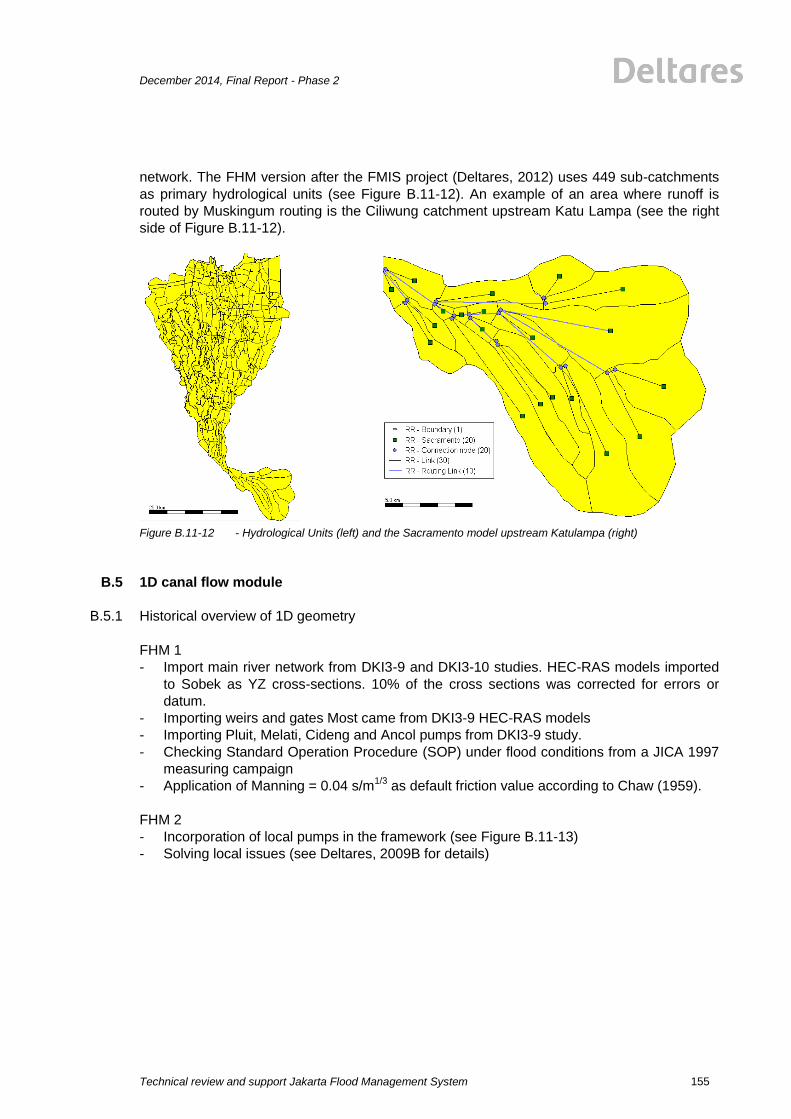
December 2014, Final Report - Phase 2
Technical review and support Jakarta Flood Management System
155
network. The FHM version after the FMIS project (Deltares, 2012) uses 449 sub-catchments
as primary hydrological units (see Figure B.11-12). An example of an area where runoff is
routed by Muskingum routing is the Ciliwung catchment upstream Katu Lampa (see the right
side of Figure B.11-12).
Figure B.11-12 - Hydrological Units (left) and the Sacramento model upstream Katulampa (right)
B.5 1D canal flow module
B.5.1 Historical overview of 1D geometry
FHM 1
- Import main river network from DKI3-9 and DKI3-10 studies. HEC-RAS models imported
to Sobek as YZ cross-sections. 10% of the cross sections was corrected for errors or
datum.
- Importing weirs and gates Most came from DKI3-9 HEC-RAS models
- Importing Pluit, Melati, Cideng and Ancol pumps from DKI3-9 study.
- Checking Standard Operation Procedure (SOP) under flood conditions from a JICA 1997
measuring campaign
- Application of Manning = 0.04 s/m1/3
as default friction value according to Chaw (1959).
FHM 2
- Incorporation of local pumps in the framework (see Figure B.11-13)
- Solving local issues (see Deltares, 2009B for details)
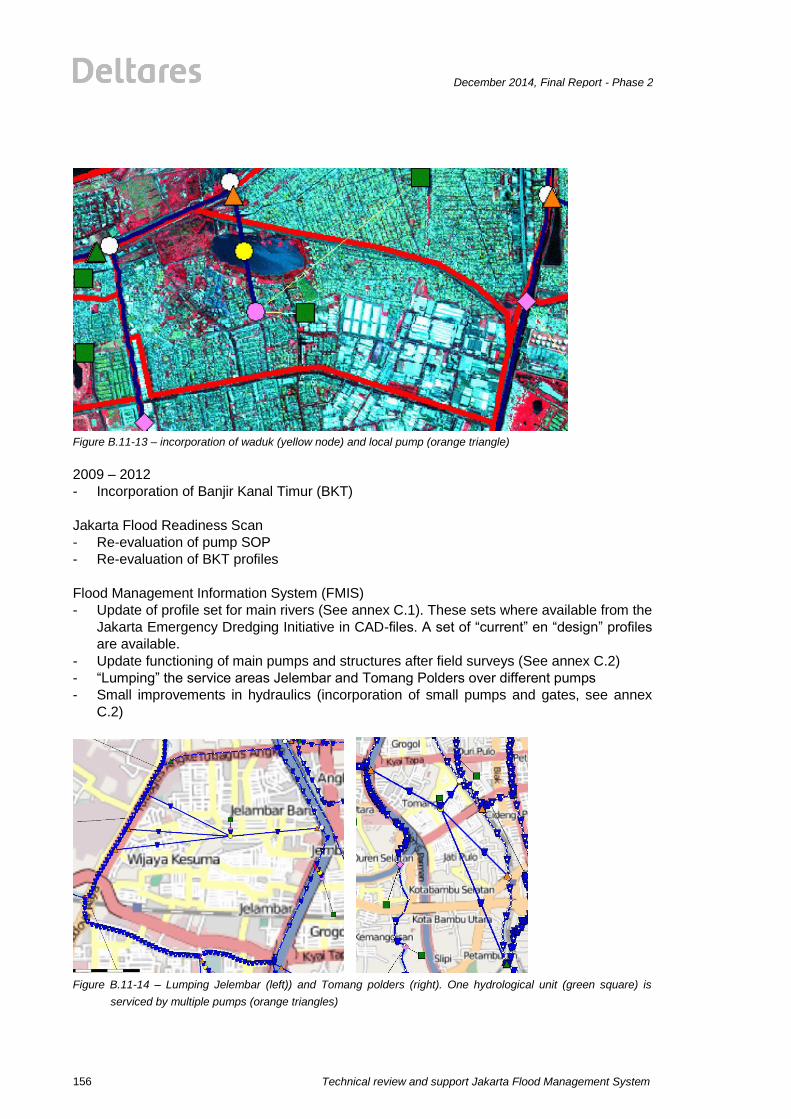
Technical review and support Jakarta Flood Management System
December 2014, Final Report - Phase 2
156
Figure B.11-13 – incorporation of waduk (yellow node) and local pump (orange triangle)
2009 – 2012
- Incorporation of Banjir Kanal Timur (BKT)
Jakarta Flood Readiness Scan
- Re-evaluation of pump SOP
- Re-evaluation of BKT profiles
Flood Management Information System (FMIS)
- Update of profile set for main rivers (See annex C.1). These sets where available from the
Jakarta Emergency Dredging Initiative in CAD-files. A set of “current” en “design” profiles
are available.
- Update functioning of main pumps and structures after field surveys (See annex C.2)
- “Lumping” the service areas Jelembar and Tomang Polders over different pumps
- Small improvements in hydraulics (incorporation of small pumps and gates, see annex
C.2)
Figure B.11-14 – Lumping Jelembar (left)) and Tomang polders (right). One hydrological unit (green square) is
serviced by multiple pumps (orange triangles)

December 2014, Final Report - Phase 2
Technical review and support Jakarta Flood Management System
157
B.6 2D Overland Flow module A digital elevation model represents the ground surface topography in a raster form. Buildings, trees etc. should not be represented in the DEM. Dikes, on the other hand, should be represented, as they influence the propagation of the water and limit the extent of the floodings. During FHM1, two types of Digital Elevation Models were prepared: a TIN (Triangulated Irregular Network) and a grid. First, a TIN was constructed from spot heights (78000) and contour lines with an interval of 1 meter. A TIN gives a continuous representation of the elevation. From the TIN a grid of 5x5 meter was constructed, from which larger versions are made for hydraulic computations. The overland model uses a grid of 100x100 meter for the province of Jakarta (DKI) and a 50X50 meter grid for the Ciliwung upstream Manggarai.
For the overland module, a Manning friction of 0.04 s/m1/3
is applied on the entire grid.