Office of Wastewater Management Report on the Sewage ... STP Report.pdf · nitrogen is by mandating...
27
COUNTY OF SUFFOLK Steven Bellone SUFFOLK COUNTY EXECUTIVE DEPARTMENT OF HEALTH SERVICES JAMES L. TOMARKEN, MD, MSW, MPH, MBA, FRCPC, FACP Commissioner Christina Capobianco Deputy Commissioner Walter Dawydiak, P.E., Director Division of Environmental Quality Office of Wastewater Management Report on the Sewage Treatment Plants of Suffolk County 2015 Performance Evaluation Walter Hilbert P.E., Chief Office of Wastewater Management Prepared by: Tanima Adhya, P.E. & Charles Olsen December 2016
Transcript of Office of Wastewater Management Report on the Sewage ... STP Report.pdf · nitrogen is by mandating...
COUNTY OF SUFFOLK
Steven Bellone
SUFFOLK COUNTY EXECUTIVE
DEPARTMENT OF HEALTH SERVICES
JAMES L. TOMARKEN, MD, MSW, MPH, MBA, FRCPC, FACP
Commissioner
Christina Capobianco
Deputy Commissioner
Walter Dawydiak, P.E., Director
Division of Environmental Quality
Office of Wastewater Management
Report on the Sewage Treatment Plants of Suffolk County
2015 Performance Evaluation
Walter Hilbert P.E., Chief
Office of Wastewater Management
Prepared by: Tanima Adhya, P.E. & Charles Olsen
December 2016
2015 STP Report Page 1
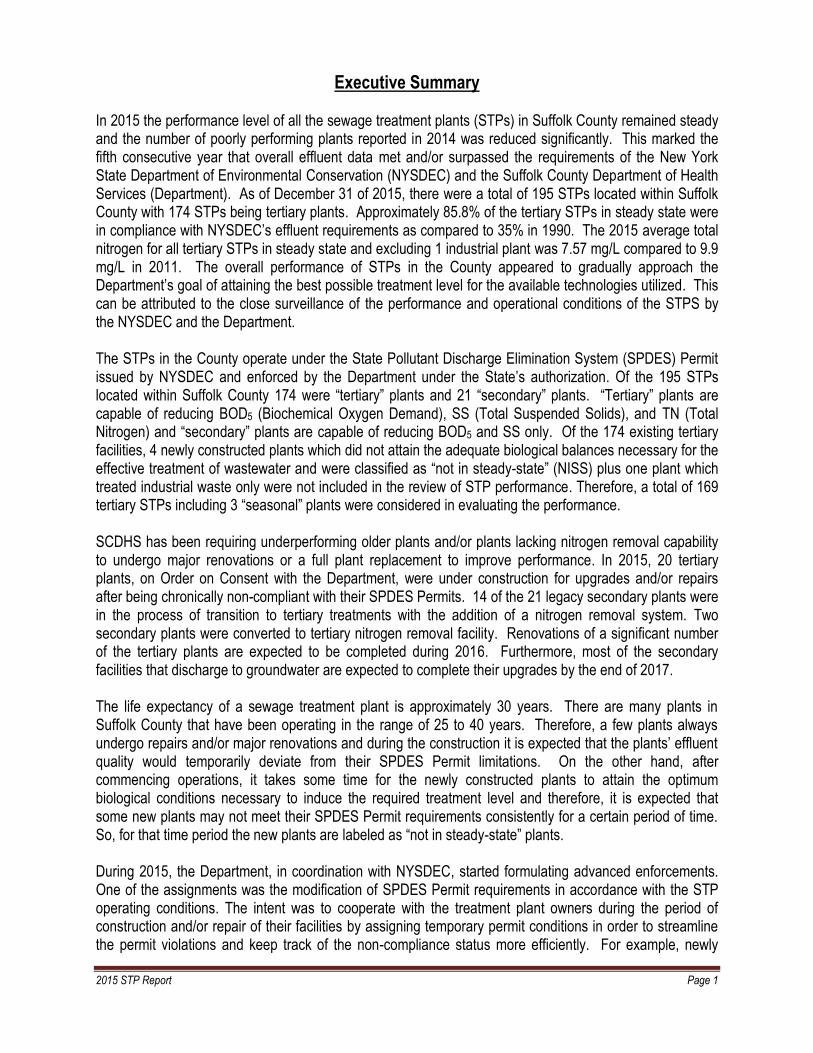
Executive Summary In 2015 the performance level of all the sewage treatment plants (STPs) in Suffolk County remained steady and the number of poorly performing plants reported in 2014 was reduced significantly. This marked the fifth consecutive year that overall effluent data met and/or surpassed the requirements of the New York State Department of Environmental Conservation (NYSDEC) and the Suffolk County Department of Health Services (Department). As of December 31 of 2015, there were a total of 195 STPs located within Suffolk County with 174 STPs being tertiary plants. Approximately 85.8% of the tertiary STPs in steady state were in compliance with NYSDEC’s effluent requirements as compared to 35% in 1990. The 2015 average total nitrogen for all tertiary STPs in steady state and excluding 1 industrial plant was 7.57 mg/L compared to 9.9 mg/L in 2011. The overall performance of STPs in the County appeared to gradually approach the Department’s goal of attaining the best possible treatment level for the available technologies utilized. This can be attributed to the close surveillance of the performance and operational conditions of the STPS by the NYSDEC and the Department. The STPs in the County operate under the State Pollutant Discharge Elimination System (SPDES) Permit issued by NYSDEC and enforced by the Department under the State’s authorization. Of the 195 STPs located within Suffolk County 174 were “tertiary” plants and 21 “secondary” plants. “Tertiary” plants are capable of reducing BOD5 (Biochemical Oxygen Demand), SS (Total Suspended Solids), and TN (Total Nitrogen) and “secondary” plants are capable of reducing BOD5 and SS only. Of the 174 existing tertiary facilities, 4 newly constructed plants which did not attain the adequate biological balances necessary for the effective treatment of wastewater and were classified as “not in steady-state” (NISS) plus one plant which treated industrial waste only were not included in the review of STP performance. Therefore, a total of 169 tertiary STPs including 3 “seasonal” plants were considered in evaluating the performance. SCDHS has been requiring underperforming older plants and/or plants lacking nitrogen removal capability to undergo major renovations or a full plant replacement to improve performance. In 2015, 20 tertiary plants, on Order on Consent with the Department, were under construction for upgrades and/or repairs after being chronically non-compliant with their SPDES Permits. 14 of the 21 legacy secondary plants were in the process of transition to tertiary treatments with the addition of a nitrogen removal system. Two secondary plants were converted to tertiary nitrogen removal facility. Renovations of a significant number of the tertiary plants are expected to be completed during 2016. Furthermore, most of the secondary facilities that discharge to groundwater are expected to complete their upgrades by the end of 2017. The life expectancy of a sewage treatment plant is approximately 30 years. There are many plants in Suffolk County that have been operating in the range of 25 to 40 years. Therefore, a few plants always undergo repairs and/or major renovations and during the construction it is expected that the plants’ effluent quality would temporarily deviate from their SPDES Permit limitations. On the other hand, after commencing operations, it takes some time for the newly constructed plants to attain the optimum biological conditions necessary to induce the required treatment level and therefore, it is expected that some new plants may not meet their SPDES Permit requirements consistently for a certain period of time. So, for that time period the new plants are labeled as “not in steady-state” plants. During 2015, the Department, in coordination with NYSDEC, started formulating advanced enforcements. One of the assignments was the modification of SPDES Permit requirements in accordance with the STP operating conditions. The intent was to cooperate with the treatment plant owners during the period of construction and/or repair of their facilities by assigning temporary permit conditions in order to streamline the permit violations and keep track of the non-compliance status more efficiently. For example, newly

2015 STP Report Page 2
constructed “NISS” facilities would be issued a temporary limit equivalent to their properties’ as-of-right density development and the permit would remain active until the facility’s daily flow attains 50% of the design flow, at which time, a permanent permit would be issued to the facilities. In the case of upgrade or major repairs or replacement of legacy plants, which may disrupt normal daily plant operations, the plant owners would be required to file an Order on Consent with the Department providing a time line to complete the required construction. Based on the timeline, the Department would assign a reasonable effluent total nitrogen limit possible to comply with during the construction period. The limit would remain in effect for the duration of the construction only in order to cooperate with the plant owners by preventing repeated violations of his SPDES Permit during the construction period. A total of 478 inspections were performed and samples were collected at the time of inspections during 2015 by the Department. Well operated plants complying with their SPDES Permit were inspected bi-annually and high risk plants were inspected quarterly. The facilities were grouped in color coded categories based upon their ownership, level of performance and physical conditions. The analysis reports of the samples collected by the Department staff along with the NYSDEC Discharge Monitoring Reports (DMR) were evaluated. TABLE I provides an account of the high risk facilities recorded by the department every year since 2011. Since 2012, the Department has been following the modified inspection program. The number of plants in the High Risk category in 2015 reduced about 32% compared to the previous year. Moreover, a gradual improvement in the overall performance level during the past five years can be seen on the table, substantiating the fact that the new risk based program and enhanced enforcement have been a success. Nine High Risk plants were moved to the Low Risk category during the year. TABLE I: Key Performance Indicators
2011 2012 2013 2014 2015
Number of High Risk Facilities
N/A 60 50 50 38
Total Nitrogen (All Tertiary STPs in Steady State) in mg/l
9.9 8.6 8.7 7.8 7.57
Percent of Tertiary STPs meeting NYS Discharge limits for Total Nitrogen (All Tertiary STPs in Steady State)
71.0% 79.6% 82.8% 85.0% 85.8%
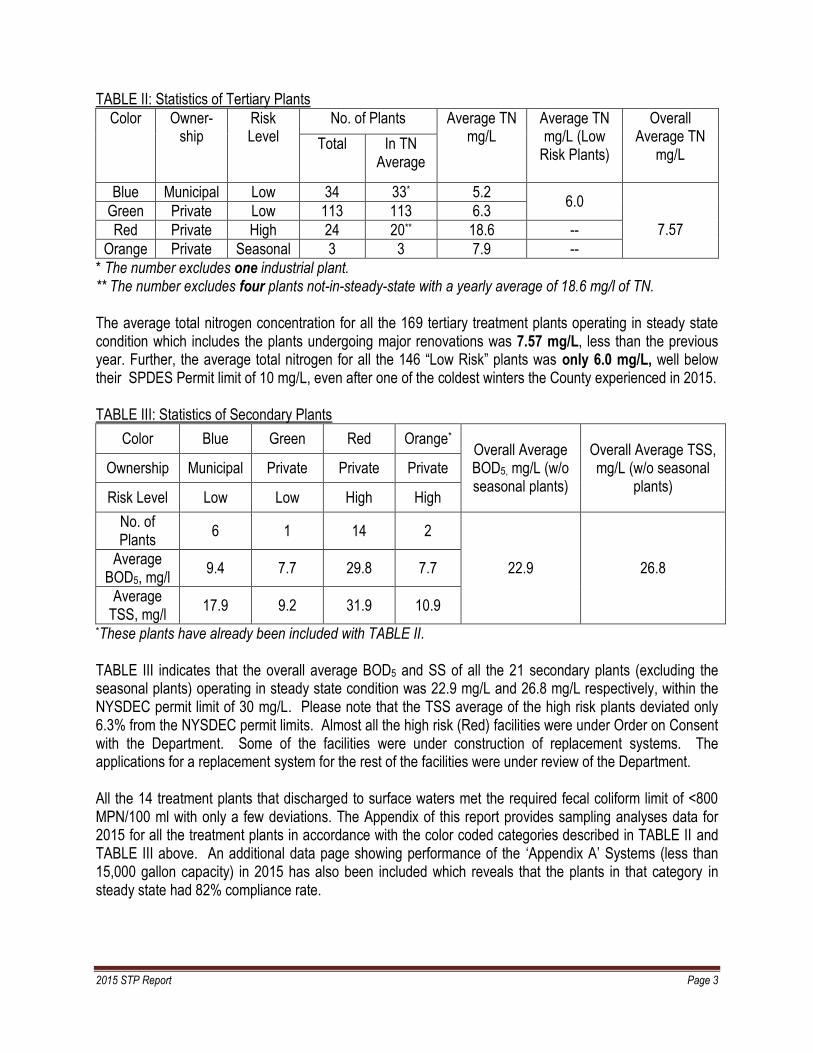
TABLE II and III represent the statistics of the facilities in accordance with their color coded categories as well as their performance. As it can be seen on both tables, the overall averages of the effluent parameters were well below the SPDES limits:
2015 STP Report Page 3
TABLE II: Statistics of Tertiary Plants
Color Owner-ship
Risk Level
No. of Plants Average TN mg/L
Average TN mg/L (Low
Risk Plants)
Overall Average TN
mg/L
Total In TN Average
Blue Municipal Low 34 33* 5.2 6.0
7.57
Green Private Low 113 113 6.3
Red Private High 24 20** 18.6 --
Orange Private Seasonal 3 3 7.9 --
* The number excludes one industrial plant. ** The number excludes four plants not-in-steady-state with a yearly average of 18.6 mg/l of TN. The average total nitrogen concentration for all the 169 tertiary treatment plants operating in steady state condition which includes the plants undergoing major renovations was 7.57 mg/L, less than the previous year. Further, the average total nitrogen for all the 146 “Low Risk” plants was only 6.0 mg/L, well below their SPDES Permit limit of 10 mg/L, even after one of the coldest winters the County experienced in 2015. TABLE III: Statistics of Secondary Plants
Color Blue Green Red Orange* Overall Average BOD5, mg/L (w/o seasonal plants)
Overall Average TSS, mg/L (w/o seasonal
plants) Ownership Municipal Private Private Private
Risk Level Low Low High High
No. of Plants
6 1 14 2
22.9
26.8
Average BOD5, mg/l
9.4 7.7 29.8 7.7
Average TSS, mg/l
17.9 9.2 31.9 10.9
*These plants have already been included with TABLE II. TABLE III indicates that the overall average BOD5 and SS of all the 21 secondary plants (excluding the seasonal plants) operating in steady state condition was 22.9 mg/L and 26.8 mg/L respectively, within the NYSDEC permit limit of 30 mg/L. Please note that the TSS average of the high risk plants deviated only 6.3% from the NYSDEC permit limits. Almost all the high risk (Red) facilities were under Order on Consent with the Department. Some of the facilities were under construction of replacement systems. The applications for a replacement system for the rest of the facilities were under review of the Department. All the 14 treatment plants that discharged to surface waters met the required fecal coliform limit of <800 MPN/100 ml with only a few deviations. The Appendix of this report provides sampling analyses data for 2015 for all the treatment plants in accordance with the color coded categories described in TABLE II and TABLE III above. An additional data page showing performance of the ‘Appendix A’ Systems (less than 15,000 gallon capacity) in 2015 has also been included which reveals that the plants in that category in steady state had 82% compliance rate.

2015 STP Report Page 4
STP Program Overview
Purpose The residents of Suffolk County rely upon groundwater for their drinking water needs. The groundwater is contained within a sole source aquifer that extends throughout Long Island. For this reason it is extremely important that the quality of the aquifer remain as pristine and pure as possible. Every effort must be made to prevent this natural resource from being polluted. Suffolk County has a population of approximately 1.5 million and much of the wastewater generated by this population is discharged back into the aquifer. One potential pollutant contained within the wastewater is nitrogen. The Suffolk County Sanitary Code limits building density throughout the region as one method of limiting the detrimental effects of nitrogen from human sources to our aquifer. Another method of limiting nitrogen is by mandating an on-site sewage treatment plant when a proposed project exceeds the allowable population density of the parcel selected for the project. Approximately 70 – 75% of the County’s population is served by conventional on-site sewage disposal systems consisting of septic tanks and leaching pools. The remaining 25 – 30% of the population is served by sewage treatment plants. In 2015 there were 195 STPs in operation in Suffolk County. Among those, 174 were tertiary plants (capable of removing nitrogen from the effluent stream to meet a discharge limit of 10 mg/l). 21 facilities were secondary plants (capable of reducing BOD5 and SS only to meet a discharge limit of 30 mg/L for each component in accordance with their SPDES Permit). Of the existing tertiary facilities, 4 plants were not in steady-state and one was an industrial plant, making the total number of tertiary plants 169 for consideration in the performance average. The Department requires installation of monitoring wells at each sewage treatment facility that discharges to groundwater in order to detect any impacts on the groundwater in the area by the discharge of the effluent. All 195 treatment plants had a discharge limitation range of 5.5 – 8.5 for pH. Furthermore, facilities that discharged to surface water were subjected to a total fecal coliform standard that varies upon location, but is generally within the range 200 – 800 MPN/100 ml. There were 14 facilities that discharged to surface waters and met the aforementioned coliform limitations. Program Aspects The Department’s Bureau of Sewage Treatment Plant is authorized by NYSDEC to issue SPDES Permits and regulate all the sewage treatment plants in the County. In 2015, the Department was tasked as a Responsible Management Entity to facilitate development and use of innovative/alternative onsite wastewater treatment systems (I/A OWTS). These systems are not classified as STP’s and are not subject to the State’s SPDES requirements. They are designed to treat sewage to below 19 mg/L TN. They will act as an environmental conservation and public health protection measure for properties which cannot be served by community sewer systems now or in the near future. Note that the status and progress of the County’s I/A OWTS program is included in an annual report that is separate from this STP report. The goal of the STP Program is to ensure that the overall annual rolling average of TN concentration of all the tertiary plants operating in Suffolk County is maintained at or below 10 mg/L and the overall annual rolling average for BOD5 and SS of all the tertiary and secondary plants remain at or below 30 mg/L and in strict compliance with their SPDES Permit requirements. A number of various activities were formulated in
2015 STP Report Page 5
order to achieve this goal and the mechanism has proven to be effective, as the annual reports of the last several years show gradual improvement and advancement towards the goal. These activities may be categorized as follows:
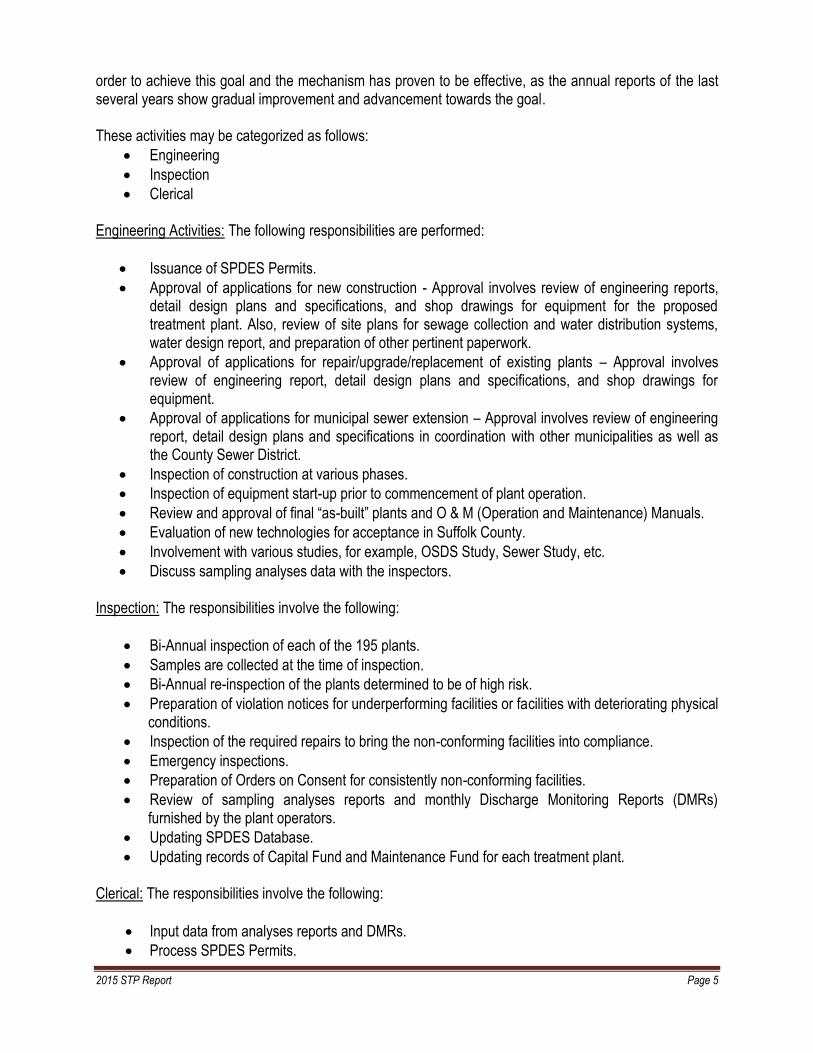
Engineering
Inspection
Clerical Engineering Activities: The following responsibilities are performed:
Issuance of SPDES Permits.
Approval of applications for new construction - Approval involves review of engineering reports, detail design plans and specifications, and shop drawings for equipment for the proposed treatment plant. Also, review of site plans for sewage collection and water distribution systems, water design report, and preparation of other pertinent paperwork.
Approval of applications for repair/upgrade/replacement of existing plants – Approval involves review of engineering report, detail design plans and specifications, and shop drawings for equipment.
Approval of applications for municipal sewer extension – Approval involves review of engineering report, detail design plans and specifications in coordination with other municipalities as well as the County Sewer District.
Inspection of construction at various phases.
Inspection of equipment start-up prior to commencement of plant operation.
Review and approval of final “as-built” plants and O & M (Operation and Maintenance) Manuals.
Evaluation of new technologies for acceptance in Suffolk County.
Involvement with various studies, for example, OSDS Study, Sewer Study, etc.
Discuss sampling analyses data with the inspectors. Inspection: The responsibilities involve the following:
Bi-Annual inspection of each of the 195 plants.
Samples are collected at the time of inspection.
Bi-Annual re-inspection of the plants determined to be of high risk.
Preparation of violation notices for underperforming facilities or facilities with deteriorating physical conditions.
Inspection of the required repairs to bring the non-conforming facilities into compliance.
Emergency inspections.
Preparation of Orders on Consent for consistently non-conforming facilities.
Review of sampling analyses reports and monthly Discharge Monitoring Reports (DMRs) furnished by the plant operators.
Updating SPDES Database.
Updating records of Capital Fund and Maintenance Fund for each treatment plant. Clerical: The responsibilities involve the following:
Input data from analyses reports and DMRs.
Process SPDES Permits.
2015 STP Report Page 6
Follow-up of violation notices sent by inspectors.
Keeping track of submission deadlines for facilities with Order on Consent.
Assisting inspectors in preparation and execution of Order on Consent.
Maintaining updated status of Letters of Credit.
STP Program Description
History
The STP Program was organized in 1998 in response to the NYSDEC Regulations that required all the existing facilities that were discharging sanitary wastewater in excess of 30,000 gallons per day to groundwater and new STPs to strictly comply with their nitrogen removal standards. The requirement caused proliferation of sewage treatment facilities in Suffolk County necessitating management and control of the performance of these facilities to protect the quality of groundwater from deterioration as most of the treatment plants discharged treated wastewater into the ground. The Department assigned two NYS certified wastewater treatment plant operators to work under the supervision of a NYS licensed engineer specialized in sewage treatment plant design and operation. A set of criteria was formulated based on experience and good engineering practice. The inspectors utilized these criteria to evaluate each STP’s performance and physical condition. The program commenced quarterly inspection of all the STPs.
In April 2008, a policy involving more stringent enforcement was enacted. The policy requires a legal action for any unsatisfactory conditions noted at a sewage treatment facility at the time of an inspection. This legal action involves monetary penalties for the first time violation and doubling the dollar amount for each repeated violation. Furthermore, the policy requires issuance of an Order on Consent (OOC) for any facility in need of a substantial upgrade involving considerable construction time and funds. The purpose of the OOC was to organize the required construction within a fixed time frame in order to bring a failing treatment facility into compliance without unnecessary delays.
Suffolk County receives partial reimbursement in the amount of $149,225 from the NYSDEC for inspection of the treatment plants per an existing contract between the Department and NYSDEC. The Department is responsible for inspecting all the 195 STPs, while only 156 private plants fall under the Department’s jurisdiction. The rest of the 39 plants are municipal and are regulated by NYSDEC under their jurisdiction.
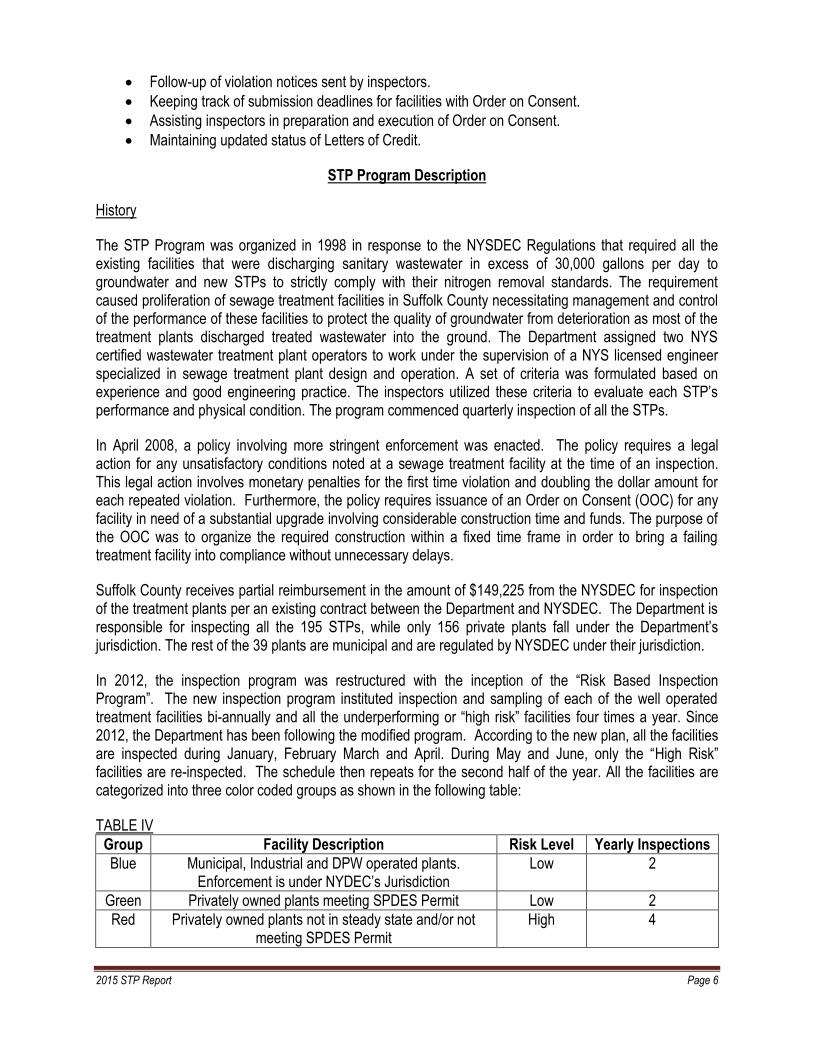
In 2012, the inspection program was restructured with the inception of the “Risk Based Inspection Program”. The new inspection program instituted inspection and sampling of each of the well operated treatment facilities bi-annually and all the underperforming or “high risk” facilities four times a year. Since 2012, the Department has been following the modified program. According to the new plan, all the facilities are inspected during January, February March and April. During May and June, only the “High Risk” facilities are re-inspected. The schedule then repeats for the second half of the year. All the facilities are categorized into three color coded groups as shown in the following table:
TABLE IV
Group Facility Description Risk Level Yearly Inspections
Blue Municipal, Industrial and DPW operated plants. Enforcement is under NYDEC’s Jurisdiction
Low 2
Green Privately owned plants meeting SPDES Permit Low 2
Red Privately owned plants not in steady state and/or not meeting SPDES Permit
High 4

2015 STP Report Page 7
The following table further categorizes the Red group based on the associated issues. Please note that the nomenclature for the “issue type” has been modified in this report. TABLE V
Issue Description
UPG Facility is currently under Order on Consent
VC Facility is currently under Voluntary Compliance Agreement
ETP Facility does not consistently comply with the conditions of its SPDES Permit
NISS Plant is not yet in steady state.
ICD DMR Data are inconsistent with SCDHS lab data
A reader must refer to the above table while going through the sample results for 2015 provided in the appendix. The Department receives monthly NYSDEC Discharge Monitoring Reports (DMR). The STP staff review the DMR data along with the analysis report of samples collected by the staff during inspection of the treatment facilities. Based on the evaluation of this data, the level of performance of each facility is determined. In order to keep all the facilities in strict compliance with their SPDES Permit requirements, since 2013, the Department has been formulating various methods for detecting the non-complying facilities and maintaining the time for the remedial work within a strict time frame in order to avoid unnecessary delays in resolving operational and/or equipment issues. In 2015, the Department in conjunction with NYSDEC started formulating some legal enhancements for convenience of tracking each facility’s status of performance as well as providing the facilities’ with more comprehensive compliance strategy which are clarified in the following paragraphs.
Enforcement Actions for Treatment Plants (ETP): The Department will evaluate all DMR reported values for exceedances. Based on the following criteria, if any exceedances are detected, the Department will issue a Notice of Violation to the owner of a treatment plant which may incur monetary penalties:
If the 6-month rolling average of total nitrogen (TN) exceeds 10 mg/L and/or 6-month rolling average of BOD or Total Suspended Solids (TSS) exceeds 30 mg/L.
If the TN, BOD or TSS exceedance is 40% more than the permit limit (i.e., more than 14 mg/L for TN and more than 42 mg/L for BOD or TSS) for more than once, within two consecutive quarters.
If TN, BOD or TSS exceeds the permit limit on four or more occasions within two consecutive quarters.
A fineable event will result in a $2,000 fine which will be posted as a Commissioner’s Order to rectify. Repeat violations within 2 consecutive review quarters will carry a doubled fine ($4,000). Only one fine for a SPDES violation can be levied in any given month. This enhanced program has three means of emphasizing importance of taking corrective actions immediately when a treatment plant experiences structural and operational issues:
Fines can be reissued on a monthly basis. Fines will escalate for chronic violators. Violation notices will be written for cases with one violation, or multiple marginal violations.

2015 STP Report Page 8
“Not-in-Steady State” (NISS) STPs: A newly constructed STP normally requires 3 to 6 months of operation to achieve “steady state” condition when biological microorganism communities are sufficiently cultivated and acclimated to facilitate proper wastewater treatment. A minimum flow threshold (typically 50% of design) is necessary to achieve this condition and a facility is labeled as “Not-in-Steady-State” (NISS) until this condition is achieved. It is expected that a facility will not be in compliance with its SPDES Permit limits until it attains the steady state conditions. In order to avoid enforcement actions and unnecessarily protracted NISS periods, SCDHS has formalized a policy (Guidance Memorandum No. 33) in cooperation with NYSDEC for NISS plants. According to the aforementioned policy, special permit conditions will apply to NISS plants to avoid unacceptable impacts. Further, STPs will no longer be considered NISS, if any of the following criteria is met:
If the average daily discharge to a plant exceeds 50% of the design flow, If the effluent parameters do not exceed a plant’s SPDES permit limits, or, If a 3-year period has passed after an application received an approval for construction, unless, the
approval was extended once on showing good cause.
A new permit will be reissued as soon as a plant achieves steady state condition. STPs on Order on Consent: When an existing facility requires a major upgrade or a replacement, the Department requires the owner of the facility to file an Order on Consent (OOC) with the Department. The primary objective of an OOC is to strategically organize the construction work in order to complete every task in a timely manner and maintain a constricted time frame to avoid unnecessary delays in the construction. Depending on the site conditions, the daily operations at the existing facility may be affected by the construction and may result in a non-compliance with the facility’s SPDES Permit. In order to avoid continuous permit violations during the construction, SCDHS in consultation with NYSDEC formalized a method, whereby, interim limits for the effluent parameters would be indicated on the OOC on a case-by-case basis pursuant to a review of the upgrade/replacement design plans by SCDHS. The interim limits will no longer be valid upon successful operation of the refurbished/replaced plant for three (3) months after completion of construction and the plant will revert to its original SPDES Permit. In order to handle all the paperwork associated with the inspections more effectively and efficiently, the Department generates inspection follow up letters that outline any specific deficiencies noted during inspections. Several need-based form letters were composed between 2013 and 2015 in order to streamline this process, making it a simple and less time consuming task for Department staff. The Department has been using these form letters to inform STP owners of the outcome of every routine inspection. If any deficiencies are detected, a time frame is specified in the letter requiring the owner to rectify the issues in a timely manner. The repairs required are tracked by the STP inspectors and under the Department’s “Zero Tolerance Policy”, legal actions are generated if not corrected in a timely manner. This may incur monetary penalties against the owner of a sewage treatment and/or industrial facility. A new full time assistant engineer was employed in 2015 for handling the work load so that review of applications can be performed in a timelier manner. The Suffolk County STP Notification Law enacted in June, 2013, has proven to be extremely helpful in tracking incidents involving discharge of untreated or partially treated wastewater into the ground and/or wastewater overflow that occurred at a treatment facility. The notification law was formulated to provide all the necessary information such as amount of discharge, type of sewage (treated, untreated, or partially
2015 STP Report Page 9
treated), date, time, etc. The law enables the Department and NYSDEC to ensure that proper clean up and corrective measures were implemented as promptly as practical, minimizing contamination of the surrounding area of the site where the incident took place. New Initiatives 2016 In order to handle the paper trail associated with effective operation of the SPDES Program, the Department will continue to modify its SPDES database to enable automatic generation of inspection follow-up letters, notifications, legal paperwork, etc. This will also alleviate some of the clerical work load.
Sample Results for 2015
Effluent data from all the STPs in Suffolk County are evaluated to determine compliance with their SPDES permit conditions. Tertiary plants that discharge to groundwater are subjected to limitations for TN, BOD5, SS, and pH. Secondary plants discharging to groundwater have limitations for BOD5, SS and pH. The plants that discharge to surface water are subjected to an additional limitation for Fecal Coliform. It must be noted that some plants have, within their SPDES Permits, varying limitations for BOD and SS depending on different calculated averages - 7 day, 30 day or 6 hr. Likewise some tertiary plants have varying limits for total nitrogen depending on calculated averages - 7 day, 30 day and pounds of nitrogen. For the Department’s enforcement work, 30 day monthly average of BOD, SS and nitrogen is used. Table VI lists the aforementioned parameters and the corresponding limits: TABLE VI
Parameter TN BOD5 SS Fecal Coliform pH
Limit/Range 10 mg/L 30 mg/L 30 mg/L 800 MPN/100 ml 5.5 to 8.5 S.U.
In 2015, all of the active plants in Suffolk County were inspected and sampled a minimum of 2 times in a 12 month period. 50 plants which were considered to be high risk at the end of 2014 were inspected 3 or 4 times in 2015. Additionally, some low risk STPs were re-inspected based on deficiencies during previous inspection and/or inconsistencies between DMR data and the data from analysis of samples collected by the Department during routine inspections. A total of 478 inspections were performed and over 2000 sample parameters were analyzed. The parameters included total nitrogen, BOD5, SS, total and fecal coliform and pH. All of the samples collected for analysis by the Department staff were grab samples. Samples analyzed for DMR were collected by the treatment plant representatives. All the samples were collected prior to discharging into the groundwater or surface water. As indicated previously, there were some treatment facilities that had influent flow well below their permitted flow. This was due to the low occupancy of the communities they served and hence a low daily discharge into their systems causing difficulty in meeting their SPDES discharge standards. The Department classified these plants as NISS. The results are displayed in Appendix A. Equipment failure at any facility and/or operational transients can negatively affect the reported numbers by skewing the average higher. While reviewing the averages it must be kept in mind that Suffolk County never eliminates transients from their calculations. The following table shows average effluent data for the color coded categories for 2015 under the “Risk Based Inspection Program”:
2015 STP Report Page 10
TABLE VII
Effluent Parameter
Limit (mg/L)
Blue (Municipal, Low
Risk) (mg/L)
Green (Private, Low Risk) (mg/L)
Red (All High Risk)
(mg/L)
Orange (Seasonal, High
Risk) (mg/L)
Average (mg/L)
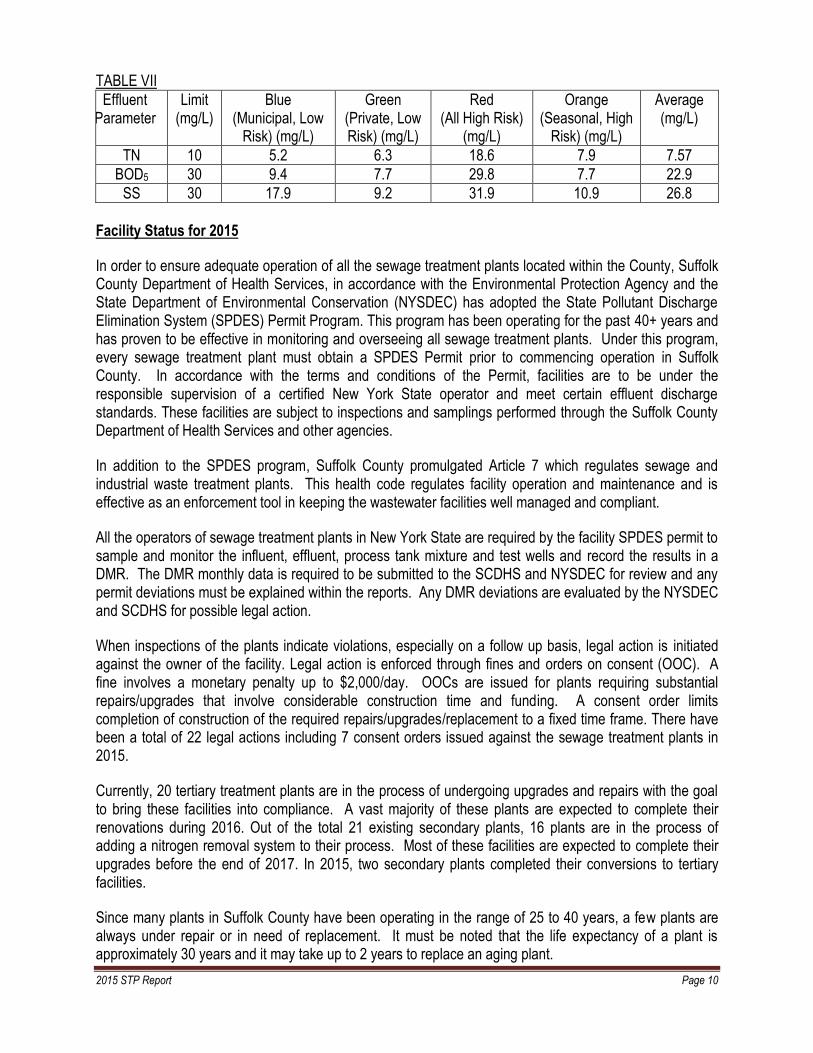
TN 10 5.2 6.3 18.6 7.9 7.57
BOD5 30 9.4 7.7 29.8 7.7 22.9
SS 30 17.9 9.2 31.9 10.9 26.8
Facility Status for 2015
In order to ensure adequate operation of all the sewage treatment plants located within the County, Suffolk County Department of Health Services, in accordance with the Environmental Protection Agency and the State Department of Environmental Conservation (NYSDEC) has adopted the State Pollutant Discharge Elimination System (SPDES) Permit Program. This program has been operating for the past 40+ years and has proven to be effective in monitoring and overseeing all sewage treatment plants. Under this program, every sewage treatment plant must obtain a SPDES Permit prior to commencing operation in Suffolk County. In accordance with the terms and conditions of the Permit, facilities are to be under the responsible supervision of a certified New York State operator and meet certain effluent discharge standards. These facilities are subject to inspections and samplings performed through the Suffolk County Department of Health Services and other agencies.
In addition to the SPDES program, Suffolk County promulgated Article 7 which regulates sewage and industrial waste treatment plants. This health code regulates facility operation and maintenance and is effective as an enforcement tool in keeping the wastewater facilities well managed and compliant.
All the operators of sewage treatment plants in New York State are required by the facility SPDES permit to sample and monitor the influent, effluent, process tank mixture and test wells and record the results in a DMR. The DMR monthly data is required to be submitted to the SCDHS and NYSDEC for review and any permit deviations must be explained within the reports. Any DMR deviations are evaluated by the NYSDEC and SCDHS for possible legal action.
When inspections of the plants indicate violations, especially on a follow up basis, legal action is initiated against the owner of the facility. Legal action is enforced through fines and orders on consent (OOC). A fine involves a monetary penalty up to $2,000/day. OOCs are issued for plants requiring substantial repairs/upgrades that involve considerable construction time and funding. A consent order limits completion of construction of the required repairs/upgrades/replacement to a fixed time frame. There have been a total of 22 legal actions including 7 consent orders issued against the sewage treatment plants in 2015.
Currently, 20 tertiary treatment plants are in the process of undergoing upgrades and repairs with the goal to bring these facilities into compliance. A vast majority of these plants are expected to complete their renovations during 2016. Out of the total 21 existing secondary plants, 16 plants are in the process of adding a nitrogen removal system to their process. Most of these facilities are expected to complete their upgrades before the end of 2017. In 2015, two secondary plants completed their conversions to tertiary facilities.
Since many plants in Suffolk County have been operating in the range of 25 to 40 years, a few plants are always under repair or in need of replacement. It must be noted that the life expectancy of a plant is approximately 30 years and it may take up to 2 years to replace an aging plant.
2015 STP Report Page 11
Conclusion
During 2015 the Office of Wastewater Management executed 478 inspections and sampled the effluent leaving the 195 STPs in the County during each of these inspections. Along with the corresponding data from these sampling events, data that were reported on New York State Department of Environmental Conservation (NYSDEC) Discharge Monitoring Reports (DMR) were analyzed. The average Total Nitrogen of all the 146 year-round Low Risk tertiary facilities was 6.0 mg/l, slightly above 2014’s average because of one of the coldest winters on record in 2015; however, the average Total Nitrogen for all the 169 tertiary plants including the “high risk” plants in steady state was 7.57 mg/l which is slightly below the 2014 average. Based on the evaluation of the data it can be said that the technologies currently utilized in Suffolk County have the potentiality of effectively treating wastewater and thereby, protecting the County’s aquifer.
It is important to note that regulations limiting nitrogen loading from sewage treatment plants are more restrictive than those permitted for as-of-right developments following the requirements of Article 6 of the Suffolk County Sanitary Code. Therefore, sewage treatment plants that serve communities in Suffolk County typically contribute less nitrogen loading per housing unit to groundwater than does a residential unit served by a conventional sewage disposal system. The Department has noticed that even when “high risk” plants were undergoing major repairs, in most cases, they typically discharged total nitrogen of less than 19 mg/l in the effluent which is the maximum limit established for Innovative/Alternative System currently being studied by the Department. The Department’s requirements for redundancy in the STP designs made it possible to keep their treatment processes active during construction, although with lesser efficiency, and thereby, keeping the TN overages as low as practical. Therefore, treatment plants are more effective in protecting the drinking water of Suffolk County. The plants that are required to provide secondary treatment are performing equally well. Sampling has shown that the overall effluent concentrations for BOD5 averaged 22.9 mg/L and suspended solids averaged 26.8 mg/L for all the secondary plants; again, a miniscule increment over 2014 averages because of the harsh winter in 2015, but below the discharge limits. The discharge limit for suspended solids and for BOD5 is 30 mg/L. In addition, all the 14 treatment plants that discharge to surface waters met the required fecal coliform effluent guideline of <800 MPN/100 ml with only a few excursions.
The plants utilizing newer technologies such as SBR, modular aeration, BESST, and MBR have been showing steady performance and increased efficiency in treating wastewater compared to the older denitrification plants. As the older denitrification plants are upgraded, it is expected that the overall effluent results will show noticeable improvement of the current numbers.
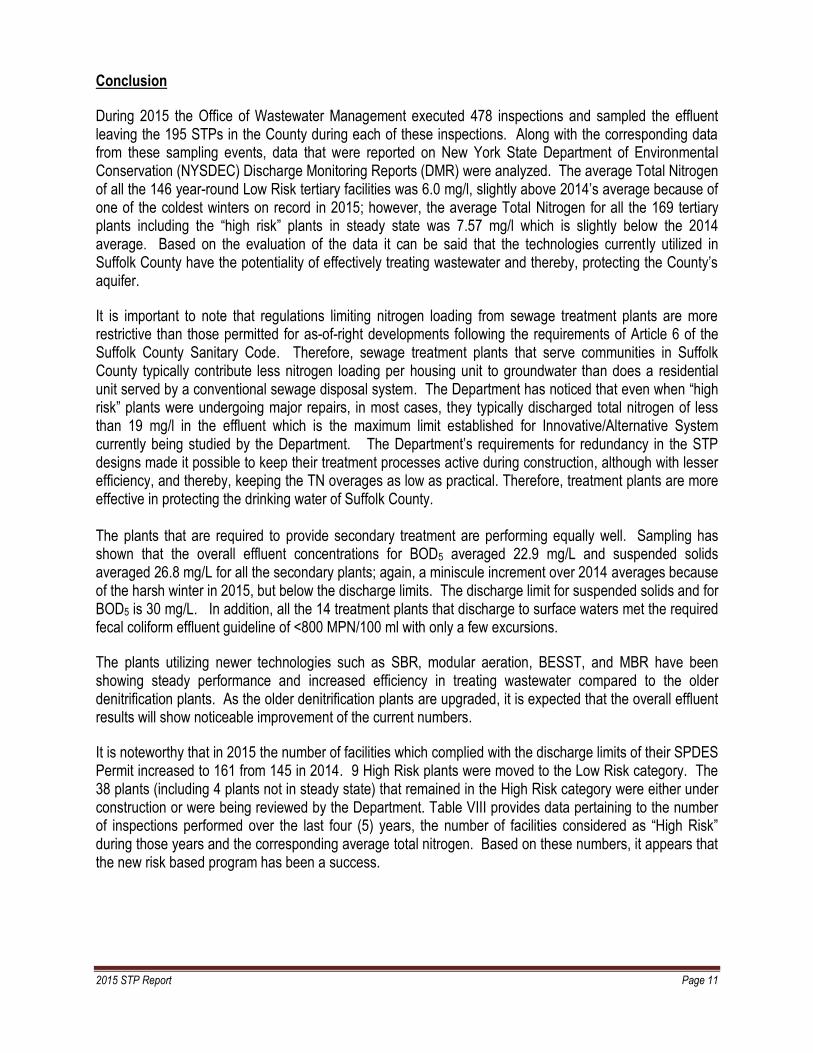
It is noteworthy that in 2015 the number of facilities which complied with the discharge limits of their SPDES Permit increased to 161 from 145 in 2014. 9 High Risk plants were moved to the Low Risk category. The 38 plants (including 4 plants not in steady state) that remained in the High Risk category were either under construction or were being reviewed by the Department. Table VIII provides data pertaining to the number of inspections performed over the last four (5) years, the number of facilities considered as “High Risk” during those years and the corresponding average total nitrogen. Based on these numbers, it appears that the new risk based program has been a success.
2015 STP Report Page 12
TABLE VIII
2011 2012 2013 2014 2015
Inspections Required
768 (Quarterly) 633 (new
program as of July 2012)
495 (fully implemented
program)
496 (fully implemented
program)
478 (fully implemented
Program)
Inspections Performed
768 633 495 496 478
Number of High Risk Facilities
N/A 60 50 50 38
Average TN in mg/l 9.9 8.6 8.7 7.8 7.57
TABLE VIII substantiates that under the enhanced enforcement program, the performances of the plants are improving steadily and the plants’ owners are cooperating in successfully operating their facilities as the number of high risk plants reduced considerably since 2012, almost 37%. From the data, it is apparent that when treatment plants are operated and maintained properly, they can generate effluent quality below drinking water standards. Overall, these results show that the surface waters and the groundwater of Suffolk County are receiving treatment plant discharges that are well processed and mostly meeting effluent limitations. The effluent total nitrogen data reveal that the overall average of 2015’s effluent samples improved slightly from that of the previous year’s irrespective of the unusually cold winter conditions in 2015, but the list of low risk plant grew considerably. It is important to note here, that the outside plants in Suffolk County are designed for an ambient temperature of 10◦C and the enclosed plants for 15◦C. Therefore, an ambient temperature in the single digit for several days at a stretch, which was the case in 2015, negatively affected the plants’ performances significantly resulting in overages in effluent total nitrogen even for the plants that are otherwise always well below the permitted limits. Therefore, the overall steady and improved performance was due to the Department’s thorough and routine inspections, follow-up inspection letters and enhanced enforcement program predicated on plants’ level of performance, physical and operating conditions of plants’ equipment, and facility maintenance. It is anticipated that the Department’s wastewater management program and policies will continue to keep the facilities’ upkeep and operating conditions at the desired level so that the Department’s goal of achieving overall total nitrogen in the range of 5 to 6 mg/l will be reached in the coming year.
Appendix
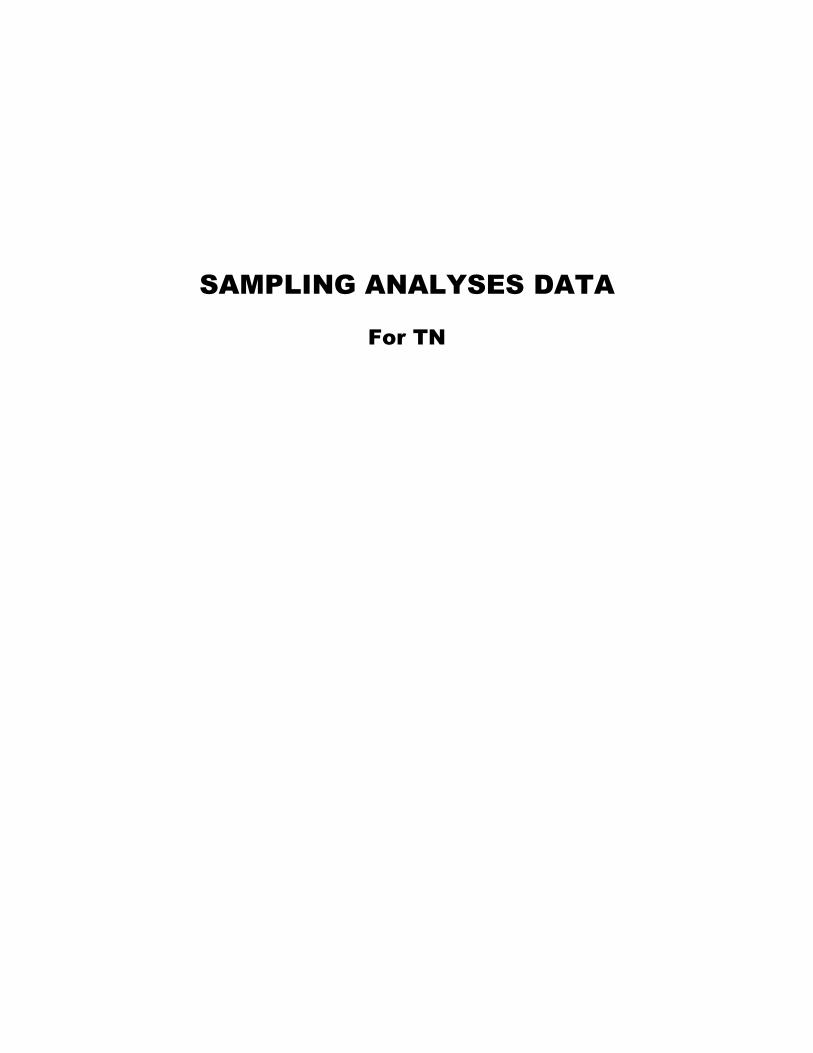
SAMPLING ANALYSES DATA
For TN
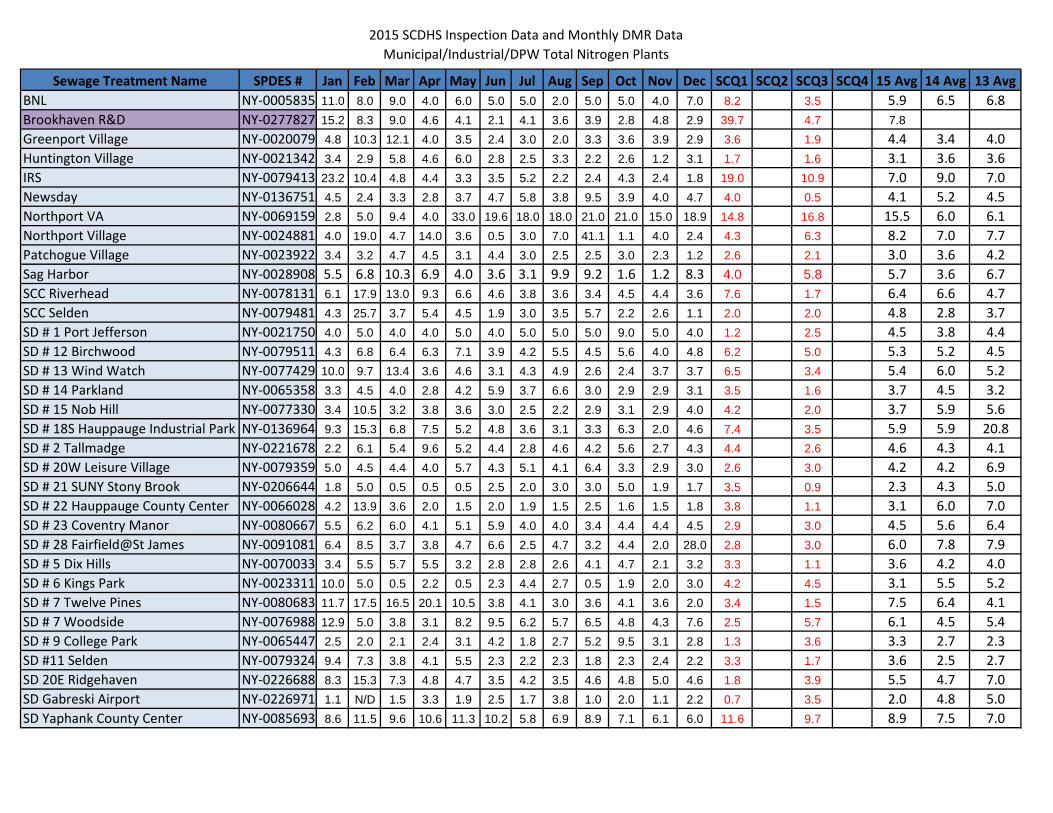
2015 SCDHS Inspection Data and Monthly DMR DataMunicipal/Industrial/DPW Total Nitrogen Plants
Sewage Treatment Name SPDES # Jan Feb Mar Apr May Jun Jul Aug Sep Oct Nov Dec SCQ1 SCQ2 SCQ3 SCQ4 15 Avg 14 Avg 13 AvgBNL NY-0005835 11.0 8.0 9.0 4.0 6.0 5.0 5.0 2.0 5.0 5.0 4.0 7.0 8.2 3.5 5.9 6.5 6.8Brookhaven R&D NY-0277827 15.2 8.3 9.0 4.6 4.1 2.1 4.1 3.6 3.9 2.8 4.8 2.9 39.7 4.7 7.8Greenport Village NY-0020079 4.8 10.3 12.1 4.0 3.5 2.4 3.0 2.0 3.3 3.6 3.9 2.9 3.6 1.9 4.4 3.4 4.0Huntington Village NY-0021342 3.4 2.9 5.8 4.6 6.0 2.8 2.5 3.3 2.2 2.6 1.2 3.1 1.7 1.6 3.1 3.6 3.6IRS NY-0079413 23.2 10.4 4.8 4.4 3.3 3.5 5.2 2.2 2.4 4.3 2.4 1.8 19.0 10.9 7.0 9.0 7.0Newsday NY-0136751 4.5 2.4 3.3 2.8 3.7 4.7 5.8 3.8 9.5 3.9 4.0 4.7 4.0 0.5 4.1 5.2 4.5Northport VA NY-0069159 2.8 5.0 9.4 4.0 33.0 19.6 18.0 18.0 21.0 21.0 15.0 18.9 14.8 16.8 15.5 6.0 6.1Northport Village NY-0024881 4.0 19.0 4.7 14.0 3.6 0.5 3.0 7.0 41.1 1.1 4.0 2.4 4.3 6.3 8.2 7.0 7.7Patchogue Village NY-0023922 3.4 3.2 4.7 4.5 3.1 4.4 3.0 2.5 2.5 3.0 2.3 1.2 2.6 2.1 3.0 3.6 4.2Sag Harbor NY-0028908 5.5 6.8 10.3 6.9 4.0 3.6 3.1 9.9 9.2 1.6 1.2 8.3 4.0 5.8 5.7 3.6 6.7SCC Riverhead NY-0078131 6.1 17.9 13.0 9.3 6.6 4.6 3.8 3.6 3.4 4.5 4.4 3.6 7.6 1.7 6.4 6.6 4.7SCC Selden NY-0079481 4.3 25.7 3.7 5.4 4.5 1.9 3.0 3.5 5.7 2.2 2.6 1.1 2.0 2.0 4.8 2.8 3.7SD # 1 Port Jefferson NY-0021750 4.0 5.0 4.0 4.0 5.0 4.0 5.0 5.0 5.0 9.0 5.0 4.0 1.2 2.5 4.5 3.8 4.4SD # 12 Birchwood NY-0079511 4.3 6.8 6.4 6.3 7.1 3.9 4.2 5.5 4.5 5.6 4.0 4.8 6.2 5.0 5.3 5.2 4.5SD # 13 Wind Watch NY-0077429 10.0 9.7 13.4 3.6 4.6 3.1 4.3 4.9 2.6 2.4 3.7 3.7 6.5 3.4 5.4 6.0 5.2SD # 14 Parkland NY-0065358 3.3 4.5 4.0 2.8 4.2 5.9 3.7 6.6 3.0 2.9 2.9 3.1 3.5 1.6 3.7 4.5 3.2SD # 15 Nob Hill NY-0077330 3.4 10.5 3.2 3.8 3.6 3.0 2.5 2.2 2.9 3.1 2.9 4.0 4.2 2.0 3.7 5.9 5.6SD # 18S Hauppauge Industrial Park NY-0136964 9.3 15.3 6.8 7.5 5.2 4.8 3.6 3.1 3.3 6.3 2.0 4.6 7.4 3.5 5.9 5.9 20.8SD # 2 Tallmadge NY-0221678 2.2 6.1 5.4 9.6 5.2 4.4 2.8 4.6 4.2 5.6 2.7 4.3 4.4 2.6 4.6 4.3 4.1SD # 20W Leisure Village NY-0079359 5.0 4.5 4.4 4.0 5.7 4.3 5.1 4.1 6.4 3.3 2.9 3.0 2.6 3.0 4.2 4.2 6.9SD # 21 SUNY Stony Brook NY-0206644 1.8 5.0 0.5 0.5 0.5 2.5 2.0 3.0 3.0 5.0 1.9 1.7 3.5 0.9 2.3 4.3 5.0SD # 22 Hauppauge County Center NY-0066028 4.2 13.9 3.6 2.0 1.5 2.0 1.9 1.5 2.5 1.6 1.5 1.8 3.8 1.1 3.1 6.0 7.0SD # 23 Coventry Manor NY-0080667 5.5 6.2 6.0 4.1 5.1 5.9 4.0 4.0 3.4 4.4 4.4 4.5 2.9 3.0 4.5 5.6 6.4SD # 28 Fairfield@St James NY-0091081 6.4 8.5 3.7 3.8 4.7 6.6 2.5 4.7 3.2 4.4 2.0 28.0 2.8 3.0 6.0 7.8 7.9SD # 5 Dix Hills NY-0070033 3.4 5.5 5.7 5.5 3.2 2.8 2.8 2.6 4.1 4.7 2.1 3.2 3.3 1.1 3.6 4.2 4.0SD # 6 Kings Park NY-0023311 10.0 5.0 0.5 2.2 0.5 2.3 4.4 2.7 0.5 1.9 2.0 3.0 4.2 4.5 3.1 5.5 5.2SD # 7 Twelve Pines NY-0080683 11.7 17.5 16.5 20.1 10.5 3.8 4.1 3.0 3.6 4.1 3.6 2.0 3.4 1.5 7.5 6.4 4.1SD # 7 Woodside NY-0076988 12.9 5.0 3.8 3.1 8.2 9.5 6.2 5.7 6.5 4.8 4.3 7.6 2.5 5.7 6.1 4.5 5.4SD # 9 College Park NY-0065447 2.5 2.0 2.1 2.4 3.1 4.2 1.8 2.7 5.2 9.5 3.1 2.8 1.3 3.6 3.3 2.7 2.3SD #11 Selden NY-0079324 9.4 7.3 3.8 4.1 5.5 2.3 2.2 2.3 1.8 2.3 2.4 2.2 3.3 1.7 3.6 2.5 2.7SD 20E Ridgehaven NY-0226688 8.3 15.3 7.3 4.8 4.7 3.5 4.2 3.5 4.6 4.8 5.0 4.6 1.8 3.9 5.5 4.7 7.0SD Gabreski Airport NY-0226971 1.1 N/D 1.5 3.3 1.9 2.5 1.7 3.8 1.0 2.0 1.1 2.2 0.7 3.5 2.0 4.8 5.0SD Yaphank County Center NY-0085693 8.6 11.5 9.6 10.6 11.3 10.2 5.8 6.9 8.9 7.1 6.1 6.0 11.6 9.7 8.9 7.5 7.0
2015 SCDHS Inspection Data and Monthly DMR DataMunicipal/Industrial/DPW Total Nitrogen Plants
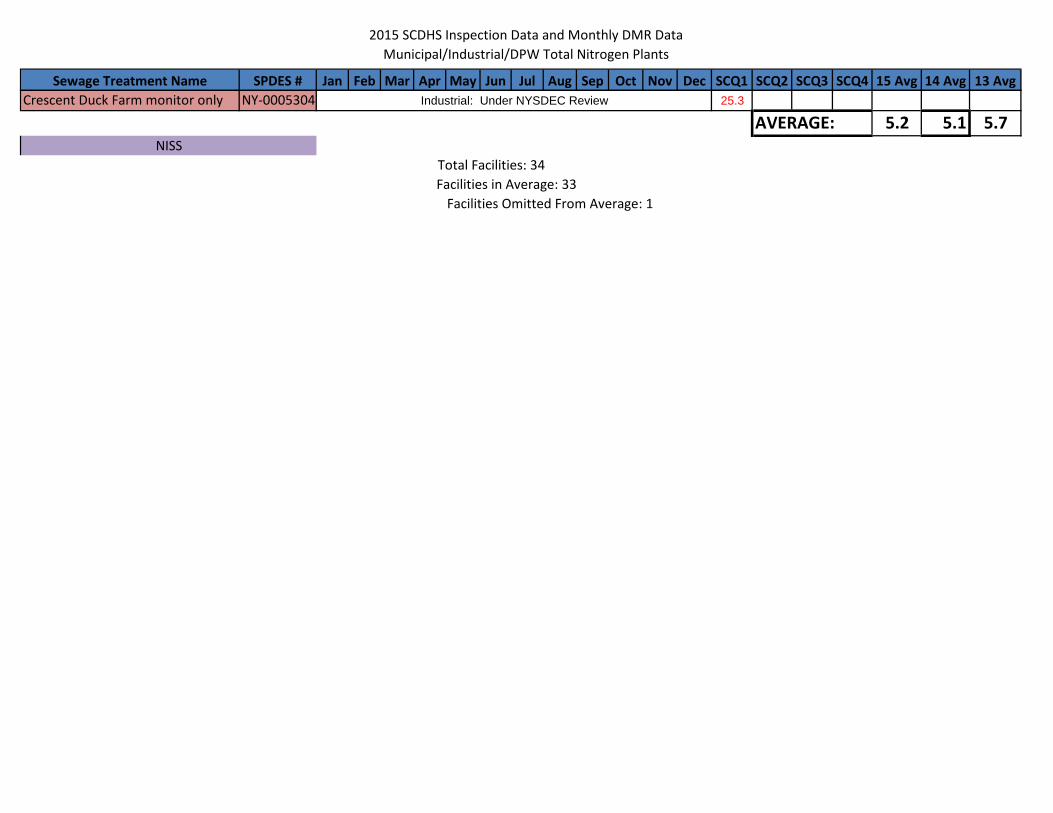
Sewage Treatment Name SPDES # Jan Feb Mar Apr May Jun Jul Aug Sep Oct Nov Dec SCQ1 SCQ2 SCQ3 SCQ4 15 Avg 14 Avg 13 AvgCrescent Duck Farm monitor only NY-0005304 25.3
AVERAGE: 5.2 5.1 5.7
Total Facilities: 34 Facilities in Average: 33
Facilities Omitted From Average: 1
Industrial: Under NYSDEC Review
NISS
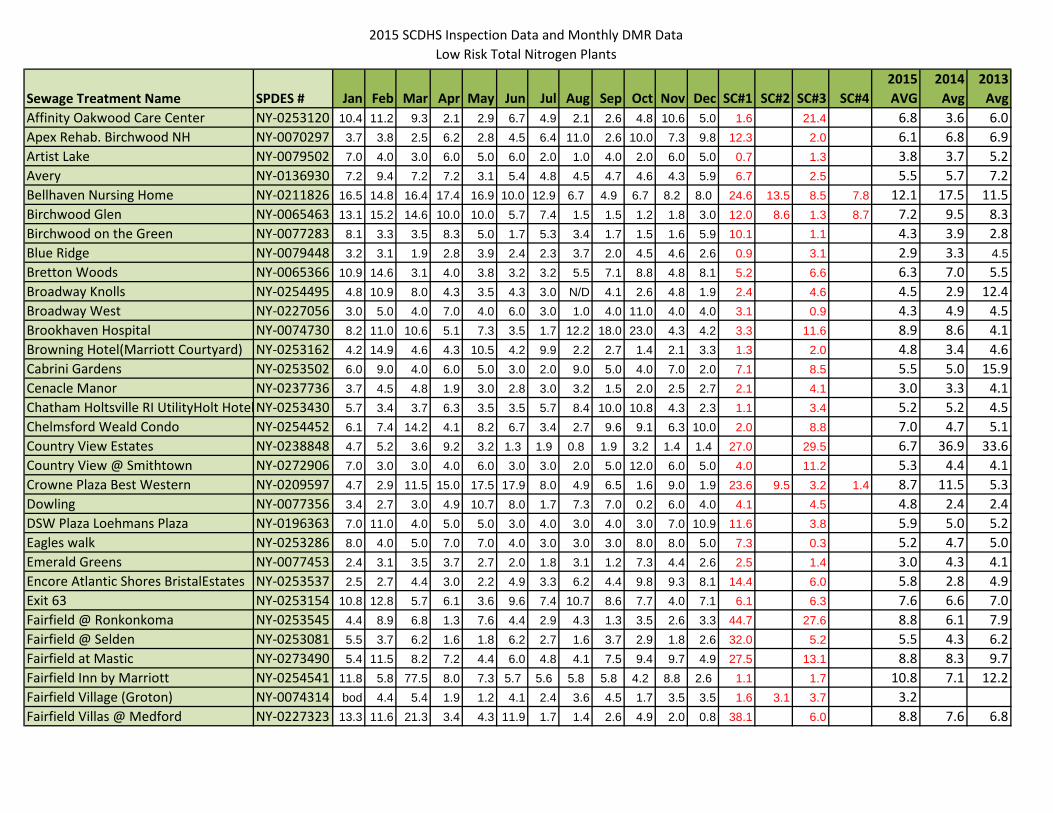
2015 SCDHS Inspection Data and Monthly DMR Data Low Risk Total Nitrogen Plants
Sewage Treatment Name SPDES # Jan Feb Mar Apr May Jun Jul Aug Sep Oct Nov Dec SC#1 SC#2 SC#3 SC#42015 AVG
2014 Avg
2013 Avg
Affinity Oakwood Care Center NY-0253120 10.4 11.2 9.3 2.1 2.9 6.7 4.9 2.1 2.6 4.8 10.6 5.0 1.6 21.4 6.8 3.6 6.0Apex Rehab. Birchwood NH NY-0070297 3.7 3.8 2.5 6.2 2.8 4.5 6.4 11.0 2.6 10.0 7.3 9.8 12.3 2.0 6.1 6.8 6.9Artist Lake NY-0079502 7.0 4.0 3.0 6.0 5.0 6.0 2.0 1.0 4.0 2.0 6.0 5.0 0.7 1.3 3.8 3.7 5.2Avery NY-0136930 7.2 9.4 7.2 7.2 3.1 5.4 4.8 4.5 4.7 4.6 4.3 5.9 6.7 2.5 5.5 5.7 7.2Bellhaven Nursing Home NY-0211826 16.5 14.8 16.4 17.4 16.9 10.0 12.9 6.7 4.9 6.7 8.2 8.0 24.6 13.5 8.5 7.8 12.1 17.5 11.5Birchwood Glen NY-0065463 13.1 15.2 14.6 10.0 10.0 5.7 7.4 1.5 1.5 1.2 1.8 3.0 12.0 8.6 1.3 8.7 7.2 9.5 8.3Birchwood on the Green NY-0077283 8.1 3.3 3.5 8.3 5.0 1.7 5.3 3.4 1.7 1.5 1.6 5.9 10.1 1.1 4.3 3.9 2.8Blue Ridge NY-0079448 3.2 3.1 1.9 2.8 3.9 2.4 2.3 3.7 2.0 4.5 4.6 2.6 0.9 3.1 2.9 3.3 4.5Bretton Woods NY-0065366 10.9 14.6 3.1 4.0 3.8 3.2 3.2 5.5 7.1 8.8 4.8 8.1 5.2 6.6 6.3 7.0 5.5Broadway Knolls NY-0254495 4.8 10.9 8.0 4.3 3.5 4.3 3.0 N/D 4.1 2.6 4.8 1.9 2.4 4.6 4.5 2.9 12.4Broadway West NY-0227056 3.0 5.0 4.0 7.0 4.0 6.0 3.0 1.0 4.0 11.0 4.0 4.0 3.1 0.9 4.3 4.9 4.5Brookhaven Hospital NY-0074730 8.2 11.0 10.6 5.1 7.3 3.5 1.7 12.2 18.0 23.0 4.3 4.2 3.3 11.6 8.9 8.6 4.1Browning Hotel(Marriott Courtyard) NY-0253162 4.2 14.9 4.6 4.3 10.5 4.2 9.9 2.2 2.7 1.4 2.1 3.3 1.3 2.0 4.8 3.4 4.6Cabrini Gardens NY-0253502 6.0 9.0 4.0 6.0 5.0 3.0 2.0 9.0 5.0 4.0 7.0 2.0 7.1 8.5 5.5 5.0 15.9Cenacle Manor NY-0237736 3.7 4.5 4.8 1.9 3.0 2.8 3.0 3.2 1.5 2.0 2.5 2.7 2.1 4.1 3.0 3.3 4.1Chatham Holtsville RI UtilityHolt HotelNY-0253430 5.7 3.4 3.7 6.3 3.5 3.5 5.7 8.4 10.0 10.8 4.3 2.3 1.1 3.4 5.2 5.2 4.5Chelmsford Weald Condo NY-0254452 6.1 7.4 14.2 4.1 8.2 6.7 3.4 2.7 9.6 9.1 6.3 10.0 2.0 8.8 7.0 4.7 5.1Country View Estates NY-0238848 4.7 5.2 3.6 9.2 3.2 1.3 1.9 0.8 1.9 3.2 1.4 1.4 27.0 29.5 6.7 36.9 33.6Country View @ Smithtown NY-0272906 7.0 3.0 3.0 4.0 6.0 3.0 3.0 2.0 5.0 12.0 6.0 5.0 4.0 11.2 5.3 4.4 4.1Crowne Plaza Best Western NY-0209597 4.7 2.9 11.5 15.0 17.5 17.9 8.0 4.9 6.5 1.6 9.0 1.9 23.6 9.5 3.2 1.4 8.7 11.5 5.3Dowling NY-0077356 3.4 2.7 3.0 4.9 10.7 8.0 1.7 7.3 7.0 0.2 6.0 4.0 4.1 4.5 4.8 2.4 2.4DSW Plaza Loehmans Plaza NY-0196363 7.0 11.0 4.0 5.0 5.0 3.0 4.0 3.0 4.0 3.0 7.0 10.9 11.6 3.8 5.9 5.0 5.2Eagles walk NY-0253286 8.0 4.0 5.0 7.0 7.0 4.0 3.0 3.0 3.0 8.0 8.0 5.0 7.3 0.3 5.2 4.7 5.0Emerald Greens NY-0077453 2.4 3.1 3.5 3.7 2.7 2.0 1.8 3.1 1.2 7.3 4.4 2.6 2.5 1.4 3.0 4.3 4.1Encore Atlantic Shores BristalEstates NY-0253537 2.5 2.7 4.4 3.0 2.2 4.9 3.3 6.2 4.4 9.8 9.3 8.1 14.4 6.0 5.8 2.8 4.9Exit 63 NY-0253154 10.8 12.8 5.7 6.1 3.6 9.6 7.4 10.7 8.6 7.7 4.0 7.1 6.1 6.3 7.6 6.6 7.0Fairfield @ Ronkonkoma NY-0253545 4.4 8.9 6.8 1.3 7.6 4.4 2.9 4.3 1.3 3.5 2.6 3.3 44.7 27.6 8.8 6.1 7.9Fairfield @ Selden NY-0253081 5.5 3.7 6.2 1.6 1.8 6.2 2.7 1.6 3.7 2.9 1.8 2.6 32.0 5.2 5.5 4.3 6.2Fairfield at Mastic NY-0273490 5.4 11.5 8.2 7.2 4.4 6.0 4.8 4.1 7.5 9.4 9.7 4.9 27.5 13.1 8.8 8.3 9.7Fairfield Inn by Marriott NY-0254541 11.8 5.8 77.5 8.0 7.3 5.7 5.6 5.8 5.8 4.2 8.8 2.6 1.1 1.7 10.8 7.1 12.2Fairfield Village (Groton) NY-0074314 bod 4.4 5.4 1.9 1.2 4.1 2.4 3.6 4.5 1.7 3.5 3.5 1.6 3.1 3.7 3.2Fairfield Villas @ Medford NY-0227323 13.3 11.6 21.3 3.4 4.3 11.9 1.7 1.4 2.6 4.9 2.0 0.8 38.1 6.0 8.8 7.6 6.8

2015 SCDHS Inspection Data and Monthly DMR Data Low Risk Total Nitrogen Plants
Sewage Treatment Name SPDES # Jan Feb Mar Apr May Jun Jul Aug Sep Oct Nov Dec SC#1 SC#2 SC#3 SC#42015 AVG
2014 Avg
2013 Avg
Fairway Manor NY-0238406 13.4 20.2 7.3 4.3 9.2 3.7 8.7 6.1 8.0 10.5 3.3 8.3 3.8 7.4 8.9 8.2 15.4 26.0Fox Meadows NY-0196339 29.5 14.9 8.3 6.0 10.1 5.4 8.3 0.2 2.3 3.2 1.1 2.8 26.6 8.4 9.1 25.6 23.5Greens at Half Hollow NY-0068071 2.0 4.0 3.0 4.0 5.0 4.0 4.0 6.0 3.0 8.0 2.0 6.8 3.2 17.6 5.2 4.5 3.2Greenview Commons NY-0253227 5.5 9.0 4.2 6.7 5.0 5.9 3.4 2.9 7.5 9.2 8.1 3.6 9.0 8.9 6.3 5.6 10.3Greenview Court NY-0226254 11.1 11.7 12.2 7.0 2.0 7.9 6.4 1.8 5.4 9.1 3.2 6.0 11.1 8.9 14.8 7.9 11.6 13.6Greenwood @ Oakdale NY-0210382 1.5 5.8 10.6 14.0 6.3 3.1 3.9 1.9 0.8 2.0 1.9 12.4 25.4 12.7 7.3 6.4 7.1Greenwood Village NY-0194212 3.6 8.8 2.2 4.0 4.0 5.8 4.3 6.2 4.0 3.8 3.0 3.3 10.7 15.6 5.7 4.3 8.9Gurwin Jewish Assisted Living NY-0253111 5.3 3.3 3.7 7.8 3.7 5.0 10.6 8.5 4.0 5.6 4.9 3.0 9.3 7.4 5.9 3.7 2.8Gurwin Jewish Geriatric ctr NY-0197777 7.5 6.0 6.6 7.6 6.4 7.3 19.8 6.6 6.0 4.8 6.4 9.5 9.9 14.4 8.5 8.1 12.5Hamptons center for Rehab and nursin NY-0253138 1.4 1.5 4.5 1.6 1.7 1.1 2.6 2.8 0.7 1.9 2.3 2.3 1.8 3.1 2.1 1.8 3.3Hawthorne (Concord) Village NY-0077402 7.2 4.2 5.2 3.2 3.5 3.8 3.1 2.2 5.7 3.9 3.5 3.8 2.5 3.1 3.9 3.9 3.0Heatherwood @ Holbrook NY-0077372 5.5 7.0 5.6 7.8 4.1 11.5 5.6 8.1 2.2 8.3 7.0 7.0 7.8 4.2 6.6 8.1 9.8Heatherwood @Lakeland NY-0077321 4.2 12.8 9.4 6.1 20.0 5.4 3.2 3.0 1.9 2.4 3.0 3.7 17.5 7.6 7.2 6.1 7.9Heritage Gardens NY-0077348 5.0 4.0 2.3 10.3 8.1 7.8 1.3 3.0 5.0 1.6 6.0 5.2 10.1 8.6 5.6 6.5Hilton Gardens NY-0253219 3.5 21.2 22.9 3.7 7.1 5.7 3.8 5.6 8.6 13.2 4.7 4.0 2.9 5.1 8.0 9.6 6.4HoIiday Inn Express NY-0227285 29.7 7.7 2.5 12.2 8.2 5.7 4.0 4.0 4.9 10.6 8.1 3.5 13.5 3.6 8.4 9.6 3.9Holiday Inn NY-0080705 4.0 3.6 2.6 2.1 3.3 1.2 1.2 1.2 1.2 1.2 3.3 2.5 2.0 0.8 2.2 2.0 3.1Homestead Village NY-0079383 21.6 8.2 4.4 3.4 2.1 2.4 2.7 3.5 1.5 2.7 1.3 3.7 32.9 1.9 3.8 6.4 21.8 12.6Inn @ East Winds NY-0253421 2.0 4.0 7.0 5.0 5.0 5.0 4.0 6.0 6.0 5.0 5.0 7.0 0.1 1.9 4.5 3.6 3.4Islandia Center NY-0220493 1.2 2.4 14.6 13.6 2.1 2.9 1.2 5.4 1.2 12.9 1.8 1.2 6.1 1.0 4.8 5.2 4.1Kensington Gardens/St James NH NY-0074292 4.7 4.0 13.7 4.1 1.4 4.9 4.8 5.2 19.6 6.3 9.4 11.0 4.7 19.8 8.1 4.8 8.9Lake Grove (Villages at Lake Grove) NY-0254720 1.0 2.0 1.3 4.3 1.7 0.7 1.0 1.8 0.7 0.6 0.8 2.2 13.0 7.9 2.8 6.7 5.4Lake Grove Apartments NY-0079499 9.2 24.8 15.2 13.1 7.2 3.3 6.8 2.9 3.3 4.5 3.6 5.6 12.9 5.5 5.1 8.2 5.6 5.5Lake Pointe NY-0180548 16.6 3.7 4.1 13.3 2.4 19.3 2.9 38.9 2.9 2.4 1.7 4.6 8.8 2.6 8.3 8.3 8.8 14.1 22.9Lakes @ Setauket NY-0198323 6.1 2.6 3.5 3.2 3.4 3.4 11.4 2.7 2.9 4.4 8.5 3.6 3.7 2.3 4.4 5.4 8.3Lakeview Woods Bayport NY-0255386 6.0 5.7 11.9 3.3 6.6 2.9 2.0 3.5 0.9 2.1 1.5 2.8 5.9 9.4 4.6 5.5 7.4Larkfield Gardens Atria NY-0209325 0.9 2.9 5.0 10.3 2.9 2.3 1.2 2.4 0.9 0.6 0.3 3.7 20.9 8.0 6.3 4.6 6.0 5.0Medford Hamlet Assisted Living NY-0253511 6.0 4.1 3.3 5.2 4.2 3.1 2.1 2.3 4.4 8.1 4.7 3.9 2.7 3.3 4.1 5.6 5.7Medford Ponds NY-0254509 12.0 4.6 10.0 4.3 2.8 3.3 2.2 3.3 7.6 10.1 7.8 4.1 7.4 6.6 6.2 5.7 10.5Mill Pond Estates NY-0278432 8.3 8.6 29.3 6.3 7.6 5.3 5.0 8.6 7.1 5.5 5.7 5.6 19.2 16.8 13.3 10.1Nesconset ctr for Nursing NY-0193470 56.1 44.9 33.6 6.3 48.1 5.1 4.0 4.4 9.3 2.5 5.9 3.8 49.0 2.6 6.5 18.8 20.5 15.8Oak creek commons NY-0272990 6.0 6.0 5.0 7.0 7.0 3.0 4.0 5.0 2.0 8.0 12.0 5.0 10.4 5.8 19.9 7.1 10.2

2015 SCDHS Inspection Data and Monthly DMR Data Low Risk Total Nitrogen Plants
Sewage Treatment Name SPDES # Jan Feb Mar Apr May Jun Jul Aug Sep Oct Nov Dec SC#1 SC#2 SC#3 SC#42015 AVG
2014 Avg
2013 Avg
Oak Hollow NY-0079456 13.3 5.2 4.8 4.4 10.6 5.2 3.0 5.3 7.7 2.9 4.8 3.6 12.8 11.3 5.2 6.7 6.7 5.1Oak Ridge Hollow NY-0273465 6.0 6.0 3.0 3.0 4.0 7.0 4.0 25.0 5.0 6.0 5.0 7.0 7.8 5.2 19.2 7.5Park Meadow STPCountry Pointe NY-0253146 15.5 3.0 11.8 3.9 6.2 5.2 5.3 5.4 7.0 5.3 3.9 9.1 12.6 8.8 7.4 8.8 10.5Patch Senior Conifer NY-0253316 5.5 7.6 16.3 12.3 4.3 3.8 3.9 5.6 4.2 4.2 4.1 4.8 5.8 1.5 6.0 7.8 5.9Paumanack Village NY-0137065 3.1 8.0 7.7 4.6 12.8 5.2 4.8 4.5 5.1 4.6 2.9 5.3 26.6 14.5 7.8 6.4 9.2Petite Fleur NY-0220990 1.7 3.9 14.8 0.9 1.5 5.0 13.2 17.8 13.8 10.5 0.7 1.4 10.2 19.7 8.2 5.4 7.6Pine Hills South Mirror Ponds NY-0253308 3.6 5.1 8.2 7.0 3.9 5.5 5.2 5.3 3.7 3.0 3.3 3.2 4.9 3.4 4.7 6.1 5.7Pinewood Gardens NY-0254525 5.0 3.0 5.0 6.0 4.0 4.0 3.0 8.0 3.0 10.0 5.0 4.0 2.5 14.9 5.5 4.3 23.1Preserves @ Connetquot NY-0254479 4.0 5.0 5.0 7.0 7.0 6.0 3.0 2.0 4.0 7.0 9.0 3.0 9.8 9.1 5.8 4.3 6.7Quail Run NY-0065391 7.8 7.4 3.7 7.6 3.8 5.9 10.2 7.3 15.8 9.0 5.3 6.9 2.5 13.9 7.6 8.4 9.7Residence Inn NY-0266337 12.2 8.5 10.9 8.7 8.8 5.0 3.2 2.7 9.9 7.4 4.7 4.6 7.2 10.8 7.5 4.5 8.1Ross Nursing Home NY0285757 3.5 2.8 4.7 4.7 3.1 3.9 3.0 3.6 3.4 21.6 6.3 10.0 2.9 2.7 5.4 11.8Saddle Cove Apts. NY-0253529 8.7 8.6 7.1 6.2 7.2 7.7 6.5 9.9 10.6 19.1 9.9 6.7 5.4 2.9 9.7 8.4 13.2 10.0Sagamore Hills NY-0065455 14.3 8.5 4.0 8.0 5.8 3.0 3.1 8.1 10.0 9.6 6.3 5.3 7.6 3.3 6.9 6.2 7.5Saint Annes NY-0266329 4.0 10.0 2.0 8.0 5.0 3.0 2.0 2.0 3.0 11.0 7.0 5.0 6.2 8.6 5.5 3.7 19.0Sayville Commons NY-0253235 6.0 3.9 5.2 13.2 12.4 23.6 19.7 17.8 9.1 4.1 1.2 2.9 13.8 4.0 4.5 9.4 4.8 4.4Senior Housing @EM Walden Ponds NY-0253375 8.5 12.4 6.0 3.2 5.8 4.8 7.5 6.1 8.7 4.5 4.2 4.6 17.7 5.6 7.1 5.2 8.9Setauket Meadows NY-0254517 3.9 1.1 1.4 4.3 0.8 1.4 1.1 0.2 0.8 1.3 0.9 0.7 10.1 3.3 2.2 2.5 5.2Smithaven Mall NY-0080446 7.8 7.0 6.2 4.4 3.0 3.3 29.7 5.7 6.0 3.0 2.6 2.6 6.3 1.6 6.4 4.6 8.5Smithtown Galleria NY-0252824 0.9 3.6 2.8 2.9 2.7 2.3 2.8 2.0 1.4 2.8 2.5 2.9 4.0 8.7 3.0 3.3 4.6Southampton Commons NY-0179213 3.2 10.4 7.5 9.0 1.7 4.1 1.6 1.6 0.4 0.4 1.2 1.3 0.3 3.3 3.3 4.2 3.2Southampton Hospital NY-0065374 8.7 7.0 3.5 4.5 7.6 2.1 3.1 2.5 2.0 2.7 4.0 3.8 5.3 1.4 4.1 3.3 3.7Southern Meadows NY-0077364 5.5 6.8 10.2 10.4 4.6 4.1 7.3 4.3 2.2 5.8 4.4 3.5 7.0 0.9 5.5 5.1 4.9Springhorn NY-0226963 14.0 4.0 4.0 7.0 9.0 3.0 3.0 2.0 5.0 4.0 5.0 6.0 5.1 2.6 5.3 15.0 28.9Spruce Ponds NY-0252972 4.1 5.2 3.9 3.7 3.5 6.3 6.5 5.4 6.4 2.9 3.9 3.1 2.9 6.2 4.6 4.9 4.3Stonehurst NY-0239011 7.1 3.5 3.7 4.6 2.2 8.7 2.9 1.6 4.2 2.2 2.0 2.4 17.0 10.8 5.2 3.9 5.8Stone Ridge at Dix Hills NY-0253171 4.2 4.0 17.5 2.5 7.4 3.4 2.6 4.1 8.4 4.0 1.5 8.6 3.3 6.4 5.6 6.3 6.5Stonington NY-0210161 3.1 6.5 5.8 4.6 2.5 3.8 1.9 0.8 7.3 10.0 9.9 2.9 18.1 11.2 6.3 8.5 6.1Stony Hollow NY-0079529 6.7 10.2 4.3 8.3 3.0 6.1 3.7 3.3 3.7 4.2 3.0 5.5 7.0 6.7 5.4 6.9 7.0Stratford Green NY-0077461 4.1 2.3 4.5 3.3 2.9 4.0 1.9 3.6 4.1 2.6 2.1 3.2 1.4 3.0 3.1 4.3 3.2Stratmore on the Green NY-0253065 11.2 19.1 12.5 10.3 8.2 36.5 5.5 4.6 7.0 6.1 10.7 8.3 15.1 3.6 8.6 7.2 10.9 6.1 5.7Sunrise Assisted Living @Holbrook NY-0227226 7.0 3.0 3.0 8.0 5.0 3.0 2.0 2.0 4.0 10.0 4.0 5.0 2.8 0.9 4.3 4.2 4.2
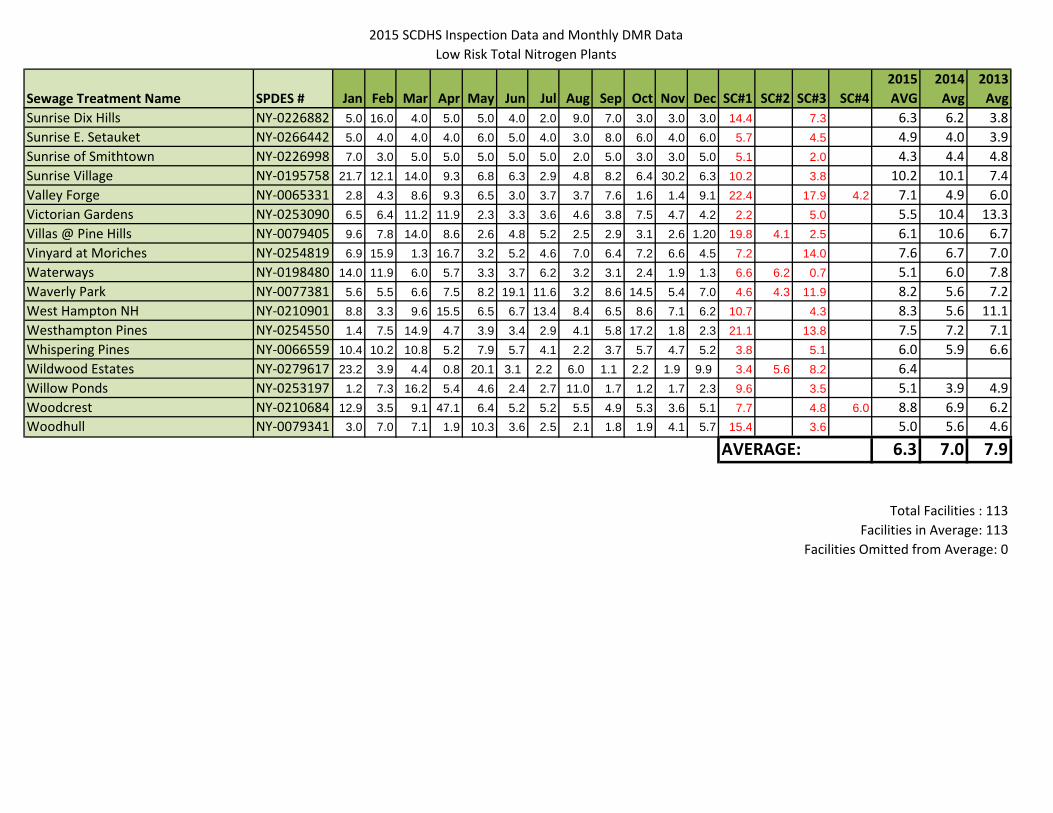
2015 SCDHS Inspection Data and Monthly DMR Data Low Risk Total Nitrogen Plants
Sewage Treatment Name SPDES # Jan Feb Mar Apr May Jun Jul Aug Sep Oct Nov Dec SC#1 SC#2 SC#3 SC#42015 AVG
2014 Avg
2013 Avg
Sunrise Dix Hills NY-0226882 5.0 16.0 4.0 5.0 5.0 4.0 2.0 9.0 7.0 3.0 3.0 3.0 14.4 7.3 6.3 6.2 3.8Sunrise E. Setauket NY-0266442 5.0 4.0 4.0 4.0 6.0 5.0 4.0 3.0 8.0 6.0 4.0 6.0 5.7 4.5 4.9 4.0 3.9Sunrise of Smithtown NY-0226998 7.0 3.0 5.0 5.0 5.0 5.0 5.0 2.0 5.0 3.0 3.0 5.0 5.1 2.0 4.3 4.4 4.8Sunrise Village NY-0195758 21.7 12.1 14.0 9.3 6.8 6.3 2.9 4.8 8.2 6.4 30.2 6.3 10.2 3.8 10.2 10.1 7.4Valley Forge NY-0065331 2.8 4.3 8.6 9.3 6.5 3.0 3.7 3.7 7.6 1.6 1.4 9.1 22.4 17.9 4.2 7.1 4.9 6.0Victorian Gardens NY-0253090 6.5 6.4 11.2 11.9 2.3 3.3 3.6 4.6 3.8 7.5 4.7 4.2 2.2 5.0 5.5 10.4 13.3Villas @ Pine Hills NY-0079405 9.6 7.8 14.0 8.6 2.6 4.8 5.2 2.5 2.9 3.1 2.6 1.20 19.8 4.1 2.5 6.1 10.6 6.7Vinyard at Moriches NY-0254819 6.9 15.9 1.3 16.7 3.2 5.2 4.6 7.0 6.4 7.2 6.6 4.5 7.2 14.0 7.6 6.7 7.0Waterways NY-0198480 14.0 11.9 6.0 5.7 3.3 3.7 6.2 3.2 3.1 2.4 1.9 1.3 6.6 6.2 0.7 5.1 6.0 7.8Waverly Park NY-0077381 5.6 5.5 6.6 7.5 8.2 19.1 11.6 3.2 8.6 14.5 5.4 7.0 4.6 4.3 11.9 8.2 5.6 7.2West Hampton NH NY-0210901 8.8 3.3 9.6 15.5 6.5 6.7 13.4 8.4 6.5 8.6 7.1 6.2 10.7 4.3 8.3 5.6 11.1Westhampton Pines NY-0254550 1.4 7.5 14.9 4.7 3.9 3.4 2.9 4.1 5.8 17.2 1.8 2.3 21.1 13.8 7.5 7.2 7.1Whispering Pines NY-0066559 10.4 10.2 10.8 5.2 7.9 5.7 4.1 2.2 3.7 5.7 4.7 5.2 3.8 5.1 6.0 5.9 6.6Wildwood Estates NY-0279617 23.2 3.9 4.4 0.8 20.1 3.1 2.2 6.0 1.1 2.2 1.9 9.9 3.4 5.6 8.2 6.4Willow Ponds NY-0253197 1.2 7.3 16.2 5.4 4.6 2.4 2.7 11.0 1.7 1.2 1.7 2.3 9.6 3.5 5.1 3.9 4.9Woodcrest NY-0210684 12.9 3.5 9.1 47.1 6.4 5.2 5.2 5.5 4.9 5.3 3.6 5.1 7.7 4.8 6.0 8.8 6.9 6.2Woodhull NY-0079341 3.0 7.0 7.1 1.9 10.3 3.6 2.5 2.1 1.8 1.9 4.1 5.7 15.4 3.6 5.0 5.6 4.6
AVERAGE: 6.3 7.0 7.9
Total Facilities : 113Facilities in Average: 113
Facilities Omitted from Average: 0
2015 SCDHS Inspection Data and Monthly DMR Data High Risk Total Nitrogen Plants
Sewage Treatment Name SPDES # Jan Feb Mar Apr May Jun Jul Aug Sep Oct Nov Dec SCQ1 SCQ2 SCQ3 SCQ4 2015 2014 2013 Risk Cat.Birchwood Spring Lake NY-0196762 10.4 5.4 8.1 27.5 20.6 13.6 16.0 3.3 7.2 14.5 7.1 6.8 25.0 29.2 13.9 9.3 8.7 VCBristal East Northport NY-0278793 90.5 14.1 52.4 21.6 9.3 21.9 41.5 31.2 35.0 25.0 6.0 7.0 35.4 14.2 16.4 9.5 26.9 23.0 11.2 VCBristal Lake Grove NY-0285897 No Discharge 10.0 8.0 10.4 5.4 7.6 8.3 NISSBrookwood on the Lake NY-0136492 14.4 13.5 21.1 16.2 13.7 7.1 11.8 11.3 7.9 9.2 12.5 17.0 9.9 8.4 5.4 12.2 12.0 15.5 19.2 UPGCourtyard at Southampton NY-0254941 19.0 12.3 13.3 12.4 25.9 14.7 9.7 20.4 17.8 16.4 11.0 13.0 7.7 21.0 4.1 18.5 14.8 21.9 18.0 VCEast Port Meadows NY-0278289 25.4 28.2 23.7 21.3 18.6 33.8 13.6 10.6 21.7 24.6 13.4 7.6 20.5 10.7 17.9 6.0 18.6 NISSHidden Ponds NY-0196282 11.1 14.7 2.7 2.4 7.7 8.1 25.4 23.3 12.1 26.1 4.3 19.0 10.7 40.8 29.6 24.1 16.4 9.5 15.8 VCIsland View NY-0252981 26.0 13.5 4.1 7.1 7.6 14.4 35.8 20.2 20.2 9.6 8.0 11.9 20.1 17.0 39.4 12.4 16.7 11.3 8.9 UPGLA Fitness NY-0285552 65.0 70.1 31.1 10.5 19.5 11.7 14.0 16.3 4.5 15.9 23.8 33.4 64.0 32.6 42.7 21.4 29.8 UPGLa Quinta NY-0254487 7.6 8.8 14.3 13.5 8.2 6.5 3.5 7.0 12.6 16.7 3.2 7.3 14.6 18.8 10.2 2.8 5.7 UPGMac Arthur Plaza NY-0197432 67.3 87.7 47.7 66.4 3.2 47.0 109.0 15.5 49.4 58.9 23.6 11.3 42.8 29.5 15.5 102.5 48.6 34.9 74.3 UPGMedford Multicare Center NY-0253383 6.0 3.5 4.1 9.5 9.7 39.2 N/D 17.7 12.5 8.1 27.0 6.4 45.4 7.2 15.1 4.5 5.1 UPGMedical Office Building (Ema NY-0266418 22.2 47.4 20.9 27.0 18.4 13.1 9.4 26.1 42.7 18.8 64.4 11.0 27.2 10.6 N/D 2.7 24.1 27.6 22.1 UPGNorth Isle NY-0079430 46.2 79.4 43.6 5.0 29.8 20.3 25.2 34.1 33.7 35.5 31.0 44.0 34.9 35.8 4.8 25.6 33.1 27.5 33.4 UPGOrchard at Bulls Head Inn NY-0279501 72.1 8.1 6.4 2.0 22.7 18.1 24.8 2.8 2.4 3.9 14.6 1.9 6.3 21.5 4.7 6.8 13.7 20.6 UPGPonds at Southampton NY0285820 25.4 21.5 22.0 5.3 31.8 17.7 7.5 8.2 6.4 27.9 15.3 35.2 31.2 20.4 26.7 21.9 20.3 NISSSilver Ponds NY-0210269 10.1 8.4 8.4 11.7 5.2 21.2 2.9 28.1 3.9 29.1 5.3 7.5 6.1 18.1 12.4 11.9 9.5 11.0 VCSuffolk Center for Rehab and NY-0080454 30.0 53.7 33.8 26.8 3.4 7.9 17.4 7.0 8.0 2.1 5.7 8.9 30.8 17.5 4.9 8.1 16.6 18.7 27.9 UPGSunrise Garden Apartments NY-0077259 9.6 20.0 11.4 10.0 11.4 9.5 9.7 12.6 3.0 9.3 6.7 10.3 NISSTimber Ridge @ Westhampto NY-0277487 42.8 15.2 25.6 53.8 43.5 38.7 13.8 20.9 44.5 23.4 18.6 29.7 2.0 51.0 10.1 27.7 28.8 NISSVictorian Homes NY-0226858 16.0 16.0 11.8 10.9 9.4 9.3 9.5 9.6 21.8 6.3 2.7 9.1 8.7 18.4 9.0 8.9 11.1 11.5 21.8 UPGVillage in the Woods NY-0078123 31.8 42.0 27.1 4.0 3.3 5.9 1.7 4.2 4.7 22.8 10.8 4.5 22.8 49.9 14.0 13.9 16.5 34.2 34.4 UPGWindbrooke NY-0077411 3.8 4.4 6.7 6.5 4.4 28.9 16.8 21.7 53.3 22.2 5.8 2.7 5.0 9.4 13.7 9.1 7.7 UPGWoodbridge @ Hampton BayNY-0226777 2.1 10.1 39.3 23.4 27.5 29.4 30.0 18.4 2.7 11.9 9.1 8.9 47.1 12.1 3.0 3.7 17.4 6.9 7.0 UPG
18.7 17.6 21.2
Facilities Omitted From Average 4 Facilities not in steady state 4
Total Facilities 24 Facilities in Average 20
AVERAGE:
Secondary STP
SAMPLING ANALYSES DATA
For BOD & TSS
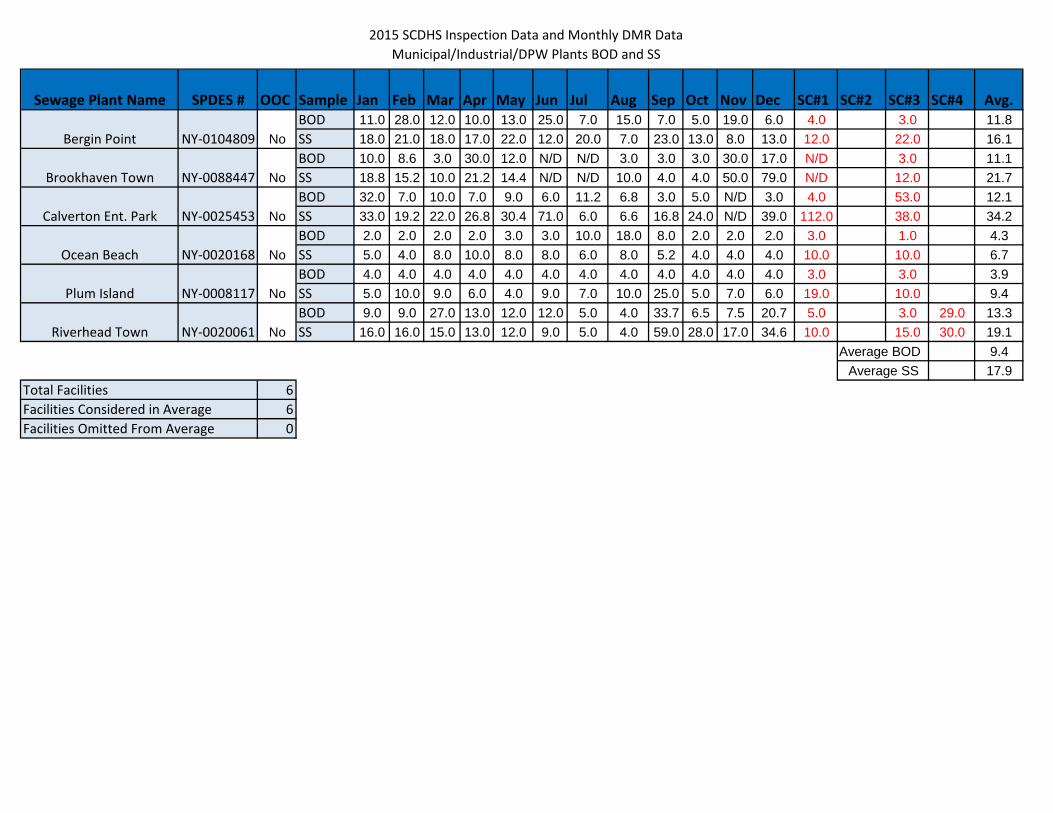
2015 SCDHS Inspection Data and Monthly DMR DataMunicipal/Industrial/DPW Plants BOD and SS
Sewage Plant Name SPDES # OOC Sample Jan Feb Mar Apr May Jun Jul Aug Sep Oct Nov Dec SC#1 SC#2 SC#3 SC#4 Avg. BOD 11.0 28.0 12.0 10.0 13.0 25.0 7.0 15.0 7.0 5.0 19.0 6.0 4.0 3.0 11.8
NY-0104809 SS 18.0 21.0 18.0 17.0 22.0 12.0 20.0 7.0 23.0 13.0 8.0 13.0 12.0 22.0 16.1BOD 10.0 8.6 3.0 30.0 12.0 N/D N/D 3.0 3.0 3.0 30.0 17.0 N/D 3.0 11.1
NY-0088447 SS 18.8 15.2 10.0 21.2 14.4 N/D N/D 10.0 4.0 4.0 50.0 79.0 N/D 12.0 21.7BOD 32.0 7.0 10.0 7.0 9.0 6.0 11.2 6.8 3.0 5.0 N/D 3.0 4.0 53.0 12.1
NY-0025453 SS 33.0 19.2 22.0 26.8 30.4 71.0 6.0 6.6 16.8 24.0 N/D 39.0 112.0 38.0 34.2BOD 2.0 2.0 2.0 2.0 3.0 3.0 10.0 18.0 8.0 2.0 2.0 2.0 3.0 1.0 4.3
NY-0020168 SS 5.0 4.0 8.0 10.0 8.0 8.0 6.0 8.0 5.2 4.0 4.0 4.0 10.0 10.0 6.7BOD 4.0 4.0 4.0 4.0 4.0 4.0 4.0 4.0 4.0 4.0 4.0 4.0 3.0 3.0 3.9
NY-0008117 SS 5.0 10.0 9.0 6.0 4.0 9.0 7.0 10.0 25.0 5.0 7.0 6.0 19.0 10.0 9.4BOD 9.0 9.0 27.0 13.0 12.0 12.0 5.0 4.0 33.7 6.5 7.5 20.7 5.0 3.0 29.0 13.3
NY-0020061 SS 16.0 16.0 15.0 13.0 12.0 9.0 5.0 4.0 59.0 28.0 17.0 34.6 10.0 15.0 30.0 19.19.417.9
Total Facilities 6Facilities Considered in Average 6Facilities Omitted From Average 0
Average BOD Average SS
Riverhead Town No
Ocean Beach No
Plum Island No
Bergin Point No
Brookhaven Town No
Calverton Ent. Park No

2015 SCDHS Inspection Data and Monthly DMR DataLow Risk Plants BOD and SS Results
Sewage Plant Name SPDES # OOC Sample Jan Feb Mar Apr May Jun Jul Aug Sep Oct Nov Dec SC#1 SC#2 SC#3 SC#4 Avg. BOD 2.0 20.0 4.0 9.0 6.0 6.0 6.0 20.0 11.0 11.3 2.0 2.0 3.0 6.0 7.7
NY-0021814 SS 7.0 18.0 6.0 15.0 2.0 4.0 9.0 7.2 17.0 7.0 6.0 10.0 10.0 10.0 9.27.7
Total Facilities 1 9.2Facilities Considered in Average 1Facilities Omitted From Average 0
Shelter Island HeightsAverage BOD
Average SS
No
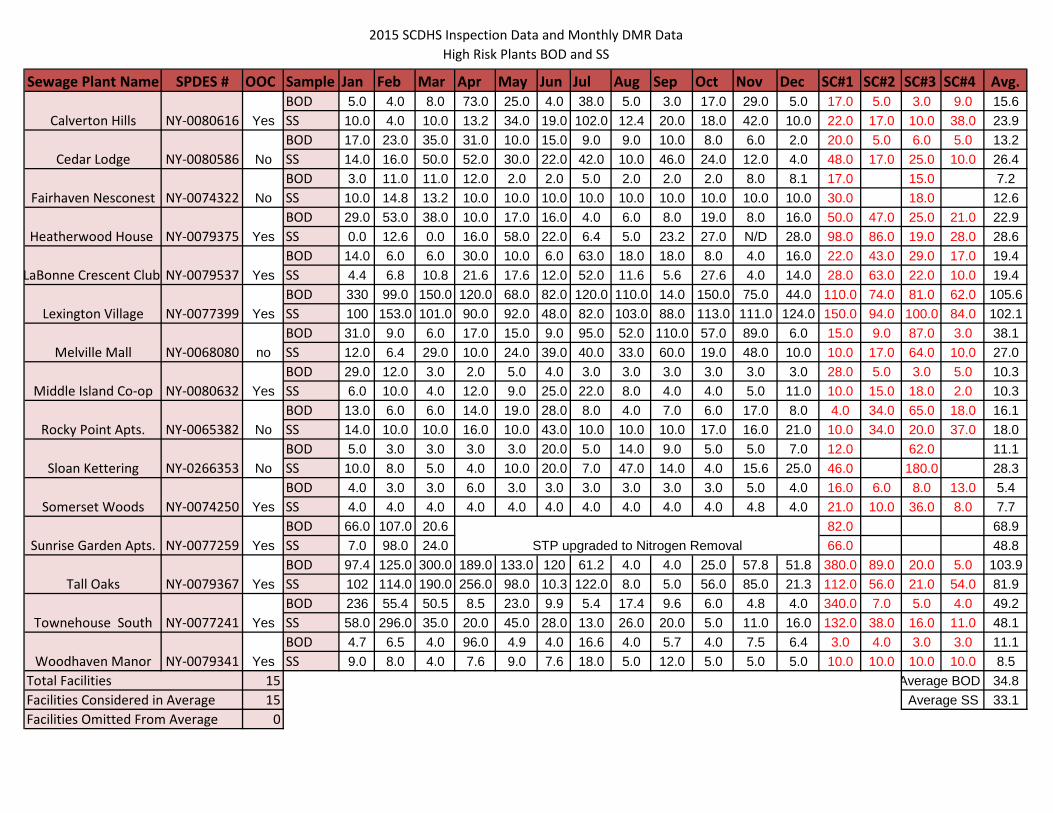
2015 SCDHS Inspection Data and Monthly DMR DataHigh Risk Plants BOD and SS
Sewage Plant Name SPDES # OOC Sample Jan Feb Mar Apr May Jun Jul Aug Sep Oct Nov Dec SC#1 SC#2 SC#3 SC#4 Avg. BOD 5.0 4.0 8.0 73.0 25.0 4.0 38.0 5.0 3.0 17.0 29.0 5.0 17.0 5.0 3.0 9.0 15.6
NY-0080616 SS 10.0 4.0 10.0 13.2 34.0 19.0 102.0 12.4 20.0 18.0 42.0 10.0 22.0 17.0 10.0 38.0 23.9BOD 17.0 23.0 35.0 31.0 10.0 15.0 9.0 9.0 10.0 8.0 6.0 2.0 20.0 5.0 6.0 5.0 13.2
NY-0080586 SS 14.0 16.0 50.0 52.0 30.0 22.0 42.0 10.0 46.0 24.0 12.0 4.0 48.0 17.0 25.0 10.0 26.4BOD 3.0 11.0 11.0 12.0 2.0 2.0 5.0 2.0 2.0 2.0 8.0 8.1 17.0 15.0 7.2
NY-0074322 SS 10.0 14.8 13.2 10.0 10.0 10.0 10.0 10.0 10.0 10.0 10.0 10.0 30.0 18.0 12.6BOD 29.0 53.0 38.0 10.0 17.0 16.0 4.0 6.0 8.0 19.0 8.0 16.0 50.0 47.0 25.0 21.0 22.9
NY-0079375 SS 0.0 12.6 0.0 16.0 58.0 22.0 6.4 5.0 23.2 27.0 N/D 28.0 98.0 86.0 19.0 28.0 28.6BOD 14.0 6.0 6.0 30.0 10.0 6.0 63.0 18.0 18.0 8.0 4.0 16.0 22.0 43.0 29.0 17.0 19.4
NY-0079537 SS 4.4 6.8 10.8 21.6 17.6 12.0 52.0 11.6 5.6 27.6 4.0 14.0 28.0 63.0 22.0 10.0 19.4BOD 330 99.0 150.0 120.0 68.0 82.0 120.0 110.0 14.0 150.0 75.0 44.0 110.0 74.0 81.0 62.0 105.6
NY-0077399 Yes SS 100 153.0 101.0 90.0 92.0 48.0 82.0 103.0 88.0 113.0 111.0 124.0 150.0 94.0 100.0 84.0 102.1BOD 31.0 9.0 6.0 17.0 15.0 9.0 95.0 52.0 110.0 57.0 89.0 6.0 15.0 9.0 87.0 3.0 38.1
NY-0068080 SS 12.0 6.4 29.0 10.0 24.0 39.0 40.0 33.0 60.0 19.0 48.0 10.0 10.0 17.0 64.0 10.0 27.0BOD 29.0 12.0 3.0 2.0 5.0 4.0 3.0 3.0 3.0 3.0 3.0 3.0 28.0 5.0 3.0 5.0 10.3
NY-0080632 SS 6.0 10.0 4.0 12.0 9.0 25.0 22.0 8.0 4.0 4.0 5.0 11.0 10.0 15.0 18.0 2.0 10.3BOD 13.0 6.0 6.0 14.0 19.0 28.0 8.0 4.0 7.0 6.0 17.0 8.0 4.0 34.0 65.0 18.0 16.1
NY-0065382 SS 14.0 10.0 10.0 16.0 10.0 43.0 10.0 10.0 10.0 17.0 16.0 21.0 10.0 34.0 20.0 37.0 18.0BOD 5.0 3.0 3.0 3.0 3.0 20.0 5.0 14.0 9.0 5.0 5.0 7.0 12.0 62.0 11.1
NY-0266353 SS 10.0 8.0 5.0 4.0 10.0 20.0 7.0 47.0 14.0 4.0 15.6 25.0 46.0 180.0 28.3BOD 4.0 3.0 3.0 6.0 3.0 3.0 3.0 3.0 3.0 3.0 5.0 4.0 16.0 6.0 8.0 13.0 5.4
NY-0074250 SS 4.0 4.0 4.0 4.0 4.0 4.0 4.0 4.0 4.0 4.0 4.8 4.0 21.0 10.0 36.0 8.0 7.7BOD 66.0 107.0 20.6 82.0 68.9
NY-0077259 SS 7.0 98.0 24.0 66.0 48.8BOD 97.4 125.0 300.0 189.0 133.0 120 61.2 4.0 4.0 25.0 57.8 51.8 380.0 89.0 20.0 5.0 103.9
NY-0079367 SS 102 114.0 190.0 256.0 98.0 10.3 122.0 8.0 5.0 56.0 85.0 21.3 112.0 56.0 21.0 54.0 81.9BOD 236 55.4 50.5 8.5 23.0 9.9 5.4 17.4 9.6 6.0 4.8 4.0 340.0 7.0 5.0 4.0 49.2
NY-0077241 SS 58.0 296.0 35.0 20.0 45.0 28.0 13.0 26.0 20.0 5.0 11.0 16.0 132.0 38.0 16.0 11.0 48.1BOD 4.7 6.5 4.0 96.0 4.9 4.0 16.6 4.0 5.7 4.0 7.5 6.4 3.0 4.0 3.0 3.0 11.1
NY-0079341 SS 9.0 8.0 4.0 7.6 9.0 7.6 18.0 5.0 12.0 5.0 5.0 5.0 10.0 10.0 10.0 10.0 8.5Total Facilities 15 34.8Facilities Considered in Average 15 33.1Facilities Omitted From Average 0
Sloan Kettering No
Somerset Woods Yes
Woodhaven Manor Yes
Yes
Townehouse South Yes
Tall Oaks Yes
no
Middle Island Co-op Yes
Rocky Point Apts. No
STP upgraded to Nitrogen Removal
Average BOD Average SS
Calverton Hills Yes
LaBonne Crescent Club Yes
Heatherwood House Yes
Cedar Lodge No
Lexington Village
Sunrise Garden Apts.
Fairhaven Nesconest No
Melville Mall
2015 SCDHS Inspection Data and Monthly DMR Data
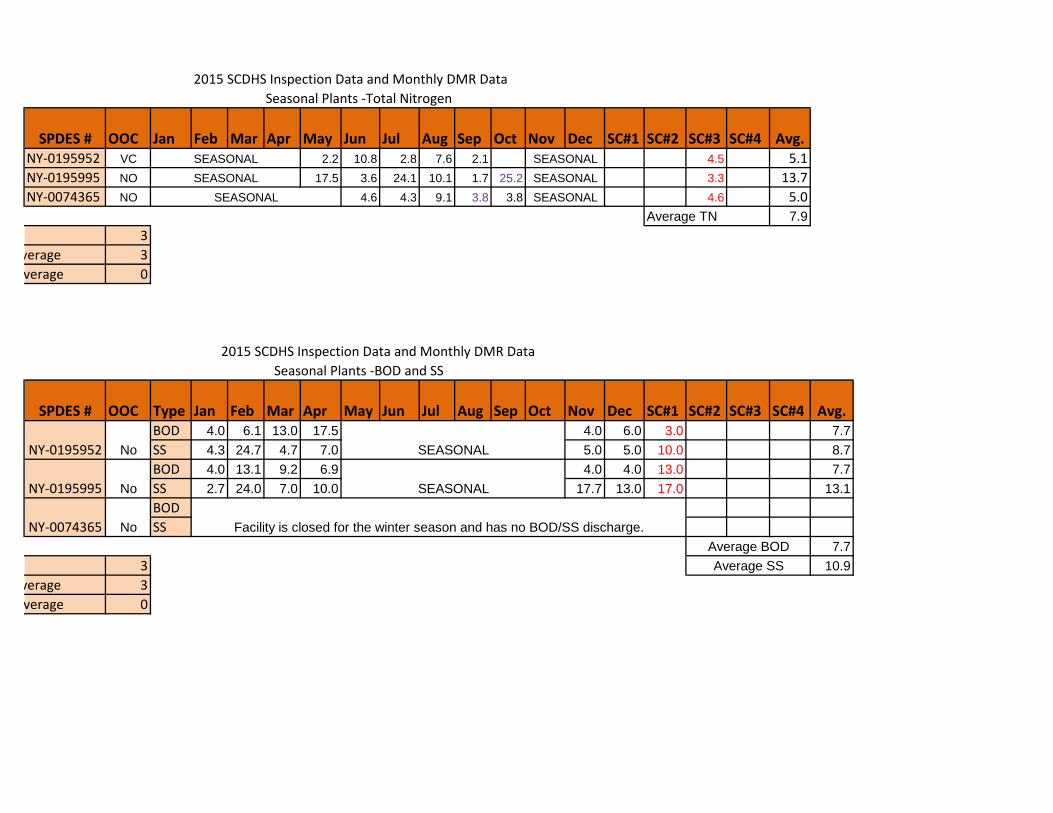
SPDES # OOC Jan Feb Mar Apr May Jun Jul Aug Sep Oct Nov Dec SC#1 SC#2 SC#3 SC#4 Avg. NY-0195952 VC 2.2 10.8 2.8 7.6 2.1 4.5 5.1NY-0195995 NO 17.5 3.6 24.1 10.1 1.7 25.2 3.3 13.7NY-0074365 NO 4.6 4.3 9.1 3.8 3.8 4.6 5.0
Average TN 7.9 3
verage 3 verage 0
SPDES # OOC Type Jan Feb Mar Apr May Jun Jul Aug Sep Oct Nov Dec SC#1 SC#2 SC#3 SC#4 Avg. BOD 4.0 6.1 13.0 17.5 4.0 6.0 3.0 7.7SS 4.3 24.7 4.7 7.0 5.0 5.0 10.0 8.7BOD 4.0 13.1 9.2 6.9 4.0 4.0 13.0 7.7SS 2.7 24.0 7.0 10.0 17.7 13.0 17.0 13.1BODSS
7.7 3 10.9
verage 3 verage 0
Average SS
Seasonal Plants -Total Nitrogen
SEASONALSEASONAL
SEASONALSEASONALSEASONAL
2015 SCDHS Inspection Data and Monthly DMR DataSeasonal Plants -BOD and SS
SEASONAL
NY-0074365 No Facility is closed for the winter season and has no BOD/SS discharge.Average BOD
NY-0195952 No SEASONAL
NY-0195995 No SEASONAL