Office of the Chief Management Officer and Deputy Chief ... · consistent with the definition of IT...
55
Office of the Chief Management Officer and Deputy Chief Financial Officer Cost Management Activity NCR PDI | March 2018
Transcript of Office of the Chief Management Officer and Deputy Chief ... · consistent with the definition of IT...

Office of the Chief Management Officer and Deputy
Chief Financial Officer Cost Management Activity
NCR PDI | March 2018

1
Executive summary
CMO and DCFO began this cost transparency in summer of 2016
Our approach to cost transparency draws upon private sector experience from commercial consulting
partners to deliver rapid insights, allow for quick decisions, and drive smarter transformations (i.e., re-
org, business process optimization) by:
• Leveraging cost and non-cost data: Identify cost and performance implications of various scenarios
• Delivering meaningful insights: Managers can immediately use insights to manage spend
• Identifying key transformation opportunities: Isolate high-impact areas for long-term change
• Developing a unified cost framework (CODE): Quickly identify key segments which drive business
decision making within a given line of business
We implement our approach within various lines of business during a time-boxed period: initial
hypotheses and insights derived within 120 days; final within a 300-day sprint
• Our first line of business was Real Property, implemented successfully in '16
• Medical and IT were successfully completed in fall '17, with follow-on extension work currently ongoing
• Currently ~ 120 days into Supply Chain LoB and ~45 days into FM

2
Initial cost baseline with preliminary
analytic capability
2016 2017 2018 2019 2020
Miscellaneous
Operations
LoB
Testing and RDT&E
Community Services
Real Property
FM
HR
Service Acquisitions
IT
Medical
Maintenance
Supply Chain
Initial 300 days Sustainment
Today
Annual refresh complete (year over year data available)
Finalized baseline with advanced analytic
capability
Calendar Year
Notional timeline for future LoBs
Initial view on timing and major milestones for all LoBs

Developing the Framework
4
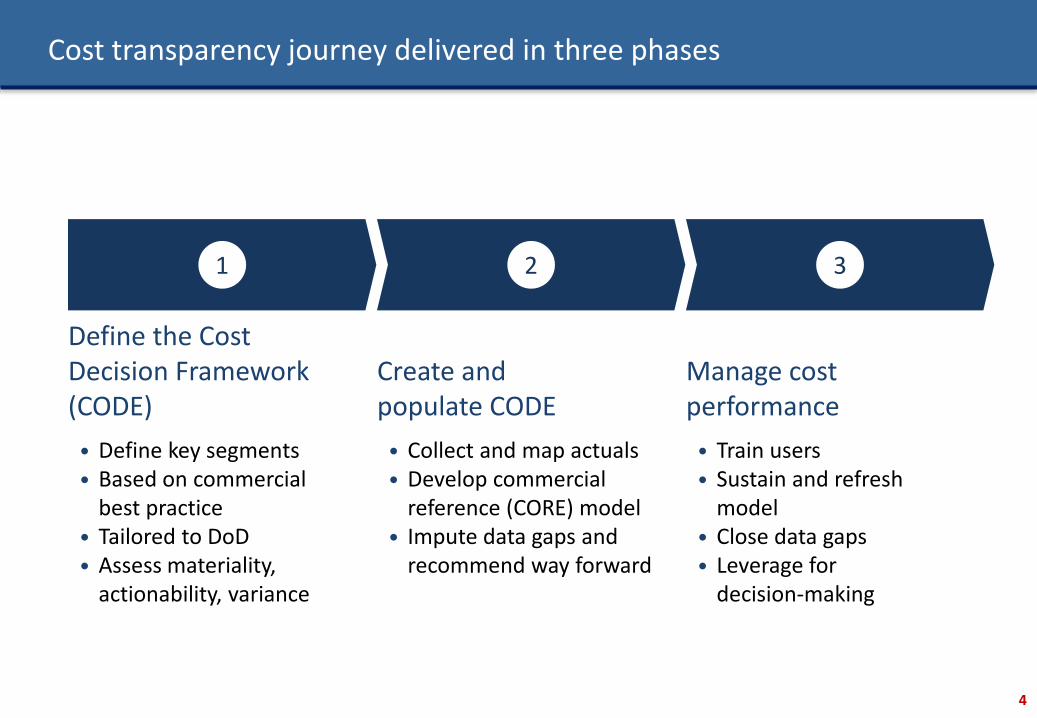
Cost transparency journey delivered in three phases
• Define key segments• Based on commercial
best practice• Tailored to DoD• Assess materiality,
actionability, variance
• Collect and map actuals• Develop commercial
reference (CORE) model• Impute data gaps and
recommend way forward
• Train users• Sustain and refresh
model• Close data gaps• Leverage for
decision-making
Define the Cost Decision Framework (CODE)
Create and populate CODE
Manage cost performance
321

5
Key business questions drive our approach to cost transparency within a given LoB
Assess cost TransformImprove efficiency
• What are the primary cost drivers?
• What are the baseline costs?
• How should systems & accounting be best aligned to capture costs?
• How do overhead costs compare to benchmarks?
• Are personnel at efficient levels to manage workload?
• What is the value of optimizing transport?
• How do outsourced costs compare to insourced?
• Is there opportunity to consolidate warehouses?
• Are procurementprocesses & personnel efficient?
• What is the cost of non-optimal demand signals?
• Are IT investments improving cost efficiency?
• Where is centralization cost-effective?
• What is the cost of duplication?
• What is the cost of non-optimal supply chain planning and execution?
• How can the DoD operating model be modified?

6
Real Property: Cost Decision (CODE) framework
CODE focuses first on product segments:
Level of Materiality, Variance, and Actionability
Real Estate Maintenance Operations Utilities
Highly material, variable and actionable
• Construction • Sustainment• Maintenance & Repair
(overhead)
• Road clearance– Snow removal– Street sweeping– Dirt and sand
• Electricity
Highly material or variable or actionable
• Planning / management• Leasing
• Restoration & Modernization
• Custodial• Grounds• Environmental operations
• Natural gas• Water • Sewer
Moderately material or variable or actionable
• Divestment / demolition• New land / property• Environmental restoration
• Refuse • Steam
Neither material nor variable nor actionable
• Other • Other • Pest control• Other
• Other
Geography (Service)
• Army• Air Force• Navy, Marine Corps• 4th Estate (DLA, WHS, DoDEA, DHP, DECA)
Site / Footprint (Installation)
All installations (U.S. and overseas)
Facility profile
• Facility class (e.g., Administrative, Hospital & medical, Troop housing & mess, etc.)• Age• Condition• Other
Object class • Personnel cost• Contractor cost
• Supplies• Travel
• Communications• Other
Hig
hLo
w
CODE covers additional key segments of geography, footprint, facility type and OC

7
Medical: Cost Decision (CODE) framework
Level of Materiality, Variance, and Actionability
PurchasedCare
Direct CareOperational Care
& ServicesOther Health
ServicesTraining & Education
Future Med. Capabilities
Command & Headquarters
Highly material,
variable and
actionable
• Purchased professional services
• Pharmaceuticals
• Med. personnel pay & benefits
• Pharmaceuticals• Mgm't activities
& admin costs
• Medical personnel pay and benefits
• Pharmaceuticals
• Command & cross-cutting administrative functions
Highly material or
variable or
actionable
• Administrative costs
• Durable medical equipment
• Medical supplies • Dental
• Medical supplies • Medical equip.• Admin costs
• Public / occupational health
• Health and training programs
• Med. research, development, testing & evaluation
• Human resources
Moderately
material or
variable or
actionable
• Contractor fees • Other • Aeromedicalevacuations
• Other
• Other non-MTF, non-operational health services
• Scholarships, grants, etc.
• Other
• Congressionally mandated research
• Other
Hig
hLo
w
Depts
• IP, OP, & other
departments
• Metric: Cost per
RVU/RWP
Medical code
frequency
• Number of instances (e.g. of CPT
66920, Extraction of Lens)
• Number of prescriptions (e.g. brand vs.
generic)
Service • Air Force • Army • Navy• Reserve for each
service
• National Guard
for each service• DHA
Facility type• Specialty clinic
• Non-GME
hospital
• GME hospital
• Etc.
Benefit plan• Prime
• TFL
• Standard/Extra
• Etc.
REA
DIN
ESS

8
Mission Systems
Enterprise Systems &
ServicesIT Security IT Management
End-User Devices and Support
Non-tactical Network Infrastructure
Hardware
• Processing and storage devices
• App development and testing devices
• Tactical data switching, routing, and wireless
• Processing and storage devices
• App development and testing devices
• Network intrusion monitoring devices
• Cryptographic hardware
• Hardware for IT admin and finance
• All end-user devices incl. printers (PCs, tablets, handhelds)
• Voice premise and Wide Area Voice hardware
• Non tactical data switching, routing, and wireless
Software
• Enterprise andstorage software
• App dev't and support software
• Tactical Network operations software and peripherals
• Enterprise andstorage software
• App dev't and support software
• Security software • Administrative software for IT
• End-user software (MS Office, email etc.)
• Non-tacticalNetwork operationssoftware and peripherals
Personnel
• O&M personnel for storage & servers
• App development & support personnel
• O&M personnel for storage & servers
• App development & support personnel
• IT security personnel
• CIO staff, IT admin staff
• Helpdesk/Service desk personnel
• End-user O&M
• Operations & maintenance (NOC) personnel
Facilities
and Power
• Facilities and power for data centers
• Facilities and power for data centers
External
Services
• Operations &maintenance contracts for storage and servers
• Development contracts for Apps
• Tactical voice anddata contracts
• Operations &maintenance contracts for storage and servers
• Development contracts for Apps
• Cybersecurity managed services
• Outsourced ITmanagement (incl. training, marketing)
• User Support Services
• IT service desk
• Non-tactical voice and data contracts
Ass
et
Capability
CODE will also exclude IT expendables (paper, ink, toner, CD and DVD media, etc.), consistent with the definition of IT in Clinger-Cohen Act
Information Technology: Cost Decision (CODE) framework

Populating the Framework

10
Followed five step process to populate CODE framework with data
Acquired raw data from complex systems landscape
Mapped data to CODE framework
Identified and assessed confidence levels
Closed data gaps where actuals were unavailable or unreliable
Validated mappings and confidence levels with key stakeholders
1
2
3
4
5

11
Navigated complex systems landscape to populate Is-Cost
SystemOrganization
Budgeting(Obl. Authority)
Procurement(Expected Obs.)
Execution(Obligations)
Army AFMCNavy
OSD
EFD
GFEBS PBIS-DB SABRSCRIS/
DEAMS
MC1 MC2 BSO1 BSO2 MC1 MC2 MC1 MC2
GFEBS SPS NAV-ITAS ITPRAS AFWay SPS
GFEBS STARS SABRS NAVY-ERP
SABRSCRIS/DEA
MS
Budgeting(Obl. Authority)
MC3MC3BSO3MC3MC3MC3 MC3MC3MC3 MC3MC3MC3
NAVY-ERP
DISA
WAAS
WAAS
WAAS
Cost Center
DHA
DAI
DAI
DAI
Cost Center
DLA
EBS
EBS
EBS
Cost Center
LMPPADS

12
All mappings and data gaps were validated with Service stakeholders
Navy NAV/EIE membersNAVFAC AONAVOP AO
NAVFAC contacts
Marines HQMC members Multiple AOs MCICOM contacts
Army ACSIM membersUSACE members
ACSIM AOs ACSIM contacts
Air Force AF/A4 members SAF-IE AOs SAF/FM contacts
OSD
EI&E membersDCMO membersDCFO membersDCFO members
DCFO contactsDCMOATL
Multiple data stewards
Steering Committee Action Officers Data Stewards
Sample list of key Real Property stakeholders for FY16
Over the course of the Real Property 300 Day Proof of Concept, we held:
• Over 150 interviews across all Services and 4th Estate agencies,
• Site visits to over 15 installation
• Over 20 “Supermarket” tours that focused on the Real Property CODE dashboards and how to enhance the dashboard visualizations

13
Real Property: Key themes and opportunities
Estimate potential savings through establishing and managing to cost performance baselines
Leased administrative space is within a 30-mile commute of dense DoD footprint
Potential for CODE analytics to inform regional consolidation
Wide variation in electricity spend
Significant lease spend near existing DoD facilities
Identification of regional clusters
Above: Electricity cost per square foot plotted for 400+ installations across all
Services (each dot is different installation)
Above: Administrative leases arrayed according to cost and amount of “nearby” owned/leased administrative facilities
Top: DoD sites with administrative square footage. Bottom: Top 20 “high density” clusters of administrative facilities

14
Key themes and opportunities for Medical
On average, MTFs are more expensive than equivalent workload performed in Purchased Care network• Adjusted to locality (where
possible)
Departments, MTFs, and Markets have large variance in cost performance when compared to peers• Controlled for potential
causes (e.g. readiness, GME, OCONUS, etc.)
Lower utilization rates drive inefficiencies in cost performance at Department, MTF, and Market levels
High spend compared to Purchased Care
MHS outliers define performance gaps
Low FTE utilization relates to high unit cost
MTFs above red line cost more than Purchased Care workload equivalent
Comparable MTFs have large variances in cost performance for same department
Physician utilization generally correlates with cost performance for each department/MTF combination

15
Information Technology: Key themes and opportunities
Delta with Commercial Reference model, driven primarily by:• External services • IT personnel
High concentration with top vendors, with long tail of spend
IT spend/FTE increases in MAJCOMS that have greater % of spend on external services
Higher spend compared to Commercial References
Lack of consolidation in third party vendors
Inefficiencies in usage of external service providers

16
The final end-user tool is composed of three primary components
View of what analogous commercial entity would incur in functional execution costs
Accounts for some systematic DoD-unique cost drivers
Commercial Reference (CORE) model
Consolidated DoD-wide view of annual execution costs aligned to cost decision (CODE) framework
Is-Cost model
Visualization dashboard
Interactive cost analytics views designed to aid in managerial decision making, e.g., • Internal and external benchmarking• Portfolio variance • Data quality assessment
17
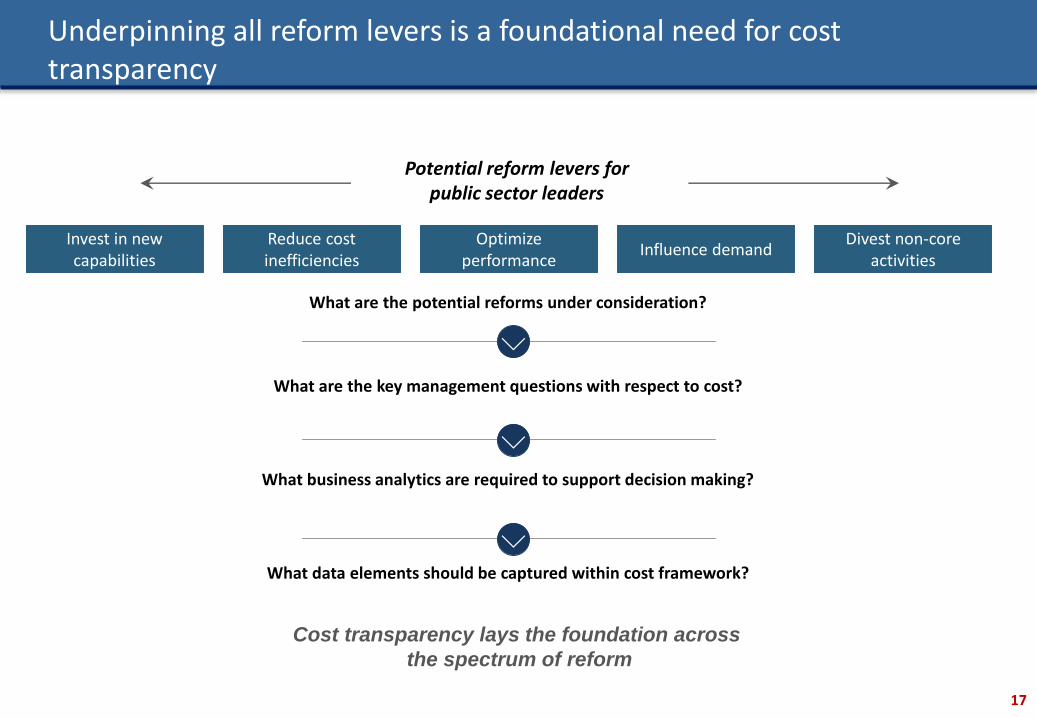
Underpinning all reform levers is a foundational need for cost transparency
Potential reform levers forpublic sector leaders
Invest in new capabilities
Divest non-core activities
Reduce cost inefficiencies
Optimize performance
Influence demand
What are the potential reforms under consideration?
What are the key management questions with respect to cost?
What data elements should be captured within cost framework?
What business analytics are required to support decision making?
Cost transparency lays the foundation across
the spectrum of reform

Sustaining the Framework

Tone-From-The-Top
The DEPSECDEF signed the Enterprise Cost Management Project Memo (JUL 13 2017) articulates DoD-wide
use of the CODE Model to inform cost decisions at enterprise level
• Enable a shift towards a cost-focused culture
• Ensure cost information is consistent and legitimate
• Provide accessible cost analytics to inform improved decision making
• Deploy the tools and technology required to enable the creation of standard ECM information
• Embed cost analytics in existing performance management processes
ECM Project Goals
19

Aligning Sustainment Activities with DEPSEC Memo
Using the Model
(End Users)
Maintaining the Model
(CODE Data Model
team)
Data Capture
(Data Stewards)
• Use standard set of reports, dashboards and visualizations in support of performance management and data quality improvement
• Collaborate with the CODE Data Model team on a regular basis to evolve the model utility
• Stand up sustainment groups at executive, functional, and financial level• Ensure the data model is accurate, updated and accessible to relevant users• Manage and update documentation as needed (e.g., business rules, SOPs) • Maintain and improve a set of standard reports, dashboards and
visualizations (in collaboration with the end user community)
• Support data refresh and validation efforts of new data uploads, assist in managing issue resolution, solving exceptions, etc.
• Understand CODE Data Model and how source data is being used within the model; collaborate with CODE Data Model team when source data environment has had a material change (e.g., changes to coding, system replacement, etc.…)
Demand management
and end user alignment
Liaison to data sources
and change control
20
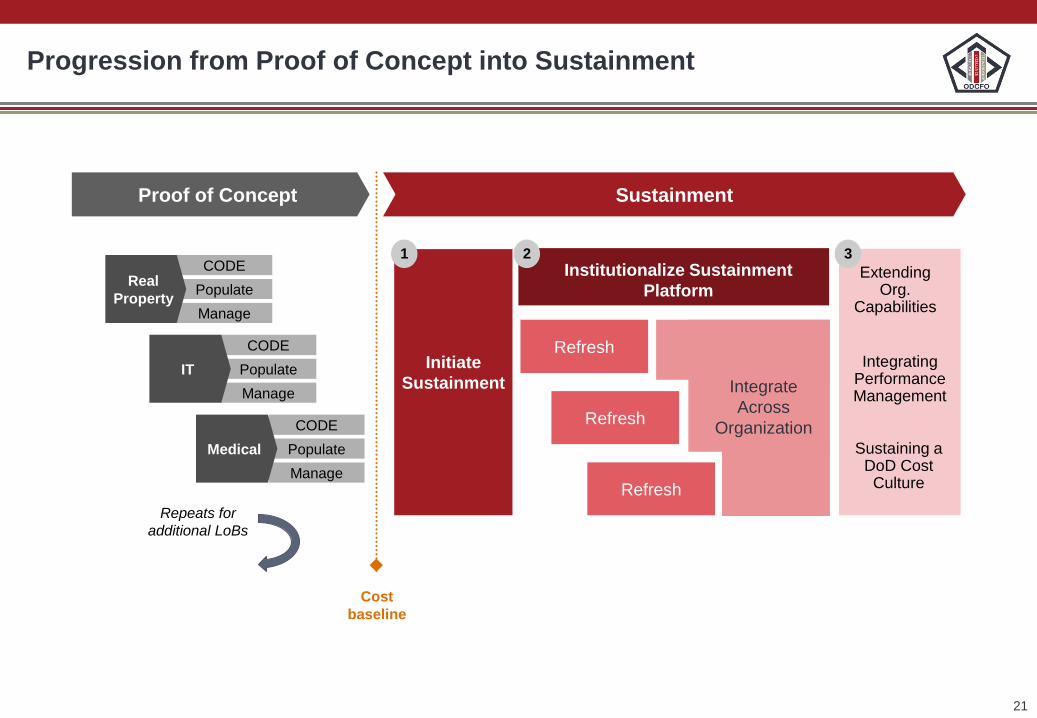
Initiate
Sustainment
CODE
Populate
Manage
Real
Property
Refresh
Refresh
Refresh
Cost
baseline
Proof of Concept Sustainment
CODE
Populate
Manage
IT
CODE
Populate
Manage
Medical
Repeats for
additional LoBs
Integrate
Across
Organization
1
Integrating Performance Management
Sustaining a DoD Cost Culture
Extending Org.
Capabilities
Institutionalize Sustainment
Platform
2 3
21
Progression from Proof of Concept into Sustainment

Comptroller Sustainment Focus
Cost Data Refresh and Analytics
Technology Enablement
Cost OperationsChange Management
& Governance
1 2 3 4
22

23
6
Launch
updated
CODE Model
3
Validate data
2
Request data
4
Iteratively
enhance
model
5
Sign off on ‘Is-
Cost’ Model
Making Proof of Concept Data Sustainable
Streamline
data sources
1

24
2
Review design &
build – provide
feedback
3
CODE BIO Team
builds updates
5
Launch updated
FY17 CODE
Model
Iterative
Apply change
control
process
4
Identify new
enhancements
1
Prioritize
identified
enhancements
Advancing Analytics to Enhancement the CODE Model

25
Financial
Reporting
Compliance /
Control
Decision Analytics on
Financial Performance
Decision Analytics on
Mission Performance
• Sound transaction
processing
• Creation of traditional
finance reports (e.g.,
balance sheet)
• Provide assurance on
strength of internal controls
and risk management
processes
• Perform cost
management analysis
• Provide resources for
performance review
• Link cost performance
data to related priority
mission objectives
• Partner on cost and
mission analytics
~ Annually ~ Quarterly ~ Montlhy or better ~ Daily / Real time /
predictive
Distributed, non-standard Distributed, standard Centralized, standard Centralized, standard,
automated
• Disaggregated systems
approached on a one-off
basis
• No enterprise view
• Disaggregated systems
• Central "translation"
ability via single taxonomy
• UoT collecting data from
multiple sources
• UoT central host system
• UoT leverages existing
data linkages to receive
specific updates/refreshes
• UoT central host system
• Automated feeds for cost
& audit
• Shared service provider
for analytics on financial
performance and cost
FM
RP
Med SC
IT
FM
RP IT
SCMed
FMRP
SC
HR IT
MedCFO
An
aly
tics
Pe
rfo
rme
dT
ime
Da
ta
Arc
hite
ctu
re
CF
O
Ro
le
Ro
le o
f
Uo
T
CFO impact
HigherLower
Driving to a Centralized, Standardized CFO Function

Functional/operations Financial
Data Stewards
Functional
Data
IT Executive Leadership
Comptroller
(DCFO-BIO)
OSD CIO
Leadership
Service
Comptrollers
(FM)
Service CIO
Leadership
Data Stewards
Cost Data
Engaging Financial and Functional CommunitiesS
tee
rin
g
co
mm
itte
eO
SD
Se
rvic
es
Part-time support
DCFO/
Comptroller
Leadership
CAPE
Cost
Management
TeamBIO
This requires vested leadership across Comptroller, CMO, and the functional community
Part-time support
CMO/DCFO
Change Champions
Change Agents
Se
rvic
es/O
SD
Working GroupWorking Group Working Group Working Group

Change Management Approach
Organization Engagement
Functions
Sustained
Change
Organization
Readiness
Organization
Engagement
Organization
Adoption
Organization Readiness Organization Adoption
• Stakeholder
management
• Communications
• Change network
• Change impact analysis
• Target organization
metrics
• Change readiness
assessment
• Training
• Support and monitoring
27

Fostering Stakeholder Engagement
The CODE Business Integration Office (BIO) Team will help facilitate Sustainment efforts by communicating
OSD’s cost management vision and enabling cross-LoB integration
The Cost Management Board is a meeting that connects the CODE BIO Team to the functional communities
and enables two-way communication
Cost Management Board
• An LoB-specific forum for
CODE BIO and Action
Officers (AOs) to discuss
pertinent cost management
topics
• Meetings are held on an
as-needed basis
• Enables CODE BIO Team
to provide updates on
milestones and next steps
for DoD’s ECM
• Functional communities
can provide insight/context
on relevant operational
issues, priorities, etc.
Functional Community
(LoB AOs)
• Provides functional-
specific context to cost
management questions
• Communicates and
escalates broader cost
issues and potential
impacts (e.g., source
system changes)
• Informs ODCFO on
current operating
environment
CODE BIO Team
• Communicates OSD
cost management
vision
• Facilitates AOG
progress towards
Sustainment
milestones
• Serves as a liaison
between OSD
ODCFO and the
functional
communities
28

Stakeholder Engagement & Change Leadership
AOG Members Leadership
• Improve the functionality and integrity of the
CODE Model
• Provide strategic direction for CODE Model,
based on LoB-specific and OSD priorities
• Fulfill data requests to support the refresh
process and enhancements to the CODE
Model
• Review and provide input on AOGs’ progress to
confirm alignment with OSD and functional
community priorities; approve critical changes
• Serve as a Subject Matter Resource to
support closure of data gaps and validate
data mapping
• Define AOG members, remove obstacles to
Sustainment efforts’ progress
Direction from OSD and
Functional Leadership
AOG 2
Analytics
Advancement
AOG 1
Data
Refresh
AOG 3
Data Quality &
Standards
Service, Functional, and Financial Management (FM)
representation
Roles & Responsibilities
• OSD ODCFO and DCMO, in
coordination with functional
communities, may “activate”
AOGs to improve the
functionality and integrity of
the CODE Model in an
adaptive, flexible approach
• Members of the activated AOG
will depend on the objective
and scope of the issue
29

Change Process
The commitment curve is used to track progress of stakeholders and serves as a stage gate for
realizing when the objective of communications can shift to the next phase
Inform Engage Enable
Hear it Believe it Live it
Awareness Understanding Buy-in Transition Reinforcement
Achieving desired communication outcomes can help DoD’s shift to a
cost-focused culture progress along the commitment curve
30

Data mapping
confidence scores
Allocations for
capability/asset
applied as
appropriate
Product overlay
based on
commercial
reference model
Shared
services allocation
Spend is categorized to CODE assets and capabilities based on GL data elements
Allocations to CODE capabilities and assets include
Spend is allocated to products according to commercial references
Shared services are identified by spikes in spending on a given capability and allocated to customers
Closing data gaps
1 2 3 4

Desired Communication Outcomes
Functional communities and financial managers across the Services and Defense Agencies/Components, at the executive- and stakeholder-levels, should understand:
• What is happening?
• Why is it happening?
• Who is impacted?
• What are the implications of the change?
• What will happen?
• What they are expected to do and when they are expected to do it?
• How they will be supported through the change?
32

Reactive / Manual Proactive / Automated
Analyze Cleanse Control Enhance
• Define, group and prioritize critical data elements; document in CODE data dictionary
• Identify data quality issues (CODE data quality heat maps)
• Define profiling metrics and thresholds
• Prioritize data requiring remediation on profiling / analysis and cleansing complexity
• Identify trusted source data provider
• Design cleansing program for existing data identified during profiling / analysis
• Identify process / systems improvements for timeliness and validity issues
• Identify data quality issues resulting from lack of optimized controls around the entry, movement and provision of data
• Identify issues to be remediated
• Develop system or compensating controls to address data quality issues at source for systems / processes unaffected by the future state (typically source systems)
• Design continuous data quality monitoring tools to identify data quality issues as they enter the pipeline
• Design processes for the identification of data quality issues by the end user, providing channels for issue resolution
Establish a framework to guide data management and data
quality improvement
33
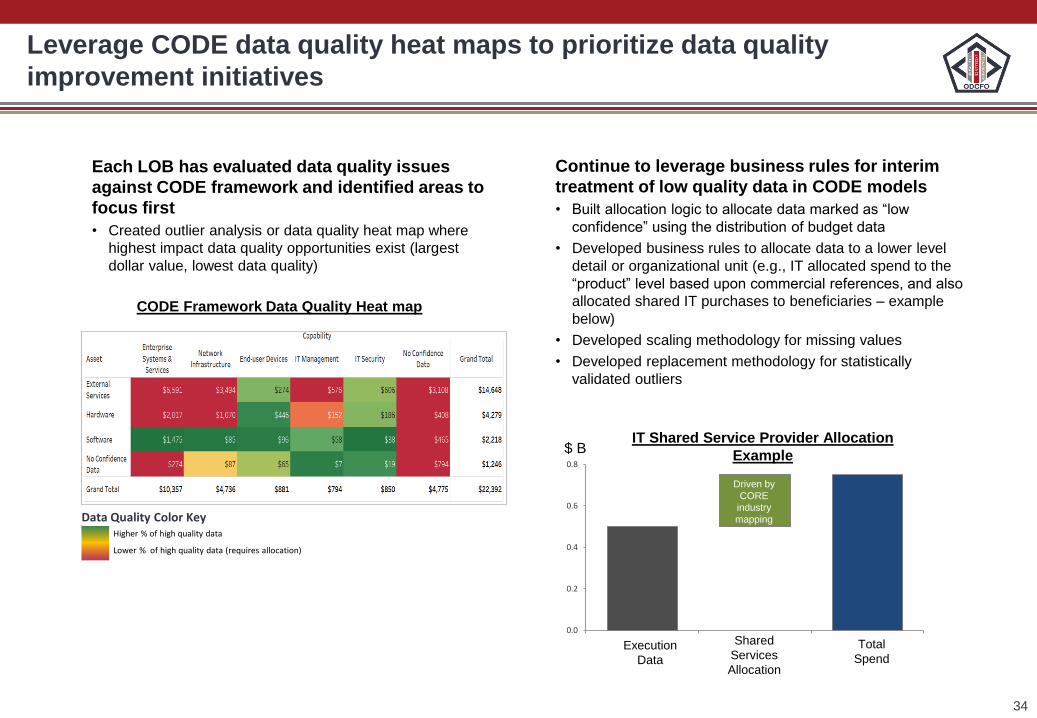
Each LOB has evaluated data quality issues
against CODE framework and identified areas to
focus first
• Created outlier analysis or data quality heat map where
highest impact data quality opportunities exist (largest
dollar value, lowest data quality)
CODE Framework Data Quality Heat map
1,2
Continue to leverage business rules for interim
treatment of low quality data in CODE models
• Built allocation logic to allocate data marked as “low
confidence” using the distribution of budget data
• Developed business rules to allocate data to a lower level
detail or organizational unit (e.g., IT allocated spend to the
“product” level based upon commercial references, and also
allocated shared IT purchases to beneficiaries – example
below)
• Developed scaling methodology for missing values
• Developed replacement methodology for statistically
validated outliers
Data Quality Color KeyHigher % of high quality data
Lower % of high quality data (requires allocation)
0.0
0.2
0.4
0.6
0.8
Execution
Data
$ B
Total
Spend
Shared
Services
Allocation
Driven by
CORE
industry
mapping
IT Shared Service Provider Allocation
Example
Leverage CODE data quality heat maps to prioritize data quality
improvement initiatives
34
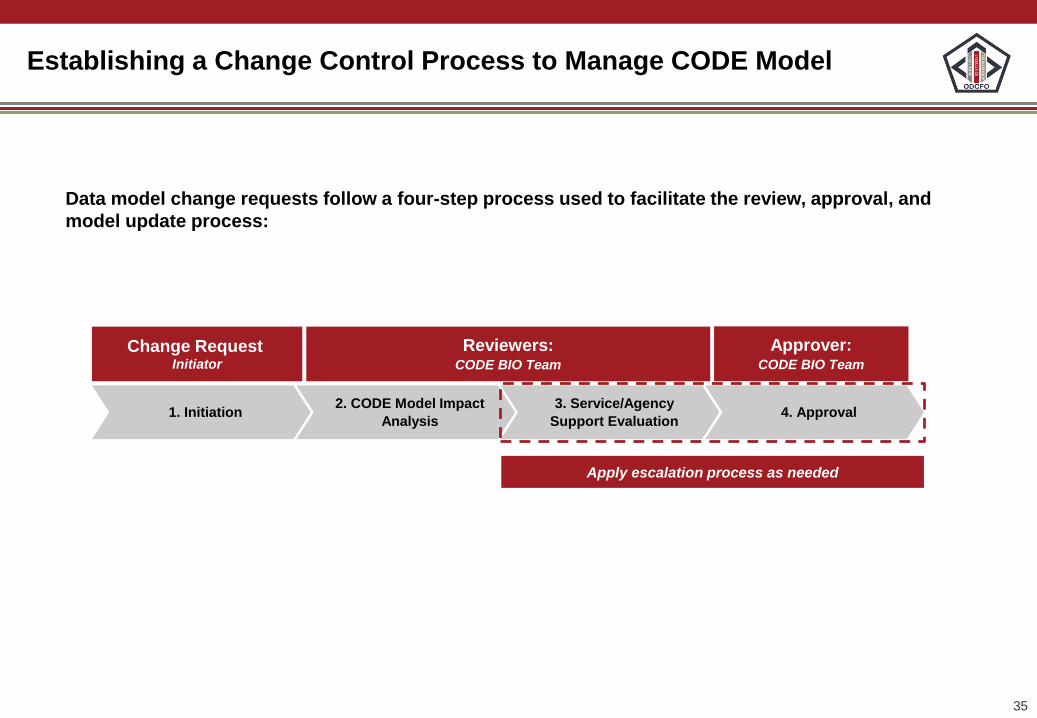
1. Initiation2. CODE Model Impact
Analysis
3. Service/Agency
Support Evaluation 4. Approval
Change Request Initiator
Reviewers:CODE BIO Team
Approver:CODE BIO Team
Establishing a Change Control Process to Manage CODE Model
Data model change requests follow a four-step process used to facilitate the review, approval, and
model update process:
Apply escalation process as needed
35

Change Request
TypeDescription Example
Technical IssueDashboard or dashboard function is
malfunctioning/not working properly
End-user filters within a dashboard and it
returns a blank visual or error message
Data Quality Issue Dashboards present cost/visuals that seem
incorrect or not aligned with what is expected
End-user believes electrical costs should be
significantly higher and is unsure why
ClarificationLack of understanding of what/how to
interpret a dashboard/data
End-user is unsure on how to read a graph
and needs assistance to develop an
understanding
Dashboard view
Altering dashboard functionalities,
capabilities to meet end-user needs and / or
a new visualization
End-user would find it beneficial to add a
filter for a particular visual or see a pie chart
instead of a bar graph
Additional / new dataRequest to add new data that does not exist
in the current data model
End-user requests to see contracting data,
which is not currently in CODE data model
Document and categorizes CRs in
internal log
1
Evaluates CRs based on defined criteria
2
Communicates status and decision to an end
user
3
Managing future requests with Change Request Categorization
36

Defining a path forward for end-user training
Develop and deliver training
Establish vehicles for delivery
Establish
curriculum
needed for each
user community
Identify user
communities
requiring training
3 4
Define, plan, and implement organizational change levers6
Establish vision,
governance, and
leadership alignment
1 2 5
37

Training Content and Activities
Delivery channels Material/Activity Descriptions
Self-service
Documentation
(MilSuite)
Data Model PlaybookDocuments overall design of LoB-specific data models (e.g.,
approach, framework, mappings, business rules)
Tableau access instructionsProvides step-by-step instructions, for new users, on how to
access and use the CODE Model Tableau dashboards
Detailed design documents Describes data sources, fields, mapping, transformations, and
step-by-step instructions to populate the data model
End-user dashboard training
material
Describes how to navigate dashboards, interpret data, and
draw insights to help facilitate value-driven cost performance
discussions, specific to each LoB
Tableau Skillsoft coursesProvides intermediate-level instructions on how to use the
Tableau software
MilTube “Supermarket”
videos
Walks through the latest set of dashboards after the data
model has been refreshed
Instructor-led
Training CODE Model dashboard
demos
Provides interactive training for end-users on how to engage
with CODE Model (e.g., traditional “Supermarket Tour”)
Sho
rt-t
erm
Lon
g-te
rm
38

Data Model Playbook
CODE Data Model Playbook
Design
Populations of Actuals
Functional-specific Data
CORE Data
Business Rules and Allocations
Overview of Dashboards
Define the LoB-specific CODE Framework and segment into
Products
Describe the cost data gathering process for each Service and
provide snapshot “Is-Cost” views
Guide to LoB-specific performance data (e.g., RPAD and
workload)
Outline the methodology for commercial reference factbase and
summarize its use
Summarize standardized rules required for apples-to-apples cost
comparisons across the Service actuals
Provide example dashboard visualization produced by the Model
as well as summarized views of cost information
39

Tableau End-user Training GuideMedical LoB
Medical CODE Tableau End-user Training Guide
Enterprise View
MTF Management
Department Management
Training & Education
Command & HQ
Purchase Care Overlay
Defining Readiness
Readiness
Review cost across segment (e.g., direct care), Service, and
cost type (e.g., personnel, supplies)
Review cost at the military treatment facility- (MTF-) level across
Services
Review and compare direct care costs at MTF- and HQ-levels
Identify opportunities to make vs. buy
Understand how the definition of readiness can impact cost
Highlight opportunities to improve readiness across the Military
Health System (MHS), based on selected definition
Review MTF cost by department (e.g., Surgical)
Review training and education costs across Services
40

Visualizing the Framework

Insights-to-Action Approach
Systems
Data
Management
Policies &
ProcessFinance &
Accounting
Systems
Data
Management
Policies &
ProcessFinance &
Accounting
Innovative
Team BCG
approach
Traditional
approach
Insights
Rapid insights
up front
Infrastructure tailored based on up front insights
$
$
Insights front-
loaded to enable
immediate action
Insights back-
loaded and
often
underperform
Can take up to five years to achieve actionable insights
Leveraging Team BCG
innovative analytic approach
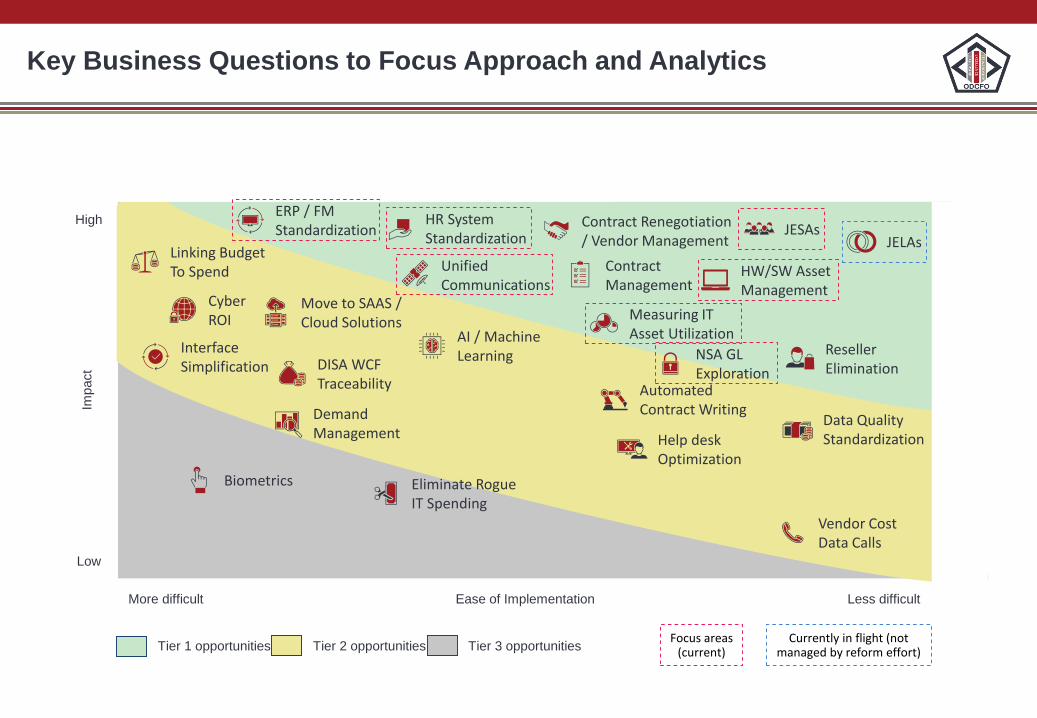
Tier 1 opportunities Tier 2 opportunities Tier 3 opportunities
Low
High
Impact
More difficult Less difficultEase of Implementation
CyberROI
AI / MachineLearning
Vendor CostData Calls
ResellerElimination
Biometrics
DemandManagement
Eliminate Rogue IT Spending
DISA WCFTraceability
InterfaceSimplification
Move to SAAS /Cloud Solutions
Focus areas(current)
Data QualityStandardizationHelp desk
Optimization
Linking BudgetTo Spend
ERP / FMStandardization
JELAs
HW/SW AssetManagement
JESAs
Measuring ITAsset Utilization
HR SystemStandardization
UnifiedCommunications
Currently in flight (not managed by reform effort)
NSA GLExploration
Contract Renegotiation / Vendor Management
ContractManagement
AutomatedContract Writing
Key Business Questions to Focus Approach and Analytics

Key Business Questions to Focus Approach and Analytics
Preliminary
Costs as
% Total1
~35% ~30% ~20% ~10% ~3% ~2%
HQ Transport Store Source Plan Return
~20% Personnel
~20%Contract
Services
~5% Facilities
~2% Equipment
~2% IT
~1% Other
~50% Materials
Supply Chain Function
Co
st T
ype
2. How do overhead
costs compare to
benchmarks?
3. What is the value of optimizing transport?
4. How do outsourced
costs compare to insourced?
5. Is there opportunity
to consolidate
warehouses?
6. Are procurement processes & personnel efficient?
7. What is the cost of
non-optimal demand signals?
1. Are personnel at efficient levels to manage workload?
8. Are IT investments improving cost efficiency?
10. What is the cost of non-optimal category management?
Cost optimization opportunity based on supply function and cost type
Relatively HighRelatively Low
9. What is the cost of non-optimal supply chain planning
and execution?
44

Real Property: CODE gives Installation-level cost comparisons
across all categories of spend
Specific installations
Categories of spend (ex: construction, utilities, custodial, operations, etc.)
Service-level spend and installations considered in-scope

Real Property: Flexibility to compare costs across installations
Spec
ific
inst
alla
tio
ns

IT: cost comparison of current spend against commercial
references
External services
Personnel
Hardware
Software
Facilities

Medical: CODE heatmap of medical spend by both purchased
and direct care
Purchased care - levels of spend by color
Direct care

Management Questions to Drive Analytical Insights
How do overhead costs compare to benchmarks?
Are personnel at efficient levels to manage workload efficiently?
Is there opportunity to consolidate warehouses?
Are IT investments improving end-to-end cost efficiency?
49
Are there cost efficiency
opportunities for overhead
centralization or decentralization
within the DoD?
Compare overhead
breakdown to commercial
benchmarks
Overhead costs misallocated based
on total cost of activity; potentially
skewed to low-activity functions
Are personnel positions higher-
graded in certain areas?
Functions? Across Services?
Compare personnel cost
by tenure by function for
similar levels
DoD organizations are conducting
similar tasks, but one has relatively
higher-graded and/or layered
workforce
What are potential cost savings
from consolidating warehouses?
Identify facilities costs of
warehouses and
differentiate by storage
type
Significant facility and overhead costs
to maintain underutilized warehouses
Detailed sub-questions Analysis & Visualization Potential Insights
Does spend on supply chain
enabling IT and non-IT equipment
improve supply chain cost
performance?
Spend on supply chain
enabling IT equipment,
maintenance and
personnel as a percentage
of supply chain operating
costs
Insufficient IT capabilities for
automated process workflows

Question: Where is medical treatment facility consolidation likely
to yield cost savings?
Relevant Audience: Defense Health Agency seeking opportunities for cost efficiencies in its oversight of
healthcare administration
Insight
(provided to
date):
A. To evaluate Military Treatment Facilities and clinical departments for consolidation
opportunities
B. To identify clinical departments that could benefit from improved utilization of clinicians
through consolidation
Desired Data
Frequency:
Financial Management Sources (quarterly): GFEBS, STARS-FL, CRIS, DAI
Non-Financial Management Sources (quarterly): MHS MDR workload, PCOLS, FPDS, DHMRSi,
DMDC
Limited benefits to
increased utilization in
Primary Care
Increasing
utilization drives
down unit cost in
OBGYN
Question: Are there inefficiencies in the usage of external service
providers?
Relevant Audience: Procurement and FM Action Officers seeking opportunities for cost efficiencies to consolidate
contracts with vendors to increase DoD buying power
Insight
(provided to
date):
A. To understand IT spend/FTE increases in MAJCOMS that have greater percentage of spend
on external services
B. To indicate inefficient outsourcing to determine opportunities
C. To identify potential redundancies with in house personnel use in services and contracts
being provided by external service providers
Desired Data
Frequency:
Financial Management Sources: Annually
Non-Financial Management Sources: Annually
Dashboard provides user
with visibility into
MAJCOMS effectiveness
in outsourcing IT projects.
With outsourcing the
internal organization
should be more effective
Dashboard provides user
with visibility into areas
where DoD can become
more effective in
outsourcing of IT projects

Question: How can Components identify inefficiencies within
their Real Property operating costs?
Relevant Audience: Component installation portfolio management organizations seeking to reduce facility
operating costs
Insight
(provided to
date):
A. To assess materiality and variability of operating cost across installations
B. To “shine a spotlight” on a subset of installations where greatest opportunity for cost
reduction exists
C. To prioritize outlier installations where operating cost per sq. ft. is relatively high
Targets costly installations compared on a square foot basis against installations within the
same Service and in other Services
Desired Data
Frequency:
Financial Management Sources: Monthly
Non-Financial Management Sources: Annually
Installations with greatest cost /
square foot should be primary
focus of additional follow up
Median cost / square foot can be
used to calculate potential
savings targets for cost
management initiatives aimed at
bringing underperforming
installations in line

53
Financial
Reporting
Compliance /
Control
Decision Analytics on
Financial Performance
Decision Analytics on
Mission Performance
• Sound transaction
processing
• Creation of traditional
finance reports (e.g.,
balance sheet)
• Provide assurance on
strength of internal controls
and risk management
processes
• Perform cost
management analysis
• Provide resources for
performance review
• Link cost performance
data to related priority
mission objectives
• Partner on cost and
mission analytics
~ Annually ~ Quarterly ~ Montlhy or better ~ Daily / Real time /
predictive
Distributed, non-standard Distributed, standard Centralized, standard Centralized, standard,
automated
• Disaggregated systems
approached on a one-off
basis
• No enterprise view
• Disaggregated systems
• Central "translation"
ability via single taxonomy
• UoT collecting data from
multiple sources
• UoT central host system
• UoT leverages existing
data linkages to receive
specific updates/refreshes
• UoT central host system
• Automated feeds for cost
& audit
• Shared service provider
for analytics on financial
performance and cost
FM
RP
Med SC
IT
FM
RP IT
SCMed
FMRP
SC
HR IT
MedCFO
An
aly
tics
Pe
rfo
rme
dT
ime
Da
ta
Arc
hite
ctu
re
CF
O
Ro
le
Ro
le o
f
Uo
T
CFO impact
HigherLower
Driving to a Centralized, Standardized CFO Function

Thank you