Office of the Chief Human Capital Officer 2007 Employee Survey - Homeland Security · PDF...
70
Office of the Chief Human Capital Officer 2007 Employee Survey Engaging the Workforce
Transcript of Office of the Chief Human Capital Officer 2007 Employee Survey - Homeland Security · PDF...

Office of the Chief Human Capital Officer
2007 Employee Survey Engaging the Workforce
Department of Homeland Security: 2007 Annual Employee Survey (AES) Management Report
April 17, 2008
Prepared for: Department of Homeland Security Office of the Chief Human Capital Officer
Prepared by: WESTAT Rockville, Maryland

(This page intentionally left blank)

Table of Contents Survey Background................................................................................................................. 1
Survey Objective .............................................................................................................. 1 Questionnaire Content .................................................................................................... 1 Data Collection ................................................................................................................. 1 Reported Data................................................................................................................... 1 Survey Items and Response Choices ............................................................................. 1 Crosstabulation Results................................................................................................... 2 HCAAF Index-Level Percent Positive Response ......................................................... 2 Comparing Your Survey Results ................................................................................... 3
Organization of the Report .................................................................................................... 3 Respondent Characteristics.................................................................................................... 4 Human Capital Assessment & Accountability Framework .............................................. 5 Performance Appraisal Assessment Tool (PAAT) Items .................................................. 9 Greatest Increases and Decreases Since 2006 FHCS ........................................................... 10 Strengths and Challenges ...................................................................................................... 11 General Perceptions about the DHS Organizational Culture ........................................... 13
Personal Work Experience.............................................................................................. 13 Recruitment, Development, and Retention .................................................................. 14 Performance Culture ....................................................................................................... 15 Employee Perceptions about Leadership ..................................................................... 16 Overall Workplace Satisfaction...................................................................................... 17
Decision Aid............................................................................................................................. 19 Overall Summary .................................................................................................................... 23 Recommendations for Action Planning ............................................................................... 24 Appendix A: Question-level Results .................................................................................... 27 Appendix B: Demographic Characteristics.......................................................................... 61
List of Tables Table 1. Characteristics: DHS Survey Population and Survey Respondent
Percentages ............................................................................................................ 4 Table 2. DHS Component-level Distribution................................................................... 6 Table 3. Performance Appraisal Assessment Tool: Percent Positive Results ............. 9 Table 4. Top 5 Increases and Decreases from 2006 to 2007 Survey Results................. 10
List of Figures Figure 1. DHS 2006 & 2007 HCAAF Results...................................................................... 5 Figure 2. Component-level HCAAF Percent Positive Results ........................................ 7 Figure 3. Agency Strengths .................................................................................................. 11 Figure 4. Agency Challenges ............................................................................................... 12 Figure 5. Personal Work Experience................................................................................... 13 Figure 6. Recruitment, Development, & Retention........................................................... 14 Figure 7. Performance Culture ............................................................................................ 15 Figure 8. Leadership ............................................................................................................. 16 Figure 9. Overall Workplace Satisfaction........................................................................... 17

(This page intentionally left blank)

2007 DHS Annual Employee Survey 1
2007 DEPARTMENT OF HOMELAND SECURITY ANNUAL EMPLOYEE SURVEY: SURVEY BACKGROUND
SURVEY OBJECTIVE
The 2007 DHS Annual Employee Survey (AES) was conducted to collect data on DHS employees’ perceptions of workforce management, organizational accomplishments, agency goals, leadership, and communication. DHS agency managers will use the findings to help sharpen polices for improving our agency performance.
QUESTIONNAIRE CONTENT
The survey included a total of 78 items/subitems — 45 OPM prescribed items (40 survey questions and 5 demographic items), 5 additional demographic questions, and 28 DHS agency-specific items.
DATA COLLECTION
Method. The survey sample included a total of 141,425 DHS employees across the 13 organizational components. The survey was administered electronically from October 26 through December 21, 2007. Weekly reminders were emailed to all eligible nonrespondents to the survey. Technical support was provided via email and telephone to employees with questions or comments about the survey.
The sample was designed to ensure representative survey results would be reported by component and supervisory status (i.e., non-supervisory, supervisors and managers, and executives) as well as for the overall DHS workforce.
Response Rate. A total of 65,753 of 141,160 eligible employees responded to the survey, for a DHS-wide response rate of 47%.
REPORTED DATA
The percentages presented in report tables are weighted data that are representative of the survey population of the DHS workforce. The survey data collected from DHS AES respondents (employees) were weighted to produce survey estimates that accurately represent the DHS population. This process did not change any answers; rather, it adjusted for over – and under-represented groups of respondents.
SURVEY ITEMS AND RESPONSE CHOICES
Three 5-point Likert-type response scales were used in the survey: (a) Strongly Agree, Agree, Neither Agree nor Disagree, Disagree, Strongly Disagree; (b) Very Satisfied, Satisfied, Neither Satisfied nor Dissatisfied, Dissatisfied, Very Dissatisfied; and (c) Very Good, Good, Fair, Poor, Very Poor. For questions 6 through 31 of the survey, respondents had the additional option of answering Do Not Know or No Basis to Judge.
The tables throughout the remaining sections of this report contain the percentages of positive, neutral, and negative responses for each survey item (all percentages in this document have been rounded to whole numbers). For most items, Positive, Neutral, and Negative were defined as follows:

2 Management Report
Percent Positive: the combined percentages of respondents (DHS agency-wide or specific component level) who answered Strongly Agree or Agree, or Very Satisfied or Satisfied, or Very Good or Good, depending on the response categories used for the item.
Percent Neutral: the percentage of respondents choosing the middle response option in the 5-point scale (Neither Agree Nor Disagree, Neither Satisfied Nor Dissatisfied, Fair).
Percent Negative: the combined percentages of respondents answering Strongly Disagree or Disagree, or Very Dissatisfied or Dissatisfied, or Very Poor or Poor, depending on the response categories used for the item.
Survey Response Categories
Positive Neutral Negative Don’t Know/
No Basis to Judge
Strongly Agree Agree Neither Agree Nor Disagree
Disagree Strongly Disagree Don’t Know
Very Satisfied Satisfied Neither Satisfied Nor Dissatisfied
Dissatisfied Very Dissatisfied No Basis to Judge
Very Good Good Fair Poor Very Poor NA
In the text, when a statement appears that X percentage “agreed” with the item, the percentage includes both those responding Agreed or Strongly Agree to the item. Similarly, “disagreed” represents those who said Disagree or Strongly Disagree.
CROSSTABULATION RESULTS
Under the heading of “Notable Subgroup Findings,” the results of the selected crosstabulations highlight differences in perceptions within population subgroups. The subgroups examined were Gender, Race/Ethnicity, and Supervisory Status. For the crosstabulations, members of subgroups were combined if necessary to achieve two categories for each subgroup. For example, for the supervisory status subgroup the “supervisor” category includes supervisors, managers, and executives, and the “nonsupervisory” category includes nonsupervisors and team leaders.
For the race/ethnicity subgroup, non-minority respondents (White) represent one category, and the minority category includes respondents who identified themselves as Asian/Pacific Islander, Hispanic/Latino, Black/African American, American Indian/Alaska Native, or Other.
HCAAF INDEX-LEVEL PERCENT POSITIVE RESPONSE
Thirty-nine items were combined to form the four Human Capital Assessment and Accountability Framework (HCAAF) Indices. The index scores were calculated for each component and DHS overall by averaging the percent positive response on the items within an index. For example, for a 4-item index, if the item-level percent positive responses were 50 percent, 45 percent, 30 percent, and 35 percent, the component’s HCAAF-level percent positive response would be the average of these four percentages or (50% + 45% + 30% + 35%)/4 = 40% positive.

2007 DHS Annual Employee Survey 3
COMPARING YOUR SURVEY RESULTS
Statistically significant differences between percentages. You may be interested in determining the statistically significant differences between your component organization and DHS overall. Statistical significance is influenced by sample sizes, so that as the number of observations in comparison groups gets larger, small differences in scores will end up being statistically significant. While a 1 percent difference between percent positive scores might be statistically significant (that is, not due to chance), the difference is not likely to be meaningful or important, and nonsignificant differences are not always trivial.
It is often useful to apply rules of thumb to determine the “notable” and “meaningful” results especially when comparing your 2007 DHS AES results to 2004 and 2006 Federal Human Capital Survey benchmark results. Therefore, we recommend the following guidelines:
5 percentage points. A difference of 5 percentage points or more is notable (e.g., increased by 5 percentage points from 2006 to 2007 or a difference of 5 percentage points or more between subcomponent results).
Strengths. Survey items that are 65 percent or more positive are considered an area of strength.
Challenges. Survey items that are 35 percent or more negative are areas of weaknesses.
Neutral. Responses that are 30 percent or more neutral may indicate opportunities for more communication.
Organization of the Report
The remainder of this document contains a profile of the respondents and the survey results. The survey results present multiple perspectives; these various views allow for a broad but interconnected picture of the State of DHS. The survey results are presented in the following order:
Human Capital and Accountability Framework
Performance Appraisal Assessment Tool
Greatest Increases and Decreases in Positive Responses since 2006 FHCS
Strengths and Challenges
General Perceptions about DHS Organizational Culture
Decision Aid
The report closes with an overall summary of the findings and recommendations for action planning derived from the findings.
The report appendix includes question-level results for DHS-wide and for each of the 13 components. The results are presented according to the question order in the survey and have been grouped into Positive, Neutral, Negative, and Do Not Know/No Basis to Judge (as applicable) categories.

4 Management Report
Respondent Characteristics
The proportions of respondents reporting various demographic and work-related characteristics were similar to the proportions of the total DHS population with those characteristics (Table 1). However, there were two notable differences: A higher proportion of Whites and Supervisors completed the survey than the proportion in DHS’s survey population.
Table 1 summarizes respondent’s answers to demographic questions (survey items 59-66). See Appendix B for more detail information about survey respondents’ characteristics.
Table 1. Characteristics: DHS Survey Population and Survey Respondent Percentages
Percent Characteristics Survey
Population Survey
Respondents‡
Supervisory Status Non-supervisor 86 61 Team Leader NA 16
Subtotal (Non-supervisor) 86 77 Supervisor 14 15 Manager NA 7
Subtotal (Supervisor) 14 22 Executive <1 1
Gender Male 68 66 Female 32 33
Are You: Hispanic or Latino Yes 19 16 No 81 80
Racial Category White 60 72 Black or African American 15 12 Native Hawaiian or Other Pacific Islander <1 1 Asian 4 4 American Indian or Alaska Native 1 1 Two or more races (not Hispanic or Latino) <1 2
Agency Component Office of the Secretary 1 1 Office of Inspector General <1 1 Under Secretary Management <1 1 Under Secretary National Protection and Programs* 1 <1 Under Secretary Science & Technology <1 <1 Citizenship and Immigration Services 5 6 U.S. Coast Guard 5 8 Customs and Border Protection 31 28 Federal Emergency Management Agency 2 2 Federal Law Enforcement Training Center 1 1 Immigration and Customs Enforcement 11 11 U.S. Secret Service 4 4 Transportation Security Administration 39 37

HUMAN CAPITAL ASSESSMENT AND ACCOUNTABILITY FRAMEWORK
Figure 1 shows the results of the four Human Capital Assessment and Accountability Framework (HCAAF) Indices that were developed as part of OPM’s Federal Human Capital Survey (FHCS). Percent positive results are presented for the 2006 FHCS and the 2007 DHS AES. The HCAAF indices are one measurement of performance that will enable you to track DHS progress in strategic human capital management. The HCAAF indices are: Leadership and Knowledge Management, Results-Oriented Performance Culture, Talent Management, and Job Satisfaction. Descriptions of the indices, as well as the survey items that make up each of the indices, are as follows:
Leadership & Knowledge Management Index: the extent our employees hold leadership in high regard; this index captures both overall as well as specific aspects of leadership. (See survey items: 5, 22, 24, 25, 26, 27, 29, 30, 31, 50, 54a, and 58)
Results-Oriented Performance Culture Index: the extent employees believe DHS culture promotes improvements in process, products and services, and organizational outcomes. (See survey items: 1, 8, 10, 14, 15, 16, 18, 19, 20, 21, 23, 28, and 53)
Talent Management Index: the extent our employees believe DHS has the talent required to accomplish our organizational goals. (See survey items: 2, 6, 7, 11, 12, 13, and 55)
Job Satisfaction Index: the extent our employees are satisfied with their jobs. (See survey items: 3, 4, 9, 51, 52, 56, and 57)
Figure 1. DHS 2006 & 2007 HCAAF Results
Human Capital Assessment and Accountability Framework (HCAAF) Indices:Positive Responses
46%42%
49%
58%
44%49%
58%
48%
0%
20%
40%
60%
80%
100%
Leadership & KnowledgeManagement
Results-OrientedPerformance Culture
Talent Management Job Satisfaction
Percent Positive
FHCS 2006 DHS AES 2007
2007 DHS Annual Employee Survey 5

6 Management Report
Overall, the 2007 AES results for all four indices are equal to or slightly more positive than similar results from 2006 FHCS, and range from 44 percent to 58 percent positive. Responses improved slightly for two of the four indices—Leadership and Knowledge Management and Results-Oriented Performance Culture. The two other indices, Talent Management and Job Satisfaction, remained at the same levels over 2006-2007.
Results indicate that DHS employees are generally more satisfied with their jobs than they are with the leadership and culture found within the agency. Of the four indices measured, employees were least positive about factors influencing the performance improvement processes within DHS (Results-Oriented Performance Culture Index). This finding is consistent with the 2006 results.
DHS Component-level HCAAF Results. In order to better understand results that are presented by component, Table 2 shows the unweighted and weighted counts of employees who completed the 2007 DHS AES. Because the Transportation Security Administration (TSA) and Customs and Border Protection (CBP) components make up 70 percent of the overall DHS total, employee responses from these two components significantly influence the DHS–wide results.
Table 2. DHS Component-level Distribution
Unweighted Count
Weighted Count Percent
Cumulative Percent
DHS-wide 65,753 141,141 100.0% Transportation Security Administration 24,494 54,610 38.7% 38.7% Customs and Border Protection 18,166 44,475 31.5% 70.2% Immigration and Customs Enforcement 6,959 13,881 9.8% 80.0% U.S. Coast Guard 5,341 8,668 6.1% 86.2% Citizenship and Immigration Services 4,271 6,965 4.9% 91.1% U.S. Secret Service 2,686 5,728 4.1% 95.2% Federal Emergency Management Agency 1,273 2,574 1.8% 97.0% Federal Law Enforcement Training Center 558 862 0.6% 97.6% Under Secretary Management 449 702 0.5% 98.1% Office of the Secretary 417 637 0.5% 98.6% Office of Inspector General 336 515 0.4% 98.9% Under Secretary National Protection and Programs 244 438 0.3% 99.2% Under Secretary Science & Technology 162 252 0.2% 99.4% Missing, no component indicated 397 834 0.6% 100.0%
Component-level HCAAF Results
Figure 2 presents the 2007 HCAAF results for DHS-wide and for the 13 individual components. In general:
Index scores range from 40 to 71 percent across all components for the four indices. As mentioned earlier, the range across the DHS-wide scores for all four indices was 44 to 58 percent.
Leadership and Knowledge Management index component scores range from 45 to 63 percent while the DHS score is 48 percent. Three components scored lower than the DHS average.
Results for the second index, Results-Oriented Performance Culture, are generally less positive than the Leadership and Knowledge Management index. The DHS-wide average for the Results-Oriented Performance Culture index is 44 percent, while component scores range from 40 to 60 percent. Only two components scored lower than the DHS average.

Figure 2. Component-level HCAAF Percent Positive Results
2007 DHS Annual Employee Survey 7
Human Capital Assessment and Accountability Framework (HCAAF) Index:Leadership & Knowledge Management
51%59% 57% 55%
62%55%
63%
45%49%
61%
45%
59%
45%48%
0%
20%
40%
60%
80%
100%
DHS-wide
Office o
f the S
ecret
ary
Office o
f Insp
ector G
enera
l
Under Sec
retary
Man
agem
ent
Under Sec
retary
Nati
onal Pro
tectio
n and Pro
grams
Under Sec
retary
Science
& Tec
hnology
Citizen
ship an
d Immigrat
ion Service
s
U.S. Coas
t Guard
Customs a
nd Bord
er Pro
tectio
n
Federa
l Emerg
ency
Man
agem
ent A
gency
Federa
l Law
Enforcemen
t Trai
ning Cen
ter
Immigrat
ion and C
ustoms E
nforcemen
t
U.S. Sec
ret Serv
ice
Transp
ortatio
n Securit
y Administ
ration
Percent Positive
Human Capital Assessment and Accountability Framework (HCAAF) Index:Results-Oriented Performance Culture
49%
59%52% 54% 55%
51%57%
42%50%
60%
46%54%
40%44%
0%
20%
40%
60%
80%
100%
DHS-wide
Office o
f the S
ecret
ary
Office o
f Insp
ector G
enera
l
Under Sec
retary
Man
agem
ent
Under Sec
retary
Nati
onal Pro
tectio
n and Pro
grams
Under Sec
retary
Science
& Tec
hnology
Citizen
ship an
d Immigrat
ion Service
s
U.S. Coas
t Guard
Customs a
nd Bord
er Pro
tectio
n
Federa
l Emerg
ency
Man
agem
ent A
gency
Federa
l Law
Enforcemen
t Trai
ning Cen
ter
Immigrat
ion and C
ustoms E
nforcemen
t
U.S. Sec
ret Serv
ice
Transp
ortatio
n Securit
y Administ
ration
Percent Positive

Figure2. Component-level HCAAF Percent Positive Results (Continued)
Human Capital Assessment and Accountability Framework (HCAAF) Index:Talent Management
51%
68%
58%52%
56% 54%61%
46%51%
68%
46%
60%
49%49%
0%
20%
40%
60%
80%
100%
DHS-wide
Office o
f the S
ecret
ary
Office o
f Insp
ector G
enera
l
Under Sec
retary
Man
agem
ent
Under Sec
retary
Nati
onal Pro
tectio
n and Pro
grams
Under Sec
retary
Science
& Tec
hnology
Citizen
ship an
d Immigrat
ion Service
s
U.S. Coas
t Guard
Customs a
nd Bord
er Pro
tectio
n
Federa
l Emerg
ency
Man
agem
ent A
gency
Federa
l Law
Enforcemen
t Trai
ning Cen
ter
Immigrat
ion and C
ustoms E
nforcemen
t
U.S. Sec
ret Serv
ice
Transp
ortatio
n Securit
y Administ
ration
Percent Positive
8 Management Report
Human Capital Assessment and Accountability Framework (HCAAF) Index:Job Satisfaction
60%66% 63% 64% 67% 66% 65%
58% 61%
71%
58%65%
54%58%
0%
20%
40%
60%
80%
100%
DHS-wide
Office o
f the S
ecret
ary
Office o
f Insp
ector G
enera
l
Under Sec
retary
Man
agem
ent
Under Sec
retary
Nati
onal Pro
tectio
n and Pro
grams
Under Sec
retary
Science
& Tec
hnology
Citizen
ship an
d Immigrat
ion Service
s
U.S. Coas
t Guard
Customs a
nd Bord
er Pro
tectio
n
Federa
l Emerg
ency
Man
agem
ent A
gency
Federa
l Law
Enforcemen
t Trai
ning Cen
ter
Immigrat
ion and C
ustoms E
nforcemen
t
U.S. Sec
ret Serv
ice
Transp
ortatio
n Securit
y Administ
ration
Percent Positive

2007 DHS Annual Employee Survey 9
The third HCAAF Index, Talent Management, has a DHS average of 49 percent. Index scores for all components range from 46 to 68 percent. Two of the components, Federal Law Enforcement Training Center (FLETC) and the Office of Inspector General (OIG), had the highest percent positive scores, while two components fell below the DHS average.
Finally, the Job Satisfaction index results are more positive than the other three indices. Averages for Job Satisfaction across the components range from 54 to 71 percent, and the DHS-wide average is 58 percent. As with the Talent Management index, the score for FLETC employees (71 percent) appears to stand above all other components on the Job Satisfaction index. Only one component scored below the DHS average.
Performance Appraisal Assessment Tool (PAAT) Items
Similar to the HCAAF Indices, the Performance Appraisal Assessment Tool (PAAT) is another assessment tool that DHS can use to gauge agency progress. The PAAT can facilitate DHS assessment and improvement of their agency appraisal programs. Fourteen items from the 2007 AES provide information on the status of DHS’s appraisal program. Table 3 below compares DHS’s 2004 and 2006 FHCS results with results from the 2007 DHS AES for survey items in the PAAT. Table 3. Performance Appraisal Assessment Tool: Percent Positive Results
Percent Positive 2004 2006 2007
8. I know how my work relates to the agency’s goals and priorities. 78 77 80 Alignment
30. Managers communicate the goals and priorities of the organization. 49 49 48
28. Employees have a feeling of personal empowerment with respect to work processes. 28 30 33
Results 35. I am held accountable for achieving results. 68 69 69
Credible Measures 34. Employees are rewarded for providing high quality products and services to their customers. 24 30 28
Differentiate Levels of Performance
18. In my work unit, differences in performance are recognized in a meaningful way. 21 22 29
36. Awards in my work unit depend on how well employees perform their jobs. 31 29 31
53. How satisfied are you with the recognition you receive for doing a good job? 36 35 35 Consequences Based on
Performance
15. In my work unit, steps are taken to deal with a poor performer who cannot or will not improve. 25 23 26
Employee Involvement 51. How satisfied are you with your involvement in decisions that affect your work? 36 39 32
Feedback Process 21. Discussions with my supervisor/team leader about my performance are worthwhile. 50 48 50
Training and Competency Development
2. I am given a real opportunity to improve my skills in my organization. 49 49 51
Assessment and Guidance 26. Managers review and evaluate the organization’s progress toward meeting its goals and objectives. 40 42 38
Purpose of Performance Management 20. My performance appraisal is a fair reflection of my performance. 57 56 52

10 Management Report
Overall, agreement levels (percent positive) increased from 2006 to 2007 for seven of the 14 PAAT items. The largest positive increase between 2006 and 2007 occurred for recognition of work performance—an increase of +7 percentage points. In 2007, 29 percent of DHS employees agreed that differences in work performance were recognized in a meaningful way compared to 22 percent in 2006. The six other PAAT items that increased from 2006 to 2007 ranged from one to four percentage points (see items: 8, 28, 35, 36, 15, and 2).
Agreement on two of the 14 PAAT items remained at the same levels for 2006-2007: Items 35 and 53. Only five of the PAAT items had smaller percentages of employees who agreed to the items in 2007 than 2006. The largest decrease, -7 percentage points, was found in satisfaction among employee involvement with decisions affecting their work (item 51).
Greatest Increases and Decreases Since 2006 FHCS
The following survey items had the greatest increase and decrease in the percentage of positive responses between the 2006 FHCS and 2007 DHS AES. The top 5 increases and decreases are presented in descending order by amount of change.
Table 4. Top 5 Increases and Decreases from 2006 to 2007 Survey Results
Percent Positive
INCREASED 2006 2007
Percentage Point
Increase
18. In my work unit, differences in performance are recognized in a meaningful way. 22 29 +7
29. My workload is reasonable. 55 62 +7
16. Creativity and innovation are rewarded. 25 29 +4
12. My talents are used well in the workplace. 48 52 +4
8. I know how my work relates to the agency’s goals and priorities. 77 80 +3
Percent Positive
DECREASED 2006 2007
Percentage Point
Decrease
51. How satisfied are you with your involvement in decisions that affect your work? 39 32 -7
57. Considering everything, how satisfied are you with your pay? 55 49 -6
6. The workforce has the job-relevant knowledge and skills necessary to accomplish organizational goals. 68 63 -5
20. My performance appraisal is a fair reflection of my performance. 56 52 -4
26. Managers review and evaluate the organization’s progress toward meeting its goals and objectives. 42 38 -4
Of the top five increases, only two items increased by five percentage points or more, a cutoff that is generally considered notable. These two items involved recognition of work performance (item 18), as previously mentioned, and reasonableness of workload (item 29). Two items improved by four percentage points from 2006 to 2007. All other item increases were three percentage points or less.
Among the top five decreases, three items decreased by five percentage points or more. These items included satisfaction with decision-making involvement, satisfaction with pay, and ability of the workforce to accomplish goals. Fairness of performance appraisal and managerial evaluation of progress (items 20 and 26, respectively) decreased by four percentage points in 2007. All other decreases were three percentage points or less.

2007 DHS Annual Employee Survey 11
Strengths and Challenges
Overall, items where 65 percent or more employees responded positively are considered areas of strength; conversely, items where 35 percent or more responded negatively are considered challenge areas. Figure 3 presents the top ten items that relate to DHS strengths and Figure 4 presents the top ten challenges.
Figure 3. Agency Strengths
Areas of Strength
80% 80% 77% 77%73% 70% 69% 69% 67%
91%
0%
20%
40%
60%
80%
100%
Q9 Q8 Q4 Q1Q41 Q46 Q44 Q35 Q32 Q38
Percent Positive
9. The work I do is important. 8. I know how my work relates to the agency’s goals and priorities. 4. I like the kind of work I do. 1. The people I work with cooperate to get the job done. 41. Sexual harassment is not tolerated in my workplace. 46. I receive the weekly DHS Today newsletter. 44. Instructions on how to do my job such as Standard Operating Procedures are available to me. 35. I am held accountable for achieving results. 32. My job matches the roles and responsibilities for which I was hired. 38. I know how to contact EEO Representatives in my component (For purposes of this question -- Equal Employment Opportunity (EEO) representatives are EEO Counselors and Special Emphasis Program Managers).
Strengths. The following findings indicate areas of success within DHS. The percentage of positive responses among the top ten DHS survey items range from 67 to 91 percent.
More than 9 of 10 DHS employees agree that the work they do is important (91% for item 9). This is notably higher than any other strength found within the agency— no more than 80% of employees respond positively on any other item.
Additionally, the percentage of positive responses to item 9 is first or second highest among employees from 12 of the 13 components. Employees from Science and Technology rate this item as third highest after item 46 (receiving the weekly DHS newsletter) and item 4 (I like the work I do).
Other areas of strength where 80 percent of employees responded positively include: I know how my work relates to agency goals and I like the work I do—areas that individual employees can generally control or influence.

Figure 4. Agency Challenges
Areas of Challenge
46% 45% 45% 44% 44% 43% 43% 42% 42%
55%
0%
20%
40%
60%
80%
100%
Q19 Q15 Q14 Q25 Q51 Q52 Q34Q42
dQ36
Q54a
Percent Negative
19. Pay raises depend on how well employees perform their jobs. 15. In my work unit, steps are taken to deal with a poor performer who cannot or will not improve. 14. Promotions in my work unit are based on merit. 25. In my organization, leaders generate high levels of motivation and commitment in the workforce. 51. How satisfied are you with your involvement in decisions that affect your work? 52. How satisfied are you with your opportunity to get a better job in your organization? 34. Employees are rewarded for providing high quality products and services to their customers. 42d. In the past year I have seen improvement in the following area: Recognition and Awards. 36. Awards in my work unit depend on how well employees perform their jobs. 54a. How satisfied are you with the policies and practices of your senior leaders?
Challenges. The percentage of negative responses among the top ten DHS challenges range from 42 to 55 percent. Similar to strengths, the areas of challenge contain one item that stands out from all other items.
DHS employees respond most negatively to the survey item that asks about pay raises and performance (item 19). Specifically, 55 percent of employees do not agree (disagree/strongly disagree) that pay raises depend on job performance. This is the only item where a majority of employees disagreed.
Employees from 7 of the 13 components reported pay for performance (item 19) as the top challenge (highest percent negative) within their component.
In general, challenges tend to be areas where the individual employee has less direct influence and/or control within the workplace (i.e., pay raises, promotions, awards, leadership, and availability of job opportunities.)
Summary
Employees appear to be more positive about their individual work performance and contributions than merits associated with job performance.
12 Management Report

2007 DHS Annual Employee Survey 13
General Perceptions About the DHS Organizational Culture
Survey items in this section are grouped based on the 40 prescribed survey items that are required by OPM.
Personal Work Experience
Survey respondents expressed mostly positive perceptions about their personal work experience at DHS (Figure 5). Survey items addressing individual personal work experiences include items 1—5 and item 58. Figure 5. Personal Work Experience
Item No. Survey Item
1. The people I work with cooperate to get the job done.
2. I am given a real opportunity to improve my skills in my organization.
3. My work gives me a feeling of personal accomplishment.
4. I like the kind of work I do.
5. I have trust and confidence in my supervisor.
58. Overall, how good a job do you feel is being done by your immediate supervisor/team leader?
51 20 29
65 17 19
80 13 7
58 19 23
% Positive % Neutral % Negative
59 23 18
77 12 11
Employees indicated that they liked the work they did (80% for item 4), that the people they worked with cooperated to get the job done (77%, item 1), and that their work gave them a feeling of personal accomplishment (65%, item 3). The percentages of positive responses were slightly lower regarding their overall perception of their immediate supervisors’ job performance (59%), their level of trust and confidence in their supervisor (58%), and the opportunities they have to improve their skills (51%). Notable Subgroup Findings: In general, mangers and supervisors are more positive than nonsupervisors about:
The opportunity to improve their skills (60% of supervisors versus 48% of nonsupervisors),
The trust and confidence they have in their supervisor (67% of supervisors versus 56% of nonsupervisors), and
Their work gives them a feeling of personal accomplishment (73% of supervisors versus 63% of nonsupervisors).

Recruitment, Development, and Retention This section covers the recruitment of new employees as well as the development and retention of current employees at DHS (survey items 6—13). Employees’ perceptions for these survey items overall had the widest percent positive range; ranging from 37 percent positive to 91 percent positive.
Figure 6. Recruitment, Development, & Retention
Item No. Survey Item
6.The workforce has the job-relevant knowledge and skills necessary to accomplish organizational goals.
7. My work unit is able to recruit people with the right skills.
8. I know how my work relates to the agency’s goals and priorities.
9. The work I do is important.
10.
Physical conditions (for example, noise level, temperature, lighting, cleanliness in the workplace) allow employees to perform their jobs well.
11. Supervisors/team leaders in my work unit support employee development.
12. My talents are used well in the workplace.
13. My training needs are assessed.
37 29 32
80 11 8
91 6 3
% Positive % Neutral % Negative
51 20 27
63 17 19
52 19 29
45 24 30
56 15 28
Approximately nine-tenths (91%) of DHS employees indicated that the work they do is important (item 9). As stated earlier in this report, this is the highest item-level percent positive for the 2007 AES survey. Eight-tenths (80%) of employees indicted that they know how their work relates to DHS goals and priorities. Employees were less positive in their perceptions that their work unit is able to recruit people with the right skills (37%) and that their individual training needs are assessed (45%). However, relatively high proportions of employees said that they neither agree nor disagree with these two items (29% and 24%, respectively). Notable Subgroup Findings:
A higher percentage of females indicated they know how their work relates to the agency goals and priorities (84% females versus 78% males).
Supervisors were more positive than nonsupervisors on six of the eight items in this group. These differences ranged up to 19 percentage points.
Minorities were more positive than non-minorities for three of the eight items including: items 8, 10, and 13.
14 Management Report

2007 DHS Annual Employee Survey 15
Performance Culture
This section includes survey items 14—23. The items cover two main subtopics addressing different aspects of performance culture; overall perceptions about whether or not DHS culture motivates employees to achieve high performance and whether DHS fosters a climate that values diversity.
Figure 7. Performance Culture
Item No. Survey Item
14. Promotions in my work unit are based on merit.
15.In my work unit, steps are taken to deal with a poor performer who cannot or will not improve.
16. Creativity and innovation are rewarded.
17.
In my most recent performance appraisal, I understood what I had to do to be rated at different performance levels (e.g., Fully Successful, Outstanding).
18.In my work unit, differences in performance are recognized in a meaningful way.
19. Pay raises depend on how well employees perform their jobs.
20. My performance appraisal is a fair reflection of my performance.
21.Discussions with my supervisor/team leader about my performance are worthwhile.
22.Managers/supervisors/team leaders work well with employees of different backgrounds.
23. My supervisor supports my need to balance work and family issues.
26 23 46
29 26 42
62 15 18
% Positive % Neutral % Negative
18 23 55
25 25 45
52 20 24
50 24 24
29 27 42
53 22 23
62 18 18
Employees had mixed perceptions about aspects of performance culture. Sixty-two percent of employees indicated that they understood the performance appraisal system (item 17) and that their supervisor supports their need to balance work and family issues (item 23). On the other hand, 55 percent of employees responded that they disagree/strongly disagree that pay raises were linked to performance (item 19). A larger percentage of employees responded negatively than positively to 5 of the 10 items in this group.
Notable Subgroup Findings:
Supervisors were more positive than nonsupervisors on 6 of the 10 items in this group. These differences ranged up to 19 percentage points.
Minority employees were more positive than non-minority employees for three items addressing how performance is evaluated (items 15, 17, and 18).

Employee Perceptions about Leadership
This section on DHS organizational culture includes survey items 24—31 addressing perceptions about overall leadership, more specifically perceptions about managers and supervisors. Figure 8. Leadership
Item No. Survey Item
24. I have a high level of respect for my organization’s senior leaders.
25.In my organization, leaders generate high levels of motivation and commitment in the workforce.
26.Managers review and evaluate the organization’s progress toward meeting its goals and objectives.
27. Employees are protected from health and safety hazards on the job.
28.Employees have a feeling of personal empowerment with respect to work processes.
29. My workload is reasonable.
30. Managers communicate the goals and priorities of the organization.
31.My organization has prepared employees for potential security threats.
29 25 45
38 28 25
55 20 24
% Positive % Neutral % Negative
62 16 22
42 22 35
48 22 29
57 20 22
33 27 38
Positive perceptions about managers and supervisors ranged from 29 percent to 62 percent, a somewhat lower range than the range of positive general perceptions about other topic areas within DHS culture. Employees were most positive when answering that their workload is reasonable (62% for item 29), they are prepared for potential security threats (57% for item 31), and they are protected from health and safety hazards on the job (55% for item 27). Employees’ perceptions become more negative when indicating that their organizational leaders generate high levels of motivation and commitment in the workplace (45% disagreed/strongly disagreed with item 25), that employees have a feeling of personal empowerment with respect to work process (38% disagreed/strongly disagreed, item 28), and having a high level of respect for DHS senior leaders (35% disagreed/strongly disagreed, item 24). It should also be noted that for items 25 and 28 a higher percentage of employees gave negative responses than positive ones.
16 Management Report

2007 DHS Annual Employee Survey 17
Notable Subgroup Findings: Overall minorities and supervisors are more positive about perceptions of DHS leadership.
A larger percentage of females (60%) than males (55%) felt that DHS had prepared them for potential security threats.
Supervisors were more positive than nonsupervisors on five of the eight items in this group. Similar to recruitment, development, and retention (page 14) and performance culture (page 15) these differences ranged up to 19 percentage points.
Item 27: Employees are protected from health and safety hazards (70% versus 51%) Item 26: Managers review and evaluate the DHS progress toward meetings its goals
and objectives (52% versus 35%) Item 25: Leaders generate high levels of motivation and commitment (39% versus 27%) Item 24: Overall respect for leaders (51% versus 40%)
Minority employees were more positive than non-minority employees for four items: Item 24: level of respect for senior leaders (47% versus 38%) Item 25: levels of motivation and commitment generated by leaders (33% versus 27%) Item 28: feeling of personal empowerment (36% versus 30%) Item 30: managers communicate the goals and priorities of DHS (51% versus 46%)
Overall Workplace Satisfaction This section addresses satisfaction more broadly than the Job Satisfaction Index presented earlier. For example some items in this section ask about information received, senior leaders’ policies and practices, and job recognition.
Figure 9. Overall Workplace Satisfaction
Item No. Survey Item
50.
How satisfied are you with the information you receive from management on what’s going on in your organization?
51.How satisfied are you with your involvement in decisions that affect your work?
52.How satisfied are you with your opportunity to get a better job in your organization?
53.How satisfied are you with the recognition you receive for doing a good job?
54a.How satisfied are you with the policies and practices of your senior leaders?
55.How satisfied are you with the training you receive for your present job?
56. Considering everything, how satisfied are you with your job?
57. Considering everything, how satisfied are you with your pay?
32 25 44
30 26 44
35 24 41
% Positive % Neutral % Negative
48 24 28
38 25 37
57 21 23
49 19 32
31 27 42

18 Management Report
The overall rating on workplace satisfaction was most positive (57% for item 56) followed by satisfaction with pay (49% for item 57) and training (48% for item 55). A larger percentage of employees responded negatively than positively to four of the eight items in this section with more than 40 percent of employees indicating that they were very dissatisfied or dissatisfied (items: 51, 52, 53, and 54a).
Notable Subgroup Findings:
Supervisors were more satisfied than nonsupervisors on five of the eight items and the difference ranged from 10 to 16 percentage points.
Minority employees were more satisfied than non-minority employees for three items: Item 50: information received from management (42% versus 35%) Item 56: with their job (60% versus 54%) Item 52: better job opportunities (33% versus 28%)

2007 DHS Annual Employee Survey 19
Decision Aid
This table is a summary of all survey items that allows you to quickly identify DHS strengths and challenges. The survey results are presented in item order. This view of the survey results can be used to pinpoint possible focus areas for action planning. According to the convention described earlier in this report (Comparing Your Survey Results), 2007 DHS AES results are displayed in green or red— items with 65 percent positive or more are displayed in green and items with 35 percent negative or more are displayed in red. Items with 30 percent neutral or more are displayed in blue.
Items highly related to satisfaction and intent to leave, based on analyses conducted by OPM for the 2006 FHCS, are noted by an asterisk (*).
Percent Positive
2007 DHS AES
2006 FHCS
.Survey Question Text
Positive Neutral Negative Positive Neutral Negative
1. The people I work with cooperate to get the job done. 77 12 11 79 11 10
2. I am given a real opportunity to improve my skills in my organization.* 51 20 29 49 22 29
3. My work gives me a feeling of personal accomplishment.* 65 17 19 62 19 19
4. I like the kind of work I do.* 80 13 7 80 13 7
5. I have trust and confidence in my supervisor. 58 19 23 56 20 25
6. The workforce has the job-relevant knowledge and skills necessary to accomplish organizational goals. 63 17 19 68 16 16
7. My work unit is able to recruit people with the right skills. 37 29 32 33 31 31
8. I know how my work relates to the agency’s goals and priorities. 80 11 8 77 13 10
9. The work I do is important. 91 6 3 89 7 3
10. Physical conditions (for example, noise level, temperature, lighting, cleanliness in the workplace) allow employees to perform their jobs well.
56 15 28 54 16 29
11. Supervisors/team leaders in my work unit support employee development. 51 20 27 52 23 24
12. My talents are used well in the workplace. 52 19 29 48 20 31
13. My training needs are assessed. 45 24 30 43 26 29
14. Promotions in my work unit are based on merit. 25 25 45 22 24 50
15. In my work unit, steps are taken to deal with a poor performer who cannot or will not improve. 26 23 46 23 24 49
16. Creativity and innovation are rewarded. 29 26 42 25 27 46
17. In my most recent performance appraisal, I understood what I had to do to be rated at different performance levels (e.g., Fully Successful, Outstanding).
62 15 18 NA NA NA
18. In my work unit, differences in performance are recognized in a meaningful way. 29 27 42 22 27 48
19. Pay raises depend on how well employees perform their jobs. 18 23 55 15 25 55

20 Management Report
Percent Positive
2007 DHS AES
2006 FHCS
.Survey Question Text
Positive Neutral Negative Positive Neutral Negative
20. My performance appraisal is a fair reflection of my performance. 52 20 24 56 22 20
21. Discussions with my supervisor/team leader about my performance are worthwhile. 50 24 24 48 25 25
22. Managers/supervisors/team leaders work well with employees of different backgrounds. 53 22 23 56 23 18
23. My supervisor supports my need to balance work and family issues. 62 18 18 64 16 19
24. I have a high level of respect for my organization’s senior leaders.* 42 22 35 41 23 36
25. In my organization, leaders generate high levels of motivation and commitment in the workforce. 29 25 45 27 25 48
26. Managers review and evaluate the organization’s progress toward meeting its goals and objectives. 38 28 25 42 28 21
27. Employees are protected from health and safety hazards on the job. 55 20 24 52 19 27
28. Employees have a feeling of personal empowerment with respect to work processes.* 33 27 38 30 28 40
29. My workload is reasonable.* 62 16 22 55 17 27
30. Managers communicate the goals and priorities of the organization. 48 22 29 49 23 27
31. My organization has prepared employees for potential security threats. 57 20 22 60 18 21
32. My job matches the roles and responsibilities for which I was hired. 69 13 17 NA NA NA
33. My supervisor provides me with constructive suggestions to improve my job performance. 51 25 25 NA NA NA
34. Employees are rewarded for providing high quality products and services to their customers. 28 30 43 30 24 43
35. I am held accountable for achieving results. 69 20 11 69 19 11
36. Awards in my work unit depend on how well employees perform their jobs. 31 26 42 29 23 44
37. Employees receive timely information about employee development programs and opportunities. 39 25 35 NA NA NA
38. I know how to contact EEO Representatives in my component (For purposes of this question -- Equal Employment Opportunity (EEO) representatives are EEO Counselors and Special Emphasis Program Managers).
67 15 17 NA NA NA
39. Discrimination is not tolerated in my workplace. 66 18 16 NA NA NA
40. I would recommend DHS as a place to work. 54 24 22 51 23 26

2007 DHS Annual Employee Survey 21
Percent Positive
2007 DHS AES
2006 FHCS
.Survey Question Text
Positive Neutral Negative Positive Neutral Negative
41. Sexual harassment is not tolerated in my workplace. 77 15 9 NA NA NA
42a. In the past year I have seen improvement in the following area: Communication. 40 27 33 NA NA NA
42b. In the past year I have seen improvement in the following area: Leadership. 34 27 39 NA NA NA
42c. In the past year I have seen improvement in the following area: Performance (i.e. appraisal, dealing with poor performers, etc.). 27 31 42 NA NA NA
42d. In the past year I have seen improvement in the following area: Recognition and Awards. 28 30 43 NA NA NA
42e. In the past year I have seen improvement in the following area: Resources (i.e. people, equipment, supplies). 37 25 38 NA NA NA
42f. In the past year I have seen improvement in the following area: Supervision. 36 30 34 NA NA NA
42g. In the past year I have seen improvement in the following area: Training. 42 27 31 NA NA NA
42h. In the past year I have seen improvement in the following area: Work Life Programs (i.e. Telework, alternative work schedules, access to Employee Assistance Programs).
29 35 37 NA NA NA
42i. In the past year I have seen improvement in the following area: Work Space (i.e. facilities, lighting, ventilation). 35 30 35 NA NA NA
43. My organization supports my participation in volunteer activities. 36 47 17 NA NA NA
44. Instructions on how to do my job such as Standard Operating Procedures are available to me. 70 15 15 NA NA NA
45. Turnover of personnel has affected my work unit’s ability to achieve objectives. 53 27 20 NA NA NA
46. I receive the weekly DHS Today newsletter. 73 12 15 NA NA NA
47. I read most of the news in DHS Today. 46 24 30 NA NA NA
48. I regularly access the DHS Online Intranet. 50 21 29 NA NA NA
50. How satisfied are you with the information you receive from management on what’s going on in your organization?* 38 25 37 35 24 42
51. How satisfied are you with your involvement in decisions that affect your work?* 32 25 44 39 24 38
52. How satisfied are you with your opportunity to get a better job in your organization?* 30 26 44 28 26 46
53. How satisfied are you with the recognition you receive for doing a good job?* 35 24 41 35 24 41
54a. How satisfied are you with the policies and practices of your senior leaders?* 31 27 42 30 28 42

22 Management Report
Percent Positive
2007 DHS AES
2006 FHCS
.Survey Question Text
Positive Neutral Negative Positive Neutral Negative
54b. How satisfied are you with the policies and practices of senior leadership in your component? 35 27 38 NA NA NA
55. How satisfied are you with the training you receive for your present job?* 48 24 28 48 24 28
56. Considering everything, how satisfied are you with your job? 57 21 23 57 21 23
57. Considering everything, how satisfied are you with your pay?* 49 19 32 55 18 27
58. Overall, how good a job do you feel is being done by your immediate supervisor/team leader?* 59 23 18 57 24 19
Summary.
A total of 12 survey items had percent positive ratings of 65 percent or more
Seven items had percent neutral ratings of 30 percent or more
23 items had percent negative ratings of 35 percent or more
Of the 14 items that are highly related to job satisfaction and intent to leave:
Two items are strengths (items 3 and 4)
Seven items are challenges (items: 24, 28, 50, 51, 52, 53, and 54a)

2007 DHS Annual Employee Survey 23
Overall Summary
This section contains an overall summary of the findings for the DHS AES. Like many other Federal and private sector employees, DHS employees want to feel their talents are being well used, they are demanding strong leadership, and they want to be valued and respected within the agency. Employees appear to be more positive about their individual work performance than merits associated with their job performance.
Employees agree that the work they do is important. This is the highest percent positive with more than 9 out of 10 employees agreeing.
8 out of 10 employees report that they know how their work relates to DHS goals and they like the work they do.
Employees do not agree that pay raises depend on how well they perform their jobs. This was the highest percent negative response and the only item with a majority of employees disagreeing.
HCAAF Indices.
The 2007 HCAAF index results were slightly more positive than the 2006 FHCS HCAAF results.
Leadership & Knowledge Management (from 46% to 48%) Results-Oriented Performance Culture (from 42% to 44%) Talent Management (remained at 49%) Job Satisfaction (remained at 58%)
Results for the Job Satisfaction index were more positive than the other three indices.
TSA, CBP, and ICE were the bottom three components for all four HCAAF indices.
Notable Subgroup Findings.
Not surprisingly, supervisors were more positive than nonsupervisors.
However, minorities were more positive than non-minorities.
There were very few gender differences across the board.
Decision Aid.
Overall DHS employees rated twice as many items as an area of challenge than an area of strength for the agency (22 items versus 12 items).
7 of the 14 items that are highly related to employee job satisfaction and intent to leave are currently areas of challenge for DHS. These seven items are potential focal areas for DHS action planning.

24 Management Report
Recommendations for Action Planning
The delivery of survey results is not the end point in the survey process, it is just the beginning. It is often the case that the perceived failure of surveys to create lasting change is actually due to faulty or nonexistent action planning or survey followup.
Four Basic Steps of Action Planning
First Step: Review and Discuss Relevant Information
As an initial step, we recommend that the Office of the Chief Human Capital Officer (Office sponsoring the survey) carefully review and reflect on all the survey findings. It may be productive to supplement the DHS AES findings with other available information about employees’ perceptions about their work experiences at DHS.
DHS management may wish to form teams with responsibility for focusing on particular survey topics. In addition, DHS could explore some of the findings in greater depth by conducting focus groups, in-depth interviews, and/or “town hall” meetings. The overall goal of these activities would be to discuss the findings and identify strengths and areas for improvement. The Decision Aid section of this report may be a helpful tool in that task. For example the seven challenge areas highly related to employee job satisfaction and intent to leave could be a starting point.
Summary: Review and discuss findings and supplementary information Consider conducting additional research such as focus groups, interviews, and/or
town-hall meetings Identify strengths and weaknesses for improvement
Second Step: Develop Action Plans
After all the information deemed as important is gathered, reflected upon, and discussed, attention should be shifted to action planning. It is extremely critical that planning activities include input from both supervisors and nonsupervisors. The survey findings indicate a divergence of perceptions between these two groups. Also, planning activities will require top-level management support and promotion for successful implementation.
Establishing short- and long-term goals is another important step in the action planning phase. Given the inevitable constrains of budget monies, time, and other resources to implement the goals; DHS would need to set priorities among the goals.
Summary: Develop an action plan
Invite input from employees representing diverse groups Establish short- and long-term goals Set priorities Establish measures for evaluating action plan elements

2007 DHS Annual Employee Survey 25
Secure top-level management endorsement and support and secure appropriate resources to carry out the plan
Establish a timeframe for achieving priority goals
Third Step: Communicate and Implement Action Plan Goals and Priorities
The goals and priorities established in the second step will need to be communicated effectively to managers and selected others. Managers and supervisors perform a fundamental role; they are the frontline agents for promoting enhancements and consequently, the success of the overall plan relies on them.
DHS can also draw on other resources for communicating its newly established goals and priorities, namely the weekly DHS Today newsletter since a large majority of employees reported they received the newsletter. The newsletter can be used as a vehicle to communicate survey findings and followup initiatives, thus assuring employees that participating in the survey is a worthwhile endeavor—that their opinions are given serious attention and can lead to positive changes.
Summary Effectively communicate the action plan goals and priorities to managers and others
who will likely serve as frontline agents for disseminating information about the plan to employees
Draw on existing resources and initiatives to reinforce efforts to promote the plan
Fourth Step: Monitor and Evaluate Effectiveness
Any new initiatives will need to be monitored for effectiveness after implementation and plans should be made on specific ways to measure such effectiveness. Regular performance reports can indicate which initiatives are working or not working, leading to decisions about which initiatives should be continued, modified, or discontinued.
Summary Implement the plan and monitor and evaluate the effectiveness of activities to achieve
priority goals Use, as appropriate, evaluation tools such as progress reports on achieving specific
goals, benchmark data, employee evaluations of activities such as training courses, and employee surveys
Use performance reports to decide:
(1) Which initiatives have been successful and should be either continued or ended because they are no longer necessary
(2) Which initiatives have not been successful and may need to be modified or discontinued

26 Management Report
(This page intentionally left blank)

2007 DHS Annual Employee Survey 27
Appendix A. Question-Level Results
Percent 1. The people I work with cooperate to get the job done. Positive Neutral Negative
DHS-wide 77.4 11.8 10.8
Office of the Secretary 74.9 12.5 12.6
Office of Inspector General 84.0 6.9 9.2
Under Secretary Management 78.8 11.2 10.1
Under Secretary National Protection and Programs 77.7 8.6 13.6
Under Secretary Science & Technology 80.9 11.8 7.2
Citizenship and Immigration Services 79.8 10.8 9.4
U.S. Coast Guard 85.0 8.7 6.4
Customs and Border Protection 75.4 12.7 12.0
Federal Emergency Management Agency 77.5 11.9 10.6
Federal Law Enforcement Training Center 81.0 9.6 9.3
Immigration and Customs Enforcement 76.6 11.1 12.3
U.S. Secret Service 89.0 6.5 4.4
Transportation Security Administration 76.6 12.3 11.1
Percent 2. I am given a real opportunity to improve my skills in my organization. Positive Neutral Negative
DHS-wide 50.5 20.3 29.1
Office of the Secretary 58.5 17.3 24.2
Office of Inspector General 71.4 14.4 14.2
Under Secretary Management 64.2 17.0 18.7
Under Secretary National Protection and Programs 57.5 19.4 23.1
Under Secretary Science & Technology 60.6 21.6 17.9
Citizenship and Immigration Services 55.3 19.9 24.9
U.S. Coast Guard 67.8 17.1 15.2
Customs and Border Protection 48.5 19.7 31.7
Federal Emergency Management Agency 53.3 19.0 27.6
Federal Law Enforcement Training Center 71.6 14.6 13.7
Immigration and Customs Enforcement 46.8 21.1 32.1
U.S. Secret Service 62.9 18.8 18.4
Transportation Security Administration 47.5 21.6 30.8

28 Management Report
Percent 3. My work gives me a feeling of personal accomplishment. Positive Neutral Negative
DHS-wide 64.5 16.8 18.6
Office of the Secretary 68.5 14.8 16.7
Office of Inspector General 77.0 10.1 12.9
Under Secretary Management 67.7 17.5 14.8
Under Secretary National Protection and Programs 70.1 11.2 18.6
Under Secretary Science & Technology 77.7 9.3 13.0
Citizenship and Immigration Services 75.4 13.0 11.6
U.S. Coast Guard 75.5 14.4 10.1
Customs and Border Protection 61.2 16.8 22.0
Federal Emergency Management Agency 72.2 13.9 14.0
Federal Law Enforcement Training Center 81.2 9.4 9.4
Immigration and Customs Enforcement 63.1 15.5 21.3
U.S. Secret Service 74.6 14.4 11.1
Transportation Security Administration 62.6 18.7 18.8
Percent 4. I like the kind of work I do. Positive Neutral Negative
DHS-wide 80.0 12.6 7.4
Office of the Secretary 77.2 14.2 8.6
Office of Inspector General 84.8 7.3 7.9
Under Secretary Management 79.8 13.4 6.7
Under Secretary National Protection and Programs 80.0 10.1 9.9
Under Secretary Science & Technology 88.7 7.3 3.9
Citizenship and Immigration Services 84.1 11.0 4.9
U.S. Coast Guard 83.6 10.9 5.4
Customs and Border Protection 80.8 11.2 7.9
Federal Emergency Management Agency 84.4 9.5 6.0
Federal Law Enforcement Training Center 90.0 6.3 3.7
Immigration and Customs Enforcement 77.2 12.3 10.6
U.S. Secret Service 86.5 9.1 4.3
Transportation Security Administration 78.0 15.0 7.1

2007 DHS Annual Employee Survey 29
Percent 5. I have trust and confidence in my supervisor. Positive Neutral Negative
DHS-wide 58.3 18.8 22.9
Office of the Secretary 63.1 15.8 21.2
Office of Inspector General 65.8 14.9 19.4
Under Secretary Management 67.9 15.4 16.6
Under Secretary National Protection and Programs 68.1 13.6 18.3
Under Secretary Science & Technology 68.3 14.9 16.7
Citizenship and Immigration Services 63.9 17.4 18.7
U.S. Coast Guard 69.9 15.6 14.5
Customs and Border Protection 55.0 19.6 25.4
Federal Emergency Management Agency 60.6 17.5 22.0
Federal Law Enforcement Training Center 71.2 11.3 17.4
Immigration and Customs Enforcement 59.1 17.1 23.8
U.S. Secret Service 67.0 16.6 16.4
Transportation Security Administration 56.8 19.8 23.5
Percent 6. The workforce has the job-relevant knowledge and skills necessary to
accomplish organizational goals. Positive Neutral Negative Don't Know
DHS-wide 63.0 17.2 19.1 0.6
Office of the Secretary 55.3 16.8 25.9 2.0
Office of Inspector General 71.5 14.9 13.2 0.3
Under Secretary Management 59.2 17.1 22.7 1.0
Under Secretary National Protection and Programs 60.9 12.0 27.0 0.0
Under Secretary Science & Technology 59.6 16.6 23.2 0.6
Citizenship and Immigration Services 63.6 18.2 17.5 0.6
U.S. Coast Guard 72.5 15.2 11.6 0.7
Customs and Border Protection 56.2 17.6 25.6 0.6
Federal Emergency Management Agency 58.6 17.1 23.1 1.3
Federal Law Enforcement Training Center 77.2 11.6 10.2 1.0
Immigration and Customs Enforcement 54.6 18.9 25.5 1.1
U.S. Secret Service 75.8 15.1 8.6 0.6
Transportation Security Administration 67.9 16.9 14.7 0.5
30 Management Report
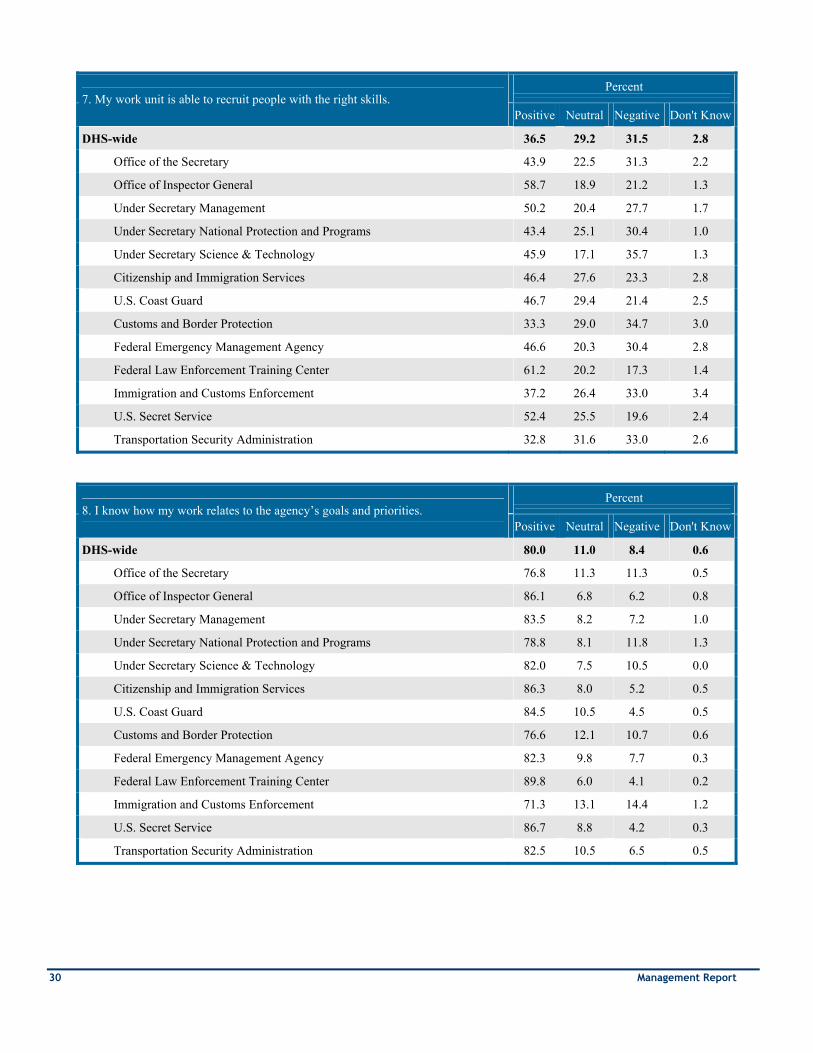
Percent 7. My work unit is able to recruit people with the right skills. Positive Neutral Negative Don't Know
DHS-wide 36.5 29.2 31.5 2.8
Office of the Secretary 43.9 22.5 31.3 2.2
Office of Inspector General 58.7 18.9 21.2 1.3
Under Secretary Management 50.2 20.4 27.7 1.7
Under Secretary National Protection and Programs 43.4 25.1 30.4 1.0
Under Secretary Science & Technology 45.9 17.1 35.7 1.3
Citizenship and Immigration Services 46.4 27.6 23.3 2.8
U.S. Coast Guard 46.7 29.4 21.4 2.5
Customs and Border Protection 33.3 29.0 34.7 3.0
Federal Emergency Management Agency 46.6 20.3 30.4 2.8
Federal Law Enforcement Training Center 61.2 20.2 17.3 1.4
Immigration and Customs Enforcement 37.2 26.4 33.0 3.4
U.S. Secret Service 52.4 25.5 19.6 2.4
Transportation Security Administration 32.8 31.6 33.0 2.6
Percent 8. I know how my work relates to the agency’s goals and priorities. Positive Neutral Negative Don't Know
DHS-wide 80.0 11.0 8.4 0.6
Office of the Secretary 76.8 11.3 11.3 0.5
Office of Inspector General 86.1 6.8 6.2 0.8
Under Secretary Management 83.5 8.2 7.2 1.0
Under Secretary National Protection and Programs 78.8 8.1 11.8 1.3
Under Secretary Science & Technology 82.0 7.5 10.5 0.0
Citizenship and Immigration Services 86.3 8.0 5.2 0.5
U.S. Coast Guard 84.5 10.5 4.5 0.5
Customs and Border Protection 76.6 12.1 10.7 0.6
Federal Emergency Management Agency 82.3 9.8 7.7 0.3
Federal Law Enforcement Training Center 89.8 6.0 4.1 0.2
Immigration and Customs Enforcement 71.3 13.1 14.4 1.2
U.S. Secret Service 86.7 8.8 4.2 0.3
Transportation Security Administration 82.5 10.5 6.5 0.5

2007 DHS Annual Employee Survey 31
Percent 9. The work I do is important. Positive Neutral Negative Don't Know
DHS-wide 90.5 5.9 3.3 0.3
Office of the Secretary 84.3 7.0 8.4 0.3
Office of Inspector General 87.7 8.3 3.7 0.2
Under Secretary Management 87.9 6.9 5.1 0.0
Under Secretary National Protection and Programs 90.0 4.7 4.8 0.5
Under Secretary Science & Technology 88.2 7.9 3.9 0.0
Citizenship and Immigration Services 93.8 4.1 1.8 0.2
U.S. Coast Guard 90.3 7.0 2.6 0.1
Customs and Border Protection 88.4 6.5 4.7 0.4
Federal Emergency Management Agency 92.1 5.2 2.5 0.1
Federal Law Enforcement Training Center 95.5 2.7 1.1 0.6
Immigration and Customs Enforcement 84.3 8.7 6.5 0.5
U.S. Secret Service 91.6 5.9 2.3 0.2
Transportation Security Administration 93.3 4.6 1.9 0.2
Percent 10. Physical conditions (for example, noise level, temperature, lighting, cleanliness
in the workplace) allow employees to perform their jobs well. Positive Neutral Negative Don't Know
DHS-wide 55.9 15.2 28.0 0.7
Office of the Secretary 45.2 12.3 41.9 0.6
Office of Inspector General 78.7 9.7 11.6 0.0
Under Secretary Management 50.2 14.8 34.5 0.5
Under Secretary National Protection and Programs 63.8 13.1 22.8 0.3
Under Secretary Science & Technology 71.5 12.4 16.1 0.0
Citizenship and Immigration Services 62.0 13.9 23.9 0.3
U.S. Coast Guard 68.6 14.9 16.1 0.4
Customs and Border Protection 55.3 15.8 28.0 0.8
Federal Emergency Management Agency 64.1 14.2 21.5 0.3
Federal Law Enforcement Training Center 78.2 9.7 11.7 0.4
Immigration and Customs Enforcement 63.4 12.7 23.1 0.8
U.S. Secret Service 79.1 11.8 8.7 0.5
Transportation Security Administration 48.5 16.2 34.5 0.9

32 Management Report
11. Supervisors/team leaders in my work unit support employee development. Percent
Positive Neutral Negative Don't Know
DHS-wide 51.2 20.1 27.3 1.3
Office of the Secretary 60.6 15.0 23.0 1.4
Office of Inspector General 75.6 10.4 13.7 0.3
Under Secretary Management 70.0 12.9 15.8 1.2
Under Secretary National Protection and Programs 64.0 16.3 17.7 2.0
Under Secretary Science & Technology 64.5 18.9 16.0 0.6
Citizenship and Immigration Services 57.0 18.9 23.2 0.9
U.S. Coast Guard 69.3 16.5 13.4 0.8
Customs and Border Protection 47.1 20.0 31.5 1.5
Federal Emergency Management Agency 58.3 17.0 23.7 0.9
Federal Law Enforcement Training Center 72.1 14.3 12.8 0.7
Immigration and Customs Enforcement 52.7 19.2 26.6 1.4
U.S. Secret Service 64.7 18.0 16.5 0.7
Transportation Security Administration 47.9 21.9 28.8 1.4
12. My talents are used well in the workplace. Percent
Positive Neutral Negative Don't Know
DHS-wide 51.5 18.8 28.6 1.0
Office of the Secretary 56.2 13.1 29.9 0.7
Office of Inspector General 66.4 12.6 20.7 0.3
Under Secretary Management 61.9 14.7 23.0 0.4
Under Secretary National Protection and Programs 60.5 13.3 25.3 0.9
Under Secretary Science & Technology 66.4 14.9 18.7 0.0
Citizenship and Immigration Services 61.4 16.2 21.6 0.9
U.S. Coast Guard 67.8 15.6 16.1 0.5
Customs and Border Protection 51.0 19.0 29.0 0.9
Federal Emergency Management Agency 57.4 15.3 26.8 0.4
Federal Law Enforcement Training Center 70.7 11.6 16.8 0.9
Immigration and Customs Enforcement 53.6 18.3 27.0 1.1
U.S. Secret Service 61.8 19.0 18.4 0.8
Transportation Security Administration 45.5 20.0 33.3 1.2

2007 DHS Annual Employee Survey 33
Percent 13. My training needs are assessed. Positive Neutral Negative Don't Know
DHS-wide 44.7 23.6 30.3 1.3
Office of the Secretary 39.0 22.4 36.6 2.0
Office of Inspector General 69.1 15.1 15.3 0.5
Under Secretary Management 50.5 20.1 27.8 1.6
Under Secretary National Protection and Programs 40.0 22.2 35.0 2.8
Under Secretary Science & Technology 45.3 29.6 23.0 2.0
Citizenship and Immigration Services 45.7 23.6 29.3 1.4
U.S. Coast Guard 53.2 24.2 21.6 1.0
Customs and Border Protection 40.6 23.8 34.1 1.4
Federal Emergency Management Agency 40.2 22.2 36.5 1.0
Federal Law Enforcement Training Center 60.8 19.4 18.9 0.9
Immigration and Customs Enforcement 36.6 24.1 37.6 1.7
U.S. Secret Service 49.4 24.7 24.9 1.0
Transportation Security Administration 47.9 23.4 27.5 1.2
Percent 14. Promotions in my work unit are based on merit. Positive Neutral Negative Don't Know
DHS-wide 25.1 24.5 45.2 5.1
Office of the Secretary 36.6 22.1 30.7 10.7
Office of Inspector General 45.5 18.0 30.8 5.7
Under Secretary Management 39.7 26.7 22.9 10.7
Under Secretary National Protection and Programs 36.2 26.9 28.4 8.6
Under Secretary Science & Technology 37.5 24.4 25.5 12.7
Citizenship and Immigration Services 32.9 26.2 35.8 5.0
U.S. Coast Guard 35.7 29.4 30.0 4.9
Customs and Border Protection 24.1 24.9 45.6 5.3
Federal Emergency Management Agency 33.2 24.3 36.6 5.8
Federal Law Enforcement Training Center 40.3 24.7 30.8 4.1
Immigration and Customs Enforcement 26.9 25.2 41.9 6.1
U.S. Secret Service 30.4 28.6 36.5 4.5
Transportation Security Administration 20.9 22.3 52.1 4.7

34 Management Report
Percent 15. In my work unit, steps are taken to deal with a poor performer who cannot or
will not improve. Positive Neutral Negative Don't Know
DHS-wide 25.5 23.4 45.8 5.4
Office of the Secretary 27.4 27.2 31.6 13.7
Office of Inspector General 30.7 29.4 30.6 9.3
Under Secretary Management 28.8 27.2 27.4 16.5
Under Secretary National Protection and Programs 26.2 29.5 33.6 10.6
Under Secretary Science & Technology 27.1 28.0 30.5 14.3
Citizenship and Immigration Services 28.3 27.4 36.6 7.8
U.S. Coast Guard 37.7 27.1 29.2 6.0
Customs and Border Protection 23.1 23.7 47.8 5.4
Federal Emergency Management Agency 24.3 26.3 42.8 6.4
Federal Law Enforcement Training Center 31.3 27.3 35.2 6.2
Immigration and Customs Enforcement 23.9 25.5 43.6 7.0
U.S. Secret Service 29.1 26.7 39.7 4.5
Transportation Security Administration 25.1 20.5 50.2 4.2
Percent 16. Creativity and innovation are rewarded. Positive Neutral Negative Don't Know
DHS-wide 29.1 26.1 41.6 3.2
Office of the Secretary 43.2 21.0 31.6 4.1
Office of Inspector General 50.6 21.2 24.8 3.5
Under Secretary Management 43.3 30.1 21.6 5.1
Under Secretary National Protection and Programs 46.0 25.4 25.7 3.0
Under Secretary Science & Technology 50.8 24.5 21.0 3.6
Citizenship and Immigration Services 37.4 26.1 33.7 2.8
U.S. Coast Guard 47.6 27.4 22.9 2.1
Customs and Border Protection 27.9 24.6 44.1 3.4
Federal Emergency Management Agency 40.0 25.0 32.3 2.6
Federal Law Enforcement Training Center 58.9 22.0 17.4 1.6
Immigration and Customs Enforcement 31.8 24.6 40.3 3.4
U.S. Secret Service 37.6 30.9 29.0 2.5
Transportation Security Administration 22.7 27.0 47.0 3.2

2007 DHS Annual Employee Survey 35
Percent 17. In my most recent performance appraisal, I understood what I had to do to be
rated at different performance levels (e.g., Fully Successful, Outstanding). Positive Neutral Negative Don't Know
DHS-wide 61.6 15.0 18.0 5.4
Office of the Secretary 57.7 11.0 19.0 12.3
Office of Inspector General 65.4 12.3 17.5 4.8
Under Secretary Management 55.3 14.6 19.2 10.9
Under Secretary National Protection and Programs 64.5 11.1 16.6 7.9
Under Secretary Science & Technology 65.4 10.5 13.7 10.3
Citizenship and Immigration Services 71.2 11.7 13.9 3.2
U.S. Coast Guard 72.3 12.9 11.6 3.2
Customs and Border Protection 59.5 16.6 17.4 6.6
Federal Emergency Management Agency 59.2 14.8 19.4 6.6
Federal Law Enforcement Training Center 77.1 7.6 13.4 2.0
Immigration and Customs Enforcement 63.5 13.9 17.1 5.6
U.S. Secret Service 72.9 13.3 9.3 4.5
Transportation Security Administration 58.8 15.1 21.3 4.8
Percent 18. In my work unit, differences in performance are recognized in a meaningful
way. Positive Neutral Negative Don't Know
DHS-wide 28.5 27.0 41.6 2.9
Office of the Secretary 33.6 26.5 29.1 10.7
Office of Inspector General 44.7 19.1 31.4 4.8
Under Secretary Management 36.9 24.5 27.3 11.2
Under Secretary National Protection and Programs 38.0 23.4 31.2 7.5
Under Secretary Science & Technology 39.4 21.2 28.3 11.2
Citizenship and Immigration Services 33.3 26.5 35.8 4.4
U.S. Coast Guard 42.2 30.1 25.0 2.8
Customs and Border Protection 26.6 26.7 43.7 2.9
Federal Emergency Management Agency 34.1 26.7 35.0 4.1
Federal Law Enforcement Training Center 48.9 24.7 24.2 2.2
Immigration and Customs Enforcement 32.3 26.2 37.7 3.9
U.S. Secret Service 35.9 31.2 29.9 3.0
Transportation Security Administration 24.5 26.7 46.7 2.0

36 Management Report
Percent 19. Pay raises depend on how well employees perform their jobs. Positive Neutral Negative Don't Know
DHS-wide 17.6 23.0 54.5 4.8
Office of the Secretary 27.9 18.9 34.5 18.8
Office of Inspector General 24.2 28.2 39.4 8.3
Under Secretary Management 26.8 26.0 28.5 18.6
Under Secretary National Protection and Programs 25.6 24.8 36.8 12.8
Under Secretary Science & Technology 25.6 26.0 33.0 15.3
Citizenship and Immigration Services 20.3 26.6 47.5 5.7
U.S. Coast Guard 19.2 28.4 47.1 5.3
Customs and Border Protection 10.5 25.1 58.8 5.6
Federal Emergency Management Agency 19.6 25.8 48.3 6.4
Federal Law Enforcement Training Center 22.4 28.6 43.8 5.2
Immigration and Customs Enforcement 13.6 25.9 54.6 5.9
U.S. Secret Service 15.1 27.6 52.5 4.9
Transportation Security Administration 23.6 18.4 54.9 3.1
Percent 20. My performance appraisal is a fair reflection of my performance. Positive Neutral Negative Don't Know
DHS-wide 52.3 20.3 24.2 3.2
Office of the Secretary 57.4 16.0 13.6 13.0
Office of Inspector General 68.9 11.5 14.1 5.5
Under Secretary Management 54.6 20.4 12.1 12.9
Under Secretary National Protection and Programs 63.8 16.6 13.7 5.9
Under Secretary Science & Technology 55.3 22.4 12.1 10.1
Citizenship and Immigration Services 65.8 14.4 17.4 2.3
U.S. Coast Guard 69.3 16.5 12.1 2.1
Customs and Border Protection 53.1 23.1 20.9 2.9
Federal Emergency Management Agency 60.1 16.8 18.9 4.2
Federal Law Enforcement Training Center 73.4 10.9 14.7 0.9
Immigration and Customs Enforcement 59.6 19.0 17.6 3.9
U.S. Secret Service 67.2 18.6 12.3 1.9
Transportation Security Administration 42.8 20.4 33.6 3.3

2007 DHS Annual Employee Survey 37
Percent 21. Discussions with my supervisor/team leader about my performance are
worthwhile. Positive Neutral Negative Don't Know
DHS-wide 49.9 24.2 23.8 2.2
Office of the Secretary 55.0 21.1 19.6 4.2
Office of Inspector General 61.3 17.7 18.9 2.1
Under Secretary Management 60.7 15.1 17.3 6.9
Under Secretary National Protection and Programs 61.3 16.7 18.6 3.4
Under Secretary Science & Technology 57.4 21.9 15.9 4.7
Citizenship and Immigration Services 56.8 22.0 19.0 2.2
U.S. Coast Guard 61.0 22.2 15.3 1.6
Customs and Border Protection 47.1 26.0 24.6 2.4
Federal Emergency Management Agency 54.0 21.0 22.1 2.9
Federal Law Enforcement Training Center 66.2 15.3 18.1 0.4
Immigration and Customs Enforcement 51.5 24.1 21.8 2.6
U.S. Secret Service 62.3 21.1 15.0 1.6
Transportation Security Administration 46.8 24.2 27.0 2.0
Percent 22. Managers/supervisors/team leaders work well with employees of different
backgrounds. Positive Neutral Negative Don't Know
DHS-wide 52.8 22.2 23.0 2.0
Office of the Secretary 59.3 17.3 19.5 3.9
Office of Inspector General 70.3 15.3 12.4 2.0
Under Secretary Management 67.8 15.8 13.0 3.5
Under Secretary National Protection and Programs 68.6 13.6 16.7 1.1
Under Secretary Science & Technology 65.6 19.0 13.6 1.8
Citizenship and Immigration Services 56.6 21.4 19.3 2.7
U.S. Coast Guard 67.0 18.8 12.6 1.6
Customs and Border Protection 51.4 22.0 24.7 2.0
Federal Emergency Management Agency 53.7 23.0 21.2 2.1
Federal Law Enforcement Training Center 68.2 15.2 14.6 2.0
Immigration and Customs Enforcement 53.8 21.0 23.0 2.2
U.S. Secret Service 64.4 20.5 13.4 1.7
Transportation Security Administration 48.9 23.7 25.5 1.9

38 Management Report
Percent 23. My supervisor supports my need to balance work and family issues. Positive Neutral Negative Don't Know
DHS-wide 62.2 17.9 18.3 1.6
Office of the Secretary 72.4 13.8 11.6 2.2
Office of Inspector General 82.5 8.5 6.6 2.5
Under Secretary Management 79.3 13.1 6.7 0.9
Under Secretary National Protection and Programs 80.8 8.6 10.0 0.7
Under Secretary Science & Technology 81.1 10.7 6.4 1.7
Citizenship and Immigration Services 74.1 14.7 9.6 1.6
U.S. Coast Guard 80.8 11.7 6.8 0.7
Customs and Border Protection 61.6 17.0 20.0 1.5
Federal Emergency Management Agency 76.5 12.4 9.8 1.3
Federal Law Enforcement Training Center 81.5 10.5 7.3 0.7
Immigration and Customs Enforcement 72.2 13.5 13.1 1.2
U.S. Secret Service 71.5 14.6 12.8 1.0
Transportation Security Administration 52.9 22.1 22.9 2.0
Percent 24. I have a high level of respect for my organization’s senior leaders. Positive Neutral Negative Don't Know
DHS-wide 42.3 22.4 34.5 0.8
Office of the Secretary 55.8 16.6 26.8 0.8
Office of Inspector General 56.8 19.2 24.0 0.0
Under Secretary Management 56.7 18.7 23.5 1.0
Under Secretary National Protection and Programs 48.4 20.4 31.3 0.0
Under Secretary Science & Technology 54.6 19.2 25.7 0.6
Citizenship and Immigration Services 51.7 22.2 25.3 0.7
U.S. Coast Guard 63.5 19.7 16.4 0.4
Customs and Border Protection 40.6 21.7 36.9 0.8
Federal Emergency Management Agency 42.1 23.4 33.7 0.8
Federal Law Enforcement Training Center 52.4 21.7 25.6 0.3
Immigration and Customs Enforcement 38.8 21.6 38.6 1.0
U.S. Secret Service 51.9 23.5 24.1 0.5
Transportation Security Administration 38.0 23.6 37.5 0.9

2007 DHS Annual Employee Survey 39
Percent 25. In my organization, leaders generate high levels of motivation and commitment
in the workforce. Positive Neutral Negative Don't Know
DHS-wide 29.2 24.8 45.1 0.9
Office of the Secretary 40.0 21.4 38.2 0.4
Office of Inspector General 44.0 22.7 33.0 0.3
Under Secretary Management 45.2 22.1 31.4 1.3
Under Secretary National Protection and Programs 39.0 21.7 38.4 0.8
Under Secretary Science & Technology 48.7 24.3 26.4 0.6
Citizenship and Immigration Services 38.7 26.0 34.1 1.1
U.S. Coast Guard 48.8 27.3 23.0 0.9
Customs and Border Protection 27.1 23.5 48.5 1.0
Federal Emergency Management Agency 30.4 29.1 39.9 0.6
Federal Law Enforcement Training Center 43.1 27.5 29.2 0.2
Immigration and Customs Enforcement 28.0 23.9 47.0 1.1
U.S. Secret Service 39.7 27.2 32.3 0.7
Transportation Security Administration 25.1 24.9 49.3 0.8
Percent 26. Managers review and evaluate the organization’s progress toward meeting its
goals and objectives. Positive Neutral Negative Don't Know
DHS-wide 38.4 28.2 24.8 8.7
Office of the Secretary 44.7 19.5 28.1 7.6
Office of Inspector General 49.0 23.0 19.7 8.2
Under Secretary Management 59.3 17.6 16.4 6.7
Under Secretary National Protection and Programs 51.2 23.0 21.6 4.2
Under Secretary Science & Technology 57.5 25.7 14.0 2.8
Citizenship and Immigration Services 58.1 22.7 12.9 6.3
U.S. Coast Guard 59.0 25.5 10.9 4.7
Customs and Border Protection 36.1 27.7 27.3 8.8
Federal Emergency Management Agency 43.3 27.7 22.6 6.5
Federal Law Enforcement Training Center 54.0 25.7 13.0 7.4
Immigration and Customs Enforcement 37.0 27.8 26.2 9.0
U.S. Secret Service 49.7 27.9 15.3 7.0
Transportation Security Administration 32.5 30.1 27.6 9.8

40 Management Report
Percent 27. Employees are protected from health and safety hazards on the job. Positive Neutral Negative Don't Know
DHS-wide 54.8 19.6 24.4 1.2
Office of the Secretary 60.7 17.4 17.6 4.2
Office of Inspector General 79.6 10.9 9.5 0.0
Under Secretary Management 61.9 21.3 11.6 5.2
Under Secretary National Protection and Programs 72.5 12.8 12.6 2.1
Under Secretary Science & Technology 82.9 11.9 4.1 1.1
Citizenship and Immigration Services 67.3 16.8 14.2 1.7
U.S. Coast Guard 78.9 13.5 6.6 1.0
Customs and Border Protection 50.2 20.7 27.8 1.1
Federal Emergency Management Agency 66.4 17.8 13.3 2.4
Federal Law Enforcement Training Center 82.0 9.4 7.8 0.8
Immigration and Customs Enforcement 57.8 20.7 19.5 2.0
U.S. Secret Service 70.2 18.1 10.7 1.1
Transportation Security Administration 49.1 20.2 29.9 0.9
Percent 28. Employees have a feeling of personal empowerment with respect to work
processes. Positive Neutral Negative Don't Know
DHS-wide 32.5 27.0 38.4 2.0
Office of the Secretary 38.4 20.0 39.4 2.2
Office of Inspector General 54.1 21.4 22.7 1.8
Under Secretary Management 48.6 20.5 28.3 2.6
Under Secretary National Protection and Programs 46.2 19.7 32.6 1.5
Under Secretary Science & Technology 54.6 15.8 27.9 1.7
Citizenship and Immigration Services 39.1 27.2 31.5 2.2
U.S. Coast Guard 52.1 27.3 18.7 1.8
Customs and Border Protection 30.3 26.4 41.0 2.3
Federal Emergency Management Agency 39.3 24.6 34.4 1.6
Federal Law Enforcement Training Center 50.8 25.2 22.5 1.5
Immigration and Customs Enforcement 33.2 27.1 37.0 2.7
U.S. Secret Service 44.6 29.2 23.6 2.5
Transportation Security Administration 27.6 27.6 43.2 1.7

2007 DHS Annual Employee Survey 41
Percent 29. My workload is reasonable. Positive Neutral Negative Don't Know
DHS-wide 61.5 16.1 22.0 0.4
Office of the Secretary 52.3 15.1 31.9 0.6
Office of Inspector General 69.4 11.6 19.0 0.0
Under Secretary Management 54.3 15.5 29.7 0.5
Under Secretary National Protection and Programs 53.9 15.5 30.5 0.0
Under Secretary Science & Technology 61.1 11.5 26.9 0.6
Citizenship and Immigration Services 59.9 15.3 24.3 0.4
U.S. Coast Guard 69.1 14.5 16.0 0.4
Customs and Border Protection 62.3 16.1 21.1 0.4
Federal Emergency Management Agency 59.7 14.6 25.5 0.2
Federal Law Enforcement Training Center 70.4 10.7 18.5 0.5
Immigration and Customs Enforcement 57.0 16.7 25.8 0.5
U.S. Secret Service 72.4 15.4 11.5 0.6
Transportation Security Administration 60.0 16.6 23.1 0.3
Percent 30. Managers communicate the goals and priorities of the organization. Positive Neutral Negative Don't Know
DHS-wide 48.2 21.9 28.8 1.0
Office of the Secretary 49.8 16.9 32.3 1.0
Office of Inspector General 60.5 15.5 23.5 0.5
Under Secretary Management 64.1 19.0 16.1 0.8
Under Secretary National Protection and Programs 54.6 16.9 28.6 0.0
Under Secretary Science & Technology 60.7 18.3 21.0 0.0
Citizenship and Immigration Services 61.0 18.4 19.6 0.9
U.S. Coast Guard 62.5 20.8 16.0 0.7
Customs and Border Protection 48.9 21.4 28.8 1.0
Federal Emergency Management Agency 48.0 23.2 28.2 0.6
Federal Law Enforcement Training Center 59.4 21.4 18.5 0.6
Immigration and Customs Enforcement 44.8 21.6 32.6 1.0
U.S. Secret Service 61.8 20.3 17.2 0.7
Transportation Security Administration 42.6 23.4 32.7 1.3

42 Management Report
Percent 31. My organization has prepared employees for potential security threats. Positive Neutral Negative Don't Know
DHS-wide 56.5 20.0 22.3 1.3
Office of the Secretary 46.2 22.8 28.5 2.5
Office of Inspector General 59.1 20.7 18.0 2.2
Under Secretary Management 46.2 25.7 23.5 4.5
Under Secretary National Protection and Programs 61.1 16.7 22.2 0.0
Under Secretary Science & Technology 68.9 20.5 8.3 2.4
Citizenship and Immigration Services 58.0 21.3 19.0 1.7
U.S. Coast Guard 68.9 18.7 10.8 1.5
Customs and Border Protection 50.7 21.2 26.6 1.4
Federal Emergency Management Agency 56.5 20.1 21.7 1.8
Federal Law Enforcement Training Center 66.0 20.3 11.7 2.0
Immigration and Customs Enforcement 43.8 22.3 31.6 2.4
U.S. Secret Service 74.1 13.4 11.4 1.0
Transportation Security Administration 60.6 18.9 19.8 0.7
Percent 32. My job matches the roles and responsibilities for which I was hired. Positive Neutral Negative
DHS-wide 69.4 13.2 17.4
Office of the Secretary 65.9 10.9 23.2
Office of Inspector General 78.2 7.6 14.2
Under Secretary Management 73.3 11.5 15.1
Under Secretary National Protection and Programs 65.7 11.8 22.5
Under Secretary Science & Technology 71.6 10.3 18.2
Citizenship and Immigration Services 75.6 12.1 12.4
U.S. Coast Guard 73.0 12.6 14.4
Customs and Border Protection 63.6 13.7 22.6
Federal Emergency Management Agency 66.5 13.1 20.4
Federal Law Enforcement Training Center 80.5 8.6 10.9
Immigration and Customs Enforcement 60.3 14.2 25.5
U.S. Secret Service 81.8 10.1 8.1
Transportation Security Administration 73.6 13.3 13.1

2007 DHS Annual Employee Survey 43
Percent 33. My supervisor provides me with constructive suggestions to improve my job
performance. Positive Neutral Negative
DHS-wide 50.5 24.9 24.5
Office of the Secretary 52.4 21.0 26.5
Office of Inspector General 62.0 15.3 22.7
Under Secretary Management 60.8 19.4 19.8
Under Secretary National Protection and Programs 58.0 23.6 18.5
Under Secretary Science & Technology 59.2 19.4 21.5
Citizenship and Immigration Services 54.3 23.8 21.9
U.S. Coast Guard 60.4 23.0 16.5
Customs and Border Protection 45.9 26.5 27.6
Federal Emergency Management Agency 51.9 22.5 25.6
Federal Law Enforcement Training Center 64.9 18.7 16.5
Immigration and Customs Enforcement 50.4 25.3 24.2
U.S. Secret Service 62.1 22.0 16.0
Transportation Security Administration 50.5 24.5 25.1
Percent 34. Employees are rewarded for providing high quality products and services to
their customers. Positive Neutral Negative Don't Know
DHS-wide 27.5 29.6 42.9 0.0
Office of the Secretary 46.2 26.3 27.5 0.0
Office of Inspector General 51.6 23.0 25.4 0.0
Under Secretary Management 45.0 31.1 23.9 0.0
Under Secretary National Protection and Programs 45.1 28.3 26.6 0.0
Under Secretary Science & Technology 50.0 25.1 24.8 0.0
Citizenship and Immigration Services 37.6 25.9 36.5 0.0
U.S. Coast Guard 48.7 28.0 23.3 0.0
Customs and Border Protection 24.3 31.0 44.7 0.0
Federal Emergency Management Agency 42.1 26.3 31.7 0.0
Federal Law Enforcement Training Center 56.8 21.0 22.2 0.0
Immigration and Customs Enforcement 29.9 32.7 37.3 0.0
U.S. Secret Service 36.2 36.0 27.7 0.0
Transportation Security Administration 22.0 28.0 50.0 0.0

44 Management Report
Percent 35. I am held accountable for achieving results. Positive Neutral Negative
DHS-wide 69.3 20.0 10.7
Office of the Secretary 76.0 16.6 7.5
Office of Inspector General 82.0 12.4 5.6
Under Secretary Management 84.3 10.5 5.2
Under Secretary National Protection and Programs 80.3 12.0 7.8
Under Secretary Science & Technology 77.8 13.7 8.4
Citizenship and Immigration Services 80.3 14.1 5.6
U.S. Coast Guard 80.8 14.0 5.2
Customs and Border Protection 65.1 22.1 12.8
Federal Emergency Management Agency 76.1 15.9 8.0
Federal Law Enforcement Training Center 80.1 14.1 5.8
Immigration and Customs Enforcement 72.8 17.7 9.5
U.S. Secret Service 75.3 18.1 6.6
Transportation Security Administration 67.0 21.4 11.5
Percent 36. Awards in my work unit depend on how well employees perform their jobs. Positive Neutral Negative
DHS-wide 31.4 26.3 42.2
Office of the Secretary 37.5 30.4 32.1
Office of Inspector General 47.5 25.0 27.4
Under Secretary Management 42.4 34.9 22.8
Under Secretary National Protection and Programs 43.9 29.6 26.5
Under Secretary Science & Technology 44.5 29.1 26.4
Citizenship and Immigration Services 39.4 27.2 33.3
U.S. Coast Guard 48.3 28.1 23.6
Customs and Border Protection 29.4 26.2 44.5
Federal Emergency Management Agency 38.4 26.0 35.7
Federal Law Enforcement Training Center 48.8 24.7 26.5
Immigration and Customs Enforcement 37.5 24.9 37.7
U.S. Secret Service 39.9 29.8 30.3
Transportation Security Administration 26.0 25.7 48.3

37. Employees receive timely information about employee development programs and opportunities.
Percent
Positive Neutral Negative
DHS-wide 39.4 25.3 35.3
Office of the Secretary 49.1 20.8 30.1
Office of Inspector General 62.4 17.2 20.4
Under Secretary Management 49.8 25.4 24.8
Under Secretary National Protection and Programs 46.4 22.5 31.1
Under Secretary Science & Technology 54.0 24.3 21.7
Citizenship and Immigration Services 46.8 25.9 27.4
U.S. Coast Guard 55.4 25.9 18.7
Customs and Border Protection 34.8 25.4 39.7
Federal Emergency Management Agency 44.0 24.6 31.4
Federal Law Enforcement Training Center 60.7 22.7 16.6
Immigration and Customs Enforcement 35.3 26.4 38.3
U.S. Secret Service 53.3 26.5 20.1
Transportation Security Administration 37.9 24.7 37.5
2007 DHS Annual Employee Survey 45
38. I know how to contact EEO Representatives in my component (For purposes of this Percent question -- Equal Employment Opportunity (EEO) representatives are EEO Counselors
and Special Emphasis Program Managers). Positive Neutral Negative
DHS-wide 67.3 15.3 17.4
Office of the Secretary 53.6 16.9 29.5
Office of Inspector General 63.6 19.8 16.5
Under Secretary Management 50.0 20.2 29.8
Under Secretary National Protection and Programs 57.5 16.2 26.2
Under Secretary Science & Technology 52.5 14.5 33.1
Citizenship and Immigration Services 72.3 13.6 14.1
U.S. Coast Guard 78.7 13.1 8.2
Customs and Border Protection 70.5 14.5 15.1
Federal Emergency Management Agency 75.9 11.4 12.7
Federal Law Enforcement Training Center 85.3 7.2 7.4
Immigration and Customs Enforcement 66.3 15.6 18.1
U.S. Secret Service 87.4 8.8 3.7
Transportation Security Administration 60.4 17.2 22.5

46 Management Report
Percent 39. Discrimination is not tolerated in my workplace. Positive Neutral Negative
DHS-wide 65.9 18.3 15.8
Office of the Secretary 67.6 21.6 10.8
Office of Inspector General 69.1 18.7 12.2
Under Secretary Management 70.2 21.3 8.5
Under Secretary National Protection and Programs 75.3 12.8 11.9
Under Secretary Science & Technology 79.7 13.3 7.0
Citizenship and Immigration Services 65.8 19.7 14.5
U.S. Coast Guard 79.5 13.0 7.5
Customs and Border Protection 66.3 18.5 15.3
Federal Emergency Management Agency 65.2 18.9 15.9
Federal Law Enforcement Training Center 74.5 14.6 10.9
Immigration and Customs Enforcement 67.8 17.7 14.5
U.S. Secret Service 77.8 13.4 8.8
Transportation Security Administration 61.3 19.5 19.2
Percent 40. I would recommend DHS as a place to work. Positive Neutral Negative
DHS-wide 54.1 24.4 21.5
Office of the Secretary 49.0 27.8 23.1
Office of Inspector General 59.5 23.2 17.3
Under Secretary Management 50.8 26.5 22.8
Under Secretary National Protection and Programs 51.3 20.7 27.9
Under Secretary Science & Technology 48.9 26.0 25.1
Citizenship and Immigration Services 65.6 21.1 13.4
U.S. Coast Guard 70.0 21.8 8.2
Customs and Border Protection 52.9 22.4 24.6
Federal Emergency Management Agency 45.7 25.9 28.3
Federal Law Enforcement Training Center 71.6 18.2 10.2
Immigration and Customs Enforcement 52.4 22.8 24.8
U.S. Secret Service 60.8 25.6 13.5
Transportation Security Administration 51.2 26.9 21.8

2007 DHS Annual Employee Survey 47
Percent 41. Sexual harassment is not tolerated in my workplace. Positive Neutral Negative
DHS-wide 76.5 14.8 8.7
Office of the Secretary 75.7 18.9 5.4
Office of Inspector General 79.5 16.0 4.5
Under Secretary Management 76.3 20.0 3.7
Under Secretary National Protection and Programs 82.5 12.6 5.0
Under Secretary Science & Technology 82.4 13.3 4.3
Citizenship and Immigration Services 80.3 13.9 5.9
U.S. Coast Guard 88.1 9.0 2.9
Customs and Border Protection 77.5 15.2 7.3
Federal Emergency Management Agency 75.0 16.4 8.7
Federal Law Enforcement Training Center 84.8 10.8 4.4
Immigration and Customs Enforcement 79.6 14.0 6.4
U.S. Secret Service 86.2 9.9 3.9
Transportation Security Administration 71.2 16.1 12.7
Percent 42a. In the past year I have seen improvement in the following area: Communication. Positive Neutral Negative
DHS-wide 39.6 27.0 33.4
Office of the Secretary 40.4 28.6 31.0
Office of Inspector General 51.5 23.2 25.4
Under Secretary Management 48.6 26.0 25.4
Under Secretary National Protection and Programs 42.2 22.0 35.8
Under Secretary Science & Technology 53.4 24.7 21.9
Citizenship and Immigration Services 47.1 24.8 28.1
U.S. Coast Guard 48.5 31.3 20.2
Customs and Border Protection 36.9 26.3 36.9
Federal Emergency Management Agency 39.9 27.2 32.9
Federal Law Enforcement Training Center 44.0 30.3 25.7
Immigration and Customs Enforcement 37.4 25.8 36.8
U.S. Secret Service 43.5 34.9 21.6
Transportation Security Administration 39.3 26.4 34.3

48 Management Report
Percent 42b. In the past year I have seen improvement in the following area: Leadership. Positive Neutral Negative
DHS-wide 34.4 26.5 39.0
Office of the Secretary 36.7 28.2 35.1
Office of Inspector General 42.8 26.8 30.5
Under Secretary Management 45.1 25.9 29.0
Under Secretary National Protection and Programs 34.1 20.3 45.6
Under Secretary Science & Technology 55.6 21.5 22.9
Citizenship and Immigration Services 42.7 26.5 30.8
U.S. Coast Guard 45.7 31.5 22.8
Customs and Border Protection 32.0 25.3 42.6
Federal Emergency Management Agency 33.9 26.2 39.9
Federal Law Enforcement Training Center 41.8 29.3 28.9
Immigration and Customs Enforcement 33.6 23.9 42.5
U.S. Secret Service 39.1 32.8 28.1
Transportation Security Administration 32.9 26.6 40.5
Percent 42c. In the past year I have seen improvement in the following area: Performance (i.e.
appraisal, dealing with poor performers, etc.). Positive Neutral Negative
DHS-wide 27.4 31.1 41.6
Office of the Secretary 29.6 37.9 32.5
Office of Inspector General 35.0 35.3 29.8
Under Secretary Management 31.3 42.9 25.8
Under Secretary National Protection and Programs 30.6 31.5 38.0
Under Secretary Science & Technology 34.7 34.7 30.7
Citizenship and Immigration Services 31.9 33.4 34.7
U.S. Coast Guard 38.0 38.5 23.5
Customs and Border Protection 24.3 30.8 44.9
Federal Emergency Management Agency 25.1 34.5 40.3
Federal Law Enforcement Training Center 36.0 32.4 31.6
Immigration and Customs Enforcement 26.8 32.1 41.1
U.S. Secret Service 32.1 37.5 30.4
Transportation Security Administration 27.0 28.2 44.7

2007 DHS Annual Employee Survey 49
Percent 42d. In the past year I have seen improvement in the following area: Recognition and
Awards. Positive Neutral Negative
DHS-wide 27.5 29.7 42.8
Office of the Secretary 31.3 36.0 32.6
Office of Inspector General 43.0 30.4 26.6
Under Secretary Management 32.6 38.4 29.0
Under Secretary National Protection and Programs 42.0 28.7 29.3
Under Secretary Science & Technology 46.5 29.7 23.8
Citizenship and Immigration Services 31.9 30.7 37.4
U.S. Coast Guard 38.7 36.9 24.5
Customs and Border Protection 24.4 29.0 46.6
Federal Emergency Management Agency 30.3 31.9 37.7
Federal Law Enforcement Training Center 45.1 31.9 23.0
Immigration and Customs Enforcement 34.4 27.0 38.5
U.S. Secret Service 30.5 36.1 33.5
Transportation Security Administration 24.7 28.7 46.6
Percent 42e. In the past year I have seen improvement in the following area: Resources (i.e. people,
equipment, supplies). Positive Neutral Negative
DHS-wide 37.4 25.0 37.6
Office of the Secretary 39.2 25.4 35.4
Office of Inspector General 46.7 22.1 31.2
Under Secretary Management 40.2 26.5 33.3
Under Secretary National Protection and Programs 31.1 22.8 46.1
Under Secretary Science & Technology 43.2 25.2 31.6
Citizenship and Immigration Services 44.2 25.5 30.3
U.S. Coast Guard 43.9 30.7 25.5
Customs and Border Protection 36.4 22.0 41.6
Federal Emergency Management Agency 34.7 23.9 41.3
Federal Law Enforcement Training Center 52.8 24.2 23.0
Immigration and Customs Enforcement 39.7 18.9 41.4
U.S. Secret Service 37.1 30.7 32.2
Transportation Security Administration 35.5 27.4 37.0

50 Management Report
Percent 42f. In the past year I have seen improvement in the following area: Supervision. Positive Neutral Negative
DHS-wide 36.2 29.9 34.0
Office of the Secretary 36.1 34.1 29.7
Office of Inspector General 47.3 29.0 23.7
Under Secretary Management 42.8 31.5 25.7
Under Secretary National Protection and Programs 42.2 28.4 29.5
Under Secretary Science & Technology 51.6 27.9 20.6
Citizenship and Immigration Services 41.8 30.0 28.1
U.S. Coast Guard 46.3 34.5 19.2
Customs and Border Protection 34.7 27.8 37.5
Federal Emergency Management Agency 37.4 30.3 32.4
Federal Law Enforcement Training Center 48.4 28.1 23.3
Immigration and Customs Enforcement 38.7 27.1 34.2
U.S. Secret Service 40.5 34.5 25.1
Transportation Security Administration 33.5 30.8 35.7
Percent 42g. In the past year I have seen improvement in the following area: Training. Positive Neutral Negative
DHS-wide 42.1 27.0 30.9
Office of the Secretary 42.2 31.7 26.1
Office of Inspector General 55.4 30.0 14.7
Under Secretary Management 47.1 32.4 20.5
Under Secretary National Protection and Programs 45.9 23.0 31.1
Under Secretary Science & Technology 49.5 29.7 20.8
Citizenship and Immigration Services 46.3 25.1 28.6
U.S. Coast Guard 45.5 33.6 21.0
Customs and Border Protection 36.9 27.1 36.1
Federal Emergency Management Agency 33.2 28.6 38.1
Federal Law Enforcement Training Center 50.7 31.1 18.2
Immigration and Customs Enforcement 34.2 26.4 39.4
U.S. Secret Service 39.7 34.3 26.1
Transportation Security Administration 47.5 25.2 27.4

2007 DHS Annual Employee Survey 51
Percent 42h. In the past year I have seen improvement in the following area: Work Life Programs
(i.e. Telework, alternative work schedules, access to Employee Assistance Programs). Positive Neutral Negative
DHS-wide 28.5 34.8 36.7
Office of the Secretary 33.5 30.9 35.5
Office of Inspector General 61.4 23.5 15.1
Under Secretary Management 30.6 35.2 34.2
Under Secretary National Protection and Programs 28.6 31.7 39.7
Under Secretary Science & Technology 43.3 36.3 20.5
Citizenship and Immigration Services 36.5 31.4 32.1
U.S. Coast Guard 43.4 39.4 17.2
Customs and Border Protection 25.9 33.3 40.9
Federal Emergency Management Agency 29.7 34.7 35.5
Federal Law Enforcement Training Center 36.2 39.2 24.6
Immigration and Customs Enforcement 22.2 35.7 42.1
U.S. Secret Service 28.5 40.7 30.8
Transportation Security Administration 28.3 35.0 36.8
Percent 42i. In the past year I have seen improvement in the following area: Work Space (i.e.
facilities, lighting, ventilation). Positive Neutral Negative
DHS-wide 35.3 29.6 35.1
Office of the Secretary 39.4 23.7 36.9
Office of Inspector General 44.3 35.2 20.4
Under Secretary Management 30.0 34.0 36.0
Under Secretary National Protection and Programs 42.8 31.3 26.0
Under Secretary Science & Technology 38.0 41.8 20.3
Citizenship and Immigration Services 42.3 28.6 29.2
U.S. Coast Guard 46.9 32.5 20.6
Customs and Border Protection 34.8 27.5 37.8
Federal Emergency Management Agency 39.1 29.8 31.0
Federal Law Enforcement Training Center 52.2 32.8 14.9
Immigration and Customs Enforcement 33.1 28.2 38.8
U.S. Secret Service 42.1 38.8 19.1
Transportation Security Administration 32.2 30.2 37.6

52 Management Report
Percent 43. My organization supports my participation in volunteer activities. Positive Neutral Negative
DHS-wide 35.6 47.0 17.4
Office of the Secretary 36.7 55.4 8.0
Office of Inspector General 42.2 50.3 7.5
Under Secretary Management 38.3 53.9 7.7
Under Secretary National Protection and Programs 35.1 55.0 9.9
Under Secretary Science & Technology 37.0 58.7 4.3
Citizenship and Immigration Services 41.6 47.0 11.3
U.S. Coast Guard 67.3 26.8 5.9
Customs and Border Protection 35.0 44.8 20.2
Federal Emergency Management Agency 40.9 49.8 9.3
Federal Law Enforcement Training Center 72.6 22.3 5.1
Immigration and Customs Enforcement 29.4 54.3 16.3
U.S. Secret Service 38.4 47.6 14.0
Transportation Security Administration 30.5 49.9 19.6
Percent 44. Instructions on how to do my job such as Standard Operating Procedures are available to
me. Positive Neutral Negative
DHS-wide 69.5 15.3 15.2
Office of the Secretary 30.2 27.1 42.7
Office of Inspector General 66.9 18.3 14.9
Under Secretary Management 40.3 19.4 40.3
Under Secretary National Protection and Programs 35.8 29.4 34.8
Under Secretary Science & Technology 50.1 29.7 20.2
Citizenship and Immigration Services 65.5 17.6 17.0
U.S. Coast Guard 63.5 18.7 17.7
Customs and Border Protection 61.1 19.3 19.7
Federal Emergency Management Agency 39.9 22.9 37.2
Federal Law Enforcement Training Center 78.1 13.3 8.7
Immigration and Customs Enforcement 51.0 22.0 27.0
U.S. Secret Service 72.0 17.6 10.4
Transportation Security Administration 84.9 8.4 6.7

2007 DHS Annual Employee Survey 53
Percent 45. Turnover of personnel has affected my work unit’s ability to achieve objectives. Positive Neutral Negative
DHS-wide 53.3 26.6 20.1
Office of the Secretary 50.3 24.4 25.3
Office of Inspector General 39.1 26.6 34.3
Under Secretary Management 50.4 25.7 23.9
Under Secretary National Protection and Programs 54.2 25.0 20.8
Under Secretary Science & Technology 36.1 24.5 39.5
Citizenship and Immigration Services 42.0 31.3 26.7
U.S. Coast Guard 43.3 30.7 26.0
Customs and Border Protection 57.5 25.1 17.5
Federal Emergency Management Agency 45.5 27.7 26.8
Federal Law Enforcement Training Center 33.9 28.2 37.9
Immigration and Customs Enforcement 48.2 28.1 23.8
U.S. Secret Service 46.8 27.8 25.4
Transportation Security Administration 56.0 25.9 18.1
Percent 46. I receive the weekly DHS Today newsletter. Positive Neutral Negative
DHS-wide 73.1 12.0 14.8
Office of the Secretary 90.9 4.8 4.3
Office of Inspector General 92.8 4.7 2.5
Under Secretary Management 90.8 5.2 4.0
Under Secretary National Protection and Programs 81.1 9.2 9.7
Under Secretary Science & Technology 91.9 4.7 3.4
Citizenship and Immigration Services 83.0 8.8 8.2
U.S. Coast Guard 22.4 19.2 58.3
Customs and Border Protection 70.2 15.2 14.7
Federal Emergency Management Agency 85.7 7.5 6.8
Federal Law Enforcement Training Center 72.3 13.3 14.3
Immigration and Customs Enforcement 75.6 12.6 11.8
U.S. Secret Service 13.5 27.3 59.2
Transportation Security Administration 86.6 7.4 6.0

54 Management Report
Percent 47. I read most of the news in DHS Today. Positive Neutral Negative
DHS-wide 46.0 23.6 30.4
Office of the Secretary 52.9 19.8 27.4
Office of Inspector General 54.2 23.2 22.7
Under Secretary Management 59.8 18.3 21.8
Under Secretary National Protection and Programs 51.8 21.1 27.1
Under Secretary Science & Technology 55.1 16.9 28.0
Citizenship and Immigration Services 60.7 18.5 20.7
U.S. Coast Guard 13.9 26.2 59.9
Customs and Border Protection 41.6 26.3 32.1
Federal Emergency Management Agency 46.3 24.5 29.2
Federal Law Enforcement Training Center 43.1 28.8 28.1
Immigration and Customs Enforcement 42.7 25.3 32.0
U.S. Secret Service 7.3 26.2 66.6
Transportation Security Administration 57.6 20.7 21.7
Percent 48. I regularly access the DHS Online Intranet. Positive Neutral Negative
DHS-wide 49.7 21.4 28.8
Office of the Secretary 64.7 15.2 20.2
Office of Inspector General 51.2 22.0 26.9
Under Secretary Management 74.7 12.0 13.2
Under Secretary National Protection and Programs 45.7 23.4 30.8
Under Secretary Science & Technology 41.0 20.5 38.4
Citizenship and Immigration Services 57.6 20.8 21.7
U.S. Coast Guard 13.5 22.9 63.7
Customs and Border Protection 53.9 20.1 26.0
Federal Emergency Management Agency 37.4 25.5 37.1
Federal Law Enforcement Training Center 41.6 28.1 30.3
Immigration and Customs Enforcement 50.8 21.7 27.6
U.S. Secret Service 11.6 21.3 67.0
Transportation Security Administration 55.0 22.1 22.9

2007 DHS Annual Employee Survey 55
Percent 49. From the following list, indicate which employee communication topic is most important to you and which is least important to you: Most Least
DHS-wide
Operations news 51.2 3.6
Policy news 26.8 3.9
Secretary news 1.4 48.1
Human Interest news 4.1 36.0
Human Resources news 16.5 8.4 *These results are reported at the DHS-wide level only.
Percent 50. How satisfied are you with the information you receive from management on what’s
going on in your organization? Positive Neutral Negative
DHS-wide 38.0 25.4 36.6
Office of the Secretary 37.5 22.5 40.0
Office of Inspector General 46.5 24.2 29.3
Under Secretary Management 47.0 24.8 28.2
Under Secretary National Protection and Programs 40.7 20.4 38.8
Under Secretary Science & Technology 52.9 20.3 26.8
Citizenship and Immigration Services 46.8 24.1 29.0
U.S. Coast Guard 52.2 26.5 21.3
Customs and Border Protection 36.2 25.9 37.9
Federal Emergency Management Agency 37.6 22.8 39.7
Federal Law Enforcement Training Center 51.3 22.7 25.9
Immigration and Customs Enforcement 33.2 24.0 42.8
U.S. Secret Service 47.0 25.9 27.1
Transportation Security Administration 35.9 25.4 38.7

56 Management Report
Percent 51. How satisfied are you with your involvement in decisions that affect your work? Positive Neutral Negative
DHS-wide 31.6 24.6 43.7
Office of the Secretary 40.3 21.4 38.3
Office of Inspector General 46.5 21.3 32.2
Under Secretary Management 47.1 21.7 31.3
Under Secretary National Protection and Programs 42.6 22.5 34.9
Under Secretary Science & Technology 54.6 15.8 29.6
Citizenship and Immigration Services 39.3 25.2 35.5
U.S. Coast Guard 49.5 24.7 25.8
Customs and Border Protection 30.0 23.9 46.1
Federal Emergency Management Agency 34.3 23.3 42.4
Federal Law Enforcement Training Center 46.0 22.6 31.4
Immigration and Customs Enforcement 30.6 24.1 45.3
U.S. Secret Service 40.0 27.1 33.0
Transportation Security Administration 27.4 25.1 47.5
Percent 52. How satisfied are you with your opportunity to get a better job in your organization? Positive Neutral Negative
DHS-wide 30.2 26.3 43.5
Office of the Secretary 32.3 31.8 35.8
Office of Inspector General 34.8 31.9 33.2
Under Secretary Management 38.5 32.1 29.3
Under Secretary National Protection and Programs 37.3 30.9 31.8
Under Secretary Science & Technology 30.3 42.3 27.4
Citizenship and Immigration Services 39.9 24.6 35.5
U.S. Coast Guard 36.4 31.1 32.5
Customs and Border Protection 31.3 25.9 42.7
Federal Emergency Management Agency 29.6 32.4 37.9
Federal Law Enforcement Training Center 40.5 26.2 33.3
Immigration and Customs Enforcement 32.2 27.5 40.3
U.S. Secret Service 36.0 33.3 30.6
Transportation Security Administration 25.5 24.3 50.2

2007 DHS Annual Employee Survey 57
Percent 53. How satisfied are you with the recognition you receive for doing a good job? Positive Neutral Negative
DHS-wide 35.2 23.5 41.3
Office of the Secretary 51.9 18.8 29.3
Office of Inspector General 53.4 20.4 26.3
Under Secretary Management 50.8 22.9 26.4
Under Secretary National Protection and Programs 52.8 21.4 25.8
Under Secretary Science & Technology 54.2 22.3 23.5
Citizenship and Immigration Services 44.3 22.6 33.2
U.S. Coast Guard 51.5 24.8 23.8
Customs and Border Protection 33.5 24.5 42.0
Federal Emergency Management Agency 47.4 22.3 30.4
Federal Law Enforcement Training Center 60.6 19.0 20.5
Immigration and Customs Enforcement 42.8 22.7 34.5
U.S. Secret Service 49.0 26.5 24.5
Transportation Security Administration 27.7 22.6 49.6
Percent 54a. How satisfied are you with the policies and practices of your senior leaders? Positive Neutral Negative
DHS-wide 31.3 26.8 41.8
Office of the Secretary 39.0 22.6 38.4
Office of Inspector General 45.9 24.4 29.7
Under Secretary Management 43.6 24.0 32.4
Under Secretary National Protection and Programs 34.6 25.2 40.2
Under Secretary Science & Technology 49.4 21.7 28.9
Citizenship and Immigration Services 39.5 28.4 32.0
U.S. Coast Guard 48.9 28.6 22.5
Customs and Border Protection 29.5 26.0 44.5
Federal Emergency Management Agency 30.7 27.3 42.0
Federal Law Enforcement Training Center 44.7 25.7 29.5
Immigration and Customs Enforcement 30.0 25.7 44.3
U.S. Secret Service 41.6 28.5 29.9
Transportation Security Administration 27.6 27.1 45.3

58 Management Report
Percent 54b. How satisfied are you with the policies and practices of senior leadership in your
component? Positive Neutral Negative
DHS-wide 34.8 27.1 38.0
Office of the Secretary 39.0 24.9 36.2
Office of Inspector General 48.7 21.5 29.8
Under Secretary Management 44.1 24.7 31.2
Under Secretary National Protection and Programs 35.9 25.5 38.7
Under Secretary Science & Technology 59.0 16.2 24.8
Citizenship and Immigration Services 42.7 27.9 29.4
U.S. Coast Guard 52.1 27.3 20.5
Customs and Border Protection 33.1 26.7 40.1
Federal Emergency Management Agency 36.8 26.5 36.7
Federal Law Enforcement Training Center 47.0 24.6 28.4
Immigration and Customs Enforcement 34.1 25.5 40.3
U.S. Secret Service 48.3 26.1 25.6
Transportation Security Administration 30.6 27.9 41.5
Percent 55. How satisfied are you with the training you receive for your present job? Positive Neutral Negative
DHS-wide 48.4 23.6 28.0
Office of the Secretary 40.9 28.6 30.5
Office of Inspector General 67.8 18.1 14.1
Under Secretary Management 50.6 28.3 21.1
Under Secretary National Protection and Programs 41.4 29.6 29.1
Under Secretary Science & Technology 49.4 28.3 22.3
Citizenship and Immigration Services 47.3 24.0 28.7
U.S. Coast Guard 51.8 26.0 22.1
Customs and Border Protection 43.9 24.1 32.0
Federal Emergency Management Agency 40.8 27.0 32.3
Federal Law Enforcement Training Center 62.5 22.5 15.0
Immigration and Customs Enforcement 38.0 24.3 37.5
U.S. Secret Service 53.0 23.0 24.0
Transportation Security Administration 53.9 22.2 23.9

2007 DHS Annual Employee Survey 59
Percent 56. Considering everything, how satisfied are you with your job? Positive Neutral Negative
DHS-wide 56.8 20.5 22.8
Office of the Secretary 54.1 19.0 26.9
Office of Inspector General 66.5 17.2 16.3
Under Secretary Management 56.6 20.5 22.9
Under Secretary National Protection and Programs 59.8 14.2 26.0
Under Secretary Science & Technology 68.9 12.6 18.6
Citizenship and Immigration Services 67.5 17.9 14.6
U.S. Coast Guard 70.3 17.3 12.4
Customs and Border Protection 55.4 19.6 25.0
Federal Emergency Management Agency 58.5 20.6 20.9
Federal Law Enforcement Training Center 73.3 14.6 12.2
Immigration and Customs Enforcement 55.5 19.5 25.0
U.S. Secret Service 68.2 17.1 14.7
Transportation Security Administration 53.0 22.9 24.1
Percent 57. Considering everything, how satisfied are you with your pay? Positive Neutral Negative
DHS-wide 49.4 19.1 31.6
Office of the Secretary 62.5 16.6 20.9
Office of Inspector General 65.6 15.0 19.3
Under Secretary Management 61.4 21.3 17.4
Under Secretary National Protection and Programs 68.0 16.6 15.4
Under Secretary Science & Technology 60.3 20.7 19.0
Citizenship and Immigration Services 63.7 16.0 20.3
U.S. Coast Guard 53.7 20.0 26.3
Customs and Border Protection 59.0 19.1 21.8
Federal Emergency Management Agency 59.6 18.2 22.3
Federal Law Enforcement Training Center 71.1 15.6 13.4
Immigration and Customs Enforcement 62.8 15.7 21.4
U.S. Secret Service 59.6 16.5 23.9
Transportation Security Administration 32.9 20.4 46.8

60 Management Report
Percent 58. Overall, how good a job do you feel is being done by your immediate supervisor/team
leader? Positive Neutral Negative
DHS-wide 59.3 22.6 18.0
Office of the Secretary 62.3 17.2 20.5
Office of Inspector General 66.3 19.5 14.2
Under Secretary Management 69.7 16.3 14.0
Under Secretary National Protection and Programs 69.5 14.2 16.3
Under Secretary Science & Technology 73.1 17.1 9.9
Citizenship and Immigration Services 65.3 19.8 14.9
U.S. Coast Guard 69.5 18.0 12.5
Customs and Border Protection 56.9 23.8 19.3
Federal Emergency Management Agency 60.7 18.8 20.6
Federal Law Enforcement Training Center 71.2 14.6 14.2
Immigration and Customs Enforcement 62.0 20.0 17.9
U.S. Secret Service 70.4 17.0 12.6
Transportation Security Administration 56.5 24.5 19.0

2007 DHS Annual Employee Survey 61
Appendix B. Demographic Characteristics The following tables present demographic information on the participating employees.
59. What is your supervisory status? % of Respondents
Non-supervisor 60.7
Team leader 16.2
Supervisor 15.1
Manager 6.6
Executive 0.9
Missing 0.6
60. Are you: % of Respondents
Male 65.5
Female 33.3
Missing 1.2
61. Are you Hispanic or Latino? % of Respondents
Yes 16.4
No 79.5
Missing 4.0
62. Please select the racial category or categories with which you most closely identify % of Respondents
White 72.0
Black or African American 11.7
Native Hawaiian or other Pacific Islander 1.3
Asian 4.0
American Indian or Alaska Native 1.2
Two or more races (Not Hispanic or Latino) 2.3
Missing 7.5

62 Management Report
64. What is your occupational group? % of Respondents
Social Science, Psychology, and Welfare Group - 0100 Series 0.6
Human Resources Management Group - 0200 Series 1.3
General Administrative, Clerical, and Office Services Group - 0300 Series 9.2
Natural Resources Management and Biological Sciences Group - 0400 Series 1.2
Accounting and Budget Group - 0500 Series 1.9
Medical, Hospital, Dental, and Public Health Group - 0600 Series 0.2
Engineering and Architecture Group - 0800 Series 1.0
Legal and Kindred Group - 0900 Series 1.9
Information and Arts Group - 1000 Series 0.2
Business and Industry Group - 1100 Series 1.1
Physical Sciences Group - 1300 Series 0.2
Library and Archives Group - 1400 Series 0.0
Mathematics and Statistics Group - 1500 Series 0.1
Equipment, Facilities, and Services Group - 1600 Series 0.4
Education Group - 1700 Series 0.6
Investigation Group - 1800 Series 32.8
Supply Group - 2000 Series 0.4
Transportation Group - 2100 Series 11.6
Information Technology Group - 2200 Series 1.7
Electronic Equipment Installation and Maintenance Group - 2600 Series 0.2
Electrical Installation and Maintenance Group - 2800 Series 0.1
General Services and Support Work Group - 3500 Series 0.2
Metal Work Group - 3800 Series 0.1
General Maintenance and Operations Work Group - 4700 Series 0.4
Mobile Equipment Operation and Transportation Group - 5700 Series 0.1
Unique Occupations Group - 0000 Series 0.6
Other (Job Title not found in any category above) 29.2
Missing 2.6
65. Please indicate your work status: % of Respondents
Full time 94.0
Part time 5.1
Missing 0.9

2007 DHS Annual Employee Survey 63
66. Do you work in the... % of Respondents
United States
Location not indicated 1.2
Alaska 0.9
Alabama 0.5
Arkansas 0.3
Arizona 3.6
California 10.6
Colorado 1.3
Connecticut 0.6
District of Columbia 8.5
Delaware 0.0
Florida 6.8
Georgia 2.7
Hawaii 1.5
Iowa 0.3
Idaho 0.3
Illinois 2.4
Indiana 0.8
Kansas 0.4
Kentucky 0.7
Louisiana 0.9
Massachusetts 1.4
Maryland 1.8
Maine 0.8
Michigan 2.4
Minnesota 1.3
Missouri 1.2
Mississippi 0.3
Montana 0.6
North Carolina 1.8
North Dakota 0.5
Nebraska 0.8
New Hampshire 0.2
New Jersey 1.8
New Mexico 1.0

64 Management Report
66. Do you work in the... % of Respondents
United States (continue)
Nevada
0.9
New York 5.5
Ohio 1.3
Oklahoma 0.4
Oregon
Pennsylvania
Rhode Island
0.8
1.9
0.3
South Carolina 0.7
South Dakota 0.1
Tennessee 1.0
Texas 11.6
Utah 0.5
Virginia
Vermont
6.2
1.4
Washington
Wisconsin
2.7
0.7
West Virginia
Wyoming
0.3
0.1
U.S. Territories
Location not indicated 0.0
American Samoa 0.0
Guam 0.2
Northern Mariana Islands 0.1
Puerto Rico 0.8
US Virgin Islands 0.3
International location
Location not indicated 0.0
Africa (includes Egypt)
Other International Location
0.0
0.1
Asia 0.1
Australia 0.0
Bermuda 0.0
Caribbean 0.0
Canada 0.2

% of 66. Do you work in the... Respondents
International location (continue)
Europe
0.1
South America 0.0
The Middle East
Multiple locations
Missing
0.0
0.0
1.2
2007 DHS Annual Employee Survey 65