Office of the Treasurerregents.universityofcalifornia.edu/regmeet/feb06/602attach.pdf · CAM 1...
34
Fixed Income Management Office of the Treasurer Of The Regents University of California February 14, 2006 Office of the Treasurer
Transcript of Office of the Treasurerregents.universityofcalifornia.edu/regmeet/feb06/602attach.pdf · CAM 1...
Fixed Income Management
Office of the TreasurerOf The Regents
University of CaliforniaFebruary 14, 2006
Office of the Treasurer

1UNIVERSITY OF CALIFORNIA
Office of the Treasurer
GVTS
CORPS
MTGES
CP
TIPS
OTHER
Total Fixed Income Under Management 6/30/05
UCRP
STIP
SAV FD
GEP
BOND FD
ICC FD
HIP
TIPS FD
CAM
1 Includes repurchase agreements, BA’s, GIC’s, CD’s, and cash.
Assets By Fund Assets By Type$ in millions $ in millions
$13,823
$1,290
$1,063
$706
$3,101
$6,671
$27 Billion
$10,562
$6,565
$3,131
$2,868
$2,866
$8801
$65
$102
$51

2UNIVERSITY OF CALIFORNIA
Office of the Treasurer
Omar Sanders
Credit Analyst
Omar Sanders
Credit Analyst
Alice YeeSenior Portfolio
Manager
Short Term Securities
Alice YeeSenior Portfolio
Manager
Short Term Securities
Randy WeddingManaging Director – Fixed Income
Randy WeddingManaging Director – Fixed Income
Kim EvansHead of Credit
Analysis
Kim EvansHead of Credit
Analysis
Linda FriedSenior Portfolio
Manager
Credit
Linda FriedSenior Portfolio
Manager
Credit
Dave SchroederSenior Portfolio
Manager
Governments
Dave SchroederSenior Portfolio
Manager
Governments
Satish SwamySenior Portfolio
Manager
Collateral-Backed
Satish SwamySenior Portfolio
Manager
Collateral-Backed
Aaron Staines
Junior Portfolio Manager
Aaron Staines
Junior Portfolio Manager
Fixed Income Organizational Chart

3UNIVERSITY OF CALIFORNIA
Office of the Treasurer
Investment Philosophy: Fixed Income
Returns can be enhanced through disciplined active management of the following risks:
- Duration-yield curve-convexity-sector-credit.
We enhance core sector returns with opportunistic investments in noncore securities.
We believe a long term investment horizon yields several advantages. Among them are:
- Allows time for our investment themes to develop.- Positions us to be the buyer when the market is selling and vice versa.
Disciplined active management implies rigorous risk assessment and management.
- Control overall portfolio risk.- Minimize unintended risk.- Identify sources of return.
4UNIVERSITY OF CALIFORNIA
Office of the Treasurer
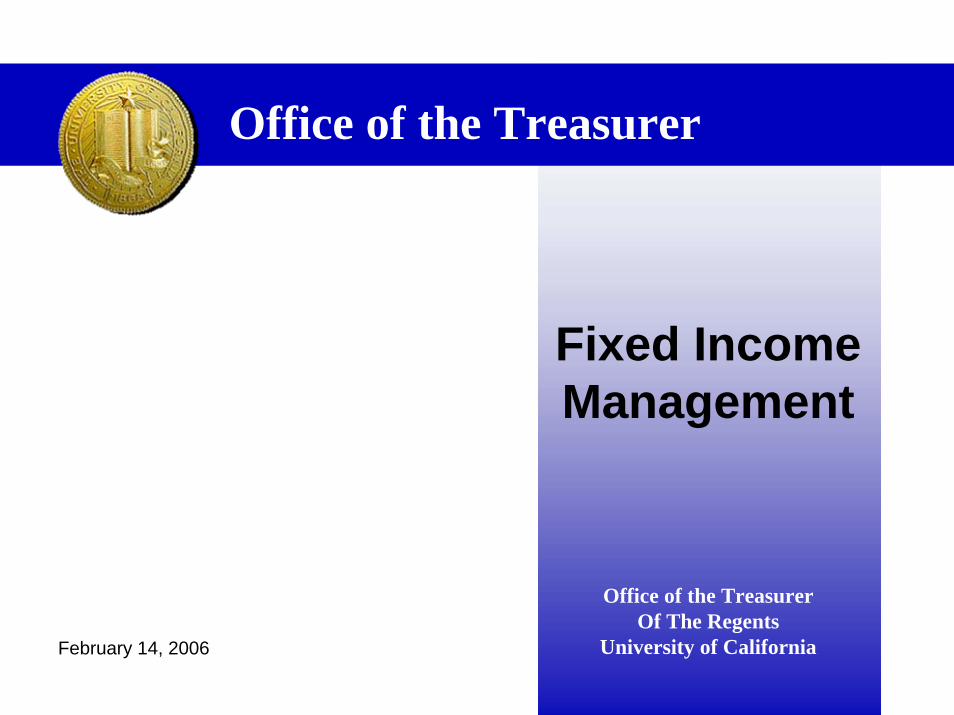
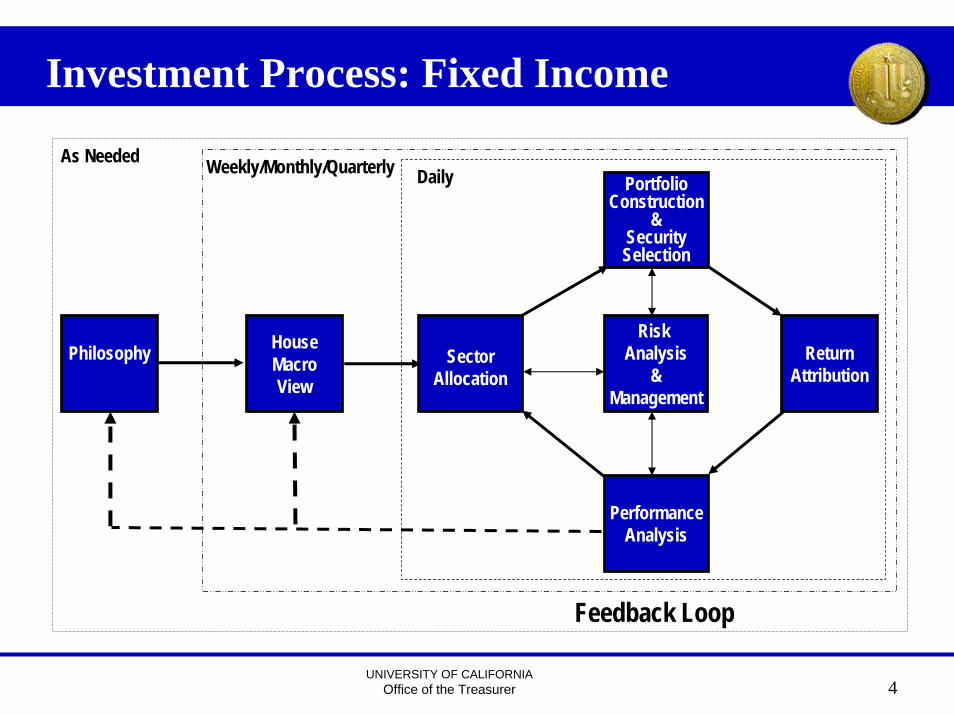
HouseMacroView
Investment Process: Fixed Income
Philosophy SectorAllocation
Risk Analysis
&Management
PortfolioConstruction
&SecuritySelection
ReturnAttribution
PerformanceAnalysis
DailyWeekly/Monthly/QuarterlyAs Needed
Feedback Loop
5UNIVERSITY OF CALIFORNIAOffice of the Treasurer
Performance
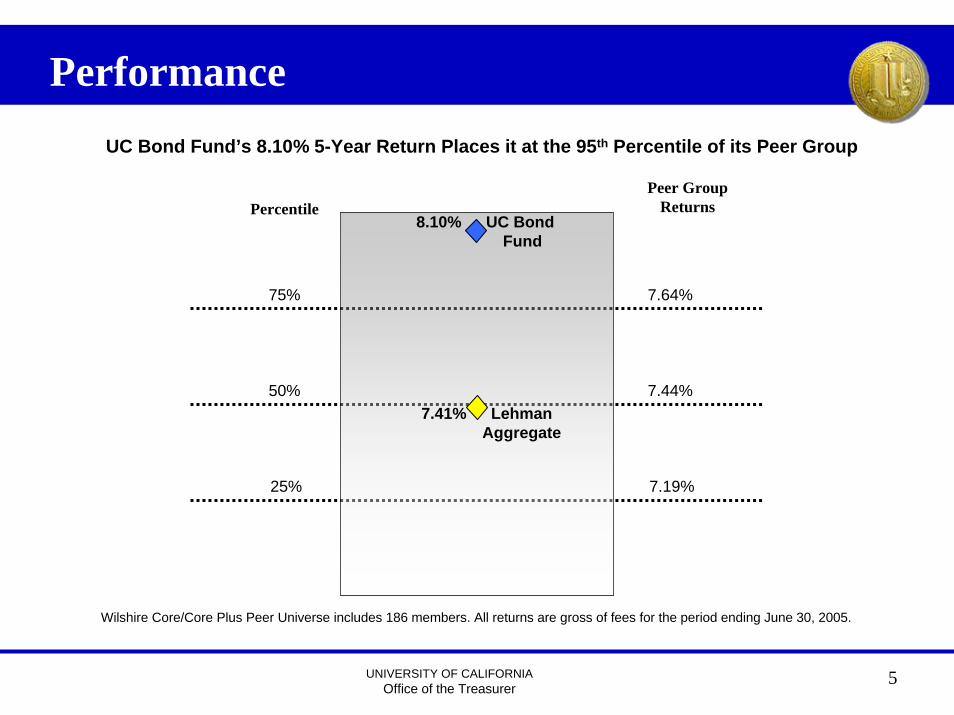
25%
50%
75%
7.19%
7.44%
7.64%
PercentilePeer Group
Returns
Wilshire Core/Core Plus Peer Universe includes 186 members. All returns are gross of fees for the period ending June 30, 2005.
8.10% UC Bond Fund
7.41% Lehman Aggregate
UC Bond Fund’s 8.10% 5-Year Return Places it at the 95th Percentile of its Peer Group

UNIVERSITY OF CALIFORNIAOffice of the Treasurer 6
Cumulative Outperformance by SectorBond Fund Sector Active Returns (Cumulative) %
All returns are gross of fees for the period June 30, 2000 – September 30, 2005.
5.31
11.79
1.97
3.62
-2
0
2
4
6
8
10
12
14
Jul-0
0
Jan-
01
Jul-0
1
Jan-
02
Jul-0
2
Jan-
03
Jul-0
3
Jan-
04
Jul-0
4
Jan-
05
Jul-0
5
Govt Corp Mtge Total Gross
7UNIVERSITY OF CALIFORNIA
Office of the Treasurer
Macro View
Each Fixed Income Team member contributes to a consensus on these fundamentals:
- Economic Activity- Inflation Expectations- Monetary Policy- Fiscal Policy
Explicit estimates of these variables are generated:- Short and long interest rates- Yield curve slope- Volatility- Sector supply/demand technicals- Credit spreads
Finally, estimates of risk and return are made for:- Core sectors- Selected non-core investments

8UNIVERSITY OF CALIFORNIA
Office of the Treasurer
Risk Settings and Sector Allocations
Exposures to major portfolio risk factors are dictated by our macro view.
- Duration- Curve Exposure- Convexity- Credit- Prepayments
Active sector weightings are the result of an iterative process.- Optimization using expected return and historical covariance.- Stress testing expected return scenarios with alternative assumptions.- Adjusting weights and repeating process.
All potential portfolios are subject to:- Portfolio risk guidelines.- Risk budgets for sectors and in aggregate.

9UNIVERSITY OF CALIFORNIA
Office of the Treasurer
GDP Growth- To average above trend 3.75% next four quarters.
Inflation- Core CPI to rise to 2.5% from current 2.2%.
Federal Reserve Bank Policy- Federal Funds rate to be hiked from current 4.00% to 4.75-5.00% by late 2006. Market forecast is for 4.50% rate at end of tightening cycle.
U.S. Treasury Yields- Two year yields to rise to 4.65%, ten year yields to rise to 5.0%. Market implied forecasts are 4.40% and 4.55%, respectively.
Equity/Interest rate volatility- Steady increase from current multiyear lows.
Current Macro Outlook
10UNIVERSITY OF CALIFORNIA
Office of the Treasurer
Interest Rate Sensitivity- Duration 3% lower than index, policy guideline is +/- 20%.
Yield Curve Exposure- Government sector positioned for a mild curve steepening following current prolonged flattening trend.
Sector Weights- Sector weights for Credit and Collateral-backed sectors are close to benchmark weights but within sectors we arepositioned for spread widening versus duration matched Treasuries.
Materially underweighting spread sectors is costly in terms of foregone yield.Security selection and industry overweights/underweights
more effective in expressing negative view on spreads.
Investment Implications
11UNIVERSITY OF CALIFORNIA
Office of the Treasurer
Ratings Bias-Overweight Higher rated, underweight lower rated credits.
Credit Sector Industry Overweights-Utilities- Good free cash flow, improving credit quality.Cable- Good free cash flow, spreads discount event risk.Commodities- Good free cash flow, global low cost leaders,
cyclical risk more than offset by secular positives.Wireless telcom
Credit Sector Industry Underweights-Financials-Banks, consumer credit.Wirelines- Secular erosion, excessive capex.Pharma- Product liability, lack of new drugs.
Credit Sector

12UNIVERSITY OF CALIFORNIA
Office of the Treasurer
Corporate/Sovereign Bonds

13UNIVERSITY OF CALIFORNIA
Office of the Treasurer
Treasurer’s Staff Credit Sector Expertise
• Credit team’s ongoing global approach to evaluating individual credits and industries has successfully led to identifying best investments, regardless of ratings or country venue.
• Credit team manages more than $6.5 billion of corporate/sovereign risk
• Credit portfolio performance (5 years through 6/05)– Cumulative outperformance 11.79% versus Lehman Aggregate
– HY and EM investments have contributed significantly to this performance

14UNIVERSITY OF CALIFORNIA
Office of the Treasurer
Emerging Market
Staff has over 12 years experience in managing EM bonds
• EM assets under management– EM investments have ranged from $350 million to
$1.25 billion or from 10-25% of credit portfolio– Current holdings $550 million
• Significant established network of relationships with EM broker/dealers, corporate managements and government officials
15UNIVERSITY OF CALIFORNIA
Office of the Treasurer
High Yield
Staff manages HY corporate risk in the context of its successful Credit philosophy and process
• Over 10 years’ experience in managing High Yield bonds.
• Current HY holdings of $300 million represent 8% of UCRP Credit sector investments
• Emphasis on upper tier or B/BB sector of HY market
• Zero default experience

16UNIVERSITY OF CALIFORNIA
Office of the Treasurer
Investment Philosophy: Corporate Bonds
Use an equity-like approach and proprietary credit metrics embodying our philosophy on credit quality.
Identify mis-priced securities resulting from structural and temporary marketinefficiencies and mis-ratings of fundamental credit quality.
Assign mis-priced or mis-rated securities a materially different weight than the benchmark representation.
Secular themes involving globalization, demographics and technological innovation influence sector weightings. With a long-term horizon, we can weather short-term market turbulence and let these themes develop.
Constantly monitor existing and prospective investments using proprietary tools that reflect our credit philosophy and reinforce objectivity and discipline. The sell decision is at least as important as the buy decision.

17UNIVERSITY OF CALIFORNIA
Office of the Treasurer
Investment Process: Corporate Bonds
Performance Analysis
Return Attribution• Sector Level Returns• Industry Level Returns• Security Level Returns
Risk Analysis & ManagementSector Allocation• Sovereign• Industrial• Financial• Utilities
Portfolio Construction• Active Industry Weightings. • Issuer Selection• Security Selection
Macro Credit View• Secular Themes• Cyclical Trends• Global Approach
Analytical Tools• Proprietary UC Credit Score• Proprietary EFG Bond Screen• LBO Screen• Options-based valuation models

18UNIVERSITY OF CALIFORNIA
Office of the Treasurer
UC Credit Score
( 1 = Best, 10 = Worst )UC
MANAGEMENT BUSINESS FINANCIAL EVENT CREDIT SCOREENTITY STRENGTH POSITION STRENGTH GROWTH RISK (Average)
UC CREDIT SCORE
Strategy Operating history/stability/ Past/projected rev/profit grwth Growth drivers Equity performance consistency of business model Execution/stability/ Profitability/margins/EVA/ Past/projected rev/profit grwth Equity valuation trend/compsconsistency/credibility Market share/business position global cost position Organic/synthetic growth Accounting/legal/SEC issuesDepth/breadth of mgmt Business mix/diversification Transparency of financial statements/off-balsht/PF's Unit volume growth/prc'g power Mergers & acquisitionsCorporate governance/ Secular trends conflict of interests/ Equity valuation/performance/ Margin expansion potential Shareholder-friendly actionsoversight/transparency Competition/globalization volatility Free cashflow/OCF growth Sovereign eventsFinancial controls/systems Barriers to entry/exit Capital structure philosophy Consistency/stability of growth Regulatory changes/eventsCapital structure philosophy Commoditization/cyclicality Free cash flow generation
Political changes/eventsAccounting/legal/SEC issues Technological rate of change Liquidity position/capital access Legal changes/events Volatility of results
Social/"other" changes/events Credit metrics

19UNIVERSITY OF CALIFORNIA
Office of the Treasurer
UC Credit Score – Clear Channel( 1 = Best, 10 = Worst )
UCMANAGEMENT BUSINESS FINANCIAL EVENT CREDIT SCORE
ENTITY STRENGTH POSITION STRENGTH GROWTH RISK (Average)
Clear ChannelQ2 2004 2 3 4 6 5 4Q2 2005 4 5 6 8 8 6
UC CREDIT SCORE
Strategy Operating history/stability/ Past/projected rev/profit grwth Growth drivers Equity performance consistency of business model Execution/stability/ Profitability/margins/EVA/ Past/projected rev/profit grwth Equity valuation trend/compsconsistency/credibility Market share/business position global cost position Organic/synthetic growth Accounting/legal/SEC issuesDepth/breadth of mgmt Business mix/diversification Transparency of financial statements/off-balsht/PF's Unit volume growth/prc'g power Mergers & acquisitionsCorporate governance/ Secular trends conflict of interests/ Equity valuation/performance/ Margin expansion potential Shareholder-friendly actionsoversight/transparency Competition/globalization volatility Free cashflow/OCF growth Sovereign eventsFinancial controls/systems Barriers to entry/exit Capital structure philosophy Consistency/stability of growth Regulatory changes/eventsCapital structure philosophy Commoditization/cyclicality Free cash flow generation
Political changes/eventsAccounting/legal/SEC issues Technological rate of change Liquidity position/capital access Legal changes/events Volatility of results
Social/"other" changes/events Credit metrics
20UNIVERSITY OF CALIFORNIA
Office of the Treasurer
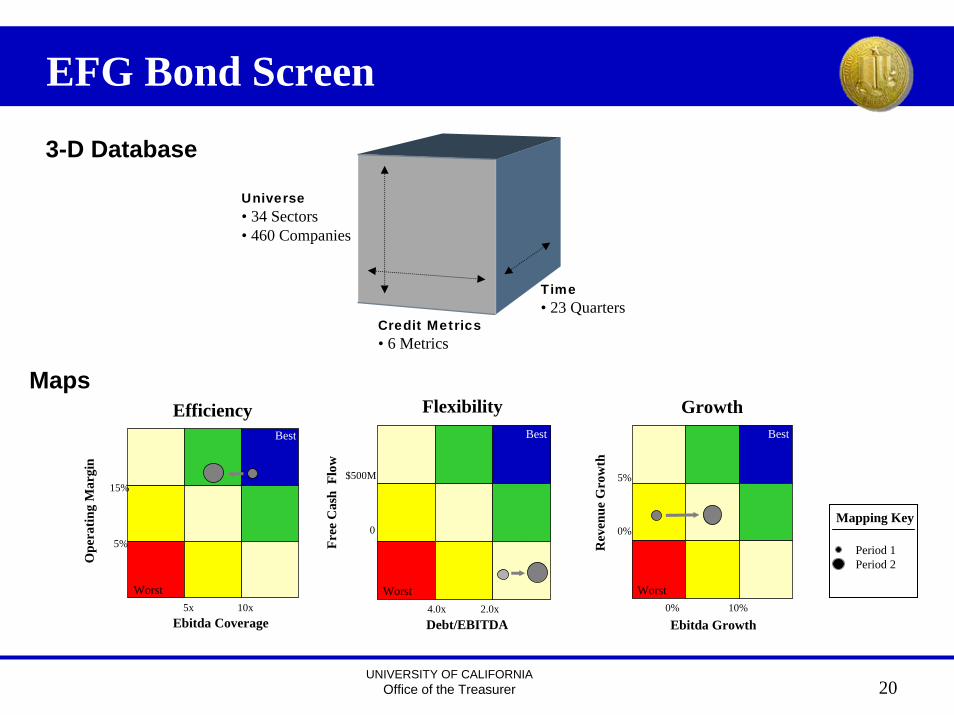
EFG Bond Screen
3-D Database
Universe• 34 Sectors• 460 Companies
Time• 23 Quarters
Credit Metrics• 6 Metrics
Ope
ratin
g M
argi
n
Efficiency Flexibility Growth
Ebitda Coverage
15%
5%
10x5x
Best
Worst
Debt/EBITDA
Ope
r. M
argi
n
$500M
0
Free
Cas
h F
low
2.0x4.0x
Best
Worst
Ebitda Growth
5%
0%
10%0%R
even
ue G
row
th
Best
Worst
Maps
Mapping Key
Period 1Period 2

21UNIVERSITY OF CALIFORNIA
Office of the Treasurer
Clear Channel EFG Score
Flexibility Map EFG Table
Free
Cas
h Fl
ow
Best
Ope
r. M
argi
n
Debt/Ebitda
$0.5B
$0
2.0x4.0xWorst
+ 1
- 1/2
+ 1/2
+ 1/2
- 1/2
0
0
0
- 1
Q2 2004 Q1 2005 Q2 2005FACTORS VALUE VALUE VALUE
EFFICIENCY + 1/2 + 1/2 + 1/2
FLEXIBILITY + 1/2 + 1/2 0
GROWTH 0 - 1/2 - 1/2
EFG SCORE + 1 + 1/2 0

22UNIVERSITY OF CALIFORNIA
Office of the Treasurer
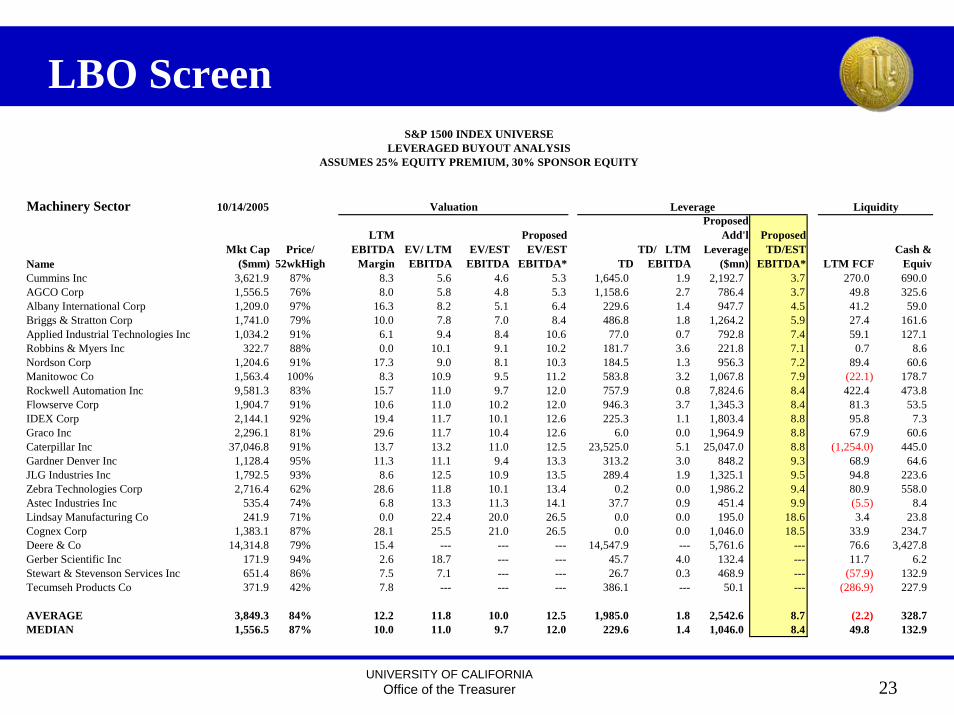
LBO Screen
Leveraged buyout (LBO) activity has dramatically increased given improved corporate liquidity and heightened shareholder activism
The LBO Screen is a real-time monitor which highlights companies most susceptible to the “negative event risk” of an LBO or recapitalization
Based on the S&P 1500 Index, the Screen calculates a company’s proposed valuation assuming:
25% acquisition premium
30% sponsor equity contribution
Corporate cash is exhausted
Revised capital structure includes additional debt necessary to fund the transaction
The LBO Screen sorts companies most vulnerable to corporate actions, supports monitoring of the current portfolio, and pinpoints credits which may need further analysis
23UNIVERSITY OF CALIFORNIA
Office of the Treasurer
LBO Screen
Machinery Sector 10/14/2005 Leverage Liquidity
NameMkt Cap
($mm)Price/
52wkHigh
LTM EBITDA
MarginEV/ LTM EBITDA
EV/EST EBITDA
Proposed EV/EST
EBITDA* TDTD/ LTM
EBITDA
Proposed Add'l
Leverage ($mn)
Proposed TD/EST
EBITDA* LTM FCFCash &
EquivCummins Inc 3,621.9 87% 8.3 5.6 4.6 5.3 1,645.0 1.9 2,192.7 3.7 270.0 690.0AGCO Corp 1,556.5 76% 8.0 5.8 4.8 5.3 1,158.6 2.7 786.4 3.7 49.8 325.6Albany International Corp 1,209.0 97% 16.3 8.2 5.1 6.4 229.6 1.4 947.7 4.5 41.2 59.0Briggs & Stratton Corp 1,741.0 79% 10.0 7.8 7.0 8.4 486.8 1.8 1,264.2 5.9 27.4 161.6Applied Industrial Technologies Inc 1,034.2 91% 6.1 9.4 8.4 10.6 77.0 0.7 792.8 7.4 59.1 127.1Robbins & Myers Inc 322.7 88% 0.0 10.1 9.1 10.2 181.7 3.6 221.8 7.1 0.7 8.6Nordson Corp 1,204.6 91% 17.3 9.0 8.1 10.3 184.5 1.3 956.3 7.2 89.4 60.6Manitowoc Co 1,563.4 100% 8.3 10.9 9.5 11.2 583.8 3.2 1,067.8 7.9 (22.1) 178.7Rockwell Automation Inc 9,581.3 83% 15.7 11.0 9.7 12.0 757.9 0.8 7,824.6 8.4 422.4 473.8Flowserve Corp 1,904.7 91% 10.6 11.0 10.2 12.0 946.3 3.7 1,345.3 8.4 81.3 53.5IDEX Corp 2,144.1 92% 19.4 11.7 10.1 12.6 225.3 1.1 1,803.4 8.8 95.8 7.3Graco Inc 2,296.1 81% 29.6 11.7 10.4 12.6 6.0 0.0 1,964.9 8.8 67.9 60.6Caterpillar Inc 37,046.8 91% 13.7 13.2 11.0 12.5 23,525.0 5.1 25,047.0 8.8 (1,254.0) 445.0Gardner Denver Inc 1,128.4 95% 11.3 11.1 9.4 13.3 313.2 3.0 848.2 9.3 68.9 64.6JLG Industries Inc 1,792.5 93% 8.6 12.5 10.9 13.5 289.4 1.9 1,325.1 9.5 94.8 223.6Zebra Technologies Corp 2,716.4 62% 28.6 11.8 10.1 13.4 0.2 0.0 1,986.2 9.4 80.9 558.0Astec Industries Inc 535.4 74% 6.8 13.3 11.3 14.1 37.7 0.9 451.4 9.9 (5.5) 8.4Lindsay Manufacturing Co 241.9 71% 0.0 22.4 20.0 26.5 0.0 0.0 195.0 18.6 3.4 23.8Cognex Corp 1,383.1 87% 28.1 25.5 21.0 26.5 0.0 0.0 1,046.0 18.5 33.9 234.7Deere & Co 14,314.8 79% 15.4 --- --- --- 14,547.9 --- 5,761.6 --- 76.6 3,427.8Gerber Scientific Inc 171.9 94% 2.6 18.7 --- --- 45.7 4.0 132.4 --- 11.7 6.2Stewart & Stevenson Services Inc 651.4 86% 7.5 7.1 --- --- 26.7 0.3 468.9 --- (57.9) 132.9Tecumseh Products Co 371.9 42% 7.8 --- --- --- 386.1 --- 50.1 --- (286.9) 227.9
AVERAGE 3,849.3 84% 12.2 11.8 10.0 12.5 1,985.0 1.8 2,542.6 8.7 (2.2) 328.7MEDIAN 1,556.5 87% 10.0 11.0 9.7 12.0 229.6 1.4 1,046.0 8.4 49.8 132.9
Valuation
S&P 1500 INDEX UNIVERSELEVERAGED BUYOUT ANALYSIS
ASSUMES 25% EQUITY PREMIUM, 30% SPONSOR EQUITY
24UNIVERSITY OF CALIFORNIA
Office of the Treasurer
Risk Management Goals
Assure quality and consistency of fixed income investment process.
- Are the risk exposures within tolerances expressed by Regents?
- Is the stated strategy being followed?
- Is the risk budget being used efficiently?
•Are expected returns commensurate with contribution to portfolio risk?
Assure adequate diversification and compliance with investment guidelines.

25UNIVERSITY OF CALIFORNIA
Office of the Treasurer
Thank you
UNIVERSITY OF CALIFORNIAOffice of the Treasurer
Managing Director
RANDOLPH E. WEDDING
Mr. Wedding is responsible for the strategic focus and management of the long-and short-term fixed-income portfolios. Prior to joining the Treasurer’s Office in 1998, Mr. Wedding was Manager of Currency Options and Derivatives Trading for Bank of America, NT&SA, New York; Managing Director, Commodities and Derivative Sales for Bear Stearns & Co. Inc, New York; and Principal, Manager of Fixed-Income Derivative Sales for Morgan Stanley & Co., New York. Mr. Wedding began his career with Wells Fargo Bank, responsible for the Bank’s Fixed Income Portfolio. Mr. Wedding earned his MBA in Finance from the University of California, Berkeley and BA in Mathematics from the University of California, San Diego.
UNIVERSITY OF CALIFORNIAOffice of the Treasurer
KIM B. EVANS
Kim Evans, Head of Fixed Income Credit Research, is responsible for global credit research and fundamental credit strategy. Ms. Evans makes fundamental investment recommendations for high-grade and high-yield corporate bonds and emerging market sovereign bonds globally.
Ms. Evans’ background comprises buy-side and sell-side experience in both Equity and Fixed Income investment areas. Prior to joining the Treasurer’s Office in 1991, Ms. Evans worked in Investment Banking at Robertson, Colman & Stevens; as Associate Director of Financial Services for Dataquest, Inc.; and as Equity Analyst for Software & Services with Sutro & Company. Ms. Evans received her MBA degree in Finance and a double BS degree in Civil Engineering and Materials Science from the University of California, Berkeley.
Credit Analysis

UNIVERSITY OF CALIFORNIAOffice of the Treasurer
OMAR K. SANDERS
Omar K. Sanders, Investment Analyst in Fixed Income Credit Research, is responsible for evaluating the fundamental credit quality and investment potential of a broad range of industry sectors and companies. Mr. Sanders makes fundamental investment recommendations for corporate bond securities.
Mr. Sanders’ background comprises buy-side and sell-side experience in both Equity and Fixed Income investment areas. Prior to joining the Treasurer’s Office in 2001, Mr. Sanders was an Associate Director of Global Research with MetLife Investments; Analyst in Equity Research with Daruma Asset Management; Analyst in Equity Capital Markets with Merrill Lynch & Company; and Analyst in Investment Banking with Prudential Securities. Mr. Sanders received his MBA in Finance and his BA in Political Science from Columbia University. Mr. Sanders has his CFA designation.
Credit Analysis
UNIVERSITY OF CALIFORNIAOffice of the Treasurer
LINDA FRIED
Linda Fried, Senior Portfolio Manager, is a member of the portfolio management team responsible for managing the fixed income portfolios. Ms Fried is responsible for formulating and implementing investment strategies for the credit portion of the fixed income portfolios, with an emphasis on evaluating relative value among industry sectors and individual credits.
Ms. Fried’s background in the Treasurer’s Office comprises experience in both the Equity and Fixed Income investment areas.
Prior to joining the Treasurer’s Office in 1982, Ms Fried was Manager of the Statistical Department and Editorial Assistant for Keystone Massachusetts, Inc., Boston; and Statistical Assistant/Office Manager for MFI Associates, Bala Cynwyd, Pennsylvania. Ms Fried earned her BA degree from the University of Pennsylvania.
Credit

UNIVERSITY OF CALIFORNIAOffice of the Treasurer
Governments
DAVID W. SCHROEDER
David Schroeder, Senior Portfolio Manager, is responsible for managing the long-term fixed income portfolios. Mr. Schroeder is responsible for formulating and implementing investment strategies for the Government Bond portion of the of the fixed income portfolios, with an emphasis on evaluating relative value and interest rate risk.
Prior to join the Treasurer’s Office in 2002, Mr. Schroeder was Senior Vice President, Senior Portfolio Manager and Head of Taxable Fixed Income with American Century Investments in Mountain View, Ca.; Vice President and Proprietary Trader, Pacific Securities, Inc. in San Francisco, Ca.; and Vice President and Proprietary Trader, Wells Fargo Bank, N.A. in San Francisco, Ca. Mr. Schroeder received a B.A. degree from Pomona College.
UNIVERSITY OF CALIFORNIAOffice of the Treasurer
Collateral-Backed
SATISH SWAMY
Satish Swamy, Senior Portfolio Manager, is a member of the portfolio management team responsible for managing the fixed income portfolios. Mr. Swamy is responsible for formulating and implementing investment strategies for the MBS portion of the fixed income portfolios, with an emphasis on evaluating relative value and prepayment risk.
Prior to joining the Treasurer’s Office in 1998, Mr. Swamy was VP/Director of Reuters Risk Management; Fixed Income Strategist for Lincoln Investment Management and Fixed Income analyst for Analytic Investment Management.
Mr. Swamy earned his MBA in Finance from the University of Southern California, MS in engineering from the University of Houston and BS in engineering from India. Mr. Swamy has his CFA designation.

UNIVERSITY OF CALIFORNIAOffice of the Treasurer
Short Term Securities
ALICE L. YEE
Alice Yee, Senior Portfolio Manager, Short-Term Securities, is responsible for the investment of the cash of the University system in short-term money market and fixed-income securities. This includes analyzing investment alternatives, forecasting cash needs and monitoring cash balances. In addition to the management of the Short Term Investment Portfolio (STIP), Ms. Yee manages the Savings Fund and the Money Market Fund.
Prior to joining the Treasurer’s Office in 1980, Ms. Yee was a Financial Analyst and Investment Analyst for Southern Pacific Transportation Company and a Systems Analyst with Bank of America, Bankamericard Systems, San Francisco. Ms. Yee earned her MBA degree in Quantitative Methods from the University of Washington and her BA degree in Applied Mathematics from the University of California, Berkeley.

UNIVERSITY OF CALIFORNIAOffice of the Treasurer
AARON STAINES
Aaron Staines, Junior Portfolio Manager, is responsible for a broad range of analytics in support of the Fixed Income portfolio management team. Prior to joining the Treasurer’s Office in 2001, Mr. Staines received his BS in Political Science from UC Berkeley; his coursework emphasized political economy. He is currently a candidate for the CFA designation.
Junior Portfolio Manager