OFFICE OF INSPECTOR GENERAL City of...
47
866-IG-TIPLINE (866-448-4754) www.chicagoinspectorgeneral.org OFFICE OF INSPECTOR GENERAL City of Chicago REPORT OF THE INSPECTOR GENERAL’S OFFICE: ************************* CHICAGO FIRE DEPARTMENT FIRE AND MEDICAL INCIDENT RESPONSE TIMES AUDIT OCTOBER 2013
Transcript of OFFICE OF INSPECTOR GENERAL City of...

866-IG-TIPLINE (866-448-4754)
www.chicagoinspectorgeneral.org
OFFICE OF INSPECTOR GENERAL City of Chicago
REPORT OF THE INSPECTOR GENERAL’S OFFICE:
*************************
CHICAGO FIRE DEPARTMENT
FIRE AND MEDICAL INCIDENT RESPONSE TIMES AUDIT
OCTOBER 2013

Joseph M. Ferguson
Inspector General
OFFICE OF INSPECTOR GENERAL City of Chicago
740 N. Sedgwick Street, Suite 200
Chicago, Illinois 60654
Telephone: (773) 478-7799
Fax: (773) 478-3949
Website Hotline: 866-IG-TIPLINE (866-448-4754) : www.ChicagoInspectorGeneral.org
October 18, 2013
To the Mayor, Members of the City Council, City Clerk, City Treasurer, and residents of the City
of Chicago:
The City of Chicago Office of Inspector General (OIG) has completed an audit of the Chicago
Fire Department’s (CFD) fire and medical incident response times for calendar year 2012.
Fire and medical emergency response is the core service provided by CFD, which is the second
largest fire department in the nation. CFD firefighters and paramedics are first responders to
Chicagoans’ calls for help in emergencies. Their prompt response is critical to the protection of
public health and safety through emergency medical response and fire suppression services,
which save lives and protect people and property from greater harm.
The OIG audit determined that CFD was not meeting the response times for National Fire
Protection Association (NFPA) Standard 1710 that it had historically claimed to meet or exceed.
It also found that CFD’s internal reports lacked the elements necessary to accurately assess
whether the Department was in fact meeting or exceeding the national standards it claimed to be
meeting.
CFD agrees that it is not strictly meeting NFPA standards. It argues that NFPA standards are
useful as guidelines rather than stringent rules for fire departments. The OIG does not have an
opinion about the usefulness of NFPA standards, but simply used the benchmark that CFD itself
had publicly attested to meeting or exceeding. I commend CFD’s commitment to clarifying its
public accounts of standards and achievements in the future. It is imperative that the residents
and City management have accurate, reliable measures of performance, especially in matters of
public safety.
I hope the audit results will be useful to the Mayor’s Office, City Council, and CFD in the shared
effort to clarify CFD’s performance metrics and improve the accuracy and integrity of its
performance reports, as well as provide a baseline analysis for efforts to increase the efficiency
and effectiveness of the services provided to residents.
CFD has stated that it is interested in working with the OIG on this issue in the future. We look
forward to this possibility and to pursuing open and positive communication with CFD in all of

Website: www.ChicagoInspectorGeneral.org Hotline: 866-IG-TIPLINE (866-448-4754)
our audits. We thank CFD as well as the Office of Emergency Management and
Communications for their cooperation during this audit.
Respectfully,
Joseph M. Ferguson
Inspector General
City of Chicago

OIG File #12-1534 October 18, 2013
CFD Response Times
Page 1 of 43
TABLE OF CONTENTS
I. EXECUTIVE SUMMARY ....................................................................................................................................... 2
II. BACKGROUND ..................................................................................................................................................... 3
A. Chicago Fire Department ............................................................................................................................. 3 B. Chicago Fire Department Emergency Call Response Process .................................................................. 3 C. National Fire Protection Association Standard 1710 ................................................................................. 3 D. Chicago Fire Department Performance Reporting .................................................................................... 5
III. OBJECTIVES, SCOPE, AND METHODOLOGY ....................................................................................................... 7
A. Objectives ....................................................................................................................................................... 7 B. Scope ............................................................................................................................................................... 7 C. Methodology .................................................................................................................................................. 7 D. Standards ....................................................................................................................................................... 8 E. Authority and Role ........................................................................................................................................ 8
IV. FINDINGS AND RECOMMENDATIONS .................................................................................................................. 9
Finding 1: CFD Does Not Have Documented Response Time Goals ................................................................. 9 Finding 2: CFD’s Analysis Does not Allow the Department to Determine Its Compliance with
National Standards ............................................................................................................................. 11 Finding 3: Not All Incidents Have Complete and Accurate Time Data .......................................................... 13 Finding 4: CFD Is Not Meeting National Standards for Response Time Citywide ........................................ 15
V. APPENDIX A: SEASONALITY ANALYSIS RESPONSE TIMES .............................................................................. 27
VI. APPENDIX B: WARD RESPONSE COMPLIANCE DETAIL .................................................................................. 28
VII. APPENDIX C: COMMUNITY AREA RESPONSE COMPLIANCE DETAIL ............................................................. 30
VIII. APPENDIX D: CFD RESPONSE TO OIG AUDIT ................................................................................................ 33
Acronyms
ALS Advanced Life Support
BLS Basic Life Support
CAD Computer Aided Dispatch
CFD Chicago Fire Department
EMS Emergency Medical Services
NFPA National Fire Protection Association
OEMC Office of Emergency Management and Communications
OIG Office of Inspector General

OIG File #12-1534 October 18, 2013
CFD Response Times
Page 2 of 43
I. EXECUTIVE SUMMARY
The Office of Inspector General (OIG) performed an audit of the Chicago Fire Department’s
(CFD) response times to fire and Emergency Medical Services (EMS) incidents for the calendar
year 2012.
The objectives of the audit were to determine if:
CFD’s response time goals are equal to or better than the national standards for fire and
EMS incidents.
CFD’s analysis of its response times allows the Department to determine its compliance
with national standards or some other goal determined by the Department.
CFD is meeting the national standards on a citywide basis as well as in each ward and
community area.
Based upon the results of our audit, we concluded that:
CFD has no documented, formal departmental goals for response time.
While CFD does analyze response time data, CFD’s own analysis does not allow it to
determine if it is meeting the National Fire Protection Association (NFPA) Standard 1710
(“national standards”), as it claims.
Nine percent of fire incidents and six percent of EMS incidents had incomplete time data
in the Computer-Aided Dispatch (CAD) system.
CFD did not meet the national standards for fire or EMS response time citywide in 2012.
CFD did not meet the national standard for medical incidents in any of the 50 wards.
CFD met the national standard for fire incidents in 7 of the 50 wards.
CFD has asserted that it meets NFPA national response time standards. Our audit found that
CFD does not in fact apply the actual national standard, opting instead to calculate a cumulative
average only. When the actual national standards are applied, CFD did not meet the standards
for response time citywide.
CFD’s reference to and assessment of its own performance relative to national standards reflects
its consideration of response times as a critical measure for achievement of its public safety
mission. It is therefore imperative that CFD formalize its response time goals and accurately
measure the extent to which it meets those goals. We hope this report serves its efforts to do so
in the future.
The specific recommendations related to each finding, and CFD’s response, are described in the
“Audit Findings and Recommendations” section of this report.

OIG File #12-1534 October 18, 2013
CFD Response Times
Page 3 of 43
II. BACKGROUND
A. Chicago Fire Department
The Chicago Fire Department is the second largest fire department in the nation. The
Department had a total 2012 budget of $565 million and 5,143 full-time equivalent positions, of
which more than 4,900 were devoted to providing Fire Suppression and Emergency Medical
Services.1 There are 92 fire stations throughout the city, which house 96 engine companies and
61 truck companies.2 In addition, there are 60 Advanced Life Support (ALS) and 15 Basic Life
Support (BLS) ambulances citywide.3 CFD receives over 500,000 calls for service per year for
emergency assistance.
B. Chicago Fire Department Emergency Call Response Process
An incident begins with a call being placed to 911. In Chicago, the call is first received into the
Office of Emergency Management and Communications (OEMC) by a police operator. If the
incident is determined to be a fire or medical emergency, it is transferred to an OEMC fire
operator. Once the operator has enough information to understand the emergency, the incident is
sent to OEMC dispatchers for execution. A dispatcher determines what companies will be
needed to respond to the emergency, identifies available companies closest to the incident, and
then dispatches the companies that will achieve the shortest response time. After the incident is
dispatched, the dispatched company acknowledges the call through a computer terminal in its
firehouse or vehicle. The responding company continues to update its status by either radio or
mobile computer terminal in its vehicle when the company departs for the incident and when it
arrives on scene. Each status update is digitally time stamped and captured in OEMC’s
Computer Aided Dispatch (CAD) system.
C. National Fire Protection Association Standard 1710
In 2001, the National Fire Protection Association established standards for fire and medical
responses known as NFPA Standard 1710 (“NFPA 1710”). Among other standards, NFPA 1710
includes response time goals for various stages of response to an emergency incident.
According to the NFPA:
1 City of Chicago, “2013 Budget Overview,” 97, accessed August 7, 2013,
http://www.cityofchicago.org/content/dam/city/depts/obm/supp_info/2013%20Budget/2013Overview.pdf, and City
of Chicago, “2012 Budget Overview,” 100. 2 An engine company relies on a “motorized apparatus that has a pump, and a 500-gallon water tank and hose—
often called a pumper”—while a truck company utilizes “a motorized apparatus that has a large mounted
hydraulically raised 100-foot ladder. The truck also carries smaller ground ladders and varied equipment for
specialized functions.” City of Chicago, “CFD Definitions,” accessed August 13, 2013,
http://www.cityofchicago.org/city/en/depts/cfd/supp_info/cfd_definitions.html. 3 As defined in Illinois’s Emergency Medical Services (EMS) Systems Act, “‘Advanced Life Support (ALS)
Services’ means an advanced level of pre-hospital and inter-hospital emergency care and non-emergency medical
services that includes basic life support care, cardiac monitoring, cardiac defibrillation, electrocardiography,
intravenous therapy, administration of medications, drugs and solutions, use of adjunctive medical devices, trauma
care, and other authorized techniques and procedures […]. ‘Basic Life Support (BLS) Services’ means a basic level
of pre-hospital and inter-hospital emergency care and non-emergency medical services that includes airway
management, cardiopulmonary resuscitation (CPR), control of shock and bleeding and splinting of fractures.” 210
ILCS 50/3.10 (a) and (c).
OIG File #12-1534 October 18, 2013
CFD Response Times
Page 4 of 43
That standard was the first organized approach to defining levels of service, deployment
capabilities, and staffing levels for substantially career fire departments. Research work
and empirical studies in North America were used by the Committee as a basis for
developing response times and resource capabilities for those services, as identified by
the fire department.4
Subsequent versions of NFPA 1710 reflect the NFPA Technical Committee’s efforts to refine
various aspects of the document including the standardization of terminology and definitions.5
While NFPA 1710 is not a legal requirement, it is followed by many cities across the country
including Los Angeles, Houston, Dallas, San Francisco, and Boston.6
For purposes of this audit, the NFPA response segments relevant to CFD (not OEMC) operations
are:
Turnout Time: defined in NFPA 1710 3.3.53.8 as “the time interval that begins when
the emergency response facilities (ERFs) and emergency response units (ERUs)
notification process begins by either an audible alarm or visual annunciation or both and
ends at the beginning point of travel time.”
Travel Time: defined in NFPA 1710 3.3.53.7 as “the time interval that begins when a
unit is en route to the emergency incident and ends when the unit arrives at the scene.”
4 NFPA 1710: Standard for the Organization and Deployment of Fire Suppression Operations, Emergency Medical
Operations, and Special Operations to the Public by Career Fire Departments, 2010 Ed. (USA, National Fire
Protection Association, 2010), 1710-1. 5 NFPA 1710: Standard for the Organization and Deployment of Fire Suppression Operations, Emergency Medical
Operations, and Special Operations to the Public by Career Fire Departments, 2010 Ed. (USA, National Fire
Protection Association, 2010), 1710-1. 6 Bryan Collins, “NFPA 1710: A Compliance Analysis of the Moraga-Orinda Fire District (MOFD),” 44 (a paper
completed for the U.S. Fire Administration’s National Fire Academy course in Executive Analysis of Fire Service
Operations in Emergency Management, May 2007), accessed August 20, 2013,
http://www.usfa.fema.gov/pdf/efop/efo40505.pdf

OIG File #12-1534 October 18, 2013
CFD Response Times
Page 5 of 43
The NFPA response time goals for those segments are (i) 80 second turnout time for fire
incidents, (ii) 4 minute or less travel time for first responders to fire incidents, (iii) 60 second
turnout time for EMS incidents, (iv) 4 minute or less travel time for BLS medical incidents, and
(v) 8 minute or less travel time for ALS medical incidents if BLS arrived within 4 minutes. The
standard further requires that the fire department establish a performance objective of not less
than a 90% achievement rate for each of the turnout and travel times stated above (NFPA 1710
4.1.2.4).
The following diagram illustrates the incident response stages described above and the NFPA
response time standards applicable to the stages examined in this audit.
Source: OIG Analysis of OEMC and CFD Operations
D. Chicago Fire Department Performance Reporting
In the 2011 Mayoral Transition Report, CFD reported that its “response time to structural fires
remains below the nationally recognized standard of four (4) minutes established by the National
Fire Protection Association.”7 The report also stated that “the estimated average [EMS] response
time for 2010 is approximately four (4) to eight (8) minutes and the CFD will strive to maintain
its 2011 performance target of six (6) minutes.” CFD officials explained to the OIG that while
the Department compares its performance to NFPA standards, CFD does not measure turnout
7 City of Chicago, “2011 Mayoral Transition Report,” March 8, 2011, 149, accessed August 9, 2013,
http://www.cityofchicago.org/content/dam/city/narr/Transition%20Reports/TransitionReport.pdf. As explained in
Finding 1 below, while CFD reported a performance target for 2011 in the Mayoral Transition Report, the
Department has no formalized performance goals in its directives, orders, or policies.

OIG File #12-1534 October 18, 2013
CFD Response Times
Page 6 of 43
and travel times separately, per NFPA 1710. Instead, the “response time” measured by CFD
represents the full interval between Dispatch and On Scene illustrated above.8
8 See Methodology and Finding 4 for more discussion of these measures.

OIG File #12-1534 October 18, 2013
CFD Response Times
Page 7 of 43
III. OBJECTIVES, SCOPE, AND METHODOLOGY
A. Objectives
This report focuses on the Chicago Fire Department’s response times to fire and medical
incidents for the calendar year 2012.
Our objectives were to determine if:
CFD’s own response time goals are equal to or better than the NFPA national standards
for fire and EMS incidents.
CFD’s analysis of response times allows it to determine compliance with the national
standards or its own goal.
CFD is meeting NFPA response time standards citywide 90% of the time.
a. Fire response time of 320 seconds or less9
b. EMS response time of 300 seconds or less10
CFD is meeting NFPA response time standards in each ward and neighborhood 90% of
the time.
a. Fire response time of 320 seconds or less
b. EMS response time of 300 seconds or less
B. Scope
The scope of our audit included Fire and EMS calls for service between January 1, 2012 and
December 31, 2012.
Because our scope was limited to the activities of the Chicago Fire Department, we did not audit
the segments of response time for which OEMC is responsible, such as 911 call answering time.
In accordance with Government Auditing Standards chapter 7.11 we are also reporting that there
was an excessive delay of nearly three months in receiving requested data from OEMC.
C. Methodology
CFD does not measure turnout and travel time separately as specified in NFPA 1710, but
measures “response time,” which represents the full interval between Dispatch and On Scene.
Therefore, to assess whether CFD’s response times met the combined total time for the otherwise
separate turnout and travel outlined in NFPA 1710, we compared CFD total response times
(turnout plus travel time) for each “call for service incident” to the national standard and
calculated the percentage of time during 2012 in which response time met the national
standard.11
9 Since NFPA does not have a standard for “response time” as CFD defines it, we combined the NFPA standards for
an 80 second turnout time and a 240 second travel time for a “response time” of 320 seconds. 10
Since NFPA does not have a standard for “response time” as CFD defines it, we combined the NFPA standards
for a 60 second turnout time and a 240 second travel time for a “response time” of 300 seconds. 11
We excluded incidents with incomplete Dispatch or On Scene Times from this analysis. Additionally, we
excluded administrative incidents—for example, fueling of fire trucks and testing of fire alarms—from this analysis.
OIG File #12-1534 October 18, 2013
CFD Response Times
Page 8 of 43
For all objectives, we interviewed senior officials from CFD to gain an understanding of the
Department’s response time goals and outcomes. Additionally, we asked the officials for written
documentation related to those goals, such as orders, directives, or policies. Finally, we
conducted a walk-through of the operations at OEMC in order to observe how 911 calls are
received, routed, and dispatched.
We assessed the reliability of the CAD data by: (1) performing electronic testing of required data
elements; (2) reviewing existing information about the data, the query and the system that
produced them; and (3) interviewing agency officials knowledgeable about the data. CFD also
performed its own analysis of a statistical sample of incidents to assess the reliability of the data.
In doing so, CFD found inaccurate CAD data for a small percentage of incidents.12
However,
we determined that these incidents did not have a statistically significant impact on our overall
results.13
We therefore determined that the data were sufficiently reliable for the purposes of this
report.
D. Standards
We conducted this audit in accordance with generally accepted Government Auditing Standards
issued by the Comptroller General of the United States. Those standards require that we plan
and perform the audit to obtain sufficient, appropriate evidence to provide a reasonable basis for
our findings and conclusions based on our audit objectives. We believe that the evidence
obtained provides a reasonable basis for our findings and conclusions based on our audit
objectives.
E. Authority and Role
The authority to perform this audit is established in the City of Chicago Municipal Code § 2-56-
030 which states that the Office of Inspector General has the power and duty to review the
programs of City government in order to identify any inefficiencies, waste, and potential for
misconduct, and to promote economy, efficiency, effectiveness, and integrity in the
administration of City programs and operations.
The role of the OIG is to review City operations and make recommendations for improvement.
City management is responsible for establishing and maintaining processes to ensure that City
programs operate economically, efficiently, effectively, and with integrity.
12
CFD reviewed a statistical sample of 139 incidents and expressed concerns about 30 unique incidents. The
Department provided evidence for 6 incidents (or 4 %) showing that the CAD data was inaccurate. CFD questioned
the accuracy of 24 additional incidents but did not provide evidence demonstrating their inaccuracy. 13
With 95% confidence, the overall expected accuracy of the data is between 90.8% and 98.4%.

OIG File #12-1534 October 18, 2013
CFD Response Times
Page 9 of 43
IV. FINDINGS AND RECOMMENDATIONS
Finding 1: CFD Does Not Have Documented Response Time Goals
CFD reported to the OIG that it has no orders, directives, or policies mandating response time
goals, but it does review response times for compliance with standards set by NFPA. We also
found evidence of CFD historically comparing its total response times (turnout plus travel time)
to NFPA 1710 in the 2011 Mayoral Transition Report (see the Background section of this
report), and in documentation from CFD Performance Management Meetings held in 2009
reflecting “average”14
response times.15
NFPA 1710 4.1.2 states that:
The fire department organizational statement shall provide service delivery objectives,
including specific time objectives for each major service component (i.e., fire
suppression, emergency medical services (EMS), special operations, aircraft rescue and
fire fighting, marine rescue and fire fighting, and/or wildland fire fighting) and objectives
for the percentage of responses that meet the time objectives.16
While CFD does review its performance with reference to NFPA 1710 response time standards,
CFD is not in compliance with the NFPA standard for setting and documenting response time
goals. A formal written statement of service delivery goals would demonstrate the Department’s
commitment and promote greater accountability to achieving those goals and measuring its
performance.
Recommendation:
We recommend that CFD formally document its response time goals, per NFPA 1710 4.1.2.
Management Response:17
“The IGO recommends formally putting in writing service delivery goal numbers in order to
‘demonstrate the department’s commitment’ to achieving response times in accordance with
certain guidelines mentioned in NFPA.
14
As with CFD’s combined “response time” measure, “average” response times is a variation from the standards set
forth in NFPA 1710 and in fact is not recommended as a measure by the Commission on Fire Accreditation
International (CFAI), as is noted in Finding 2. 15
Performance management meetings with City departments were held from 2008-2011. Departments were
required to make presentations based on their performance trends, actions taken as a result of analysis, and other
issues or challenges. 16
The “organizational statement” referenced in NFPA 1710 4.1.2 is defined in NFPA 1710 4.1.1 as a “written
statement or policy that establishes the following: (1) Existence of the fire department; (2) Services that the fire
department is required to provide; (3) Basic organizational structure; (4) Expected number of fire department
members; [and] (5) Functions that fire department members are expected to perform.” 17
See Appendix D for CFD’s complete response letter.

OIG File #12-1534 October 18, 2013
CFD Response Times
Page 10 of 43
First, as described above,18
CFD has documented formal EMS response goals in its plan as
mandated by the IDPH. CFD has been in compliance with these goals since the time of the
Plan’s approval in 2000.
The CFD has formal written rules, procedures, and training protocol on fire suppression already
in place, but disagrees with putting time goals for fire suppression response time in writing and
potentially encouraging reckless behavior to meet an arbitrarily set time goal such as NFPA,
absent a legal requirement. The IGO and the CFD are in agreement in that neither entity
advocates advising CFD personnel to drive faster to an incident to reduce response times.
Ultimately CFD’s priority is twofold: ensuring that all emergency response vehicles take the
most direct route to an emergency incident in the safest, possible manner. These goals are
reflected in two (2) different documents currently maintained by the CFD including:
• The Defensive Training Manual
• The Rules, Regulations, Practices and Procedures of the Chicago Fire Department
While CFD disagrees that it should formalize fire suppression response time goals for safety
reasons, CFD does compare its response times to the National Fire Protection Association
(NFPA) guidelines. CFD acknowledges that it does not meet the strict reading of the NFPA
guidelines employed by the IGO in their audit but strongly believes that its measurement of
average response times is a reliable and appropriate measure in line with methods employed by
other major cities. However, CFD appreciates the IGO’s view that there may be some confusion
in previous CFD materials regarding its adherence to NFPA guidelines, and will accordingly
ensure in all future literature and communications that it clarifies its usage of NFPA guidelines
as that of a tool for comparison only.”
OIG Response to Management Response:
1. CFD did not provide documentation reflecting the existence or application of fire or EMS
response time goals other than the NFPA standards, despite repeated OIG requests during
the audit process. As CFD notes elsewhere in its response to the audit, it accepts
responsibility for not providing this information during the audit process.19
2. CFD provides no substantiation for its claim that response time goals—not
requirements—will threaten traffic safety any more than already occurs as a result of
ordinary course emergency response imperatives.
3. CFD’s claim of potential impairment of traffic safety through the utilization of fire
response time goals is belied by its post-audit disclosure of its use and claimed
compliance with state-mandated response time goals for EMS.
18
See CFD’s complete response letter in Appendix D. 19
See the fourth page of CFD’s complete response letter in Appendix D.

OIG File #12-1534 October 18, 2013
CFD Response Times
Page 11 of 43
Finding 2: CFD’s Analysis Does not Allow the Department to Determine Its
Compliance with National Standards
CFD officials reported to the OIG that the Department always meets or exceeds the national
standards for response times. CFD currently receives a weekly report from OEMC that shows
citywide average response times for first responders to fire and EMS calls.20
The OIG asked
CFD for the parameters that are used to create this report but CFD did not provide them.
Because of this, we were unable to determine whether the average response time report is
accurate or reliable.
Furthermore, average response time is not a measurement contained in NFPA 1710. The
standard states that “the department shall establish a performance objective of not less than 90
percent for the achievement of each turnout time and travel time objective” (NFPA 1710
4.1.2.4). In other words, the standard does not state that the average response time should be at
or below the target response time, but rather that responses to at least 90% of incidents should be
at or below the target response time. Such measurement of the percent of a population that meets
a given criterion is called “fractile” measurement.
CFD officials stated that they believe average response time is a better measure because it takes
into account the outliers. However, the Commission on Fire Accreditation International (CFAI)
recommends against using averages as a measure of response time and instead promotes fractile
measurement:
For nearly 50 years, fire agencies have been talking about their average response time.
This is an inadequate statistical reference. As discussed earlier, a few isolated abnormal
response times will skew the average, giving an inaccurate picture of the agency’s overall
response time.[…] In early CFAI documentation it was suggested that fractile goals were
more relevant in defining an expected response goal for fire and EMS response times
instead of using averages.21
By using average response time, which is a measurement of response time not contained in
NFPA 1710, Department officials cannot truly know if or substantiate that they are meeting or
exceeding the national standards as they have previously stated.
Recommendation:
We recommend that CFD suspend all internal and external reporting that states it is in
compliance with NFPA 1710 until such time as it conducts analysis to determine if at least 90%
of responses meet the response time goals. Such an evaluation should be done annually, as
recommended in NFPA 1710 4.1.2.5.
20
According to CFD officials, this report is cumulative and provides average response times for the year-to-date.
NFPA 1710 4.1.2.5 requires fire departments to produce annual reports evaluating their response time performance. 21
Commission on Fire Accreditation International, Inc., “Creating and Evaluating Standards of Response Coverage
For Fire Departments,” 4th
ed. (Chantilly, VA: 2003), ch. 5 p. 10, accessed August 20, 2013,
http://www.riskinstitute.org/peri/images/file/cfaimanual.pdf.

OIG File #12-1534 October 18, 2013
CFD Response Times
Page 12 of 43
We further recommend that the analysis be conducted by ward or community area so the
Department can determine if its equipment and personnel are positioned appropriately to meet
target response times across the city.
Management Response:22
“As stated previously, there are no official national standards for fire department response times
and the NFPA in its own documentation recognizes that its response standards must include
flexibility and allow for differences in each fire department. NFPA 1710, section A.1.4.
Nonetheless, CFD monitors its own response times to make sure its operations are running
safely and efficiently using CAD data. CFD reviews CAD data in order to calculate average
response times as an early alert system during an internal weekly audit. While the CAD data is
subject to human error, that human error often artificially lengthens the response times instead
of shortening them. (This is a primary reason why CFD has concerns with IGO using CAD as
their only source of data for their audit of all 2012 runs, as relying on CAD data alone in
calculating average response times for such an extended period of time more likely than not has
artificially lengthened the average response times.)
For example, the CAD system depends on drivers pressing an ‘on scene’ button. If the driver
forgets to press the button, the actual response time will be shorter than the recorded response
time. In addition, due to the large number of each week’s sample size, an average of response
times is an appropriate measure of total performance. (Per basic math concepts, the larger the
sample size, the more accurately an average will account for what is being measured.) If in a
given week the averages change in a way that appears at all significant, the CFD will take a
closer look at the events of the week, running event queries, pulling two-way radio traffic and
looking at ‘after event’ documentation in order to investigate and determine the cause of any
outlier response times. For these reasons, CAD data is a sufficient early alert system for
detecting outliers in average response times.”
OIG Response to Management Response:
1. CFD acknowledges using CAD data to monitor its own response times, although it
provided no documentation of the parameters for its weekly CAD reports despite requests
from the OIG.
2. The average measure CFD purports to use to monitor response times (i) does not comport
with the NFPA fractile measure; (ii) is therefore not susceptible to comparison with the
NFPA fractile measure; and (iii) as noted above by the Commission on Fire Accreditation
International, is an inadequate measurement of performance because, “a few isolated
abnormal response times will skew the average, giving an inaccurate picture of the
agency’s overall response time.”
3. CFD’s purported use of CAD data as a “sufficient early alert system for detecting outliers
in average response times” is belied by CFD’s lack of awareness of significant outliers
found in the 2012 CAD data by the OIG during the audit, thus demonstrating the
mathematical truism that averages, by their very nature, do not reveal outliers.
22
See Appendix D for CFD’s complete response letter.

OIG File #12-1534 October 18, 2013
CFD Response Times
Page 13 of 43
Finding 3: Not All Incidents Have Complete and Accurate Time Data
Incident data obtained from OEMC showed that CFD responded to 77,262 fire incidents and
310,118 medical incidents in 2012.
We found that 7,221 or 9% of fire incidents and 17,933 or 6% of medical incidents lacked an On
Scene time. None of the incidents lacked a Dispatch time.
The Department stated that incomplete time data could be a result of the CAD system not
receiving the signal from the responding company or the responding company not pushing their
Fire Mobile Data terminal button to update their status.
In addition, CFD’s policies and procedures do not specify at what point the responding company
or the OEMC dispatcher must update the company’s status (e.g., to record On Scene time),
which has resulted in inaccurate time stamps for some incidents.23
Without complete and accurate time data, the incident response times cannot be accurately
calculated.24
This will hamper the Department’s ability to determine if it is meeting its goals, or
the national standards.
Recommendation:
We recommend that CFD update its policies and procedures to specify the point at which the
responding company’s status should be updated either by radio or Fire Mobile Data terminal.
We also recommend that CFD continuously monitor the number of blank and inaccurate time
fields and work toward achieving 100% completeness and accuracy in all data fields.
Management Response:25
“The IGO is correct in that, used on its own, CAD data is not a complete and accurate picture of
CFD response time data. Rather, it is one piece of the puzzle that may be used for short-term,
early alerts, but is not appropriate as the single tool to be used for a comprehensive audit of
response time data.
Dispatch of CFD resources in response to requests for service is the responsibility of the OEMC.
The OEMC uses the CAD system to help communications operators make final dispatching
decisions. The mobile terminals of the CAD are utilized on all frontline fire apparatus and were
designed to work in an open-air environment (an open air environment is designed for minimal
in-building penetration and use outside). The CFD has found, through interviews and practice,
that the signals from pressing the CAD buttons in CFD vehicles are not consistently received by
the CAD when transmitted from firehouses and certain parts of the city. This issue can lead to
23
As noted in the Methodology section, the Department provided evidence for a small number of incidents showing
that the CAD data was inaccurate—that is, the On Scene time stamps were complete but not correct. 24
We omitted incidents with incomplete time data from the analysis described in Finding 4. As explained in the
Methodology section, we determined that the data remained sufficiently reliable for purposes of the analysis. 25
See Appendix D for CFD’s complete response letter.
OIG File #12-1534 October 18, 2013
CFD Response Times
Page 14 of 43
varied results that may make some otherwise accurate data ‘appear’ flawed. Additionally, as
described in greater detail in a previous section, there are circumstances like a walk-in to a
firehouse or a forgotten ‘on scene’ CAD button push that leads to CAD time results like 0.00
seconds or several apparatus having their CAD buttons pushed all at once by someone at the
OEMC after a fire or EMS rescue has been long completed. These types of inconsistent CAD
events or missing fields can appear inexplicable in a vacuum, and can often only be
corroborated with the corresponding two-way radio traffic and after action queries.
The CAD has been in use since 1996 and is an incredibly helpful tool, but by no means is meant
to be used as a standalone system. The CFD’s two-way radio was and still is the primary
communications method the CFD uses with the OEMC. The two-way radio is the most reliable
method to send and receive information. It is also critical to the CFD’s overall operation
because it allows the CFD to provide urgent information to the OEMC, such as the travel
direction of emergency vehicles, extent and location of the fire within a structure, the need for
immediate rescue of civilians, any escalation of a fire, and any patient care/severity of injury
information. Admittedly, for the purposes of this audit where the IGO wanted to look at an entire
year—radio transmittals are not permanent, as audio records are only archived for 30 days
pursuant to the Local Records Act retention schedule.
In order to thoroughly investigate the response time to any emergency incident, an analysis must
be made of the CAD data, the radio traffic that occurred between CFD responding units and the
OEMC, the OEMC Event Query report, and the CFD’s NIFR report. Any CFD review or ‘after
action’ exercise is always scheduled as soon as possible after an emergency incident, to ensure
that all radio traffic is obtained and reviewed. Using CAD data that is over a year old that no
longer has the corresponding radio traffic available such as the IGO did in their audit, can lead
to an unreliable representation of what may/may not have happened during an historical
emergency incident.
In the future, the CFD is open to participating in a forward looking audit with the IG for a 30
day period so that all data, including the CAD, two-way radio traffic, event query, and NIFR
reports can be retained and reviewed, and a complete picture of response time can be obtained
and fully analyzed.”
OIG Response to Management Response:
1. CFD expressed no concerns about the use of CAD data to analyze response times until
the OIG presented the audit results to CFD.
2. The CAD data used for the audit was validated by the OIG with the assistance and review
of CFD in order to collaboratively assure sufficient reliability as an appropriate data set
for performance analysis, as described in the Methodology section of the audit.
3. The OIG is open to working with CFD on a future audit using CAD data together with
any additional CFD sources of information about fire and medical responses.

OIG File #12-1534 October 18, 2013
CFD Response Times
Page 15 of 43
Finding 4: CFD Is Not Meeting National Standards for Response Time Citywide
NFPA 1710 4.1.2.4. states that the fire department shall establish a performance objective of
meeting response time standards no less than 90% of the time.
As defined in NFPA 1710, turnout and travel time are two distinct time intervals related to an
emergency response incident and must be measured as such. CFD does not measure turnout and
travel time separately but instead measures “response time” which represents the interval
between Dispatch and On Scene (see Background section of this report). NFPA 1710 does not
have a standard for “response time” as CFD defines it. As a result CFD cannot appropriately
claim that it is in compliance with NFPA 1710.
To most proximately assess CFD’s “response time” measure in relation to the national standards,
we combined the NFPA standards for an 80 second turnout time and a 240 second travel time for
a total “response time” of 320 seconds for fire incidents. Likewise, we combined the NFPA
standards for a 60 second turnout time and a 240 second travel time for a total “response time” of
300 seconds for medical incidents. To determine whether CFD’s response times met the
aggregation of the response segment standards outlined in NFPA 1710, we compared CFD
“response times” for each call for service incident to the combined national standard segments
and calculated the percentage of responses that met that combined standard in 2012.
For fire incidents, CFD met the combined standard of a 320 second (5 minutes 20 seconds)
“response time” 82% of the time in 2012. For medical incidents, CFD met the combined
standard of a 300 second (5 minutes) “response time” 58% of the time in 2012. Therefore, CFD
failed to meet the NFPA standard for achieving target response times at least 90% of the time
citywide for both fire and medical incidents.
The charts below illustrate CFD’s compliance percentages for fire and medical incidents:
Source: OIG analysis of CFD data
We also analyzed incident data by ward and community area to determine if the combined
standards of fire response within 320 seconds and medical response within 300 seconds were met
at least 90% of the time on a ward and community area basis. We found that CFD met the
combined standard for fire incidents in 14% of the City’s wards (7 of 50), and did not meet the
82%
18%
Fire Response Compliance
Met 320SecondsStandard 58%
42%
Medical Response Compliance
Met 300SecondsStandard
OIG File #12-1534 October 18, 2013
CFD Response Times
Page 16 of 43
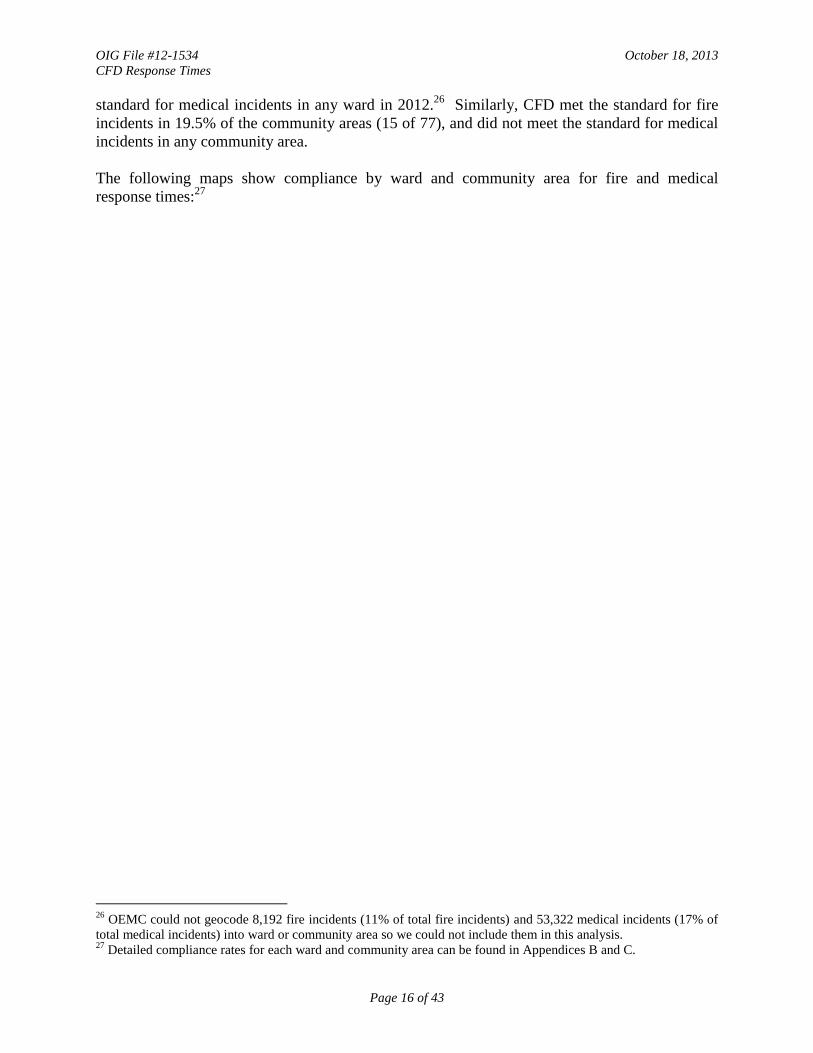
standard for medical incidents in any ward in 2012.26
Similarly, CFD met the standard for fire
incidents in 19.5% of the community areas (15 of 77), and did not meet the standard for medical
incidents in any community area.
The following maps show compliance by ward and community area for fire and medical
response times:27
26
OEMC could not geocode 8,192 fire incidents (11% of total fire incidents) and 53,322 medical incidents (17% of
total medical incidents) into ward or community area so we could not include them in this analysis. 27
Detailed compliance rates for each ward and community area can be found in Appendices B and C.

OIG File #12-1534 October 18, 2013
CFD Response Times
Page 17 of 43
Source: OIG analysis of CFD data

OIG File #12-1534 October 18, 2013
CFD Response Times
Page 18 of 43
Source: OIG analysis of CFD data

OIG File #12-1534 October 18, 2013
CFD Response Times
Page 19 of 43
Source: OIG analysis of CFD data

OIG File #12-1534 October 18, 2013
CFD Response Times
Page 20 of 43
Source: OIG analysis of CFD data

OIG File #12-1534 October 18, 2013
CFD Response Times
Page 21 of 43
The OIG also performed an analysis by month to determine if seasonality could have affected
response times. Our analysis showed seasonality had little to no impact on response times for
both fire and medical incidents.28
CFD management stated that many factors can contribute to extended response times such as
poor road conditions, train crossings, and traffic congestion.
Recommendation:
CFD expressed concerns regarding any recommendation that would encourage fire and EMS
companies to drive faster in order to decrease response time. We agree with the Department that
such a recommendation is not appropriate. However, other operational factors could be
contributing to increased response times such as a lack of ambulances and paramedics, location
of fire houses, or aging equipment. Therefore, we recommend that CFD conduct a thorough
data-based analysis to identify causes that are preventing them from meeting the national
response time goals and ways to improve its operational efficiency. Additionally, to the extent
the Department intends in the future to use NFPA 1710 as a performance standard and
benchmark, we recommend the Department immediately create and implement an action plan
that will ensure verifiable compliance with NFPA 1710 standards.
Alternatively, CFD could conduct a study to determine if the unique characteristics of the city
prevent it from meeting the response time goals contained in NFPA 1710 and could recommend
choosing other response time goals.29
The Department should then perform an annual analysis
of incidents to determine if it is meeting the alternative goals.
Finally, we recommend the Department evaluate turnout and travel time separately from total
response time to better identify and understand areas that need improvement as well as to be in
compliance with NFPA 1710.
Management Response:30
“CFD acknowledges that it does not meet the strict reading of the NFPA guidelines for fire
suppression response times employed by the IGO in their audit, but does believe that its
measurement of average response times is a reliable and appropriate measure in line with
methods employed by other major cities. Furthermore, what is advised by the NFPA for EMS is
not actually the most applicable standard, as the Illinois Department of Public Health (IDPH) is
the regulatory agency for EMS response time, trumping the NFPA’s guidelines. IDPH has
reviewed and approved CFD’s EMS response time goal of six minutes as appropriate as part of
CFD’s overall EMS Plan.
28
See Appendix A for seasonality analysis. 29
In February 2011, Citygate Associates, LLC, a consulting company hired by the City of San Diego, issued a report
titled Fire Service Standards of Response Coverage Deployment Study for the City of San Diego Fire-Rescue
Department. The report suggested changing San Diego’s medical response performance goals to account for unique
characteristics of the City. 30
See Appendix D for CFD’s complete response letter.

OIG File #12-1534 October 18, 2013
CFD Response Times
Page 22 of 43
As discussed above, the CFD gets weekly average response time results based on total time from
dispatch to ‘on scene,’ with thousands of emergency incidents resulting in a sample size big
enough to create an accurate reflection of the true average. CFD uses these averages as a first-
line tool for monitoring itself, as do many other large cities to monitor system performance. For
example, New York City, which is also not technically compliant with NFPA 1710, shows an
average response time of four minutes, as compared to Chicago’s average of just under four
minutes for suppression.
A. Ward or Community-Based Allocation of Fire Resources Would Unnecessarily
Politicize Apolitical Public Safety Mission
The IGO also recommended CFD conduct an equipment/personnel audit by ward or community
area. CFD strongly disagrees that emergency and fire suppression services should be allocated
by ward or by any other political boundaries. The only way an authentic ward or community-
area analysis could be conducted is if each ward/community had a firehouse centrally located in
it, if the ward map never changed (which is occurring now), or, if the CFD didn’t have
firehouses that were located on the borders of more than one (1) ward, and, if firehouses only
responded to incidents in their respective ward/community boundary.
In fact, neighborhood/ward boundaries are not factored in the dispatching of CFD equipment
and resources in any way. The CFD’s firehouses are laid out in a manner that gives each
firehouse a first due response or ‘still district’ response, with a dynamic network of expanding
and contracting coverage responsibilities that is based on several factors. Neighborhood/ward
boundaries are not among these factors. For instance, a neighborhood like Edison Park that is
surrounded on three (3) sides by suburbs might show a higher response time at certain times
because all CFD-based support must come from the south of the neighborhood. The IGO would
have to ‘normalize’ each neighborhood based on its location, with respect to borders, or perhaps
Lake Michigan, as any city border will affect response from that direction, especially if the
neighborhood/ward boundary has no firehouse in it.
To suggest that neighborhood/ward boundaries have a relationship to CFD operations
unnecessarily politicizes an apolitical public safety mission. Additionally, while the IGO looks at
neighborhood/ward boundaries it does not take consideration actual physical structures,
expressways, airports, or industrial areas, which may be located within those boundaries and in
many cases can affect response times. The IGO’s attempt at establishing neighborhood/ward
boundaries as an audit parameter potentially causes unnecessary and unforeseen consequences
that could undermine the CFD’s public safety mission. Further, this issue has never been a
subject of complaint either in public forums or 311 City Services.
B. Firehouse Resources in Chicago are Allocated Appropriately throughout City
On the issue of CFD potentially adding more firehouses, the CFD looked at a study previously
completed by the Rand Corporation of fire department response times. It says:

OIG File #12-1534 October 18, 2013
CFD Response Times
Page 23 of 43
‘In evaluating a community’s public fire protection, one must consider the distribution of
fire companies. Generally, expert criteria says that a built-upon area of a community
should have a first-due engine company within 1.5 road miles of the protected properties
and a ladder-service company within 2.5 road miles. Those benchmark criteria produce
an expected response time of 3.2 minutes for an engine company and 4.9 minutes for a
ladder-service company, based on the Rand formula.’
Rand conducted extensive studies of fire department response times and they concluded that the
average speed for a fire apparatus responding with emergency lights and siren is 35 mph. That
speed considers average terrain, average traffic, weather, and slowing down for intersections.
Taking into account the average speed and the time required for an apparatus to accelerate from
a stop to the travel speed, Rand developed the following equation for calculating the travel time:
T = 0.65 + 1.7D, where T = time in minutes to the nearest 1/10 of a minute and 0.65 = a
vehicle-acceleration constant for the first 0.5 mile traveled.
1.7 = a vehicle-speed constant validated for response distances ranging from 0.5 miles to
8.0 miles. D = distance
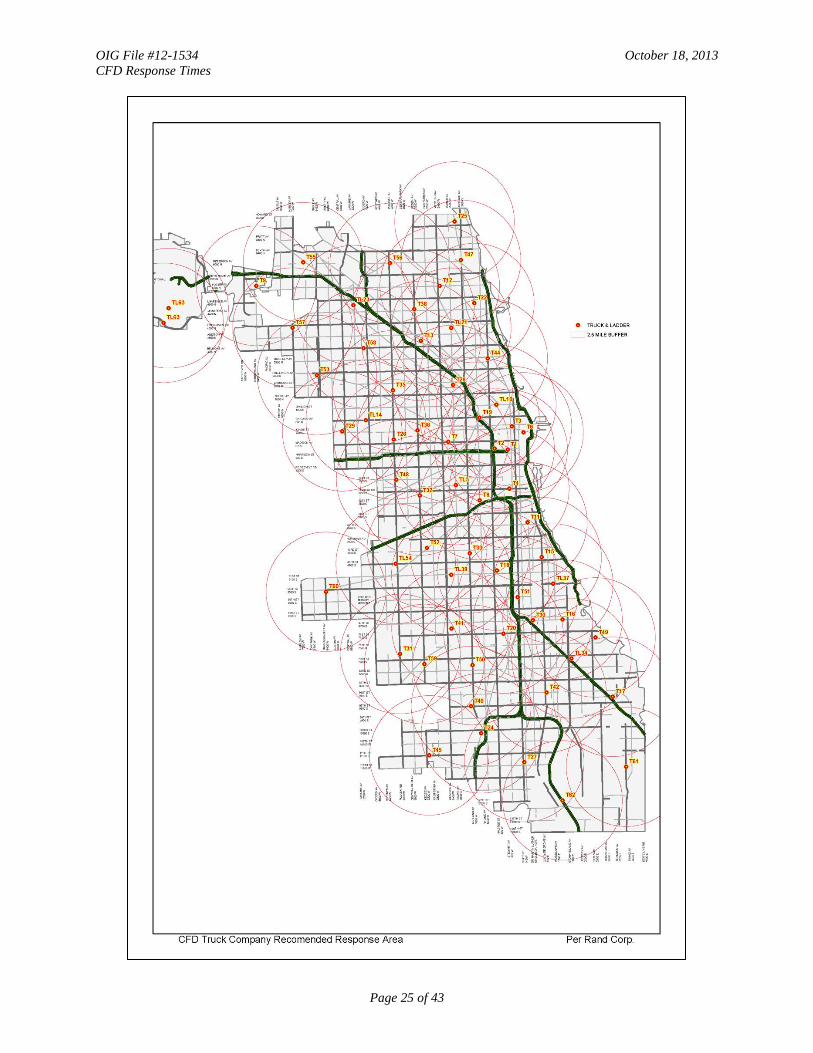
Using this formula, the CFD mapped every current firehouse in the CFD, with a buffer of 1.5
miles. The CFD used the location of each of its truck companies and made a buffer of 2.5 miles,
in accordance with the Rand formula for response. The resulting maps show that Chicago is well
within distance limits to provide proper response times and that CFD’s average reported time is,
in fact, a reflection of the grid system that is used in the deployment of firehouses, regardless of
ward or neighborhood.”
(The following two maps are part of management’s response.)

OIG File #12-1534 October 18, 2013
CFD Response Times
Page 24 of 43
OIG File #12-1534 October 18, 2013
CFD Response Times
Page 25 of 43
OIG File #12-1534 October 18, 2013
CFD Response Times
Page 26 of 43
OIG Response to Management Response:
1. CFD’s information and arguments do not respond directly to the OIG audit finding.
2. Although CFD executes fire and EMS response on a nearest available unit to incident
basis, not a nearest firehouse basis, CFD’s response to the audit’s finding employs a
formula designed to calculate response area around a firehouse, not response time to
actual incidents.
3. The most fundamental customer metric is response time, not firehouse location.
4. CFD still districts are not a meaningful geographic frame of reference from a resident’s
perspective—wards and/or community areas are.

OIG File #12-1534 October 18, 2013
CFD Response Times
Page 27 of 43
V. APPENDIX A: SEASONALITY ANALYSIS RESPONSE TIMES
Source: OIG analysis of CFD data
0%
10%
20%
30%
40%
50%
60%
70%
80%
90%
Jan Feb Mar Apr May Jun Jul Aug Sep Oct Nov Dec
2012 Fire Seasonality Analysis
Compliance Rate
0%
10%
20%
30%
40%
50%
60%
70%
80%
90%
Jan Feb Mar Apr May Jun Jul Aug Sep Oct Nov Dec
2012 Medical Seasonality Analysis
Compliance Rate
OIG File #12-1534 October 18, 2013
CFD Response Times
Page 28 of 43
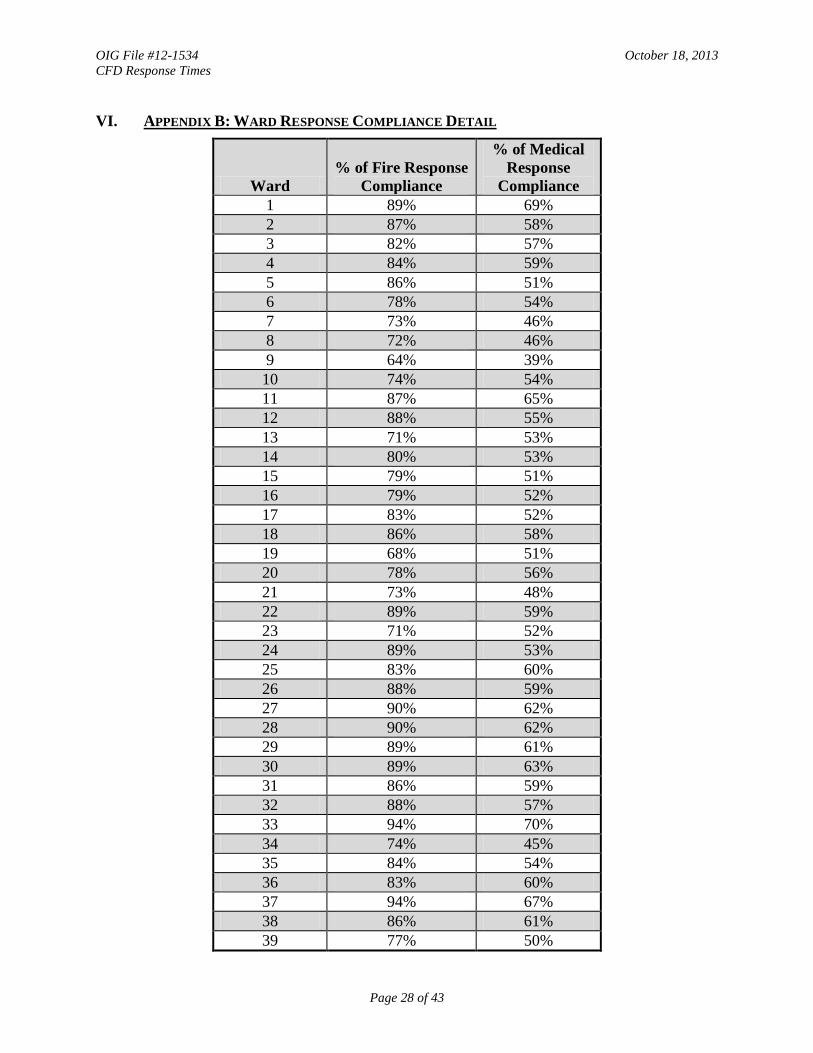
VI. APPENDIX B: WARD RESPONSE COMPLIANCE DETAIL
Ward
% of Fire Response
Compliance
% of Medical
Response
Compliance
1 89% 69%
2 87% 58%
3 82% 57%
4 84% 59%
5 86% 51%
6 78% 54%
7 73% 46%
8 72% 46%
9 64% 39%
10 74% 54%
11 87% 65%
12 88% 55%
13 71% 53%
14 80% 53%
15 79% 51%
16 79% 52%
17 83% 52%
18 86% 58%
19 68% 51%
20 78% 56%
21 73% 48%
22 89% 59%
23 71% 52%
24 89% 53%
25 83% 60%
26 88% 59%
27 90% 62%
28 90% 62%
29 89% 61%
30 89% 63%
31 86% 59%
32 88% 57%
33 94% 70%
34 74% 45%
35 84% 54%
36 83% 60%
37 94% 67%
38 86% 61%
39 77% 50%

OIG File #12-1534 October 18, 2013
CFD Response Times
Page 29 of 43
Ward
% of Fire Response
Compliance
% of Medical
Response
Compliance
40 93% 67%
41 76% 56%
42 89% 61%
43 89% 60%
44 83% 55%
45 75% 59%
46 89% 69%
47 93% 61%
48 89% 60%
49 90% 70%
50 80% 52%
Source: OIG analysis of CFD data

OIG File #12-1534 October 18, 2013
CFD Response Times
Page 30 of 43
VII. APPENDIX C: COMMUNITY AREA RESPONSE COMPLIANCE DETAIL
Community
Area
% of Fire
Response
Compliance
% of Medical
Response
Compliance ALBANY
PARK 81% 54%
ARCHER
HEIGHTS 90% 70%
ARMOUR
SQUARE 75% 61%
ASHBURN 84% 57%
AUBURN
GRESHAM 84% 56%
AUSTIN 90% 61%
AVALON
PARK 73% 53%
AVONDALE 86% 54%
BELMONT
CRAGIN 88% 67%
BEVERLY 63% 44%
BRIDGEPORT 92% 66%
BRIGHTON
PARK 90% 56%
BURNSIDE 83% 66%
CALUMET
HEIGHTS 59% 37%
CHATHAM 78% 52%
CHICAGO
LAWN 77% 47%
CLEARING 65% 60%
DOUGLAS 88% 63%
DUNNING 82% 61%
EAST
GARFIELD
PARK 86% 61%
EAST SIDE 77% 55%
EDGEWATER 89% 59%
EDISON PARK 49% 32%
ENGLEWOOD 78% 50%
FOREST GLEN 76% 58%
FULLER PARK 64% 52%
GAGE PARK 70% 40%
GARFIELD
RIDGE 75% 52%
GRAND
BOULEVARD 86% 59%
GREATER
GRAND
CROSSING 76% 51%

OIG File #12-1534 October 18, 2013
CFD Response Times
Page 31 of 43
Community
Area
% of Fire
Response
Compliance
% of Medical
Response
Compliance
HEGEWISCH 76% 52%
HERMOSA 90% 62%
HUMBOLDT
PARK 91% 61%
HYDE PARK 83% 55%
IRVING PARK 87% 62%
JEFFERSON
PARK 72% 58%
KENWOOD 85% 58%
LAKE VIEW 84% 57%
LINCOLN
PARK 88% 57%
LINCOLN
SQUARE 92% 67%
LOGAN
SQUARE 87% 58%
LOOP 90% 55%
LOWER WEST
SIDE 83% 58%
MCKINLEY
PARK 88% 66%
MONTCLARE 89% 68%
MORGAN
PARK 67% 45%
MOUNT
GREENWOOD 67% 54%
NEAR NORTH
SIDE 88% 63%
NEAR SOUTH
SIDE 81% 48%
NEAR WEST
SIDE 88% 62%
NEW CITY 90% 60%
NORTH
CENTER 93% 57%
NORTH
LAWNDALE 91% 54%
NORTH PARK 79% 61%
NORWOOD
PARK 76% 53%
OAKLAND 84% 57%
OHARE 82% 76%
PORTAGE
PARK 88% 63%
PULLMAN 50% 18%
RIVERDALE 22% 11%

OIG File #12-1534 October 18, 2013
CFD Response Times
Page 32 of 43
Community
Area
% of Fire
Response
Compliance
% of Medical
Response
Compliance
ROGERS
PARK 90% 70%
ROSELAND 70% 40%
SOUTH
CHICAGO 70% 41%
SOUTH
DEERING 61% 45%
SOUTH
LAWNDALE 86% 60%
SOUTH
SHORE 85% 54%
UPTOWN 92% 70%
WASHINGTON
HEIGHTS 71% 44%
WASHINGTON
PARK 76% 57%
WEST
ELSDON 66% 40%
WEST
ENGLEWOOD 87% 60%
WEST
GARFIELD
PARK 92% 61%
WEST LAWN 68% 49%
WEST
PULLMAN 78% 51%
WEST RIDGE 81% 53%
WEST TOWN 90% 70%
WOODLAWN 85% 56%
Source: OIG analysis of CFD data

OIG File #12-1534 October 18, 2013
CFD Response Times
Page 33 of 43
VIII. APPENDIX D: CFD RESPONSE TO OIG AUDIT

OIG File #12-1534 October 18, 2013
CFD Response Times
Page 34 of 43

OIG File #12-1534 October 18, 2013
CFD Response Times
Page 35 of 43

OIG File #12-1534 October 18, 2013
CFD Response Times
Page 36 of 43

OIG File #12-1534 October 18, 2013
CFD Response Times
Page 37 of 43

OIG File #12-1534 October 18, 2013
CFD Response Times
Page 38 of 43

OIG File #12-1534 October 18, 2013
CFD Response Times
Page 39 of 43

OIG File #12-1534 October 18, 2013
CFD Response Times
Page 40 of 43

OIG File #12-1534 October 18, 2013
CFD Response Times
Page 41 of 43

OIG File #12-1534 October 18, 2013
CFD Response Times
Page 42 of 43

OIG File #12-1534 October 18, 2013
CFD Response Times
Page 43 of 43

CITY OF CHICAGO OFFICE OF THE INSPECTOR GENERAL
Public Inquiries Rachel Leven (773) 478-0534
To Suggest Ways to Improve
City Government
Visit our website:
https://chicagoinspectorgeneral.org/get-involved/help-
improve-city-government/
To Report Fraud, Waste, and
Abuse in City Programs
Call the OIG’s toll-free hotline 866-IG-TIPLINE (866-448-
4754). Talk to an investigator from 8:30 a.m. to 5:00 p.m.
Monday-Friday. Or visit our website:
http://chicagoinspectorgeneral.org/get-involved/fight-
waste-fraud-and-abuse/
MISSION
The City of Chicago Office of Inspector General (OIG) is an independent, nonpartisan oversight
agency whose mission is to promote economy, efficiency, and integrity in the administration of
programs and operations of City government. The OIG achieves this mission through:
- Administrative and criminal investigations
- Audits of City programs and operations
- Reviews of City programs, operations, and policies
From these activities, the OIG issues reports of findings, disciplinary, and other
recommendations to assure that City officials, employees, and vendors are held accountable for
the provision of efficient, cost-effective government operations and further to prevent, detect,
identify, expose and eliminate waste, inefficiency, misconduct, fraud, corruption, and abuse of
public authority and resources.
AUTHORITY
The authority to produce reports and recommendations on ways to improve City operations is
established in the City of Chicago Municipal Code § 2-56-030(c), which confers upon the
Inspector General the following power and duty:
To promote economy, efficiency, effectiveness and integrity in the administration of the
programs and operations of the city government by reviewing programs, identifying any
inefficiencies, waste and potential for misconduct therein, and recommending to the
mayor and the city council policies and methods for the elimination of inefficiencies and
waste, and the prevention of misconduct.