
OFFICE OF CLINICAL PHARMACOLOGY REVIEW OF CLINICAL PHARMACOLOGY REVIEW . NDA: 21-976 (SE5-009)...
51
OFFICE OF CLINICAL PHARMACOLOGY REVIEW NDA: 21-976 (SE5-009) Submission Date: June 20, 2008 Brand Name Prezista ® (co-administered with Norvir ® ) Generic Name Darunavir (co-administered with ritonavir) Reviewer Stanley Au, Pharm.D., BCPS Pharmacometrics Reviewer Kevin Krudys, Ph.D. Secondary Pharmacometrics Reviewer Pravin Jadhav, Ph.D. Clinical Pharmacology Team Leader Kellie S. Reynolds, Pharm.D. OCP Division Division of Clinical Pharmacology 4 OND Division DAVP Sponsor Tibotec, Inc. Formulation; strength(s) dosed Darunavir oral tablets, 75 mg and 300 mg, in the study administered with ritonavir 80 mg/mL solution or 100 mg capsules Indication for this supplement Treatment of HIV-1 infection in pediatric patients 6 (SE5-009) to 17 years old Table of Contents Table of Contents .............................................................................................................. 1 1 Executive Summary ................................................................................................... 2 1.1 Recommendation ................................................................................................. 2 1.2 Phase IV Commitments ...................................................................................... 2 1.3 Summary of Important Clinical Pharmacology and Biopharmaceutics Findings .......................................................................................................................... 2 2 Question based review (QBR) ................................................................................... 7 2.1 General Attributes of the Drug .......................................................................... 7 2.2 General Clinical Pharmacology ......................................................................... 7 2.3 Intrinsic Factors................................................................................................. 10 2.4 Extrinsic Factors ................................................................................................ 10 2.5 General Biopharmaceutics................................................................................ 11 3 Appendices ................................................................................................................ 11 3.1 Individual Study Review-TMC114-C212 ........................................................ 11 4 Pharmacometrics Review ........................................................................................ 34 1
Transcript of OFFICE OF CLINICAL PHARMACOLOGY REVIEW OF CLINICAL PHARMACOLOGY REVIEW . NDA: 21-976 (SE5-009)...

OFFICE OF CLINICAL PHARMACOLOGY REVIEW
NDA: 21-976 (SE5-009) Submission Date: June 20, 2008
Brand Name Prezista® (co-administered with Norvir®)
Generic Name Darunavir (co-administered with ritonavir)
Reviewer Stanley Au, Pharm.D., BCPS
Pharmacometrics Reviewer Kevin Krudys, Ph.D.
Secondary Pharmacometrics Reviewer Pravin Jadhav, Ph.D.
Clinical Pharmacology Team Leader Kellie S. Reynolds, Pharm.D.
OCP Division Division of Clinical Pharmacology 4
OND Division DAVP
Sponsor Tibotec, Inc.
Formulation; strength(s) dosed Darunavir oral tablets, 75 mg and 300 mg, in the study administered with ritonavir 80 mg/mL solution or
100 mg capsules
Indication for this supplement Treatment of HIV-1 infection in pediatric patients 6 (SE5-009) to 17 years old
Table of Contents
Table of Contents .............................................................................................................. 1 1 Executive Summary ................................................................................................... 2
1.1 Recommendation ................................................................................................. 2 1.2 Phase IV Commitments ...................................................................................... 2 1.3 Summary of Important Clinical Pharmacology and Biopharmaceutics Findings .......................................................................................................................... 2
2 Question based review (QBR) ................................................................................... 7 2.1 General Attributes of the Drug .......................................................................... 7 2.2 General Clinical Pharmacology ......................................................................... 7 2.3 Intrinsic Factors................................................................................................. 10 2.4 Extrinsic Factors................................................................................................ 10 2.5 General Biopharmaceutics................................................................................ 11
3 Appendices ................................................................................................................ 11 3.1 Individual Study Review-TMC114-C212 ........................................................ 11
4 Pharmacometrics Review ........................................................................................ 34
1
1 Executive Summary In partial fulfillment of postmarketing study commitments for deferred pediatric studies as required by the Pediatric Research Equity Act (PREA), a clinical study (TMC114C212) was conducted to determine the appropriate doses of darunavir for HIV-1 infected treatment experienced pediatric and adolescent patients ages 6 to 17 years old. The study results and conclusions are discussed in the Summary of Important Clinical Pharmacology and Biopharmaceutics Findings (section 1.3).
1.1 Recommendation The Office of Clinical Pharmacology (OCP) has reviewed the information submitted in this NDA supplement and the information provided supports the proposed weight based dosing of darunavir in combination with ritonavir for treatment experienced pediatric patients 6 to 17 years old (≥ 20 to < 30 kg: 375 mg darunavir/50 mg ritonavir twice daily, ≥ 30 to < 40 kg: 450 mg darunavir/60 mg ritonavir twice daily, ≥ 40 kg: 600 mg darunavir/100 mg ritonavir twice daily).
This conclusion was based upon the following information from the TMC114-C212 study in treatment experienced pediatric subjects that is summarized in this review:
• The darunavir exposure (C0h, AUC0-24h) observed with the sponsor’s proposed weight based dosing of darunavir with ritonavir overlapped with the darunavir exposure (C0h, AUC0-24h) observed in treatment experienced adults administered 600 mg darunavir/100 mg ritonavir twice daily.
• Based on the available Week 24 data, the efficacy of darunavir in combination with ritonavir for treatment experienced pediatric patients 6 to 17 years old when compared is similar to the efficacy in treatment experienced adults.
• There were no observed trends in the reported adverse events that were of clinical significance. In addition, no relationship was observed when comparing Grade 2 or higher hepatic abnormalities and skin rash versus darunavir exposure.
In addition, the administration of pediatric doses equivalent to the adult dose of darunavir/ritonavir 600/100 mg twice daily in treatment naïve pediatric patients 6 to 17 years old is acceptable based on the favorable safety and exposure-response information from treatment experienced pediatric subjects 6 to 17 years old. Therefore, the pediatric dosing information for darunavir in the prescribing information will not be differentiated based on antiretroviral treatment history.
1.2 Phase IV Commitments None.
1.3 Summary of Important Clinical Pharmacology and Biopharmaceutics Findings Darunavir (Prezista®, darunavir ethanolate, DRV) is a human immunodeficiency virus (HIV-1) protease inhibitor. Currently, darunavir, co-administered with ritonavir, is indicated for use in the treatment of HIV-1 infection in combination with other antiretroviral medications for both treatment-experienced and naïve adult patients.
2

As of October 2008, darunavir is marketed as 300, 400 and 600 mg tablets. The recommended darunavir/ritonavir dose in treatment-experienced adult patients is 600 mg/100 mg twice a day with food and in treatment-naïve adult patients the recommended darunavir/ritonavir dose is 800 mg/100 mg once daily with food. There are no dosing recommendations in the current prescribing information (also referred to as “the label”) for either HIV-1 infected treatment experienced or naïve pediatric and adolescent patients less than eighteen years old.
In partial fulfillment of postmarketing study commitments for deferred pediatric studies as required by the Pediatric Research Equity Act (PREA), a clinical study (TMC114C212) was conducted to determine the appropriate doses of darunavir for HIV-1 infected treatment experienced pediatric and adolescent patients ages 6 to 17 years old.
This supplemental NDA was based on the results from Tibotec study TMC114-C212. The primary method for determining the appropriate dose of darunavir for HIV-1 infected treatment experienced pediatric and adolescent patients was through comparison of the darunavir exposure data from the TMC114-C212 study with the darunavir exposure data from Phase 2 clinical studies in treatment experienced HIV-1 infected adult patients (TMC114-C202 and TMC114-C213). Two different dosing cohorts with different dosage regimens per weight range were compared in Part 1. In Part 2, the higher weight based doses were chosen and all subjects from Part 1 who were not receiving the higher weight based doses were converted at Week 12 or later. At Week 12, 16 and 20 and 24, the number of subjects receiving the lower weight based doses was 21, 7, 1, and 0, respectively. Noncompartmental and population PK analysis were used to analyze the darunavir plasma concentration data in Parts 1 and 2, respectively. Ritonavir plasma concentration data was analyzed using noncompartmental analysis in Part 1 only.
The darunavir exposure data (C0h, AUC0-24h) from Part 1 of the study is located in the Individual Study Review (section 3.1) and the darunavir exposure data from Part 2 of the study is presented below. Darunavir C0h and AUC0-24h values achieved in pediatric subjects overlapped with darunavir C0h and AUC0-24h values from treatment experienced adults. Additionally, based on the Part 1 exposure data, the relationship between weight adjusted darunavir clearance and age was evaluated and it was observed that darunavir clearances adjusted for body weight in older pediatric subjects were similar to adult clearance values. In younger pediatric subjects, the small sample size and variability in clearance values preclude definitive conclusions from being made in regards to whether increased clearances are observed compared to adults. Therefore, the importance of age as a covariate when evaluating darunavir clearance remains to be determined for younger pediatric subjects.
3

Part 2 darunavir AUC0-24h comparisons for pediatric (weight based darunavir/ritonavir dosing) versus adult HIV-1 infected subjects
(darunavir/ritonavir 600 mg/100 mg twice daily) AU
C24
(ng
h/m
l)
1000
00
1500
00
2000
00
Adult Pediatric 20 - 29 kg Pediatric 30 - 39 kg Pediatric 40 - 49 kg Pediatric > 50 kg
n=119 n=18 n=19 n=25 n=12
Part 2 darunavir C0h comparisons for pediatric (weight based darunavir/ritonavir dosing) versus adult HIV-1 infected subjects (darunavir/ritonavir 600 mg/100 mg
twice daily)
1000
20
00
3000
40
00
5000
60
00
7000
80
00
C0H
(ng/
ml)
Adult Pediatric 20 - 29 kg Pediatric 30 - 39 kg Pediatric 40 - 49 kg Pediatric > 50 kg
n=119 n=18 n=19 n=25 n=12
4

The virologic efficacy measurements included evaluating the percentage of subjects at Week 24 with: a) plasma viral load < 50 HIV-1 RNA copies/mL, b) plasma viral load < 400 HIV-1 RNA copies/mL and c) plasma viral load decrease from baseline of ≥ 1.0 log10. While the sponsor did not directly compare the efficacy results at Week 24 to da ta from adults, as part of the clinical pharmacology review, these efficacy measurements were compared to the available data at Week 24 obtained from clinical studies in treatment experienced HIV-1 infected adult subjects, including two pooled phase 2 b studies (TMC114-C202 and TMC114-C213).
There was no relationship observed between darunavir exposure (C0h and AUC0-12h values) and the three measurements of virologic response at Week 24: a) plasma vira l load < 50 HIV-1 RNA copies/mL, b) plasma viral load < 400 HIV-1 RNA copies/mL a nd c) plasma viral load decrease from baseline of ≥ 1.0 log10.
Additionally, the inhibitory quotient (IQ), which is the ratio of C0h (exposure) at steady state and IC50 (a measurement of the ability of darunavir to inhibit HIV-1 virus), was derived. For each patient, the IQ provides a more robust comparison than exposure al one for the response to treatment by adjusting the exposure for the degree of HIV-1 resistance to darunavir viral inhibition. The degree of viral resistance is an important component of darunavir response as indicated by the fact that the IC50 was determined to be the major contributor to the IQ calculation. Higher IC50 values are associated with more resistant HIV-1 viruses and higher IQs are associated with greater response rates. For darunavir, when the virologic response was compared to the inhibitory quotient (IQ), at higher IQs a greater virologic response at Week 24 was observed in both adults and pediatric subjects. The IQ analysis is presented in the Individual Study Review (section 3.1).
Twenty-seven subjects were defined as virologic failures. In the plots below, virologic failures were defined as subjects who did not have Week 24 virologic data or subjects who were never suppressed or were rebounders at Week 24 using a virologic endpoint of HIV RNA <400 copies/mL. The majority of the Part 1 and 2 C0h and AUC0-12h values for virologic failure subjects were within the range of values for virologic responder subjects reported for the TMC114-C212 study. As indicated in the box plots below, lower darunavir exposures (C0h) were not observed for virologic failures but there were h igher IC50 values observed, with resulting lower IQs, indicating that viral resistance is the primary cause of the failures. When the analysis was conducted excluding the five subjects that had missing virologic data at Week 24, the same conclusions were reac hed.
5

Comparison of C0h, IC50, and IQ values for Week 24 virologic failure subjects versus virologic responder subjects using a virologic endpoint of HIV RNA <400 copies/mL
(n=27 for the virologic failure subjects and n= 53 for the virologic responder subjects)
2000
30
00
4000
50
00
6000
70
00
8000
C0H
-7
-6
-5
-4
-3
-2
log10(IC50)
4 5
6 7
8 9
log10(IQ)
Virologic Failures Virologic Responders Virologic Failures Virologic Responders Virologic Failures Virologic Responders
Based on the available Week 24 data, the efficacy of darunavir in combination with ritonavir is comparable for treatment experienced pediatric subjects 6 to 17 years old versus treatment experienced adults. In pediatric subjects, 50% had an undetectable v iral load (< 50 copies/mL) and 63.8% had a viral load < 400 copies/mL at Week 24 based on data from 80 subjects. In treatment experienced adults, based on data from 131 subjects, 69.5% of subjects had experienced a ≥ 1 log10 decrease from baseline at Week 24 and 45% had an undetectable viral load (< 50 copies/mL) based on combined data from the TMC114-C202 and TMC114-C213 studies.
There were no observed trends in the reported adverse events that were of clinical significance. In addition, no relationship was observed when comparing Grade 2 or higher hepatic abnormalities and skin rash versus darunavir exposure from Part 2 of the study.
The question of whether pediatric patients dosed with 50 and 60 mg twice daily of ritonavir oral solution could potentially receive 100 mg capsules twice daily if issue s of tolerability with the ritonavir solution occurred was discussed with the sponsor. While n o formal exposure analysis was performed comparing the ritonavir solution versus the capsule formulation, the sponsor has indicated that there was no differences in the We ek 24 and 48 adverse events for the twenty-three subjects (age range: 8 to 17 years old) who switched from the ritonavir solution to the higher 100 mg twice daily dose with the capsules. The clinical reviewer concurs with this conclusion.
6

2 Question based review (QBR)
2.1 General Attributes of the Drug
2.1.1 What is the proposed therapeutic indication(s)? The proposed therapeutic indication for darunavir is the trea tment of HIV-1 infection in pediatric and adolescent patients ages 6 to 17 years old.
2.1.2 What are the proposed dosage(s) and route(s) of administration? The proposed doses of darunavir and ritonavir are listed in the table below. D arunavir tablets and ritonavir capsules or solution were to be administered with food. The medications used in the study were darunavir 75 mg and 300 mg tablets and ritona vir 100 mg capsules or 80 mg/mL solution. While different darunavir/ritonavir ratios were administered (see chart below), the overall darunavir exposure across the different w eight groups was acceptable.
Proposed darunavir/ritonavir weight based dosage regimens in HIV infected pediatric and adolescent patients
Weight Range (kg)
Weight Range (lb) Dosage Regimen
≥ 20 kg – < 30 kg
≥ 44 lbs – < 66 lbs
375 m mgg PREZISTA®/50 ritonavir twice daily
≥ 30 kg – < 40 kg
≥ 66 lbs – < 88 lbs
450 g mg PREZISTA®/60 m ritonavir twice daily
≥ 40 kg< 50 kg ≥ 88 lbs
PREZ 0 mg 600 mg
ISTA®/10 ritonavir twice daily
2.1.3 What efficacy and safety information contribute to the assessment of clinical pharmacology and biopharmaceutics study data?
The efficacy data that was evaluated for this review to determine the effect of darunavir against the HIV-1 virus included the TMC114-C212 data as well as adult data from the Phase 2b TMC114-C202 and TMC114-C213 studies. In addition, the darunavir exposur e data from the TMC114-C202 and TMC114-C213 studies that were used to establish the efficacy of darunavir in treatment experienced adult subjects was compared with the darunavir exposure data from the TMC114-C212 pediatric subjects.
2.2 General Clinical Pharmacology
2.2.1 What is the basis for selecting the response endpoints (i.e., clinical or surrogate endpoints) or biomarkers (collectively called pharmacodynamics [PD]) and how are they measured in clinical pharmacology and clinical studies?
7
(b) (4)
(b) (4)
(b) (4)
The clinical endpoints were: a) plasma viral load < 50 HIV-1 RNA copies/mL, b) plasma viral load < 400 HIV-1 RNA copies/mL and c) plasma viral load decrease from baseline of ≥ 1.0 log10. The HIV viral load has been demonstrated to be a valid surrogate to establish the efficacy of antiretroviral medications for the treatment of HIV-1 infection.
2.2.2 Are the active moieties in the plasma (or other biological fluid) appropriately identified and measured to assess pharmacokinetic parameters and exposure response relationships?
The darunavir/ritonavir method validation report and the TMC114-C212 bioanalytical report reported were reviewed and there were no issues identified either with the darunavir/ritonavir bioanalytical method or the TMC114-C212 bioanalysis that affected the validity of the reported darunavir or ritonavir concentrations. Further information is located in the individual study report review (section 3.1).
A Division of Scientific Investigations (DSI) bioanalytical audit was conducted in November 2008. A full discussion of the audit findings is included in the individu al study report review (section 3.1). Three 483 observations were issued. There was one 483 observation which has a potential direct impact on the reported darunavir plasma concentrations: analysis runs 1 though 6 and 7 through 10 o ut of 12 accepted analytical runs were performed with QCs prepared beyond the retest date for the darunavir reference standard. ONDQA (Office of New Drug Quality Assessment) reviewed whether the month darunavir drug substance stability data submitted by Tibotec co uld be used as a substitute in the absence of valid darunavir certificates of analysis to suppor t the use of darunavir reference standards beyond the retest date. ONDQA also confirmed that the darunavir reference standard and the darunavir drug substance are the same chemical material. Upon review, ONDQA determined that while the month da runavir drug substance stability data did not provide direct supportive evidence of stability f rom the time of manufacturing to the time the QCs were prepared for either of the lots that DSI citied, the available darunavir drug substance data provides general supportive evidence of darunavir drug substance stability over months. Therefore, ONDQA’s assessment is that using darunavir reference standards beyond the retest date is not expected to impact the reported darunavir concentrations. OCP and DSI concur with this assessment.
2.2.3 What are the characteristics of the exposure-response relationships (d ose response, concentration-response) for efficacy and safety?
Exposure-response analysis
When the darunavir exposure-response data from study TMC114-C212 was analyzed, there was no relationship observed between darunavir exposure (C0h and AUC0-12h values) and virologic response at Week 24. Additionally, the inhibitory quotient (IQ), which is the ratio of C0h (exposure) at steady state and IC50 (a measurement of the ability of darunavir to inhibit HIV-1 virus), was derived. For each patient, the IQ provides a more robust comparison than exposure alone for the response to treatment by adjusting the exposure for the degree of HIV-1 resistance to darunavir viral inhibition. The degree of viral resistance is an important component of darunavir response as indicated by the
8

RNA < 50 Copies/ml
0.2
0.4
0.6
0.8
Pro
porti
on o
f Res
pond
ers
Adult (N = 350) Pediatric (N = 64)
0 1 2 3 4 5
log10 IQ
fact that the IC50 was determined to be the major contributor to the IQ calculation. High er IC50 values are associated with more resistant HIV-1 viruses and higher IQs are associated with greater response rates. For darunavir, when the virologic response was compared to the inhibitory quotient (IQ), at higher IQs a greater virologic response at Week 24 was observed in both adults and pediatric subjects. The IQ analysis is presented in the Individual Study Review (section 3.1).
AUC0-12h versus virologic response (plasma viral load < 50 HIV-1 RNA cop ies/mL) at Week 24
IQ versus virologic response (plasma viral load < 50 HIV-1 RNA copies/mL) at Week 24
9

Exposure-safety analysis
Darunavir exposure-safety analyses were conducted comparing: a) Grade 2 or higher hepatic abnormalities and b) skin rash versus darunavir exposure data from Part 2 of the study. There was no relationship observed for these comparisons (see the Pharmacometrics review).
2.3 Intrinsic Factors
2.3.1 What intrinsic factors (age , gender, race, weight, height, disease, genetic polymorphism, pregnancy, & organ dysfunction) influence exposure &/or response and what is the impact of any differences in exposure on the PDs? What dosage regimen adjustments, if any, are recommended for each of these subgroups?
Pediatric darunavir exposure data, and information on darunavir clearance as well at the exposure-response relationship are described in the Individual Study Review (section 3.1).
At the proposed weight based darunavir doses, the covariates of age, weight, gender, race and geographic region were evaluated for potential effects on the pediatric exposure d ata. For age, the 6 to less than 12 years old and the 12 to less than 18 years old groups were compared and for weight, the 20 to 29 kg, 30 to 39 kg, 40 to 49 kg and 50 kg or greater groups were compared. There were no differences observed for these covariates that were considered clinically significant. For most alpha-1-acid glycoprotein (AAG) concentration groups, an association of higher AAG concentrations with higher darunavir C0h and AUC0-12h values was observed. However, when the AAG concentration was compared to the virologic response (plasma viral load < 50 HIV-1 RNA copies/mL an d plasma viral load < 400 HIV-1 RNA copies/mL at Week 24), there was no relationshi p observed between the two variables.
When data from adult and pediatric subjects was evaluated together, a strong re lationship was observed between clearance and the covariates of AAG and body weight but not for age (see the Pharmacometrics review for further details).
2.4 Extrinsic Factors
2.4.1 What extrinsic factors influence dose-exposure and/or –response, and what is the impact of any differences in exposure on response?
Concurrent use of tenofovir and efavirenz did not affect the darunavir exposure. It was not specified why these two antiretroviral medications were evaluated by the sponsor. In the October 2008 label, it is stated that dose adjustments are not needed when administering darunavir with these two concomitant medications.
10

2.5 General Biopharmaceutics
For the TMC114-C212 study, darunavir (Prezista®) was formulated as 75 mg (F027) and 300 mg tablets (F016) for oral administration. The tablets were composed of darunavir ethanolate, microcrystalline cellulose, colloidal silicon dioxide, crospovidone, magnesium stearate and OPADRY®. The tablets were to be administered whole and not crushed.
For ritonavir (Norvir®), the commercially available 80 mg/mL solution or 100 mg capsules (Abbott Laboratories) were administered.
3 Appendices
3.1 Individual Study Review-TMC114-C212
1. Title
A Phase 2, open-label trial, to inves tigate pharmacokinetics, safety, tolerability and antiviral activity of TMC114/rtv BID in treatment-experienced HIV-1 infected children and adolescents-Week 24 analysis
2. Objectives
In Part 1 of the study, the objectives were to compare the darunavir exposure data from two darunavir/ritonavir dosing cohorts and to select the most appropriate dose for Part 2 as well as to obtain safety and tolerability data from the two cohorts. In Part 2 of the study, exposure-response was evaluated up to Week 24 and the safety, efficacy and tolerability of darunavir/ritonavir was evaluated up to Week 48.
3. Study Design
TMC114-C212 was a randomized, open label, Phase 2 study. Treatment experienced HIV-1 infected pediatric subjects 6 to 17 years old were enrolled. For Part 1, 52 subjects were screened and 44 subjects were randomized and treated, with 22 subjects assigned to each dosing cohort (Groups A and B). The darunavir doses in Group B were 20 to 33 % higher than in Group A. Within each dosing cohort, three weight bands (≥ 20 kg – < 30 kg, ≥ 30 kg – < 40 kg, and ≥ 40 kg-<50 kg were used to stratify the dosing regimens. The dosing cohorts are listed in Table 1.
The inclusion criteria included subjects receiving antiretroviral treatment for at least 12 weeks who required a change in their regimen because of a failure to suppress the HIV virus (viral load >1000 copies/mL). The individual antiretroviral medications used and the combinations of antiretroviral medications used as part of the treatment regimen a s recorded on Day 7 are listed in Tables 2 and 3. Lamivudine and tenofovir were the m ost commonly administered NRTIs and the majority of subjects were receiving 2 or 3 nucleoside reverse transcriptase inhibitors (NRTIs).
11

Table 1-Darunavir/ritonavir dosing cohorts
Group A (Approximately 9 to 15 mg/kg darunavir and 1.5 to 2.5 mg/kg ritonavir given BID):
Weight Range (kg)
Weight Range (lb) Dosage Regimen s (%) Number of Subject
≥ 20 kg – < 30 kg
≥ 44 lbs – < 66 lbs
300 mg PREZISTA /50 mg ®
ritonavir twice daily 7 (31.8) ≥ 30 kg – < 40 kg
≥ 66 lbs – < 88 lbs
375 mg PREZISTA®/60 mg ritonavir twice daily 8 (36.4)
≥ 40 kg-<50 kg ≥ 88 lbs
450 mg PREZISTA®/100 mg ritonavir twice daily 7 (31.8)
Group B (Approximately 11.5 to 18.75 mg/kg darunavir and 1.5 to 2.5 mg/kg ritonavir given BID):
Weight Weight Range (kg) Range (lb) Dosage Regimen Number of Subjects (%) ≥ 20 kg – < 30 kg
≥ 44 lbs – < 66 lbs
375 mg PREZISTA®/50 mg ritonavir twice daily 7 (31.8)
≥ 30 kg – < 40 kg
≥ 66 lbs – < 88 lbs
450 m mgg PREZISTA®/60 ritonavir twice daily 7 (31.8)
≥ 40 kg600 mg
PREZISTA®/100 mg < 50 kg ≥ 88 lbs ritonavir twice daily 8 (36.4)
Table 2-Antiretroviral medications adm inistered as part of the treatment regimen on Day 7
12
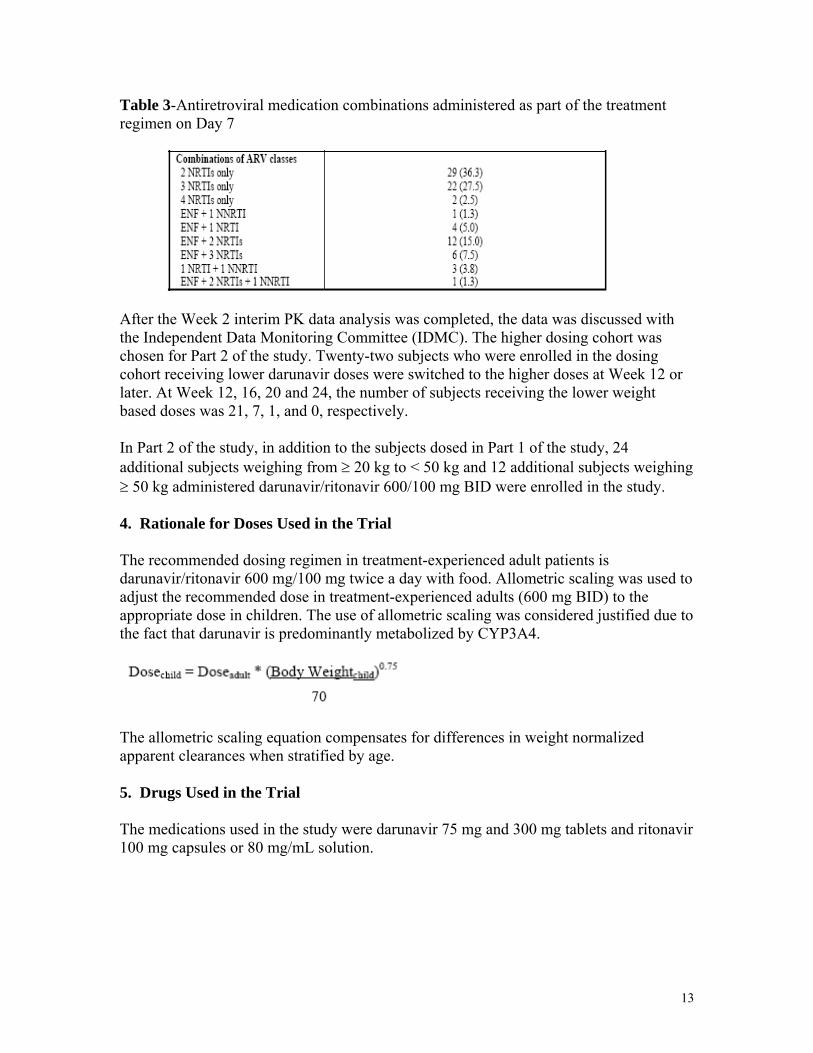
Table 3-Antiretroviral medication combinations administered as part of the treatment regimen on Day 7
After the Week 2 interim PK data analysis was completed, the data was discussed with the Independent Data Monitoring Committee (IDMC). The higher dosing cohort was chosen for Part 2 of the study. Twenty-two subjects who were enrolled in the dosing cohort receiving lower darunavir doses were switched to the higher doses at Week 12 or later. At Week 12, 16, 20 and 24, the number of subjects receiving the lower weight based doses was 21, 7, 1, and 0, respectively.
In Part 2 of the study, in addition to the subjects dosed in Part 1 of the study, 24 additional subjects weighing from ≥ 20 kg to < 50 kg and 12 additional subjects weighing ≥ 50 kg administered darunavir/ritonavir 600/100 mg BID were enrolled in the study.
4. Rationale for Doses Used in the Trial
The recommended dosing regimen in treatment-experienced adult patients is darunavir/ritonavir 600 mg/100 mg twice a day with food. Allometric scaling was used to adjust the recommended dose in treatment-experienced adults (600 mg BID) to the appropriate dose in children. The use of allometric scaling was considered justified due to the fact that darunavir is predominantly metabolized by CYP3A4.
The allometric scaling equation compensates for differences in weight normalized apparent clearances when stratified by age.
5. Drugs Used in the Trial
The medications used in the study were darunavir 75 mg and 300 mg tablets and ritonavir 100 mg capsules or 80 mg/mL solution.
13

(b) (4)
(b) (4)
6. Sample Collection, Bioanalysis, Pharmacokinetic Assessments, and Statistical Analysis
Sample Collection
Blood samples were collected for analysis of darunavir and ritonavir plasma concentrations at different time points for Pa rts 1 (Week 2) and 2 (Weeks 4, 24 and 48). For Week 2, blood samples were collected pre-dose and 0, 1, 3, 6 and 12 hours. For Weeks 4, 24 and 48, one blood sample was collected pre-dose and the second sample was collected 1 hour or later after the first blood sample. Additionally, for the subjects that were enrolled in Part 2 of the study only, Week 2 samples were collected pre-dose and the second sample was collected 1 hour or later after the first blood sample.
Bioanalysis
A validated LC/MS/MS assay was used to quantitate darunavir and ritonavir plasma concentrations. The lower limit of quantification for both darunavir and ritonavir was 5 ng/mL and the upper limit of quantification for both darunavir and ritonavir was 10000 ng/mL. For the TMC 114-C212 analysis, darunavir accuracy and precision at the low Q C (13.2 or 13.6 ng/mL) ranged from -8.8% to 0% and 0.5% to 9.2%, respectively, and for the high QC (7560, 7580 or 7590 ng/mL) the accuracy and precision ranged from -8.7% to 6.6% and 0.5% to 4.8%, respectively. For ritonavir, the accuracy and precision at the low QC (13.2 or 13.6 ng/mL) ranged from -11% to 8.3% and 0.8% to 6.1%, respectively, and for the high QC (7560 or 7580 ng/mL) the accuracy and precision ranged from -9.8% to 12.1% and 0.4% to 4.9%, respectively.
There were no issues identified in the reports for the darunavir/ritonavir bioanalytical method or the TMC114-C212 bioanalysis that affected the validity of the reported darunavir or ritonavir concentrations. A Division of Scientific Investigations (DSI) inspection of the bioanalytical laboratory that performed the darunavir/ritona vir bioanalytica l method validation and the TMC114-C212 bioanalysis was conducted in November 20 08. Three 483 observations were issued. There was one 483 observation that has a potential impact on the reported darunavir plasma concentrations: analysis r uns 1 though 6 and 7 through 10 out of 12 accepted analytical runs were performed with QC s prepared beyond the retest date for the darunavir reference standard. Two different lots o f darunavir reference standard used for Runs 1 through 6 (Lot S-05-0065; retest date: April 26, 2007) and 7 thorough 10 (Lot S-04-0050; retest date: September, 2006). Darunavir QCs for runs 1 through 6 were prepared on June 8, 2007 and darunavir QCs for runs 7 through 10 were prepared on October 2, 2006.
ONDQA (Office of New Drug Quality Assessment) reviewed whether the month darunavir drug substance stability data submitted by Tibotec could be used as a substitute in the absence of valid darunavir certificate s of analysis to support the use of darunavir reference standards beyond the retest date. ONDQA also confirmed that the darunavir reference standard and the darunavir drug substance are the same chemical material. Upon review, ONDQA determined that while the month darunavir drug substanc e stability data did not provide direct supportive evidence of stability from the time of
14

(b) (4)
(b) (5)(b
(b) (5)(b) (5)
(b) (5)
manufacturing to the time the QCs were prepared for either of the lots that DSI c itied, the available darunavir drug substance data provides general supportive evidence of darunavir drug substance stability over months. Therefore, ONDQA’s assessment is that using darunavir reference standards beyond the retest date is not expected to impact the reported darunavir concentrations. OCP and DSI concur with this assessment.
The other two 483 observations were related to appropriate follow up and documentation of validation experiments that did not meet acceptance criteria or exclusion of failed run s from the validation report. When repeated, the experiments citied by DSI did meet acceptance criteria in the method validation rep ort. DSI is recommending
OCP’s assessment is that based on the comparable adult and pediatric darunavir plasm a pharmacokinetic results and exposure response data, the 483 observations should not impact the study conclusions.
Additionally, three clinical sites were audited and two 483 observations were issued. The first observation involved a subject who was receiving efavirenz in Part 1 of the study. This issue was noted in the TMC114-C212 clinical study report and the subject w as excluded from the Part 1 analysis. The second observation involved a subject who deviated from the inclusion criteria for the CD4 count-this observation did not affect the reported darunavir or ritonavir plasma concentration data.
Pharmacokinetic Assessments
The Week 2 darunavir and ritonavir plasma concentrations were analyzed using noncompartmental analysis to derive the darunavir and ritonavir AUC0-12h, AUC0-24h (2 X the AUC0-12h), C0h, Tmax and Cmax. Though the study protocol also indicated that the fluctuation index (FI) was to be calculated, this parameter was not reported in the TMC114-C212 study report.
The Week 2 pharmacokinetic data along with adult data from the TMC125-C206 an d TMC125-C216 studies was used to update the population PK mo del (two compartment, first order absorption) that was previously developed for adults. The adult TMC 114C202, C213 and C215 studies were used to develop the initial adult population PK estimates. Using this revised model, intensive and sparse sampling plasma data from Weeks 2, 4, 24 and 48 were then used to derive individual AUC0-12h, C0h and Cl/F population PK estimates for each Part 1 and 2 study visit. When calculating median population PK estimates for each subject, the week 2 AUC0-12h and C0h predicted estimates were not included.
15

The equation that describes the original model is listed below:
(CLINT is the intrinsic clearance, KAFF is the affinity constant of the TMC114-AAG complex and AAG is the AAG concentration in mg/dL, TDD is the total daily dose in mg, θ is a scaling factor and eη indicates the inter-individual variability).
For the pediatric PK model, the total daily dose (TDD) was removed and weight w as added:
Additional information about the development of the pediatric population pharmacokinetic model is included in the Pharmacometrics revi ew.
Statistical Assessments
For Part 1, descriptive statistics were calculated, including the mean plasma concentrations and for the pharmacokinetic parameters, the mean, median, standard deviation, and the minimum and maximum values. As defined by the sponsor, if the darunavir AUC0-24h, C0h, and Cmax mean values in pediatric subjects were within 80-130 % of adult values, the exposure in pediatric subjects was considered to be comparable to adult subjects. For Part 2 of the study, population PK analysis was used.
7. Results
7.1 Pharmacokinetic and Pharmacodynamic Analysis
Both the Part 1 and 2 plasma concentration data was reviewed for subjects with non quantifiable or low darunavir or ritonavir concentrations at steady state. The dose administration record was reviewed for missed doses of either darunavir or ritonavir and the adverse events listing was checked for reported emesis episodes. For most of the subjects whose data was reviewed, the exact causes of these reported anomalies were not explained by either miss ed darunavir or ritonavir doses or emesis episodes. There were also no concomitant medications administered that would be anticipated to significantly decrease the reported plasma concentrations.
Part 1-darunavir
In Part 1, both Group A and B pediatric subjects had darunavir exposures comparable t o treatment experienced adults, based on adult exposure data from the TMC 114-C202 and TMC114-C213 studies. Group B dosing was selected for Part 2 dosing based on the higher darunavir exposures.
16

The Part I darunavir pharmacokinetic parameters were derived using scheduled sampling times. Three subjects were excluded from the overall an alysis: one subject (63) with no detectable ritonavir concentrations and two subjects who were also receiving efavirenz (27 and 57). The darunavir plasma concentration data was reviewed using actual sampling times. The differences in the reported pharmacokinetic parameters were determined to be minimal. It was noted, however, that the pre-dose times for intensive PK sampling varied in relation to the last administered darunavir dose, which ranged from approximately 5 hours before to 3 hours after the end of the twelve hour dosing interval (excluding subjects who missed doses). Deviations were also observed for Part 2 pre-dose times with reported plasma concentrations, which ranged from approximately 8 hours before to 5 hours after the end of the twelve hour dosing interval. In discussions with the sponsor, the Part 1 deviations are not considered significant because of factors such as the long half life of darunavir when co-administered with ritonavir, and for the Part 2 calculations, the sampling time deviation did not affect the exposure data since the C0h values were estimated based on what the predicted value would be if it was taken at the end of a 12 hr interval and the AUC0-12h values were calculated independent of the sampling times using the equation Cl=Dose/(AUC/f). The Pharmacometrics review compared the noncompartme ntal and population PK analysis AUC0-12h and C0h values and concluded there were minimal differences in the reported values for the two analyses.
Figure 1-Darunavir C0h comparisons for Group A pediatric (weight based darunavir/ritonavir dosing) versus adult HIV-1 infected subjects (darunavir/ritonav ir 600 mg/100 mg twice a day)
2000
30
00
4000
50
00
6000
70
00
C0H
(ng/
ml)
A dult 600 mg A ll P ed ia tric P ed ia tric 300 m g P ed iatric 375 mg P ed ia tric 450 m g
n=119 n=20 n=7 n=7 n=6
17

Figure 2-Darunavir AUC0-24h comparisons for Group A (weight based darunavir/ritonavir dosing) pediatric versus adult HIV-1 infected subjects (darunavir/ritonavir 600 mg/100 mg twice a day)
5000
0 10
0000
15
0000
20
0000
AUC
24 (n
g h/
ml)
A dult 600 mg A ll Pediatric Pediatric 300 mg Pediatric 375 mg Pediatric 450 mg
n=119 n=20 n=6 n=8 n=6
In general, the Group A median darunavir C0h and AUC0-24h values trended lower for all dosing groups when compared to the adult values (Figures 1 and 2). However, for the entire Group A cohort, the darunavir C0h AUC0-24h and Cmax values were 91%, 81% and 88% of adult values, which were within 80-130% of adult values (see Table 5). Therefore, the darunavir exposure in Group A pediatric subjects was considered to be acceptable when compared to adult subjects.
The sponsor did not evaluate the Group A weight groups to determine whether the mean darunavir C0h and AUC0-24h values for each of the groups were within 80-130% of adult values. However, in the ≥20 to <30 kg and ≥40-to <50 kg groups, the mean AUC0-24h values did not met the 80-130% criteria. However, the samples sizes for these weight group comparisons were limited to less than 10 subjects.
18

5000
0 10
0000
15
0000
20
0000
25
0000
30
0000
AUC
24 (n
g h/
ml)
A dult 600 m g A ll P ed ia tric P ed ia tric 375 m g P ed ia tric 450 m g P ed ia tric 600 m g
n=119 n=19 n=7 n=5 n=7
Figure 3-Darunavir C0h comparisons for Group B (weight based darunavir/ritonavir dosing) pediatric versus adult HIV-1 infected subjects (darunavir/ritonavir 600 mg/100 mg twice a day)
1000
060
00
8000
C0H
(ng/
ml)
040
000
02
0
Adult 600 mg All Pediatric Pediatric 375 mg Pediatric 450 mg Pediatric 600 mg
n=119 n=20 n=7 n=6 n=7
Figure 4-Darunavir AUC0-24h comparisons for Group B (weight based darunavir/ritonavir dosing) pediatric versus adult HIV-1 infected subjects (darunavir/ritonavir 600 mg/100 mg twice a day)
19

The Group B median darunavir C0h values trended higher for the darunavir/ritonavir 375 mg/50 mg twice daily and the 600 mg/100 mg twice daily dosing groups when compared to the adult value. The only exception was for the darunavir/ritonavir 450 mg/60 mg twice daily (≥ 30 kg – < 40 kg) dosing group, which was lower than the adult value. The data is displayed in Figures 3 and 4. The Group B median darunavir AUC0-24h values were more variable, with the darunavir/ritonavir 375 mg/50 mg dosing group trending higher, the 600 mg/100 mg dosing group trending slightly lower and the 450/60 mg group was significantly lower compared to the adult value.
It is unclear why the Group B darunavir/ritonavir 450 mg/60 mg group twice daily had a lower median AUC0-24h value of 79020 ng/mL*hr. Subject 32 had a much lower AUC0-24h value, however the reason for the low ritonavir and darunavir plasma concentrations is not clear (see below). However, excluding this subject did not result in a significant change in the darunavir median AUC0-24h value (the median value when excluding subject 32 was 83390 ng/mL*hr). In Group A, when darunavir/ritonavir 450 mg/100 mg twice daily was dosed in the ≥ 40 kg-<50 kg group, the darunavir median AUC0-24h value was 83965 ng/mL*hr and when darunavir/ritonavir 375 mg/60 mg twice daily was dosed in the ≥ 30 kg-<40 kg group, the median AUC0-24h value was 102495 ng/mL*hr. However, a direct comparison of the data from the two groups is not possible due to the differences in the weight groups and ritonavir dosage.
For the overall Group B cohort, the mean darunavir C0h AUC0-24h and Cmax values were 114%, 102% and 112% of adult values, which were within 80-130% of adult values (see Table 5). Therefore, based on the acceptance criteria, the overall darunavir exposure in Group B pediatric subjects was considered to be acceptable when compared to adult subjects.
The sponsor did not evaluate the mean Group B weight groups to determine whether th e darunavir C0h and AUC0-24h values for each of the groups were within 80-130% of adul t values. However, in the ≥20 to <30 kg, the mean C0h and AUC0-24h values did not me t the 80-130% criteria, and in the ≥30-to <40 kg group the mean AUC 0-24h values did not met the 80-130% criteria. However, the samples sizes for these weight group comparisons were limited to less than 10 subjects and the Group B doses were further evaluated in Part 2 of the study.
As mentioned previously, due to the overall higher darunavir exposure as well as the lack of tolerability or safety issues in Group B, this cohort was chosen for further dosing in Part 2 of the study.
20

Table 5-Comparison of darunavir pediatric versus adult C0h, AUC0-24h and Cmax parameters
Additionally, the relationship between darunavir weight adjusted clearance and age was evaluated based on the Part 1 exposure data (Figure 5). It was observed that darunavir clearances adjusted for body weight in older pediatric subjects were similar to adult clearance values. In younger pediatric subjects, the small sample size and variability in clearance values preclude definitive conclusions from being made in regards to whether increased clearances are observed compared to adults. Therefore, the importance of age as a covariate when evaluating darunavir clearance remains to be determined for younger pediatric subjects.
Figure 5-Darunavir weight adjusted clearance versus age comparisons for all Week 2 pediatric subjects
0
100
200
300
400
500
600
700
800
900
Cle
aran
ce (m
L/h
r/kg
)
6 8 10 12 14 16
Age
Two subjects had calculated clearance values greater than 700mL/hr/kg. Subject 63 did not have quantifiable ritonavir concentrations and subject 32 had low ritonavir and
21
18

darunavir concentrations. It is unknown why ritonavir and darunavir concentration were low for these two subjects-the prior evening and morning dose of ritonavir and darunavir have dosing times listed for both subjects. In addition, no emesis episodes were noted for either subject. There were also no concomitant medications administered that would be anticipated to significantly decrease the reported plasma concentrations.
Part 1-ritonavir
The Group A and B plasma concentration time profiles for ritonavir are displayed below (Figure 6). When compared to ritonavir concentrations from the adult TMC114-C202 and TMC114-C213 studies, the mean concentration time profile for Groups A and B were lower and higher, respectively, when compared to the adult mean profile. No descriptive statistics for ritonavir PK parameters were included in the study report and the ritonavir plasma concentration data was not reviewed.
Figure 6-Ritonavir mean plasma concentration comparisons for Group A and B pediatric versus adult HIV-1 infected subjects
The question of whether pediatric patients dosed with 50 and 60 mg twice daily of ritonavir oral solution could potentially receive 100 mg capsules twice daily if issues of tolerability with the ritonavir solution occurred was discussed with the sponsor. While no formal exposure analysis was perform ed comparing the ritonavir solution versus the capsule formulation, the sponsor has indicated that there was no differences in the Week 24 and 48 adverse events for the twenty-three subjects (age range: 8 to 17 years old) who switched from the ritonavir solution to the higher 100 mg twice daily dose with the capsules. The clinical reviewer concurs with this conclusion.
Part 2-darunavir
Seventy-four out of eighty subjects were included in the Part 2 analysis. The sponsor
22
1000
70
00
8000
20
000
0 6
)
00
3000
40
00
500
C0H
(ng/
ml
Adult Pediatric 20 - 29 kg Pediatric 30 - 39 kg Pediatric 40 - 49 kg Pediatric > 50 kg
n=119 n=18 n=19 n=25 n=12
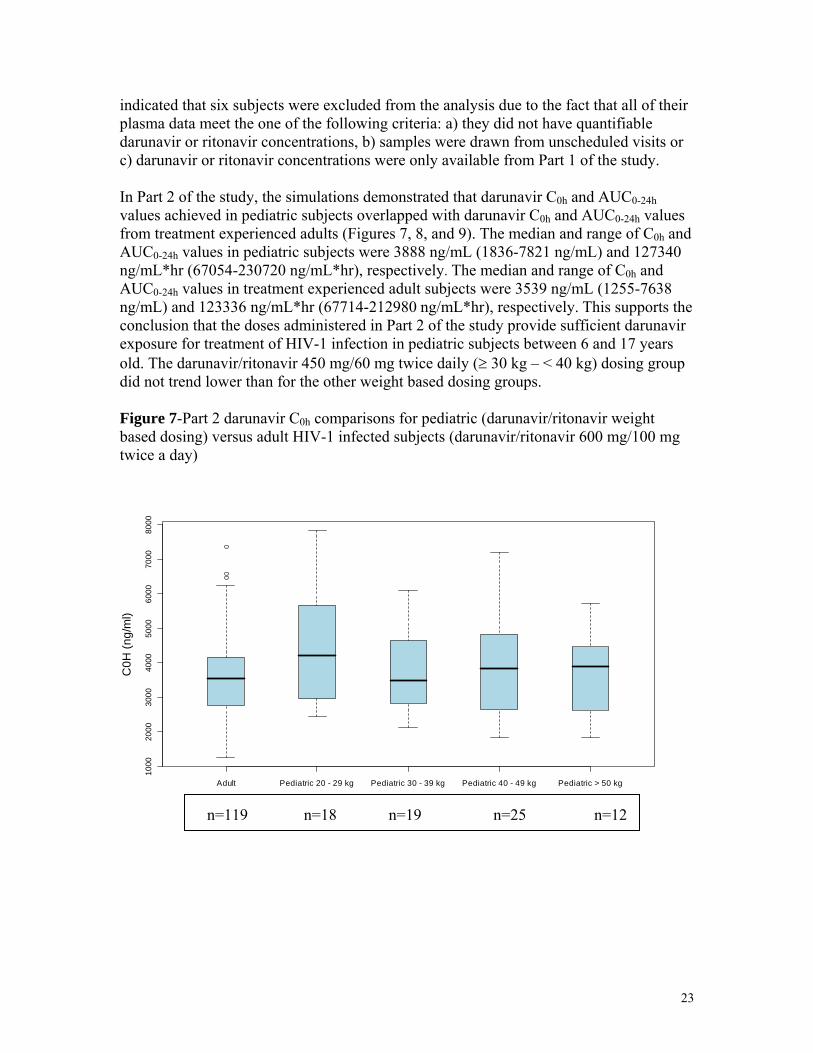
indicated that six subjects were excluded from the analysis due to the fact that all of their plasma data meet the one of the following criteria: a) they did not have quantifiable darunavir or ritonavir concentrations, b) samples were drawn from unscheduled visits or c) darunavir or ritonavir concentrations were only available from Part 1 of the study.
In Part 2 of the study, the simulations demonstrated that darunavir C0h and AUC0-24h values achieved in pediatric subjects overlapped with darunavir C0h and AUC0-24h values from treatment experienced adults (Figures 7, 8, and 9). The median and range of C0h and AUC0-24h values in pediatric subjects were 3888 ng/mL (1836-7821 ng/mL) and 127340 ng/mL*hr (67054-230720 ng/mL*hr), respectively. The median and range of C0h and AUC0-24h values in treatment experienced adult subjects were 3539 ng/mL (1255-7638 ng/mL) and 123336 ng/mL*hr (67714-212980 ng/mL*hr), respectively. This supports the conclusion that the doses administered in Part 2 of the study provide sufficient darunavir exposure for treatment of HIV-1 infection in pediatric subjects between 6 and 17 years old. The darunavir/ritonavir 450 mg/60 mg twice daily (≥ 30 kg – < 40 kg) dosing group did not trend lower than for the other weight based dosing groups.
Figure 7-Part 2 darunavir C0h comparisons for pediatric (darunavir/ritonavir weightbased dosing) versus adult HIV-1 infected subjects (darunavir/ritonavir 600 mg/100 mg twice a day)
23

AUC
24 (n
g h/
ml)
1000
00
1500
00
2000
00
Adult Pediatric 20 - 29 kg Pediatric 30 - 39 kg Pediatric 40 - 49 kg Pediatric > 50 kg
n=119 n=18 n=19 n=25 n=12
10 00
2 0
0 0
30 00
40
00
5 00 0
6 0
0 0
70 00
8 0
0 0
C 0H
(ng /
m l)
1000
00
1500
00
2000
00
ml)
AUC
24 (n
g h/
Adult Pediatric Adult Pediatric
n=119 n=74 n=119 n=74
Figure 8-Part 2 darunavir AUC0-24h comparisons for pediatric (darunavir/ritonavir we ight based dosing) versus adult HIV-1 infected subjects (darunavir/ritonavir 600 mg/100 mg twice a day)
Figure 9-Part 2 darunavir C0h and AUC0-24h comparisons for pediatric (darunavir/ritonavir weight based dosing) [all weight groups combined] versus adult HIV-1 infected subjects (darunavir/ritonavir 600 mg/100 mg twice a day)
Tibotec also conducted subgroup analyses of the pediatric exposure data and evaluated the covariates of age, weight, gender, race and geographic region. For age, the 6 to less
24
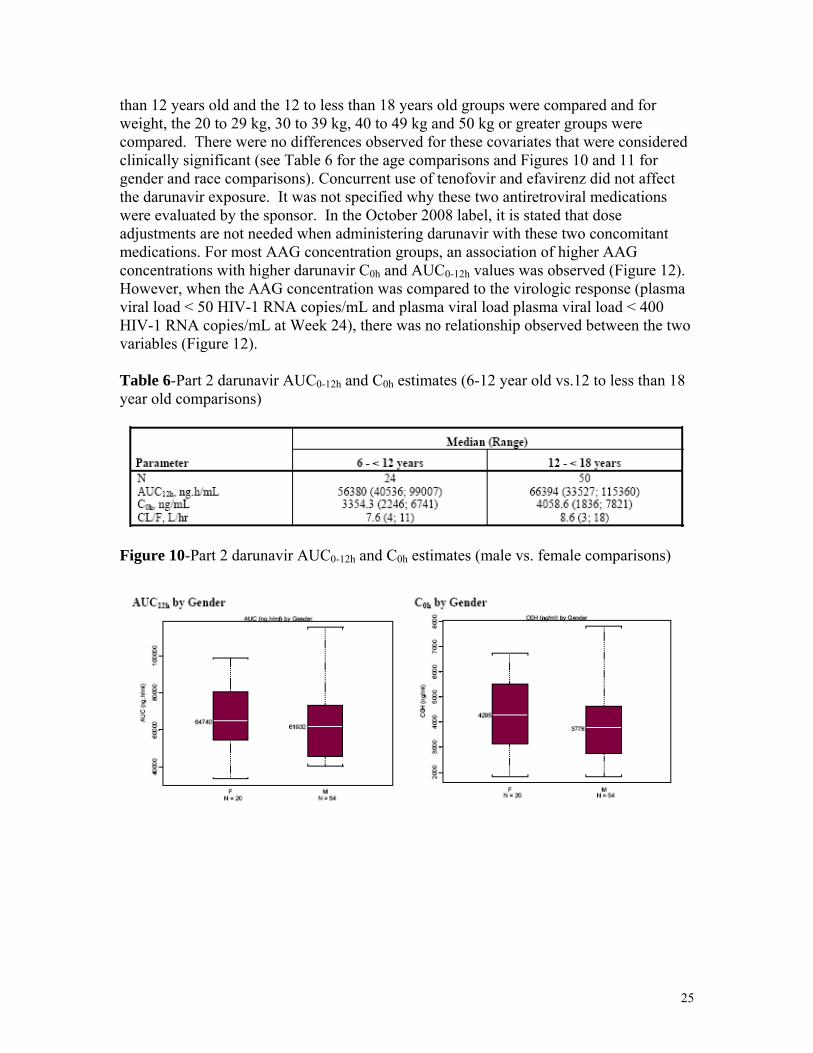
than 12 years old and the 12 to less than 18 years old groups were compared and for weight, the 20 to 29 kg, 30 to 39 kg, 40 to 49 kg and 50 kg or greater groups were compared. There were no differences observed for these covariates that were considered clinically significant (see Table 6 for the age comparisons and Figures 10 and 11 for gender and race comparisons). Concurrent use of tenofovir and efavirenz did not affect the darunavir exposure. It was not specified why these two antiretroviral medications were evaluated by the sponsor. In the October 2008 label, it is stated that dose adjustments are not needed when administering darunavir with these two concomitant medications. For most AAG concentration groups, an association of higher AAG concentrations with higher darunavir C0h and AUC0-12h values was observed (Figure 12). However, when the AAG concentration was compared to the virologic response (plasma viral load < 50 HIV-1 RNA copies/mL and plasma viral load plasma viral load < 400 HIV-1 RNA copies/mL at Week 24), there was no relationship observed between the two variables (Figure 12).
Table 6-Part 2 darunavir AUC0-12h and C0h estimates (6-12 year old vs.12 to less than 18 year old comparisons)
Figure 10-Part 2 darunavir AUC0-12h and C0h estimates (male vs. female comparisons)
25

Figure 11-Part 2 darunavir AUC0-12h and C0h estimates (race comparisons)
Figure 12-Part 2 darunavir AUC0-12h and C0h estimates versus AAG concentrations
26

Figure 13-AAG concentrations versus virologic response at Week 24
Exposure-response analysis
When the exposure-response data from study TMC114-C212 was analyzed, there was no relationship observed between darunavir exposure (C0h and AUC0-12h values) and virologic response at Week 24. Three measurements of virologic response were evaluated: a) plasma viral load < 50 HIV-1 RNA copies/mL, b) plasma viral load < 400 HIV-1 RNA copies/mL and c) plasma viral load decrease from baseline of ≥ 1.0 log10
(Figures 14, 15, and 16).
Figure 14-Darunavir AUC0-12h versus virologic response (plasma viral load decrease from baseline of ≥ 1.0 log10) at Week 24
27

Figure 15-Darunavir AUC0-12h versus virologic response (plasma viral load < 50 HIV-1 RNA copies/mL) at Week 24
Figure 16-Darunavir AUC0-12h versus virologic response (plasma viral load < 400 HIV-1 RNA copies/mL) at Week 24
Additionally, the inhibitory quotient (IQ) data, which is the ratio of C0h (exposure) at steady state and IC50 (a measurement of the ability of darunavir to inhibit HIV-1 virus), was derived. For each patient, the IQ provides a more robust comparison than exposure alone for the response to treatment by adjusting the exposure for the degree of HIV resistance to darunavir viral inhibition. The degree of viral resistance is an important component of darunavir response as indicated by the fact that the IC50 was determined to be the major contributor to the IQ calculation. Higher IC50 values are associated with more resistant HIV-1 viruses and higher IQs are associated with greater response rates.
In Figures 16 and 17, the adult data was divided into IQ quartiles and the pediatric data was divided into two quant iles of IQ given the relatively small number of pediatric subjects. Only subjects with complete viral load data up to 24 weeks and IQ data were included in the exposure-response analysis. The points on the plots represent the median IQ value within the quantile on the x-axis and the proportion of patients with 1 log
28
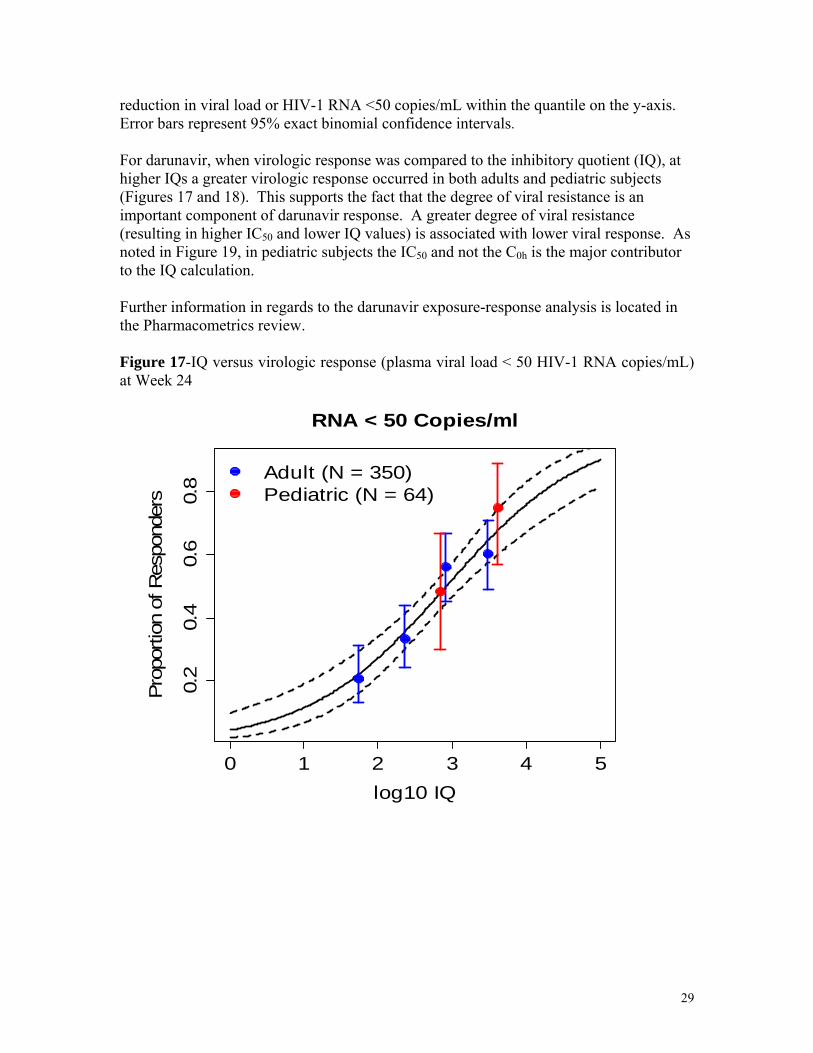
reduction in viral load or HIV-1 RNA <50 copies/mL within the quantile on the y-axis. Error bars represent 95% exact binomial confidence intervals.
For darunavir, when virologic response was compared to the inhibitory quotient (IQ), at higher IQs a greater virologic response occurred in both adults and pediatric subjects (Figures 17 and 18). This supports the fact that the degree of viral resistance is an important component of darunavir response. A greater degree of viral resistance (resulting in higher IC50 and lower IQ values) is associated with lower viral response. As noted in Figure 19, in pediatric subjects the IC50 and not the C0h is the major contributor to the IQ calculation.
Further information in regards to the darunavir exposure-response analysis is located in the Pharmacometrics review.
Figure 17-IQ versus virologic response (plasma viral load < 50 HIV-1 RNA copies/mL) at Week 24
RNA < 50 Copies/ml
0.2
0.4
0.6
0.8
ion
of R
espo
nder
s P
ropo
rt
Adult (N = 350) Pediatric (N = 64)
0 1 2 3 4 5
log10 IQ
29

Figure 18-Darunavir IQ versus virologic response (plasma viral load decrease from baseline of ≥ 1.0 log10) at Week 24
Log Reduction in Viral Load 0.
2 0.
4 0.
6 0.
8 1.
0
Prop
ortio
n of
p
A
Res
ond
ers
dult (N = 350) Pediatric (N = 64)
0 1 2 3 4 5
log10 IQ
Figure 19- Darunavir IC50 and C0h versus the IQ in pediatric subjects
2000
30
00
4000
50
00
6000
70
00
8000
C0H
(ng/
ml)
-7
-6
-5
-4
-3
-2
log1
0(IC
50)
IQC0H Quartile Q1: 348 (55 - 685) Q2: 1106 (686 - 1969) Q3: 3057 (2112 - 4170) Q4: 6548 (4447 - 16127)
IQC0H Quartile Q1: 348 (55 - 685) Q2: 1106 (686 - 1969) Q3: 3057 (2112 - 4170) Q4: 6548 (4447 - 16127)
Q1 Q2 Q3 Q4 Q1 Q2 Q3 Q4
Twenty-seven subjects were defined as virologic failures. In the plots below (Figure 20), virologic failures were defined as subjects who did not have Week 24 virologic data or subjects who were never suppressed or were rebounders at Week 24 using a virologic endpoint of HIV RNA <400 copies/mL. The majority of the Part 1 and 2 C0h and AUC0-12h values for virologic failure subjects were within the range of values for virologic responder subjects reported for the TMC114-C212 study. As indicated in the
30

box plots below, lower darunavir exposures (C0h) were not observed for virologic failures but there were higher IC50 values observed, with resulting lower IQs, indicating that viral resistance is the primary cause of the failures. When the analysis was conducted excluding the five subjects that had missing virologic data at Week 24, the same conclusions were reached.
Figure 20-Comparison of darunavir C0h, IC50, and IQ values for Week 24 virologic failure subjects versus virologic responder subjects using a virologic endpoint of HIV RNA <400 copies/mL (n=27 for the virologic failure subjects and n= 53 for the virologic responder subjects)
2000
30
00
4000
50
00
6000
70
00
8000
C0H -7
-6
-5
-4
-3
-2
log10(IC50)
4 5
8 9
log10(IQ)
6 7
Virologic Failures Virologic Responders Virologic Failures Virologic Responders Virologic Failures Virologic Responders
7.2 Efficacy Analysis
Based on the available Week 24 data, the efficacy of darunavir in combination with ritonavir is similar for treatment experienced pediatric subjects 6 to 17 years old when compared to the efficacy in treatment experienced adults. In pediatric subjects, based on data from 80 subjects, at Week 24, 73.8% experienced a ≥ 1 log10 decrease from baseline. 50% had an undetectable viral load (< 50 copies/mL) and 63.8% had a viral load < 400 copies/mL at Week 24 based on data from 80 subjects. In treatment experienced adults, based on data from 131 subjects, 69.5% of subjects had experienced a ≥ 1 log10 decreas e from baseline at Week 24 and 45% had an undetectable viral load (< 50 copies/mL) based on combined data from the TMC114-C202 and TMC114-C213 studies. Please see the clinical review for additional efficacy analysis information.
31

7.3 Safety Analysis
There were no observed trends in the reported adverse events that were of clinical significance. Most of the reported adverse events were grade 1 or 2. The most common adverse events reported by the sponsor at rates of 10% or higher during the study we re respiratory tract infections (16.3%), cough (16.3%), pyrexia (15%), vomiting (12.5%), diarrhea (11.3%), lymphadenopathy (11.3%), abdominal pain (10%), pneumonia (10.0%) and sinusitis (10%). Serious adverse events (SAEs) were reported in 9 subjects (11.3%) and were most commonly attributed to infections and infestations (6 subjects, 7.5%) and gastrointestinal adverse events (2 subjects, 2.5%).
In addition, exposure-safety analyses were conducted comparing: a) Grade 2 or higher hepatic abnormalities and b) skin rash versus darunavir exposure from Part 2 of the study. There was no relationship observed for these comparisons (see the Pharmacometrics review).
Please see the clinical review for additional safety analysis information.
8. Conclusions
The sponsor’s proposed weight based darunavir doses in combination with ritonavir for treatment experienced pediatric patients 6 to 17 years old are acceptable. The TMC114C212 study demonstrated that the darunavir exposure (C0h, AUC0-24h) observed with the sponsor’s proposed weight based dosing of darunavir in treatment experienced patients (≥ 20 to < 30 kg: 375 mg darunavir/50 mg ritonavir twice daily, ≥ 30 to < 40 kg: 450 mg darunavir/60 mg ritonavir twice daily, ≥ 40 kg: 600 mg darunavir/100 mg ritonavir twice daily) overlapped with the darunavir exposure (C0h, AUC0-24h) observed in treatment experienced adults administered 600 mg darunavir/100 mg ritonavir twice daily.
When the exposure-response data from study TMC114-C212 was analyzed, there was no relationship observed between darunavir exposure (C0h and AUC0-12h values) and the three measurements of virologic response: a) plasma viral load < 50 HIV-1 RNA copies/mL, b) plasma viral load < 400 HIV-1 RNA copies/mL and c) plasma viral load decrease from baseline of ≥ 1.0 log10.
However, for darunavir, when virologic response was compared to the inhibitory quotient (IQ) [the ratio of C0h and IC50], at higher IQs a greater virologic response was observed in both adults and pediatric subjects. The degree of viral resistance is an important component of darunavir response as indicated by the fact that the IC50 was determined to be the major contributor to the IQ calculation.
In virologic failure subjects there was not a trend toward lower darunavir expos ures (C0h) for virologic failures but there were higher IC50 values observed, with resulting lower IQs, indicating that viral resistance is the primary cause of the failures.
Based on the available Week 24 data, the efficacy of darunavir in combination with ritonavir is similar for treatment experienced pediatric subjects 6 to 17 years old when
32

compared to the efficacy in treatment experienced adults. 50% had an undetectable viral load (< 50 copies/mL) compared with 45% of adults at Week 24.
There were no observed trends in the reported adverse events that were of clinical significance. In addition, when comparing Grade 2 or higher hepatic abnormalities and skin rash versus darunavir exposure from Part 2 of the study there was no relationship observed.
33

4 Pharmacometrics Review
34
doylec
Appears This Way On Original

OFFICE OF CLINICAL PHARMACOLOGY: PHARMACOMETRIC REVIEW
1 SUMMARY OF FINDINGS
1.1 Key Review Questions The purpose of this review is to determine whether the proposed dosing regimen of darunavir/ritonavir in pediatric patients 6 to < 18 years of age (Table 1) is acceptable.
Table 1. Proposed Dose of Darunavir/Ritonavir for Pediatric Patients 6 to < 18 Years of Age
Body Weight Dose
(kg) (lbs)
> 20 kg - < 30 kg > 44 lbs - < 66 lbs 375 mg darunavir/50 mg ritonavir twice daily
≥ 30 kg - < 40 kg ≥ 66 lbs - < 88 lbs 450 mg darunavir/60 mg ritonavir twice daily
≥ 40 kg ≥ 88 lbs 600 mg darunavir/100 mg ritonavir twice daily
To address this central question, this review will focus on the following sub-questions.
1.1.1 Does the proposed darunavir/ritonavir dosing regimen in pediatric patients 6 to < 18 years of age achieve similar darunavir exposures to those in treatment-experienced adults receiving the approved dose of twice daily 600 mg darunavir/100 mg ritonavir?
The proposed darunavir/ritonavir dosing regimen (Table 1) in pediatric patients 6 to < 18 years of age achieves comparable exposures to those in treatment-experienced adult subjects receiving the approved dose. In the 20 pediatric patients who received the proposed dose and were included in the rich sampling noncompartmental pharmacokinetic analysis in Part I of Study TMC114-C212, mean values of darunavir AUC24, C0h and Cmax were 102%, 114% and 112%, respectively, of the corresponding mean adult parameters derived from population pharmacokinetic analysis of 119 HIV-infected treatment-experienced subjects receiving 600 mg darunavir/100 mg ritonavir b.i.d. in Study TMC114-C202 and Study TMC114-C213. The range of 24-hour area under the darunavir concentration curve (AUC24) and steady state trough concentration (C0h) values in pediatric patients were reasonably within the range observed in adults (Figure 1 and Figure 2).
Submission Number Page 1 of 16
NDA21976_PMReview 121808.doc

Figure 1. Darunavir AUC24 (ng h/ml) in (from left): adults (TMC114-C202 and TMC114-C213), pediatric patients receiving the proposed dose (Part I TMC114-C212), pediatric patients receiving the proposed dose divided into three weight
groups (Part I TMC114-C212) 50
000
1000
00
1500
00
2000
00
2500
00
3000
00
AUC
24 (n
g h/
ml)
N = 119 N = 19 N = 7 N = 5 N = 7
Adult Pediatric Pediatric 20 - 29 kg Pediatric 30 - 39 kg Pediatric > 40 kg
Figure 2. Part I Darunavir C0h (ng/ml) in (from left): adults (TMC114-C202 and TMC114-C213), pediatric patients receiving the proposed dose (Part I TMC114-C212), pediatric patients receiving the proposed dose divided into three weight
groups (Part I TMC114-C212)
0 20
00
4000
60
00
8000
10
000
C0H
(ng/
ml)
N = 119 N = 20 N = 7 N = 6 N = 7
Adult Pediatric Pediatric 20 - 29 kg Pediatric 30 - 39 kg Pediatric > 40 kg
Individual estimates of darunavir pharmacokinetic parameters derived from sparse sampling from 74 subjects in Part II of Study TMC114-C212 provide supporting evidence that the proposed dosing regimen in pediatric patients achieves similar Submission Number Page 2 of 16
NDA21976_PMReview 121808.doc
N = 119 N = 18 N = 19 N = 25 N = 12
2000
00
1000
00
1500
00
AUC
24 (n
g h/
ml)
Adult Pediatric 20 - 29 kg Pediatric 30 - 39 kg Pediatric 40 - 49 kg Pediatric > 50 kg
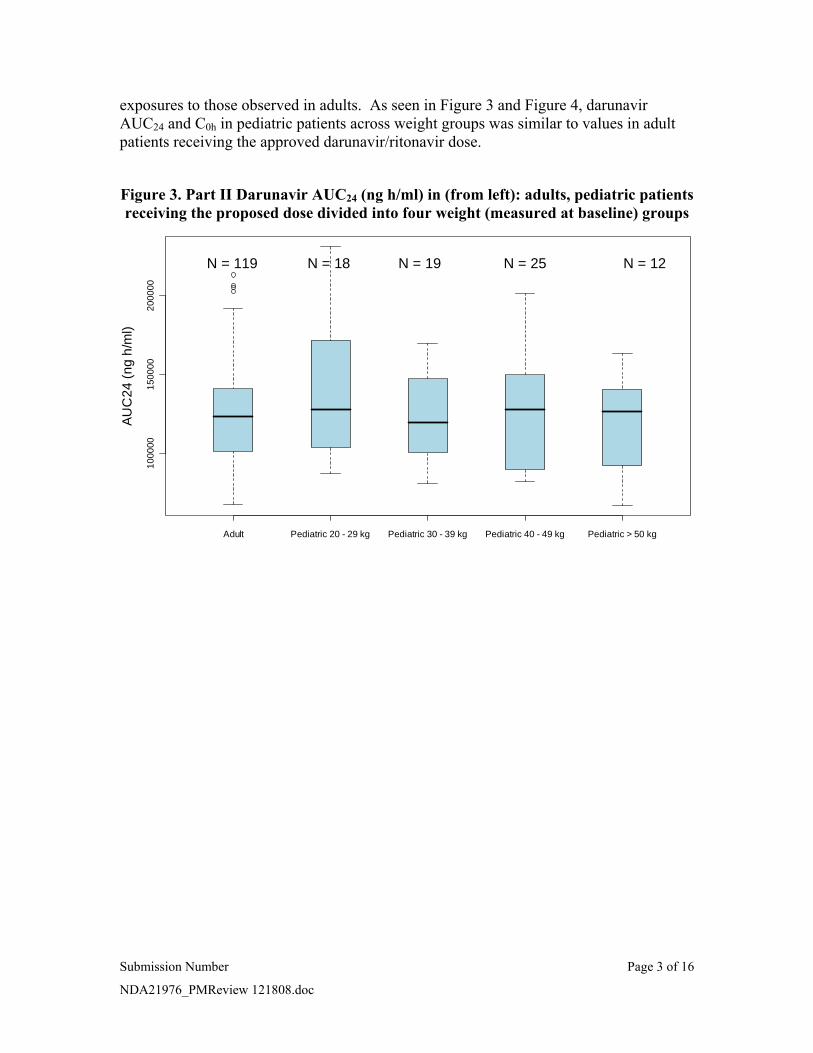
exposures to those observed in adults. As seen in Figure 3 and Figure 4, darunavir AUC24 and C0h in pediatric patients across weight groups was similar to values in adult patients receiving the approved darunavir/ritonavir dose.
Figure 3. Part II Darunavir AUC24 (ng h/ml) in (from left): adults, pediatric patients receiving the proposed dose divided into four weight (measured at baseline) groups
Submission Number Page 3 of 16
NDA21976_PMReview 121808.doc
doylec
Appears This Way On Original
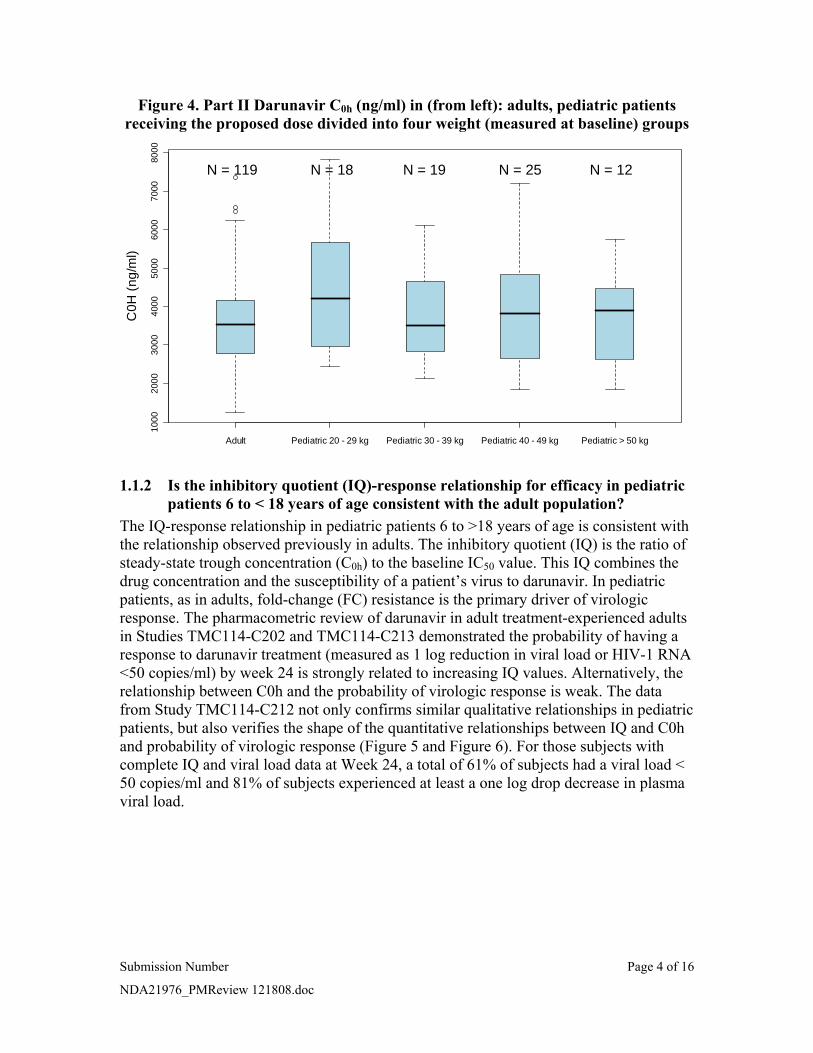
Figure 4. Part II Darunavir C0h (ng/ml) in (from left): adults, pediatric patients receiving the proposed dose divided into four weight (measured at baseline) groups
1000
20
00
3000
40
00
5000
60
00
7000
80
00
C0H
(ng/
ml)
N = 119 N = 18 N = 19 N = 25 N = 12
Adult Pediatric 20 - 29 kg Pediatric 30 - 39 kg Pediatric 40 - 49 kg Pediatric > 50 kg
1.1.2 Is the inhibitory quotient (IQ)-response relationship for efficacy in pediatric patients 6 to < 18 years of age consistent with the adult population?
The IQ-response relationship in pediatric patients 6 to >18 years of age is consistent with the relationship observed previously in adults. The inhibitory quotient (IQ) is the ratio of steady-state trough concentration (C0h) to the baseline IC50 value. This IQ combines the drug concentration and the susceptibility of a patient’s virus to darunavir. In pediatric patients, as in adults, fold-change (FC) resistance is the primary driver of virologic response. The pharmacometric review of darunavir in adult treatment-experienced adults in Studies TMC114-C202 and TMC114-C213 demonstrated the probability of having a response to darunavir treatment (measured as 1 log reduction in viral load or HIV-1 RNA <50 copies/ml) by week 24 is strongly related to increasing IQ values. Alternatively, the relationship between C0h and the probability of virologic response is weak. The data from Study TMC114-C212 not only confirms similar qualitative relationships in pediatric patients, but also verifies the shape of the quantitative relationships between IQ and C0h and probability of virologic response (Figure 5 and Figure 6). For those subjects with complete IQ and viral load data at Week 24, a total of 61% of subjects had a viral load < 50 copies/ml and 81% of subjects experienced at least a one log drop decrease in plasma viral load.
Submission Number Page 4 of 16
NDA21976_PMReview 121808.doc

0.2
0.4
0.6
0.8
Pro
porti
on o
f Res
pond
ers
Adult (N = 350) Pediatric (N = 64)
Pro
porti
on o
f Res
pond
ers
0 1 2 3 4 5
0.0
0.2
0.4
0.6
0.8
1.0
Adult (N = 358) Pediatric (N = 71)
0 2000 4000 6000 8000 C0H ng/mL
log10 IQ
Figure 5. Exposure-Response for IQ (left) and C0h (right) and Probability of 1 Log Reduction in Viral Load at Week 24 in Adult and Pediatric Populations. The solid
line represents the logistic regression model fit for the adult relationship. The dotted lines represent the 95% confidence interval.
Log Reduction in Viral Load Log Reduction in Viral Load
0.2
0.4
0.6
0.8
1.0
Prop
ortio
n of
Res
pond
ers
Adult (N = 350) Pediatric (N = 64)
0.0
0.2
0.4
0.6
0
8 1.
0
Pro
porti
on o
f Res
pond
ers
Adult (N = 358) Pediatric (N = 71)
0 2000 4000 6000 8000 0 1 2 3 4 5
log10 IQ C0H ng/mL
Figure 6. Exposure-Response for IQ (left) and C0h (right) and Probability of < 50 copies/ml RNA at Week 24 in Adult and Pediatric Populations. The solid line
represents the logistic regression model fit for the adult relationship. The dotted lines represent the 95% confidence interval.
RNA < 50 Copies/ml RNA < 50 Copies/ml
Submission Number Page 5 of 16
NDA21976_PMReview 121808.doc

IQ Quartiles
Median (Range)
Q1: 348 (55 – 685)
Q2: 1106 (686 – 1969)
Q3: 3057 (2112 – 4170)
Q4: 6548 (4447 – 16127)
log1
0(FC
) -1
01
23
4
Q1 Q2 Q3 Q4
Figure 7 provides further evidence of the greater importance of IC50 relative to C0h in driving the relationship between IQ and virologic response in pediatric patients. Subjects within each IQ quartile have comparable exposure to darunavir, but very different IC50 values at baseline. Fold change measures the increase in IC50 relative to a standard wild type virus and is significantly larger in subjects with low IQ values and therefore a lower probability of virologic response.
Figure 7. Boxplots of Part II trough concentrations, IC50 and fold change by IQ quartile in pediatric patients from TMC114-C212.
2000
40
00
6000
80
00
C0H
(ng/
ml)
-7
-6
-5
-4
-3
-2
log1
0(IC
50)
Q1 Q2 Q3 Q4Q1 Q2 Q3 Q4
The influence of C0h and IC50 on the occurrence of virologic failure is shown in Figure 8. There were 27 patients with virologic failure, defined here as subjects who did not achieve or sustain HIV RNA < 400 copies/ml, discontinued prematurely or missed their week 24 visit. As expected, patients with virologic failure tended to have lower IQ values. This was the case in spite of having a higher median darunavir trough concentration than patients experiencing virologic success. The lower IQ values in patients experiencing virologic failure are therefore driven by their relatively higher values of baseline IC50.
Submission Number Page 6 of 16
NDA21976_PMReview 121808.doc

Figure 8. Differences in Darunavir Trough Concentration (C0h), IC50 and IQ between Patients Categorized as Virologic Failures and Virologic Responders at
Week 24 20
00
3000
40
00
5000
60
00
7000
80
00 C0H
-7
-6
-5
-4
-3
-2
log10(IC50)
4 5
6 7
8 9
log10(IQ)
Virologic Failures Virologic Responders Virologic Failures Virologic Responders Virologic Failures Virologic Responders
1.1.3 Do pediatric patients 6 to < 18 years of age with low baseline alpha-1 acid glycoprotein (AAG) and therefore lower exposure of darunavir exhibit an inferior virologic response?
Pediatric patients 6 to <18 years of age with low baseline AAG and therefore lower exposure of darunavir do not exhibit an inferior virologic response requiring dose modification. Population pharmacokinetic modeling established the existence of an inverse relationship between baseline AAG and darunavir clearance (Figure 14) so that patients with low baseline AAG have relatively lower darunavir exposure. As seen in Figure 9, there was no clear relationship between baseline AAG concentration and likelihood of virologic response (< 50 copies/ml RNA) at Week 24. There was a slight trend, however, of larger changes in viral load from baseline for patients with higher baseline AAG values (Figure 10). Given the relatively weak relationship between darunavir exposure and probability of virologic response, the relatively larger variability in IC50 compared to darunavir plasma concentrations and the less than proportional increase in darunavir exposure with increasing dose found in adults, minimal benefit would be derived from increasing the darunavir dose to compensate for a perceived trend towards smaller changes in viral load in pediatric patients with low baseline AAG.
Submission Number Page 7 of 16
NDA21976_PMReview 121808.doc
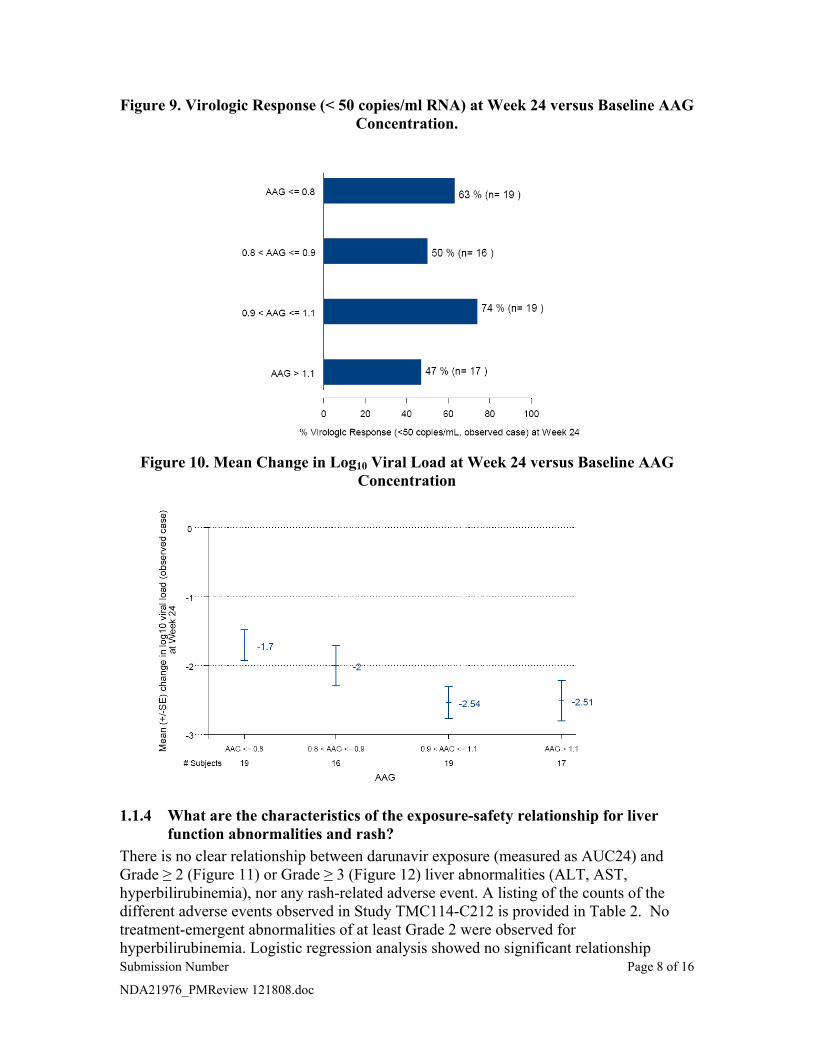
Figure 9. Virologic Response (< 50 copies/ml RNA) at Week 24 versus Baseline AAG Concentration.
Figure 10. Mean Change in Log10 Viral Load at Week 24 versus Baseline AAG Concentration
1.1.4 What are the characteristics of the exposure-safety relationship for liver function abnormalities and rash?
There is no clear relationship between darunavir exposure (measured as AUC24) and Grade ≥ 2 (Figure 11) or Grade ≥ 3 (Figure 12) liver abnormalities (ALT, AST, hyperbilirubinemia), nor any rash-related adverse event. A listing of the counts of the different adverse events observed in Study TMC114-C212 is provided in Table 2. No treatment-emergent abnormalities of at least Grade 2 were observed for hyperbilirubinemia. Logistic regression analysis showed no significant relationship Submission Number Page 8 of 16
NDA21976_PMReview 121808.doc

between measures of darunavir exposure (log10C0h and log10 AUC24) and occurrence of Grade ≥ 2 or Grade ≥ 3 ALT/AST abnormalities.
Table 2. Subjects with Adverse Events in TMC114-C212
Type of Event Number of Subjects Total Number of Events Experiencing Event
Rash 7 7
Grade 2 ALT 4 7
Grade 3 ALT 2 4
Grade 4 ALT 1 1
Grade 2 AST 3 6
Grade 3 AST 1 1
Grade 2 ALP 3 10
Grade 3 ALP 2 8
Figure 11. Subjects with Grade ≥ 2 ALT (left) or AST (right) Abnormalities by Darunavir AUC24 Quartile
Submission Number Page 9 of 16
NDA21976_PMReview 121808.doc
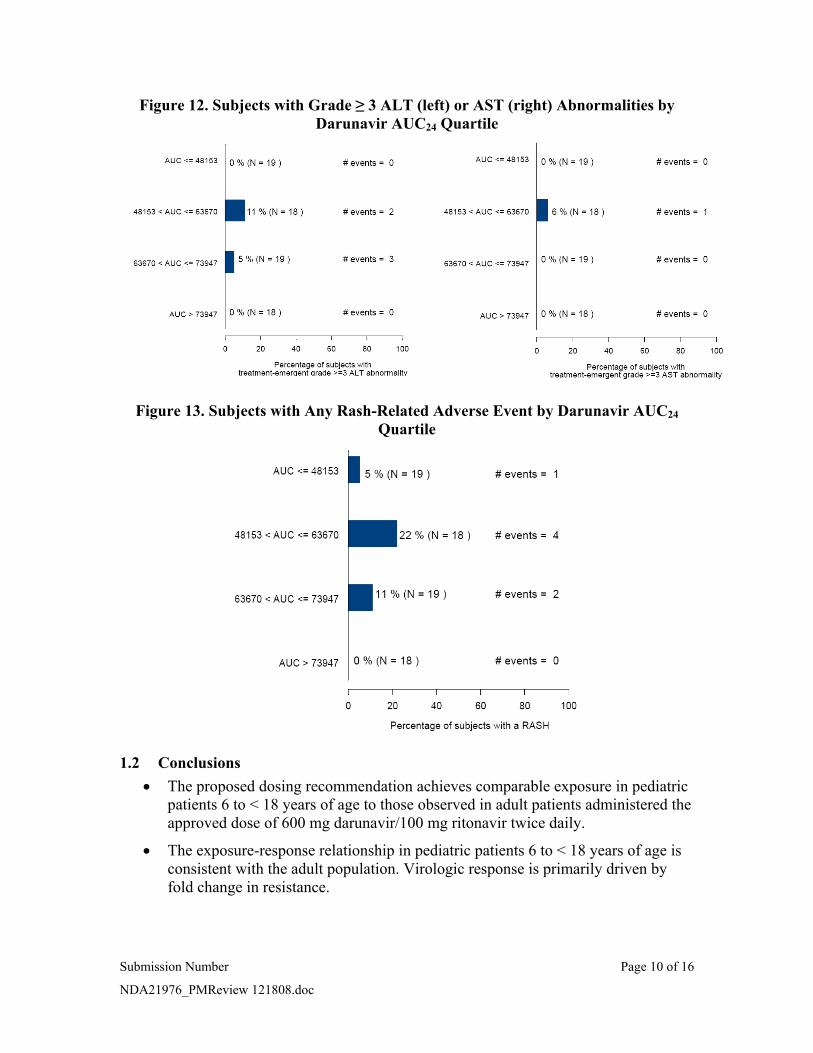
Figure 12. Subjects with Grade ≥ 3 ALT (left) or AST (right) Abnormalities by Darunavir AUC24 Quartile
Figure 13. Subjects with Any Rash-Related Adverse Event by Darunavir AUC24
Quartile
1.2 Conclusions • The proposed dosing recommendation achieves comparable exposure in pediatric
patients 6 to < 18 years of age to those observed in adult patients administered the approved dose of 600 mg darunavir/100 mg ritonavir twice daily.
• The exposure-response relationship in pediatric patients 6 to < 18 years of age is consistent with the adult population. Virologic response is primarily driven by fold change in resistance.
Submission Number Page 10 of 16
NDA21976_PMReview 121808.doc

• There is no exposure-safety relationship for liver function abnormalities or rash at the exposures observed in Study TMC114-C212 in pediatric patients 6 to < 18 years of age.
1.3 Recommendations The proposed dosing recommendation of darunavir/ritonavir in pediatric patients 6 to < 18 years of age (Table 1) is acceptable.
2 RESULTS OF SPONSOR’S ANALYSIS The sponsor conducted a population pharmacokinetic analysis to adjust a previously developed model developed in adult treatment-experienced patients to incorporate pediatric patients aged 6 to <18 years from Part I of Study TMC114-C212. The resulting model was then used to predict individual pharmacokinetic parameters at Week 24 in Part II of Study TMC114-C212 which were subsequently used for description of the population and exposure-response relationships.
The dataset used for the initial model adjustment consisted of 437 plasma darunavir concentrations from 71 subjects in Studies TMC125-C206 and TMC125-C216 in adults and Part I of Study TMC114-C212 in pediatric patients (Table 3). The data from the two studies in adult subjects was chosen to provide a similar richness of pharmacokinetic sampling and a balance between the number of adults and children included in the analysis.
Table 3. Summary of Data Included in Model Adjustment
For details and a review of model development in adult treatment-experienced subjects, please refer to the pharmacometric review of NDA 21-976 by Christine Garnett. Briefly, the original model was a two compartment model with first-order absorption and apparent clearance dependent on AAG concentrations assuming a linear binding and total daily dose. With the addition of pediatric data, there was a confounding relationship between total daily dose and body weight since pediatric patients were dosed according to body weight. Subsequent model development showed no added benefit in adding the influence of total daily dose when body weight was accounted for. In the final model, clearance was described as: Submission Number Page 11 of 16
NDA21976_PMReview 121808.doc
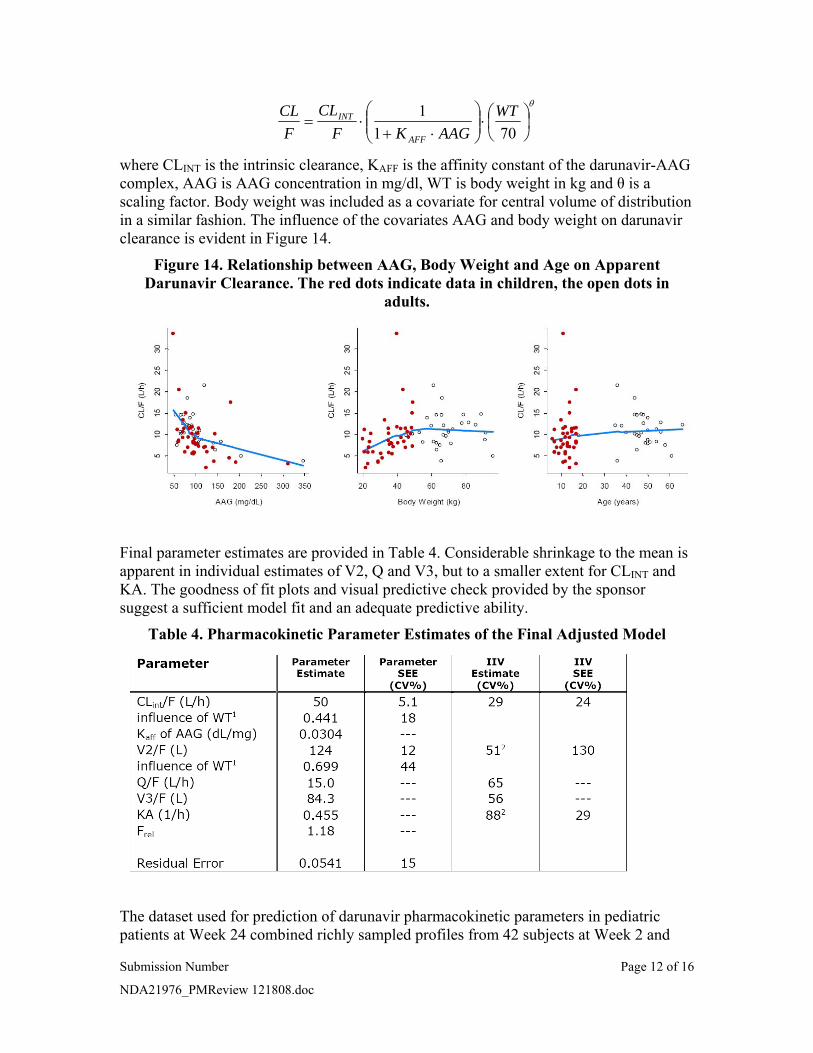
CL CLINT ⎛ 1 ⎞ WT ⎞θ
= ⋅ ⎜⎜ ⎟⎟ ⋅ ⎜⎛
⎟F F 1+ K ⋅ AAG ⎝ 70 ⎠⎝ AFF ⎠
where CLINT is the intrinsic clearance, KAFF is the affinity constant of the darunavir-AAG complex, AAG is AAG concentration in mg/dl, WT is body weight in kg and θ is a scaling factor. Body weight was included as a covariate for central volume of distribution in a similar fashion. The influence of the covariates AAG and body weight on darunavir clearance is evident in Figure 14.
Figure 14. Relationship between AAG, Body Weight and Age on Apparent Darunavir Clearance. The red dots indicate data in children, the open dots in
adults.
Final parameter estimates are provided in Table 4. Considerable shrinkage to the mean is apparent in individual estimates of V2, Q and V3, but to a smaller extent for CLINT and KA. The goodness of fit plots and visual predictive check provided by the sponsor suggest a sufficient model fit and an adequate predictive ability.
Table 4. Pharmacokinetic Parameter Estimates of the Final Adjusted Model
The dataset used for prediction of darunavir pharmacokinetic parameters in pediatric patients at Week 24 combined richly sampled profiles from 42 subjects at Week 2 and
Submission Number Page 12 of 16
NDA21976_PMReview 121808.doc

sparse data from 75 subjects. It consisted of a total of 541 plasma darunavir measurements from 78 subjects in Study TMC114-C212. During the review, the sponsor noted a small error in the dataset resulting in a deviation between the actual dosing time and the dosing time recorded in the NONMEM dataset for some subjects. The median deviation was 15 minutes and deemed too small to significantly alter the conclusions of the pharmacokinetic modeling analysis. To obtain individual pharmacokinetic parameters, empirical Bayes estimation was performed using NONMEM V with the MAXEVAL=0 option in the $ESTIMATION record. Simulation records were added to the NONMEM dataset to obtain prediction of C0h at each visit. The area under the model-predicted darunavir concentration curve (AUCtau) was calculated as Dose/(CL/F). Individual medians of C0h and AUCtau were used for the Week 24 summary. As in the model adjustment stage, considerable shrinkage to the mean was observed for individual estimates of V2, Q and V3. Goodness of fit plots were otherwise adequate and the distributions of random effects exhibited median values close to zero, suggesting negligible bias.
3 REVIEWER’S ANALYSIS
3.1 Introduction Since exposure- and safety-response analysis is based on empirical Bayes estimates of population pharmacokinetic parameters, a few simple checks of model performance were performed. In addition, the exposure-virologic response for adults was reanalyzed and compared to the exposure-virologic response in pediatric patients.
3.2 Objectives Analysis objectives are:
1. Compare estimates of C0h and AUC24 in Part I of Study TMC114-C212 obtained from model prediction to those reported from noncompartmental analysis.
2. Explore the exposure-response relationship between IQ and C0h and probability of virologic response in adults and pediatric patients.
3.3 Methods
3.3.1 Data Sets Data sets used are summarized in Table 5.
Table 5. Analysis Data Sets Study Number Name Link to EDR
TMC114-C202 and TMC114-C213
xpk.xpt \\Cdsesub1\evsprod\NDA021976\0006\m5\53-clin-stud-rep\534-rep-human-pd-stud\5342-patient-pd-stud-rep\tmc114-c926\datasets\analysis
TMC114-C212 expsaf.xpt \\Cdsesub1\evsprod\NDA021976\0069\m5\53-clin-stud-rep\535-rep-effic-safety-stud\treatment-of-hiv-1-infection\5352-stud-rep-uncontr\tmc114-c212\datasets\analysis
Submission Number Page 13 of 16
NDA21976_PMReview 121808.doc

TMC114-C212 (Week 2 NONMEM data)
c212week2ad.dat \\Cdsesub1\evsprod\NDA021976\0063\m5\53-clin-stud-rep\533-rep-human-pk-stud\5335-popul-pk-stud-rep\tmc114-c940\datasets\pharmacokinetics
TMC114-C212 (Week 24 NONMEM data)
c212fb.dat \\Cdsesub1\evsprod\NDA021976\0063\m5\53-clin-stud-rep\533-rep-human-pk-stud\5335-popul-pk-stud-rep\tmc114-c940\datasets\pharmacokinetics
3.3.2 Software NONMEM Version VI was used to obtain empirical Bayes estimates of pharmacokinetic parameters. R was used for logistic regression, data manipulation and plots.
3.3.3 Models
3.3.3.1 PK Model The sponsor’s final adjusted model after inclusion of pediatric data was used to predict AUC24 and C0h in the 41 subjects with rich pharmacokinetic sampling in Study TMC114-C212.
3.3.3.2 Exposure response model Logistic regression with either IQ or C0h as the independent variable and virologic response (1 log reduction in viral load or HIV-1 RNA <50 copies/ml) as the dependent variable was used to describe the exposure-response relationship in adult patients. Data from pediatric patients were overlaid on plots of the resulting logistic regression relationship in the adults to compare the nature of the exposure-response relationships in the two populations. Adult data was used for model building because there was a larger sample size in this population, as well as a broader range of IQ and C0h values. For plotting purposes, the adult data was divided into quartiles of IQ or C0h. Pediatric data was divided into two quantiles of IQ or C0h given the relatively small number of pediatric patients. Only patients with viral load and IQ or C0h data at Week 24 were included in the exposure-response analysis. The points on the plots represent the median IQ or C0h value within the given quantile on the x-axis and the proportion of patients with 1 log reduction in viral load or HIV-1 RNA <50 copies/ml within the quantile on the y-axis. Error bars represent 95% exact binomial confidence intervals.
3.4 Results
3.4.1 PK model AUC24 predicted from the sponsor’s pharmacokinetic model strongly agreed with AUC24 calculated from noncompartmental analysis (Figure 15) with a correlation coefficient of 0.99. Agreement was less strong for C0h between the two methods with a correlation coefficient of 0.89. The mean C0h predicted from the sponsor’s model, 3348 ng/ml was lower than from noncompartmental calculation, 3617 ng/ml. This difference may be due to the considerable shrinkage to the mean observed in model parameter V2 as noted in Section 3. The small uncertainty in the prediction of C0h may have implications for the Submission Number Page 14 of 16
NDA21976_PMReview 121808.doc
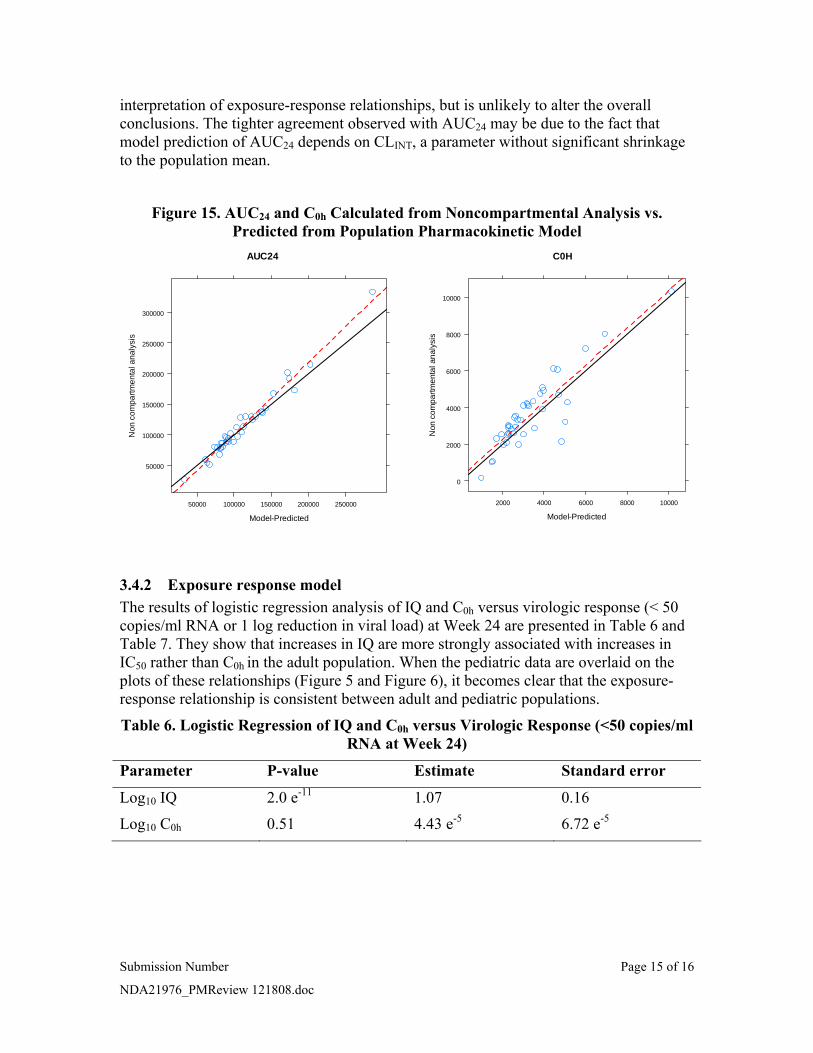
Figure 15. AUC24 and C0h Calculated from Noncompartmental Analysis vs. Predicted from Population Pharmacokinetic Model
AUC24 C0H
10000
300000
Non
com
partm
enta
l ana
lysi
s
2000 4000 6000 8000 10000
Non
com
partm
enta
l ana
lysi
s 8000 250000
200000
150000
6000
4000
100000
50000
50000 100000 150000 200000 250000
0
2000
interpretation of exposure-response relationships, but is unlikely to alter the overall conclusions. The tighter agreement observed with AUC24 may be due to the fact that model prediction of AUC24 depends on CLINT, a parameter without significant shrinkage to the population mean.
Model-Predicted Model-Predicted
3.4.2 Exposure response model The results of logistic regression analysis of IQ and C0h versus virologic response (< 50 copies/ml RNA or 1 log reduction in viral load) at Week 24 are presented in Table 6 and Table 7. They show that increases in IQ are more strongly associated with increases in IC50 rather than C0h in the adult population. When the pediatric data are overlaid on the plots of these relationships (Figure 5 and Figure 6), it becomes clear that the exposure-response relationship is consistent between adult and pediatric populations.
Table 6. Logistic Regression of IQ and C0h versus Virologic Response (<50 copies/ml RNA at Week 24)
Parameter P-value Estimate Standard error
Log10 IQ 2.0 e-11 1.07 0.16
Log10 C0h 0.51 4.43 e-5 6.72 e-5
Submission Number Page 15 of 16
NDA21976_PMReview 121808.doc

Table 7. Logistic Regression of IQ and C0h versus Virologic Response (Log Reduction in Viral Load at Week 24)
Parameter P-value Estimate Standard error
Log10 IQ 1.3 e-14 1.41 0.18
Log10 C0h 0.23 9.02 e-5 7.50 e-5
4 LISTING OF ANALYSES CODES AND OUTPUT FILES File Name Description Location in
\\cdsnas\pharmacometrics\
eff_analysis.R IQ – 1 log reduction in viral load exposure-response analysis
Darunavir
eff_analysis_log_C0H.R C0h – 1 log reduction in viral load exposure-response analysis
Darunavir
eff_analysis_RNA_50.R IQ – < 50 copies/ml RNA exposure-response analysis
Darunavir
eff_analysis_RNA_C0H_50.R C0h– < 50 copies/ml RNA exposure-response analysis
Darunavir
week2.mod Sponsor’s final model (NONMEM control file)
Darunavir\NM
week2.lst Sponsor’s final model (NONMEM output file)
Darunavir\NM
week24.mod Sponsor’s model for Bayesian estimation of Week 24 PK parameters (NONMEM control file)
Darunavir\NM
week24.lst Sponsor’s model for Bayesian estimation of Week 24 PK parameters (NONMEM output file)
Darunavir\NM
Submission Number Page 16 of 16
NDA21976_PMReview 121808.doc

---------------------------------------------------------------------------------------------------------------------
---------------------------------------------------------------------------------------------------------------------
---------------------
This is a representation of an electronic record that was signed electronically and this page is the manifestation of the electronic signature.
/s/
Stanley Au 12/18/2008 11:58:46 AM PHARMACOLOGIST
Kevin Krudys 12/18/2008 12:01:15 PM BIOPHARMACEUTICS
Pravin Jadhav 12/18/2008 03:04:43 PM BIOPHARMACEUTICS
Kellie Reynolds 12/18/2008 03:06:38 PM BIOPHARMACEUTICS


