OFFICE MARKET - esop.ro · PROJECT ING Bank 19.000 Expo Business Park Amazon 13.555 Globalworth...
9
ESOP Consulting l CORFAC International, Phone: +4021.528.04.40, [email protected] Locally Owned . Globally Connected. OFFICE MARKET In the beginning of 2018
Transcript of OFFICE MARKET - esop.ro · PROJECT ING Bank 19.000 Expo Business Park Amazon 13.555 Globalworth...

ESOP Consulting l CORFAC International, Phone: +4021.528.04.40, [email protected]
Locally Owned . Globally Connected.
OFFICE MARKET
In the beginning of 2018

ESOP Consulting l CORFAC International, Phone: +4021.528.04.40, [email protected]
Business Centers - Main Projects Delivered in 2017
PROJECT NAME SURFACE
(SQM) AREA LOCATION
The Bridge - Phase I 36.871 CENTRAL-WEST Grozavesti Globalworth Campus - Cladirea A 28.600 CENTRAL-NORTH Pompei
Timpuri Noi Square II 20.100 CENTRAL-SOUTH Timpuri Noi Sema Parc - Cladirea Berlin 15.701 CENTRAL-WEST
Splaiul Independentei
Timpuri Noi Square I 14.280 CENTRAL-SOUTH Timpuri Noi Sema Parc - Cladirea Paris 10.758 CENTRAL-WEST
Splaiul Independentei
Park Avenue 6.800 CENTRAL-NORTH Aviatorilor
BOOKASE 2.993 ULTRACENTRAL Dorobanti
THE OFFER At the beginning of 2018, the office stock available for rent
in Bucharest is 682.000 sqm, 84% of which located in
business centers (A, B and C class) and 16% in villas or
similar buildings.
Notes: In this volume of spaces available for rent are included only the
buildings delivered/ completed by the end of 2017.
The data is extracted from the ESOP database, probably the most extensive
offices portfolio of a real estate company in Bucharest.
BUSINESS CENTERS The total office stock in Bucharest amounts to over 3,28
million square meters at the beginning of 2018, out of which
over 2,85 million square meters in A and B class buildings.
THE AVAILABLE STOCK IN THE EXISTING BUILDINGS
Out of the stock of available space for rent, approx. 41% are
in A / A- Class business centers (of which only 7% are prime
locations, the rest in central and semi-central locations),
37% are B Class, respectively 22% C Class buildings.
The largest office stock available in completed buildings is
located in the Central-North area (Aviatorilor - Caramfil -
Barbu-Vacarescu perimeter), namely 155.000 sqm,
representing 27% of the available space stock), followed by
the North area (Baneasa, Pipera) with 107.200 sqm,
respectively the Central-West area, with 73.100 sqm
available.
DELIVERIES IN 2017 IN BUCHAREST
During 2017 was delivered a total volume of approx.
144.000 sqm office spaces, of which 45% in the Central-
West area, unlike the previous years when the Central-
Nordth area had the largest share. In 2017, the Central-
North area recorded 26%, followed by South-Central area
with 24%.
0
20.000
40.000
60.000
80.000
100.000
120.000
140.000
160.000
180.000
Ultracentral Central-North Central-West Central-South North Other Areas
Business Centers - Available spaces, by CLASS and AREA
"A / A-" Class "B" Class "C" Class

ESOP Consulting l CORFAC International, Phone: +4021.528.04.40, [email protected]
More than 77% the projects delivered in 2017 were rented
by the end of the year.
It should be noted that the volume of deliveries announced
at the beginning of 2017 was approx. 246.000 sqm. From
this estimate, 102.000 sqm offices were delayed for the first
half of 2018 (of which 80% in 3 major projects), thus
registering a double percentage of postponed projects,
compared to the annual average rate (ranging between 15
to 20%).
DELIVERIES ESTIMATED FOR 2018-2019 IN
BUCHAREST
For 2018, more than 243.000 sqm of office space is expected
to be completed in business centres, while a total volume of
270.000 sqm is announced for 2019.
However, as in previous years, some of these spaces may
register certain delays in completion.
Approx. 38% of the offices to be delivered in 2018 are
already pre-leased, along with 9% of those scheduled for
2019.
In 2018 most new projects will be delivered also in the
Central-West area, with 137.421 sqm (56%), followed by the
Ultracentral area, with 63.253 sqm (26%) and the Central-
North - 41.411 sqm (17%).
In 2019 the Central-North area will dominate the volume of
deliveries, with approx. 75% of the spaces announced to be
delivered (namely 203.126 sqm), given the delivery of the
first projects in the Exhibition - Presei Libere Square area,
amounting approx. 80.000 sqm.
SPACES IN VILLAS
The stock of office spaces available in villas in the ESOP
portfolio at the beginning of 2018 is of approx. 112.000 sqm.
More than 33% of these spaces are located in buildings in
the North-Central area, and approx. 23% of them in the
Ultracentral area.
In the past 3 years, the demand for space in villas has declined progressively, with companies – often even the start-ups - preferring the business centers.
41
5.0
00
27
5.0
00
13
0.0
00
10
7.0
00
12
5.0
00
13
9.1
90
85
.00
0
28
2.0
00
14
4.0
00 24
3.0
00
27
0.0
00
2 0 0 9 2 0 1 0 2 0 1 1 2 0 1 2 2 0 1 3 2 0 1 4 2 0 1 5 2 0 1 6 2 0 1 7 2 0 1 8 2 0 1 9
B U S I N ES S C EN T ER S - A N N U A L D EL I V ER I ES 2 0 0 9 - 2 0 1 9
203.12675%
43.14616%
20.0007%
4.2002%
BUSINESS CENTERS - DELIVERIES FOR 2019, by AREAS (sqm)
CENTRAL-NORTH
CENTRAL-WEST
CENTRAL-SOUTH
ULTRACENTRAL

ESOP Consulting l CORFAC International, Phone: +4021.528.04.40, [email protected]
THE
DEMAND In Bucharest, the office volume traded in 2017 was at a level
of approx. 308.000 sqm, slightly higher compared to the 2016
transactions, and by 6,6% higher than the the last 3 years
average level.
Notes: The information within this chapter is based on the data collected within
The Research FORUM of the main commercial real estate companies in
Romania, of which ESOP is part.
Of the total transactions, the Renewal/Renegotiations
represented only approx. 26% (79.000 sqm), while 74%,
namely 229.000 sqm were represented by the (Pre) Lease and
Expansion transactions.
By category, Lease transactions recorded a significant increase
(+ 21%) in 2017, while all other segments (Pre-Lease,
Expansion, Renewals/ Renegotiations) recorded slight
decreases ranging between 9 and 14%.
(PRE) LEASES AND EXPANSIONS, BY AREA Nearly 60% of total Pre-Lease and Expansion transactions
were made in the Central-North area, amounting 135.000
sqm. The second place is taken by in the Central-West area,
with over 49.000 sqm, representing about 22%, the area being
in full ascension in the context of important deliveries of new
projects in 2017 and in the near future.
The lowest activity level (0,55%) was registered in the Central-
Eastern area, which is a significantly less developed perimeter
on the office market.
181.700
233.200
189.000213.350
228.619
112.200
72.800 71.00086.800 79.139
0
50.000
100.000
150.000
200.000
250.000
300.000
350.000
2013 2014 2015 2016 2017
Transactions between 2013-2017
(Pre) Leases and Expansions Renewals/ Rennegotiations
Total Tranzactions
137.700 130.800124.000
119.350
144.900
24.400
73.300
49.500
64.00058.000
19.600
29.100
15.500
30.000 25.700
112.200
72.80071.000
86.80079.100
2013 2014 2015 2016 2017
Leases Pre-leases Expansiuni Renewals/ Rennegotiations
YEAR 2011 2012 2013 2014 2015 2016 2017 Variation 2017 vs 2016Leases 159.000 90.500 137.700 130.800 124.000 119.350 144.900 21%
Pre-leases 38.800 59.300 24.400 73.300 49.500 64.000 58.000 -9%
Expansions 13.700 18.600 19.600 29.100 15.500 30.000 25.700 -14%
(Pre) Leases and Expansions 211.500 168.400 181.700 233.200 189.000 213.350 228.600 7%
Renewals/ Rennegotiations 51.900 70.500 112.200 72.800 71.000 86.800 79.100 -9%
Total Transactions 263.400 238.900 293.900 306.000 260.000 300.150 307.700 3%
ESOP Consulting l CORFAC International, Phone: +4021.528.04.40, [email protected]
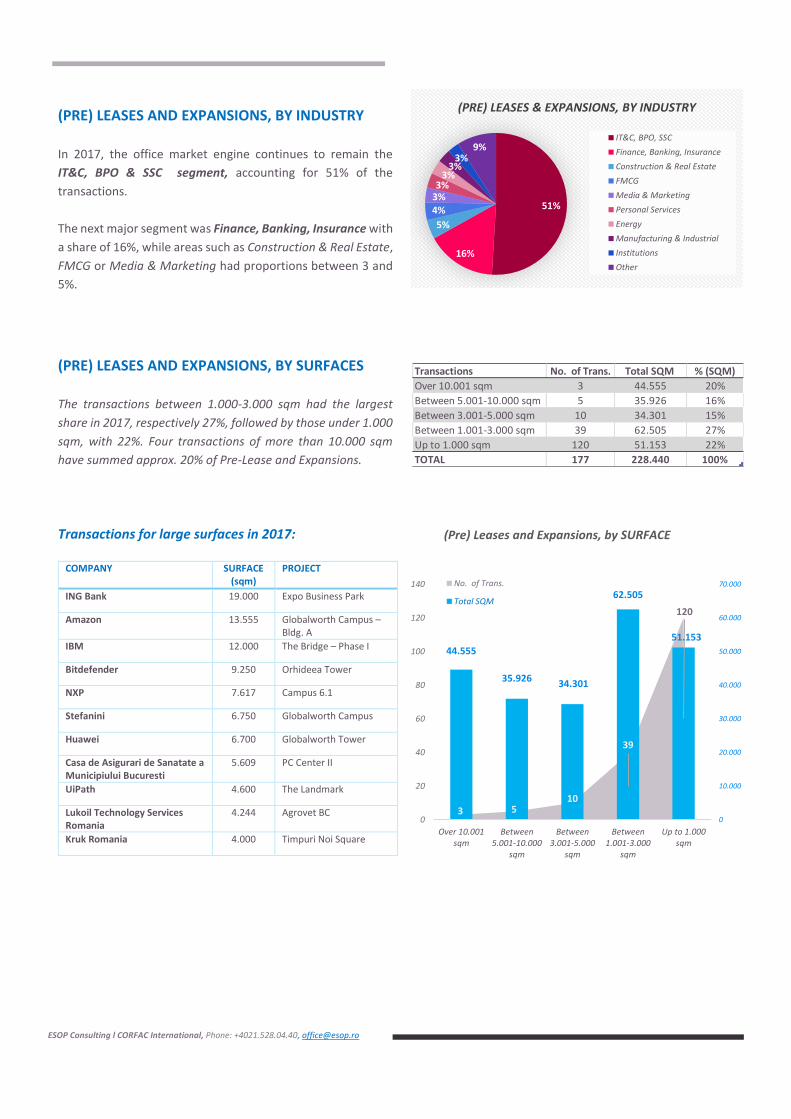
(PRE) LEASES AND EXPANSIONS, BY INDUSTRY
In 2017, the office market engine continues to remain the
IT&C, BPO & SSC segment, accounting for 51% of the
transactions.
The next major segment was Finance, Banking, Insurance with
a share of 16%, while areas such as Construction & Real Estate,
FMCG or Media & Marketing had proportions between 3 and
5%.
(PRE) LEASES AND EXPANSIONS, BY SURFACES The transactions between 1.000-3.000 sqm had the largest
share in 2017, respectively 27%, followed by those under 1.000
sqm, with 22%. Four transactions of more than 10.000 sqm
have summed approx. 20% of Pre-Lease and Expansions.
Transactions for large surfaces in 2017:
COMPANY SURFACE
(sqm) PROJECT
ING Bank 19.000 Expo Business Park
Amazon 13.555 Globalworth Campus – Bldg. A
IBM 12.000 The Bridge – Phase I
Bitdefender 9.250 Orhideea Tower
NXP 7.617 Campus 6.1
Stefanini 6.750 Globalworth Campus
Huawei 6.700 Globalworth Tower
Casa de Asigurari de Sanatate a Municipiului Bucuresti
5.609 PC Center II
UiPath 4.600 The Landmark
Lukoil Technology Services Romania
4.244 Agrovet BC
Kruk Romania 4.000 Timpuri Noi Square
Transactions No. of Trans. Total SQM % (SQM)
Over 10.001 sqm 3 44.555 20%
Between 5.001-10.000 sqm 5 35.926 16%
Between 3.001-5.000 sqm 10 34.301 15%
Between 1.001-3.000 sqm 39 62.505 27%
Up to 1.000 sqm 120 51.153 22%
TOTAL 177 228.440 100%
3 510
39
120
44.555
35.92634.301
62.505
51.153
0
10.000
20.000
30.000
40.000
50.000
60.000
70.000
0
20
40
60
80
100
120
140
Over 10.001sqm
Between5.001-10.000
sqm
Between3.001-5.000
sqm
Between1.001-3.000
sqm
Up to 1.000sqm
(Pre) Leases and Expansions, by SURFACE
No. of Trans.
Total SQM
51%
16%
5%
4%
3%3%
3%3%
3%9%
(PRE) LEASES & EXPANSIONS, BY INDUSTRY
IT&C, BPO, SSC
Finance, Banking, Insurance
Construction & Real Estate
FMCG
Media & Marketing
Personal Services
Energy
Manufacturing & Industrial
Institutions
Other

ESOP Consulting l CORFAC International, Phone: +4021.528.04.40, [email protected]
COMMERCIAL TERMS RENT LEVELS IN BUSINESS CENTERS BEGINNING OF 2018. Rents in office buildings have remained relatively stable over the last
12 months, prospects that remain also for the year 2018. An assessment of rent levels is outlined below, considering the business
centers with available spaces for lease or pre-lease, by areas and classes. We notice extensive margins in most office areas for
same class of property, the differences resulting mainly from the proximity of the subway station of each building and its
positioning /visibility.
Asking Rent Margins, by Classes, in main Areas
ESOP Consulting l CORFAC International, Phone: +4021.528.04.40, [email protected]
Area Building type Rent level asking (Eu/sqm/mont) *)
Maintenance expenses
Contract duration
Villas
Central
Patrimony Villas 16,0 - 5,0 3,0 - 3,5 minimum 3 years
New or renovated Villas
12,0 - 15,0 2,5 - 3,0 2 – 3 years
Non-renovated Villas 7,0 – 12,0 2,5 - 3,1 1 - 3 years
Demi-Central
New or renovated Villas
11,0 - 13,5 2,5 - 3,2 2 - 3 years
Non-renovated Villas 6,0 – 10,5 2,5 - 3,0 1 - 3 years
*) Asking rent level, before negociation
HEADLINE versus NET EFFECTIVE. It is maintained further the Landlord’s policy of providing incentives – like rent free period
and fit-out contribution. The difference between headline and net effective rents varies between 10-18%, depending on the
area and the moment of contracting the space. Such incentives significantly influence the tenants’ relocation decision.
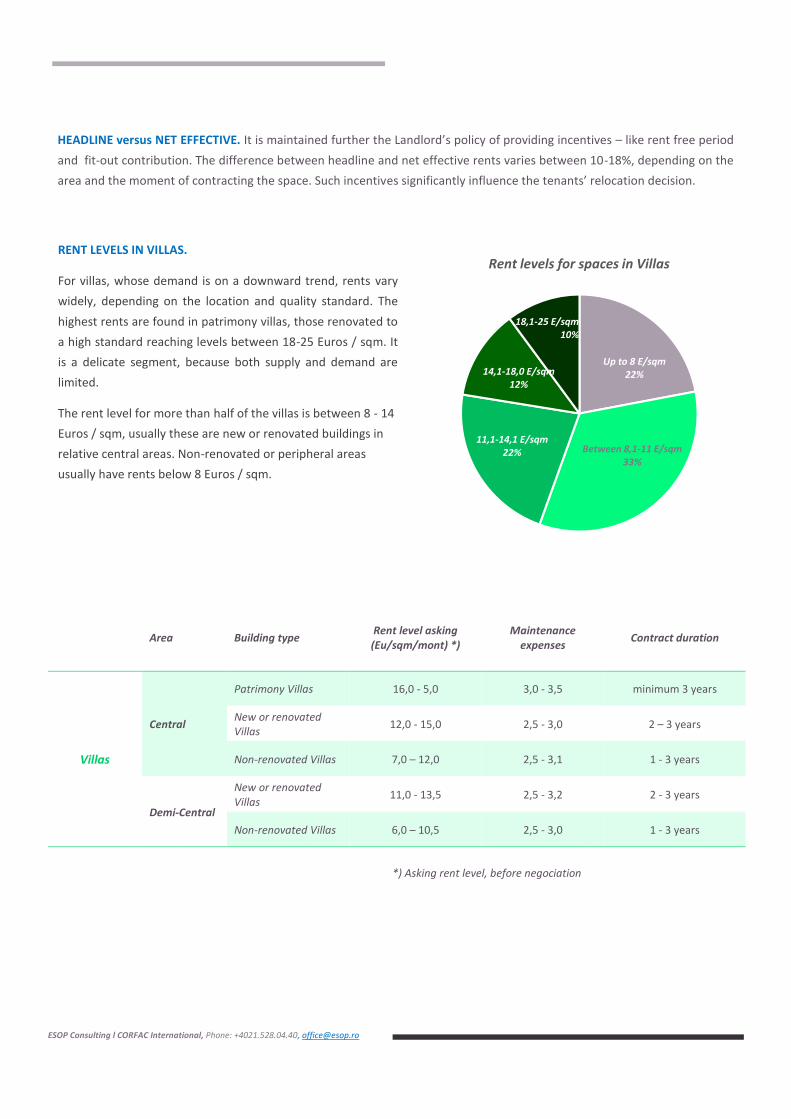
Up to 8 E/sqm22%
Between 8,1-11 E/sqm33%
11,1-14,1 E/sqm22%
14,1-18,0 E/sqm12%
18,1-25 E/sqm10%
Rent levels for spaces in VillasRENT LEVELS IN VILLAS.
For villas, whose demand is on a downward trend, rents vary
widely, depending on the location and quality standard. The
highest rents are found in patrimony villas, those renovated to
a high standard reaching levels between 18-25 Euros / sqm. It
is a delicate segment, because both supply and demand are
limited.
The rent level for more than half of the villas is between 8 - 14
Euros / sqm, usually these are new or renovated buildings in
relative central areas. Non-renovated or peripheral areas
usually have rents below 8 Euros / sqm.

ESOP Consulting l CORFAC International, Phone: +4021.528.04.40, [email protected]
FORECAST The enriched offer in 2018 and 2019 will lead to increased transactions. The market will remain dynamic in 2018, and the
completion of 243.000 square meters office spaces (of which more than 102,000 postponed from 2017) will boost the rentals
volume. The mature companies and a large part of the young and dynammic companies in the market will focus especially on
the new office projects, a trend characteristic of the economic expansion periods.
Considerint that 38% of the 2018 deliveries are already leased, some of the companies will prefer to secure contracts in the
projects to be delivered in the following year. With pre-lease level of only 9% in the beginning of 2018, 2019 offers numerous
pre-lease alternatives that are more financially flexible, opportunity window that will only be maintained for a limited time.
The IT&C, BPO and SSC segment are further on top of the office market. Overall, the Bucharest office market has confirmed
through the past 5 years track record (Pre) Rentals and Extensions levels ranging from 180.000 to 230.000 sqm/year. We
estimate that in 2018 these transactions will be able to register a 25-30% increase compared to 228.600 sqm in 2017, if the
labour market is not blocked, and if the IT&C, BPO and SSC does not slow down it’s growth rate in Bucharest.
Bucharest gets placed on a more organic development matrix. Business areas consolidating or opening: Politehnica –
Orhideea (in Central-West), Timpuri Noi (Central-South) and from 2018, Expozitie-Presei Libere Square (Central-North). The
Central-West area, with a stock of A Class spaces estimated to exceed 400.000 sqm by the end of 2019, of which over 60% of
properties delivered after 2017, is certainly the second largest business area, after the Central-North perimeter.
In 2017, the Timpuri Noi Square project successfully opened a new office area in the South-Central area of the capital. Companies
that choose Timpuri Noi Square - Phases I and II, or those evaluating the third pahse that will be delivered in Q1 2019, appreciate,
besides the high standard of the construction, the employees enhanced accessibility from the classical residential areas (the
west – south - east ring) and last but not least, proximity to the city center.
The North-Central Area develops with a new business district, the Expozitiei – Presei Libere pole, starting in 2019, when over
80.000 sqmare announced for delivery . We think this new supply will put pressure on the offices lower in quality from the north
area, or on those from Pipera area ( having good quality, yet more difficult access).
For any details regarding this material, you can contact us using the following coordinates:
ALEXANDRU PETRESCU MIRELA RAICU IRINA GHITULESCU MARIA NEDA
Managing Partner Partner Research Consultant PR Coordinator
Tel: 021 - 528.04.40 Tel: 021 - 528.04.40 Tel: 021 - 528.04.40 Tel: 021- 528.04.40
[email protected] [email protected] [email protected] [email protected]

ESOP Consulting l CORFAC International, Phone: +4021.528.04.40, [email protected]
About ESOP Consulting l CORFAC International
With more than 16 years of experience, more than 400,000 sqm of traded offices, ESOP is one of the most reputable and
trusted real estate companies in Romania, and the only company with local capital among the main brokers in the commercial
segment.
Locally Owned. Globally Connected.
Starting from 2013, ESOP is working in conjunction with CORFAC International - Corporate Facility Advisors - an alliance of
entrepreneurial real estate companies committed to providing quality services at local, national and international levels.
CORFAC has 46 companies in the United States, 4 in Canada and 27 in international markets, including Australia, Great Britain,
Switzerland, Colombia, France, Germany, Romania, Ireland, Israel, Italy, Mexico, Russia and South Korea. Companies in CORFAC
have more than 11,000 rental and sales transactions each year, amounting to more than 46 million square meters, and worth
over 7.5 billion Euros.
LIMITED LIABILITY - ESOP Consulting l CORFAC International 2018
________________________________________________________________
This is a presentation of ESOP Consulting company that should not be construed as legal or investment advice. This report aims to present a
market study and is based on materials belonging to our company and we have been provided and in whose fairness we believe. Although efforts
were made to verify the accuracy and completeness of the material, we cannot guarantee that there are no errors. Interested persons will
assume the responsibility for performing detailed research or evaluations before signing any agreement on the property / space that is subject
to their interest. ESOP Consulting l CORFAC International assumes no responsibility for damages or losses arising from any inaccuracy or
incorrectness of this report.