Off-Grid Energy
205
Off-Grid Energy An OFT market study October 2011 OFT1380
Transcript of Off-Grid Energy

Off-Grid Energy
An OFT market study
October 2011
OFT1380

© Crown copyright 2011
You may reuse this information (not including logos) free of charge in any format or medium, under the terms of the Open Government Licence. To view this licence, visit www.nationalarchives.gov.uk/doc/open-government-licence or write to the Information Policy Team, The National Archives, Kew, London TW9 4DU, or email: [email protected].
Any enquiries regarding this publication should be sent to us at: Marketing, Office of Fair Trading, Fleetbank House, 2-6 Salisbury Square, London EC4Y 8JX, or email: [email protected].
This publication is also available from our website at: www.oft.gov.uk.

CONTENTS
Chapter/Annexe Page
1 Executive Summary 4
2 Introduction 9
3 Overview of the off-grid market 13
4 Heating Oil 56
5 Liquefied Petroleum Gas (LPG) 127
6 Microgeneration 168
7 Conclusion and recommendations 200
1 EXECUTIVE SUMMARY
1.1 Four million households in the UK are not connected to the mains gas grid and therefore use other fuel sources for their heating. These 'off-grid' fuels include kerosene heating oil, liquefied petroleum gas (LPG), coal, wood and electricity, with microgeneration technologies, such as solar panels, increasingly playing a role.
1.2 In the winter of 2010/11 some heating oil customers experienced high prices and delays in supply, causing some commentators to question how well the markets for heating oil and off-grid fuels more generally were working. In January 2011 the OFT brought forward planned work into off-grid energy supply and launched a market study to assess whether and how the competition and consumer protection regimes could bring about better outcomes for consumers.
Off-grid customers and fuels
1.3 The off-grid community is large, geographically dispersed and diverse: it covers all social grades, urban and rural communities, households in fuel poverty as well as households that are not, and embraces a wide range of fuels.
1.4 The markets in England, Wales and Scotland are broadly similar, with between 12 and 25 per cent of the population off-grid, and with heating oil and electricity being the main fuels used. Northern Ireland is very different. Fully 80 per cent of households are off-grid and around 80 per cent of these use heating oil. However, a higher proportion of the off-grid population in Northern Ireland has the option to connect to mains gas. This reflects the relatively recent roll-out of mains gas networks.
1.5 There is limited potential for most consumers to switch between different fuels – the cost of converting boilers means that such switching is likely only when central heating systems are upgraded or replaced. This means that the different fuels provide only a limited competitive constraint on one another. There are therefore separate
OFT1380 | 4

markets for each fuel and the issues arising in each market are largely distinct.
1.6 Our report focuses primarily on the markets for heating oil, LPG and microgeneration; our key findings for each of these are set out below.
Heating Oil
1.7 Most complaints about heating oil concern high prices. Retail margins only account for around 10 to 15 per cent of the price level, out of which distributors cover their own costs, and some profit. Of the variation in prices over time, over 90 per cent is explained by movements in the price of crude oil.
1.8 Unexpectedly early, heavy snow in December 2010 triggered a sharp spike in demand (40 per cent up on the previous year) at the same time as hampering deliveries. Prices also spiked. To some extent this reflected the increased costs of supply in tough conditions, but firms may also have taken profit during this peak period. However, retail margins over the year as a whole do not appear excessive – these margins are generally high in the winter but low or even negative in the summer.
1.9 Our analysis of the market strongly suggests that competition is generally working well. Almost all (97 per cent) of off-grid households live in a postcode district served by at least four known suppliers. Barriers to entry are low, and the industry is fragmented – the largest player accounts for less than a fifth of the market and there are many small players including relatively recent entrants. We found no evidence of collusion between suppliers, and a variety of evidence that rival suppliers compete on price.
1.10 We found higher concentration in supply in a small number of remote areas – less than 0.3 per cent of off-grid households live in a postcode district with access to only one or two suppliers. High concentration is an issue for the supply of many products and services in such locations due to sparse populations and access issues – this is not a finding unique to heating oil.
OFT1380 | 5

1.11 We have, therefore, found no evidence of a competition problem that would require either Competition Act enforcement or intervention to regulate prices in this market.
1.12 We did, however, find grounds for concern about compliance with consumer law. We found evidence of some heating oil websites making claims that implied that they were independent or were comparing prices from different suppliers, when this was not the case. We have already taken action to address this.
1.13 We also received complaints that some heating oil suppliers were charging a different price on delivery from that quoted when the order was taken, particularly during the severe weather last December. Carmarthenshire County Council took a successful case against this practice in August of this year.1 The OFT is now examining this and related practices.
LPG
1.14 Our initial assessment of the Competition Commission's Orders in the bulk LPG market is that they have resulted in more customers switching and some new entrants to the market: annual switching rates have risen from 0.5 per cent at the time of the Competition Commission investigation to 3.7 per cent in 2010/2011. The Orders have only recently taken effect and we will continue to keep this under review.
1.15 We received some complaints about contract terms in bulk LPG, including around limited termination rights in the face of sharp price rises during the two year maximum lock-in period permitted by the Orders. This is of particular concern for customers who are offered low but temporary introductory rates as an incentive to switch. We are pursuing this matter with the industry.
1 www.tradingstandardswales.org.uk/prosecutions/carmarthengboils.cfm
OFT1380 | 6

1.16 Our review of the supply of cylinder LPG brought to light some concerns about the contractual arrangements between suppliers and dealers. However, domestic heating represents only a small part of a wider market for cylinder LPG (including industrial and commercial customers). We may revisit this matter in the context of this wider market.
Microgeneration
1.17 Microgeneration is a relatively young industry and currently accounts for only a very small proportion of off-grid energy supply. Take-up is expected to grow substantially, encouraged by a combination of financial incentives, other Government policy, rising costs for conventional fossil fuels and a growing degree of environmental awareness. The development of this market over the medium term should provide an option for off-grid customers to switch away from fossil fuels.
1.18 However, there are several features of the industry that make mis-selling a particular risk: not all technologies are suitable for all properties; the technology is complex, so customers are dependent on an expert assessment to make a decision; salespeople tend to specialise in one technology and hence may not provide an assessment of the best technology overall; there is little independent assessment available; and prices are high so if mis-selling occurs the problems are significant.
1.19 Our evidence suggests that at present problems are not widespread, but complaints started to increase over the summer. We expect most of these complaints to be resolved by installers, and are confident that the arrangements in place through the REAL Assurance Scheme Consumer code of practice, will support this. It is crucial that such problems do not undermine consumer confidence and thus the development of this market. Alongside Local Authority Trading Standards OFT stands ready to investigate specific allegations with a view to enforcement action as necessary to stop unfair commercial practices in this market.
OFT1380 | 7

Next steps
1.20 OFT is actively examining a number of practices and engaging with industry to ensure consumer law compliance, as set out above. We are also working with trade bodies to ensure that their members are fully aware of their obligations under consumer law, and that when things go wrong consumers obtain adequate redress.
1.21 We welcome the recent campaigns by consumer and industry organisations to advise households about the measures they can take to buy early and reduce their exposure to risks.
1.22 Our study presents an evidence base on the off-grid population and its experiences that we hope will be useful to relevant policy-makers, notably DECC, Defra, the Scottish Government, the Welsh Government and the Northern Ireland Executive. While by no means all off-grid consumers are vulnerable, there is a proportion of the off-grid community that is particularly vulnerable to high prices both in the short term and the longer term, notably the subset of consumers in deep rural locations with little choice of suppliers, poor housing stock, and low incomes. Our view is that targeted assistance to the most vulnerable is more appropriate than measures addressed at the markets more widely, as in many respects the markets appear to be working reasonably well.
Thank you
1.23 Finally, we would like to extend our thanks to the many stakeholders in the private, public and third sectors who generously contributed their time and information to this study.
OFT1380 | 8

2 INTRODUCTION
2.1 On 25 January 2011, the Office of Fair Trading (OFT) announced its intention to undertake a market study into the off-grid energy sector in the United Kingdom (UK).2 This study was brought forward from the OFT's 2011/12 programme of work in light of consumer experiences in winter 2010/2011 of high and volatile prices and difficulties in receiving supply, particularly in respect of heating oil, giving rise to concerns that competition and consumer protection aspects of the market might not be working well for consumers. Following a short consultation on scope, the market study was formally launched on 15 March 2011.3
Scope of the study
2.2 The scope of the study relates to the domestic supply of energy to off-grid consumers for their heating needs.4 For the purposes of the study, we define off-grid consumers as those households that are not connected to the mains gas grid. This includes both those households that are not connected to a mains gas supply but may be able to obtain a connection, as well as those for which the mains gas grid is too distant for connection to be either practically or economically feasible.
2.3 The following heating sources are commonly used by off-grid households:
• Heating oil.
• Liquefied petroleum gas (LPG) supplied both in bulk and in cylinders.
2 The press release is published at: www.oft.gov.uk/news-and-updates/press/2011/07-11
3 The press release is published at: www.oft.gov.uk/news-and-updates/press/2011/35-11
4 More information on the market study is available on the OFT website: www.oft.gov.uk/OFTwork/markets-work/current/off-grid/ - including full details of the study scope at: www.oft.gov.uk/shared_oft/market-studies/oft1302f.pdf
OFT1380 | 9
• Solid fuels, in particular wood (in the form of chips, pellets or logs) and mineral forms of solid fuel such as coal and coke.
• Mains electricity (storage, immersion and portable room heaters).
• Microgeneration technologies directly providing heat, in particular ground source and air source heat pumps and solar thermal water heating as well as biomass boilers or stoves that typically burn wood.
• Other microgeneration technologies that can indirectly generate heat by producing electricity to operate heaters, in particular photovoltaic panels and wind turbines.
2.4 The study focuses primarily on the supply of heating oil and LPG because, apart from electricity which is already regulated by the Office of the Gas and Electricity Markets (Ofgem) in Great Britain (GB) and the Northern Ireland (NI) Authority for Utility Regulation (the Utility Regulator) in NI, these are among the main energy sources for domestic off-grid central heating.
2.5 The study considers whether the markets for these sources of domestic energy are working well for consumers, taking into account both competition and consumer issues.
2.6 The study also considers the potential role of alternative heating sources such as microgeneration technologies, electricity and solid fuel. Our initial interest in considering this arose because a wider cross-fuel choice – if available – would create competitive pressures that could act as important constraints on suppliers across all substitutable markets, including heating oil and LPG.
2.7 However, our work has identified a limited degree of substitutability among off-grid heating sources, primarily because of high switching costs. In light of these costs, heating system replacement tends to be infrequent and driven by major events such as housing changes or boiler replacement.
OFT1380 | 10

2.8 Given the limited cross-fuel switching observed, off-grid energy represents a collection of separate energy markets rather than a cohesive market in its own right. Therefore, while there are some themes common across these markets, it is appropriate to consider the competition and consumer issues in each of these markets separately.
2.9 Accordingly, our report commences by describing the nature of the off-grid population and the common themes it faces. The report then discusses each of the heating oil and LPG markets, which represent the focus of our study, in more detail individually. We also include a discussion of the microgeneration market which, despite not currently representing a strong constraint on the heating oil and LPG markets due to its small installed base, is of particular interest given its early stage of development and hence potential for continued growth. A discussion of other alternative energy sources is annexed to the study.
2.10 We conclude with a summary of our key findings and our recommendations. We do not propose to refer the heating oil retail distribution market to the Competition Commission and we are consulting on this provisional non-reference decision.
Activities and data sources
2.11 In the course of our study we engaged with a wide range of relevant parties: consumers; consumer organisations; industry representatives, including trade associations and companies of diverse sizes; central, devolved and local government; sector regulators; and interested third parties including those with relevant sector expertise.5
2.12 Our evidence base was assembled by:
• A call for submissions by the OFT at the time of the study launch, following which a number of relevant parties provided submissions and information to the OFT.
5 A list of key contributors to this market study is provided in Annexe P.
OFT1380 | 11

• Data provided by industry following information requests by the OFT to a sample of suppliers across the relevant industries.
• Bilateral discussions and correspondence with relevant parties.
• Eight roundtable sessions held across the UK (two in each nation) in May and June 2011 bringing together a broad range of stakeholders to contribute their experiences and views of the off-grid market.
• Other correspondence with relevant parties.
2.13 The OFT also commissioned UK-wide consumer research from the market research firm SPA Future Thinking (SPA). This comprised:
• Qualitative research with off-grid consumers (8 focus groups and 46 depth interviews across the UK).
• A quantitative survey with 400 heating oil consumers in the UK.
• A mystery shopping exercise obtaining telephone quotes for heating oil and cylinder LPG in locations across the UK as well as using a sample of five heating oil websites.
A report by SPA on the consumer research findings is available on the OFT website (the SPA Report).6
2.14 The OFT supplemented the above information through additional desk research drawing on public and other third party data.
2.15 The remainder of this report summarises our findings from the above discussions, research and analysis.
6 The SPA main report is published at: www.oft.gov.uk/shared_oft/market-studies/off-grid/final-report.pdf. Data tables for the main report are published at: www.oft.gov.uk/shared_oft/market-studies/off-grid/data-tables.pdf. Screener data for the main report are published at: www.oft.gov.uk/shared_oft/market-studies/off-grid/screener-questions.pdf.
OFT1380 | 12

3 OVERVIEW OF THE OFF-GRID MARKET
Summary
3.1 This chapter considers the characteristics of the off-grid population (meaning households not connected to the gas grid) and the common issues they face. Our key findings are that:
• 15 per cent of UK households are off-grid, with large variation between the four nations: 80 per cent of homes in NI are off-grid, compared with only 12 per cent of homes in England. Proportionally more off-grid households are single occupancy (in GB) and/or house a person over the age of 60 (in the UK).
• There are large urban off-grid populations in addition to rural off-grid populations. In GB, electricity is the most common fuel for off-grid households in urban locations; heating oil is most common in rural locations. In NI, heating oil is the most common fuel regardless of location.
• The UK average cost of heating a typical three bedroom house is around 50 per cent higher with heating oil and 100 per cent higher with LPG than with mains gas. UK average heating costs for both heating oil and LPG have risen over the last four years. Over this period LPG has been consistently the most expensive and heating oil has been the most volatile.
• Switching between fuel sources is expensive and may make sense only when boilers or central heating systems are replaced. Where available, connection to the mains gas grid may be the best option. In particular we note that 30 per cent of off-grid households in NI may be within 50 metres of a gas connection. Microgeneration technologies also represent an increasingly viable alternative. For many households, however, improvements to home energy efficiency may be the best way to improve affordability in the short term.
OFT1380 | 13

3.2 This chapter sets out in more detail the characteristics of households off the gas grid, and discusses the possibility of gas connections and the wider context and issues for off-grid consumers.
Who is off-grid?
3.3 Around four million UK households are not connected to the mains gas grid.7 This varies substantially across the UK, as shown in Table 3.1 below. Among the nations, NI has a unique majority reliance on non-gas fuels since natural gas was only relatively recently introduced there in 1996. For more details of the derivation of Table 3.1, refer to Annexe A.
Table 3.1: Off-grid populations by nation
Mains gas availability
England Scotland Wales NI UK
Off-grid
('000 households)
2,631 488 253 594 3,966
Off-grid as a percentage of total households
12% 21% 19% 80% 15%
Sources: OFT analysis of Consumer Focus Report data; Welsh Government data; NI Utility Regulator data and NI House Condition Survey 2009 data. Refer to Annexe A for more details.
3.4 Unless otherwise indicated, all off-grid statistics cited in the remainder of this chapter8 are:
7 This is a conservative estimate, preferred as it is based on detailed breakdown figures referenced elsewhere in the report. Other estimates range up to 4.7 million. Refer to Annexe A for details.
8 Please note that the OFT has not undertaken any significance testing when referring to statistical data from the Consumer Focus Report or the NI House Condition Survey. Differences between groups are presented for information only and may not be statistically significant.
OFT1380 | 14

• For GB – based on a report on off-gas issues to be published by Consumer Focus9 (Consumer Focus Report) which draws on GB survey data.10 A more detailed breakdown of differences by nation within the GB data can be found in the Consumer Focus Report.
• For NI – based on the closest comparable data, where available, from the NI House Condition Survey 2009 published by the NI Housing Executive.11
We caveat that neither of the above reports provides statistics that are an exact match to our study definition of the off-grid population as set out in paragraph 3.1. Hence, the off-grid statistics cited in this chapter refer to the closest available proxy from the above and should be understood as estimates. The relevant proxy is, for GB, the statistics for homes that do not use gas as their main heating fuel12 and, for NI, the
9 Off-gas consumers: Information on households without mains gas heating, to be published by Consumer Focus.
10 The Consumer Focus Report is based on analysis of data from the 2008 English Housing Survey (EHS), the 2007/09 Scottish House Condition Survey (SHCS) and the 2008 Living in Wales Survey (LIWS). The sample base for each survey is 15,523, 9,394 and 2,741 households respectively. For more details, please refer to the Consumer Focus Report and Annexe A of this report.
11 This survey is based on a sample base of 3,000 dwellings. Refer to www.nihe.gov.uk/northern_ireland_house_conditions_survey_2009_-_main_report.pdf
Please note that some of the NI House Condition Survey 2009 statistics refer to dwellings and some refer to households. In this report, where we refer to statistics from the NI House Condition Survey, we have used both terms interchangeably, as where figures relating to households are not available, figures relating to dwellings are the closest available proxy. For example, the off-grid percentage of NI households presented in Table 3.1 is more precisely the off-grid percentage of NI dwellings.
12 Not identical to our study definition, as some of these homes are, despite not using gas for their main heating, connected to a gas supply.
OFT1380 | 15
statistics for households with non-gas central heating or no central heating.13
3.5 The OFT definition of off-grid households, for the purposes of this study, covers both homes that do not use gas but lie within a gas postcode14 ('potentially connectable' homes with respect to gas supply) and homes that do not use gas and do not lie within a gas postcode ('likely non-connectable' homes). The possible circumstances and solutions for households in each of these categories clearly differ and we will highlight some of these differences in this chapter for interest.
3.6 The following figures show postcode areas that are not on the mains gas grid – in each map these areas are outlined in black. We refer to these as off-gas areas, which are likely to capture mainly the likely non-connectable proportion of the off-grid population. We show these off-gas areas overlaid against fuel poverty,15 rural and urban classification and general deprivation indicators,16 in that order. This gives some idea of where the off-grid population lives, how spread out it is and some
13 Not identical to our study definition for the following reasons. Categorisation is by use of gas rather than connection to gas; and 'gas' includes LPG. Also, the data specify a particular off-grid fuel usage only where this occurs with central heating systems; off-grid use of standalone stoves or heaters is not broken down by fuel. Finally, a separate category of dual central heating is identified which covers both gas fired and off-grid fuels. Where we do not have a breakdown of dual central heating by type of fuel, we have excluded these households from the calculation and state so in accompanying footnotes.
14 Defined as a postcode where at least some households within that postcode have been recorded as having a gas supply.
15 For more details of the definitions of fuel poverty applied, which vary across the UK, please refer to Annexe B. We note that for England, the fuel poverty definition and its associated targets are currently being considered by an independent Review led by Professor John Hills. Refer to: www.decc.gov.uk/en/content/cms/funding/fuel_poverty/hills_review/hills_review.aspx.
16 Because fuel poverty and deprivation are measured differently and at different points in time in each nation of the UK, these maps are not directly comparable across nations. For example, the most deprived area in England cannot be compared to the most deprived area in Wales.
OFT1380 | 16

indication of its likely vulnerabilities. Details of the sources for and methodology underlying these maps are in Annexe B.
OFT1380 | 17
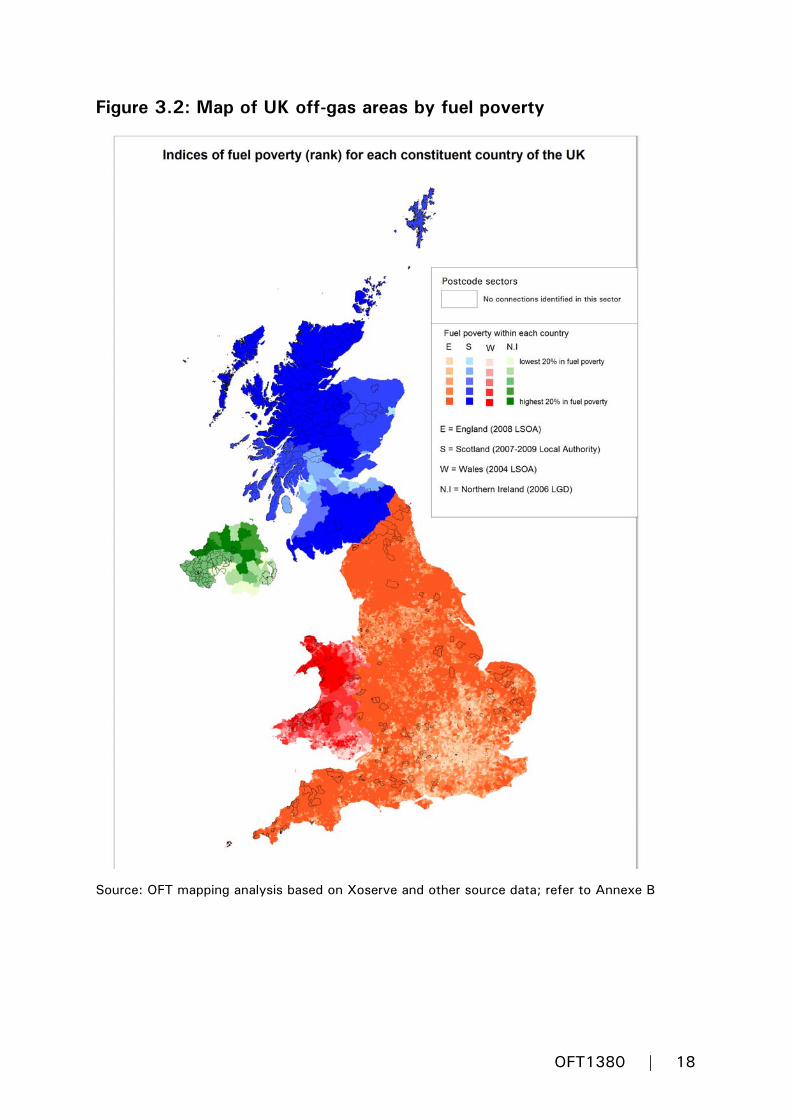
Figure 3.2: Map of UK off-gas areas by fuel poverty
Source: OFT mapping analysis based on Xoserve and other source data; refer to Annexe B
OFT1380 | 18

Figure 3.3: Map of UK off-gas areas by rural/urban classification
Source: OFT mapping analysis; based on Xoserve and other source data; refer to Annexe B
OFT1380 | 19

Figure 3.4: Map of UK off-gas areas by multiple deprivation indices
Source: OFT mapping analysis; based on Xoserve and other source data; refer to Annexe B
OFT1380 | 20

Off-grid rural/urban split and associated fuel use
3.7 In GB, there are clear differences in the off-grid population in urban compared to rural locations. However, in NI, where the natural gas market (introduced in 1996) is much less established, there remains a prevalence of off-grid households across both urban and rural areas and the differences between the two areas are less marked.
3.8 We therefore consider GB and NI separately below, making a distinction between rural and urban locations only for the former.
GB
3.9 In GB, 51 per cent of off-grid households are in rural17 areas compared to 15 per cent of on-grid households. The higher than average rurality of off-grid households reflects the higher costs of installing mains gas infrastructure in such locations (due to, for example, the greater distance to reach households, topological complexities and there being fewer households over which to spread costs).
3.10 However, almost half of off-grid GB households are in urban areas.
• This may in part be due to health and safety regulations prohibiting mains gas from being installed in certain types of buildings. Following the partial collapse of the high-rise Ronan Point apartment building in London in 1968 due to a gas explosion, building regulations were changed to ensure that new buildings over five storeys tall were constructed to resist an explosive force such as a gas explosion.18 Gas supply was banned from existing buildings that
17 Rural and urban definitions vary for each housing survey. For England and Wales, we have estimated 'rural' data by combining the 'town and fringe', 'village' and 'hamlet and isolated dwellings' categories.
18 www.pwri.go.jp/eng/ujnr/joint/35/paper/72lew.pdf
OFT1380 | 21

did not meet these criteria, resulting in a number of high rise blocks switching to electricity.
• Some landlords may also be unwilling to take on onerous gas installation and maintenance regulations.19
3.11 Because of the different circumstances affecting the urban and rural off-grid populations as described above, the two populations are also quite distinct in nature, with substantial differences in particular with respect to the types of fuels used. This is illustrated by Figure 3.5 which show the use of different off-grid fuels in urban and in rural areas:
• Urban off-grid households rely largely on electricity (90 per cent use this as their main heating fuel in GB). The reasons set out above are likely to factor into this. Other possible reasons include:
- Flammable and contaminable fuels with relatively high levels of emissions are less favoured (or may not be allowed by regulation20) in densely built up areas and are also less easy to deliver door-to-door given the size of the delivery vehicles.
- Urban homes are also less likely to have the outdoors space available to accommodate storage tanks or solid fuel stockpiles.21
19 Based on discussions with some stakeholders. For details of applicable regulations, refer for example to: www.letlink.co.uk/letting-factsheets/factsheets/factsheet-7-the-gas-safety-installation-and-use-regulations-1998.html
20 Under the Clean Air Act 1993 and the Clean Air (NI) Order 1981, smoke control areas have been introduced in many large towns and cities in the UK and in large parts of the Midlands, North West, South Yorkshire, North East of England, Central and Southern Scotland. In these areas, it is an offence to emit smoke from a chimney of a building, from a furnace or from any fixed boiler. (Source: smokecontrol.defra.gov.uk/background.php#smoke)
21 This seems a reasonable general assumption but, for illustration, the English Housing Survey Housing Stock Summary Statistics Tables, 2009, show that the average floor area for a dwelling in a city centre is 71 square metres compared to 153 square metres in a rural area. Refer to Table SST1.1 in www.communities.gov.uk/documents/statistics/xls/1937429.xls
OFT1380 | 22

• Rural off-grid households have fewer such constraints and rely much more on delivered fuels, in particular heating oil which is the main heating fuel for 53 per cent of GB rural off-grid households.
Figure 3.5: Main heating fuel by location and nation for GB off-grid households
Urban Rural
LPG & Bottled Gas Heating OilSolid Fuel Electric heating
Source: Consumer Focus Report22
3.12 As shown in Figure 3.5, there are also considerable variations by nation. Notably, the proportion of off-grid households using electricity is lower in Wales than elsewhere in GB, in both urban and rural areas. Conversely the proportion of off-grid households using heating oil or solid fuel is higher in Wales than elsewhere in GB, in both urban and rural areas (although the difference is less marked in the latter).
22 For urban areas, the number of households is 1606 (England), 288 (Scotland) and 40 (Wales – note the small size). For rural areas, the number of households is 1509 (England), 253 (Scotland) and 229 (Wales).
0%
10%
20%
30%
40%
50%
60%
70%
80%
90%
100%
England Scotland Wales
% o
ff-g
rid
hous
ehol
ds
0%
10%
20%
30%
40%
50%
60%
70%
80%
90%
100%
England Scotland Wales
% o
ff-g
rid
hous
ehol
ds
OFT1380 | 23

3.13 A clear majority of GB off-grid households rely on a mix of fuels to heat their home (80 per cent use secondary fuels, with the figure higher among households using heating oil and LPG as their main fuels and lower among households using electricity as their main fuels). The SPA research corroborated that a high level of secondary use exists, with 75 per cent of GB heating oil consumers surveyed using a secondary heating fuel. Mains electricity (which we assume means portable heaters) and/or23 wood were each used by around 40 per cent of GB heating oil consumers, followed by coal/coke (25 per cent) and cylinder LPG (seven per cent).
NI
3.14 In NI, a clear majority (around 80 per cent) of the population is off-grid.24 78 per cent of urban households are off-grid and 99 per cent of rural households are off-grid.
3.15 About two-thirds of all NI households (68 per cent) use heating oil as their primary heating fuel,25 rising to 81 per cent of off-grid households. Electricity heating – used by five per cent of off-grid NI households – is much less common in NI than in GB and is associated mainly with urban areas and apartment buildings.26
23 Respondents could select multiple responses in this question.
24 Please note that the percentage of off-grid households derived from NI House Condition Survey 2009 data (84 per cent) differs slightly from the percentage of off-grid households in Table 3.1 (80 per cent). We assume this may be because some households with a gas supply do not use it for central heating.
25 NI House Condition Survey 2009, data provided by the NI Housing Executive. Please note that fuel use is recorded according to central heating (CH) type and there may be additional oil, solid fuel or electricity use within the categories CH Dual/Other and Non CH.
26 According to the NI House Condition Survey 2009 Report: ' … over two-thirds (67%) of all dwellings with electric central heating were flats/apartments … The majority of dwellings with electric (92%) central heating were located in urban areas, partly reflecting concentrations of
OFT1380 | 24

Table 3.6: NI off-grid fuel use by location
0%10%20%30%40%50%60%70%80%90%
All Urban Rural
% o
f off-
grid
hou
seho
lds
CH Oil CH Solid Fuel CH Electricity CH Dual/Other Non CH
Source: NI House Condition Survey 2009. Note that 'CH' refers to central heating.
3.16 The SPA research showed that a high level of off-grid secondary use exists, with 65 per cent of NI heating oil consumers surveyed using a secondary heating fuel. Mains electricity (which we assume means portable heaters) and/or27 coal/coke were each used by around 30 per cent of NI heating oil consumers, followed by wood (20 per cent) and cylinder LPG (14 per cent). This suggests that, among heating oil consumers, coal/coke is preferred to wood as a secondary solid fuel in NI whereas this is reversed in GB; and secondary cylinder LPG use is also higher in NI than in GB.
Off-grid housing stock
3.17 Off-grid households face some particular challenges in respect of housing stock, which may make off-grid housing on average harder to treat.
Housing Executive dwellings.' www.nihe.gov.uk/northern_ireland_house_conditions_survey_2009_-_main_report.pdf
27 Respondents could select multiple responses in this question.
OFT1380 | 25

3.18 Off-grid households generally seem to be less energy efficient:
• In GB, 59 per cent of off-grid households (mainly electricity users) do not have central heating as their main heating system. However, this is not similarly a factor in NI where less electric heating is used.
• A higher proportion of GB off-grid households have the lowest F and G Energy Performance Certificate (EPC)28 ratings (49 per cent compared to 10 per cent on-grid). Similar data were not readily available for NI.
3.19 Among those who are off-grid in Scotland and Wales, and within segments of this population in England, there is on average a higher proportion of households with solid wall construction – which indicates that these households will less readily be able to reduce their energy needs through cavity wall insulation. Similar figures are not available for NI.
• In Scotland and Wales respectively, 28 per cent and 34 per cent of off-grid properties have solid walls compared to 20 per cent and 26 per cent of on-grid properties.
• In England, data from the English Housing Survey suggest that the incidence of solid walled properties is greater in more remote areas (hamlets and isolated dwellings).
3.20 Households living in rental accommodation are at a further disadvantage in terms of energy use, as they have less control over improvements to their housing stock. On average, a slightly higher proportion of GB off-grid households are in rental accommodation compared to GB on-grid households (38 per cent compared to 31 per cent). However, this differs
28'Every home which has been on the market should have an Energy Performance Certificate (EPC) which rates the home for energy efficiency. Energy Performance Certificate Ratings run from A (very efficient) to G (very inefficient). The average rating in the UK at the moment is D.' Source: www.energysavingtrust.org.uk/Home-improvements-and-products/Moving-home-a-green-guide
OFT1380 | 26

by nation: notably, in Scotland the difference is more marked (46 per cent to 34 per cent). In Wales the position is reversed (21 per cent to 28 per cent). Similarly, in NI, a higher proportion of off-grid households own their homes (66 per cent) than on-grid households (45 per cent).29
Off-grid demographics
3.21 When comparing the income distribution for off-grid households compared to on-grid households, the picture across the different nations is mixed. Each nation presents income distributions in a slightly different way and so they cannot be directly compared with each other. Broadly, however, there appears to be variation in the income profiles for households using different off-grid fuels.30
3.22 Notwithstanding this, a higher proportion of GB off-grid households are in fuel poverty31 (32 per cent, compared to 15 per cent of on-grid households; while NI experiences the highest levels of fuel poverty in the UK32 at 44 per cent overall33). This implies that features of the housing
29 These NI figures are calculated excluding dual fuel use.
30 In GB, a higher than average proportion of solid fuel and electricity consumers are in the lowest three income bands surveyed and a higher than average proportion of heating oil consumers are in the highest three income bands surveyed. Refer to the Consumer Focus Report for more details of the GB statistics. In NI, 25 per cent of off-grid households in the top income bracket recorded earn more than £30,000, compared to 17 per cent for on-grid households.
31 The definition of fuel poverty varies slightly across the nations. Please refer to Annexe B for more details; however for example in England: 'A household is said to be in fuel poverty if it needs to spend more than 10% of its income on fuel to maintain a satisfactory heating regime (usually 21 degrees for the main living area, and 18 degrees for other occupied rooms)'. (www.decc.gov.uk/en/content/cms/statistics/fuelpov_stats/fuelpov_stats.aspx)
32 As cited on page 5 of DETINI's 2010 Strategic Energy Framework.
33 No corresponding data for the off-grid and on-grid segments are readily available from the NI House Condition Survey. However, 46 per cent of rural NI households are in fuel poverty compared to 43 per cent of urban NI households and 99 per cent of rural households are off-grid. Furthermore, according to the 2009 NI House Condition Survey Report (page 63), NI households using off-grid central heating fuels such as electricity or solid fuel have higher levels
OFT1380 | 27

stock and the relatively higher costs of off-grid fuels as shown later in Figure 3.7, together clearly affect the average energy spend of an off-grid household.
3.23 Among off-grid households (comparable NI statistics are only shown where of interest):
• A higher proportion of GB off-grid households are single occupancy (41 per cent compared to 27 per cent on-grid) although in Wales there is no substantial difference (26 per cent compared to 25 per cent on-grid).
• A higher proportion of GB off-grid households house a person over the age of 60 (22 per cent compared to 15 per cent on-grid). The same applies in NI, where 31 per cent of off-grid households house a person aged 60 years or older, compared to 21 per cent of on-grid households.34
• A lower proportion of GB off-grid households house a couple with dependent child(ren) (15 per cent compared to 23 per cent on-grid).
The first two cases may be more vulnerable to fuel-related concerns, for example because those in older age groups are more likely to be in retirement with fixed incomes.
Switching across off-grid fuels
3.24 This section considers the potential benefits to households from switching between off-grid energy alternatives and the extent to which barriers to switching may exist. Our analysis of potential benefits focuses on costs, because the SPA research and the correspondence we have received both indicate that costs are a major concern for off-grid
of fuel poverty (69 per cent and 63 per cent respectively) than households using heating oil and mains gas central heating (41 per cent and 43 per cent of whom are fuel poor respectively).
34 These NI figures are calculated excluding dual fuel use.
OFT1380 | 28

consumers and a main driver of their purchasing behaviour. But we recognise that myriad other factors such as environmental considerations, ease of handling and ease of buying also affect household fuel choices.
3.25 Off-grid fuels are generally a more expensive option than gas. This is illustrated by Figure 3.7, which uses data from Sutherland Tables35 to illustrate the comparable costs for heating an average-size three-bedroom house with different types of fuel.36
• For example, in July 2011, the latest period for which comparable data is available from Sutherland Tables, the UK average cost37 of heating an average-size three-bedroom house was 47 per cent higher for oil and 107 per cent higher for LPG, in each case compared to gas.
35 Information about Sutherland Tables can be found on their website: www.sutherlandtables.co.uk
36 This is based on data from Sutherland Tables that are 'intended to be used to compare different domestic fuels and the costs of using them under similar conditions. Their primary purpose is not the prediction of actual operating costs in any particular dwelling, although they will of course give an indication of this' (Sutherland Tables, Introduction to the July 2011 Tables).
37 For consistency with Figure 3.7, where calculating UK averages based on Sutherland Tables data in this report, we have followed Sutherland Tables's methodology of a simple average across the six UK regions (South East, South West and Wales, Midlands, Northern England, Scotland and NI) for which they provide cost data.
OFT1380 | 29

Figure 3.7: Comparative Domestic Heating Costs – United Kingdom National Averages, July 2011
Source: Sutherland Tables, July 2011
3.26 Data from Sutherland Tables show that, among the fuel types shown, the costs of all fuels, but in particular of LPG and of heating oil, have risen over the past four years. In this period, LPG has been consistently the most expensive off-grid option followed by, on average, heating oil which has been the most volatile in terms of costs. However, we note
OFT1380 | 30

that the comparable heating cost based on a standard electricity tariff38 exceeds the costs of both LPG and heating oil.39
3.27 There is also variation in heating costs by region, as would be expected in light of temperature differences. Scotland is the most expensive region while the South-West of England and Wales40 appears to be the least expensive region, for most fuels. However, '… sometimes these variations are not systematic in terms of climate. For example, heating and hot water costs with wood pellets are much cheaper in NI than in Scotland or the North of England, while figures for solid fuels are cheaper in South West England and Wales than in the South East of England. In these cases, local economics appear to prevail over climate conditions.'41 In our view, the differences may also reflect geographic features leading to higher establishment and transportation costs for supplying the relatively higher number of outlying areas in Scotland compared to other UK nations. For NI, the Sutherland Tables data42 also show that:
• Standard gas heating costs appear higher in NI than in GB, so that the cost disadvantage of being off-grid is reduced for the former – particularly as the NI heating costs for heating oil, which is used by the majority of off-grid households, are also lower than in GB.
38 According to the SPA research, a standard electricity tariff, rather than more economical special tariffs like Economy 7, is used by a minority of the off-grid households sampled who use electricity for heating. These sampled households should be seen as representative of electricity use only in the areas surveyed. Further details are provided in the screeners to the SPA Report.
39 Heating costs using standard electricity to run radiators (rather than storage heaters) were one per cent higher than the heating costs using LPG based on a UK average from Sutherland Tables data for July 2011.
40 Costs for the South West of England and Wales are not reported separately and are represented only as a combined cost in Sutherland Tables's standard cost tables.
41 Sutherland Tables: Commentary on April 2011 Tables.
42 Sutherland Tables, July 2011 data.
OFT1380 | 31

• NI heating costs for some solid fuels and for electricity have risen less relative to the four-year average than in other regions (and indeed, for wood pellets, have reduced).
3.28 The wide range and variability of off-grid fuel costs observed shows that the mix of fuels used can have a significant impact on heating costs for the average off-grid household. This suggests that some off-grid households could benefit from switching to another off-grid fuel.
3.29 To illustrate this, Table 3.8 summarises, for each off-grid heating source:
• The relative estimated upfront costs of installation.
• The annual savings relative to heating oil.
OFT1380 | 32

Table 3.8: Relative upfront and heating costs of off-grid fuels
Heating oil
LPG43 Microgeneration Solid fuels Electricity
Upfront costs (installation and equipment)
£3.5k - £8k44
£2.5k -£6k45
Wide range depending on technology but typically between £2k - £23k
c. £0.5k-£7k46
c. £2k47
Average annual heating costs relative to heating oil
+41% -100% to -54% -22% (wood pellets)
-23% (coal)48
-40% (anthracite)49
-22% (economy)
+42% (standard)
Source: OFT research and supplier estimates. Information on the relative costs of microgeneration technologies can be found on the EST website.50 Other average relative heating costs are calculated by the OFT from Sutherland Tables data for July 2011, for an average size three-bedroom house in the UK, and assuming the use of conventional boilers for oil and LPG.
43 The annual savings figures provided relate to bulk LPG, which suppliers have informed us tends to be more economical than cylinder LPG.
44 www.homeheatingguide.co.uk/central-heating-cost.html
45 www.homeheatingguide.co.uk/central-heating-cost.html
46 OFT desk research and information provided by the Solid Fuel Association.
47 See www.energysavingtrust.org.uk/business/Business/Housing-professionals/Interactive-tools/Hard-to-treat-homes/Matrix/Electric-storage-heating and www.energysavingtrust.org.uk/business/Business/Housing-professionals/Interactive-tools/Hard-to-treat-homes/Matrix/Explanation-of-terms-used
48 Housecoal gp A(1).
49 In the form of peas / grains.
50 www.energysavingtrust.org.uk
OFT1380 | 33

3.30 We note, however, that Figure 3.7 and Table 3.8 provide a historic view of annual heating costs that may change over time depending on the relative development of the different sectors. For example, while heating costs using oil are currently more expensive than heating costs using electricity, when averaged over a four-year period these costs have, at least in some nations (Scotland and NI) been on a par;51 and going forward, gas and electricity suppliers have recently announced substantial increases in their standard rates. 52 Furthermore, a comparison of whole-life costs taking into account potential differences in upfront costs, average replacement life cycles and average maintenance costs among different heating systems may yield different outcomes for different households depending on their individual circumstances than a comparison of relative annual running costs.
3.31 We also note that cost is only one factor in a household's determination of the best off-grid heating source for its circumstances – ease of use, quality of heat, emissions, efficiency and security of supply are examples of other factors that may be relevant. Different fuel types offer quite diverse purchasing and usage experiences, so that consumers would need to research the features of different options, the availability of local suppliers and other relevant factors carefully to determine which type is most suitable for their individual circumstances before taking any decision to switch.
3.32 In any case, the possible cost or other benefits that may derive from switching between different heating sources, including as a result of
51 Sutherland Tables data, July 2011.
52 For more information refer to: www.decc.gov.uk/en/content/cms/meeting_energy/markets/making_energy_/making_energy_.aspx
www.uregni.gov.uk/news/utility_regulator_comments_on_power_ni_tariff_announcement www.uregni.gov.uk/news/increases_in_international_fuel_costs_directly_responsible_for_the_gas_price_rise_announced_by_phoen
OFT1380 | 34

increasing competition and choice across the market for off-grid fuels as a whole, are only available where switching is readily feasible.
3.33 This is not the case for off-grid consumers, as our study has identified considerable barriers to switching between different fuel types.
3.34 These barriers largely arise because such a switch typically requires the replacement of the boiler and central heating system. The upfront cost of installing a new central heating system throughout the home is generally the main barrier to switching. However, the disruption that this would entail, given that the system is often embedded in the infrastructure of the building to some extent, is also a strong deterrent.
• Other barriers relate to lack of information and awareness about different fuels and their relative costs.
• In some cases (for example in rental accommodation), consumers are constrained by having little choice over the form of heating used.
• In some cases, bulk LPG consumers can face additional fuel switching costs related to charges for the removal of their LPG storage tank where this is owned by their supplier.
3.35 Accordingly, off-grid opportunities to switch fuel type tend to be event-driven: for example, by changes in housing circumstances (moving home, or refurbishment), or aligned with the life cycle of a boiler (around 12 years).53
3.36 Replacement in the latter case tends to arise only when the heating system breaks down, which by nature represents a distressed situation in which a household may make a replacement decision more for reasons of expediency (in which case a like-for-like replacement is most straightforward and therefore probable) than long-term efficiency. Households may also be guided in their decision-making at such times by
53 www.energysavingtrust.org.uk/Home-improvements-and-products/Heating-and-hot-water
OFT1380 | 35
the person servicing their existing boiler, who may not have experience of or access to alternative solutions.
3.37 The odds are therefore stacked against fuel switching in that opportunities to do so are generally rare, and constrained even when they arise.
3.38 The existence of significant barriers to switching in practice is borne out by the fact that many of those households who use heating oil appear to have done so for a very long time. The SPA survey of heating oil consumers, for example, showed that 63 per cent of UK heating oil consumers surveyed have used heating oil for over 10 years (rising to 78 per cent for NI consumers alone) and for the majority54 of all UK heating oil consumers surveyed this had been ever since moving into their home.
3.39 In light of the difficulties in switching between different types of off-grid heating sources, we conclude that off-grid energy is not in fact a market in its own right but, rather, represents a community who share the common feature of not being connected to the mains gas grid, albeit that they are consumers in largely separate markets.
3.40 Given that switching costs limit substitutability between heating sources, we have considered the different off-grid fuels separately. Therefore the next chapters of our report consider each of the heating oil and LPG markets in turn and separately from any other. The report also considers the microgeneration market which, despite not currently representing a strong constraint on the heating oil and LPG markets due to its limited off-grid installed base, is of interest given its relative immaturity compared to the other off-grid fuel markets and hence potential for rapid growth.
54 73 per cent of GB consumers and 61 per cent of NI consumers.
OFT1380 | 36

3.41 Our findings in respect of the electricity55 and solid fuel markets for heating use, which the study has also considered in the limited context of their role as possible alternatives to heating oil and LPG, are attached in Annexes M and N respectively.
Gas connection as an off-grid option
3.42 Connection to the mains gas grid may be an attractive option where available. Natural gas is a relatively low carbon56 energy source that is easy to use and offers greater security of supply than fuels requiring road transportation to the home. A choice of suppliers is available and its status as a regulated sector affords the consumer additional protections. It also has the advantage of being – at least in recent times57 – a relatively inexpensive source of space and water heating.58
3.43 The potential for expansion of the grid differs between GB and NI. In GB:
• The option for large scale expansion of the mains gas grid was previously considered in 2001 by a working group chaired by the then Department of Trade and Industry (DTI). The report of the working group (the DTI Report)59 found that, even were a full-scale extension of the gas network possible, it would not be justified on cost/benefit grounds.60 Furthermore, at an individual level, while
55 Although electricity is used for heating by a large proportion of off-grid households, we have not focused on the supply of electricity within this market study as this is separately regulated.
56 Natural gas is the lowest polluting fossil fuel (source: NI Strategic Energy Framework 2010).
57 As noted, there is no certainty about how the relative costs of different off-grid fuels may develop in future.
58 Refer to Figure 3.7.
59 Report of the Working Group on Extending the Gas Network, 2001.
60 Report of the Working Group on Extending the Gas Network, 2001. The report refers to an estimated cost of £80m to connect 100 communities.
OFT1380 | 37

connection to the gas grid may be the most appropriate solution for a given household, it is not necessarily so in every case and a wide range of other (sometimes quicker) options should be taken into account.
• Small-scale extension of the GB gas grid is still occurring on an ad-hoc basis, funded either by the individual household or community requesting the connection, or through the Fuel Poverty Scheme administered by Ofgem (as described in more detail in Annexe D). New gas connection levels have been falling over the past few years, with around 78,000 gas connections to GDN owned networks in 2009/10, down from 114,000 in 2007/08.61 78,000 represents approximately two per cent of the estimated size of the GB off-grid population.
3.44 In NI, the Department of Enterprise, Trade and Investment (DETINI) has consulted on the potential for extending the natural gas network.62 The consultation closed only recently, on 30 September 2011, so no decision has yet been made. Even without expansion, the relatively recent introduction of natural gas in NI means that many off-grid households could be, but have not yet been, connected – as detailed below.
3.45 Without further large scale expansion, our work has estimated that (depending on the criteria used) between five and 45 per cent of off-grid households by nation are currently potentially connectable63 to the mains
61 Refer to Table 2.5 of Ofgem's Gas and Electricity Connections Industry Review 2009-10, 28 March 2011. The Review is published at: www.ofgem.gov.uk/Networks/Connectns/ConnIndRev/Documents1/CIR%2009-10.pdf
Paragraph 2.22 explains that GDN networks account for a much higher proportion of new/modified connections to existing domestic premises.
62 The consultation may be viewed at: www.detini.gov.uk/deti-energy-index.htm
63A further (approximately) 500,000 GB households are connected to a mains gas supply but do not use it as their main heating source. As these households fall outside our off-grid definition, we will not consider them further in the context of this study. However, as a potentially readily
OFT1380 | 38

gas grid. Our definition of connectable relates to location relative to the mains gas grid. It is, as such, a technical measure rather than one based on affordability; furthermore it does not take into account feasibility (such as geographical, geological or engineering factors). Our analysis is set out in Table 3.9 – more details are provided in Annexe A.
Table 3.9: Estimates of the percentage of off-grid households that are potentially connectable based on proximity to the mains gas grid
England Wales Scotland NI
Potentially connectable (within 50 m)
N/A 6% N/A 30%
Potentially connectable (within 1 or 2 km)
20% (Southern Gas Network only, 2 km)
31% (1 km) 40% (2 km) N/A
Potentially connectable (in gas postcode)
42% 22% 35% N/A
Source: OFT analysis of Consumer Focus Report, Scotia Gas Networks data and NI Utility Regulator data; Welsh Government analysis
3.46 A lower distance from the grid implies a greater likelihood of connectability.64 Table 3.9 shows that the largest opportunity for gas connections is in NI, where a material proportion of off-grid households
addressable subset of those households who may struggle with non-gas heating costs, this segment may be of particular policy interest. We refer interested parties to section 2.6 of the Consumer Focus Report which analyses this segment (in England) in more detail.
64 The exact distance beyond which connection costs are not practical will vary according to dwelling density and technical factors among others, but two km is one proxy that has been used in some analyses (Scottish House Condition Survey, Scotia Gas Networks) as an indicative threshold.
OFT1380 | 39

live within 50 m where connection is currently generally free,65 more cost-effective (hence affordable) and more likely to be feasible.
3.47 Although, from Table 3.9, the potentially connectable proportion of the off-grid population appears at face value substantial, it must be emphasised that engineering feasibility has not been taken into account in this analysis. Furthermore, analysis of this segment reveals inherent characteristics that may reduce their actual connection opportunities:
• For example, many of the GB households who are theoretically connectable are, in practice, unable to connect to the gas grid due to location, 66 tenure67 or housing stock68 restrictions that are also likely to explain their higher reliance on electric heating.
• In NI, we expect the potentially connectable population to be concentrated in the urban areas where the current gas network areas are located; more detailed data on this segment are unavailable. Nevertheless, constraints on connection are likely to be fewer than in GB as a higher proportion (66 per cent) of the NI off-
65 firmus energy will connect households within 30 metres and Phoenix Gas Networks will connect households within 50 metres. Refer to Annexe D for more details.
66 In GB, a higher proportion of the potentially connectable segment are located in urban areas (75 per cent) compared to the likely non-connectable segment (26 per cent) with there being less of a difference in Wales. Refer to Annexe C for more details.
67 In GB, more households that are potentially connectable are renting (44 per cent) compared to those that are likely non-connectable (34 per cent). The proportion of potentially connectable households in rental is notably higher than average in Scotland (58 per cent) and lower than average in Wales (26 per cent). Refer to Annexe C for more details.
68 The proportion of those in flats among potentially connectable households was higher for England and Wales (44 per cent and 13 per cent respectively) than for likely non-connectable households (23 per cent for England and five per cent for Wales). In Scotland there was no difference between the two groups. Refer to Annexe C for more details.
OFT1380 | 40

grid population owns their home and a lower proportion lives in flats or apartments (six per cent).69
3.48 Besides feasibility considerations as covered above, there are also, in practice, other more general yet equally substantial barriers to connection. Consistent with the overall barriers to fuel switching described in paragraphs 3.34, these are primarily concerned with costs, disruption and awareness. The disruptive effects are self-evident; the other points are discussed below:
• The average cost of connection for an individual household sufficiently close to the mains gas grid to benefit from regulated connection charges and acting independently of others, where the engineering requirements are straightforward, is in the region of £660 per GB household70 and, in NI, is free where a dwelling is within 30 or 50 metres of the grid.71 However, the large majority of households will incur bespoke costs that can vary widely upwards of this depending on factors including distance from the closest suitable gas mains access point and complexity of installation.
• Connection costs are in addition to the costs of installing a gas boiler and associated pipework (up to around £2,000 depending on the complexity of the installation)72 and the cost of the boiler itself (in the region of £1,000).73
69 These NI figures are calculated excluding dual fuel use.
70 Please refer to Annexe D for details of gas connection costs. Average is calculated as a straight average of connection charges that include the cost of backfill by the GDN.
71 Depending on the relevant NI gas network area.
72 See for example: www.which.co.uk/home-and-garden/heating-water-and-electricity/guides/installing-a-boiler/
73 www.energychoices.co.uk/partner-lp_do-you-need-a-new-boiler/do-you-need-a-new-boiler.html#5
OFT1380 | 41

• Consumers may not be sufficiently aware of their proximity to the gas grid, the cost and process of connection, or available financial support (as described in Annexe D), to properly assess their options for connection. The SPA research found that such awareness within the sample of off-grid consumers providing qualitative feedback appears low. Government, regulators and/or industry may therefore wish to consider means of raising awareness, particularly of available connection funding, within qualifying off-grid households.
3.49 In summary, our analysis of potential connectability among the off-grid population concludes that:
• There are many factors that will in practice significantly limit the achievable conversion rate among those households who have an opportunity to do so. However, there should still be numerous households for whom connection is a genuine option for consideration.
• Nevertheless, it should also be recognised that this option is primarily one available to urban off-grid households and therefore offers little if any relief for the many off-grid consumers who live in rural areas. This is both because the majority of potentially connectable households are located in urban areas and because of scale efficiencies in incurring connection costs that favour urban areas.74
3.50 For NI, there are further differences that should be noted. Here, more so than in other nations of the UK given the relative immaturity of the NI natural gas market, there is a significant opportunity to decrease the size of the off-grid population either by expansion or by increased conversion to natural gas within existing grid areas. Both are consistent with
74 All else equal, mains gas extension is most economic where there is a greater density of connectable households within a certain distance from a grid, to share the predominantly fixed costs of laying an extension. Therefore, any gas extension programme that seeks to maximise cost-effectiveness is likely to focus on urban rather than rural areas.
OFT1380 | 42

DETINI's stated objectives to promote opportunities for switching to lower carbon fuels such as natural gas and biomass, where it is cost effective to do so,75 which will also assist in alleviating the high fuel poverty levels in NI.
3.51 Nevertheless it is clear that there are strong barriers to the adoption of gas by NI consumers, even where already available, including high levels of satisfaction with existing home heating and the need to reassure a nervous public with limited experience of gas of its safety and to effectively communicate its benefits.76
3.52 We therefore support the plans set out in the 2010 Strategic Energy Framework published by DETINI77 to '(a)gree a strategy to incentivise gas connections and increase gas uptake in existing and future licensed areas'. As illustrated, there seems to be potential for such a programme to have a strong impact in NI, which represents 15 per cent of all UK off-grid households.
The wider off-grid landscape
3.53 This section provides some further general context, as background for the consideration of off-grid issues in this report, on the wider policy and regulatory support and energy measures that may be relevant to off-grid consumers.
75 www.detini.gov.uk/strategic_energy_framework__sef_2010_-3.pdf
76 A study undertaken by Action Renewables and Element Energy on behalf of the Energy Saving Trust (Into the West: Low carbon heat options off NI's gas network, July 2010) found that among those uninterested in the potential of connecting to gas, almost two thirds (64 per cent) felt there was nothing that could be done to help them change their mind, although as expected the level of interest increased where the availability of grants was factored in. The SPA research found that only nine per cent of NI heating oil consumers surveyed who could access gas said they were likely to do so within the next three years. (Please note that this finding is based on a small sample size of 47 NI consumers who could access gas.)
77 Refer to: www.detini.gov.uk/strategic_energy_framework__sef_2010_-3.pdf
OFT1380 | 43

Policy support
3.54 The UK Government and Devolved Administrations are committed to supporting increased energy efficiency and promoting low carbon energy.
• For GB, the Energy Bill 201178 includes the following elements:
- The flagship policy in the Bill is the 'Green Deal', a scheme whereby householders, private landlords and businesses would be given finance upfront to make energy efficiency improvements, which would then be paid for from energy bill savings. The Green Deal will be introduced from October 2012.
- The Bill also seeks to establish a new Energy Company Obligation (ECO),79 which will take effect from the end of 2012 and places requirements on energy companies to help certain groups of consumers who are more exposed to energy issues. ECO works alongside the Green Deal by targeting appropriate measures at those households which are likely to need additional support, in particular those containing vulnerable people on low incomes and those in hard to treat housing. ECO replaces existing obligations to reduce carbon emissions (the Carbon Emissions Reduction Target (CERT) and Community Energy Saving Programme (CESP)), which expire at the end of 2012.
• Alongside this, the Welsh Government has published an Energy Policy Statement on its ambitions for a Low Carbon Revolution80 and
78 www.decc.gov.uk/en/content/cms/legislation/energy_bill/energy_bill.aspx
79 By amending existing powers in the Gas Act 1986, Electricity Act 1989 and the Utilities Act 2000.
80 wales.gov.uk/topics/environmentcountryside/energy/renewable/policy/lowcarbonrevolution/?lang=en
OFT1380 | 44

the Scottish Government's Low Carbon Economic Strategy forms an integral part of its overall Economic Strategy.81
• For NI, DETINI's 2010 Strategic Energy Framework aims for an energy system where 'much more of (NI's) energy is from renewable sources and the resulting economic opportunities are fully exploited; and energy efficiency is maximised'.82
• The Devolved Administrations are also active through schemes including arbed and Nyth/NEST in Wales, the Energy Assistance Package in Scotland83 and Warm Homes in NI. In England, similar funding is available through the Warm Front scheme. More details of these schemes are set out in Annexe L.
3.55 The UK Government and Devolved Administrations are also implementing specific initiatives related to microgeneration takeup (for example the Renewable Heat Incentive programmes in GB and in NI, and Feed-In-Tariffs in GB) that are described in more detail in Chapter 6.
3.56 The measures highlighted above are applicable to both on-and-off-grid households. However, existing and proposed measures mostly do not distinguish between off-grid and on-grid targets or specific fuel types.
• Off-grid households are a notable segment of the relevant population for, and can benefit significantly from, these policies, given the fuel types used, the limited alternatives available and the harder-to-treat nature of a substantial proportion of the housing stock.
81 www.scotland.gov.uk/Topics/Business-Industry/Energy/Action/lowcarbon
82 DETINI Strategic Energy Framework, September 2010 www.detini.gov.uk/strategic_energy_framework__sef_2010_-3.pdf
83 The Energy Assistance Package is one of a range of fuel poverty and energy efficiency schemes to which the Scottish Government has announced in October 2011 a 35 per cent increase in overall funding. www.scotland.gov.uk/News/Releases/2011/10/05163256
OFT1380 | 45

• Our analysis shows that the issues faced by off-grid households differ to some extent from those faced by on-grid households, and indeed differ even between off-grid households in urban and in rural areas, hence potentially warranting distinctions within policy.
3.57 Absent such distinctions, there may not automatically be intervention to the degree that may be desirable among the off-grid population – in particular the large proportion of this population that is located rurally – given asymmetries that may exist in the costs and challenges of rolling out such measures to different groups or areas or for specific fuel types.
3.58 Should policy intervention be considered, Government may therefore wish to consider whether the introduction of policies targeted specifically at off-grid households, or the establishment of targets within existing policy that relate specifically to off-grid households or off-grid fuel types, is warranted. There may be a reasonable case, both in terms of maximising impact and redressing variations in cost-to-service across affected groups, for such targeting. There will be a trade-off between different prioritisation criteria that could, for example, include:
• Needs – focused on the subset of the off-grid community that is most vulnerable to high prices. These are consumers who combine the most challenging aspects of the characteristics described earlier: that is, with no real alternative whether because they live in deep rural locations with little choice of suppliers or rent electrically-heated homes in urban areas; poor housing stock; and low incomes.
• Volume or feasibility – focused on the subset of households that can most readily be assisted, for example through efficiency measures or connection to gas. Further work by others to refine our high level analysis of potentially connectable households and assess household needs, ultimately at local levels, would be beneficial.
3.59 Our view is that a strategically targeted form of intervention will deliver a greater return than measures addressed more widely at the heating oil market, much of which appears to be working reasonably well.
OFT1380 | 46

3.60 We are aware of ongoing projects that are already seeking to assess and thereby effectively target the needs of off-grid households by matching information on their characteristics and location with available policy solutions and funding, often working with parties with deep local knowledge such as local authorities and housing associations. No doubt there are many other examples and this list is not intended to be exhaustive, but we cite for interest work undertaken by:
• The Welsh Government, which is undertaking a study drawing on data provided by Wales and West Utilities, to categorise off-grid households according to their distance from the mains gas grid which will affect their options for connection. This information will be used to develop strategies to address the issues faced by off-grid households and to best deploy available resources and funding according to case-by-case circumstances.
• GDNs, in planning the delivery of their commitments under the fuel poverty network extension scheme.
• Some energy suppliers, in delivering their obligations under schemes to implement efficiency improvements such as CERT, CESP and in future ECO.
• Consumer organisations who have commissioned off-grid research,84 and other work by organisations such as the Centre for Sustainable Energy85 and through initiatives such as The Future of Rural Energy in Europe (FREE).86
84 For example, the Consumer Focus Report, and the Consumer Focus Wales report Off-gas consumers and microgeneration published at: www.consumerfocus.org.uk/wales/publications/off-gas-consumers-and-microgeneration.
85 For example through the website www.energyefficiencywales.org.uk, which was developed by the Centre for Sustainable Energy with funding from the Welsh Government.
86 FREE is a three year initiative launched in 2010 which operates in rural communities across England, Scotland and Wales to reduce levels of fuel poverty and carbon emissions in off-grid
OFT1380 | 47

Consumer protection
3.61 Ofgem regulates the supply of gas and electricity in GB and the Utility Regulator does the same for NI. In contrast, off-grid energy supplies are not subject to monitoring by a sectoral regulator, although they are subject to UK competition and consumer protection law. We have received a number of representations that this situation is an anomaly and that the greater consumer protections afforded to on-grid consumers should be extended to consumers in an off-grid setting.
3.62 We note, however, that there are critical differences between on-grid and off-grid energy supplies which have resulted in regulation for the former.
• On-grid energy supplies are not fully price regulated; 87 rather the cost of transmission of electricity and gas using the respective grid networks is regulated. The rationale for this is that the grids are 'natural monopolies' that it is undesirable or uneconomic to replicate and hence there is no scope to control pricing through competition.
• Heating oil, LPG and solid fuels are not delivered via natural monopoly grids but via tanker/HGV and as such do not raise the same issues of competitive constraint.
3.63 Ofgem and the Utility Regulator have, alongside their transmission price regulation functions, also been granted powers to oversee certain other consumer protections, for example, regulating the treatment of bad debtors and disconnection. With respect to these protections, the OFT has no analogous powers or remit. While we recognise that it is to some
areas. FREE is being delivered through a partnership between ACRE, Calor, NEA, the Rural Community Action Network and the Commission for Rural Communities, funded by Calor Gas Limited. Work has included mapping of off-grid areas and fuel poverty. Refer to www.nea.org.uk/working-with-rural-communities-free-future-of-rural-energy-in-europe/print
87 Apart from in NI, where the Utility Regulator regulates supply prices for the dominant suppliers of gas and electricity (Phoenix Supply Limited and Power NI). 2010 Energy Retail Report, p11.
OFT1380 | 48
extent anomalous that a consumer has better protection when they live in an on-grid property compared to an off-grid property, it is also the case that the suite of consumer protection regulations enforced by the OFT and Trading Standards – including the Unfair Terms in Consumer Contracts Regulations 1999, the Consumer Protection from Unfair Trading Regulations 2008 and the Consumer Protection (Distance Selling) Regulations 2000 – apply to off-grid energy products and services and aim to ensure that consumers are treated fairly. We discuss these regulations further in Chapter 4.
3.64 Individual suppliers may also elect to offer additional support. While the ability or inclination of suppliers to do this may vary by supplier and on a case by case basis by customer, we have heard of some incidences of practices that are helpful to consumers such as identifying and prioritising vulnerable customers during delivery backlogs, or offering a range of payment options such as prepayment, instalments, stamps and direct debits. Consumers may also wish to explore such options where available.
Addressing off-grid issues: the role of efficiency measures
3.65 The diversity of the off-grid population implies that the most suitable or cost-effective solution to a home's heating needs may vary considerably across households. A flexible rather than one-size-fits all approach drawing on the full range of energy measures and policy support available will allow the needs of different off-grid households to be most effectively met. Such measures may include, as suitable to the specific circumstances of a household:
• Efficiency measures: enhancing existing insulation or installing further insulation; upgrading to more energy efficient appliances and/or taking measures to reduce one's energy use where possible.
• Gas connection, where feasible (for example where households are in close proximity to a mains gas grid).
OFT1380 | 49
• The installation of replacement heating systems other than gas or of additional heating sources to supplement the existing central heating system.
As described in paragraphs 3.54 and 3.55, there are energy policies in place that support much of the above and hence play a part in shaping the holistic solution set.
3.66 In general however, our discussions and research suggest that, for many households, the benefits from improving home energy efficiency, for example through insulation and/or the replacement of old and inefficient boilers, may be greater and more consistent over the short to medium term than the benefits from getting the best deal within existing market constraints, as well as relatively immediate compared to more significant intervention such as gas connection.88
• For example, the Energy Saving Trust (EST) estimates that consumers could save up to a quarter on their annual heating bills by replacing their boiler and heating controls. 89 Which? estimates that roof and wall insulation could save between £150 and £450 a year and adding a modern boiler and heating controls could save a further £200 a year.90 This compares to the SPA consumer research findings where shopping around for 500 litres of heating oil only found average price differences up to £26.
• While the costs of insulation can be relatively low, the costs of replacing a boiler are more substantial. For example the EST
88 The 2001 findings from the DTI-sponsored working group on fuel poverty seem consistent with this conclusion: 'electric storage heating and insulation would remove 300-400,000 from fuel poverty, while insulation measures alone would remove 200-300,000'.
89 Refer to: www.energysavingtrust.org.uk/Home-improvements-and-products/Heating-and-hot-water
90 www.which.co.uk/environment-and-saving-energy/energy/guides/home-heating-systems/options-for-heating-your-home
OFT1380 | 50

estimates the cost of replacing a boiler at £2,300.91 However, many of the energy-related support schemes92 available relate to efficiency measures (for example there is a boiler scrappage scheme in Scotland) and this could help to alleviate associated affordability barriers.
3.67 We therefore recommend that, where possible, off-grid consumers carefully consider the possibilities for further improving the energy efficiency of their homes and seek to maximise any support that may be available for them to do so.
Other consumer considerations
3.68 In addition to the efficiency measures listed above, the SPA research indicates that there are opportunities for consumers to shop around more proactively, to maximise available assistance and to draw on prior experiences of peak-time constraints in planning and managing their purchases of oil. The suitability and effectiveness of such measures will vary from household to household and we recognise that the incremental benefit of such measures will still be limited for some households given their individual circumstances. Nevertheless, consumers may wish to consider for example:
• Buying outside the peak winter season and/or making sure not to leave purchases until the last minute, in order to increase flexibility and hence bargaining power when purchasing.
• Regularly shopping around (where not limited by contract terms) and monitoring prices, albeit there may be a trade-off between benefiting
91 This figure relates to the replacement of a gas boiler, but we have assumed the cost of replacing other types of boilers will be broadly in the same range. Refer to: www.energysavingtrust.org.uk/In-your-home/Heating-and-hot-water/Replacing-your-boiler
92 Information on assistance is available at, for example, the Energy Saving Trust: www.energysavingtrust.org.uk/Easy-ways-to-stop-wasting-energy/Energy-saving-grants-and-offers.
OFT1380 | 51

from any supplier loyalty and obtaining lower prices that must be taken into account in individual purchasing decisions.
• Participating in heating oil buying groups.93
• Considering schemes to assist in budgeting for payments, for example paying by instalments, prepayment or (in NI) saving for fuel payments using heating oil stamp saving schemes. Consumers should, however, be careful to assess the terms and conditions of any arrangements made to check that they can still readily monitor and control costs if needed, shop around, and exit if pricing is not competitive. The benefits of any arrangements should be balanced against any limitations on a case by case basis.
• Considering auto-top-up schemes that may help regulate and increase security of supply; however, the same caveats as above regarding terms and conditions apply.
• Making applications for grants (in relation to insulation, boiler replacement, fuel bills and so on) where qualifying criteria are met.
• In line with paragraph 3.65, the above can be complemented by:
- Considering back-up arrangements (for example portable heaters) in case of supply disruptions in winter; and more generally considering whether supplementing the central heating system with a mix of other room heating alternatives may be beneficial on an ongoing basis.
- Considering, where possible, the suitability of alternative fuels. For example consumers could research information on alternative fuels
93 Information and advice about buying groups can be found at, for example: www.citizensadvice.org.uk/oilclubs where consumers can also download a Best Practice for Oil buying Groups guide jointly produced by Citizens Advice, ACRE and the Federation of Petroleum Suppliers. The SPA report also reviews consumers' experiences of buying groups.
OFT1380 | 52

towards the end of a boiler's life cycle in preparation for possible future switching opportunities.
3.69 Consumers can seek advice and obtain information on their energy purchasing, use and options from a wide range of organisations including the EST, Citizens Advice, Citizens Advice Scotland, the Consumer Council for NI (CCNI), Consumer Focus, Consumer Focus Scotland, Consumer Focus Wales, Which? and Action for Communities in Rural England (ACRE).
• Some useful contact details for consumers are available at: www.decc.gov.uk/en/content/cms/about/contact_us/key_contacts/key_contacts.aspx.
• Additional information about available support can be found on www.direct.gov.uk,94 the Welsh Government website,95 the Energy Saving Trust Scotland website96 and www.nidirect.gov.uk.97
• A campaign has also recently been launched by consumer groups, jointly with the industry, the Department of Energy and Climate
94 For example: www.direct.gov.uk/en/Environmentandgreenerliving/Energyandwatersaving/index.htm www.direct.gov.uk/en/Pensionsandretirementplanning/Benefits/BenefitsInRetirement/DG_185940 www.direct.gov.uk/en/MoneyTaxAndBenefits/BenefitsTaxCreditsAndOtherSupport/On_a_low_income/DG_10018946
95 wales.gov.uk/topics/environmentcountryside/energy/efficiency/saving/?lang=en
96 www.energysavingtrust.org.uk/scotland/Scotland-Welcome-page/At-Home/Home-Energy-Scotland/Energy-Assistance-Package
97 For example: www.nidirect.gov.uk/index/information-and-services/environment-and-greener-living/energy-and-water-saving/energy-and-water-efficiency-in-your-home/insulating-and-heating-your-home-efficiently.htm?WT.ac=Popular-Environment-Greener-Living-1
www.warm-homes.com
OFT1380 | 53

Change (DECC) and the Department for Environment, Food and Rural Affairs (Defra), issuing guidance on buying heating oil and using buying groups.98 CCNI also provides relevant information for NI consumers including on prices.99
3.70 To successfully improve their energy outcomes, it will be important for consumers to be supported in the choices they need to make and with the actions they should consider.100 Government, consumer organisations and industry have an important role in considering the provision of readily available and impartial information and advice to help consumers to select the solution best fitted to their circumstances when purchasing a new heating system, to effectively supplement their existing central heating system, to prepare for a future juncture when switching may be possible, and to become more informed buyers.
Evidence base
3.71 In the course of our work, we have found that public data on off-gas areas and experiences are patchy or available only on a piecemeal basis due to gas grid confidentiality issues and this may be a hindrance to the effective application of any off-grid strategy. Accordingly we have sought to identify and draw together a number of sources of UK off-grid data to form an evidence base, including off-grid maps and bespoke
98 For example: www.citizensadvice.org.uk/oilclubs www.consumerfocus.org.uk/wales/news/campaign-aims-to-cut-costs-of-winter-heating-oil www.oilsave.org.uk
www.consumerfocus.org.uk/scotland/publications/top-tips-for-heating-oil
www.acre.org.uk/news/2011-news/acre-joins-launch-of-the-buy-fuel-early-campaign
99 www.consumercouncil.org.uk/energy/home-heating
100 For example, the qualitative findings in the SPA research indicated that consumers would value more advice regarding switching between different fuels.
OFT1380 | 54

consumer research, on factors that may be of relevance to future work in this area.
3.72 We hope that all interested parties will find our report and the accompanying evidence base useful in the further development of any relevant policy and consumer engagement and support that may be considered appropriate in light of this study, and in the consideration of strategies to maximise the effect of funding that exists or may become available in off-grid areas.
OFT1380 | 55

4 HEATING OIL
Summary
4.1 The price of heating oil has been both volatile and rising in recent years. This, combined with supply problems last winter (2010/11) has prompted concerns that the market is not working well. The OFT has looked in detail at the market for heating oil and our key findings are:
• Over 90 per cent of the variation in the average national retail prices of heating oil is explained by movements in the price of crude oil. High and volatile heating oil prices overwhelmingly reflect high and volatile crude oil prices. Heating oil suppliers make a gross margin of perhaps six pence per litre on an underlying price of around 50 pence per litre, and out of this must cover their own costs including staff and transport – in other words the retail margin accounts for only around 10 or 15 per cent of the final price of heating oil.
• In the course of our study, and via Consumer Direct, we received a large number of complaints from consumers relating to domestic heating oil. Nonetheless, our consumer survey found that overall customer satisfaction is high. 79 per cent of respondents to the consumer research were either very or fairly satisfied with heating oil as a fuel to heat their home and/or water. Pricing aside, 94 per cent of consumers are either very or fairly satisfied with the service received from their main supplier.
• There are many competing suppliers at both national and (in most places) local level, even taking account of suppliers that operate multiple brands. The 10 largest companies supply less than half the market. 97 per cent of off-grid households live in a location served by at least four suppliers that we know of, while less than 0.3 per cent have access to only one or two. Furthermore, we believe that barriers to entry are low in most areas.
• We found no evidence of price fixing or other forms of collusion between heating oil suppliers.
OFT1380 | 56
• Demand for heating oil is strongly seasonal. Prices are not obviously seasonal; however, prices do seem to be higher in winter and indeed, after controlling for crude oil prices, retail prices do rise as temperature falls.101 Retail margins are strongly seasonal – firms make enough money delivering high volumes in the winter months to support their operations through the quieter summer – but do not appear excessive overall. There is no evidence in the data we have to support the hypothesis that suppliers are quicker to pass on increases in the underlying oil price than decreases.
• Severe weather in December 2010 triggered a sharp spike in demand (40 per cent up on the previous year) at the same time as hampering deliveries. Prices also spiked – while average prices for December were in the region of 50-60 pence per litre, in some places prices of up to 80 pence per litre were reported on single days. Some of the price increase reflected higher costs of supply in these conditions, for example longer driving times per drop. Nonetheless it is likely there was also a profit element. However in competitive markets it is not illegal to raise prices in response to increased demand. Our analysis of the market suggests that, while firms are able to make profits at times of peak demand, competition will constrain the extent to which they do so over time.
• On this basis, we find no grounds to recommend regulating prices.
• We did, however, find breaches of some consumer protection law:
- We found evidence of three specific heating oil websites making claims that implied they were independent or were comparing prices from different suppliers, when this was not the case. We have already taken enforcement action to address this issue.
- We received complaints that some heating oil suppliers were charging a different price at delivery from that quoted at order, particularly
101 For details see Annexe G.
OFT1380 | 57

during severe weather last December. Carmarthenshire County Council took a successful case against GB Oils Limited (trading as O. J. Williams), in August of this year.102 We are currently examining this and related practices.
• We are working with the industry trade bodies to promote compliance across the sector, through a combination of self regulation by the industry, supported by the OFT.
• We also received complaints about price discrimination, and calls to prevent it by making firms publish their prices. However, offering different prices to different customers is not of itself illegal. Given the strength of competition in the market, we are not currently recommending mandated price publication.
• Our consumer survey indicated that on the whole people find it is easy to compare prices and switch suppliers. However, customer loyalty is high – most people buy from their usual supplier, in part because they value the relationship and in part because they do not expect prices to vary much. The SPA mystery shop found some price variation, suggesting potential benefit of shopping around in the region of two to five pence per litre. Tests of price comparison websites suggested that while these can be useful for obtaining indicative quotes, it is worth telephoning to find the best deal.
• There are particular features of the heating oil market in NI that make it different from the rest of the UK. Throughout this chapter we discuss the NI perspective separately where appropriate. In particular, on market structure (paragraph 4.21), pricing (paragraph 4.61), delivery size (paragraphs 4.77 – 4.78), order size and affordability (paragraphs 4.87 – 4.88) and the case for regulation (paragraph 4.142).
102 See: www.tradingstandardswales.org.uk/prosecutions/carmarthengboils.cfm
OFT1380 | 58

Introduction
4.1 The price of heating oil has been both volatile and rising in recent years. This, combined with supply problems last winter (2010/11) has prompted concerns that the market is not working well.
4.2 Concerns put to us included:
• Fears that some suppliers may have market power or even monopoly positions in some localities, or that they might be engaged in cartel behaviour.
• Concerns over excessively high prices, and whether there were grounds for regulating prices in this market.
• Concerns about price variations between consumers.
• Complaints that some customers have not been treated fairly with respect to billing and cancellation rights.
4.3 This chapter looks at heating oil, focusing on the domestic retail or distributor level in the UK. It describes the product and supply chain, and considers competition and consumer protection issues in the retail market. It also includes a specific discussion of market conditions last winter.
4.4 The analysis in this chapter is based on sources including public data, research with consumers (see the SPA Report) and a data request we sent to firms. We received 18 responses (from over 70 firms contacted) from firms whose combined market share we estimate at around 40 per cent of domestic heating oil sales in 2010.
OFT1380 | 59

The product
4.5 There are two types of heating oil used in the UK: kerosene and gas oil. Gas oil, also known as red diesel,103 is mainly for agricultural or light industrial use in the UK. Kerosene is the most commonly used for heating homes in the UK, and is the focus of this study. All references to 'heating oil' in this report mean kerosene unless otherwise stated.
4.6 Both gas oil and kerosene are produced (refined) from the distillation of crude oil. They are 'middle distillates' – produced at the midpoint of the distillation process, as opposed to the beginning (heavy distillates) or end (light distillates). Kerosene cannot be produced in isolation from other products and there is only limited flexibility in the refinery output mix. Kerosene makes up around 16 per cent of the yield from a barrel of crude oil.104
4.7 Kerosene is used both for aviation and for heating. Until 2008, when EU environmental legislation105 required a reduction in the sulphur content of heating oil, jet (or aviation) kerosene and heating oil kerosene had similar specifications. Since 2008, jet kerosene is less likely to meet the heating oil sulphur specification and they are less likely to be substitutable. See Annexe E for more detail.
4.8 Refiners have only limited flexibility to switch between products, and profitability depends on selling prices of each. Figure 4.1 shows the spread (the gap between refined and crude prices) for jet kerosene (which is the traded product most similar to heating oil kerosene) alongside that for other distillates, some of which sell for more and some of which sell for less than the price of crude.
103 Dye is added to distinguish it from diesel that is used for road vehicles and which is therefore taxable. 104 UK Refineries - Data provided by the International Energy Agency.
105 1999 EU Sulphur Content of Liquid Fuel Directives, as amended by the 2005 Sulphur Content of Marine Fuels Directive. In England and Wales, the Directive is implemented under The Sulphur Content of Liquid Fuels (England and Wales) Regulations 2007.
OFT1380 | 60

Figure 4.1: Gap between the price of refined products and crude oil
-15
-10
-5
0
5
10
15
20
25
Jan 08 Jul 08 Jan 09 Jul 09 Jan 10 Jul 10 Jan 11 Jul 11
Penc
e pe
r lit
re
CIF Petrol 10ppm CIF Diesel 10ppm CIF Gasoil 0.1% CIF Jet CIF Fuel Oil low % LPG (Propane)
Source: Graph produced by DECC with permission from Bloomberg
4.9 Heating oil is a small part of the overall UK market for petroleum products, as Figure 4.2 indicates. In 2010, four million tonnes of heating oil were sold, of which 2.5 million tonnes was for domestic heating. This is less than a quarter of the 11.1 million tonnes of jet kerosene.106 Similarly, the UK market for heating oil is small compared with other parts of Europe (where gas oil rather than kerosene predominates in heating). For example 2009 domestic volumes were 20.5 million tonnes in Germany, 4.4 million tonnes in Belgium, and only 2.2 million for domestic use in the UK.107 Although heating oil consumption might be expected to decline over time as efficiency of fuel use increases, there has been no fall in demand in the last 10 years.108
106 DECC, inland deliveries. 107 Figures from OFTEC/Eurofuel and DECC – other countries' figures are for gas oil. 108 DECC, monthly volumes data.
OFT1380 | 61

Figure 4.2: Petroleum products sold in the UK, 2010
Jet kerosene17%Heating oil
kerosene6%
Gas oil (Derv)32%
Gas oil8%
LPG4%
Other petroleum
gases4%
Motor spirit23%
Fuel oil3%
Lubricating oils1%
Bitumen2%
Source: DECC, deliveries of petroleum products for inland consumption
The supply chain
4.10 The supply chain for heating oil is illustrated in Figure 4.3, and described below. For more detail, see Annexe F.
OFT1380 | 62

Figure 4.3: UK heating oil supply chain
Source: OFT research
• Stage 1 – from source to refineries or coastal import terminals:
Terminals (coastal import terminal or inland distribution terminal)
UK crude oil comes by pipe/
boat from source
Heating oil transported by pipe/ boat/ rail
Distributor's depots (wet depots)
Customers
Distributors collect heating oil in tankers
Some distributors
own terminals
Distributors deliver in tankers
Some distributors
collect direct from
refineries Some distributors don't have storage
so buy ex-rack daily
Crude oil, intermediate and finished products imported from outside
the UK
Refineries in UK produce heating
oil Stage 1
Stage 2
Stage 3
OFT1380 | 63

- Crude oil is transported from oil fields by pipeline or boat to one of the eight operational UK refineries.109
- There are also more than 16110 sea-fed coastal oil terminals that receive oil from UK refineries and abroad.
- NI has no refineries. Heating oil is transported by sea to one of three terminals in Belfast or one in Derry.
- Exchange contracts allow refiners to sell oil from other companies' refineries, reducing the cost of delivering to areas remote from their own refining facilities.111
• Stage 2 – moving product to terminals:
- Product is transported to terminals by: pipeline (51 per cent), sea (34 per cent) or rail (15 per cent).112
- There are around 50 major terminals in the UK; some are based on the coast for imports, others are based inland. Many are owned by the major oil companies, sometimes in a joint venture.
• Stage 3 – road distribution to customers:
- Heating oil distributors (that is, retailers) collect oil from refineries or terminals in trucks (buying 'ex-rack') or get it delivered to their depots by a wholesaler or independent transport company.
- Distributors can either deliver to customers direct from the terminal or via their own depots. Most do both, though this varies by firm and time of year. Some smaller distributors, especially in NI, do not have storage facilities, so deliver straight to the customer.
4.11 Some heating oil distributors are also wholesalers and some are also importers. However, in the event of the anticipated acquisition of Total
109 Since 2008 ExxonMobil at Fawley no longer produces kerosene specifically for heating oil as a result of the change in sulphur content, described at Annexe E. 110 Downstream Oil – short term resilience and longer term security of supply Deloitte p42. 111 UK Downstream Oil Infrastructure Wood Mackenzie report p25. 112 UKPIA Statistical Review 2011 p8.
OFT1380 | 64

Butler by the Rontec Consortium and subsequent sale on to DCC,113 no oil majors would remain in retail distribution of heating oil in the UK, and no UK refiners would also distribute.
Scope: retail supply to domestic customers
4.12 The final consumer could be affected by capacity and resilience at any level of the supply chain. These issues are briefly considered in Annexe F, but the focus of this study is the retail supply of heating oil to domestic consumers – Stage 3 in the supply chain description above. At this stage, the market for heating oil kerosene is more distinct from that for jet kerosene, than at earlier stages in the process. While the other elements of the supply chain obviously have a direct bearing on the retail market they are beyond the scope of this report.
4.13 There are about 1.6 million domestic users of heating oil in the UK (around six per cent of all households in the UK), mostly concentrated in rural areas.114 Usage is highest in NI, where 68 per cent of homes use heating oil.115 This is because natural gas was introduced in NI only relatively recently in 1996. Figure 4.4 shows how use of heating oil is distributed across the country.
113 otp.investis.com/clients/ie/dcc/rns/regulatory-story.aspx?cid=207&newsid=221166
114 Consumer Focus and NI House Condition Survey 2009 115 NI House Condition Survey 2009.
OFT1380 | 65

Figure 4.4: Heating oil use across the UK
Source: UK Emission Mapping Methodology 2009, AEA, Ioannis Tsagatakis, Tony Bush, Helen Walker, Neil Passant, Nicola Webb and Daniel Brookes. Refer to Annexe B for detailed underlying source explanations.
4.14 At the retail level, few firms focus solely on domestic heating oil. It is sold within a portfolio of fuels delivered to domestic and commercial customers, often alongside other products or services such as boiler installation.
OFT1380 | 66

• Most firms116 sell both transport and heating fuels, and on average heating oil made up less than half of the total liquid fuel sales among those that responded to our data request.
• All the businesses who responded to our information request deliver fuels to both commercial and domestic customers. For kerosene, domestic sales made up around 75 per cent of sales on average (though it was 100 per cent for some).117 Some firms reported that the importance of domestic sales has increased recently because of the contraction in commercial demand caused by the recession.118
Competition assessment
4.15 The following sections look at allegations of monopolisation and market power, at barriers to entry, at the relationship between prices and the number of suppliers in an area, at the possibility of collusion between suppliers, at consumer behaviour and buying power, at allegations of price discrimination and excessive pricing, and at events last winter. It also addresses the question of whether there is a case for regulating prices in this market.
Monopolisation and market power
4.16 During the market study consultation we heard a number of allegations and concerns about monopolisation and market power by distributors of heating oil. In essence, these allegations implied:
• that some localities have been monopolised
116 13 of the 17 firms that answered this question in our data request. Our discussions with firms suggest this is true of the wider market.
117 Data request responses from firms.
118 Meetings with firms.
OFT1380 | 67

• that many distributors are ultimately owned by a single company so that what appears to be competition between rival suppliers is in fact a monopoly.
4.17 We have considered these issues and concluded that there is no monopolisation problem at a national level. At a local level only a small number of rural or island communities face a very limited choice of supplier. This section sets out the evidence behind our findings.
The national market
4.18 At a national level the retail market for kerosene is not concentrated, although in recent years it has been consolidating. In 2010 the 10 largest distributors had a combined share by volume of the domestic market119 of just over 40 per cent compared to 35 per cent in 2005 (throughout our analysis firms are only counted once, even where they operate multiple brands).
• Consolidation has mainly been driven by acquisitions by the current market leader in domestic heating oil, DCC (predominantly through its subsidiary GB Oils). Their market share has increased substantially in the past five years. Acquisitions completed or in train this year would lead to further increases – for example GB Oils' merger with Pace Petroleum was recently approved subject to undertakings,120 and DCC have recently reached conditional agreement with Rontec Investments LLP to acquire oil distribution assets currently owned by Total Butler.121
119 RDCO data from HMRC, share of domestic sales below the de minimus of 3,500 litres individually or 10,000 litres in total in a year.
120 Acquisition by GB Oils of Pace Fuelcare, ME/4924/11: www.oft.gov.uk/OFTwork/mergers/decisions/2011/gb-oils and OFT press release: www.oft.gov.uk/news-and-updates/press/2011/104-11
121 otp.investis.com/clients/ie/dcc/rns/regulatory-story.aspx?cid=207&newsid=221166
OFT1380 | 68

• Other firms have also grown through acquisition, although not to the same extent – for example, NWF (in the top 10 by domestic volumes in 2010) has recently acquired Evesons.122
4.19 Beyond the top 10 distributors, in 2010 there were around 70 other registered UK dealers who each sold more than 10 million litres to domestic customers, and over 300 that sold more than a million litres. The fragmented nature of the UK market is shown in Figure 4.5. Only a handful of firms have sizeable national networks, but there is a reasonable number of big regional firms, as well as a large number of smaller businesses, particularly in NI.
Figure 4.5: Estimated shares of UK 2010 domestic kerosene market
29%
14%
13%
43%
Firms with large national networks (3 firms)
Large regional and smaller nationalnetworks with >1% market share (8 firms)
Smaller firms with ~0.5-1% market share (around 20 firms)
Small local firms with less than 0.5%market share (300+ firms)
Source: RDCO data from HMRC, share of domestic sales below the de minimus of 3,500 litres individually or 10,000 litres in total in a year. Firms selling more than one million litres in 2010
122 www.nwffuels.co.uk/latest_news/detail/?nId=23
OFT1380 | 69

4.20 There is significant national variation in the demand for and supply of domestic heating oil throughout the UK, as shown in Table 4.6 (where the number of suppliers relates to those who delivered more than a million litres each to domestic customers in 2010).123
Table 4.6: Heating oil use by country
England Wales Scotland NI
Annual domestic heating oil volumes (billion litres, 2010) (Share of UK total)
1.7
(53%)
0.3
(9%)
0.2
(5%)
1.0
(33%)
Households using heating oil (thousands) (Share of UK total)
828
(52%)
143
(9%)
135
(8%)
505
(31%)
Estimated number of active distributors (Share of UK total)
150
(39%)
25
(7%)
25
(7%)
180
(47%)
Source: OFT estimates based on analysis of total volumes and estimated regional consumption data from DECC124 (volumes); Consumer Focus Report (households using heating oil); firms' registered location in RDCO Data from HMRC for firms selling more than one million litres to domestic customers, augmented by information from trade associations, price comparison sites and firms (number of distributors)
4.21 The market structure in NI is less concentrated than in the rest of the UK, with a smaller share held by the market leader and more mid-sized firms, relative to the size of the market. See Figure 4.7.
123 Firms' registered location in RDCO Data from HMRC; augmented with firm coverage information collated by the OFT.
124 See www.decc.gov.uk/en/content/cms/statistics/energy_stats/source/oil/oil.aspx (ET 3.13) and www.decc.gov.uk/en/content/cms/statistics/energy_stats/regional/regional.aspx
OFT1380 | 70

Figure 4.7: Estimated shares of NI 2010 domestic kerosene market
13%
29%
25%
33%
Firms with > 5% market share (2 firms)
Firms with >1% market share (16 firms)
Firms with ~0.5-1% market share (around 40 firms)
Small local firms with less than 0.5%market share (around 125 firms)
Source: RDCO data from HMRC, share of domestic sales below the de minimus of 3,500 litres individually or 10,000 litres in total in a year, firms selling more than one million litres in 2010
4.22 The main industry bodies relating to heating oil distribution are:
• The Federation of Petroleum Suppliers (FPS) – over 230 members in the UK and the Republic of Ireland.
• The NI Oil Federation (NIOF) – around 70 members.
• The Oil Firing Technical Association (OFTEC) – focused on installation and maintenance of equipment.
Local competition
4.23 Market structure at a national level helps in understanding the overall competition environment. However a large number of suppliers at the national level may mask greater concentration at the local level, and
OFT1380 | 71

heating oil is sold on local markets so the number of suppliers active in each area matters.
4.24 Retail supply is centred on supply infrastructure: depots, refineries and terminals, or tanker parking areas.125 The retail supply 'footprint' of this infrastructure (in effect the maximum distance delivery tankers can travel economically) is driven by factors including:
• The total distance.
• The size of vehicle needed because of, for example, weight restrictions or access to the customer's property.
• Topography and road quality.
• Weather and road conditions.
• Route alterations to prioritise run-outs, and the extent to which new customers can be economically added to existing routes.
• The number of daylight hours and driver hour restrictions.
4.25 Evidence from around 10 firms we spoke to,126 alongside the evidence provided to support past merger decisions,127 shows that firms may compete most strongly within a radius of around 30 miles from their
125 For discussion, see the OFT's merger decision on the completed acquisition by GB Oils Limited of Brogan Holdings Limited, May 2010. ME/4406/10: www.oft.gov.uk/shared_oft/mergers_ea02/2010/GB_Oils-Brogans.pdf and acquisition by GB Oils of Pace Fuelcare, ME/4924/11: www.oft.gov.uk/OFTwork/mergers/decisions/2011/gb-oils and OFT press release: www.oft.gov.uk/news-and-updates/press/2011/104-11
126 Data request responses and meetings with individual firms.
127 OFT's merger decision on the completed acquisition by GB Oils Limited of Brogan Holdings Limited.
OFT1380 | 72
supply points,128 such as depots or terminals. Most firms said that their routes extended 30 miles or less on average, although some deliveries, and therefore some competition, does extend further.
4.26 It should be noted, however, that since routing is affected by severe weather, the economic supply distance is likely to be more limited in winter than summer.
Number of suppliers by delivery area
4.27 The size of area that firms cover from a single depot is likely to vary by local area. To build the supply radii analysis above, we have collated data on the postcode areas to which particular firms deliver. Figure 4.8 summarises data we have collected on the number of suppliers that serve particular geographies (that we know of – some areas may have more suppliers than shown).129 Again, firms are counted only once, even where they operate multiple brands. There is variation across the UK, but most consumers have a reasonably large choice of suppliers: 130
• Around 60 per cent of GB households that are not connected to the gas grid live in a postcode district served by eight or more suppliers.
• All Northern Irish districts are served by 20 or more suppliers.
• Less than three per cent of UK off-grid households live in a location with fewer than four known suppliers, and less than 0.3 per cent have access to only one or two suppliers.
128 Data request responses, which supported the findings of previous OFT merger decisions, for example on the completed acquisitions by GB Oils Limited of Brogan Holdings Limited and of Pace Fuelcare; and completed acquisition by DCC plc of CPL Petroleum Limited.
129 Particularly those shown as having three or more, since more extensive checking was done in areas that initially appeared to have only one or two suppliers.
130 OFT collated coverage data, combined with GB off-grid household estimates provided by Xoserve.
OFT1380 | 73

4.28 These findings were broadly supported by the SPA research, which also found that most consumers felt they have good choice – nearly 70 per cent of those surveyed said they have a wide choice of suppliers, compared with 30 per cent who said they have a limited choice, and three per cent who responded that only one supplier served their area.131 The average number of suppliers reported was six (slightly lower than the number we calculated based on supplier coverage information, suggesting that consumers might not be aware of all suppliers in their area).
131 Consumers were asked how many suppliers they were aware of that could supply their home.
OFT1380 | 74

Figure 4.8: Number of known serving suppliers, by postcode district
Source: Information about the postcode districts (for example AB10, BT6) firms report they are willing to supply, collated from sources including price comparison and firms' websites, the FPS and CCNI. Numbers in brackets count the number of postcode districts in each category (including some very small postcode districts).
4.29 Those areas with fewest suppliers are in outlying and rural locations, and are generally distant from terminals and refineries.
OFT1380 | 75

• The Isle of Wight has two suppliers of heating oil to domestic consumers. The acquisition by GB Oils of Pace Fuelcare would have reduced this to one supplier132 so the OFT has accepted divestments on the Isle of Wight to restore pre-merger levels of competition.133
• In June 2010, the OFT accepted divestments in the Western Isles as part of the acquisition by GB Oils of Brogan Holdings, to restore pre-merger levels of competition.
4.30 The evidence suggests that most localities have good levels of choice – based on our coverage data, the median134 is eight – but some areas do have only low levels of choice, which in turn raises questions.
4.31 High levels of market concentration might be expected to lead to higher prices in those areas. However, we would not expect these to persist if rival suppliers can easily enter the market (for example a local entrepreneur or a rival supplier in an adjacent locality who may see an opportunity to undercut the incumbent supplier). We have therefore examined how easy it is to enter the industry, barriers to entry and expansion, and whether firms do enter and grow over time.
Entry and expansion
4.32 In a market with low barriers to entry, we would expect any excessive profits to attract new entrants or expansion of existing suppliers. Entry costs depend on the scale of entry, but we have seen evidence both of small firms entering and surviving in the market, and of expansion at a larger scale.
132 ME/4924/11: www.oft.gov.uk/OFTwork/mergers/decisions/2011/gb-oils
133 www.oft.gov.uk/news-and-updates/press/2011/104-11
134 That is, the mid point of the number of suppliers serving the off-grid population, when ranked by number of suppliers.
OFT1380 | 76

4.33 Although the overall number of firms has declined slightly over time, around 10 per cent of the top 50 are new entrants since 2004, and between 2005 and 2010, 18 of the top 50 distributors increased their market shares year on year. At the same time, in 2010 firms with market shares of less than 0.5 per cent numbered more than 300 in GB and over 100 in NI – this is evidence of past entries into the market.135
Figure 4.9: Cumulative market shares over time (domestic heating oil)
0%
10%
20%
30%
40%
50%
60%
70%
80%
90%
100%
2004 2005 2006 2007 2008 2009 20100%
10%
20%
30%
40%
50%
60%
70%
80%
90%
100%
All who sold more than 1m litres
Top 50
Top 25
Top 10
Top 5
Top 3
Around 400 firms in total in 2004 Around 360 firms in total in 2010
Source: RDCO data from HMRC, share of domestic sales below the de minimus of 3,500 litres individually or 10,000 litres in total in a year
4.34 This evidence that it is possible for small firms to survive, and for firms to expand over time, is consistent with what we heard about the costs of entry and expansion.
135 RDCO data from HMRC, domestic below de minimus, firms that sold more than one million litres.
OFT1380 | 77
4.35 The key costs of entry are:
• Tankers: a new tanker costs around £140,000, or can be hired at an annual cost.
• Attracting customers: some firms described themselves as operating in a declining market over the medium to long term, which makes entry an unattractive proposition. However, consumption of heating oil has not declined in the last 10 years.136 Limited expansion of the GB gas network (and slow uptake even in NI despite its recent transition from coal and its expanding gas network) along with high costs of switching to alternative fuels mean a sizable market will remain in the medium term. Customers new to heating oil are few, but the relatively high rates of switching between suppliers that we have seen in the consumer research (see the SPA Report) means new or expanding suppliers can compete for existing customers.
• Access to supply: A small number of firms reported that during winter 2010, those who had pre-purchased heating oil had their orders ring-fenced at some terminals and were therefore at an advantage when supply was constrained.137 Pre-ordering oil is more expensive and risky, so is generally more accessible to the larger or more established firms, which could pose a barrier to new entrants. However, we also heard some evidence that the difficulties of getting access to wholesale supply have declined over time, as branding agreements (where distributors carry the majors' brands), are becoming less important in the industry, although some companies still operate under this model.
• Credit: Most firms need to buy their oil on credit from their supplier(s), since a large majority of customers do not provide payment authorisation at order and can take up to 30 days to pay
136 DECC, monthly volumes data.
137 Firms' responses to the OFT's data request.
OFT1380 | 78

after delivery.138 A one-truck business might collect 25,000 litres of oil from its supplier each day – costing perhaps £13,000 at recent prices. Industry has told us that credit arrangements have recently become tighter because of rising oil prices (which require higher supporting levels of credit) and the recession (where suppliers or banks offering working credit or guarantees impose more demanding conditions due to higher lending risks). Data139 provided by a wholesaler also showed that the average credit limit of its customers reduced between 2009 and 2011.
• Depots: It is challenging to obtain consents for new depots, and the capital outlay is high. For example, a new storage tank can cost approximately £250,000 to £500,000.140 A small number of respondents also told us that it is more difficult for a new entrant or expanding firm to get planning permission for storage facilities today than it was for incumbent firms to acquire the relevant permissions in the past. Similarly, since environmental and safety standards have been raised over time (sometimes with arrangements allowing existing facilities time to comply), it is more difficult and costly for new firms to set up facilities that meet regulatory standards than was the case for earlier entrants.
4.36 Access to depots is therefore perhaps the greatest barrier to entry (and especially expansion) in the market. In areas close to terminals it may not be necessary to have storage space at a depot, since it is possible to deliver direct from the terminal. Firms responding to our data request told us their domestic deliveries made direct from terminals ranged from less than one per cent to 50 per cent.141 However, depots are
138 Meetings with firms.
139 OFT information request.
140 OFT information request and discussion with firm.
141 Data request responses from firms.
OFT1380 | 79

particularly important in areas more distant from supply points. Counteracting this concern, in some areas at least, is the possibility for small firms to start by renting space at another firm's depot. More importantly, we have heard several examples of expanding firms opening new depots in recent years,142 and in contrast to concerns about the entry barrier created by higher environmental and safety standards, we heard examples of more modern equipment (such as bunded tanks) that are easier to set up and less costly than earlier technologies.
4.37 The responses to our information request suggest that most distributors expected to be able to maintain or expand their businesses.143 Customer service and pricing were the most important ways to attract and retain customers, with two distributors commenting that they aimed to win disgruntled customers from 'poorly run businesses'. Some firms have invested in new infrastructure, including tankers and computer systems. Reasons for not expanding included the strength of local competition, customers' bad debts and low profitability.
4.38 Even without growth, small firms can provide important competition, since individual domestic consumers do not need to make use of an extensive network. Some firms144 argued that small businesses benefit from local knowledge and loyal customers. Indeed one of the primary reasons for retaining brand names following an acquisition is because of this loyalty. Some also suggested that small firms were better able to deal with difficulties last winter, because their close relationships with customers allowed them to more accurately prioritise urgent deliveries. In NI, we heard that the very smallest businesses can compete strongly in winter because they can reduce operations and avoid the fixed costs
142 For example by Carrs Billington, Stevenage Oil, Oil 4 Wales and Rix Petroleum. Source: OFT desk research and Fuel Oil News.
143 Half of the 18 firms that responded to our request expected to grow, the majority of the remainder to maintain their business.
144 Discussions with firms and responses to our data request.
OFT1380 | 80
associated with maintaining business through the summer. The parties in the GB Oils/Pace Fuelcare acquisition145 also argued that there should not be a distinction made between the constraints posed by smaller or larger distributors.
4.39 On balance, the costs of entry are likely to be particularly low in areas that are close to supply points. The number of firms in the market, and in most localities, suggests that barriers are low in most places, but they are likely to be more significant (though generally not insurmountable, judging by recent expansions) in areas where depots are essential. For the most remote areas, this might be in addition to other barriers – for example, we have previously heard from distributors that were reluctant to supply the Western Isles because it is more expensive and logistically difficult than supplying the mainland. 146 Entry into this type of market may therefore be less common.
4.40 That barriers to entry are low in most places is reflected in the earlier analysis (see paragraphs 4.27 – 4.31) showing that most areas do have a relatively wide choice of suppliers. The following section considers whether consumers in the small number of areas with few suppliers are paying more as a result.
Pricing by geography
4.41 Although firms compete on both price and service, 47 per cent of consumers said price was one of their top three most important considerations when buying oil.147 Several firms agreed that price is
145 OFT's merger decision on the completed acquisition by GB Oils Limited of Pace Fuelcare, ME/4924/11: www.oft.gov.uk/OFTwork/mergers/decisions/2011/gb-oils
146 OFT's merger decision on the completed acquisition by GB Oils Limited of Brogan Holdings Limited
147 See the SPA Report.
OFT1380 | 81

considered most important, but others felt brand/ reputation and customer service were more important.148
4.42 The data we have seen suggest there are price variations across and within regions. Retail and wholesale prices in recent years have been lower in NI than elsewhere,149 perhaps in part because of the larger volumes sold there.150
4.43 Elsewhere, variations of perhaps five to 10 pence per litre are seen across (and in some cases within) postcodes.151 Note that prices described in this report are inclusive of VAT unless otherwise stated.
4.44 Although variations of five to 10 pence sound high in the context of average retail margins of around six pence (see paragraph 4.111), the data that firms provided to us on their costs of purchasing oil showed within-month averages that varied by 10 to 20 pence between the firms with lowest and highest costs.152 Travel time per drop may also vary significantly by area.
4.45 Short term variations in local supply or demand will ordinarily lead to price variation across geographies. We would be more concerned by long
148 OFT information requests.
149 Seen, for example, in the Price Totem published each month by Fuel Oil News, in wholesale and retail pricing data we received from firms, and in Sutherland Tables data.
150 Other prices are also lower in NI, perhaps reflecting costs such as land/rent and labour – see ONS UK Relative Regional Consumer Price levels for Goods and Services for 2010 www.ons.gov.uk/ons/.../consumer-price...consumer-price.../uk-relative-regional-consumer-price-levels-for-goods-and-services-2010.pdf
151 In the mystery shop carried out by SPA in July 2011, variations were generally less than five pence per litre. Data from CCNI show an average variation across NI towns of eight pence per litre.
152 Based on data from 13 firms. Part of this variation will be driven by the times of the month that firms sold their volumes, and the prevailing wholesale purchase price at the time. Only some will be due to contemporaneous variations in purchase prices across firms.
OFT1380 | 82

term variations that could not be explained by variations in the costs of supply. In particular if customers in certain areas were paying more because they have little choice over which supplier to use.
4.46 Although there are some persistent variations in price across postcodes,153 our limited data do not allow us to quantify precisely the relationship between competitive conditions and price. This is primarily because the number of suppliers in a particular area is likely to be linked to factors affecting the cost of supply, such as distance from the nearest terminal or refinery. For example, although travel time per drop may vary significantly by area, the data we have do not allow us to assess what proportion of price variations are explained by variations in cost factors such as this.
4.47 Figure 4.10 shows the small sample of local pricing data we have for GB (there are no postcodes in NI with fewer than 10 suppliers). On the face of it prices seem to be higher in some of the small number of areas with the very fewest suppliers.
153 For example, in the data collected by CCNI, heating oil in the most expensive area in NI costs on average five pence per litre more than the cheapest area on a given day.
OFT1380 | 83

Figure 4.10: Prices by number of suppliers for 25 GB postcodes (average daily price from 05/08/2011 to 16/09/2011)
54
56
58
60
62
64
66
68
0 1 2 3 4 5 6 7 8 9 10 11 12 13 14 15 16
Number of suppliers
Ave
rage
pric
e in
the
per
iod,
by
post
code
(pe
nce
per
litre
)
Average in the sample
Estimated percentage of the off-grid population with this many suppliers
1 2 3 4 5 6 7 8 9 10 11 12 13 14 15 16+ 0% 0.3% 3% 5% 6% 11% 12% 12% 15% 7% 6% 5% 3% 1% 1% 12%
Source: price for standard delivery of 1000 litres of kerosene collected from BoilerJuice.com each weekday between 05/08/2011 and 16/09/2011, averages across time and postcodes with a given number of suppliers.
4.48 Most heating oil customers have a good level of choice (see paragraphs 4.27 – 4.31). We do not have data on how margins vary by geography, but some limited pricing information (in Figure 4.10) shows that some of those places with the fewest suppliers are paying more than elsewhere. Much of this premium could plausibly reflect higher costs of supply – for example if travel distances or other delivery costs were higher in the most remote areas where there are also few suppliers. Our recent merger decisions have been careful to protect competition in those
OFT1380 | 84

areas,154 so far as is possible given that the market size in some areas will naturally constrain the number of firms that can be supported.
4.49 In the next section we consider the allegation that apparently high levels of competition overall mask collusion between suppliers.
Collusion
4.50 We have received no specific allegations of cartel activity where firms make agreements, for example about price levels or market sharing. But even without explicit agreements, if certain conditions are met,155 it can be rational for firms to refrain from initiating price cuts which would be unavoidable in more competitive circumstances. This is called tacit collusion, or coordinated effects, and can mean that prices stay at 'focal points' or prices. Among the consumers that wrote to us describing their suspicions about collusion, the most common observation was of very similar prices across suppliers. However, this pattern might also be seen under intense competition, when firms face similar costs of supply and compete to offer the best price.
4.51 A number of consumers and some firms have written to us highlighting the fact that multiple brands operated by the same firm can agree prices between them. However, there is no prohibition on businesses operating multiple brands with similar or identical pricing, and this is common in many industries (see paragraphs 4.148 – 4.152, though, for further discussion).
4.52 For coordinated effects to be stable, firms must not have an incentive to deviate by cutting prices and attracting more customers. One condition for this is that a retaliatory mechanism is available – with firms able to quickly cut their own prices in order to punish price cutting by another
154 For example, the completed acquisitions by: DCC plc of CPL Petroleum Limited; GB Oils Limited of Brogan Holdings Limited; GB Oils Limited of Pace Fuelcare.
155 See: Market Investigation References: Competition Commission Guidelines
OFT1380 | 85

firm. The frequent price adjustments in the market for heating oil do mean such action is possible.
4.53 However, stability also depends on the market being sufficiently concentrated for firms to be aware of the behaviour of their competitors, and for significant deviation by an individual firm to be observable by other firms. The market for heating oil is not concentrated at the national level, or in most local areas of the country (where there are eight suppliers on average), so coordination would be difficult. Daily varying prices, rarely published prices, fluctuating demand, and price variation across customers means that price levels are not transparent, so establishing and monitoring focal points would be difficult. Because geographic markets overlap, with different levels of competition in each and a mix of large and small firms, it could be difficult for firms to delineate areas and the associated pricing levels in each. The identity of firms in each geographic area also differs, which makes market sharing (where firms agree to operate in distinct geographies) unlikely.
4.54 There are also some external factors in the heating oil market that make coordinated effects less likely. Because switching costs are low (see paragraphs 4.63 – 4.69) and a sizable proportion of customers shop around regularly, new entrants or firms that expanded from other areas in response to artificially high prices could be expected to attract customers away and destabilise the tacit collusion. This threat of new entry is strongest in areas where barriers to entry are low or firms can expand from geographically close areas. The growing role of buying groups could also particularly encourage firms to price cut in order to attract large orders.
4.55 Without reasonable suspicion or evidence of collusion in particular geographies, we have not considered the matter further. We would, of course, revisit the issue (subject to our prioritisation principles)156 should contrary evidence come to light.
156 www.oft.gov.uk/shared_oft/market-studies/oft1302f.pdf
OFT1380 | 86

Consumer behaviour
4.56 Consumer behaviour can also affect competitive outcomes in markets. Even if the market structure is competitive it can to some extent be undermined by consumer behaviour.157
Shopping around
4.57 The quantitative survey conducted as part of the SPA research found a mixed picture with respect to shopping around. Although 38 per cent of heating oil consumers surveyed obtain quotes from different suppliers every time they buy and 19 per cent do so sometimes, 42 per cent never obtain more than one quote.
4.58 The most common reason given in the SPA survey for not shopping around was that consumers had found that their regular supplier is usually the cheapest or very competitive (40 per cent cited this reason). 24 per cent said that there is very little difference in prices between suppliers.
4.59 Some consumers observed that firms' prices are very similar, and that shopping around is not rewarded. This is to be expected in a retail market where the distribution margin is only a small proportion of the total retail price (see paragraphs 4.104 – 4.105), especially where retail competition drives margins down so they are close to costs. Nonetheless the SPA mystery shopping exercise found a degree of price variation
157 As context to this section, in the course of our study we received over 200 written complaints from consumers relating to domestic heating oil. Consumer Direct received nearly 1700 complaints between 1 January 2008 and 31 August 2011. Consumerline in NI received over 270 in the same period. However, we found that overall customer satisfaction is high. 79 per cent of respondents to the SPA consumer research were either very or fairly satisfied with heating oil as a fuel to heat their home and/or water. Pricing aside, 94 per cent of consumers are either very or fairly satisfied with the service received from their main supplier.
OFT1380 | 87
between firms, suggesting that the potential benefit to shopping around may be in the region of two to five pence per litre.158
4.60 The SPA research159 found that although 79 per cent overall said it is easy to compare firms' prices, the process is not interesting or enjoyable: 24 per cent of those that do not always shop around said they are too busy or don't have enough time, and in focus groups, customers described it as 'too much hassle' or said they 'couldn't be bothered'. This is consistent with evidence of consumer inertia for energy purchasing in general, not only for heating oil.160
4.61 Increasing use of the internet161 has generated a number of developments that may reduce the time and effort required to compare prices and that in time may promote more shopping around:
• Some, but not many, firms publish their prices on the internet. In NI, some firms provide anonymous pricing data by participating in a regular survey run by the Consumer Council which can help consumers know whether they are getting a good deal.
• Heating oil price comparison sites have also emerged. As a sales channel they currently play a relatively small role in the heating oil market, accounting for perhaps three per cent of sales in 2010 in total, and varying by firm.162 They are more widely used for reference though: 25 per cent of consumers surveyed say they have used a price comparison site, and 84 per cent of these said they
158 See the SPA Report.
159 See the SPA Report.
160 The Retail Market Review - Findings and initial proposals Ofgem, 2011: www.ofgem.gov.uk/Pages/MoreInformation.aspx?docid=1&refer=Markets/RetMkts/rmr
161 For example, see ONS (2011), Internet Access - Households and Individuals
162 OFT estimate based on data from firms.
OFT1380 | 88

found it useful. The SPA research indicated that, while price comparison sites can be useful for getting indicative prices and saving time, it may be necessary to telephone to find the best deals as not all firms participate in price comparison sites.163
4.62 While the internet and price comparison sites can play a role in promoting competition, both firms164 and consumers165 voiced concerns about the independence and reputability of such sites. In response to these concerns, the OFT has recently taken action against a number of price comparison sites, which have now improved their transparency as detailed further in paragraphs 4.153 – 4.159.166
Switching
4.63 Heating oil consumers face few contractual barriers to switching supplier. Unlike in LPG (see chapter 5), heating oil consumers own their own storage tanks, and our research suggested that very few (perhaps one per cent) are tied into contracts. The vast majority typically purchase by calling to make an order a few days before they want a delivery (sometimes called a spot purchase).
4.64 Many firms offer arrangements for automatic top-ups, or for consumers to spread the cost of their payments using a budgeting plan, but without any contractual barriers to switching. Nevertheless, these arrangements might be expected to make consumers less likely to switch – for reasons of convenience or because they are in debt to their supplier. However, the proportion of consumers surveyed with one of these arrangements is fairly low: only around 14 per cent of consumers make regular payments
163 See the SPA Report.
164 A small number of firms mentioned this in their response to our data request or in meetings we held.
165 See the SPA Report.
166 See also our press release: www.oft.gov.uk/news-and-updates/press/2011/96-11
OFT1380 | 89

to a supplier through the year to cover their oil costs, while 15 per cent have their tanks topped up automatically.167
4.65 Absent contractual arrangements, switching costs are low: consumers mentioned occasional inconveniences such as drivers not knowing the location of a new customer's tank, but overall most do not consider it difficult or inconvenient to switch suppliers.168
4.66 In practice, a sizeable proportion do switch suppliers regularly, although they are not the majority. In the SPA survey:
• 21 per cent of those with a choice of more than one supplier switch regularly.
• 54 per cent always use the same supplier, and another 25 per cent usually use the same supplier.
• Those more likely always to use the same supplier were people over the age of 65 and those that do not use the internet.
4.67 Even where consumers are not switching suppliers, they may be shopping around. Some consumers may call around to check prices, before going back to their preferred supplier and asking them to match the price.169 29 per cent of those who always use the same supplier nonetheless get multiple quotes before buying at least half the times they purchase.
4.68 Consumers do not necessarily have to switch to a rival supplier to obtain lower prices if they can do so through the threat of switching. 41 per
167 Consumer research (quantitative survey element) – see the SPA Report for details. Those using auto-top-up were more likely to say they always use the same supplier (84 per cent vs. 48 per cent for those not on auto-top-up). However, note the small sample base using auto-top-up.
168 Consumer research (focus group element) – see the SPA Report for details. 169 NI roundtable and meetings with individual firms.
OFT1380 | 90

cent of consumers surveyed said they bargain with suppliers at least some of the time, although 28 per cent have never tried to negotiate.
4.69 Firms' attitudes to negotiation also vary. Some told us that they never negotiate, or that they do so with only a small number of their customers, while others said half or even the majority of customers bargain over prices.
Buying groups
4.70 We are also aware of collective bargaining through buying groups, although consumers and industry have expressed mixed views to us.170 Our research with consumers found that:
• Many who are part of a buying group are very positive and feel they get better prices whilst maintaining the flexibility to buy ad-hoc if they want.
• Non-price benefits such as the convenience of devolving purchasing responsibilities to others were also noted.
• However, some consumers that are not part of a group (or once were but have left) do not believe groups achieve preferential rates, feel it is difficult to coordinate deliveries to meet needs, and that it can be a challenge to identify someone to organise the group and check orders.
• Buying groups are currently limited, with around 14 per cent of GB consumers in our survey buying through one of these groups, and less than five per cent in NI.
4.71 For suppliers, the attractiveness of buying groups can vary, depending particularly on factors that affect the cost of delivery:171
170 For more detail on consumers' views, see the SPA Report.
171 Discussions with firms.
OFT1380 | 91
• Where groups cover a large geographic area, the distances involved may offset the savings from larger volume orders.
• To meet varying needs within the group, buying groups can result in more frequent, small drops which are less cost effective.
• Each customer's purchase still needs to be delivered and invoiced separately so administrative cost savings are limited, and concerns can arise about coordinating timely payments and the bearing of credit risks.
• Some distributors prefer not to deal with buying groups (for example because they believe it damages customer relationships and loyalty, or because the large orders involved are impractical). We heard that some firms offer deliberately high quotes when they are unwilling, or have insufficient capacity, to deal with buying group orders.
4.72 Overall, while some groups provide a good service for their members, this means of purchasing may not be suitable for all customers. The savings the group can achieve may depend on the composition of the group and the knowledge and negotiating skill of the administrator. Guidance for consumers on how to get the best out of buying groups has recently been published by the FPS, ACRE and Citizen's Advice.172
Conclusions on consumer behaviour as a competitive constraint
4.73 Our research has illustrated the varying extent to which consumers conduct active searching and switching in the market for heating oil. Importantly, consumers feel able to understand and compare prices. However, supplier loyalty remains a strong factor in the market, and some consumers always use the same supplier.
172 Download the guidance from here: www.citizensadvice.org.uk/index/campaigns/oilclubs/oilclubs-info.htm
OFT1380 | 92

4.74 Although the threat of consumers shopping around and switching suppliers is a constraint on firms' pricing, those who shop around may pay less than those who do not, since many firms will individually negotiate prices. This issue is considered in the next section.
Unfair pricing
Price discrimination
4.75 Some consumers and a small number of firms raised concerns about the fact that the same supplier may charge different prices to different customers.
4.76 Variations across customers in the price charged for heating oil could be driven by factors including: differing costs of delivery, selective discounting, and individual customers' negotiations. Another influence is that when distributors receive customer orders, they buy oil ahead accordingly to make these deliveries. The price distributors pay to their suppliers can fluctuate during and across the day, and the price they charge the customer will tend to reflect the value of oil purchased to fulfil the order (or in stock at the time of the order). This helps to explain why people in the same locality receiving an oil delivery on the same day from the same supplier may pay different prices, because they may have ordered at different times, leading to differences in the wholesale value of the oil used to fulfil their order.
4.77 Some stakeholders raised concerns about the extent to which those who order smaller amounts tend to pay more for their oil. For example, in NI in July, the average per litre price for a 300 litre delivery was 64 pence, compared to 59 pence for 500 litres and 58 pence for 900 litres.173 Distributors in other parts of the country confirmed that they often give discounts for larger orders, and in the SPA mystery shopping exercise
173 CCNI Oil Survey – see www.consumercouncil.org.uk/oil-price-watch/
OFT1380 | 93

conducted in July, the average UK price for 500 litres was 61.4 pence per litre compared to 60.4 pence per litre for 1000 litres.174
4.78 However, a comparison of the gap between wholesale prices175 and NI retail prices176 suggests that although distributors make smaller per-litre margins on large deliveries, their total margins are higher for these bigger orders (see Figure 4.11). This suggests that while smaller buyers are paying more per litre, the distributor is receiving less per delivery.
174 See the SPA Report.
175 Wholesale jet kerosene prices.
176 Collected by CCNI.
OFT1380 | 94

Figure 4.11: NI – total retail margins per drop
£0
£10
£20
£30
£40
£50
£60
£70
£80
£90
£100
24/0
5/10
23/0
6/10
23/0
7/10
22/0
8/10
21/0
9/10
21/1
0/10
20/1
1/10
20/1
2/10
19/0
1/11
18/0
2/11
20/0
3/11
19/0
4/11
19/0
5/11
900 litres
500 Litres
300 Litres
Source: Prices collected twice-weekly from around 30 firms by CCNI, compared to jet kerosene price (OECD). Lines show: (Average price without VAT - wholesale price of jet kerosene)*(litres in the drop)
4.79 While, as noted in paragraph 4.76, there are many reasons why prices may vary between customers, we received complaints from some consumers and consumer groups that at least some element of this price variation is unfair and makes it difficult for consumers to compare firms and be confident of finding the best deal. It was suggested by some stakeholders that firms should be required to publish their prices to make it easier for consumers to compare firms' offers and to ensure that all customers of a particular firm get the same price.
4.80 Price discrimination can have a variety of effects. It can potentially boost overall consumer welfare by allowing firms to offer lower prices to consumers who may have lower ability to pay, while still covering their fixed costs. Firms' flexibility to vary their prices across customers that order on a single day also allows them to vary their prices in response to short-term fluctuations in demand, for example by reducing prices during
OFT1380 | 95

the course of the day if few customers are choosing them over competitors.
4.81 Nevertheless, price discrimination can be problematic for competition if it means that prices can be selectively discounted for those that shop around or bargain hard, which means firms can charge more to existing customers without fear of losing the custom of those that shop around. Consequently, under some circumstances price discrimination can potentially be a breach of the Competition Act or consumer protection legislation.
4.82 The evidence for price discrimination in the industry comes from a number of sources. Both firms and consumers told us some firms will reduce prices for customers who bargain hard. We received a small number of allegations that some firms charge those on auto-top-up plans substantially more than other customers. Buying groups also argue that they obtain lower prices than other customers, although this can in part be driven by lower costs to serve these groups.
4.83 The concern is that those who shop around do not constrain prices for those that do not shop around. However, several firms told us that increasing numbers of customers are switching regularly, and that it would be difficult to distinguish, at the time of calling to ask for a price, between those that are shopping around and those that aren't. And many consumers do shop around: in the SPA survey, 46 per cent said they switch suppliers at least sometimes, and 50 per cent get quotes from different suppliers at least half the times they buy. 41 per cent bargain at least some of the time.
4.84 It is our view that the most proportionate response to concerns about price discrimination is to improve price transparency for consumers using auto-top up plans and to advise consumers of the value of shopping around and bargaining for the best available price. This protects the benefits of price variation across customers (particularly for buying groups) while addressing concerns in relation to auto-top-up plans. This approach can be implemented within the existing framework of consumer law – our work with industry trade bodies on a best practice
OFT1380 | 96

approach to pricing and price information will cover, amongst other things, auto-top-up plans (see paragraphs 4.172 – 4.174).
Order sizes and affordability
4.85 While it is understandable that firms charge more per litre for smaller deliveries, we have been told by firms and consumers that people are increasingly buying heating oil in smaller amounts, which means that consumers might be paying more than they otherwise would. From firms, we heard that the average order size is around 900 litres, and among consumer respondents to the SPA survey it was a little under 800 litres. In some cases, smaller orders may be driven by small tank sizes – some newer tanks take up more space for a given capacity so that consumers wishing to minimise the space taken up by their tank are opting for smaller models. Only 20 per cent of consumers in our survey had a tank that could hold more than 1501 litres, and the average was around 1400 litres.
4.86 However, we heard from most firms we spoke to that smaller orders are often due to high prices and people's inability to afford larger deliveries, or unwillingness to pay large amounts in one go. In consequence, some consumers have complained to us about being unable to order in quantities of less than 500 litres. However, the threshold is designed to ensure that the amount of oil delivered is accurately measured. Regulations177 enforced by Trading Standards dictate the minimum volume of heating oil that can legally be delivered by road tanker using a mechanical meter.178
4.87 In NI, stakeholders told us that high prices were driving consumers to buy small quantities of oil in 20 litre drums, even though this means paying more per litre overall. While a handful of people argued that sales
177 Measuring Instruments under Statutory Instrument No. 1269:2006 (Liquid fuel delivered from road tankers) Regulations
178 www.fpsonline.co.uk/BriefingNotes/MINIMUM%20VOLUME%20DELIVERIES.pdf
OFT1380 | 97

in this way should be banned, we would not advocate removing consumers' choice over buying in this way when they are unable to get a bulk delivery, either because of delays in supply or because of limited budget.
4.88 To deal with the difficulties of budgeting for oil, most firms offer methods to spread the cost of purchases, and in NI consumers can pre-pay through Paypoint or (in most areas) through a stamp savings scheme. Stamp savings schemes are run by some councils and charities, where consumers buy stamps costing £5 or £10 to stick on a savings card. Consumers then redeem the card with a heating oil distributor that is part of the scheme. Paypoint is a pre-paid system that allows customers to pay small amounts per week to a heating oil supplier. It is similar to monthly payment plans but a bank account is not required, since payment is via Paypoint rather than direct debit.
4.89 Fuel poverty is clearly a major concern, but goes wider than heating oil and is primarily one for government rather than an enforcer of competition and consumer protection law – see Chapter 3 for discussion.
Excessive pricing
4.90 Despite a broadly positive picture of competitive conditions, the vast majority of complaints received by the study related to high prices. Consequently, we have directly examined claims that prices are excessive (that is, not reflective of cost).
4.91 The key finding is that high prices, and price fluctuations, are predominantly driven by the price of crude oil. The retail margin fluctuates in response to the market's very seasonal demand, but it accounts for only around 10 to 15 per cent of the price on average. This margin, covering both costs and profits, works out at around £55 per 900 litre delivery (see paragraph 4.110).
OFT1380 | 98

Background
4.92 Retail heating oil prices are usually quoted in terms of pence per litre, including delivery costs. At present, VAT, at five per cent, is often excluded from the headline pence per litre figure. (See paragraph 4.163 for the OFT's view of this practice. All prices in this report are inclusive of VAT). Suppliers generally vary their prices daily, and very few consumers have any form of fixed-price contract. As discussed above, it is generally cheaper to buy in bulk.
4.93 The retail price of heating oil has in essence two components: the wholesale price of heating oil and the distributor's margin.
4.94 There is no widely published wholesale price for heating oil. Distributors in the UK typically buy their heating oil from a refiner or wholesaler at a pence per litre price which is defined with reference to the international wholesale price of jet kerosene. This is the most similar (albeit, as previously explained, not directly substitutable) traded commodity for which prices are published. Pricing information for wholesale jet kerosene is collected and published by pricing agencies, based on prices paid in large trades for delivery in Europe. The traded wholesale price of jet kerosene itself closely follows the traded price of crude oil from which it derives, plus an additional refining margin.
4.95 The jet kerosene reference price used to price heating oil will typically be the price which prevailed the previous day or two days ago. For example, a heating oil distributor may have a contract to purchase heating oil at 'Platts plus X', where the Platts price is for jet kerosene and the X amount may be around two pence per litre, reflecting transport and other wholesale costs and profits as well as production cost differences between jet kerosene and heating oil.
4.96 Both crude oil and wholesale jet kerosene are internationally traded and their prices are outside the remit of this study. Nonetheless we note that
OFT1380 | 99

other bodies are currently considering how wholesale prices are reported.179
4.97 The remainder of this section focuses on analysing UK retail prices for heating oil.
The relationship between heating oil retail prices, wholesale kerosene prices and crude oil
4.98 As we have discussed the retail price of heating oil is heavily influenced by the wholesale price of heating oil. In turn the wholesale price of heating oil is driven by the wholesale price of crude oil. These relationships are shown in Figure 4.12.
179 In April 2011, the International Organisation of Securities Commissions (IOSCO) announced an investigation into commodity speculation, and will report its findings to the G20.
OFT1380 | 100

Figure 4.12: Prices of crude oil, wholesale jet kerosene and retail heating oil
0.00
0.10
0.20
0.30
0.40
0.50
0.60
0.70
Feb-08
Apr-0
8
Jun-08
Aug-0
8
Oct-0
8
Dec-0
8
Feb-09
Apr-0
9
Jun-09
Aug-0
9
Oct-0
9
Dec-0
9
Feb-10
Apr-1
0
Jun-10
Aug-1
0
Oct-1
0
Dec-1
0
Feb-11
£/li
tre
(2010 p
rices
)
Brent crudeWholesale (Jet Kerosene)Retail before dutyRetail after duty
Source: Retail price – ONS (based on a purchase of 1000 litres bought mid-month), OECD data on crude oil and Jet Kerosene (average in month)
4.99 The upward trend in heating oil prices since early 2009 is largely driven by the price of crude. Taking a longer view, since February 2000 over 90 per cent of the variation in the average national retail prices of heating oil is explained by movements in the price of crude oil (see Annexe G).
4.100 A related result is that although a number of customers complained that suppliers are quicker to pass on increases in cost associated with crude oil prices than they are to pass on the effects when the price of crude oil falls, this relationship is not evident in the data we have (see Annexe G).
4.101 The price of freely traded products is set by supply and demand. In the case of heating oil, the core ingredient, kerosene, has more than one use and is subject to demand pressures from all of those uses, not just from heating.
OFT1380 | 101

4.102 Although refiners have limited flexibility to switch production from, say, kerosene to petrol they do have some flexibility in choosing between jet kerosene and heating kerosene – currently, around three quarters of the kerosene produced in the UK goes into jet fuel and just one quarter into heating oil.180 This means the price of heating oil is strongly influenced by demand for jet kerosene. A few of the people we spoke to said they expect heating oil prices to rise over time (relative to, for example, gas oil or petrol) as a result of continuing growth in air travel.
4.103 Reflecting increasing crude and wholesale prices, retail prices have been rising over time. With the exception of a major price spike in 2008, prices in summer 2011 were higher than they have ever been (see Figure 4.13).
Figure 4.13: Retail price of heating oil
0.00
0.10
0.20
0.30
0.40
0.50
0.60
0.70
0.80
Jan-89
Jan-90
Jan-91
Jan-92
Jan-93
Jan-94
Jan-95
Jan-96
Jan-97
Jan-98
Jan-99
Jan-00
Jan-01
Jan-02
Jan-03
Jan-04
Jan-05
Jan-06
Jan-07
Jan-08
Jan-09
Jan-10
Jan-11
£/li
tre
(2010 p
rices
)
Beginning of recession - Dec 2007
Winter 2010/11
Source: DECC - www.decc.gov.uk/assets/decc/statistics/source/prices/qep411.xls
180 UK Refineries – data provided by International Energy Agency.
OFT1380 | 102

Price composition
4.104 While margins in heating oil vary (we return to this later) overall the retail margin is a small component of the total heating oil price. As illustrated in Figure 4.14, costs and profits at the level of retail distributors make up perhaps around 10 to 15 per cent on average of the final price of heating oil. Because of the large proportion of price that is determined by crude oil prices, a 10 per cent increase in the gross retail margin has only a one per cent effect on price. Note that gross margins are the retail price less the wholesale price of heating oil – distributors must cover their own costs out of this (notably staff and transport), taking what is left as profit.
Figure 4.14: Estimated price decomposition based on 2010 data
33 5 5 6 2
0.0 10.0 20.0 30.0 40.0 50.0
2010
Pence per litre
Crude oil
Refining margin
Wholesale margin
Retail margin
Duty
65% 10% 10% 10-15% 5%
Source: OECD, ONS, data provided by firms. The crude price shown is the average daily price of Brent crude; refining margin is the average daily gap between wholesale jet kerosene and Brent crude; the wholesale margin is the gap between average buying price (weighted by volumes) indicated by firms who responded to our data request, and the average daily wholesale jet kerosene price; the retail margin is the gap between average buying and selling prices provided by firms who responded to our data request, weighted by volume; duty – (monthly average of implied duty, calculated from retail prices collected once a month) – ONS. Note: the crude value
OFT1380 | 103

is only a rough indication of input costs, since kerosene is one of a basket of products made from crude oil. May not sum to 100 per cent because of rounding (to the nearest five, reflecting the uncertainty of the estimates).
4.105 Compared with the price of petrol, very little of what consumers pay for heating oil is made up of tax. For that reason, heating oil prices are more responsive to changes in crude oil prices, and therefore more volatile.
Seasonality
4.106 A key feature of heating oil demand is that it is seasonal, with demand concentrated in the winter months (see Figure 4.15).
Figure 4.15: Average UK monthly volumes 2005-2010
0
100
200
300
400
500
600
January February March April May June July August September October November December
Thou
sand
tonn
es
Source: DECC, DUKES Table 3.13 Deliveries of burning oil kerosene for inland consumption
4.107 Prices appear to be less seasonal than demand, and in fact their variations across the months have been dominated by the effect of crude oil prices, which are not necessarily higher in winter (see Figure 4.16). Only after controlling for the price of crude oil, does the effect of seasonal demand (through temperature) show. Temperature is a proxy
OFT1380 | 104

for demand, since demand rises when temperature falls. After controlling for the price of crude oil, retail prices rise as temperature falls and demand rises.181
Figure 4.16: seasonality in crude oil and retail heating oil prices
-2.5
-2
-1.5
-1
-0.5
0
0.5
1
1.5
2
Jan Feb Mar Apr May Jun Jul Aug Sep Oct Nov Dec
Ave
rage
dev
iatio
n fo
r th
e m
onth
, fr
om t
he 1
3 m
onth
mov
ing
aver
age
Retail (average 1999-2010)
Brent (average 1999-2010)
Source: Crude oil data taken from OECD, retail heating oil prices, ONS, de-seasonalised by removing 13 month moving averages.
4.108 Underlying mild seasonality in prices there is strong seasonality in retail margins, which are the focus of retail competition. Firms told us that the profits they make from domestic heating oil during winter compensate for very low returns or losses during the summer months. This is supported by the data we have seen and reflects the fact that revenue is
181 For details see Annexe G.
OFT1380 | 105

strongly seasonal (with both volumes and prices182 higher in winter) while firms incur many of their costs throughout the year.
4.109 Based on public data, Figure 4.17 shows differences between retail and wholesale prices that range from negative in the quieter summer months to eight pence per litre and higher in the busy winter months. This is in contrast to a lack of seasonality in the gap between wholesale kerosene and crude oil prices, perhaps because the majority of demand for kerosene comes from aviation (where demand is only slightly seasonal, and higher in summer) rather than from heating oil.183 The data we received from individual firms showed a similar story about retail margins being seasonal, but with a wider range of variability. Margins last winter are discussed in more detail below.
Figure 4.17: gaps between crude oil, wholesale jet kerosene, and retail heating kerosene prices
-0.07
-0.02
0.03
0.08
0.13
0.18
Feb-08
Apr-0
8
Jun-08
Aug-0
8
Oct-0
8
Dec-0
8
Feb-09
Apr-09
Jun-09
Aug-0
9
Oct-0
9
Dec-0
9
Feb-10
Apr-10
Jun-10
Aug-1
0
Oct-10
Dec-1
0
Feb-11
£/li
tre
(2010 p
rices
)
Wholesale minus crude
Retail minus wholesale
Duty
Source: OECD (Crude oil and jet kerosene), ONS (retail heating kerosene).
182 After controlling for the price of crude oil.
183 DUKES Tables 3.13 Deliveries of petroleum products for inland consumption
OFT1380 | 106

4.110 Because of seasonality, it is therefore important to look at average margins across the year to assessing their overall adequacy. We asked retailers the prices at which they buy184 and sell kerosene. The average gap between the two (weighted by volumes) was approximately six pence per litre in 2010185 (less in 2009). For a 900 litre delivery186 of oil, this implies gross margins of around £55 per delivery (more on larger and less on smaller deliveries) or about 10 per cent. There are no like for like industries with which it is possible to compare the heating oil distribution industry, so there is no litmus test for whether 10 per cent is high or low. We would note, however, that 'gross margins' in mains gas retailing are on average 20 per cent187 and that for the road haulage industry the gross margin is on average 43 per cent188.
Financials
4.111 Determining the profitability of a firm's domestic heating oil business requires detailed cost data. This data is challenging to isolate, as a distributor's assets (for example, depots) and costs (for example, staff) are shared across different products which are sold to domestic and commercial customers. Although we requested the necessary detailed information from a small number of firms, the difficulty of allocating costs and a limited response to our data request has required that we exercise caution in interpreting the data.
184 Compared with the international price of jet kerosene, the price that distributors buy at reflects the different specification of heating oil kerosene, and additional wholesale margins (including transport and other costs).
185 Based on the responses of 17 firms covering around 20 per cent of the market.
186 From the data provided to us by firms, the average domestic drop size seems to be around 900 litres, although it varies across the year.
187 Based on 2010 Ofgem figures.
188 Based on FAME data.
OFT1380 | 107

4.112 For the firms that did answer our questionnaire the data show:
• Domestic heating oil is not the main source of revenue.
• Gross margins on domestic sales are slightly higher than for other heating fuel sales, although drop sizes are smaller (and therefore cost per drop for the supplier are higher).
• Profit before interest and tax on commercial sales is often low or negative (loss making).
• Profit earned from domestic customers contributed disproportionately to the overall profit of each firm's heat fuel division.
4.113 One explanation of this might be that the commercial market is more competitive than the domestic market. However the finding relates only to a small number of firms so we would hesitate to put too much weight on it.
4.114 We were unable to obtain reliable estimates of return on capital employed (ROCE) due to the difficulty of allocating cost/capital and because the book value of capital seemed likely to understate the value of assets and over state the ROCE.
4.115 Published accounting statements for firms involved in heating oil distribution show a wide range of profitability. Although these statements do not isolate domestic heating oil (and for the largest businesses include a wide range of activities) the majority of firms issuing public accounts had a ROCE of below 20 per cent in 2010 (across all their businesses) which in our view is not excessive.
4.116 The wide range of profitability in the industry, combined with the tentative conclusions of our more detailed study, seem inconsistent with systematic and persistent conditions of excessive profitability across the industry. Although the range of results seen could be consistent with varying strengths of competition in different geographies there may be other factors, such as different business strategies and product quality,
OFT1380 | 108

driving the variance observed. Disparities in the efficiencies of firms, or in the book value of assets, could create a further distortion when comparing firms' return on investment (ROCE or ROTA). Long running firms may have comparatively low levels of debt or have highly depreciated asset bases. This could lead to variance in the return on investment observed between different firms based on the age of their capital base rather than their overall profitability.
4.117 Although overall we do not believe our evidence is consistent with excessive profitability, we are nonetheless aware that there are very specific circumstances in which prices can suddenly spike dramatically and during which consumers can exercise little or no competitive pressure. Last winter, and in particular December 2010, was one of these periods. We discuss these specific conditions in more detail in the next section.
Winter 2010/11
4.118 The harsh winter in 2010/11 caused complaint levels about the heating oil market to rise. The OFT received complaints about high prices, uncertain prices and delivery dates, and the way some firms set and agreed prices and prioritised deliveries. This section presents evidence, and our conclusions about whether the complaints were a symptom of wider competition problems. Consumer law issues that were raised with us in connection with last winter, such as lack of clarity over the price that would be charged on delivery, are addressed in the following section.
4.119 December 2010 was the coldest month since February 1986, and the coldest December in 100 years. Snow fell across the country, including in places where snow in December is rare.189 The severe weather triggered a sharp spike in demand (see Figure 4.18). 40 per cent more oil was sold in December 2010 than in December 2009 – in effect nearly 20 per cent of the year's total volume was sold in three working weeks.
189 Met Office.
OFT1380 | 109

Figure 4.18: sales of heating oil
-
100
200
300
400
500
600
700
800
Jan-9
9
Jan-0
0
Jan-0
1
Jan-0
2
Jan-0
3
Jan-0
4
Jan-0
5
Jan-0
6
Jan-0
7
Jan-0
8
Jan-0
9
Jan-1
0
Jan-1
1
Thou
sand
s of
tonn
es
Dec 2010: 40% higher volumes than Dec 09 and 5 year Dec average; 18% of 2010 sales
Source: DECC - www.decc.gov.uk/en/content/cms/statistics/energy_stats/source/oil/oil.aspx
4.120 Firms had difficulty meeting this volume of orders during a time of poor road conditions and interruptions to their own supplies.190 We heard from consumers who had difficulty in getting an oil delivery before Christmas, and some firms stopped taking new orders to cope with backlogs. The time between order and delivery rose to seven days or more, up from the usual two to three working days.191
4.121 Some consumer groups and others we spoke to raised specific concerns about the relatively low stocks of oil held in NI, with sea- fed terminals operating on a 'just-in-time' basis that could cause difficulties in poor weather. We note that firms responding to our information request did not identify this as an issue last winter.
190 See Annexe F for more detail.
191 Responses from firms.
OFT1380 | 110
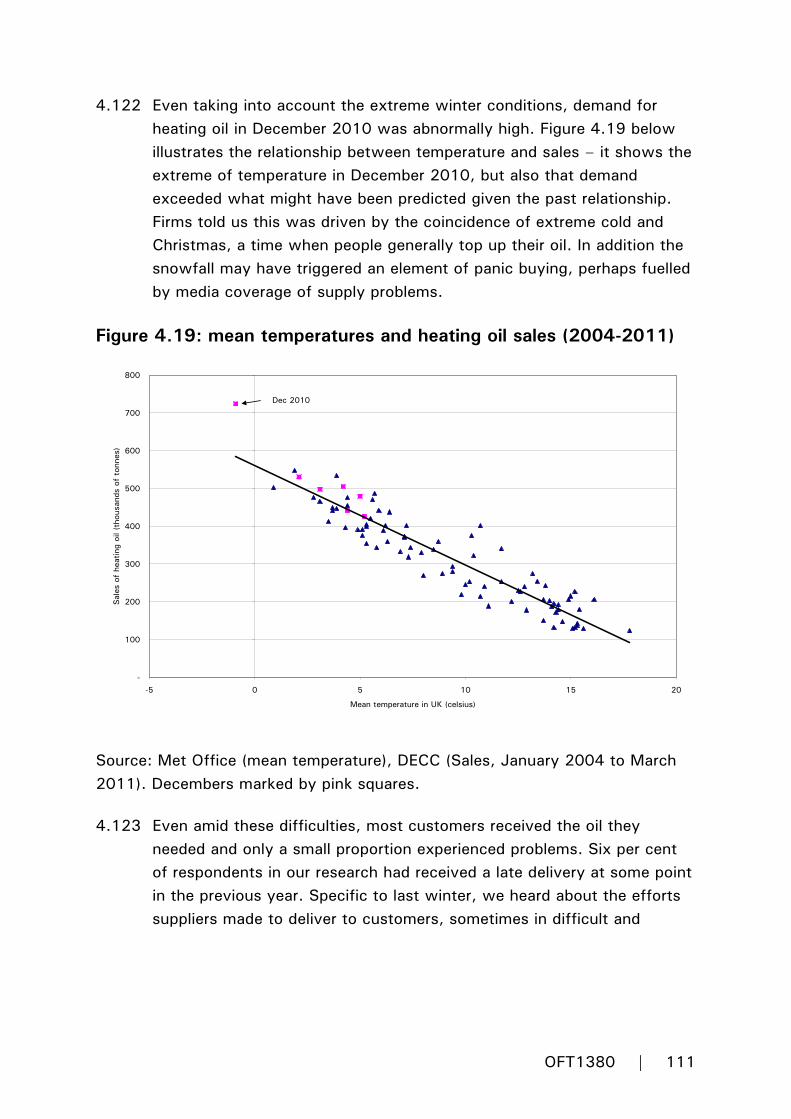
4.122 Even taking into account the extreme winter conditions, demand for heating oil in December 2010 was abnormally high. Figure 4.19 below illustrates the relationship between temperature and sales – it shows the extreme of temperature in December 2010, but also that demand exceeded what might have been predicted given the past relationship. Firms told us this was driven by the coincidence of extreme cold and Christmas, a time when people generally top up their oil. In addition the snowfall may have triggered an element of panic buying, perhaps fuelled by media coverage of supply problems.
Figure 4.19: mean temperatures and heating oil sales (2004-2011)
Dec 2010
-
100
200
300
400
500
600
700
800
-5 0 5 10 15 20
Mean temperature in UK (celsius)
Sal
es o
f he
atin
g oi
l (th
ousa
nds
of t
onne
s)
Source: Met Office (mean temperature), DECC (Sales, January 2004 to March 2011). Decembers marked by pink squares.
4.123 Even amid these difficulties, most customers received the oil they needed and only a small proportion experienced problems. Six per cent of respondents in our research had received a late delivery at some point in the previous year. Specific to last winter, we heard about the efforts suppliers made to deliver to customers, sometimes in difficult and
OFT1380 | 111

dangerous circumstances. DECC lifted restrictions on drivers' overtime to enable deliveries to be made. DECC and the industry estimate that up to a couple of thousand households (equivalent to around 0.1 per cent of heating oil users) may have run short of fuel in the lead up to Christmas, but few were without heat over the holiday.
4.124 Although most households received oil in the end, some were surprised by the price. Two concerns were raised with us: first, that the spike in prices was unjustifiable 'profiteering' by the heating oil industry, and second that during the period some firms had either refused to quote a price or had changed the price between when the order was placed and the oil was delivered. We deal with the first of these allegations in the following section. The second is addressed under 'Consumer Issues' below.
Pricing in December 2010
4.125 Prices were high in December 2010, and rose rapidly. Average prices went from around 40 pence per litre in mid October, to 52 pence per litre in mid December.192 Among those 17 suppliers that provided us with pricing data, average prices for the whole month were as high as 66 pence, and across these firms the average (weighted by volume sold) seems to have been around 60 pence per litre. Elsewhere on single days, prices of 80 pence or more per litre were reported.193
4.126 As at other times, a large proportion of December's price was made up of the price of crude oil and the wholesale refined product. However, gross retail margins also spiked significantly in December 2010, though they varied very widely across firms. Some earned up to around 20
192 ONS (for an order of 1000 litres). Though prices were higher in July 2008 and during much of 2011, far higher volumes were purchased during December 2010.
193 Article in The Times Heating oil crisis feared, 19 December 2010; House of Commons library briefing SN/SC/5806 Heating Oil, 1 June 2011; Parliamentary debate, 21 December 2010 www.publications.parliament.uk/pa/cm201011/cmhansrd/cm101221/debtext/101221-0004.htm
OFT1380 | 112
pence per litre, almost double the average in the data we saw and substantially higher than in the previous peak in January 2010.
4.127 From public data with larger sample sizes, a comparison of the retail price in December 2010194 with the international wholesale price of kerosene shows that the difference of around eight pence per litre was only 20 per cent higher than the previous year's peak of seven pence per litre.
4.128 There is little doubt that gross margins spiked sharply during the period of extreme demand. This is in part because costs also increased. Drivers of increased costs during December 2010 included reduced availability of oil at some supply points and the need to travel long distances to collect from alternative supply points, and increased time spent queuing at terminals. In response to the difficulties, the government agreed a temporary relaxation of regulations on drivers' hours, and firms incurred overtime costs. Other costs included: 195
• High volumes of customer telephone calls, requiring additional staff time.
• Difficult driving conditions making deliveries slower (and hence more expensive).
• Accidents and damage to vehicles from icy roads, which put vehicles out of action and prevented deliveries.
194 ONS – based on an order of 1000 litres, mid-month, compared with the average wholesale Platts price of jet kerosene in that month (simple average of daily prices). Note that prices include VAT.
195 Data request responses from firms, adjusted to reflect VAT.
OFT1380 | 113

• Customers ordering from multiple firms to be sure of delivery. This resulted in an increase in failed deliveries (because the tank had already been filled).196
• An increase in the proportion of small orders (on average 15 per cent smaller than the previous December) which are more costly on a per litre basis than larger orders.
• Large numbers of consumers claiming they had run out and needed to be prioritised. Prioritisation can mean less economical routing for deliveries, and some claims were false from consumers looking to gain priority.197
4.129 This is not to say that the spike in prices was driven entirely by increases in cost. In free markets prices will typically rise in response to increased demand, at least over the short term. In competitive markets the profits thus garnered can only ever be temporary, as high profits attract new firms to the industry.
4.130 In markets such as domestic energy where demand varies reasonably predictably over time, the extent to which firms are able to take profit at peak times depends on the industry's capacity to meet peak demand. Provided entry barriers are low, high profits during the peak will attract new entry – thus pushing prices down – to the point where a potential new entrant can no longer expect to make enough during the peak to turn an economic profit for the year.
4.131 Our analysis of this market strongly suggests that, while firms are able to take profits at times of peak demand, competition will constrain the extent to which they are able to do so over time.
196 Note that consumers could technically be in breach of contract in these circumstances, with firms entitled to recoup some of their costs (although firms told us they generally do not).
197 Discussions with individual firms, and responses to the data request.
OFT1380 | 114

4.132 Nonetheless, spikes in demand and prices are a feature of this market, and are difficult for consumers and firms to manage. Both can take action to reduce the likelihood of demand (in the case of consumers) and price spikes, and improve their resilience when spikes do occur.
4.133 We understand that some distributors have increased kerosene storage capacity, planned for greater provision of emergency 20 litre drums, and established an industry code of conduct for prioritising deliveries in severe weather. Representatives from all parts of the supply chain are working with DECC, for example through their Downstream Oil Industry Forum, to improve the resilience of the UK's oil infrastructure.198 The Scottish Government chairs the Resilience Advisory Board for Scotland (Fuel) which brings together the Scottish Government and key fuel distributors to discuss how to improve fuel resilience in Scotland. The UK Government has also been reviewing severe weather preparations, including for the road network, which significantly hampered the distribution of heating oil in December 2010.199
4.134 There are also steps consumers can take to smooth demand, reduce their exposure to short-term price spikes, and improve their preparedness for severe weather. These include buying early, and buying larger amounts where possible, as well as organising alternative heating in case of short-term emergency. Industry, government and consumer groups have this year issued additional concerted publicity to encourage early purchases wherever possible.200 We recognise however that consumers may be constrained from buying early by the size of their tanks (an issue mentioned by six per cent in the SPA consumer survey) or by their ability
198 For more information, see: www.decc.gov.uk/en/content/cms/meeting_energy/en_security/downstream_oil/improving/improving.aspx
199 www.dft.gov.uk/news/statements/hammond-20101221
200 See press releases for Consumer Focus: www.consumerfocus.org.uk/wales/news/campaign-aims-to-cut-costs-of-winter-heating-oil; FPS www.fpsonline.co.uk/news_details.asp?ID=266; and Oil Save www.oilsave.org.uk/news_details.asp?ID=18
OFT1380 | 115

to afford large payments (mentioned by 26 per cent), particularly if they are unwilling or unable to sign up for a budgeting plan with a distributor.
A case for regulation?
4.135 To summarise, our assessment of competition in this market is broadly positive – it is characterised by lots of competing firms (see 'Local competition' section) and low barriers to entry and expansion in most areas (see 'Entry and expansion' section). There is also a relatively high proportion of consumers that shop around and switch suppliers (see 'Consumer behaviour' section'). We have seen no evidence of collusion between suppliers.
4.136 On the question of prices, we have found that the main driver is the price of crude oil – this is, unfortunately, both volatile and rising over time, suggesting that high and volatile prices are likely to remain a feature of the heating oil market. Furthermore, demand peaks in the winter and prices rise at this time. Over the course of the year, however, gross margins do not appear excessive (see 'Excessive pricing' and 'Financials' sections).
4.137 Since we do not have evidence of collusion, and since it is not illegal to raise prices in a competitive industry, we do not believe that the complaints put to us about this industry reflect anti-competitive behaviour that breaches competition law (though should evidence of such behaviour come to light in future we would of course consider it, subject to the application of our prioritisation principles).
4.138 However, we also received representations from consumers and consumer organisations suggesting that the heating oil industry should be subject to regulation in a manner similar to that of mains gas or electricity, with the objective of constraining prices and/or margins.
4.139 On the aforementioned competition grounds we see no case for price regulation of the industry. Although high and volatile prices are clearly difficult for consumers, competition appears to be sufficient to keep
OFT1380 | 116

retail prices down to a competitive level, and competition law exists to prosecute any future anti-competitive behaviour should it arise.
4.140 Moreover the industry does not exhibit any of the usual features of regulated industries. Regulation is a solution where markets cannot be expected to work well of their own accord, for example where natural monopolies arise. This is the case for gas and electricity, where the transmission distribution networks are natural monopolies which it is not feasible or desirable for multiple firms to duplicate. It is worth noting that only these elements of the final price for electricity and gas are regulated – the commodity price (generation costs for electricity and exploration and production costs for gas) and retail costs are set in the market.
4.141 It is also worth noting that regulation would be unlikely to have a significant impact on overall prices – probably no more than is currently achievable by shopping around. This is because a price regulator would have to allow the pass-through of legitimate input costs, most notably the crude oil price.
4.142 We recognise that it is an oddity of the NI market that the most common household heating fuel, heating oil, is unregulated while electricity and gas, which are much less common, are regulated. We also recognise that regulation allows for other interventions, not just price control. For example initiatives to address fuel poverty or raise standards of conduct with respect to doorstep sales can be implemented by way of licence conditions. However, these issues do not of themselves amount to a case for sector-specific regulation. Consumer law offers significant protection from unfair trading – we discuss this in the next section.
4.143 Insofar as heating oil presents challenges for consumers in terms of high prices and volatility, it is a matter for government to consider whether further measures should be taken to support vulnerable off-grid consumers and, in the longer term, to ease the transition away from fossil fuel dependence. The Government already has a number of policies and work programmes that bear directly on these issues.
OFT1380 | 117

Assessment of consumer issues
4.144 The OFT's mission is to make markets work well for consumers. As part of that process, the OFT is under a duty to enforce legislation which is intended to protect consumers when they buy goods or services. Examples of the key legislation that could apply to the heating oil industry include:
• The Consumer Protection (Distance Selling) Regulations 2000 which protect consumers in relation to distance contracts by requiring the supplier to provide certain information to consumers prior to the conclusion of the contract.
• The Consumer Protection from Unfair Trading Regulations 2008 which prohibits suppliers from engaging in unfair commercial practices whilst providing goods or services to consumers.
• The Unfair Terms in Consumer Contracts Regulations 1999, which prohibits suppliers from using unfair contract terms in contracts made with consumers for the sale of goods and services.
4.145 We have considered in the course of this study a range of issues relating to the application of consumer protection legislation in the heating oil industry.
4.146 In particular, we have closely examined three main consumer based concerns that have become apparent during the course of the study:
• Complaints that company ownership lacked transparency.
• Concerns about the role played by price comparison sites.
• Concerns about how heating oil suppliers indicate a price to consumers, and the varying of prices between order and delivery.
4.147 We examine these points in turn below.
OFT1380 | 118

Transparency of ownership
4.148 It was put to us via consumer complaints that the ownership of multiple brands by large suppliers is not made clear to consumers, leading to confusion about choice of supplier and creating an illusion that the choice available to a consumer is greater than it actually is. We also heard complaints that consumers may want to give business to a small local supplier, and believe they are doing so, when in fact they are buying from a large national firm.
4.149 In terms of how choice matters to consumers, our research found that price is the main driver of choice of supplier but that to a fifth of consumers the identity of the supplier was a consideration,201 particularly for those consumers concerned with buying local or with security of supply.202
4.150 Many businesses use a trading name that is not the company name and a company may legally operate multiple brands in the same industry. In acquisitions the brand value is often a significant part of the value of the acquired asset and the new owner may continue to operate the old brand indefinitely. However consumer protection and other laws impose certain requirements which relate to the disclosure of business names and ownership. For example, the Consumer Protection from Unfair Trading Regulations 2008 provides that a trader must not make misleading statements. That means statements that: (a) contain information that is false, deceitful or likely to deceive, or information that omits material information; and (b) causes or are likely to cause a consumer to make a transactional decision he would not have otherwise
201 See the SPA Report – respondents were asked to think back to their last order and describe their main reasons for choosing that particular supplier. 47 per cent mentioned price, 20 per cent mentioned brand or reputation, and 13 per cent mentioned the desire to use a local supplier.
202 See the SPA Report - this issue was raised in interviews and focus groups. It was also raised in response to our data request, where some argued that small local firms are better able to cope with extreme conditions.
OFT1380 | 119
taken.203 In terms of transparency of ownership in the heating oil industry this means for example that:
• Because a supplier's identity matters to consumers (as shown in the SPA research), they should not be misled (by what is said or not said) about the identity of the supplier in a way that affects their decision about their order.
• Information about company ownership should be clearly provided on business documentation including, letters, notices invoices and on any website operated by the company. 204
4.151 A number of the complaints received from consumers highlighted GB Oils Limited which operates 42 brands, considerably more than anyone else. DCC Group Plc, the owner of GB Oils Limited, have told us that they have made the following changes to their procedures over the last 12 months, to reduce the risk of customer confusion when they contact a distributor brand owned by DCC Group Plc. For example:
• Any advertising material placed by a DCC brand (for example, an advert in the Yellow Pages for a particular area) will identify that that brand is owned by GB Oils Limited.
• The website for any individual brand owned by DCC will identify that it is owned by GB Oils Limited.
• If someone calls a DCC depot the phone will be answered with the wording 'XXXX a GB Oils brand'.
• As before, invoices sent to an individual customer will identify that the brand is owned by GB Oils Limited.
203 See regulations 5 (prohibits misleading acts) and 6 (prohibits misleading omissions) of the Consumer Protection from Unfair Trading Regulations 2008.
204 See the Companies Act 2006 and related secondary legislation.
OFT1380 | 120

4.152 We welcome these changes, which should help consumers be more confident about how much real competition there is in their area, and make informed decisions about their purchases of heating oil.
Transparency in price comparison sites (PCS)
4.153 Following concerns expressed to us about price comparison sites, we conducted a web sweep on websites offering quotes for the supply of heating oil. We identified more than a dozen such sites making a variety of claims.
4.154 The OFT would have concerns205 in particular if:
• The ownership of the sites was not clear, because they only displayed a trading name.
• The relationship between the site and other businesses providing goods and services through the site was not clear. For example whether the site was an independent intermediary or owned by a heating oil supplier.
• The number of quotes and identity of any supplier chosen on the basis of those quotes was not available.
4.155 It is important that when consumers use (or decide whether to use), a price comparison site they are able to make an informed choice – to know whether they have done enough shopping around or whether they need to look further. That requires them to know whether the site is independent of any of the companies providing quotes. It is also important that consumers know or can access how many different businesses are being compared when a quotation is given.
4.156 On the basis of our preliminary sweep we examined a subset of sites in more detail. We found:
205 For example in relation to the Consumer Protection from Unfair Trading Regulations 2008.
OFT1380 | 121

• WCF Limited which operates the website fuelfighter.co.uk, claimed to make price comparisons but only quoted prices for its own products and services. It also used false customer testimonials on the site. The website has been changed to reflect its operation as a website to order fuel from WCF Limited. The company and directors have signed formal undertakings as to future conduct.
• boilerjuice.co.uk, operated by BoilerJuice Limited, whilst a price comparison website providing quotations from GB Oils Limited as well as price quotations from other unrelated heating oil distributers, was not transparent about its links to parent company DCC Group Plc, which owns GB Oils Limited, the largest heating oil distributer in the UK. The company made changes to its website to make its ownership by parent company DCC Group Plc clear. Other changes to the website include changes to the quotation process so consumers can see how many firms are providing quotations. The company and the directors signed formal undertakings as to future conduct.
• Johnston Oils Limited, owner of the website cheapheatingoil.co.uk made changes to its website after the OFT contacted it and the OFT sent a letter of advice.
• In addition two other sites have made changes to their wording, which have addressed our concerns.
4.157 In a separate decision, DCC Group Plc has recently sold BoilerJuice Limited to the company's management, and it is now wholly independent of DCC.
4.158 As a result of these changes, the ownership of these web sites is now clear, any relationship with a business supplying heating oil is transparent and the number of quotes that have been compared is stated prominently. Needless to say, we expect the rest of the industry to take note and ensure their sites and marketing materials do not mislead.
4.159 Our press notice in September 2011 detailing the above work can be found at: www.oft.gov.uk/news-and-updates/press/2011/96-11
OFT1380 | 122

Pricing practices
4.160 We were told of occasions when firms had refused to provide a firm price before delivery, or charged a different price at delivery than was quoted at order. Our research found that a third of customers are not offered a guaranteed price for their heating oil when they place their order, and we have also seen websites that say the price charged will be the price applicable on the day of delivery.
4.161 However while it appears that many firms reserve the right to vary the price, in practice price variation is an occasional rather than widespread problem in the industry: the SPA consumer research found that only one per cent of respondents had experienced these problems last year.206
4.162 Nonetheless we did hear of instances when prices had varied quite significantly between order and delivery during the severe weather last winter, and these complaints received some media coverage early in 2011.
4.163 The Consumer Protection (Distance Selling) Regulations 2000 (DSRs)207 require that when a contract is made over the phone or internet, the consumer is given the price of the goods including all taxes.208
4.164 The Unfair Terms in Consumer Contracts Regulations 1999 (UTCCRs)209 prohibit contractual terms which, if not individually negotiated and contrary to the requirement of good faith, cause a significant imbalance in the parties' rights and obligations arising under the contract to the detriment of the consumer. In our view such an imbalance could be created by contract terms that reserved a firm's right to vary its price
206 See the SPA Report.
207 See OFT 698: A guide for businesses on distance selling
208 Regulation 7 of the Consumer Protection (Distance Selling) Regulations 2000.
209 See OFT 311: Unfair Contract Terms Guidance
OFT1380 | 123
unilaterally at a point in time when the consumer had little choice but to accept the order.
4.165 To ensure compliance with the Consumer Protection from Unfair Trading Regulations 2008 (CPRs)210 firms should provide either a firm price, or where the price cannot be reasonably calculated in advance, the way it will be calculated, since failure to do so could be a misleading action and/or omission that changes the consumer's transactional decision. In a recent case brought by Carmarthenshire County Council against GB Oils Limited (trading as O. J. Williams), it was held that the defendant did engage in an unfair commercial practice contrary to Regulation 10 of the CPRs.211
4.166 We appreciate that wholesale prices may move when there is a significant delay between order and delivery, and that at times these can move significantly. This can present difficulties for firms. However, we understand that such delays occur only infrequently, and many suppliers adhere to agreed prices even under these circumstances.
4.167 The OFT has previously published guidance on price variation clauses within the UTCCRs. In essence the law requires firms to fix a price with the consumer, or to ensure that the customer has adequate cancellation rights if the price increases. In our view adequate cancellation rights means allowing the consumer sufficient time to find an alternative deal.
4.168 We also note that when people buy oil via prepayment or auto-top-up plans (to spread costs or avoid having to monitor fuel levels) they should be told the basis on which the unit price is calculated, and be able to make informed choices about the value of their plan relative to non plan
210 See BERR (2008), Guidance on the Consumer Protection from Unfair Trading Regulations 2008 p.37 paragraph 7.33
211 Carmarthenshire County Council v GB Oils Limited t/a OJ Williams, Ammanford Magistrates Court, 15 August 2011. For more information on this case see www.tradingstandardswales.org.uk/prosecutions/carmarthengboils.cfm
OFT1380 | 124

prices. Consumers taking up such plans should not be subject to unclear or onerous contract terms or unfairly prevented from leaving the plan.
4.169 We are currently examining these and related pricing practices.
4.170 We are also working with the industry trade bodies to ensure understanding of and compliance with consumer protection legislation.
Self-regulation
4.171 The OFT and Local Authority Trading Standards have taken enforcement action in this sector, and will continue to do so. Building on these, we believe the industry itself can do more to ensure compliance with existing legislation, help consumers get the best service possible, and reassure customers that they are getting a fair deal.
4.172 During our study we have consulted with the main trade bodies for heating oil distributors – the FPS in GB and the NIOF in NI. The FPS has an existing code of practice, with additional commitments relating to supply in severe weather.212 The NIOF has been in discussion with the CCNI about developing and publishing a code of practice.213
4.173 Our own discussions have focused on the demands of consumer protection law in relation to agreeing prices before delivery. Both bodies are engaging with us and beginning work to strengthen compliance, with the support of firms in the industry. Drawing on our previous experience of successful self regulation,214 we are supporting the FPS to formulate
212 www.fpsonline.co.uk/Code%20of%20Conduct.pdf and www.fpsonline.co.uk/BriefingNotes/CODE%20OF%20PRACTICE%20FOR%20SUPPLY%20OF%20HEATING%20OIL%20IN%20ABNORMAL%20WEATHER%20AND%20SUPPLY%20CONDITIONS.pdf
213 www.consumercouncil.org.uk/energy/newsroom/item/646/a-joint-statement-from-the-consumer-council-and-northern-ireland-oil-federation/
214 See OFT 2009, Policy statement - The role of self-regulation in the OFT's consumer protection work (OFT 1115)
OFT1380 | 125

high standards around pricing practices, and to develop its capacity to deliver training, monitoring and enforcement. The FPS also aims to draw consumer bodies into discussions on a wider set of issues and has already successfully worked with Citizen's Advice to engage consumers on the subjects of buying groups and stocking up early for winter.
4.174 We will continue to engage with both the FPS and the NIOF to ensure their members are aware of their legal obligations.
OFT1380 | 126

5 LIQUEFIED PETROLEUM GAS (LPG)
Summary
5.1 In 2006 the Competition Commission (CC) published the findings of its market investigation into competition in the supply of domestic bulk LPG.215 Given the in-depth nature of that investigation, we have focused on developments since then, and on areas that the CC investigation did not cover, namely competition issues in cylinder LPG, and consumer protection issues in the supply of domestic bulk LPG.
5.2 Our key findings are as follows:
• For domestic bulk LPG, the CC investigation identified competition problems in the market and introduced remedies to address these problems. These remedies were implemented by means of two Orders governing the supply of domestic bulk LPG to individual tank customers and customers on metered estates respectively.216 We have looked at the initial impact of the Orders, which came into force in 2009. While it is too early to draw firm conclusions, the Orders appear to have substantially increased switching rates for individual tank customers but have had less impact on switching rates for metered estate customers. The OFT will continue to undertake its statutory duty to keep under review the effectiveness of and compliance with the Orders.
• We also considered consumer protection issues in connection with the supply of bulk LPG. The OFT has concerns that some contract terms may not be entirely consistent with consumer protection
215 Market investigation into supply of bulk liquefied petroleum gas for domestic use, June 2006 (the CC Report). The CC Report is published at: www.competition-commission.org.uk/rep_pub/reports/2006/514lpg.htm
216 www.competition-commission.org.uk/inquiries/current/gas/lpg_order_final.pdf and www.competition-commission.org.uk/inquiries/current/gas/notice_order_metered_estates.pdf
OFT1380 | 127

legislation. We are engaging with suppliers to seek, where necessary, improvement in the clarity of contract terms, particularly concerning cancellation and switching rights. Among other things, adequate and clear cancellation and switching rights ensure that consumers have options in the event of their supplier varying the price of LPG within the term of its supply contracts.
• We found that cylinder LPG is relatively little used as a primary source of domestic heating, and conversely that the domestic heating market is a small part of a much wider and predominantly commercial market for cylinder LPG.217 We have not sought to draw definitive conclusions about the wider market. Nonetheless, some features are worth noting. There are few cylinder LPG suppliers upstream and some domestic cylinder LPG users have a limited choice of retailers downstream. Furthermore, distribution and retail arrangements for cylinder LPG are heavily constrained by vertical agreements that in effect require dealers to deal exclusively with one supplier. Given the concentration in the upstream market, these agreements could potentially restrict competition. The OFT may return to these issues in the context of the wider cylinder LPG market at a later date (subject to OFT prioritisation principles).
Introduction
5.3 LPG performs the same household functions as mains gas, but is delivered by road and stored on individual premises. It is either obtained as a by-product when refining crude oil at refineries and petrochemical plants, or directly from North Sea oil or gas wells. It is subsequently delivered from the supply points in liquefied form to a primary storage facility where it is stored by a process of refrigeration or pressurisation. It is then ready for purchase by resellers. Once purchased, the LPG is usually delivered to bulk distribution depots and cylinder-filling plants,
217 This is taken from Appendix C of the CC Report. More detail relating to the supply chain can be found in this Appendix.
OFT1380 | 128

some of which are combined on large sites, by means of large bulk road tankers.218
5.4 There are two types of LPG – propane and butane. According to the website of the UKLPG, which is the trade association for suppliers of LPG in GB:219
• 'Propane is used primarily for central heating, hot-water, gas-fires, convector heaters and for cooking.
• Butane is used mainly in cylinders for portable applications in mobile heaters in the home, and for leisure activities such as boats, caravans and barbecues.'
5.5 Our study concerns the use of LPG as a fuel for domestic heating purposes. Hence, this report focuses on propane gas, which is the main type of LPG used for this purpose, and references to LPG in the remainder of this section should be construed as referring to propane gas (unless otherwise stated).
5.6 Households can be supplied with LPG in two different forms:
• Bulk (tank) LPG, where propane gas is delivered by tanker to an external storage tank on the customer's premises, which may be sited above or below ground. This is the most common domestic form of LPG used. In 2006, the domestic supply of bulk LPG was the subject of an investigation by the CC, resulting in the implementation of remedies aimed at improving competition in the market.
• Cylinder (bottled) LPG: this is usually delivered to households in pre-filled gas cylinders and tends to be used in locations where a
218 This is taken from Appendix C of the CC Report. More detail relating to the supply chain can be found in this Appendix.
219 www.uklpg.org/exceptional-energy/what-is-lpg
OFT1380 | 129
customer is unable to site a tank, or where tanker access is an issue. Various sizes of cylinder can be purchased for home heating: large (typically 47 kg) sizes for central heating and smaller sizes (including 7 kg and 15 kg butane cylinders) for indoor room heaters. Small propane cylinders are also available for patio heaters. Per energy unit, cylinder LPG is more expensive than bulk LPG and it is used by far fewer homes.
5.7 Around 150,000 households220 use bulk LPG and 25,000221 to 50,000222 households use cylinder LPG for heating purposes in the UK. It is unlikely223 that households would switch from one to the other, as bulk is cheaper and generally preferred, while cylinder is mainly used where bulk cannot be supplied, for example due to space constraints.
5.8 The distribution of households using LPG across the UK is shown in the following map.
220 CC Report, paragraph 2, page 3. The CC Report also found that an estimated one per cent of households in NI use bulk LPG—2.5 per cent of those outside the mains gas network (paragraph 1, appendix H).
221 OFT estimate based on the difference between the figure given in the Consumer Focus Report for bulk and bottled LPG households in GB and the number of bulk LPG households estimated in the CC Report.
222 Supplier responses to OFT information requests, based on returns from at least 85 per cent of the market.
223 Albeit possible, as we have heard of a few such instances from consumers and suppliers.
OFT1380 | 130

Figure 5.1: UK map of domestic LPG use (both bulk and cylinder)
Source: UK Emission Mapping Methodology 2009, AEA, Ioannis Tsagatakis, Tony Bush, Helen Walker, Neil Passant, Nicola Webb and Daniel Brookes. Refer to Annexe B for detailed underlying source explanations.
5.9 LPG is attractive for its versatility, as the same supply can be used for cooking as well as for heating. LPG also produces lower levels of emissions than heating oil. However, it is costly to heat an average home using LPG relative to other off-grid fuels.224 As with heating oil, consumers have raised concerns with the OFT that LPG prices have increased sharply in recent times. While Annexe J shows that such price increases are correlated with underlying input cost rises, such concerns will be considered further later in this chapter.
5.10 The rest of this chapter considers the market for LPG in bulk and cylinder form separately, given the significant differences in their retail structure and customer base.
224 Sutherland Tables data, July 2011.
OFT1380 | 131

Bulk LPG
Introduction
5.11 In July 2004, the OFT made a Market Investigation Reference (MIR) to the CC under section 131225 of the Enterprise Act 2002 of the supply of domestic bulk LPG.226 The CC published its final report in June 2006 (the CC Report)227 and the resulting Orders took effect in 2009.228
5.12 The CC's inquiry was detailed and we have not sought to replicate the analysis. The scope of our study in respect of the Orders is limited to assessing the initial impact and considering evidence of compliance. Our analysis in this market study does not constitute a formal review of the Orders resulting from the CC's inquiry, as it is too early (less than two years after the later Order took effect) to conduct such a review. Nonetheless our findings provide useful early feedback to inform our future monitoring of the Orders.
5.13 Our study has also considered consumer protection issues that have been raised with us in the course of our study.
5.14 The remainder of this section sets out:
• An overview of the CC's investigation and its key findings.
225 Under section 131 of the Enterprise Act, the OFT may make a market investigation reference to the CC where it has reasonable grounds for suspecting that any feature, or combination of features, of a market in the UK for goods or services prevents, restricts, or distorts competition in connection with the supply or acquisition of any goods or services in the UK or a part of the UK.
226 Further information about the OFT's July 2004 Market investigation reference on the supply of liquefied petroleum gas to domestic bulk storage tanks can be found at: www.oft.gov.uk/OFTwork/markets-work/references/liquefied-petroleum
227 www.competition-commission.org.uk/rep_pub/reports/2006/514lpg.htm
228 See Annexe I for more details of the CC Orders.
OFT1380 | 132

• Background context based on the CC Report, describing the market structure at that time and any significant changes since then.
• Our analysis of the initial impact of the Orders, assessing the extent to which companies are complying with the Orders and the impact of the Orders to date on indicators such as switching behaviour.
• Consumer evidence to our market study, focusing on potentially unfair contract terms where we have received a number of complaints.
The CC's investigation and its key findings
5.15 The CC's investigation concluded that there were features of the domestic bulk LPG market which adversely affected competition. As evidence of weak competition, the CC found that each year only around three per cent of the major suppliers' customers ended their supply arrangements, and that only one in six of these (0.5 per cent of the customer base) did so to switch to an alternative LPG supplier.229
5.16 The CC found the following features which resulted in weak competition:
• Up-front charges to customers (meaning that the costs of removing and installing tanks were borne by the customer).230
• Poor customer information about switching. LPG suppliers did not provide information to customers concerning their right to switch; pricing information from other LPG suppliers was difficult to obtain; and, in some cases, customers incurred search costs for finding a cheaper supplier.
229 Paragraph 4.14 of the CC Report.
230 Paragraph 4.49 of the CC Report.
OFT1380 | 133

• Contractual restrictions on switching, which included lengthy fixed minimum terms in introductory contracts.
• Selective discounting – most suppliers offered selective discounts to customers. These can reduce the potential rewards to competitors' efforts to win customers away from their current suppliers, and thereby discourage firms from competing to win customers from one another.
5.17 The CC concluded that most customers in the market were paying higher prices than would be the case if these features did not exist.
5.18 To address its concerns, the CC introduced a package of remedies in the form of two Orders. These were aimed at easing switching between LPG suppliers by providing for a timely tank transfer or removal process at no cost to the customer, standardising and improving the information suppliers must provide to their customers on the switching process, and changes to all customer contracts to enable easier switching.231
5.19 Separate Orders were made in respect of domestic supply to each of two distinct customer groups and took effect in 2009:
• The Domestic Bulk Liquefied Petroleum Gas Market Investigation Order 2008 (the 2008 Order) applied to bulk LPG customers with their own dedicated tank, who represent around 91 per cent of the bulk LPG customer base.232 This Order came into force on 13 April 2009.233
• The Domestic Bulk Liquefied Petroleum Gas Market Investigation (Metered Estates) Order 2009 (the 2009 Order) applied to bulk LPG customers on a metered estate, who represent around nine per cent
231 See Annexe I for further details.
232 Paragraph 3.17 of the CC Report.
233 www.competition-commission.org.uk/inquiries/current/gas/lpg_order_final.pdf
OFT1380 | 134

of the bulk LPG customer base.234 This Order came into force on 6 November 2009.235
5.20 The OFT has a statutory duty to keep under review undertakings and Orders made following an MIR, and consider whether these have been or are being complied with. For the domestic bulk LPG Orders, this has involved:
• Working with the industry to raise awareness of LPG suppliers' obligations under the Orders.
• Collecting annual switching statistics from suppliers236 to help assess the effectiveness of the Orders over time.
• Helping consumers, who may be affected by the Orders, to understand their rights. The OFT has published advice on both the Consumer Direct and the OFT website in the form of frequently asked questions (FAQs)237 on how consumers can switch supplier.
5.21 More details regarding the CC's investigation and the OFT's role and activities undertaken in monitoring the Orders since their inception are provided in Annexe I.
234 The term 'metered estate' is used to describe a number of possible arrangements whereby suppliers supply via an intermediary. In some case the supplier supplies the customer directly through a central fixed storage tank which also supplies other customers. In other cases, the supplier's customer may be an intermediary such as developer or an estate owner who resells the LPG to customers on an estate. This arrangement is common, for example, on park home estates.
235 www.competition-commission.org.uk/inquiries/current/gas/notice_order_metered_estates.pdf
236 Further details of the information required sought from LPG suppliers annually can be found at Schedule 3 of the 2008 Order and Schedule 2 of the 2009 Order.
237 LPG Frequently Asked Questions can be found on the OFT website at: www.oft.gov.uk/shared_oft/monopolies/OFT-Domestic-bulk.pdf
OFT1380 | 135

Market structure
5.22 The logistics of bulk LPG supply require the supplier to use a depot. In its report, the CC noted that a depot can supply domestic customers economically to a range of up to 100 miles, although in practice companies tend to focus their activities more locally than this. Nonetheless, no distinct local or regional markets were identified by the CC, with prices being broadly similar in all regions of GB and within NI. The investigation concluded that the relevant markets were the supply of domestic bulk LPG in GB and NI.238
5.23 The CC report found that:
• In GB, four major national suppliers – BP LPG UK (BP), Calor Gas Limited (Calor), Flogas UK Limited (Flogas) and Shell Gas Limited (Shell) – supplied around 90 per cent of the market. Of these, BP and Shell operated at all levels of the distribution chain and Flogas and Calor operated only at the retail level.239 Around 20 smaller companies supplied the remaining 10 per cent, generally on a more regional or local basis.
• NI had only two suppliers of bulk LPG – Calor Gas NI (CGNI) (supplying the majority of customers) and Flogas NI. There was very little cross border trade between Ireland and NI.
5.24 One important difference between the bulk LPG and heating oil markets is therefore concentration in supply. Whereas the heating oil market is fragmented, the bulk LPG market is highly concentrated.
5.25 Suppliers told us that the market had not changed significantly since the CC Report, apart from increased switching as a result of the Orders, so that its findings as to market structure remain generally valid. Evidence
238 Paragraphs 3.12-3.14 of the CC Report.
239 Appendix C of the CC Report.
OFT1380 | 136

presented to us suggests some gradual growth of smaller players at the expense of the major suppliers in recent years. According to their own figures for the number of households supplied, the four major companies supply over 85 per cent of households in GB, down from around 90 per cent in 2003.240
5.26 The CC conducted some analysis on the choice of supplier faced by consumers.241 Taking 50 miles as a conservative estimate of the range over which a depot supplies, data provided by suppliers indicated that there were few depots which do not overlap with others in their range of supply, suggesting that most consumers have a choice of supplier and there is a continuous chain through most of GB. However, the SPA research found that consumers in rural areas often knew of only one supplier in their area242 – this may reflect a combination of lack of awareness of options, and genuinely little choice in some areas.
5.27 The majority of customers now sign two year exclusive contracts with their supplier (the maximum period of exclusivity allowed by the Orders) and under those contracts the supplier usually retains ownership of the tank. We are aware of some instances where customers own and take responsibility for their own tank but, as the CC Report indicated, in this situation, the protections for tank safety afforded by the existing regime are diminished.243
Implementation of and compliance with the Orders
5.28 In making an assessment of the extent to which companies are complying with the terms of the Orders, we asked suppliers a number of questions relating to their experience of the Orders. We also asked for
240 Data based on company returns and Appendix F3 of the CC Report.
241 Appendix E, paragraph 21 of the CC Report.
242 SPA Report, slide 53.
243 CC Report, paragraph 5.28 and Appendix D.
OFT1380 | 137

documentation and any other evidence demonstrating their compliance with the Orders. Table 5.2 provides a summary of some of the evidence reviewed during our study and our findings.
Table 5.2: Review of evidence on compliance
Evidence reviewed Findings
Company concerns and opinions about compliance or implementation issues.
Companies are concerned that competitor behaviour should be in line with the Orders so that they compete on a level playing field.
Documentation required in order to complete tank transfers is not always forwarded as quickly as possible.
At times the quality of documentation provided is poor.
Satisfaction levels (rated out of 10, where 10 is the best possible score) with the timeliness of the notices, statements and documentation (as required by the Orders) provided by competitors during the switching process.
On average, respondent companies rated their level of satisfaction with the timeliness of documentation required for switching as eight out of 10.
Ratings ranged from four to 10 out of 10.244
Satisfaction levels (rated out of 10, where 10 is the best possible score) with the quality of documentation on the age, condition and work done on the tank provided by competitors during the switching process.
On average, respondent companies rated their level of satisfaction with the quality of documentation required for switching as eight out of 10.
Ratings range from seven out of 10 to 10 out of 10.245
244 This figure is based on a sample size of eight companies, covering at least 90 per cent of the market.
OFT1380 | 138

OFT review of core documents:
• Current standard terms and conditions
• Current standard customer invoices
• Copies of letters sent refusing a request to switch due to lack of eligibility
• Standard customer letters sent prior to termination of fixed term contracts or when exclusivity periods are coming to an end.
In parts some of these do not comply fully.
Some letters sent towards the date of expiry of exclusivity do not state clearly that customers have the option to switch.
Details on how companies have implemented the requirement to provide a telephone enquiry line
All companies which responded, including the major suppliers, gave details of their telephone enquiry service
Source: OFT analysis of supplier documentation and information
5.29 In line with the CC Orders, information on the Orders, the switching process and LPG suppliers in regional areas can also be found on the UKLPG website.
5.30 Though our assessment has been brief, the emerging picture on compliance with the Orders is broadly positive and companies appear to be taking the Orders seriously. In general, companies are satisfied with the timeliness and quality of documentation supplied to them when they are acquiring tanks from outgoing suppliers. Although there are some shortcomings, companies are broadly implementing what is required.
5.31 Where issues have been identified, the OFT will continue compliance discussions with industry and will continue to monitor progress going forward. Our overall approach to monitoring and enforcement of the
245 This figure is based on a sample size of seven companies, covering at least 50 per cent of the market.
OFT1380 | 139

Orders is to encourage firms and customers to resolve issues, in the first instance, with a sliding scale of further intervention depending on the seriousness and persistence of any breach:
• Where issues have been identified by consumers (or their representatives) which point to possible non-compliance, the OFT will advise consumers of the general rights afforded to them by the Orders although it cannot intervene in individual disputes. The OFT may ask to be kept in touch with any developments to ensure that a breach of the Orders has been averted and any misunderstandings cleared up.
• If the issue persists, and if the OFT has not already done so, we may pursue it with the supplier(s) concerned. If evidence of a breach is found, we will ask that it is put right as soon as possible. In more serious cases we may publicise the breach and the action taken to rectify it. In any event, such cases might also cause us to review our guidance to consumers on their rights under the Orders.
• Should a breach still persist, OFT would discuss with the CC the possibility of the CC issuing directions to require compliance, for instance as per Article 21 of the 2008 Order.
Initial impact of the Orders
5.32 In this section we consider the available evidence on the initial impact of the Orders. We look at the following indicators:
• consumer awareness of the Orders
• switching data
• pricing behaviour.
Consumer awareness of the Orders
5.33 Our consumer research suggested little awareness of the CC Orders among customers, although we note that this finding is based on
OFT1380 | 140

qualitative interviews with a small number of bulk LPG customers, few of whom had considered switching. However, interviewees generally viewed the Orders as advantageous when described to them and thought that they would make switching more attractive for them in future. The Orders are still relatively new and with continued efforts from industry and industry bodies,246 we expect customer awareness to continue to grow which, given consumer reaction from the SPA research, should encourage switching.
Switching data
5.34 The CC in its investigation noted the considerable costs faced by customers wishing to switch supplier. These included charges for installation and removal of tanks and the inconvenience caused by this. The CC noted that the average cost of installing a tank ranged from £250 to £650 whilst removal cost around £200 to £250.247 Costs involved in cancelling contracts and uncertainty around the switching process also contributed to customers' unwillingness to change supplier.248
5.35 The CC found that customers on metered estates may face an additional barrier to switching in the need for agreement between all customers on a metered estate to be reached before a switch can take place. The CC also acknowledged a potential countervailing factor which may facilitate switching on metered estates.249 If residents on a metered estate work together they can achieve lower prices and share some switching costs (including non-monetary costs such as time taken to shop around)
246 Information on the Orders is provided by companies and available through the UKLPG website at: www.uklpg.org/advice-and-information/how-to-switch-lpg-supplier
247 CC Report, paragraph 4.7.
248 Table 1 in Appendix G of the CC Report gives full coverage of switching costs faced by customers at the time of the report.
249 CC Report, paragraph 4.13.
OFT1380 | 141

between properties on a particular estate, thus reducing the cost per household of switching.
5.36 At the time of the CC Report, switching rates for bulk LPG consumers were low. In GB, only one in every 200 of the major suppliers' individual tank customers switched to an alternative supplier each year, amounting to only 0.5 per cent of the customer base in 2003.250
5.37 The Orders were devised with the aim of reducing switching costs, thus easing consumers' ability to switch LPG supplier. An important factor in determining the impact of the Orders therefore is to review the switching rates of customers to see if these have increased since implementation.
5.38 The OFT is responsible for collecting annual switching statistics for both individual tank customers and metered estates, from suppliers. We therefore have two sets of data on which to base a preliminary assessment.
Individual tank customers
5.39 Table 5.3 provides a summary of individual tank switches in the UK across all bulk LPG companies since the 2008 Order was implemented. (Note that the timing of the introduction of the Orders means that the figures for 2009-10 represent only part of a year.)251
250 CC Report, paragraph 4.14.
251 For more information on the switching data collected, please refer to Annexe I.
OFT1380 | 142

Table 5.3: Incidence of switching amongst individual domestic bulk LPG customers in the UK since implementation of the Orders
Total number of domestic bulk LPG customers
Switches as per cent of the customer base
2009-2010 2010-2011 2009-2010 2010-2011
All switches away from companies
4751
5929 3.7% 4.1%
Source: OFT analysis of annual returns from suppliers to the OFT under the Orders
5.40 The data in Table 5.3 include not just customers switching between bulk LPG suppliers but also those switching from other fuels, such as heating oil, to bulk LPG and vice versa.
5.41 We have sought to isolate the annual number of customers of the major LPG suppliers who switched between bulk LPG suppliers for comparison with the CC's equivalent estimate of 0.5 per cent of GB customers in 2003. In GB, 3.7 per cent of individual customers of the major suppliers switched between bulk LPG suppliers in 2010-2011, confirming that the Orders appear to have stimulated a substantial increase in switching in the GB market. However, data collected for NI show lower switching rates, with only around 1.2 per cent of customers switching away from their supplier (either to another fuel or to another LPG supplier) in 2010-2011. One supplier stated their view that the low rates are indicative of customer satisfaction. We have not sought to study variations in switching rates by market in detail. We note that low switching rates in NI are consistent with findings at the time of the CC Report.252
5.42 The data also show smaller suppliers gaining customers. In some cases, gains made are large. More than 10 smaller suppliers have expanded their customer base by more than 10 per cent since the Orders were
252 Refer to paragraph 4.45 and Appendix H of the CC Report.
OFT1380 | 143
introduced.253 In contrast, the major suppliers have either lost customers or achieved only small increases in the number of customers served. Smaller suppliers we spoke to confirmed that customers are switching to them. Additionally, we are aware of at least two firms who have entered the market since the Orders were introduced and we have heard from at least one other supplier that the Orders make the market a more attractive prospect for future entry.
Health and safety compliance
5.43 In considering the ease of switching under the Orders, several suppliers and consumers noted that the location of tanks, in positions that are not compliant with industry codes of practice on health and safety, can prevent switching. For example, building work or plant growth close to a tank may have rendered it non-compliant over time. A new supplier can exercise its rights to refuse to take on a non-compliant tank and in this case will not accept the new customer until the tank is repositioned in a compliant manner.
5.44 Suppliers indicated that the proportion of non-compliant tanks among customers wishing to switch appears substantial. Suppliers also indicated that customers' reluctance to re-site the tank (or the impossibility of re-siting the tank in a compliant manner) hinders switching, as the customer will generally prefer to avoid the costs and disruption of tank relocation by remaining with their existing supplier who will still supply the tank. The incidence of such situations suggests that the policy of companies differs so that whilst one supplier may be willing to take on or continue supplying a tank, others may not; and it is often only when a customer tries to switch, triggering a formal assessment of the tank, that the issue is highlighted.
5.45 We discussed this matter with the Health and Safety Executive (HSE). When approached for a view, the HSE has advised customers to explore the reasons why an incumbent supplier considers the tank compliant and
253 Based on annual returns from suppliers to the OFT under the Orders.
OFT1380 | 144

that these points could then be put to the new potential supplier. The new potential supplier is then in a position to consider this information but is not bound by another supplier's opinion and can make their own judgements.
Metered estate customers
5.46 We also considered the switching data for metered estate customers, 254 as summarised in Table 5.4. In total only 30 metered estates (mainly in GB) have switched away from their supplier since the implementation of the 2009 Order, whether to LPG to other fuels. Among these we have estimated that in GB 0.7 per cent255 of metered estate customers of the major suppliers switched to an alternative LPG supplier in 2010-2011. There is no comparable figure from the CC Report, but we note that the percentage of switchers away from companies has dropped over the two years that statistics have been collected – although this may also reflect that most estates wanting to switch may have sought to do this in the immediate aftermath of the introduction of the 2009 Order and are now locked into a two year contract.
Table 5.4: Incidence of switching amongst metered estate customers since implementation of the Orders
Number of metered bulk LPG customers switching away
Switches as per cent of the customer base
2009-2010 2010-2011 2009-2010 2010-2011
All switches away from companies 19 11 0.9% 0.5%
Source: OFT analysis of annual returns from suppliers to the OFT under the Orders
254 As defined in footnote 234.
255 Please note that this figure is higher than the total number of switches away from all UK companies (0.5 per cent as shown in Table 5.4) due to differences in the customer base when only data from the major companies are considered.
OFT1380 | 145
5.47 The lower percentages of metered estate customers switching compared to individual tank customers suggests metered estate customers continue to find it difficult to switch. We noted that the CC had identified additional barriers to switching for metered estate customers (see paragraph 5.35), and the OFT has received a number of queries on this issue since implementation of the Orders.
5.48 Contracts of customers on a metered estate tend to be staggered, reflecting the times when they moved onto the estate, so that they expire at different times. Thus all customers on a metered estate are not out of contract and searching for a new supplier at the same time. Some, but not all, suppliers are willing to terminate contracts before they expire in return for an early termination fee but may not be obliged to do this. Furthermore, in order to change supplier, customers within the same metered estate need to be in a position to reach a unanimous collective agreement about a new supplier, which may not always be possible.256 In our view, unanimity has practical benefits in protecting the individual rights of customers; the different timings of contract expiry pose the more significant challenge in allowing switching to be considered.
5.49 Nevertheless, switching by metered estate customers can and does occur. It is important that residents are fully aware of their rights, and can work together towards a unilateral agreement to switch to a new supplier. For example, residents should compare prices, and advise new residents that they are not obliged to sign a new contract automatically (thus binding the whole estate for up to two more years). We have discussed with industry their experiences of switching and the issues arising. Revised guidance reflecting these discussions, for metered estate
256 These issues were recognised and considered by the CC in its investigation. Refer for example to paragraph 20 of the following document: www.competition-commission.org.uk/inquiries/current/gas/response_consultation_metered_estates.pdf
OFT1380 | 146

customers wishing to switch, is provided in FAQs published by the OFT.257
Price outcomes
5.50 In general, suppliers have told us that their pricing practices are not fundamentally different today when compared with those at the time of the CC Report. Consistent with this, we have heard from consumers that a number of the potential pricing concerns identified by the CC persist in the market.
• For example, there are still wide disparities in prices charged to customers, even in the same locality, so that consumers remain concerned over the transparency of pricing. However, consistent with the CC Report, we have heard of individual instances where customers have successfully negotiated down their prices or achieved a reduction by querying imposed price increases.
• The CC considered this issue in its report258 and decided not to facilitate greater transparency of prices in such a way that would make suppliers' prices more visible to other suppliers. This was in part because of concerns that increasing pricing transparency to other suppliers could potentially have adverse effects by facilitating collusive practices. Nevertheless, the CC Report was not intended to discourage steps to increase the transparency of pricing to customers and the CC's remedies included measures to help customers make comparisons. It is not anti-competitive for individual firms to decide to publish their prices voluntarily, as for example we are aware some companies do.
257 The FAQs are published on the OFT website at: www.oft.gov.uk/shared_oft/monopolies/OFT-Domestic-bulk.pdf
258 Refer to section C of Chapter 4 and Appendix G of the CC Report, for a discussion of this and other pricing issues.
OFT1380 | 147

5.51 The above concerns are set against a backdrop of high and rising prices for consumers, which will be separately considered in the next section.
Consumer issues
5.52 We note concerns raised during our study regarding disruption to supply last winter. Prolonged periods of severe cold weather, snowfall rendering certain areas inaccessible and supply failures at some refineries created a situation where some consumers were left without an energy supply at a very critical time. We are aware of a number of measures implemented by suppliers at the time to overcome supply issues including the recruitment of additional drivers, utilising 4x4 vehicles for deliveries, part filling tanks to spread supplies available and topping up customers early. We have talked with suppliers about ways to avoid a recurrence over future winters. The larger suppliers have told us for example that they have invested in additional bulk storage and snow-appropriate delivery vehicles and put in place larger call centres to deal with additional calls from customers. Suppliers also acknowledged the need for continued investment in refineries to ensure security of supply.
5.53 Compared to the heating oil market, we believe that the LPG suppliers are better able to make the investments necessary to ensure security of supply because of their size in comparison to the average heating oil distributor.
5.54 However, the most prevalent complaint raised with us was about frequent and significant increases in the price of bulk LPG, including sharp increases once an introductory pricing period had expired.
5.55 Data collected during our study259 demonstrate that the retail price of domestic bulk LPG has increased sharply in recent years. In GB, the
259 The major suppliers provided us with their average purchase price of propane and average retail price of bulk LPG on a monthly basis between January 2008 and March 2011. These data are confidential to the parties and are therefore not published here. We also obtained similar data from some smaller suppliers but over a shorter time period.
OFT1380 | 148
average price charged by the major suppliers increased by two thirds between 2005 and 2010. In NI, average price increases have been more substantial, almost doubling during the period.260
• LPG used in the UK is primarily produced as a by-product from the refining of crude oil and hence its price is related to the price of crude oil and the internationally traded price of propane. The LPG price is also influenced by the relative demand for other refined products, as production volumes are interrelated within the refining process. Escalations in input prices, particularly over last winter, have contributed at least in part to pushing up the price of LPG as evidenced in Annexe J. Other operating costs also contribute to the end price – particularly transport costs, given that road fuel prices have also risen.
• Suppliers told us that they do not pass on every increase and decrease in input costs, instead trying to minimise the frequency of price changes to the consumer. Data they have provided show that in both GB and NI, retail prices tend to not fluctuate as much as input costs. Some of the larger companies have told us that they engage in hedging activities, such as investing in storage facilities and buying forward, to provide greater price stability.
5.56 Although the price increases observed credibly appear to be driven in part by external input cost pressures, and despite the efforts suppliers have informed us they make to smooth price fluctuations, this does not remove the challenge of managing the resulting price increases, particularly where consumers are contracted to purchase exclusively from a given supplier.
260 Supplier responses to OFT information requests. A LPG supplier told the OFT that any differences in price increases between GB and NI are mainly attributable to the higher cost of shipping product to NI and the ongoing distribution costs to customers, both of which were impacted by sharply higher diesel costs which would have resulted in inflationary effects on the NI LPG domestic central heating prices.
OFT1380 | 149

5.57 Some customers complained that their contract terms meant they had to accept these price increases, while others, whose contracts contained price limits, complained that their suppliers did not abide by these.
5.58 The Orders imposed new contract terms on suppliers. These changes have brought advantages to consumers, for example by reducing exclusivity periods to no more than two years. This is likely to increase competition in the market by allowing customers more opportunities to switch supplier. However, where customers are locked into contracts even for a minimum period, it is important that the contracts offer sufficient protection for consumers against material variations, including variations in the price.
5.59 In our view, consumers should either have some form of contractual protection against price variation (for example price limits) or they should be able to cancel the contract on reasonable terms if the price varies significantly. If the price change reflects underlying costs, for example wholesale LPG prices, then customers will not necessarily be able to find a better deal elsewhere, and they may stay in their existing contract. If, however, suppliers offer competitive introductory prices but then unilaterally increase the price significantly mid-way through the contract term, customers may choose to cancel.
5.60 With this in mind, we have reviewed a sample of current contracts provided by suppliers.
5.61 We note that, prior to the CC Orders, the OFT had considered similar issues before and as part of this work had agreed undertakings with some bulk LPG suppliers to address concerns identified with a number of contract terms. The OFT had identified concerns regarding clauses where it considered that suppliers might be able to vary prices, but reserved judgment pending further evidence of reaction to the revised terms proposed. We consider that the complaints received in the last year may suggest that certain prevailing contract terms could result in consumer detriment.
OFT1380 | 150

5.62 The OFT has therefore reviewed the terms of current customer contracts against previous undertakings and in light of complaints received. In conclusion:
• Our review has identified concerns that some suppliers' contract terms may not be entirely consistent with existing consumer protection legislation. In particular, we have some concerns relating to the clarity and fairness of termination rights and we are engaging with the major suppliers to discuss these.
• Furthermore, where contracts are terminated early by a customer in line with their contractual rights, the OFT considers that the provisions of the Order should apply to switching requests upon termination. We will work with industry to seek to ensure that guidance and contract documentation clarify this point where necessary.
Conclusions
The initial impact of the Orders
5.63 For individual tank customers, the Orders appear to be facilitating an increase in the amount of switching between LPG suppliers. In addition, smaller companies generally appear to be gaining customers at the expense of the major suppliers. As well as facilitating switching, it would therefore appear that the Orders have been effective in stimulating entry and the expansion of smaller firms.
5.64 Metered estate customers seem to continue to find it difficult to switch, indicated by the low incidence of switching. While it is too early to draw any firm conclusions, several of the constraints identified on metered estate switching seem likely to persist, so that we do not have strong expectations for large increases in switching levels absent any other market developments.
5.65 We have found that some of the potential pricing concerns identified by the CC persist in the market. However, the Orders have only been in
OFT1380 | 151

operation for around two years and are still in their relative infancy. Competition may further increase over time as the Orders bite.
Consumer protection issues
5.66 The OFT has concerns that some contract terms may not be entirely consistent with consumer protection legislation. We are engaging with suppliers to seek, where necessary, improvement in the clarity of contract terms and protection of consumers' cancellation and switching rights.
5.67 While competition appears to have improved, at least in some segments of the market based on higher switching rates since the CC Orders took effect, the likelihood that competition is continuing to evolve in this market given that the Orders were only recently made, increases the importance of enforcing consumer rights, particularly as regards cancellation and switching. Such steps may help to reduce detriment in the market directly but should also reinforce the effect of the Orders on competition in the market.
Cylinder LPG
Introduction
The use of cylinder LPG for off-grid heating
5.68 LPG is also supplied in cylinders of varying sizes for a range of uses in the domestic, industrial and commercial sectors. Domestic customers use cylinders for heating or cooking in the home and for outdoors leisure. Non-domestic customers use cylinders for a wide range of applications including lighting, refrigeration and fork lift trucks. Cylinders contain either propane or butane gas depending on their use and size.
5.69 For domestic heating purposes, LPG cylinders can be used in a central heating system, in stoves for room heating, or outdoors in patio heaters.
5.70 Our focus in this study is on LPG as a main or central heating source, for which large propane cylinders over 40 kg in size (typically 47 kg) are
OFT1380 | 152

used due to the larger volumes typically consumed for this purpose. In the remainder of this section, where we refer to 47 kg cylinders we refer to all cylinders of a similar size that are used for home central heating (and, usually in parallel, for cooking).
5.71 Retailers sell a portfolio of cylinders of varying sizes and to non-domestic as well as domestic customers. Domestic sales are approximately one-third of total UK cylinder sales by tonnage.261
• In 2010, total UK sales of all cylinder sizes were around 250,000 tonnes,262 of which around 50 per cent were 47 kg cylinders.263 We do not have reliable data to estimate the proportion of these 47 kg cylinder sales that relates to domestic use.264
• A domestic customer will typically consume 24 47 kg cylinders a year.265 Cylinders are typically delivered in pairs and sit in banks of four, connected via a change over valve and pigtails (two cylinders are connected and two cylinders disconnected at any time).
• A full 47 kg cylinder is difficult to handle. Because of its size, the customer usually has to organise delivery and collection.
261 Confidential data provided to the OFT by DECC.
262 Supplier responses to OFT information requests, based on returns from at least 85 per cent of the market.
263 Supplier responses to OFT information requests, based on returns from at least 85 per cent of the market.
264 The market structure makes it challenging to estimate total domestic volumes and customer numbers. Suppliers are not aware of the proportions of cylinders supplied that are sold by their numerous dealers and retailers into the domestic rather than non-domestic sector.
265 Supplier response to OFT information request.
OFT1380 | 153

5.72 Cylinder LPG is a mature and declining market overall and, in respect of 47 kg cylinders, of a small size. Around 25,000266 to 50,000267 households rely on it for home central heating and suppliers expect this number to continue to decline as householders improve their homes and update their heating systems.
• The limited use of cylinder LPG for central heating is largely due to a general preference for bulk LPG where possible. Bulk LPG is generally more economical than bottled LPG268 – although suppliers indicate that retail price differences between the two forms have reduced considerably over the past few years – and offers greater ease of delivery and handling.269
• Bottled LPG is therefore generally only used where bulk LPG is not an option, for example due to lack of suitable space to locate a bulk LPG tank or insufficient access for larger delivery vehicles – such as on park home sites, whose residents, we understand from suppliers, represent a significant proportion of domestic cylinder LPG users.
5.73 Given that bulk LPG is more expensive to use to heat an average home than other off-grid fuels such as heating oil, solid fuels or electricity (on an economy tariff),270 the even higher average price of cylinder LPG
266 OFT estimate based on Consumer Focus Report and CC Report data.
267 Supplier responses to OFT information requests. This figure cannot readily be accurately estimated and the actual figure may be higher. However, suppliers have consistently indicated that the cylinder LPG market size is small relative to bulk LPG.
268 This is supported by data provided by suppliers to the OFT on the average retail prices of bulk and cylinder LPG.
269 During our study, we have also heard that people may choose cylinders over bulk deliveries as the financial outlay required to buy two cylinders is lower than filling a bulk tank and hence more affordable at the point of purchase. This is true however only for a small subset of consumers.
270 Sutherland Tables data, July 2011. Refer to Table 3.7.
OFT1380 | 154

provided to the OFT suggests that cylinder LPG consumers are more likely than average to struggle with their heating costs.
5.74 In summary, many cylinder LPG consumers are in practice unable to readily switch to alternative methods of heating or to bulk LPG and, on a like-for-like basis, face above average heating costs. Conversely, due to the factors mentioned above, cylinder LPG is not the most suitable alternative fuel choice for many off-grid households.
Vertical agreements and competition issues
5.75 At the outset of our market study, we intended our examination of the domestic cylinder LPG market to focus on vertical agreements271 between suppliers and their dealers that impose conditions such as exclusive purchasing requirements and handling restrictions. This came about as the initial consultation on the scope of our study had surfaced complaints from dealers alleging that these agreements hampered competition in the market, making it more difficult for them to switch suppliers and preventing them from multi-sourcing cylinders.
5.76 While vertical agreements may have both pro-competitive and anti-competitive effects, those that on the balance of effects appreciably restrict or distort competition are, in some cases, prohibited under competition law.272 The OFT was therefore interested to consider the potential competition aspects of such arrangements, particularly in light
271 As defined in the European Commission Guidelines on Vertical Restraints, a vertical agreement (or restraint) is an agreement or concerted practice entered into between two or more undertakings each of which operates at a different level of the production or distribution chain, and relates to the conditions under which the parties may purchase, sell or resell certain goods or services.
272 Relevant competition law may include, subject to the circumstances of the particular case, the Competition Act 1998 (CA98) in the UK or Articles 101 or 102 of the Treaty on the Functioning of the European Union (TFEU). However, exemptions from these laws, again subject to the individual circumstances, may also apply such as under s9(1) CA98, or the Vertical Agreements Block Exemption Regulation (330/2010/EU).
OFT1380 | 155

of previous cases273 that at different times had raised potential antitrust concerns regarding the vertical arrangements then existing in the cylinder LPG market and resulted in changes in the market, primarily relating to the length of the arrangements in place. The OFT's interest was indicated in its scoping document at the time the study was formally launched in March 2011.274
5.77 However, in the course of the study it became apparent that the vertical agreements in place apply to the supply of a wider portfolio of cylinders to dealers, of varying sizes for both non-domestic and domestic sales. The assessment of any potential anti-competitive effect that may arise from these vertical agreements requires a full assessment of harm. This is not possible within this market study, which only contemplates a small part of the wider cylinder market. Hence, the vertical arrangements in place in this market have been set aside from the study, along with any analysis of competition in this market as this cannot properly be considered in isolation from the vertical arrangements in place. The OFT may return to these arrangements in the context of the wider cylinder LPG market at a later date subject to OFT criteria for the prioritisation of its work.275 Any relevant information gathered in the course of this market study will be retained so that it can be made available if required for this purpose.
Focus of the remaining section
5.78 Setting the question of vertical agreements aside for the reasons explained above, this section provides an overview of the cylinder LPG
273 Refer to Annexe K for more details.
274 This is published on the OFT website: www.oft.gov.uk/shared_oft/market-studies/oft1302f.pdf
275 The OFT applies prioritisation principles to ensure that it makes the best use of its finite resources and makes appropriate decisions about which projects and programmes of work are undertaken. A copy of the OFT's prioritisation principles can be downloaded here: www.oft.gov.uk/shared_oft/about_oft/oft953.pdf
OFT1380 | 156

market for home heating, highlighting the market structure and consumers' experiences. The analysis presented is intentionally high level and preliminary in nature, given the small market size for domestic heating with 47 kg cylinders.
5.79 The analysis focuses primarily on the GB market for domestic cylinder heating, for the following reasons:
• The NI market for domestic heating with 47 kg cylinders is very small, with only around 200 households using cylinder LPG for home heating276 and we did not receive representations from cylinder LPG consumers in NI.
• There are fewer cylinder suppliers in NI than in GB. Flogas has indicated to the OFT that as far as it is aware and to the best of its knowledge it believes its share of the domestic 47 kg cylinder market for home heating to be negligible in NI. CGNI does supply this market. However, CGNI has indicated that its domestic cylinder sales for domestic heating business, being of a limited volume, are priced in line with prevailing bulk LPG prices and therefore are more likely to be more competitive than would be the case if priced to reflect the small domestic heating business. The bulk LPG market is already separately considered in this chapter.
5.80 We have not considered consumer protection rights under cylinder LPG purchase contracts in our analysis, as the one-off nature of purchases277 and apparently more stable pricing compared to heating oil278 makes it
276 NI House Condition Survey 2009: NI Housing Executive. Please note that this is an estimate and small numbers should be treated with some caution.
277 Consumers are not tied to a particular retailer from purchase to purchase, although consumers may have ongoing obligations to a retailer in relation to the cylinders in their possession.
278 Based on the mystery shopping exercise included in the SPA research, which found that quoted cylinder LPG prices generally either remained the same or only increased slightly over a 2 week period. However, the number of repeat calls undertaken to establish this was necessarily
OFT1380 | 157

less likely that harm will occur compared, for example, to bulk LPG where consumers are tied to a supplier for a minimum exclusive period. Furthermore, we have not received complaints from cylinder LPG consumers regarding any contractual issues in the course of our study.
5.81 Our analysis – while, as stated, of a preliminary nature – indicates constraints on the outcomes available to consumers using 47 kg cylinders to heat their home, from factors including:
• High market concentration, so that there is a limited choice of supplier although there are numerous dealers and retailers. This seems unlikely to change given the maturity of the market and its small size.
• While the number of retailers in the market suggests that choice is available, in practice consumers did not tend to concur. This may reflect a combination of a lack of awareness of their options and/or genuinely little choice in some areas. In part due to this apparent lack of choice, we have received little evidence of consumers switching between retailers. However, the limited number of representations received from a small available base prevents us from drawing strong conclusions regarding consumer detriment.
• We have also received complaints from consumers alleging that prices are excessively high and rising. This must be considered against a background of rising raw material costs.
5.82 These findings are described in more detail in the next section.
limited (10 calls) and so this finding should be considered indicative. This compares to more volatile results for heating oil for a similar mystery shopping exercise. Please refer to the SPA Report for more information on both mystery shopping exercises.
OFT1380 | 158

Overview of the cylinder LPG market for home heating
Market structure
5.83 The supply chain for cylinder LPG comprises three levels: the supply level (where cylinders are filled by suppliers), the wholesale level (where cylinders are distributed by dealers), and the retail level (where they are delivered to end customers).
5.84 At the supply level:
• Suppliers purchase cylinders and fill them at filling plants, of which there are at least 25 in the UK. We have heard that some suppliers will also fill cylinders on a contract basis for others.
• There are three major cylinder suppliers operating in GB: Calor Gas (owned by SHV), Flogas (owned by DCC Energy) and BP Gas (owned by BP plc). In 2010, these suppliers represented a combined market share of between 85 and 90 per cent by volume of all cylinders in GB. Variation reported to us relative to these shares279 for the 47 kg segment of the cylinder market does not materially alter the picture of a mature and concentrated market.
• The structure of supply has remained stable over many years. In the 1981 Monopolies and Mergers Commission Report into cylinder LPG, the structure of supply looked very similar to today. At this time, the three largest companies, with Calor as market leader, supplied around 85 per cent of the market. A long tail of smaller firms supplied the remaining 15 per cent of the market.280
279 Supplier data from OFT information requests, based on returns from at least 85 per cent of the market.
280 'LPG A Report on the supply in the UK of LPG in containers of not more than 50KG capacity and not less than 150 gram capacity.' MMC 1981
OFT1380 | 159

• Although the structure of supply has remained the same, expansion and exit has occurred. Notably Shell UK Oil, previously the second largest supplier, left the market and Flogas has successfully grown its operations, largely through acquisition of smaller suppliers. 281
• The majority of suppliers distribute their cylinders via a network of independent dealers and retailers (stockists), and also through their own retail outlets for direct onward sale to the public, as detailed further below. It is widespread industry practice for suppliers to control this distribution process using vertical agreements to enforce exclusive purchasing and handling of their cylinders among their dealers and retailers and to require supplied stock to be sold only at specified branches.
• Unlike Calor and Flogas, BP does not supply cylinders directly to end users, working only through its dealer network.
5.85 At the wholesale level:
• Dealers are categorised into different tiers. Larger primary dealers distribute onwards to smaller secondary dealers and retailers. Secondary dealers and retailers may also be supplied directly by the supplier. All dealers distribute to retailers.
• Dealers are an important route to market for suppliers. Dealers have knowledge and experience of the cylinder LPG trade in their locality and they own the key relationships with the finite number of end customers available given the maturity of the market. Suppliers provide product development and brand identity and support to dealers in terms of financial, marketing and technical back-up.
5.86 At the retail level:
281 www.scotcourts.gov.uk/opinions/2008csoh13.html
OFT1380 | 160

• Similar to heating oil, and for similar reasons including the cost of transport, retail competition is localised within around 20 miles282 of the retail sites or nearby supply points where cylinders are stored or collected.
• As indicated, a high level of vertical integration exists within this distribution structure. Among the three largest suppliers, Calor and Flogas retail direct as well as supplying retailers through dealers, and many dealers are active at both the wholesale and retail levels. These various routes to market from supplier to end customer are summarised in Figure 5.5.
Figure 5.5: Supply chain structure
Source: Discussions with suppliers and OFT information requests
5.87 While the cylinder market is highly concentrated at the supplier level, there are over 1,000 dealers and over 14,000 retailers in the market.
5.88 As 47 kg cylinders are sold alongside other cylinders, this description of the supply chain broadly applies to the wider cylinder market. However,
282 Supplier data from OFT information request.
Dealer
Supplier
Retailer
Consumer
OFT1380 | 161

as these heavier cylinders are more specialised to handle in that they require delivery, they are not universally stocked by all retailers.
• Data provided to the OFT suggest that among all GB cylinder retail outlets at least 40 per cent supply 47 kg cylinders.
• An initial high level analysis, based on the delivery radii of the major cylinder suppliers and the locations of filling plants, suggests that most dealers (and hence consumers) in GB should have a choice of at least two suppliers.
5.89 Dealers and retailers are dependent on upstream capacity and storage, and suppliers' investment policies in these areas, for continuity and resilience of supply. The limited number of supply, filling and storage points means that, like heating oil and bulk LPG, capacity is susceptible to disruptions and shortages, and road conditions affecting access to supply points, in winter periods of peak demand.
5.90 Stock management is an important factor in the cylinder market. As with bulk LPG where the supplier owns the tank, cylinder suppliers retain ownership of the cylinders in which LPG is sold and loan them to dealers and retailers. Reasons given for this include health and safety and cost.
• As a flammable gas, propane is a potential safety hazard and suppliers must check and maintain the quality of the cylinders when re-filling them.
• Cylinders are expensive to manufacture. At prevailing steel prices, the replacement cost of a cylinder is high relative to the variable cost of the gas contained. Hence the efficient management and re-use of cylinders is important to suppliers' profitability.
- To incentivise the return of empty cylinders, a new domestic customer purchasing a cylinder for the first time may be asked to sign a cylinder hire agreement and in some cases also pay a deposit or hire charge. These costs are not always refundable or may only be partially refundable on a sliding scale depending on
OFT1380 | 162

the number of cylinders purchased, or the length of time a customer has been with a supplier.
- Returning customers will exchange their empty cylinder for a filled one, paying the price of the fuel.
Consumer experiences
5.91 This section summarises feedback received by the OFT during the course of the study from cylinder LPG consumers, via the SPA research as well as direct from consumers.
• The SPA research included qualitative research with seven cylinder LPG consumers. This, however, represents a very small sample size as it was challenging to recruit cylinder LPG consumers due to their low incidence within the population, and not all of these consumers used their cylinders for central heating.
• Therefore, the OFT also contacted a sample of consumers who had contacted the market study team, asking for their views on their choice of retailer, whether they shopped around for different retailers and their experiences of switching.
5.92 We report in this section on our findings based on the above inputs, caveating that such findings remain indicative as the total number of responses was still too small to be statistically significant and consumers who have voluntarily corresponded with the OFT will typically be among those with concerns regarding the market. This may be particularly relevant for the consumer feedback on limited retailer choice, given the information from suppliers on the high number of retailers in the market.
5.93 Many customers indicated that they did not have a good choice of retailer, with only one or two in the area (up to 15 miles typically being cited), and/or the number of retailers having reduced over time.
5.94 Where choice was available, customers unanimously stated they chose a retailer on price, though the speed of delivery and reliability were also important factors.
OFT1380 | 163

• Consumers value quality and timeliness of service, which are difficult to observe and may cause reluctance to risk switching to a new retailer.
• Delivery distance did not seem to be a particular concern, perhaps because the cost of delivery is included in the price.
• While some customers stated that the brand made no difference to their choice of retailer, it was not clear from the small sample of respondents available whether customers were influenced by or even aware of the supplier (manufacturer) brand (apart from Calor being widely known).
5.95 Consumers generally did not shop around, or have stopped doing so, for reasons such as:
• Insufficient numbers of retailers available.
• Retailers having similar pricing. However, the SPA mystery shopping research suggests that despite this impression it may still be worth shopping around. In six locations where multiple quotes were obtained, the average price difference per location between the highest and lowest quotes for two 47 kg cylinders was around £30.
• Retailers not being keen to collect cylinders when a customer has switched away. Customers may therefore fear that retailers will cease to accept their business if they switch too often.
• Some customers cited deposits on cylinders as a barrier to switching, since it can be difficult to get the deposit back. The degree to which this may affect switching will depend on the nature and variability of deposit policies among competing retailers.
5.96 A consumer wishing to switch to a new retailer affiliated to a different supplier has to return their empty cylinders to their previous retailer, as well as organising delivery from the new retailer. This involves a certain amount of effort on the part of the consumer, adding to their costs of switching. However, we received limited evidence on the extent to
OFT1380 | 164

which this troubled customers or (as indicated in paragraph 5.27) how much consumers thought about the supplier brand as opposed to the retailer, in part because few of the customers canvassed had much experience of switching retailers.
5.97 In summary, albeit the results are indicative due to a very limited sample size, consumers indicated a general dissatisfaction regarding available retail choice and offered only limited evidence of switching. However, consumers' main area of dissatisfaction related to high and rising price levels, which is discussed in the next section.
Retail prices
5.98 Prices are quoted per cylinder and typically include delivery and VAT.283
5.99 The retail price data we have collected from suppliers284 in the course of our study support consumers' main feedback relating to facing high and increasing prices. Consumers have complained that prices of 47 kg cylinders have more than doubled over the past decade. However, this appears to be driven mainly by high and rising input costs, which are detailed in Annexe J. Spikes in retail prices (for example in winter 2010/11) appear correlated with a sharp increase in propane costs. Retail prices also appear smoothed relative to propane costs.
5.100 The mystery shopping conducted as part of the SPA research found some large variations across the UK in the prices quoted for 47 kg LPG cylinders (between £96 and £204 for two cylinders, with average prices appearing higher in Scotland).285 The mystery shopping also indicated (as
283 As evidenced by the mystery shopping exercise included in the SPA consumer research.
284 The sample size is small (four suppliers) but covers at least 85 per cent of the 47 kg cylinder LPG market. Data is considered indicative and for confidentiality reasons is not shown in this report.
285 This research is based on a necessarily limited number of telephone quotes (27 calls, of which only five were to Scottish suppliers) and should therefore be considered indicative only.
OFT1380 | 165
described in paragraph 5.95) price variations within the local areas sampled. Supplier data286 and discussions tended to support the impression that price variations exist. One dealer stated their view that prices varied considerably by area, in some areas due to limited competition.
Conclusions
5.101 The LPG cylinder market for home heating is small, focused in GB rather than NI, and characterised by high supply concentration, declining demand in a mature market, and limited evidence of consumer switching. We have set aside from this market study the questions of the extent to which existing vertical agreements may affect these features and whether these may give rise to any concerns regarding the operation of the wider cylinder market in the UK, which are beyond the scope of this study. These questions have been reserved for possible future consideration which, if progressed subject to the OFT prioritisation principles, would take into account any relevant feedback from this limited part of the market.
5.102 Within the portfolio of off-grid energy options, cylinder LPG is not the most suitable alternative fuel choice for many households due to its relative expense (bulk LPG is generally more cost-effective due to volume efficiencies) and some disadvantages in terms of handling.
5.103 While a small segment of the off-grid energy market, cylinder LPG users therefore appear to be a potentially vulnerable segment, including a number of park home residents (who may be further constrained by relying on the supply procured through their site owner). Cylinder LPG users may have only a limited number of local suppliers, may pay higher heating costs on average than any other off-grid consumers, may be less able to readily switch to a different fuel type and are susceptible to road delivery disruptions. The SPA research indicates that in some areas
286 The sample size is small (four suppliers), but covers at least 85 per cent of the 47 kg cylinder LPG market. Data is considered indicative.
OFT1380 | 166

consumers may benefit from shopping around. Consumers should extract any benefit that is possible from shopping around and seek to minimise costs through improvements to insulation where possible and efficient energy use, maximising available grants where qualifying criteria are met.
5.104 However, in light of the potential challenges faced by cylinder LPG consumers, this group could be a candidate for targeted assistance or support, for example from policy-makers or consumer organisations.
OFT1380 | 167

6 MICROGENERATION
Summary
6.1 Our key findings are as follows:
• The installation base for microgeneration technologies is growing rapidly and is currently estimated to be around 82,000 units per year. The most popular microgeneration technologies are solar photovoltaic (PV) and solar thermal. Government financial incentives such as the Feed-in-tariffs (FIT) have been crucial in driving domestic uptake.
• The domestic market for microgeneration technologies is fragmented with thousands of certified installers distributed across the UK. There are also a number of manufacturers providing a wide range of certified products.
• Given the complexity of the technologies, and consumers' reliance on advice from salespeople, consumers are vulnerable to mis-selling (for example being sold a technology inappropriate for their needs) and misleading claims (for example overstatement of likely benefits). Complaints data from various sources confirm that such problems are just starting to arise in this market.
• We are monitoring these trends closely and expect that most of these complaints will be addressed by suppliers and are confident that the arrangements in place through the REAL Assurance Scheme Consumer Code will support this. The OFT will undertake any additional work, including enforcement action, as may be necessary.
OFT1380 | 168

Introduction
6.2 Microgeneration is the onsite generation of heat or electricity by individual households for small scale domestic use.287 It comprises a range of different technologies, including heat pumps, solar thermal, solar photovoltaic (PV) panels, micro wind, micro hydro, and micro combined heat and power (CHP).
6.3 With its lower running costs and green credentials, microgeneration is potentially an attractive longer term alternative for consumers off the gas grid (including those currently using heating oil and LPG) who are facing rising and volatile energy costs. Indeed, off-grid consumers are seen as being ideally placed candidates for early adoption of microgeneration. This is evidenced by uptake to date being highest amongst this group.288
6.4 Although new, the value of the domestic market is already substantial. Based on current annual uptake of about 82,000 units, we estimate it to have a value of approximately £697 million in 2011.289 With rising oil prices, Government policies including financial incentives that reduce upfront costs, and an increasingly environmentally aware population, uptake is expected to grow substantially.
6.5 However, as with many nascent markets, there are emerging consumer issues in the microgeneration market that, if not addressed early, risk undermining consumer confidence and growth. These issues are mainly
287 According to sub-section 82 (8) of Energy Act 2004, the capacity in relation to the generation of electricity is 50 Kilowatts and in relation to the production of heat 45 kilowatts thermal. This is largely consistent with the definition in European Directive 2004/8/EC.
288 'The Microgeneration Customer Journey – A report into the domestic uptake of microgeneration in the United Kingdom' was prepared by the EST for DECC (March 2011).
289 Derived from volume and costs data from Ofgem Feed-in-Tariffs database, the Renewable Heat and Energy Uptake Journey research proposal, and the Renewables Consumer Journey Research (2011) by Purple Market Research on behalf of the EST.
OFT1380 | 169

centred round allegations of poor quality service, mis-selling of technologies, and misleading information as to expected returns or payback times.
6.6 In this section, we assess the scope and viability of microgeneration as a current and future alternative source of energy for off-grid households. Of course many of the issues for consumers looking to install microgeneration are common to both on-grid and off-grid communities.
6.7 In our assessment, we consider:
• The main types of microgeneration technologies available (both heat generating and electricity generating technologies).
• Microgeneration as an option for off-grid households, noting also the role of insulation in the economics of domestic heating.
• How to ensure that the nascent market for microgeneration gets off to a healthy start, so households can invest in microgeneration with confidence.
6.8 Overall we believe that microgeneration has the potential to be a viable and attractive alternative source of energy for off-grid households over the longer term. However, there remain significant barriers to take-up. Government policy can and does address many of these. Successful growth will also depend on the market being competitive and working well for consumers as it develops.
Microgeneration Technologies
6.9 For the purpose of this study, we have focused on the most common microgeneration technologies used by domestic consumers in the UK to meet their heating and electricity needs. These are:
• Heat generating technologies: - Heat pumps (ground source heat pumps and air source heat
OFT1380 | 170

pumps). - Solar thermal (hot water, underfloor heating).
• Electricity generating technologies: - Solar (Photovoltaic panels). - Micro wind turbines.
6.10 We have not considered micro hydro and micro combined heat and power (CHP) technologies in any depth as the number of installations to date is very small.290
6.11 The benefits of microgeneration technologies are their lower running costs and lower cost to the environment. The extent to which these benefits are realised will depend to a large part on the characteristics of the property in which they are installed – in particular the technologies are likely to perform well only in well-insulated homes.
6.12 Table 6.1 provides a short description of the main technologies, suitability factors, and their low carbon credentials in terms of expected reduction in CO2 emissions.
Table 6.1 – Domestic microgeneration technologies
Technology Description291 Heat Pumps: Ground Source Heat Pumps (GSHPs) Air Source Heat Pumps (ASHPs)
ASHPs and GSHPs operate in a manner similar to household fridges, but in reverse. They take heat from the ground or air and compress it. While both pump types require electricity to run, when running properly they produce up to three units (kJ) of heat output for each unit (kWh) of electricity used (to power the pump). Heat pumps provide hot water and space heating and work best in well insulated buildings. ASHPs are most suitable for small properties while GSHPs are more
290 According to volumes data from Ofgem E-Serve's Feed-In Tariff Update, Issue4/June 2011, current weighted average uptake stands at 17 micro hydro and 8 micro CHP units per month.
291 Data on carbon savings were obtained from the EST website.
OFT1380 | 171

suitable for properties where there is a large amount of land available to install the heat pipes. Per annum, for a three-bedroom semi-detached house, carbon savings for a typical performing ASHP are approximately -105kg against gas and 4,600kg against electricity. For GSHP savings are in the region of 280kg against gas and 4,895kg against electricity.
Solar Thermal Solar thermal systems collect heat from the sun which is then used to provide hot water (but generally not space heating) for household use. These systems are the most popular form of microgeneration in the UK at present and suit households with a higher demand for hot water, especially in the summer. Carbon savings are approximately 250kg switching from gas and up to 570kg from electricity.
Solar Photovoltaic (PV) Panels
Solar PV generates electricity when exposed to daylight by converting solar radiation. It can produce electricity even on cloudy days. Solar PV is most suitable for houses with a south facing roof although in some cases they can be mounted on a pole. A typical 2.7kWp domestic system can generate CO2
savings of approximately 1,200kg per annum (against using mains electricity).
Micro Wind Turbines
Domestic micro wind turbines range from 1kW to 6kW. The turbine works by converting the wind energy captured by the rotor into electrical energy by means of a generator. This generated power can be stored in batteries or synchronized to the national grid. If a wind turbine is placed in a suitable site it can provide a reliable and economical means of generating clean energy. For a 6kW system, CO2 savings are approximately 5,500kg per annum (against using mains electricity).
Source: Information obtained from various sources including the Energy Savings Trust (EST) website,292 the Micropower Council,293 and NHBC Foundation Report.294
292 www.energysavingtrust.org.uk
293 www.micropower.co.uk
294 NHBC Foundation report (2008), A review of microgeneration and renewable energy technologies.
OFT1380 | 172

6.13 As the table suggests, these microgeneration technologies are typically used to meet either the heating or electricity needs of a household, not both. Electricity generating technologies can of course be used to provide heat through electric heaters but this is a relatively inefficient way of heating space.295
Awareness and uptake of microgeneration
6.14 In this section we look at the extent to which these technologies represent a real alternative to traditional fuels for off-grid households and communities. Specifically we look at consumer awareness of microgeneration, uptake to date, and barriers to uptake.
Awareness
6.15 Available evidence shows that public awareness of most microgeneration technologies and what they offer to the individual household remains limited. A 2009 attitude tracker survey by Defra296 found that a large proportion of the general public are unaware of some of the main types of microgeneration technologies, with heat technologies (excepting solar thermal) having overall the lowest levels of awareness. This finding of a relatively lower level of awareness of heat generating technologies compared to electricity generating
295 In addition, using electricity as a source of heating (as well as for other domestic energy uses) will reduce the potential income from selling unused electricity back to the grid. Moreover, energy bill savings are likely to be substantially reduced as the amount of electricity generated may not be sufficient to meet all of the household's energy needs leaving the household possibly needing to buy electricity from the provider.
296 Defra (2009) Public Attitudes and Behaviours Towards the Environment Tracker Survey. A research report completed for Defra by TNS. Based on a sample of 1,335 respondents, the survey found that levels of awareness for different technologies range between 29 per cent and 54 per cent.
OFT1380 | 173

technologies is supported by numerous other studies including a more recent survey conducted on behalf of the EST.297
6.16 An earlier study by EST298 revealed that on-grid consumers knew substantially less about microgeneration technologies than off-grid consumers, as illustrated in Table 6.2.
Table 6.2 – Awareness of microgeneration technologies
I know little or nothing about this technology
Technology On-grid Off-grid Overall
GSHP 52% 44% 51%
ASHP 75% 58% 72%
Solar Thermal
15% 10% 15%
Solar PV 21% 16% 20%
Micro wind 32% 25% 31%
Source: Purple Market Research/EST
Uptake
6.17 Low levels of awareness have been reflected in relatively low uptake across technologies to date. Table 6.3 shows that as of 2008 estimates of the number of installations of microgeneration technologies stood at less than 200,000, most of which was solar
297 Renewables Consumer Journey Research (2011) undertaken by Purple Market Research for the EST. Based on a sample of 1,223, the survey revealed that, with the exception of solar thermal, over 50 per cent of respondents had little or no knowledge of the main heat generating technologies that can be installed in the home.
298 'The Microgeneration Customer Journey – A report into the domestic uptake of microgeneration in the United Kingdom' was prepared by the EST for DECC (March 2011). This report draws on evidence primarily from previous EST studies and surveys. Based on a sample of 1,058 on-grid and 164 off-grid respondents, it found that compared to on-grid consumers, a far lower proportion of off-grid consumers said they knew little or nothing about microgeneration technologies.
OFT1380 | 174

thermal. This means that less than one per cent of UK households had installed a renewable energy technology at that time. We have no up to date figures for total installations but note that take-up of electricity generating technologies has increased markedly since the introduction of feed-in tariffs (discussed in more detail later in this chapter).299
Table 6.3 – Estimated installation of microgeneration technologies (up to 2008)
Source: Element Energy 2008302
299 Although data on the rate of installations are available for 2010 and 2011, the most recent year for which data on the estimated number of installations are available is 2008.
300 Using data from Consumer Focus Report, Welsh Government; OFT analysis of NI Utility Regulator data and 2009 NI House Condition Survey data, we estimate the number of households in the UK to be 25,843,000 of which England accounts for 21,407,000, Scotland 2,330,000, Wales 1,365,000, and NI 740,000. Refer to Annexe A for more details.
301 There have not been many ASHP installations under the major UK microgeneration programmes for England & Wales. However, there have been ASHP installations under various pilots but data for these are not readily available.
England Scotland Wales NI UK
Total 72,600-76,100
12,590-13,100
6,130-6,410
16,700-17,300
108,000 -113,000
Percentage of households (approx)300 0.36% 0.56% 0.50% 2.34% 0.44% Number accounted for by: GSHP 1,620 1,057 155 583 3,415 ASHP301 n/a 96 n/a 73 169
Solar thermal 66,800-69,600
10,700-11,100
5,590-5,830
14,400-15,000
97,490-101,530
Solar PV 2,511 95 155 232 2993 Micro-wind 1,297 410 142 473 2322
OFT1380 | 175

6.18 NI has the highest rate of installations. Indeed the pattern across nations reflects the proportion of households who are off-grid – 80 per cent of households in NI are off-grid with much lower proportions in the other three nations. This is not surprising – the pattern of off-grid households being more aware of microgeneration is reflected in the pattern of uptake. Research by the EST has confirmed that uptake amongst off-grid consumers is higher than average.303
6.19 However, the Purple Market Research survey304 found that adopters of microgeneration technologies tend to be middle class home owners living in larger rural properties that are not connected to the gas grid. A substantial proportion of the off-grid population – those living in flats, social housing, or rented accommodation – do not fall into this category.
6.20 The higher uptake amongst (at least a subset of) off-grid households almost certainly reflects the fact that the running costs of microgeneration technologies are considerably lower than those of other off-grid energy sources. For consumers on mains gas, the difference is smaller.
6.21 This suggests that the off-grid population represents a promising class of early adopters of microgeneration technology. In the next section we discuss Government targets, policies and financial incentives aimed
302 Obtained from the 2008 report 'Numbers of microgeneration units installed in England, Wales, Scotland, and NI' prepared by Element Energy on behalf of The Department for Business, Enterprise and Regulatory Reform (BERR).
303 According to the 2008 report 'YIMBY Generation – yes in my back yard: UK householders pioneering microgeneration heat' by the EST, 29 per cent of those who switched to microgeneration were heating oil users, eight per cent electricity and 19 per cent were users of other fuels such as LPG and solid fuel. 'The Microgeneration Customer Journey – A report into the domestic uptake of microgeneration in the United Kingdom' which was prepared by the EST for DECC (March 2011) also reported that adopters of microgeneration are typically not connected to the gas grid.
304 Renewables Consumer Journey Research (2011) by Purple Market Research for the EST.
OFT1380 | 176

at stimulating future uptake. Later we discuss the barriers to uptake and other factors that limit the attractiveness of microgeneration as an alternative source of energy.
Government targets, policies and financial incentives
6.22 In March 2007, the European Council established a target of generating 20 per cent of the EU's energy from renewable sources by 2020 and in 2008 a new Renewable Energy Directive (Directive 2009/29/EC) resulted in agreement of country shares of this target. The UK target was set at 15 per cent of gross final energy consumption.
6.23 To meet this target for final energy consumption, the UK has set specific targets for heat and electricity generation. For heat the target was set at 12 per cent with a potential for 22 per cent of that to be met by the domestic sector. For electricity the target was set at 30 per cent305 with two per cent of this coming from small scale sources. However, the NI Executive has committed to a non statutory target of 40 per cent of electricity generated from renewables by 2020.306
Policy
6.24 While these targets set the broad foundation that supports the microgeneration market, its growth is driven by four key Government strategies that augment each other – The UK Low Carbon Industrial Strategy, The UK Low Carbon Transition plan, UK Renewable Energy Strategy, and the Microgeneration Strategy. Although the first three strategies are not focused on microgeneration, they seek to create an environment within which microgeneration can become a mainstream source of fuel for domestic consumers.
305 See www.decc.gov.uk/en/content/cms/meeting_energy/renewable_ener/renewable_ener.aspx.
306 See www.detini.gov.uk/strategic_energy_framework__sef_2010_-3.pdf
OFT1380 | 177

6.25 The 2009 Low Carbon Industrial Strategy sets out the case for moving to a low carbon economy and provides a strategic view of Britain's low carbon potential. The strategy aims to provide an environment that encourages businesses and workers to be in a position to take advantage of the new demand created by climate change policies. The accompanying 2009 Low Carbon Transition plan describes, sector by sector, how carbon savings can be achieved in order to meet the UK's 2020 carbon emissions target. On the domestic side, the Government requires that all new homes be built to higher environmental standards with a 'zero carbon' requirement from 2016 (that is, net carbon emissions over a year must be zero).
6.26 The 2009 Renewable Energy Strategy puts forward a roadmap for achieving the UK's target of 15 per cent energy from renewables by 2020. It focuses on reducing UK dependence on fossil fuels and moving to using more renewable sources of energy.
6.27 At a more granular level than the other strategies, DECC's 2011 Microgeneration Strategy307 focuses on non-financial barriers and is centred round small-scale renewable and low carbon technologies. It sets out plans to complement the financial incentives that have been or are being put in place to bolster the microgeneration market.
Financial incentives
6.28 In terms of financial incentives, the UK Government and Devolved Administrations have put in place several schemes to encourage domestic adoption of microgeneration technologies.308 Some of these schemes are UK wide (covering all the devolved territories) whilst others are only available in one or some of the devolved territories. By helping to reduce upfront costs, these schemes have been and
307 www.decc.gov.uk/en/content/cms/meeting_energy/microgen/strategy/strategy.aspx
308 There are other Government supported energy efficiency financial schemes but these do not cover microgeneration. For that reason they are not included here.
OFT1380 | 178

continue to be instrumental in stimulating an increase in the adoption of microgeneration technologies. Table 6.4 lists the main current schemes and indicates their geographic coverage. Further information on these schemes can be found in Annexe L.
Table 6.4: Main current Government and Devolved Administration financial incentives that support microgeneration installations
Schemes England Wales Scotland NI
Renewable Heat Incentive (RHI) √ √ √ Feed–in Tariff (FIT) √ √ √ Green Deal √ √ √ NI Renewable Obligation (NIRO) √ Renewable Incentive NI (RHI NI) √ Carbon Emissions Reduction Target (CERT)
√ √ √
Interest Free Loan Scheme (IFLS) √ Nyth/Nest √ Arbed (Wales' Strategic Energy Performance Investment Programme) √ Community Energy Savings Programme (CESP)
√ √ √
Cur
rent
Energy Assistance Package (EAP) √
Source: DECC, Department of Enterprise Trade and Investment (DETINI), Element Energy,309 NI Executive, Ofgem, Scottish Government, and the Welsh Government
6.29 Currently, the two main schemes directly supporting the uptake of microgeneration in GB are the FIT (electricity generating technologies) and the RHI (heat generating technologies). The FIT scheme has been in operation in GB since April 2010. In February 2011, the Secretary of State for Energy and Climate Change announced the start of the first review of the FIT scheme. In doing so, he explained that a principal objective of the review was to determine how the efficiency of FITs will be improved to deliver the expected savings in 2014/15 that were committed to in the 2010 Spending Review. As such, one aspect
309 Element Energy Limited for BERR: Numbers of Microgeneration Units installed In England, Wales, Scotland, and NI, 2008
OFT1380 | 179

under consideration is tariff levels. DECC have said that they will consult on the comprehensive review later this year, with tariffs remaining unchanged until April 2012 (unless the review indicates the need for greater urgency).310 We note, however, that those who have already installed an eligible low-carbon electricity generating technology and are receiving FITs will not be affected by the review and will continue to receive the FIT at the current levels.
6.30 The RHI for domestic GB consumers is not due to come into full effect until October 2012.311 However, as an interim measure, a Premium Payment scheme of £15m, available from 1 August 2011, was set up to fund up to 25,000 household installations. Under this interim measure, any household in England, Scotland, and Wales can apply to secure funding for solar thermal installations. However, funding for the installation of heat pumps is only available to those off the gas grid.
6.31 The main financial incentives available in NI are similar to those in GB. The NI Renewable Obligation (NIRO), which was introduced in 2005, provides similar support to the FIT for electricity generating technologies. With regard to heat generating technologies, DETINI launched a public consultation in July 2011 on the introduction of a RHI in NI. Like its counterpart in GB, the NI RHI is expected to be implemented in October 2012. A Renewable Heat Premium Payment scheme of £2m will also be available in advance to domestic households until March 2012 (with further funding available as required until October 2012).
310 www.decc.gov.uk/en/content/cms/meeting_energy/renewable_ener/feedin_tariff/fits_review/fits_review.aspx
311 The RHI for non-domestic installations in the industrial, businesses, and public sector has been in operation since July 2011.
OFT1380 | 180
Impact on installations
6.32 Under the FIT scheme, the rate of domestic installations of electricity generating technologies increased from a few hundred in April 2010 to over 3,800 a month by June 2011.312
6.33 Given the success of the FIT scheme in its first year of operation and the past relatively greater popularity of the heat generating technologies (see Table 6.5 below), there is the possibility that the RHI may have an equal or greater multiplier effect on the number of installations of heat generating technologies.
6.34 However, while the RHI is expected to have a significant positive impact on the number of installations, the delay in defining the qualifying criteria and its subsequent implementation could limit growth. According to several industry stakeholders who spoke to or submitted their views to the OFT Off-Grid Market Study team, the uncertainty round the RHI has hampered the demand and supply of heat generating technologies, with focus being switched to electricity generating technologies.
6.35 The increase in the popularity of electricity generating technologies is anecdotally evidenced by the data shown in Table 6.5. Under past schemes (and as evidenced by 2010 data) heat generating technologies accounted for the vast majority of installations. However, since the introduction of the FIT and with greater certainty round this scheme, domestic installation of electricity generating technologies has far exceeded that of heat generating technologies.
312 Obtained from Ofgem E-Serve's Feed-In Tariff Update, Issue5/September 2011. Total uptake increased to, on average, 4932 a month of which 77 per cent can be attributed to domestic installations. Around 98 per cent of installations were of solar PV.
OFT1380 | 181

Table 6.5 – Estimated number of installations per month
Technology Estimated number of installations per month as at 2010313
Estimated number of installations per month as at June 2011
Heat Generating Technologies
GSHP ASHP
1,083
1,083
Solar Thermal 2,083 2,083 Electricity Generating Technologies
Solar PV 833 3,730
Micro-wind 42 48
Source: Ofgem314 and EST315
6.36 With recent Government policies, financial incentives, rising oil prices and a growing number of consumers who are concerned about the environment, the outlook for installations is positive. Indeed, according to a 2008 National House Building Council (NHBC) Foundation report,316 lower energy costs are the main driving force encouraging homeowners in the UK to explore the idea of adopting microgeneration. Similarly, results from the 2011 Purple Market Research317 showed that the availability of funding and rising oil prices provide the greatest impetus for installation. At present, replacing a mains gas boiler is
313It is assumed that absent the RHI, the rate of installation for heat generating technologies has remained the same.
314 Ofgem E-Serve – Feed-in Tariff Update – Issue 5/September 2011.
315 Purple Market Research Renewable Heat and Energy Uptake Journey research proposal (2011) commissioned by the EST.
316 NHBC Foundation report (2008), Zero Carbon: what does it mean to homeowners and housebuilders?
317 Renewables Consumer Journey Research (2011) undertaken by Purple Market Research for the Energy Savings Trust.
OFT1380 | 182

typically cheaper than installing most microgeneration technologies.318 Therefore, reducing the relative cost of renewable energy is likely to be crucial in prompting households to switch to microgeneration technologies.
6.37 The implication is that to achieve a significant increase in installations, schemes such as the FIT, RHI, and Green Deal must be successfully implemented. In particular, it is important to ensure that there is certainty around qualifying criteria and tariff and incentive levels. Raising awareness of these schemes and the qualifying technologies will also be important as will raising awareness of the continued likely increase in the cost of fossil fuels. Nevertheless, since the RHI and Green Deal are yet to come into force, for now microgeneration heating solutions for off-grid consumers are limited.
6.38 Despite the current absence of funding for heat generating technologies, by achieving economies of scale, community schemes may offer some households an opportunity to reduce the cost of installation. A 2011 study by EST319 found that with a community of 50 dwellings, community-scale projects could reduce capital costs by seven per cent for solar PV and 34 per cent for solar thermal compared to individual purchases. There have been a number of such schemes across the UK. For example, in 2010, under the Government sponsored Low Carbon Community Challenge initiative,320 12 local communities across the UK were awarded up to £500,000 to undertake green measures such as the installation of microgeneration technologies. Under this initiative, approximately 20 homes in Oxfordshire will receive funding for the installation of solar panels and two thousand
318 Installation of a microgeneration technology costs between £2,000 and £23,000 (see Table 6.6) whereas a straightforward replacement of a gas boiler typically costs £2,300 (see www.energysavingtrust.org.uk/In-your-home/Heating-and-hot-water/Replacing-your-boiler)
319 'The Microgeneration Customer Journey: A report into the domestic uptake of microgeneration in the United Kingdom' prepared by EST for DECC.
320 www.energyefficiencynews.com/microgeneration/i/2786
OFT1380 | 183
homes in Wales will receive power through the installation of two wind turbines.
Barriers to uptake
6.39 Even with the existence of Government financial incentives, there are still barriers that may constrain supply and limit the demand base hence hindering growth in the microgeneration market. The most significant of these are:
Cost and payback period
6.40 Mirroring the main drivers of installations, installation costs and the resulting lengthy payback periods are cited by respondents to the Purple Market Research survey321 as the main deterrents to uptake. Although Government finance schemes have incentivised many households to install a microgeneration technology, for many the upfront costs – in the range of £2,000 to £23,000 as shown in Table 6.6 – remain a barrier. According to the Purple Market Research survey, 57 per cent of those who are not yet actively considering adopting microgeneration technologies would require a 50 per cent or greater reduction in upfront costs in order seriously to consider installation. The survey also found that 63 per cent of all respondents are only prepared to wait five years or less to recoup their investment in a microgeneration technology – a payback period which is not feasible for most microgeneration technologies. The SPA qualitative consumer research found that the age of some participants was also a concern as they did not expect a return in their lifetime.
6.41 Table 6.6 provides a summary of the estimated annual running costs, installation costs, and payback period for the main microgeneration technologies. This compares to annual costs of £1,096, £1,611, and £2,272 for heating an average-size three-bedroom house with gas,
321 Renewables Consumer Journey Research (2011) by Purple Market Research for the EST.
OFT1380 | 184

heating oil or LPG respectively.322 The relatively higher number of installations for solar thermal is consistent with it being the cheapest technology.
Table 6.6: Running costs, installation costs, and estimated payback periods (as at August 2011)
Technology
Annual running costs per annum323
Average Installation Costs (estimations)
Estimated Payback period324
2011 2020 GSHP £655 £8,000 -
£20,000 £7,434 8-15 years
ASHP £745 £6,000-£10,000
£6,181 8-15 years
Solar thermal No running costs
£3,000-£6,500 £3,264 8-20 years
Solar PV No running costs
£11,000 - £14,000
£5,974 12-25+ years
Micro wind No running costs
£2,000 - £23,000
£3,126 10-15 years
Source: NHBC Foundation Report325/Element Energy 2008326/Purple Market Research/EST327
322 Data from Sutherland Tables, July 2011.
323 Information on running costs was obtained through correspondence with EST.
323 NHBC Foundation report (2008), A review of microgeneration and renewable energy technologies.
323 Element Energy Limited for BERR: The growth potential for Microgeneration in England, Wales and Scotland (Final Appendix), 2008
324 Estimations of payback periods are based on current financial incentives and current levels of usage for the fuels being replaced.
OFT1380 | 185

6.42 According to industry participants, in the long run, as the market develops and the costs of using fossil fuels rise, microgeneration technologies are expected to become relatively cheaper than other energy sources. This will result in shorter payback periods. The quality and performance of these technologies are also likely to improve. However, much will depend on consumers placing a higher value on low running costs than on upfront costs.
Installer capacity and skills
6.43 In some areas in the UK, there are a limited number of installers of microgeneration technologies. This is mainly due to low consumer demand and the process for MCS certification, particularly amongst smaller companies, being seen as onerous and expensive. However, even in areas like London, with a large number of properties and a considerable 'able to pay market', there are relatively few installers. There are also concerns over the lack of skilled labour capable of meeting the MCS standards, which prevents companies from expanding their businesses. For example, in a recent EST report, concerns over skill shortages and lack of places on training courses were highlighted.328 Further details on the number of installers in the UK are provided in the next section.
327 Renewables Consumer Journey Research (2011) by Purple Market Research for the EST.
328 EST 2010 report, Microgeneration in the capital: An investigation into the drivers and barriers facing the London Industry.
OFT1380 | 186

Uncertainty around future market scenarios
6.44 With the RHI for domestic consumers still in its development stage, manufacturers are reluctant to commit to product development of microgeneration heat generating technologies and installers are less willing to get MCS certification for these technologies.
6.45 Although for existing users and businesses there is clarity around FIT levels, for consumers looking to install or businesses looking to enter the market, the current review of the FIT presents a period of uncertainty as to future tariff levels.329 It is important that consumers clearly understand, in a timely manner, the implications of any changes that may be introduced.
Planning permission
6.46 The Permitted Development Rights introduced in England in 2008 and Scotland in 2009 and the relaxation of permitted developments in Wales in 2009 and NI in 2011 have made it easier to secure permission for domestic installations.330 However, obtaining planning permission remains a barrier.331 Both homeowners and installers are reluctant to seek planning permission, as there is still lack of clarity
329 With regard to the non-domestic sector, a fast track consideration was given to large-scale (over 50 kilowatts) and standalone solar PV projects as well as farm-scale anaerobic digestion projects (up to and including 500 kilowatts). Following consultation during the first half of 2011, proposed changes to tariff levels came into force on 1 August 2011.
330 Ground source heat pumps are permitted and with some exceptions so are solar thermal and solar PV. Air source heat pumps and micro wind are not currently covered.
331 See for example, www.decc.gov.uk/en/content/cms/meeting_energy/microgen/solar_pv/solar_pv.aspx and www.energysavingtrust.org.uk/Generate-your-own-energy/Wind-turbines/Choosing-a-site-and-getting-planning-permission
OFT1380 | 187

over what works require building control notification.332 This is most likely to affect ASHPs and micro wind, both of which need planning permission and also solar thermal and solar panels, for which there are still exceptions to the permitted development rights.333
The market for microgeneration
6.47 Industry and consumer bodies play an important role in increasing awareness of the benefits and functionality of microgeneration. They are also instrumental in moving it from being a niche market to being a mainstream market. In recognising the importance of industry and consumer bodies, a key aim of the Government's Microgeneration Strategy is to strengthen the ability of these bodies to tackle non-financial barriers in the market.
6.48 The main industry and consumer bodies providing information and guidance for consumers and businesses wishing to participate in the microgeneration market are the Microgeneration Certification Scheme (MCS), the Renewable Energy Association (REA), the Renewable Energy Assurance Limited (REAL), and the EST.
332 EST 2010 report, Microgeneration in the capital: An investigation into the drivers and barriers facing the London Industry.
333 See www.planningportal.gov.uk/planning/
OFT1380 | 188
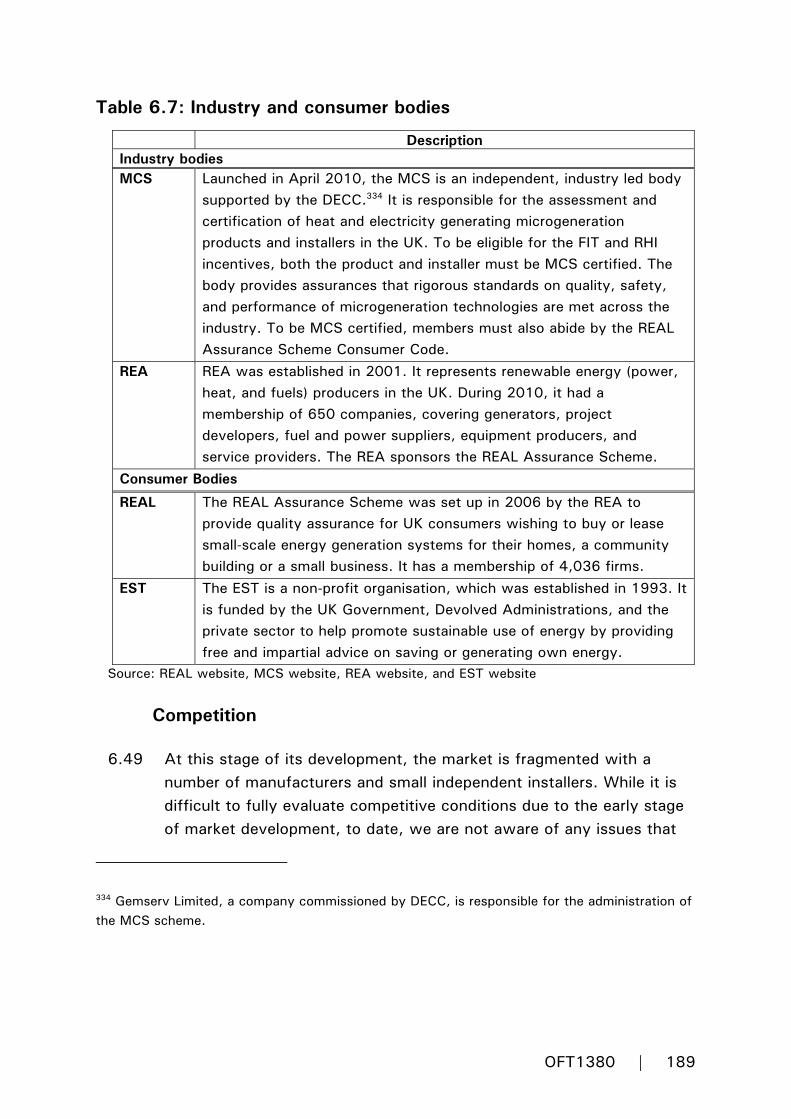
Table 6.7: Industry and consumer bodies
Description Industry bodies MCS Launched in April 2010, the MCS is an independent, industry led body
supported by the DECC.334 It is responsible for the assessment and certification of heat and electricity generating microgeneration products and installers in the UK. To be eligible for the FIT and RHI incentives, both the product and installer must be MCS certified. The body provides assurances that rigorous standards on quality, safety, and performance of microgeneration technologies are met across the industry. To be MCS certified, members must also abide by the REAL Assurance Scheme Consumer Code.
REA REA was established in 2001. It represents renewable energy (power, heat, and fuels) producers in the UK. During 2010, it had a membership of 650 companies, covering generators, project developers, fuel and power suppliers, equipment producers, and service providers. The REA sponsors the REAL Assurance Scheme.
Consumer Bodies
REAL The REAL Assurance Scheme was set up in 2006 by the REA to provide quality assurance for UK consumers wishing to buy or lease small-scale energy generation systems for their homes, a community building or a small business. It has a membership of 4,036 firms.
EST The EST is a non-profit organisation, which was established in 1993. It is funded by the UK Government, Devolved Administrations, and the private sector to help promote sustainable use of energy by providing free and impartial advice on saving or generating own energy.
Source: REAL website, MCS website, REA website, and EST website
Competition
6.49 At this stage of its development, the market is fragmented with a number of manufacturers and small independent installers. While it is difficult to fully evaluate competitive conditions due to the early stage of market development, to date, we are not aware of any issues that
334 Gemserv Limited, a company commissioned by DECC, is responsible for the administration of the MCS scheme.
OFT1380 | 189
could be expected to restrict competition. Membership of trade bodies can be instrumental in a company being able to access consumers (such as those wishing to apply for FIT and RHI funding). Therefore, industry bodies play an important role in facilitating competition and have obligations to ensure that firms are treated without bias.
6.50 To be eligible for FIT or RHI funding, the consumer must ensure that the technology and installer are both MCS certified. Currently, there are 3,462 MCS certified microgeneration products being sold by a number of manufacturers in the UK and across the UK, there are 3,111 MCS certified installers.335 Information provided by REA suggests that although some manufacturers will supply directly to domestic consumers they typically sell to an agent or wholesaler who in turn supply installers.
6.51 Based on data obtained from the MCS and the REAL Assurance Scheme, Table 6.8 provides a summary of the number of MCS and REAL members across the UK who supply and install the five main heat and electricity generating technologies.
335 Further information can be obtained from the MCS website - www.microgenerationcertification.org
OFT1380 | 190

Table 6.8 – Microgeneration installers (August 2011)
Technology Membership of the REAL Assurance Scheme
Number of MCS approved installers
GSHP 960 556
ASHP 1,217 651
Solar Thermal 1,636 939
Solar PV 3,321 2,443
Micro wind 466 143
Source: MCS website and REAL website
6.52 Solar PV and solar thermal account for the highest number of installers. Although there are a number of installers operating in the UK, the geographic spread reveals that some areas are differentially served by installers. Widest coverage by MCS installers is in South East England with 2,336 and South West England with 2,317 whilst only 1,617 and 1,786 MCS installers cover the whole of NI and Scotland respectively. This means that for some consumers, installer choice and availability might be limited.
6.53 With various Government initiatives currently driving market growth, the number of products and installers and the geographic spread are expected to increase to cater for the growing demand for renewable energy. In turn, a well supplied market is likely to encourage further demand.
Consumer issues
6.54 Satisfaction amongst microgeneration users is high. According to the Purple Market Research survey,336 90 per cent of respondents who installed microgeneration technologies were satisfied with performance
336 Renewables Consumer Journey Research (2011) undertaken by Purple Market Research for the EST.
OFT1380 | 191
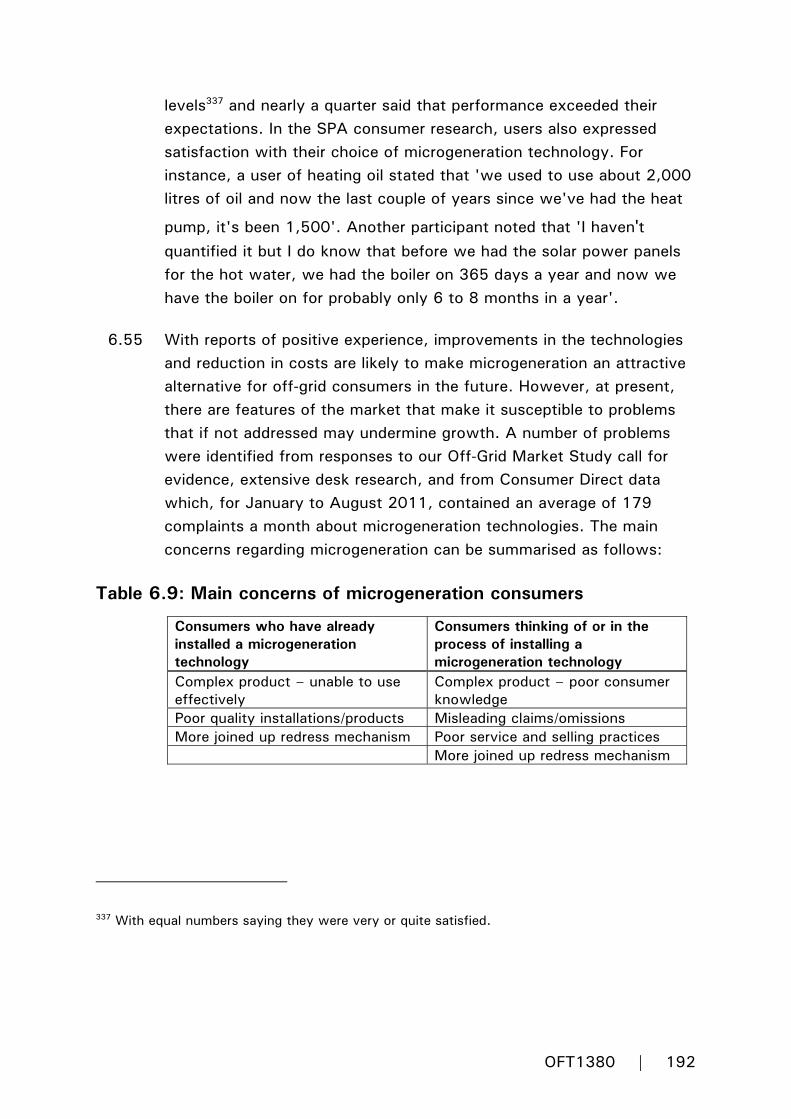
levels337 and nearly a quarter said that performance exceeded their expectations. In the SPA consumer research, users also expressed satisfaction with their choice of microgeneration technology. For instance, a user of heating oil stated that 'we used to use about 2,000 litres of oil and now the last couple of years since we've had the heat
pump, it's been 1,500'. Another participant noted that 'I haven't quantified it but I do know that before we had the solar power panels for the hot water, we had the boiler on 365 days a year and now we have the boiler on for probably only 6 to 8 months in a year'.
6.55 With reports of positive experience, improvements in the technologies and reduction in costs are likely to make microgeneration an attractive alternative for off-grid consumers in the future. However, at present, there are features of the market that make it susceptible to problems that if not addressed may undermine growth. A number of problems were identified from responses to our Off-Grid Market Study call for evidence, extensive desk research, and from Consumer Direct data which, for January to August 2011, contained an average of 179 complaints a month about microgeneration technologies. The main concerns regarding microgeneration can be summarised as follows:
Table 6.9: Main concerns of microgeneration consumers
Consumers who have already installed a microgeneration technology
Consumers thinking of or in the process of installing a microgeneration technology
Complex product – unable to use effectively
Complex product – poor consumer knowledge
Poor quality installations/products Misleading claims/omissions More joined up redress mechanism Poor service and selling practices More joined up redress mechanism
337 With equal numbers saying they were very or quite satisfied.
OFT1380 | 192

Complex products
6.56 Microgeneration technologies are complex to operate and are not easy to understand. This is compounded by the fact that microgeneration technologies are experience goods whose quality can only be verified after installation. In EST's 2008 YIMBY report,338 65 per cent of a sample of 167 users of microgeneration were found to have had difficulties or uncertainties with operating the system's controls to make the best use of the technology. The Purple Market Research339 survey also found that 22 per cent of respondents did not know what technology best suits their home.
6.57 The effective operation of microgeneration technologies also require properly insulated properties. Consumers without proper insulation may find that their chosen technology works poorly and does not yield the expected benefits. Therefore, insulation should be regarded as a prerequisite in moving to microgeneration, especially as a substantial proportion of homes in the UK are poorly insulated.340
6.58 Challenges faced in understanding how best to use the technology are exacerbated by the difficulties encountered in obtaining independent assessment and advice. According to the Purple Market Research survey, 10 per cent of respondents said that not being able to obtain impartial advice has made it difficult for them to install microgeneration. Indeed, 42 per cent of respondents said they would consider paying for impartial independent advice if they were thinking about installing.
338 EST (2008) YIMBY Generation – yes in my back yard: UK householders pioneering microgeneration heat.
339 Renewables Consumer Journey Research (2011) by Purple Market Research for the EST.
340 Data from Consumer Focus Report and NI House Conditions survey (2009) reveal that a substantial proportion of both off-grid and on-grid consumers live in poorly insulated properties.
OFT1380 | 193

6.59 Under the current system of separate certification for product and installer, installers are more likely to encourage installation of the technology that they are certified to install rather than provide an independent assessment of what is most suitable for the consumer.341 As such, there appears to be a risk that consumers may install certain technologies without being fully informed of the suitability or overall benefits. A 2010 investigation by Which? into the sale of domestic solar thermal systems found that 10 out of 14 companies exaggerated the potential savings and none of the 14 companies investigated identified all the important technical challenges before providing a quote. 342 In 2011 Which? conducted an investigation into the sale of solar PV that also found problems. Out of the 12 MCS certified firms investigated, using the Government's required SAP assessment methodology, three quarters were found to overestimate the annual amount of energy that the PV system would produce and eight underestimated the payback period.343
6.60 Together, possible installer bias or lack of knowledge and the complexity of microgeneration technologies create an environment where customers may not be provided with the necessary or correct information before deciding which technology best suits their property and needs. This is supported by the Consumer Direct data which indicates that allegedly misleading claims or omissions are just starting to become a feature of the market.
341 See www.which.co.uk/documents/pdf/draft-microgeneration-strategy-which-response-237753.pdf and Consumer Focus Scotland 2010 Report 'Power at Home – Improving Consumer Access to the Benefits of Microgeneration' www.consumerfocus.org.uk/scotland/files/2010/11/Power-at-home.pdf
342 www.which.co.uk/news/2011/06/solar-panel-firms-give-consumers-poor-advice-says-which--256929
343 www.which.co.uk/about-which/press/press-releases/product-press-releases/which-magazine/2010/04/solar-sellers-slammed
OFT1380 | 194

Misleading claims
6.61 Our consumer research indicated that some microgeneration users thought they would see a return on their investment earlier than expected and the Which? investigation found that firms provided poor advice and made unrealistic claims about the benefits of the technology. Which? found that 10 out of the 14 companies exaggerated the potential savings that could be made from switching to solar thermal. Consumer Direct data also revealed that the number of complaints about mis-selling and misleading claims increased by 75 per cent for the year to August 2011.
6.62 The Advertising Standards Authority (ASA) has also recently taken action against some firms for making misleading claims. In 2008, the Advertising Standards Authority (ASA) upheld a complaint against Danfoss Heat Pumps Limited after finding that it could not substantiate claims that consumers could reduce their heating costs by up to 70 per cent.344 In a more recent case the ASA ruled that claims made by ACS Renewable Solutions that their air source heat pumps would reduce winter fuel bills by 40 per cent were misleading.345
6.63 Concerns about mis-selling and misleading claims can undermine consumer confidence in the market. For instance, in the Purple Market Research survey only nine per cent of respondents said they would trust installers to provide impartial information and advice.
Poor quality products/service and selling practices
6.64 A number of complaints to Consumer Direct about microgeneration technologies relate to poor quality goods and services. In 2010, poor
344 www.asa.org.uk/ASA-action/Adjudications/2011/8/Danfoss-Heat-Pumps-UK-Ltd/SHP_ADJ_157342.aspx
345 www.asa.org.uk/ASA-action/Adjudications/2011/8/ACS-Renewable-Solutions-Ltd/SHP_ADJ_141588.aspx
OFT1380 | 195

quality goods accounted for 27 per cent of complaints. Pressure selling and cold calling accounted for about nine per cent. For the period January 2011 to August 2011, although there has been a decline in these types of complaints, the figures remain significant at 14 per cent and seven per cent respectively.
6.65 Results in the EST's 2008 YIMBY report346 also highlighted that 17 per cent of respondents who use microgeneration complained about the unreliability of the system (for example, component breakdown and leaks) and a further 12 per cent complained that the system provided less heat or hot water than expected. The latter is consistent with mis-selling or misleading claims and with poor product quality. In addition, concerns over quality of service are reflected in results from the Purple Market Research survey, which found that 53 per cent of respondents at preparation or installed phase had doubts about the skills and experience of installers.
6.66 As with mis-selling and misleading claims, poor quality service and selling practices can cause significant detriment, leading consumers to withdraw from the market.
Redress mechanism
6.67 At the moment, consumers have two main avenues for redress outside of court action – provisions under the MCS accreditation scheme and the REAL Assurance Scheme Consumer code allow for complaints resolution between consumers and members. Members who do not comply with the rules governing these schemes (including the findings from the complaints process) can have their membership revoked. Last year, following audit compliance checks, REAL excluded three companies from the scheme due to non-compliance. As MCS and REAL certification are crucial for consumer access to Government financial incentives such as FIT and RHI, for members, the threat of exclusion
346 EST (2008) YIMBY Generation – yes in my back yard: UK householders pioneering microgeneration heat.
OFT1380 | 196

can be a significant deterrent against non-compliance. The important deterrent role played by MCS and REAL is consistent with the high level of satisfaction reported by respondents in the SPA research.
6.68 Our view is that, while REAL and MCS play a crucial role in ensuring consumers obtain redress where appropriate, there are opportunities to further strengthen this regime. For both consumers already using or in the process of installing microgeneration technologies, seeking redress can be challenging. For instance, separate MCS accreditation of installers and technologies make redress and accountability difficult, with installers and manufacturers expecting the other to accept responsibility for faults. As a result, consumers may find it difficult to determine which party is liable if the technology does not perform as expected.
6.69 In addition, since complaints regarding installation can be made to either REAL or the relevant MCS accreditation body, consumers may be confused as to which avenue to pursue. MCS certification bodies handle complaints regarding the technical aspects of the installation while REAL deals with complaints about the standard of service or aspects of the contract. However, since there is separate accreditation for installers and products, the consumer must first ascertain the nature of the problem and whether it is best handled by REAL or MCS. Given the complexity of the technologies, this may not always be straightforward.
6.70 If the consumer is not happy with the outcome of the complaints process under the REAL scheme, they can seek independent arbitration. Arbitration can cost from £100 and the outcome is binding.347 In its response to DECC's 'Consultation on a Microgeneration Strategy', Which? notes as a concern that arbitration is costly to the consumer, does not generally find fault, and the
347 See www.realassurance.org.uk/consumers/independent-arbitration
OFT1380 | 197

outcome can deny the consumer the right to go to the courts if they are not happy with the results.348
Actions and recommendations
6.71 Our research found that satisfaction amongst users of microgeneration is high. Against that background the OFT uses its complaints database as an 'early warning system' to monitor trends in the market. The latest Ofgem and EST figures record 6,900 installations a month349 generating 179 Consumer Direct complaints.350 We expect that most of these complaints will be addressed by installers and are confident that the arrangements in place through the REAL Assurance Scheme Consumer Code will support this. Alongside Trading Standards, the OFT will monitor the market and will undertake any additional work, including enforcement action, as may be necessary.
6.72 The OFT also recognises the need for the following:
• Clarity around Government schemes. In particular, the FITs scheme is currently under review. While the outcome of the review is not yet known, it is important that Government, trade bodies and industry work together to ensure that any changes that may be made are understood in a timely manner by consumers.
348 See www.which.co.uk/documents/pdf/draft-microgeneration-strategy-which-response-237753.pdf
349 Number of installations for electricity generating technologies is based on Ofgem data www.ofgem.gov.uk/Sustainability/Environment/fits/Newsletter/Documents1/Feed-in%20Tariff%20(FIT)%20Update%20Newsletter%20Issue%205.pdf. The Ofgem data contains a lag on current market activity and so will not reflect any recent changes in the rate of take up. Monthly installation for heat generating technologies was based on estimates from the Purple Market Research Renewable Heat and Energy Uptake Journey research proposal (2011) commissioned by EST.
350 Thus the proportion of complaints to number of installations is about three per cent. This is substantial. For instance, in our Second Hand Car Market Study, the proportion of complaints to number of transactions was less than one per cent.
OFT1380 | 198

• Availability of independent assessment. While consumers can access information and independent advice on technologies, it is difficult for them to obtain an independent assessment of the options for their property. As the market develops, this service may emerge. If not, the Government may wish to consider sponsoring such a service.
• Opportunity to further strengthen redress mechanisms. Consumer satisfaction levels in the market are high and in this regard we would highlight the important role played by REAL and MCS in this industry and the fact that consumers have access to redress mechanisms via the MCS and REAL. There is an opportunity to further strengthen these mechanisms in the future by further integrating the approach to consumer redress.
6.73 Much of this work is already in hand. In its recent Microgeneration Strategy, the UK Government has begun the process of addressing some of these issues. In particular, there are recommendations around strengthening the role of the MCS and the REAL Assurance scheme in terms of providing independent assessment and more robust redress mechanisms. Some of these recommendations do not extend to the Devolved Administrations and for a comprehensive approach will need to do so.
OFT1380 | 199

7 CONCLUSION AND RECOMMENDATIONS
7.1 Off-grid consumers represent a diverse population using a wide range of different fuel types. Some face challenges that include fuel poverty, limited possibilities to improve the energy efficiency of their homes, and potential disruptions to supply because they are dependent on the road transport network for delivery of their fuel. The most pressing concern that consumers have repeatedly raised with us relates to the high and increasing level of prices. Affordability concerns are not likely to abate given expected upward pressures on energy prices in general, both on-grid and off-grid. Furthermore, these price trends may not be directly remediable given that they are to a large extent driven by the internationally traded prices of oil and LPG.
7.2 While we recognise that wider challenges exist for some off-grid consumers, the OFT's remit is to consider competition and consumer protection issues for these consumers. Our study has examined competition in the supply of heating oil but has not found evidence of either market power or coordination problems, with a choice of supplier generally available to consumers, low barriers to entry, and no apparent evidence of collusion. These features indicate that, while firms are able to make profits at times of peak demand, competition will constrain the extent to which they do so over time. In some outlying areas, consumers may face a limited choice of suppliers. However, this is true of many services in such localities and is not readily susceptible to competition remedies.
7.3 Hence, while a number of parties have advocated price regulation in the heating oil market, the OFT does not see any justification for this on competition grounds. Moreover, even if we had identified market power concerns, any such regulation would be challenging to administer and may not be cost-effective given the large number of firms in the market.
7.4 However, further support for off-grid consumers should come from the enforcement of existing consumer protections by the OFT and Trading Standards. Such enforcement is particularly important in sectors, such as this, which include a number of vulnerable consumers. We note the
OFT1380 | 200

recent actions taken by the OFT against some heating oil firms and price comparison websites, and by Trading Standards in relation to heating oil. Our study has also identified potential consumer protection concerns in the domestic supply of bulk LPG and microgeneration. We are taking appropriate actions in these matters as summarised below.
7.5 Beyond this, the UK Government and Devolved Administrations can of course consider policy interventions targeted towards the vulnerable parts of the off-grid population. In this respect, we hope the evidence base from our study will be of use to all interested parties.
7.6 The OFT's key actions and recommendations from this study are summarised as follows.
Summary of the outcomes and recommendations from our study
Heating oil
• It is important that consumers can genuinely shop around and make informed decisions about which suppliers to use. The OFT has taken action against several heating oil companies and price comparison sites in order to prevent consumers being misled when searching online for heating oil supplies. This was announced in September 2011. The changes secured mean that domestic heating oil consumers will be better able to compare deals on offer. It should also be clear to any heating oil company running a price comparison site that the law requires transparency around ownership and links to heating oil suppliers.
• The OFT also notes the court case successfully brought in August 2011 by Carmarthenshire County Council against GB Oils Limited (trading as O. J. Williams). In light of this case and of complaints received from consumers elsewhere regarding allegedly unclear pricing practices, in particular over last winter, the OFT is now examining this and related practices.
• We also recommend that the industry strengthen its codes of practice in relation to consumer protection and redress. The OFT is working with the FPS and the NIOF to support their activities in this regard.
OFT1380 | 201

LPG
• The OFT has considered the compliance of industry, to date, with the Orders made by the CC in respect of the supply of domestic bulk LPG. Some areas of possible compliance weakness exist. The OFT will engage with the industry to address and monitor these areas. A breach of the Orders, if found, could lead to enforcement action.
• The OFT maintains FAQs on the implementation of the Orders and recommends that consumers – particularly those on metered estates, where switching rates remain low – consider these FAQs if they have queries about the Orders or experience difficulties switching.
• The OFT is engaging with the industry regarding concerns that some terms in domestic bulk LPG consumer contracts, particularly as regards early termination rights, may not be fully consistent with existing consumer protection legislation.
• Furthermore, we take the view that the Orders apply even where contracts are terminated early and we recommend the industry make this clearer in its consumer guidance.
OFT1380 | 202

Provisional decision not to make a market investigation reference to the CC
7.7 A possible outcome from a market study is a market investigation reference (MIR) to the CC. The OFT has considered whether this would be appropriate in respect of the main market where this study has made a competition assessment – the heating oil retail distribution market.
7.8 In order to make a MIR to the CC, the OFT must have reasonable grounds for suspecting that any feature, or combination of features, of a market in the UK for goods or services prevents, restricts or distorts competition in connection with the supply or acquisition of any goods or
Microgeneration
• We have identified a particular risk of mis-selling problems within the microgeneration industry, and some recent evidence of such problems materialising. We expect that most of these complaints will be addressed by installers and are confident that the arrangements in place through the REAL Assurance Scheme Consumer Code will support this. The OFT will undertake any additional work, including enforcement action, as may be necessary alongside Local Authority Trading Standards.
• Going forward, the OFT recommends that Government and the devolved administrations should continue ongoing work considering:
- Measures to increase access to and use of independent advice.
- Opportunities to further strengthen existing independent redress mechanisms if significant problems do materialise.
OFT1380 | 203

services in the UK or part of the UK (the 'reference test', as detailed further in Annexe O).351
7.9 The OFT has only assessed whether the main sector we have reviewed in the course of our off-grid energy market study – the domestic heating oil retail distribution market – meets the reference test. We have not applied the reference test in respect of the other fuels because:
• For bulk LPG: The CC has already investigated the domestic bulk LPG market. Instead of looking at issues already addressed by that investigation, we have focused on evidence of the initial impact of the Orders.
• For cylinder LPG: while there are some features of this market which may give rise to competition concerns, these concerns would, if valid, go beyond the supply of cylinders for domestic heating and therefore require consideration of the wider cylinder LPG market (including commercial and industrial customers) beyond the scope of this study. We may return to these issues in the context of the wider cylinder LPG market at a later date (subject to OFT prioritisation principles).
• All other energy markets examined (microgeneration, solid fuels and electricity) have, within the context of this particular study, been considered primarily in relation to their role as alternatives to heating oil and LPG rather than individually in their own right.
7.10 As regards heating oil, and as set out in Chapter 4, the OFT has not, in the course of its study and on the basis of the evidence seen to date, found reasonable grounds for suspecting the presence of any feature or features of the heating oil retail distribution market in the UK that may prevent, restrict or distort competition in connection with the supply or acquisition of domestic heating oil in the UK or part of the UK.
351 The reference test is set out under section 131 of the Enterprise Act 2002.
OFT1380 | 204
7.11 Therefore, the reference test is not met and the OFT does not propose to make a MIR to the CC in respect of the domestic heating oil retail distribution market.
7.12 For the avoidance of any doubt, our study has not examined the wholesale market for petroleum products in detail and does not reach any conclusions on this market.
7.13 We are consulting on our provisional non-reference decision and invite relevant views. Responses should be emailed to [email protected] by 5pm on Friday 18 November 2011. Alternatively, they can be sent to:
Off-Grid Energy Market Study Office of Fair Trading Fleetbank House 2-6 Salisbury Square London EC4Y 8JX
7.14 We will consider any responses received and will publish our final decision on a MIR in due course.
OFT1380 | 205