Ofcom’s Media Nations: Wales 2018 report (PDF, 2.7 MB) · More than half of homes in Wales (5...
43
MEDIA NATIONS: Wales 2018 Published 18 July 2018
Transcript of Ofcom’s Media Nations: Wales 2018 report (PDF, 2.7 MB) · More than half of homes in Wales (5...

MEDIA NATIONS: Wales2018
Published 18 July 2018

2
About this document
This is Ofcom’s first annual Media Nations: Wales report. The report reviews key trends in the
television and audio-visual sector as well as the radio and audio industry in Wales. It provides
context to Ofcom’s work in furthering the interests of consumers and citizens in the markets we
regulate.
In addition to this Wales report, there are separate reports for the UK as a whole, Northern Ireland,
and Scotland, as well as an interactive data report.
The report provides updates on several datasets, including bespoke data collected directly from
licensed television and radio broadcasters (for output, spend and revenue), Ofcom’s proprietary
consumer research (for audience opinions), and BARB and RAJAR (for audience consumption). It
should be noted that our regulatory powers do not permit us to collect data directly from online
video-on-demand and video-sharing services (such as ITV Player, Netflix, Amazon Prime Video and
YouTube) for research purposes, and therefore we rely predominately on third-party sources for
information relating to these services.

3
Contents
About this document ......................................................................................... 2
Key points .......................................................................................................... 4
TV services and devices...................................................................................... 7
TV and AV consumption ................................................................................... 12
TV programming for viewers in Wales ............................................................. 20
Satisfaction with and perceptions of TV ........................................................... 29
The radio listener ............................................................................................. 33

4
Key points
In 2017 people in Wales spent an average of 3 hours 43 minutes per day watching broadcast television, down 17 minutes since 2016
• This 7.1% decline in television viewing in Wales was greater than the UK average of 4.2%.
• The decline in Wales is partly due to an increase in the amount of time spent using the
television set for purposes other than broadcast TV (such as streaming services like Netflix
and Amazon, or gaming). Use of the television set for these purposes increased by an
average of 11 minutes, to 44 minutes per person, per day.
• Wales v Ireland in the Six Nations on BBC One was the most-viewed TV programme in 2017
with an average audience of 806,000 viewers.
• In a typical week in 2017, 364,000 viewers in Wales watched S4C on television for at least
three consecutive minutes. This was the highest level of reach since 2014 and there was a
notable increase in reach, when all viewers across the UK are considered, to 562,000 in
2017, a 3.1% increase since 2016.
There was an 8% real-terms increase in spend on programming for viewers in Wales by the BBC and ITV in 2017
• Together, the BBC and ITV spent £29.1m on first-run, UK-originated content for viewers in
Wales, an 8.1% increase in real terms on 2016. This increase was driven by the BBC, which
increased its spend by 12% year on year, while ITV spend has remained broadly stable since
2013.
More than half of homes in Wales (50.4%) have a satellite TV service
• At 50.4%, far more homes in Wales had a satellite TV service in Q1 2018 than the UK average
(37.1%). Sky’s pay satellite service was the most popular pay-TV service in Wales in Q1 2018,
with 41.8% of homes having such a service.
• One in ten homes (10.1%) had a cable TV service in Wales by the start of 2018 – lower than
the 14.9% UK average, and comparable with the 8.7% take-up among homes in Northern

5
Ireland. A third of homes in Wales (33.3%) had digital terrestrial television (DTT) as their only
TV platform in Q1 2018.
• BBC iPlayer was the most popular on-demand service in 2018, with 37% of adults in Wales
using the service, followed by Netflix (25%) and ITV Hub (24%).
Seven in ten PSB viewers were satisfied with PSB content in 2017
• At 72%, this compares with 75% for the UK average, 75% in England, 71% in Scotland and
69% in Northern Ireland.
• Looking at news provision by the public service broadcasters (PSBs), audiences in Wales
rated delivery of ‘Its news programmes are trustworthy’ highly at 65%. This compares with
the UK average of 69%, England (68%) and Northern Ireland (74%). It is significantly1 lower
than in Scotland (79%).
• Less than half of regular/occasional PSB audiences in Wales (47%) rated the delivery of ‘It
portrays my region/nation fairly to the rest of the UK’ highly. While this score is comparable
to Northern Ireland (48%), it is significantly lower than Scotland (62%) and England (56%).
• ‘It shows different parts of the UK, including England, Northern Ireland, Scotland and Wales’
was rated highly by 56% of regular/occasional PSB audiences in Wales. This compares to 63%
in Northern Ireland and is significantly lower than Scotland (70%) and England (66%).
Digital radio listening continues to grow in Wales
• The amount of radio listening via a digital platform has been increasing, from 28% at the
start of 2013 to 47% in 2018.
• Ownership of DAB radio sets within Wales dropped slightly to 56% in 2018, despite
continuing to increase across the rest of the UK. Compared to Wales, take-up was higher
across the UK as a whole (64%) and in Scotland (66%) at the start of 2018 but remained
lower in Northern Ireland at 50%.
• Looking at all radio, around nine in ten adults listened to the radio each week in Wales in Q1
2018, and at 22 hours, they listened for longer each week than any of the other nations in
the UK.
• BBC Radio 2 was the station with the most weekly listeners in Wales in the first quarter of
2018.
1 Throughout the Satisfaction and Perceptions of TV chapter, ‘significantly’ has only been used to highlight any increase or decrease in scores that show statistically significant differences at the 95% confidence level for results compared within the current year, and at the 99% confidence level for results compared between years. For further details, please refer to the PSB Tracker technical report on Ofcom’s website: https://www.ofcom.org.uk/research-and-data/data/statistics/stats18

6

7
TV services and devices
Chapter overview
TV services are available in a variety of ways in Wales. Freeview is available through digital terrestrial
television (DTT) and delivered through a television aerial while Sky and Freesat offer satellite
services and Virgin Media offers a cable TV service. Set-top boxes from providers including TalkTalk
and BT offer a Freeview service alongside pay-TV channels delivered through an internet connection,
sometimes referred to as internet protocol television (IPTV).
There are also many on-demand and streaming services available to consumers over the internet.
These range from public service broadcaster (PSB) services like BBC iPlayer, ITV Hub, S4C’s Clic, All4
and My5 to the subscription services offered by Netflix and Amazon.
97.7% of premises in Wales had DTT coverage in 20182
DTT services are provided in Wales through a combination of public service broadcasting (PSB) and
commercial (COM) multiplexes.3 Examples of services on the PSB multiplex include BBC One, ITV,
Channel 4 and S4C, while the COM multiplexes provide access to services such as Dave, Sky News
and E4.
As of January 2018, 2.3% of premises in Wales had no DTT coverage at all, while over a quarter
(26.6%) had PSB coverage but were unable to receive the COM channels through their aerial.4 As
such, these households would need to receive television via satellite, cable or over the internet, in
order to watch the channels provided by the commercial multiplex.
2 Ofcom analysis of operator data, January 2018 3 Multiplexes are the transmission infrastructure used to distribute television services. 4 As above

8
At 97%, a higher proportion of homes in Wales had a television in the first quarter of 2018 than
across the UK as a whole (95.6%) and Scotland (94.5%), and on a par with Northern Ireland. A third
of homes in Wales (33.3%) had DTT only as their TV platform in Q1 2018.5
Half of homes in Wales had a satellite TV service in 2018
Satellite TV services are provided by Sky and Freesat and serve about 98% of UK
premises,6 with broadly the same level of availability across Wales. Sky’s paid
satellite service was the most popular pay-TV service in Wales at the beginning of
2018, serving 41.8% of homes. A further 8.6% had a free satellite service, most
likely from Freesat, meaning that at 50.4%, far more homes in Wales than the UK
average (37.1%) had a satellite TV service.7
Cable TV take-up in Wales continues to be lower than in the UK as a whole
Virgin Media’s cable service was available to more than 300,000 premises in Wales
(21.2%) in January 2018, a slight increase on the 20.9% of premises where it was
available in June 2016.8
One in ten homes (10.1%) had a cable TV service in Wales at the beginning of 2018
– lower than the 14.9% seen across the UK as a whole, and comparable with the
8.7% take-up among homes in Northern Ireland.9
5 Source: BARB Establishment Survey Q1 2018 6 Based on the availability of a line-of-sight path to the satellite. Does not include the impact of factors such as access in multi-dwelling units where it is not feasible to install a dedicated household satellite dish and where there is no internal wired distribution system for satellite, and the need for planning permission in some locations 7 Source: BARB Establishment Survey Q1 2018 8 Ofcom analysis of operator data, January 2018 9 Source: BARB Establishment Survey Q1 2018

9
Broadband in Wales
A download speed of 2Mbit/s is the minimum speed required to deliver standard definition (SD)
video, and 98.5% of premises in Wales had access to such a service in 2018 – an increase from 97.1%
in 2016. The vast majority (98.2%) of premises with PSB DTT coverage that were unable to receive
transmissions from the commercial multiplex through their aerial did have access to such a
broadband service in January 2018.10
Ofcom research shows that three quarters (75%) of households in Wales had fixed internet access in
2018, lower than the UK (80%) as a whole.11 Superfast broadband offers download speeds equal to
or greater than 30Mbit/s, and 36% of superfast lines in Wales delivered such speeds in 2017. This
was lower than the 43% across the UK.12
IPTV services are less popular in Wales than in the rest of the UK
The proportion of homes that have internet protocol television (IPTV) only (any
one of BT TV, TalkTalk TV, Plusnet TV, or a standalone YouView box, and do not
also have satellite, cable or other service), was only 5.5% in Wales in Q1 2018, the
lowest across the UK nations.13
10 Ofcom analysis of operator data, January 2018 11 Ofcom Technology Tracker H1 2018 12 Connected Nations 2017: Wales available at https://www.ofcom.org.uk/__data/assets/pdf_file/0023/108842/wales-connected-nations-2017.pdf. 13 Source: BARB Establishment Survey Q1 2018

10
Figure 1: Platform take-up in Wales, households (000s): 2012-2017
Source: BARB Establishment Survey. BBC areas. Household-level data, all TV sets in home, therefore there are platform overlaps. Notes: Data points are based on Q4 of each year until 2018 when it is Q1. From Q4 2015 the claimed usage element was removed, which led to an increase in the ‘TV set homes’ population. ‘Digital terrestrial only TV’ = receives digital TV through an aerial and not through DSAT/DCAB or other platforms. ‘Hybrid IPTV digital terrestrial only’ = receives digital terrestrial TV through any of BT TV/TalkTalk TV/YouView/Plusnet TV and not DSAT/DCAB/other platforms.
On-demand and streaming services offer additional content and options for consumers
A third (33%) of adults in Wales used subscription streaming and on-demand services, such as Netflix
and Amazon, in 2018. This is broadly the same proportion as in England (34%), Scotland (33%) and
Northern Ireland (34%).
However, BBC iPlayer was the most popular on-demand service in 2018, with 37% of adults using it,
followed by Netflix (25%) and ITV Hub (24%).14
14 Ofcom Technology Tracker H1 2018
0
100
200
300
400
500
600
700
800
900
1000
1100
1200
1300
1400
1500
2012 2013 2014 2015 2016 2017 2018
Hybrid IPTV and digitalterrestrial only
Digital terrestrial only
Digital cable
Free-to-view digital satellite
Pay-digital satellite
97.5% 96.8% 95.6% 96.9% 96.3% 97.5% 97.0%

11
Over half of TV households in Wales have a television connected to the internet
Over two in five (42%) households with a TV in Wales had a smart TV in H1 2018 and most of these
were connected to the home broadband service (79%). However, when we look at all forms of
internet connectivity, including broadband-connected smart TVs, more than half (52%) of TV
households in Wales have their TVs connected to the internet in 2018. Other ways people in Wales
connected their TV to the internet include: through games consoles (26%); laptops/desktops (15%),
and internet-connected dongles or set-top boxes (such as NOW TV set-top box, Roku, Google
Chromecast, Amazon Fire TV stick, Amazon Fire TV, Apple TV) (13%).15
Watching TV on the go has been enabled by the growth in smartphone take-up in recent years,
although in Wales just 78% of mobile phone users have a smartphone, a lower proportion than in
England (83%) and Northern Ireland (85%). Among smartphone users in Wales, 83% have a 4G
service, in line with Scotland and Northern Ireland. 16
15 Ofcom Technology Tracker H1 2018 16 Ofcom Technology Tracker H1 2018

12
TV and AV consumption
This section uses data provided by the Broadcasters’ Audience Research Board (BARB), a panel of
5,100 homes across the UK providing the official broadcast TV measurement for the industry. This
includes all viewing of broadcast TV through a television set, and via any device attached to the set
such as a computer, laptop or tablet. Unless otherwise stated, figures quoted are for seven-day
consolidated viewing. Consolidated viewing includes viewing of programmes at the time they were
broadcast on TV (live viewing) as well as from recordings on digital video recorders (DVRs) and
through catch-up player services (e.g. apps on smart TVs) up to seven days after the first broadcast
(time-shifted). See the methodology annex for more information.
In 2017 people in Wales spent an average of 3 hours 43 minutes per day watching broadcast television
Wales had the second-highest average viewing per day of the four nations (overtaken by Scotland
for the first time since 2011). Between 2016 and 2017, viewing fell by 17 minutes (7.1%) in Wales – a
steeper decline than the 4.2% average across the UK. Only Northern Ireland, down by 7.9% since
2016, had a steeper decline.17
17 Source: BARB. Source: BARB. All individuals (4+), network. Note: the number of hours calculations are made from minutes data to six decimal places, so may not always fit with the rounding to whole minutes in the charts.
13
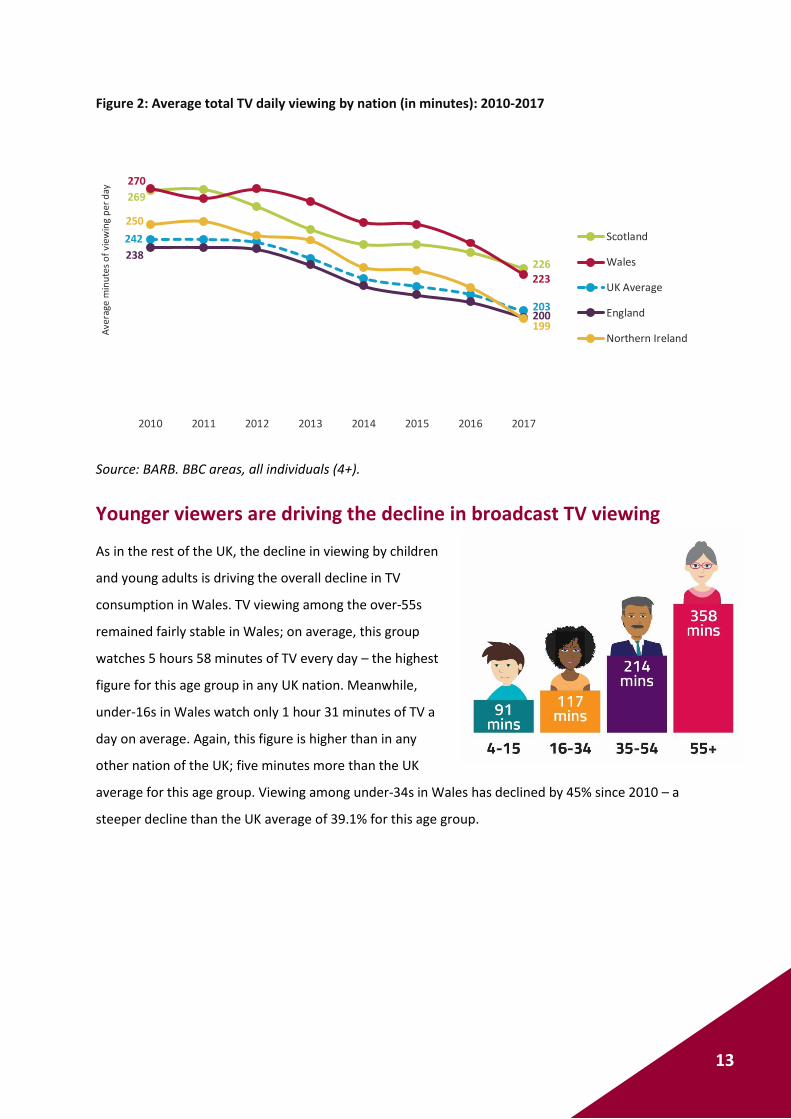
Figure 2: Average total TV daily viewing by nation (in minutes): 2010-2017
Source: BARB. BBC areas, all individuals (4+).
Younger viewers are driving the decline in broadcast TV viewing
As in the rest of the UK, the decline in viewing by children
and young adults is driving the overall decline in TV
consumption in Wales. TV viewing among the over-55s
remained fairly stable in Wales; on average, this group
watches 5 hours 58 minutes of TV every day – the highest
figure for this age group in any UK nation. Meanwhile,
under-16s in Wales watch only 1 hour 31 minutes of TV a
day on average. Again, this figure is higher than in any
other nation of the UK; five minutes more than the UK
average for this age group. Viewing among under-34s in Wales has declined by 45% since 2010 – a
steeper decline than the UK average of 39.1% for this age group.
Ave
rage
min
ute
s o
f vi
ewin
g p
er d
ay
269
226
270
223
242
203
238
200
250
199
2010 2011 2012 2013 2014 2015 2016 2017
Scotland
Wales
UK Average
England
Northern Ireland

14
Figure 3: Average daily minutes spent viewing total TV, by age group in Wales: 2010 - 2017
Source: BARB. BBC areas.
Non-broadcast viewing on TV sets continues to increase
As in the rest of the UK, although people in Wales are watching less broadcast television, they are
spending more time watching other things on their TV sets. Viewing of non-broadcast services on
the TV set (such as streaming services like Netflix and Amazon, and gaming) increased by 11 minutes
a day in 2017, to 44 minutes per person, per day. However, this increase did not totally offset the
overall decline in use of the television set, which decreased from 277 minutes per day in 2016 to 272
minutes in 2017.
Figure 4: Average daily minutes per person of total TV screen time in Wales
Source: BARB. BBC areas, all individuals (4+). * Note: Unmatched viewing refers to when the TV is in use, but content cannot be audio-matched or otherwise identified. It includes gaming, viewing DVDs/box sets/archives, SVoD, time-shifted viewing beyond 28 days, apps on smart TVs and navigation around EPG guides where there is no in-picture broadcast content. Audio-matched digital radio stations are excluded
Ave
rage
min
ute
s o
f vi
ew
ing
pe
r d
ay
367358
270
223261
214207
117
171
91
2010 2011 2012 2013 2014 2015 2016 2017
55+
All individuals (4+)
35-54
16-34
Children (4-15)
223 220 210 192
28 3130
31
4 44
5
23 28 3344
278 283 277 272
2014 2015 2016 2017
Total TV screen time
Unmatched viewing*
Time-shifted: 8-28 days
Time-shifted: up to 7 days
Live viewing
Industry standard BARB measurement is up to 7 days

15
The PSB channels
PSB is currently provided in Wales by the BBC, Channel 4 Corporation (C4C), ITV (holder of the
Channel 3 licence in Wales), Channel 5 and S4C. While all the BBC TV services are PSB, only the main
channels of the other broadcasters are. In return for providing PSB services such as news and
original productions, these broadcasters receive certain benefits: access to spectrum (the radio
waves that support wireless communication) to broadcast their services; prominence on electronic
programme guides on television (EPGs); and in the BBC’s case, the licence fee.
The main five PSB channels perform better in Wales than in the other UK nations
The main five PSB channels accounted for a combined 53.1% share of the total broadcast TV
audience in Wales in 2017. This audience share is higher than in Scotland and Northern Ireland, and
higher than the UK average of 50.9%. But although the main five PSBs, put together, had a relatively
high audience share in Wales in 2017, compared to the rest of the UK, this was not true of every
individual PSB. Channel 4 had a lower audience share in Wales than in all the other UK nations and
regions, with a 3.3% audience share (compared to the UK average of 4.8%). This may be because
Channel 4 in Wales has a lower position on the electronic programme guide (EPG); S4C occupies slot
4/104, so Channel 4 appears lower down on most TV platforms in Wales.
Figure 5: Percentage share of total TV viewing in the devolved nations of the UK, five main PSB
channels: 2017
Source: BARB. BBC areas, all individuals (4+).
22.4 20.023.7 21.8
5.84.8
6.15.8
15.117.7
16.214.6
4.9 4.83.3
4.8
4.1 3.63.8
3.9
52.450.9
53.150.9
Scotland Northern Ireland Wales UK
Channel 5
Channel 4
ITV/UTV/STV/ITV Cymru Wales
BBC Two
BBC One

16
Wales v Ireland in the Six Nations was the most-viewed TV programme in 2017
The most-viewed programme in Wales in 2017 was the Wales v Ireland Six Nations rugby match in
March. All in all, rugby accounted for five of the top ten programmes in Wales in 2017, and its
popularity helped to fuel a strong performance for BBC One in Wales: 15 of the top 20 programmes
were on BBC One Wales or BBC Two Wales. The premiere of the 2017 series of I’m a Celebrity - Get
Me out of Here! was the most-viewed ITV Cymru Wales show in 2017, and the third most-viewed of
all programmes in Wales.
Figure 6: The top 20 most-watched programmes in Wales, 2017
Source: BARB. BBC areas, all individuals (4+). Includes HD variants where applicable, excludes +1 variants. The TVR (television rating) is the measure of the popularity of a programme, daypart, commercial break or advertisement by comparing its audience to the population as a whole. One TVR is numerically equivalent to one per cent of a target audience.
Rank Programme Title Channel Date Average 000s % TVR % Share
1 Six Nations Rugby: Wales v Ireland BBC One Wales 10/03/2017 806 27.9 54.7
2 Mrs Brown's Boys Christmas Special BBC One Wales 01/01/2017 779 27.0 52.5
3 I'm a Celebrity - Get Me Out of Here! ITV Cymru Wales 19/11/2017 759 26.2 52.6
4 Strictly Come Dancing BBC One Wales 16/12/2017 746 25.7 58.1
5 Six Nations Rugby: Wales v England BBC One Wales 11/02/2017 741 25.7 62.4
6 Blue Planet II BBC One Wales 12/11/2017 700 24.2 47.8
7 Call the Midwife BBC One Wales 19/02/2017 695 24.1 48.2
8 Six Nations Rugby: Scotland v Wales BBC One Wales 25/02/2017 666 23.1 65.2
9 Britain's Got Talent (Series 11) ITV Cymru Wales 27/05/2017 648 22.4 44.8
10 Six Nations Rugby: France v Wales BBC One Wales 18/03/2017 647 22.4 67.8
11 New Year's Eve Fireworks BBC One Wales 31/12/2017 644 22.2 54.8
12 Strictly Come Dancing: The Results BBC One Wales 03/12/2017 617 21.3 45.0
13 Sherlock BBC One Wales 01/01/2017 611 21.2 39.2
14 Rugby Union: Wales v New Zealand BBC Two Wales 25/11/2017 590 20.4 48.9
15 Broadchurch ITV Cymru Wales 17/04/2017 589 20.4 38.2
16 Strictly Come Dancing Launch Show BBC One Wales 09/09/2017 587 20.3 48.0
17 Ant & Dec's Saturday Night Takeaway ITV Cymru Wales 18/03/2017 585 20.3 42.8
18 Death in Paradise BBC One Wales 05/01/2017 584 20.3 37.1
19 EastEnders BBC One Wales 25/12/2017 583 20.1 37.5
20 One Love Manchester BBC One Wales 04/06/2017 582 20.1 49.0

17
Keeping Faith breaks iPlayer records.
BBC Cymru Wales’ Keeping Faith was requested more than 9.5 million times on BBC iPlayer across
the UK, the highest ever number for a non-network show.18 The series was filmed simultaneously in
English and Welsh (Un Bore Mercher). The initial S4C broadcasts carried entirely English subtitles,
while repeat airings carried encoded English subtitles for scenes spoken in Welsh, before the show
was aired in English on BBC One Wales. BBC Wales has confirmed that Keeping Faith is the
broadcaster’s most-watched Welsh series on BBC One Wales in over twenty years and has confirmed
that a second series is in development.
BBC One Wales’ and ITV Cymru Wales’ early evening news bulletins attracted a lower share in Wales than their equivalents in the other devolved nations
Wales Today, BBC One Wales’ early evening news bulletin, attracted a 29.2% share of the slot’s
viewing in Wales, fairly stable since 2016 (28.8%) but lower than the equivalent early evening news
programmes in Scotland and Northern Ireland. ITV Cymru Wales’ counterpart Wales at Six attracted
a lower 20.6% share, slightly down on 2016 (22.2%) and on a par with the Channel 3 UK average
share (20.5%) of the slot.19
18 http://www.bbc.co.uk/mediacentre/latestnews/2018/keeping-faith 19 Source: BARB. Individuals (4+). UK averages based on share to respective early evening news bulletin time slots (using the London news schedule). BBC One’s news is based on BBC Wales area, ITV news is based on ITV Wales area. Channels include HD variants but not +1s.

18
Figure 7: Audience share % of BBC One Wales and ITV Cymru Wales early evening news: 2017
Source: BARB. All individuals (4+). Note: Early evening (‘local’) news bulletin figures based on ‘regional news’ genre programmes, start time 17:55-18:35, 10mins+ duration, weekdays. UK averages based on share to respective early evening news bulletin time slots (using the London news schedule). BBC One’s early evening news bulletin is transmitted between 18:30-19:00 and based on BBC areas. ITV Cymru Wales is transmitted between 18:00-18:30 and is based on ITV areas.
S4C viewing and reach increased in 2017
In a typical week in 2017, 364,00020 viewers in Wales watched S4C on television for at least three
consecutive minutes. This was the highest level of reach since 2014, and when all viewers across the
UK are taken into account, it increases to 562,000, up by 3.1% on 2016. When we include figures for
viewing on the TV set between eight and 28 days after transmission, S4C’s 2017 reach increased by
2% to 373,000 in Wales and by 25% across the UK to 700,000.21
20 These reach figures are rounded to the nearest 1000. 21 Source: BARB. All individuals (4+), S4C total area and S4C network. Reach criteria: 3+ consecutive minutes, full weeks used.

19
Figure 8: Average weekly reach (000s) of S4C, individuals: 2010-2017
Source: BARB. Individuals (4+). S4C total area and S4C network. Reach criteria: 3+ consecutive minutes, full weeks used. Consolidated up to 7 days.
Time spent watching S4C increased in Wales in 2017 to 13 hours 18 minutes per person, per year,
following four years of decline. The spread of viewing by genre on S4C has remained broadly
consistent year on year, although sport was driven up by the World Cup qualifiers. Sport accounted
for the largest proportion of viewing, at 27%, while news dropped to 2013 levels. The proportion of
children’s viewing increased to its highest level since 2014.22
Figure 9: Proportion of viewing to S4C in Wales, by genre, individuals
Source: BARB. All individuals (4+), S4C total area. News and weather on S4C is for Wales only and has been placed in the national news/weather category. All other genres = Music: contemporary, news: other, visual & performing arts, religion, music: other, weather, music: classical, education, party political broadcast, current affairs: other, docs: science & natural history, current affairs: political/ economic/ social, UK films and BARB ‘other’ /unspecified
22 Source: BARB. All individuals (4+). S4C total area.
620 631589 575 559
614545 562
470 480 456401 375 349 339 364
In Wales (000s) Across the UK (000s)
22% 20% 20% 20% 21%27%
9% 11% 12% 13% 13%
12%15% 15% 16% 11% 12%
11%8% 7%
8%9%
10%9%
12% 10%11%
8%8%
9%6% 8%
6%
7%9%
7%8% 7% 7%
8%6%
6%5% 5% 6%
7%7%
5%6% 6% 6%7%
5% 4%
20% 19% 17% 20% 18% 17%
2012 2013 2014 2015 2016 2017
All other genres
UK Drama
Natl/Intl News
Visual & Performing Arts
Entertainment
Children’s
Docs: Other
UK Soaps
Curr Aff: Other
Sport

20
TV programming for viewers in Wales
Chapter overview
The BBC and ITV provide content specifically for viewers in Wales, over and above what they show
across the UK. This is across a range of genres but has a particular focus on news and current affairs.
S4C is a channel dedicated to Welsh-language programming across a wide range of genres.
The analysis below focuses on first-run UK originations, which are programmes commissioned by or
for a licensed public service channel with a view to their first showing on television in the UK in the
reference year. Spend on such content includes all costs incurred by the broadcaster associated with
making programmes. These include both direct and indirect production costs for in-house
productions, and licensing costs for commissioned programmes, but exclude costs related to
marketing and distribution.
There was an 8% real-terms increase in spend on programming for viewers in Wales by the BBC and ITV in 2017
In 2017, the BBC and ITV combined spent £29.1m on first-run UK-originated content for viewers in
Wales, an 8.1% increase in real terms on 2016. Half of this total spend was on news and current
affairs content (£14.6m) with the rest (£14.5m) on other genres.

21
Figure 10: First-run UK originated content for Wales, by genre
Source: Ofcom/broadcasters. Note: Figures are expressed in 2017 prices. Excludes spend on S4C output.
In 2017, BBC spend for viewers in Wales increased by 12% in real terms
The BBC contributed £23m of total first-run spend in 2017, a 12% increase in real terms on 2016,
bringing spend back up to 2015 levels. ITV Cymru Wales spent £6.1m on new UK content in 2017 and
has maintained this level of investment in real terms since 2013.
22
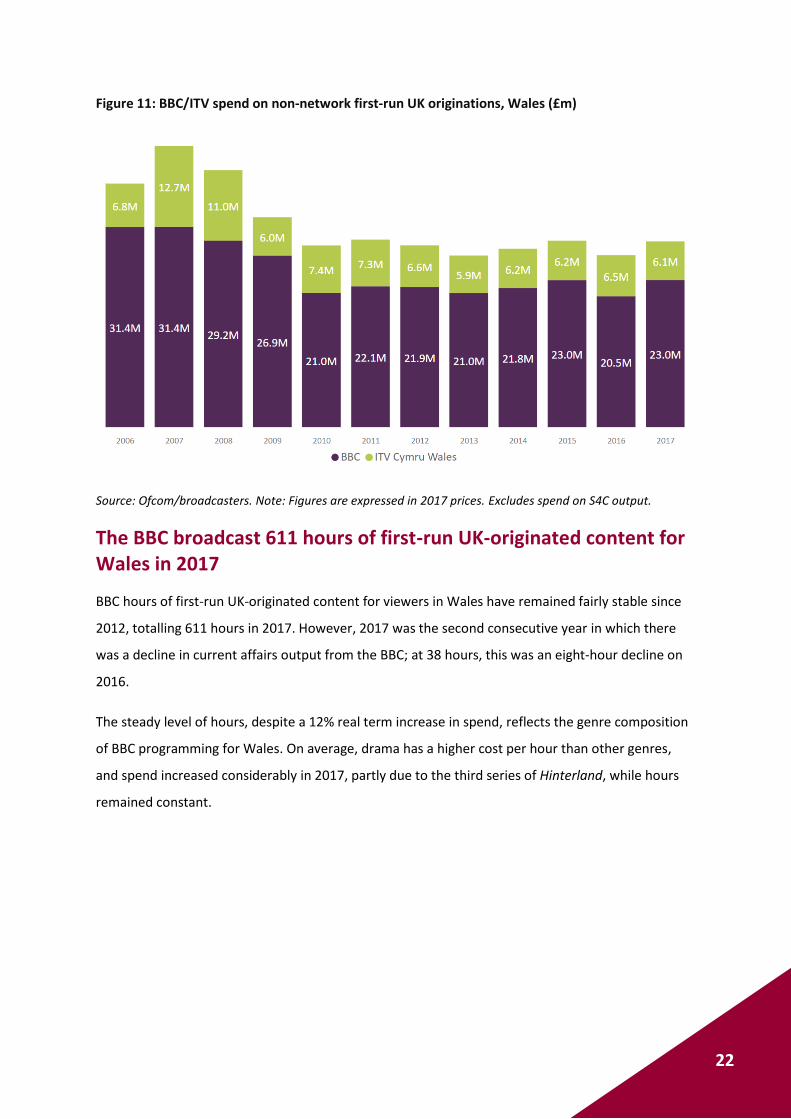
Figure 11: BBC/ITV spend on non-network first-run UK originations, Wales (£m)
Source: Ofcom/broadcasters. Note: Figures are expressed in 2017 prices. Excludes spend on S4C output.
The BBC broadcast 611 hours of first-run UK-originated content for Wales in 2017
BBC hours of first-run UK-originated content for viewers in Wales have remained fairly stable since
2012, totalling 611 hours in 2017. However, 2017 was the second consecutive year in which there
was a decline in current affairs output from the BBC; at 38 hours, this was an eight-hour decline on
2016.
The steady level of hours, despite a 12% real term increase in spend, reflects the genre composition
of BBC programming for Wales. On average, drama has a higher cost per hour than other genres,
and spend increased considerably in 2017, partly due to the third series of Hinterland, while hours
remained constant.
23
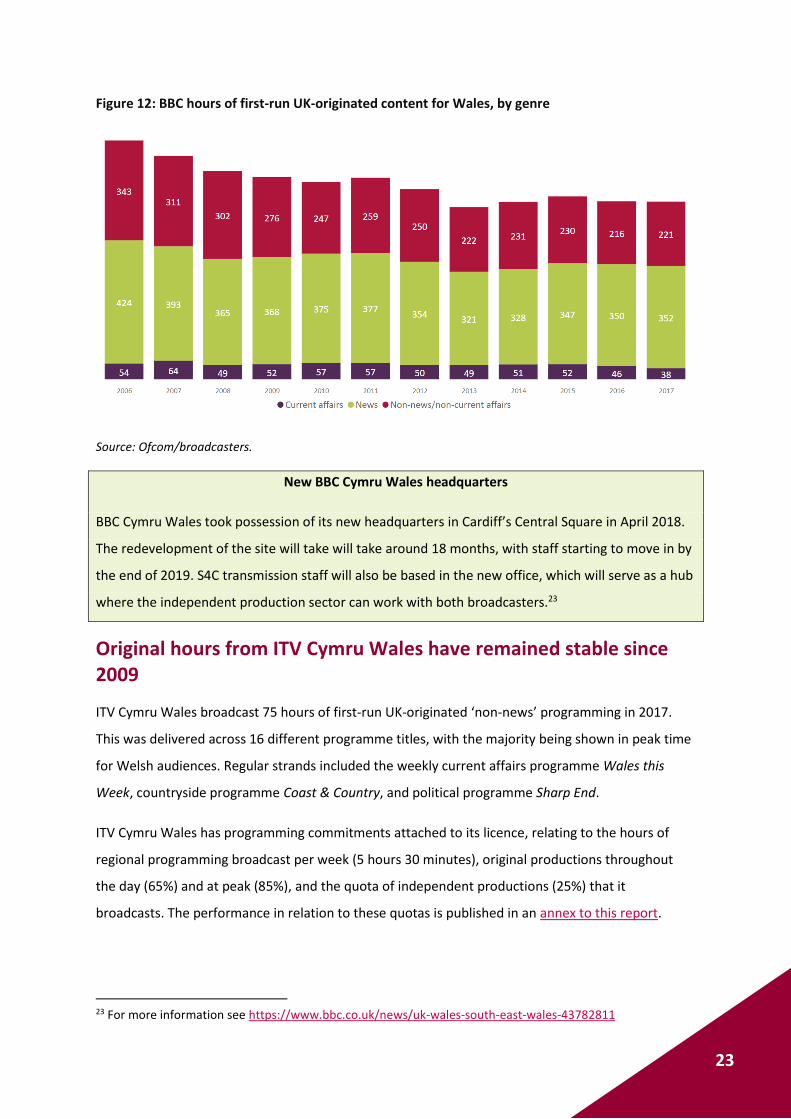
Figure 12: BBC hours of first-run UK-originated content for Wales, by genre
Source: Ofcom/broadcasters.
New BBC Cymru Wales headquarters
BBC Cymru Wales took possession of its new headquarters in Cardiff’s Central Square in April 2018.
The redevelopment of the site will take will take around 18 months, with staff starting to move in by
the end of 2019. S4C transmission staff will also be based in the new office, which will serve as a hub
where the independent production sector can work with both broadcasters.23
Original hours from ITV Cymru Wales have remained stable since 2009
ITV Cymru Wales broadcast 75 hours of first-run UK-originated ‘non-news’ programming in 2017.
This was delivered across 16 different programme titles, with the majority being shown in peak time
for Welsh audiences. Regular strands included the weekly current affairs programme Wales this
Week, countryside programme Coast & Country, and political programme Sharp End.
ITV Cymru Wales has programming commitments attached to its licence, relating to the hours of
regional programming broadcast per week (5 hours 30 minutes), original productions throughout
the day (65%) and at peak (85%), and the quota of independent productions (25%) that it
broadcasts. The performance in relation to these quotas is published in an annex to this report.
23 For more information see https://www.bbc.co.uk/news/uk-wales-south-east-wales-43782811

24
Figure 13: ITV hours of first-run UK-originated content for Wales, by genre
Source: Ofcom/broadcasters.
Local TV in Wales
There were three local TV stations broadcasting in Wales in 2018. Cardiff’s service was the first to
launch in 2014, followed by the service for Swansea in 2016 and the service for Mold in 2017.
Each channel has programming commitments attached to its licence, typically to do with the
required hours of local programming, including local news and current affairs. These commitments
can be found on Ofcom’s website. Ofcom granted a variation to the programming commitments of
the Swansea service earlier in 201824.
Across the PSB channels, 2.4% of qualifying network programmes broadcast in 2017 were Wales productions.
The public service broadcasters produce programming across the UK, based on Ofcom’s regional
production guidance.25 Of all qualifying hours in 2017, 2.4% were Wales productions, accounting for
3.4% of all qualifying spend, up from 3.2% in 2016.
24 https://www.ofcom.org.uk/__data/assets/pdf_file/0028/112987/swansea-change-request.pdf 25 The main purpose of the PSBs’ regional production requirements, measured against their out-of-London quotas, is to support and strengthen the TV production sector and creative economies in the nations and regions of the UK. Ofcom is currently reviewing the guidance and published a call for evidence in March 2018: https://www.ofcom.org.uk/consultations-and-statements/category-2/regional-production-programming-guidance-review.

25
The bulk of these hours were BBC productions, with productions from Wales making up 4.4% of the
BBC’s qualifying hours and 6.7% of its qualifying spend in 2017. This covered a broad range of
programming, including high-volume productions such as Bargain Hunt and Casualty as well as
drama productions with typically higher production budgets such as Sherlock and Doctor Who.
More than 2% of Channel 4’s qualifying hours (2.7%) and spend (2.2%) were assigned to Wales
productions in 2017; One Born Every Minute was the most high-profile production. The vast majority
of ITV’s (99.7%) and Channel 5’s (98.8%) qualifying network productions continued to be produced
in England in 2017.
Figure 14: Expenditure on and hours of originated network productions out of London: 2010-2017
Source: Ofcom/broadcasters. Note: Figures do not include network news production. The category ‘other’ refers to programmes made by producers based within the M25, which qualify as regional productions on the grounds that 70% of total spend and 50% of off-screen talent spend was outside the M25 but not all in one macro-region, and therefore cannot be attributed to a single region. See www.ofcom.org.uk/__data/assets/pdf_file/0019/87040/Regional-production-and-regional-programme-definitions.pdf on Ofcom website for further details.
Cardiff shortlisted for Channel 4’s national HQ and Creative Hubs
Cardiff is shortlisted in the second stage of the competitive process for the new national HQ, and
two Creative Hubs, that Channel 4 will open from 2019. The decision will be made in October 2018,
with Cardiff facing competition from six cities for the national HQ and from 12 cities for the two
Creative Hubs.26
26 http://www.channel4.com/info/press/news/channel-4-reveals-shortlist-for-new-national-hq-and-creative-hubs
15.1% 16.7%20.0% 19.9%
22.5% 20.3% 21.5% 20.2%
12.6%14.7%
12.1% 13.6%13.3%
14.0%7.8% 9.7%
2.8%
2.5% 2.6% 2.1%1.6%
1.1%
1.9% 1.5%4.6%
4.9% 4.4%5.9%
5.2%4.3%
5.7% 5.6%2.6%
2.8% 3.5%3.3% 3.2%
3.5%3.2% 3.4%0.4%
1.0% 0.8%1.1% 1.2%
0.9%1.5% 1.2%
1.2%
2.3% 1.4%1.5%
1.5% 2.0%
2010 2011 2012 2013 2014 2015 2016 2017
Other
Northern Ireland
Wales
Scotland
Midlands & East
Southern England
Northern England
11.6% 13.4%18.2%
21.1%24.1% 21.8% 23.1%
19.7%
12.9% 10.9%
10.1%
12.1%11.1%
10.4% 8.0%10.4%
8.3% 7.7%
6.3%
6.1%5.1%
5.5% 6.7%6.0%
4.6% 6.8%7.2%
8.4% 7.5%7.2% 8.6%
8.5%1.4%
1.6%
1.7%
1.4% 1.8%2.7%
2.5%2.4%
0.8%
0.9%
0.9% 0.8%0.9%
1.1%0.9%
2010 2011 2012 2013 2014 2015 2016 2017
Spend Hours
London
61.8% 57% 55.4% 51.9% 51.7% 54.4% 56.8% 56.6%
London
60.8% 58.5% 54.7% 49.3% 49% 50.8% 49.4% 51.2%

26
S4C spent £62.9m on first-run commissions broadcast in 2017-18
S4C spent £62.9m on original commissions broadcast in 2017/18 across eight genres of
programming. Drama and general factual programming combined accounted for nearly half of this
spend (£31.2m) with the rest distributed across the genres, as shown below. In addition, the BBC
provided 508 statutory programming hours for S4C, down from 538 the previous year.
Figure 15: S4C spend on first-run commissions: 2017-18 (£m)
Source: S4C. Note: current affairs programming includes weather.
The UK Government’s independent review of S4C was published in March 2018
The UK Government appointed Euryn Ogwen Williams to lead an independent review of S4C. The
review examined three issues:
1) S4C’s public service remit and its ability to deliver high-quality content;
2) S4C’s funding methods; and
3) S4C’s governance structure.
16
15
2
9
7
4
9
1
Drama
General factual
Current affairs
Light music/entertainment
Children's
Music & arts
Sport
Religion

27
The report was published on 29 March27 and made seven recommendations.
Recommendation
Chapter 1: Delivering High Quality Content and Serving Welsh Speaking Audiences
Recommendation 1:
The government should update S4C’s public service remit to include digital and online services
and remove the current geographical broadcasting restrictions. This will allow S4C to broaden its
reach and offer its content on a range of new platforms in the UK and beyond.
Recommendation 2:
S4C should establish an in-house digital hub to develop and improve S4C’s digital footprint and
form the basis of a Welsh language digital cluster.
Recommendation 3:
S4C should establish a language partnership with the Welsh Government and others to help
deliver the Welsh Government’s commitment to reach 1 million Welsh language speakers by
2050.
Chapter 2: Guaranteeing an S4C for the future
Recommendation 4:
S4C’s public funding should be provided entirely through the licence fee from 2022/23 onwards,
with all future funding decisions made as part of the BBC licence fee funding settlement.
• The UK Government currently provides about 8% of the channel's £84m budget - £6.7m -
with 90% coming from the licence fee and 2% from S4C's own commercial income. The UK
contribution is guaranteed until 2020.
Recommendation 5:
The government should consider amending current approval requirements to give S4C greater
freedom to invest and generate commercial revenue.
Chapter 3: Securing an independent and effective S4C
Recommendation 6:
The S4C Authority should be replaced with a new unitary board comprising executive and
non-executive directors.
Recommendation 7:
The government should consider whether S4C’s current financial audit arrangements are suitable,
including whether it would be appropriate to appoint the Comptroller and Auditor General as
S4C’s external auditor.
The UK Government accepted all the review’s recommendations and now expects S4C to take these
forward. S4C is due to provide a detailed implementation plan by July 2018 on how it will deliver the
necessary reforms.
27 Available at https://www.gov.uk/government/publications/building-an-s4c-for-the-future-an-independent-review-by-euryn-ogwen-williams

28
S4C’s digital strategy
S4C has announced that it will spend £3m over the next three years to develop the channel’s digital
strategy.28 In line with the recommendations of the DCMS review, S4C has already approved changes
in the way the channel connects with viewers. This entails improving and expanding the online
viewing platform, S4C Clic, and varying the the content on offer: long-form, short-form and mid-
form. S4C will work to get to know its viewers better and will enable users to create personal
homepages on S4C Clic.
28 https://rts.org.uk/article/future-s4c-wales

29
Satisfaction with and perceptions of TV
Chapter overview
This chapter examines TV audiences’ overall satisfaction with PSB channels in Wales, and their
opinions on the importance and delivery of a range of purposes and characteristics29, with data
drawn from Ofcom’s 2017 PSB tracker survey.30 It then considers audience satisfaction with
broadcasting standards, using data from Ofcom’s 2017 cross-platform media tracker survey.
Seven in ten PSB viewers were satisfied with PSB content in 2017
Seventy-two per cent of regular or occasional viewers in Wales of any PSB channel (BBC One, BBC
Two, ITV Wales, Channel 4 and Channel 5) claimed to be either very, or quite satisfied with PSB
broadcasting. This compares to 75% for the UK average, 75% in England, 71% in Scotland and 69% in
Northern Ireland.31
Looking at news provision by the PSBs, audiences in Wales rated delivery of “Its news programmes
are trustworthy” highly at 65%. This compares with the UK average of 69%, England (68%) and
Northern Ireland (74%). It is significantly32 lower than in Scotland (79%).
29 The statutory purposes and objectives of public service broadcasting are set out in Section 264 of the Communications Act 2003. In Ofcom’s first PSB Review, we built on these, following extensive research and consultation, creating a framework of PSB purposes and characteristics. 30 For details on the methodology and questionnaire, please refer to the PSB tracker technical report on Ofcom’s website at https://www.ofcom.org.uk/research-and-data/data/statistics/stats18 31 Ofcom PSB tracker 2017. For details on the methodology and questionnaire, please refer to the PSB tracker technical report on Ofcom’s website at https://www.ofcom.org.uk/research-and-data/data/statistics/stats18 32 Throughout the Satisfaction with and perceptions of TV chapter ‘significantly’ has only been used to highlight any increase or decrease in scores that show statistically significant differences at the 95% confidence level for results compared within the current year, and at the 99% confidence level for results compared between years. For further details, please refer to the PSB tracker technical report on Ofcom’s website at https://www.ofcom.org.uk/research-and-data/data/statistics/stats18

30
PSB viewers in Wales rated the range of news output less highly than the rest of the UK
Figure 16 shows the ratings for the delivery of “regional news programmes providing a wide range of
good quality news about my area” for BBC One, ITV and all channels combined, by nation. Seventy
per cent of regular viewers in Wales rated BBC One highly for its wide range of quality news. This
was lower than the UK average (75%) and the other nations: Northern Ireland (79%), Scotland (78%)
and England (75%), although the differences are not significant.
ITV in Wales received the same score as BBC One (70%). This score is significantly lower than the
score in Scotland (85%). In comparison, the UK average score is 75%, Northern Ireland is 80% and
England is 74%.
Figure 16: Delivery of regional news programmes providing a wide range of good quality, by
nation: 2017
Source: Ofcom PSB tracker 2017.Q15 How would you rate each channel individually on this statement, on a scale of 1 to 10, where 10 is the highest score and 1 is the lowest? Q16 How would you rate BBC One and ITV combined on this statement? Base for individual channels: Self-reported regular viewers of each in each nation (BBC One = 2207, 1384, 351, 292, 180; ITV1 = 1884, 1183, 286, 246 ,169). Base for ‘All channels combined’: All respondents who ever watch any PSB channels in each nation (3098, 1957, 502, 400, 239).
75% 75%70%
75% 74%70%
78%
85%
76%
70% 70% 69%
79% 80%
71%
BBC One ITV/ STV/ ITV Wales/ UTV All channels combined
UK England Scotland Wales NI
% Rating as 7-10 out of 10 for delivery
Shows significant differences between nations for BBC One/ITV/All channels combined at 95% level
UK England Scotland NIWales

31
PSB viewers in Wales rated the representation and diversity of the PSBs less highly than viewers in the other UK nations
Almost half of regular/occasional PSB audiences in Wales (47%) rated the performance delivery of “It
portrays my region/nation fairly to the rest of the UK” highly. While this score is comparable to
Northern Ireland (48%), it is significantly lower than Scotland (62%) and England (56%).
“It shows different parts of the UK, including England, Northern Ireland, Scotland and Wales” was
rated highly for delivery by 56% of regular/occasional PSB audiences in Wales. This compares to 63%
in Northern Ireland and is significantly lower than Scotland (70%) and England (66%).
Sixty-two per cent of regular/occasional PSB audiences in Wales rated “Its programmes show
different kinds of cultures within the UK” highly for delivery. This is comparable to Northern Ireland
(65%) and England (66%) but is significantly lower than Scotland (71%).
Figure 17: Reflecting identity/ representing diversity in the nations, by nation: 2017
Source: Ofcom PSB tracker 2017. Q15 How would you rate each channel individually on this statement, on a scale of 1 to 10, where 10 is the highest score and 1 is the lowest? Base: All respondents who watch any PSB channels regularly or occasionally in each nation: 2017 (1957, 502, 400, 239).
56%
66% 66%62%
70% 71%
47%
56%
62%
48%
63% 65%
It portrays myregion/Scotland/Northern
Ireland/Wales fairly to the rest ofthe UK
It shows different parts of the UK,including England, NorthernIreland, Scotland and Wales
Its programmes show differentkinds of cultures within the UK
England Scotland Wales NI
% Rating as 7-10 out of 10 for delivery
Shows significant differences between nations for BBC One/ITV/all channels combined at 95% level
UK England Scotland NIWales

32
Attitudes to TV in Wales
One of Ofcom’s duties under the Communications Act 2003 is to ensure that people who watch
television and listen to the radio are provided with appropriate protection from harmful or offensive
material. The Ofcom cross-platform media tracker looks at attitudes to offensive language, sex and
violence on an annual basis.
Television audiences in Wales are significantly more likely than audiences in the UK to say that there
is too much sex on TV (32% vs. 25%). They also feel that there is too much violence (38% vs. 34% for
the UK), too much swearing (39% vs. 33%) and that TV has got worse in the past year (26% vs. 22%).
However, these differences are not significant.
Source: Ofcom cross-platform media tracker 2017. Base: All with any TV sets in 2017; UK (2,313); Wales (237)

33
The radio listener
Chapter overview
This chapter provides an overview of the key developments in the radio and audio market in Wales,
including who is listening, how they are listening and what they are listening to. It also looks at the
availability of DAB (digital audio broadcasting) services in Wales.
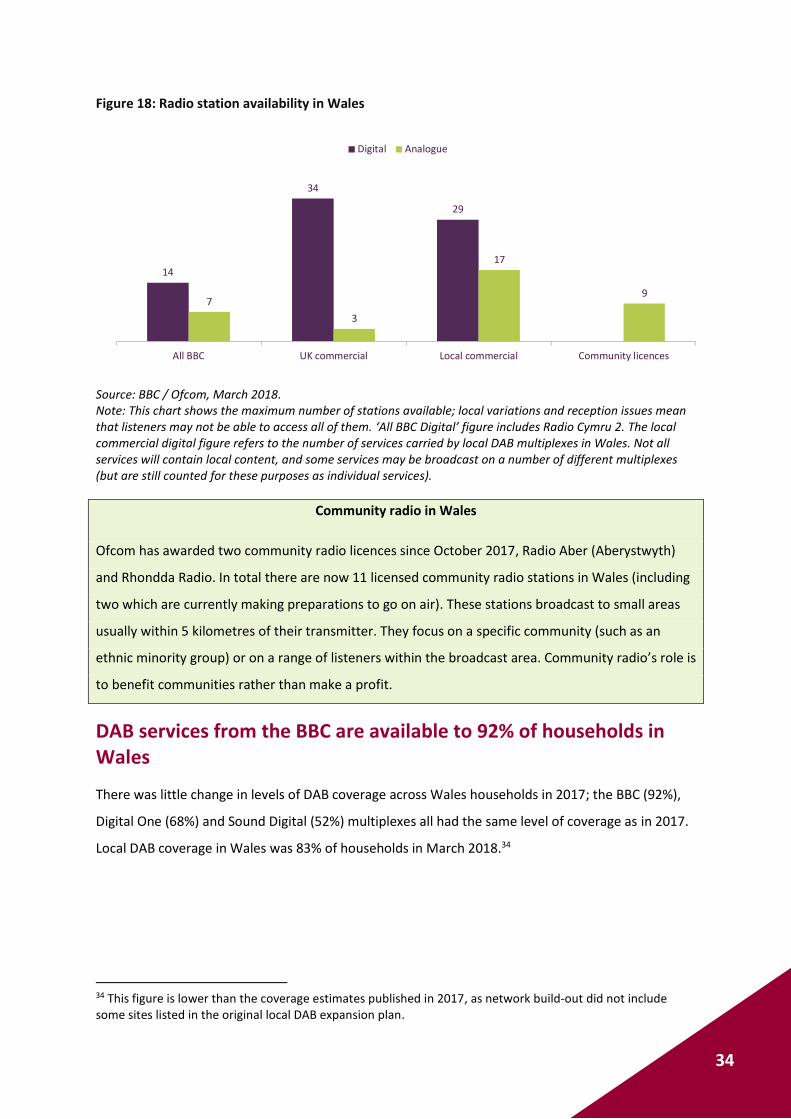
There were 77 services broadcasting on DAB multiplexes across Wales in March 201833
Most of the DAB services available in Wales (34) were commercial stations that broadcast across the
UK. However, nearly as many local commercial services were also broadcasting (29) in various parts
of Wales. There were 36 analogue stations broadcasting across Wales in 2018, including nine
community stations. Local commercial radio stations available include Heart and Capital stations
(owned by Global or Communicorp), serving communities in north and south Wales, Nation
Broadcasting’s portfolio of stations (including Radio Ceredigion and Nation Radio) and Wireless
Group’s The Wave and Swansea Sound.
33 There may some duplication in the services counted here, where services broadcast on more than one Welsh local multiplex.
34
Figure 18: Radio station availability in Wales
Source: BBC / Ofcom, March 2018. Note: This chart shows the maximum number of stations available; local variations and reception issues mean that listeners may not be able to access all of them. ‘All BBC Digital’ figure includes Radio Cymru 2. The local commercial digital figure refers to the number of services carried by local DAB multiplexes in Wales. Not all services will contain local content, and some services may be broadcast on a number of different multiplexes (but are still counted for these purposes as individual services).
Community radio in Wales
Ofcom has awarded two community radio licences since October 2017, Radio Aber (Aberystwyth)
and Rhondda Radio. In total there are now 11 licensed community radio stations in Wales (including
two which are currently making preparations to go on air). These stations broadcast to small areas
usually within 5 kilometres of their transmitter. They focus on a specific community (such as an
ethnic minority group) or on a range of listeners within the broadcast area. Community radio’s role is
to benefit communities rather than make a profit.
DAB services from the BBC are available to 92% of households in Wales
There was little change in levels of DAB coverage across Wales households in 2017; the BBC (92%),
Digital One (68%) and Sound Digital (52%) multiplexes all had the same level of coverage as in 2017.
Local DAB coverage in Wales was 83% of households in March 2018.34
34 This figure is lower than the coverage estimates published in 2017, as network build-out did not include some sites listed in the original local DAB expansion plan.
14
34
29
7
3
17
9
All BBC UK commercial Local commercial Community licences
Digital Analogue

35
Figure 19: Household coverage of DAB (%)
Source: BBC, Arqiva, Ofcom, March 2018.
Radio Cymru 2
BBC Radio Cymru’s second Welsh language station, Radio Cymru 2, launched at the end of January
2018, having been trialled in 2016 to celebrate Radio Cymru’s 40th anniversary. Radio Cymru 2
received funding from the BBC to develop and sustain the station during its first year. It is available
on weekdays between 7am and 10am on DAB, BBC Radio iPlayer and digital TV (subject to agreeing
contractual arrangements with the relevant DAB operators).
Digital radio ownership dipped slightly in Wales in 2018
Ownership of DAB radio sets in Wales dropped slightly to 56% in 2018, despite continuing to
increase across the rest of the UK. Take-up was higher across the UK as a whole (64%) and in
Scotland (66%) at the start of 2018, but remained lower in Northern Ireland, at 50%.
Among radio listeners in Wales, 36% had a DAB radio in the home in 2018,35, broadly in line with
Scotland (40%) and higher than Northern Ireland (28%).36
35 These are ‘active’ digital radio sets in the home, i.e. a radio that is used by someone in the household most weeks. 36 Ofcom Technology Tracker, H1 2018
97% 98%
87%
95%92%92% 95%
85%82%
68%
77%81%
57%
65%
52%
91% 92%88% 85% 83%
UK England Northern Ireland Scotland Wales
BBC National DAB Digital One Sound Digital Local DAB

36
Figure 20: DAB ownership
Source: RAJAR, all adults (15+), Q1 for each year BBC nations’/local radio TSA in each nation
Digital listening continued to grow in 2018
The amount of listening that is through a digital platform has increased; from 28% at the start of
2013 to 47% five years later. This is lower than in the UK as a whole (51%), the same as in Scotland
(47%) and far greater than in Northern Ireland, where only around a third of total listening was
digital in Q1 2018 (35%).
Although listening online has seen the greatest increase in Wales in recent years, listening through
DAB radio now accounts for a third of all listening (33%).
Figure 21: Share of listening hours via digital and analogue platforms in Wales: 2013-2018
Source: RAJAR, all adults, Q1 of each year, BBC Radio Wales TSA
% of population
England
Scotland
Northern Ireland
UK44%
64%
46%
64%
37%
66%
37%
56%
23%
50%
2013 2014 2015 2016 2017 2018
Wales
27.8%
46.6%
72.2%
53.4%
2013 2014 2015 2016 2017 2018
Total Digital
Total Analogue

37
Nearly eight in ten radio listeners in Wales without a DAB set say they’re unlikely to buy one in the next year
Only 6% of radio listeners without a DAB radio in Wales say they are likely to get one in the next 12
months; the vast majority are unlikely to do so (79%).
Among those unlikely to get a DAB radio in the next 12 months, more than half (51%) said they were
happy using an existing service, while 46% said they had no need of a DAB radio.37
Figure 22: Likelihood of purchasing a DAB radio within the next year
Source: Ofcom Technology Tracker, Half 1 2018. Base: Adults aged 16+ who listen to radio, have any active radio sets at home and do not have a DAB set** (n = 675 UK, 98* Wales, 361 England, 110 Scotland, 106 Northern Ireland, 48* Wales urban, 50* Wales rural). *Caution: Low base, treat as indicative only. Significance testing: Arrows indicate any significant differences at the 95% confidence level between Wales and UK in 2018 and between Wales urban and rural in 2018. QP12: How likely is it that your household will get a DAB radio in the next 12 months?
Live radio is the most popular listening activity in Wales
On average, adults in Wales spend 14 hours 45 minutes each week listening to any type of audio;
81% of this is to live radio. This is greater than the proportion of time spent on live radio across the
UK (75%). Adults in Wales are less likely than adults across Great Britain (8%) or Scotland (7% vs.
11%)38 to spend time listening to streamed music (e.g. Spotify and Apple Music). This is reflected in
the fact that adults in Wales are less likely to subscribe to a music streaming service (25%) than
adults in Great Britain (30%) or Scotland (33%).39
37 Ofcom Technology Tracker, Half 1 2018 38 The TouchPoints sample covers Great Britain and so excludes Northern Ireland 39 TouchPoints 2017
14%6%
16%5% 9% 5% 7%
68% 79%68%
62% 53%
80% 75%
19% 15% 16%
34% 38%
15% 18%
UK 2018 Wales 2018 England 2018 Scotland 2018 N Ireland 2018 Wales urban2018
Wales rural2018
Don't know
Unlikely
Likely

38
Figure 23: Proportion of time spent listening to different types of audio
Source: TouchPoints 2017 Base: GB adults 15+; Government Office Regions: Wales; Scotland
Music is the most valued type of audio content for listeners across Great Britain as a whole, and in
Wales, followed by national news. For listeners in Wales, local news coverage is the third most
valued type of content, ahead of breaking news.
Figure 24: Top ten most-valued types of content on the radio
Source: TouchPoints 2017 Base: GB adults 15+; Government Office regions: Wales; Scotland
71% 67%76%
8%11%
6%8% 8%
7%4% 4%
5%3% 3%3%2% 3%3%
Great Britain Scotland Wales
Radio podcasts/downloads
On demand/listen again radio programmes
Other podcasts/downloads
Music video channels/sites for backgroundlistening e.g. YouTube, MTV
Your own personal collection on CD, vinyl record,etc.
Live radio on a laptop, tablet, mobile, etc. (not aradio set, car radio or TV set)
Your own personal digital music or audiocollection - stored on a device
Streamed online music e.g. Spotify, last.fm
Live radio on a radio set
52%
34%
28% 27%
21%20% 19%
13% 13% 13%
53%
36%
27%29%
18%19% 19%
12%11% 11%
52%
34%
28%
35%
23% 22%
19%16%
13% 12%
Music National news Breaking news Local news Local traffic andtravel
Weather Internationalnews
Football Current affairs Djs/Presenters
Great Britain Wales Scotland

39
Ninety per cent of adults listened to the radio each week in Wales in Q1 2018
Nine in ten adults listened to the radio each week in Wales in Q1 2018, and at an average of 22
hours per week, they listen for longer than adults in any of the other UK nations. Seventy-one per
cent listen to BBC radio services each week, down from 76% five years ago. Commercial radio
listening has remained stable over the period; 60% of adults tune in each week (61% in 2013).
Culture, Welsh Language and Communications committee
The National Assembly for Wales’ Culture, Welsh Language and Communications Committee is
holding an inquiry into radio in Wales. The terms of reference to the consultation were to assess:
• the extent to which BBC Cymru Wales radio services, commercial radio services and community radio services meet the needs of audiences in Wales;
• the possible impact of the deregulation of commercial radio on audiences in Wales;
• ownership structures of commercial radio and their impact on local content;
• the impact of new technology on local content;
• the financial sustainability of community radio services in Wales; and
• the suitability of Wales’s radio broadcasting infrastructure.
Ofcom’s former Wales Director, Rhodri Williams, and Head of Radio Licensing and Planning, Neil
Stock, gave evidence to the committee on the deregulation of commercial radio in February 2018.40
The Committee due to publish its report shortly.
Figure 25: Average weekly reach and listening hours
Source: RAJAR, all adults (15+), Q1 2018 BBC nations’/local radio TSA in each nation
40 A transcript of the session can be found at http://record.assembly.wales/Committee/4561
90.2%93.4%90.1%88.3%89.9%Reach
20:4819:1822:0021:0620:48Average weekly
listening
UK TOTALNorthern Ireland
WalesScotlandEngland
Reach
Average weekly listening
UK TOTALWalesScotlandEngland

40
The BBC’s network radio stations are particularly popular in Wales
As a proportion of all radio listening, more time is spent listening to BBC UK-wide services in Wales
than in any other UK nation. BBC Radio 2 takes almost a quarter of the share of listening in Wales
(23.3%). In contrast, local commercial services have a lower proportion of listening hours in Wales
than in other nations. Commercial stations also have lower reach in Wales (43%) than in the other
UK nations (51% in Scotland, 60% in Northern Ireland).
Figure 26: Share of listening hours, by nation
Source: RAJAR, all adults (15+), Q1 2018 BBC nations’/local radio TSA in each nation
45%39%
48%
20%
45%
7%8%
9%
22%
7%
18%17%
18%
10%
18%
27% 34%23%
39%
27%
3% 3% 2%9% 3%
England Scotland Wales Northern Ireland UK
BBC UK-wide BBC nations/local UK-wide commercial Local commercial Other

41
BBC Wales national radio stations
In June 2017, BBC Cymru Wales announced plans for expansion in BBC Radio Wales coverage,
extending the station’s availability on the FM band to an estimated 330,000 people and increasing
its nationwide FM coverage in Wales from 79% to 91%.
The increase in BBC Radio Wales’ coverage on FM will benefits listeners in north-east Wales and mid
Wales. Using a small amount of the existing network FM frequency band, currently allocated to BBC
Radio 3, the development brings Radio Wales’s FM coverage into line with other national and
network radio stations. Radio 3 continues to be available to 92% of households in Wales on FM, and
the station’s availability on DAB, television and online will be unaffected by the changes.
Reach of national commercial radio in Wales grew in 2018
The sector that has increased its audience most is the
UK-wide commercial stations; listener figures have
risen from 33% of adults in Wales in 2013 to 38% in
2018. This is probably due to the increased availability
of these stations since March 2016 when the second
UK-wide commercial DAB multiplex, Sound Digital, was
launched. BBC radio has seen the biggest drop in
audience numbers: from 76% of adults in Wales in
2013 to 71% in 2018.
Figure 28: Weekly reach by radio sector over time: 2013-2018
Source: RAJAR, all adults (15+), Q1 of each year, BBC Radio Wales TSA
% of population
BBC
Commercial
National commercial
All radio
94% 95% 95%92% 91% 90%
76% 78%74% 72% 71% 71%
61% 61% 62%60% 62% 60%
66%70%
67% 66% 65% 65%
33% 34% 33% 33% 34%38%
22% 23% 21%19% 19% 18%
46% 45% 47%44% 46%
43%
4% 4%6% 6% 6% 6%
2013 2014 2015 2016 2017 2018
BBC UK-wide
Local commercial
BBC nations/local
Other

42
BBC Radio 2 was the most popular radio station in Wales in Q1 2018
BBC Radio 2 was the most listened-to radio station across Wales in Q1 201841 with a weekly reach of
38%, followed by BBC Radio 1 at 24% and BBC Radio 4 with 17%.
In Cardiff42, Global’s Heart South Wales was the third most popular radio station, with a reach of
21%; behind BBC Radio 2 and BBC Radio 1. Across North Wales43, the three most popular stations
were the same as those across Wales as a whole, with BBC Radio 2 having an even greater reach
(41%).
Table 29: Top three stations listened to across the UK, Wales and Welsh regions
Source: RAJAR Q1 2018 * BBC Radio Wales TSA **Capital South Wales TSA ***Heart North Wales TSA
Typically, across the UK, peak listening is between 8am and 9am. But in Wales the peak in Q1 2018
was between 10am and 10:30am, when around 15-16% of the population listened to The Ken Bruce
Show – featuring BBC Radio Wales presenter Lynn Bowles until March 2018 – on BBC Radio 2. Across
the duration of the show44 it reached 20% of the population in the Cardiff area, higher than the
average across the UK (16%).
41 RAJAR’s BBC Radio Wales TSA 42 RAJAR’s Capital South Wales TSA which accounts for around 40% of the Wales adult population. 43 RAJAR’s Heart North Wales TSA, which covers around 727,000 adults. 44 09:30-12pm Monday-Friday
UK Wales* Cardiff** North Wales***
Rank Station Weekly reach (%)
Station Weekly reach (%)
Station Weekly reach (%)
Station Weekly reach (%)
1 BBC Radio 2 28.3% BBC Radio 2 37.9% BBC Radio 2 37.9% BBC Radio 2 40.6%
2 BBC Radio 4 20.0% BBC Radio 1 23.6% BBC Radio 1 21.8% BBC Radio 1 24.1%
3 BBC Radio 1 17.4% BBC Radio 4 17.1% Heart South Wales
21.2% BBC Radio 4 20.9%

43
Figure 30: Average reach across the day in the Cardiff area: Monday-Friday
Source: RAJAR Q1 2018, all adults 15+ Capital South Wales TSA
Local commercial radio in Wales generated £6.33 per head in 2017
Local analogue commercial radio stations in Wales such as Radio Ceredigion and Capital South Wales
generated £6.33 per head of population in 2017.45 This was the lowest figure across the UK nations
and a 1% decrease in real terms on 2016.
Figure 31: Local commercial radio revenue per head: 2017 (£)
Source: Ofcom/broadcasters, Ofcom estimates. Note: These figures relate to relevant turnover of AL licences (local analogue commercial) and include local and national revenues and sponsorship.
45 These figures relate to revenues generated against analogue licences only. Revenue generated through digital platforms are not included.
0%
2%
4%
6%
8%
10%
12%
14%
16%
18%
Wee
kly
reac
h %
BBC Radio 2 BBC Radio 1 BBC Radio 4 Heart South Wales Capital South Wales Kiss
6.64 6.50
8.16
6.33
7.59
Revenue per head
UK England Scotland Wales Northern Ireland
Year-on-year change
UK -2%
England -3%
Scotland 0%
Wales -1%
Northern Ireland 0%