OF QUAID E-AZAM SOLAR POWER · 4 Hydel(Tarbela IV and 2 others) 1,679 6 LNG (3*1200) 3,600 7...
13
PRIVATIZATION OF QUAID-E-AZAM SOLAR POWER PRELIMINARY INFORMATION MEMORANDUM JULY 2017 In collaboration with 1
-
Upload
vuongthien -
Category
Documents
-
view
213 -
download
0
Transcript of OF QUAID E-AZAM SOLAR POWER · 4 Hydel(Tarbela IV and 2 others) 1,679 6 LNG (3*1200) 3,600 7...

PRIVATIZATION OF QUAID-E-AZAM SOLAR POWER
PRELIMINARY INFORMATION MEMORANDUM JULY 2017
In collaboration with
1

TRANSACTION BACKGROUND
2
The Government of Punjab, Pakistan (“GOPb”), which currently owns 100% of Quaid e Azam Solar Power (Pvt.) Ltd (“QASP” or the “Company”) seeks to divest its entire stake in QASP along with management control to a qualified local and/or international strategic bidder. The Punjab Privatization Board (“PPB”) on behalf of the GOPb thus invites Expression of Interest (“EOI”) from investors interested in acquiring 100% of QASP’s share capital.
GOPb / PPB has appointed a Financial Advisory Consortium comprising of United Bank Limited (Lead Financial Advisor), EY Ford Rhodes (Accounting and Tax Advisor), HaidermotaBNR (Legal Advisor) and ensibo GmbH (Technical Advisor) to conduct this transaction.
QASP’s power plant is located in Bhawalpur while its registered office is in Lahore.
Bahawalpur
Lahore
CAPACITY
100 MW
CAPACITY FACTOR
18.27%
25Y LEVELIZED TARIFF
US c14.97/kWh
GUARANTEED USD EQUITY IRR OF
17%
FY2016 REVENUE PKR 2.95 Bn
FY2016 ASSETS PKR 16.7 Bn
1ST SOLAR POWER PLANT IN PAKISTAN
CREDIT RATING AA- (JCR-VIS)
TRANSACTION OVERVIEW

ECONOMIC FUNDAMENTALS
3
13.7
11.0
7.7 7.2
2.5
4.78 4.8
12
9.5 10
9.5
6 6 5.75
0
2
4
6
8
10
12
14
0.0
2.0
4.0
6.0
8.0
10.0
12.0
14.0
16.0
2011 2012 2013 2014 2015 2016 2017
CPI Inflation % Policy Rate %
Nominal & Real GDP 2013-2018
3.62 3.84 3.68
4.05 4.04
4.71
5.20 5.60
0
1
2
3
4
5
6
0
50
100
150
200
250
300
350
2011 2012 2013 2014 2015 2016 2017E 2018E
Nominal GDP ($ bn) Real GDP Growth %
0
200
400
600
800
1000
1200
1400
1600
1800
155
160
165
170
175
180
185
190
195
200
205
2011 2012 2013 2014 2015 2016 2017E 2018E
Po
pu
lati
on
(M
n)
Population Mn GDP per capita $
18,243
15,288
11,019
14,141
18,699
23,098
20,520
2011 2012 2013 2014 2015 2016 2017
Pakistan has a population of 188 Mn (2015), of
which 30% is within 25-30 years age bracket,
signifying growth potential for the country.
Economic growth has gained momentum on
improving macro economic fundamentals backed
by GDP growth, lower discount rate, improving
external outlook and consistently improving
political / security environment.
Lower oil prices have also pulled down the
inflation trajectory with YoY monthly CPI clocking
at below 5% for the past 3 years.
An overall positive economic outlook and $20 bn+
foreign reserves have enhanced investor
confidence and upgraded country rating for
Pakistan by Moody’s from Caa1 in 2013 to B3 in
2017
Source: World Bank Database Source: World Bank Database
Source: World Bank Database Source: World Bank Database
2012 2013 2014 2015 2016 2017
Rating (Moody’s) Caa1 Caa1 Caa1 B3 B3 B3
Outlook Stable Negative Stable Stable Stable Stable
Source: Moody’s Rating Agency
GDP per capita forecast
CPI and Policy Rate Liquid Foreign Reserves (USD mn)

ECONOMIC FUNDAMENTALS
4
STRATEGIC LOCATION CONSISTENT ENERGY SUPPLY CPEC INITIATIVES 1. 2. 3.
Pakistan is situated right at the junction of Central Asia, China, the Middle East and South Asia.
Pakistan has the potential to become one of Asia’s premier trade, energy and transport corridor
It serves as the lowest cost land route to Central Asian countries
China – which is Pakistan’s biggest trading partner – signed an agreement, the China Pakistan Economic Corridor (CPEC). The agreements consists of infrastructure expenditure of $54 bn
C. $35 billion allocated for Energy projects only, which includes 900 MW Solar Power Plant at the same site as QASPL’s
USD 16 Billion LNG supply deal with Qatar to ensure consistent energy supply to Pakistan to support its power generation and domestic energy needs
ECONOMIC STABILITY IMPROVED LAW & ORDER CLASSIFICATION TO MSCI
EM STATUS
Pakistani Rupee has been one of the relatively stable currencies in the emerging markets amidst decline in oil prices (average of 3.9% depreciation in FY16)
Central Bank is following a relaxed monetary policy to promote investment, bringing benchmark rates down from 12% in 2011 to 5.75% in 2016 and maintaining at the same rate.
Given strong stock market fundamentals in place, MSCI has reclassified Pakistan in its Emerging Market Index this year, providing an impetus for increased foreign investment
Pakistan’s security forces have achieved significant success in improving the law and order in the country as witnessed through a significant decline in terrorism
The ongoing operations against militants throughout the country will further improve the overall security situation in the country
4. 5. 6.

POWER SECTOR SNAPSHOT
5
Pakistan’s high dependence on imported oil for electricity
generation has contributed to high cost of electricity during the
past decade.
The energy mix will change in favor of hydel, coal and gas based
power generation over the next 5 years due to increasing
emphasis on RLNG, coal, hydel and renewable based power
generation.
Favorable Power sector policies with equitable and time-tested
concessionary framework incorporating adequate lender
protection and guaranteed USD based equity returns have
encouraged private sector participation in electricity generation
since the 90’s.
Source: NEPRA – State of the industry Report 2016
Source: NEPRA state of industry report 2016 Source: NEPRA State of the Industry Report 2016 Source: NEPRA State of the Industry Report 2016
Electricity Generation (GWh)
Demand and Supply scenario (MW) Primary Energy Supplies by Source (MTOE)
Installed Generation by Source (MW) Energy Consumption by Sector (GWh)
Overview
Public Hydro 6,902
Public Thermal 5,762
Nuclear 787
IPPs Hydro 214
IPPs Thermal 8,948
KEL 1,909
Renewable 852
Gas 30
Oil 25
LNG Import, 0.47
LPG, 0.46
Coal 5
Hydro 7.75
Nuclear 1.4
Renewable 0.2
Source: NEPRA state of industry report 2016
45
,73
1
46
,38
0
48
,91
5
50
,17
4
52
,13
9
53
,56
4
52
,27
5
56
,78
3
58
,74
2
59
,85
8
-
10,000
20,000
30,000
40,000
50,000
60,000
70,000
2012 2013 2014 2015 2016
Public Sector Private Sector
46%
7.5%
26.5%
9.0%
11%
-
10,000
20,000
30,000
40,000
50,000
60,000
70,000
80,000
90,000
100,000
2012 2013 2014 2015 2016
Domestic Commercial Industrial Agriculture Others
12
,32
0
14
,60
0
16
,17
0
16
,50
0
17
,26
1
18
,94
0
18
,82
7
20
,57
6
21
,70
1
22
,55
9
-
5,000
10,000
15,000
20,000
25,000
2012 2013 2014 2015 2016Firm Supply Demand

PAKISTAN’S ELECTRICITY GENERATION – WAY FORWARD
6
Pakistan is expected to achieve power surplus by 2020
due to new additions to power generation under foreign
& local investments.
Projects under CPEC are expected to generate more than
6,000 MW in 2017-18 and another 2,910 MW beyond
2018
Other than CPEC, there are many other power projects
being undertaken by private sector and the Government
and are expected to contribute additional generation of
7,748MW in 2017-18 wehile projects worth 27,940 MW
are in the pipeline (including those at feasibility stage)
going beyond 2018
24,871 26,105
27,408 28,773
20,304
23,734
26,480
29,895
2016-17 2017-18 2018-19 2019-20
NTDC Peak Demand (MW) Projected Capacity (MW)
Projected New Power Generation Capacity
CP
EC -
Ad
dit
ion
al G
en
era
tio
ns
(MW
s)
Sr No Project Name 2017 2018 Beyond
1 Coal-based power project at RYK, Punjab 1,320
2 Coal-based power project at Sahiwal 1,320
3 Imported Coal-based project at Port Qasim, 1,320
4 Engro coal-fired power project 660
5 SSRL coal-based power plant 1,320
6 Coal-based power project at Muzaffargarh 1,320
7 Suki Kinari Hydropower KPK 870
8 Karot Hydropower project Punjab 720
Total 2,640 3,300 2,910
Oth
er E
ne
rgy
Pro
ject
s -
Ad
dit
ion
al
Ge
ner
atio
n (
MW
s)
1 Neelum Jehlum 969
2 Chashma Nuclear (C4) 340
3 Wind (Other than CPEC) 500
4 Hydel(Tarbela IV and 2 others) 1,679
6 LNG (3*1200) 3,600
7 Jamshoro Coal Power Plant 660 660
8 K2 & K3 2,200
9 CASA 1000 1,000
10 Dasu 1& 2 4,280
11 Diamer Basha 4,800
12 Others 15,000
Total 7,088 660 27,940
Source: NEPRA and News Article
Source: NEPRA
Demand and Supply Forecast

SOLAR POTENTIAL IN PAKISTAN
7
Pakistan has tremendous potential to meet its power
demand needs from renewable energy sources and, in
particular, solar.
Solar irradiance levels in parts of Pakistan, particularly in the
southwest, are on par with the best in the world with global
horizontal irradiance (GHI) values over 1500 kWh/m² in over
90% of the country’s land area 2. The annual mean value of
GHI for whole Pakistan, based on preliminary analysis by The
World Bank, is 2071 kWh/m².
The maps reveal that even areas receiving the least average annual irradiation are better than Germany’s best regions for solar power generation
Source: World Bank Group (2015). Solar Modeling Report
750
1,250
1,750
2,250
2,750
20
00
20
01
20
02
20
03
20
04
20
05
20
06
20
07
20
08
20
09
20
10
20
11
20
12
An
nu
al S
un
shin
e H
ou
rs
Pakistan Northern Regions Sindh Balochistan Punjab
31
.5
16
.9
13
.5 1
6.5
18
.5
6.7
10
.4
14.5
10
11.2
0
5
10
15
20
25
30
35
South Africa(ComparativeProcurement)
Jorden (Round1: FIT, Round 2:
Competitive)
Pakistan (WindFIT)
Pakistan (SolarFIT)
Round 1 Round 2 Round 3
NEPRA recently replaced upfront tariff (FIT) with competitive bidding tariff (benchmark tariff likely to be US Cents 6/kWh – Zorlu’s tariff for 100MW solar plant)
Source: World Bank Group (2015). Solar Modeling Report
Source: NEPRA
Annual suns of GHI based on satellite estimates
Declining Tariffs (US Cents/kWh) High Solar Irradiance in Punjab
Source: World Bank Group (2015). Solar Modeling Report
Capacity (MW) Number of Projects Sponsors
>50 7
ET Solar (Pvt.) Ltd, Forshine Pakistan, Siddiqsons Solar
Ltd, M/s Solar Blue Pvt. Ltd., M/s Jafri & Associates, M/s
Integrated Power Solution
>30, 50> 1 Asia Petroleum Ltd
>20, 30> 3 ET Solar (Pvt.) Ltd, M/s R.E. Solar Pvt. Ltd.
Upcoming Major Solar Power Projects

QASPL – OVERVIEW OF THE ASSET
8
Principal Activity Own, operate and maintain the power plant
Installed Capacity
100 MW
Location District Bhawalpur, Punjab
Governance Independent Board & Professional Management
Technical Specifications
− 395,120 Polycrystalline Photo Voltaic (PV) modules (255 Wp each)
− 1,300 DC Combiner Boxes − 200 Inverters (500 KW) − 100 Transformers (0.315 / 33 kV) − 33kV Collection System Loops (20 feeders)
Net Output (FY2016)
154,005 MWh
Operational Efficiency (FY2016)
Capacity Factor: 18.27%
Off-taker Central Power Purchasing Agency (CPPA-G)
Applicable Framework
Renewable Energy Act 2006
Employees 66 (Dec’16)
Rating (JCR-VIS) AA-
Established as a part of GoPb’s initiative to establish a 1,000 MW solar park in Bahawalpur.
Incorporated in September 2013 and achieved COD in July 2015.
During its first 18 months of operation, QASP generated approved energy of 232,660 MWh, while operating at a capacity factor of 18.27% against NEPRA’s benchmarks of 223,094 MWh and 17.5% respectively.
Key Milestones
Plant Details
Project Cost & Contractors
• TBEA EPC & O&M Contractor
• 13,301 PKR mn EPC Cost
• 456.8 PKR mn Non-EPC Cost
• 14,946.8 PKR mn Total Adjusted Cost
Introduction
EPC and O&M contract with
TBEA Signing of Land
lease Agreement
2nd June 2014 10th June 2014
Energy Purchase Agreement with
CPPA-G
8th July 2014
Tariff Determination
by NEPRA
22nd Jan 2015
Achieved Commercial Operations
15th Jul 2015

TECHNICAL SNAPSHOT
9
9,120
13,942
15,155 14,517
11,431
10,418 9,710
15,031
12,775
6,000
7,000
8,000
9,000
10,000
11,000
12,000
13,000
14,000
15,000
16,000
MW
h
Actual Production (MWh) NEPRA's target
PERFORMANCE RATIO [FEB 16 – FEB 17]
75.4%
UNITS EXPORT TO NATIONAL GRID
[JUL 16 – JUN 16]
153.9 GWH
O&M CONTRACT [DURATION]
25 YEARS
HOUSES POWERED
50,000 – 100,000 Plant Type
Ground-mounted Photovoltaic Plant
Installation type Fixed installation
DC-Capacity 100,967 kWp (based on flash test data)
PV Modules Manufacturer JA Solar
Inverter & Combiner boxes TBEA SunOasis
Mounting Structure TBEA SunOasis
Foundation TBEA SunOasis
Plant Details
QASPL is achieving higher efficiency than NEPRA’s benchmark for the two successive years. As at 30 June 2017, QASPL exported 153.9 GWh to the national grid, which is more than NEPRA’s 152.2 GWh benchmark, with 15 days left in the year end.
On-site monitoring via SCADA system
High plant availability is ensured by on-site monitoring and short response times
Source: QASPL’s Management

STRONG FINANCIAL POSITION
10
2,956
1,492
84
7
43
3 1
,01
5
68
6
0
0.2
0.4
0.6
0.8
1
1.2
-
500
1,000
1,500
2,000
2,500
3,000
3,500
FY16 6m17
Sales Cost of Sales Net Profit
16,744 16,622
4,4
16
4,5
01
-
4,000
8,000
12,000
16,000
20,000
FY16 6m17
Total Assets
Total Liabilities
Total Equity
Source: QASP’s financial accounts
Profitability and growth (PKR mn) Operating Profits and EBITDA (PKR mn) Gross Margin and Net profit Margin
Balance Sheet Snapshot (PKR mn)
Revenues generated during FY16 and 6m17 amounted to PKR 3.0 billion and PKR 1.5 billion
respectively, while gross margin was reported at around 71% for corresponding period. The
company’s profitability draws support from high margins with net income reported at PKR 1.0
billion for FY16A and PKR 0.7 billion for 6m17.
6m17 earnings include one-off income of PKR 119.3 million recorded on account of liquidated
damages recoverable from the O&M contractor.
At Dec16, total asset base of the company amounted to PKR 16.6 billion. Major assets include
operating fixed assets of PKR 12.9 billion, mainly representing plant and ancillary equipment, and
cash and bank balances of PKR 2.5 billion, jointly representing c.93% of total assets.
2,081
1,208
2,646
1,484
83.60%
85.90%
82.00%
82.50%
83.00%
83.50%
84.00%
84.50%
85.00%
85.50%
86.00%
86.50%
-
500
1,000
1,500
2,000
2,500
3,000
FY16 6m17
Operating profit EBITDA Adj EBITDA Margin
72% 71%
34%
46%
0%
10%
20%
30%
40%
50%
60%
70%
80%
1 2
Gross Profit Margin (%) Net Profit Margin (%)

APPROVED TARIFF STRUCTURE & FEATURES
11
Tariff Structure
• Tariff Period: 25 years
• Tariff structure guarantees a fixed return under Capacity Purchase Payments (“CPP”) and Energy Purchase Payments (“EPP”)
• Capacity payments comprises of a fixed component of the tariff which covers shareholder’s return and debt servicing thereby ensuring stable dividends in case of declining energy offtake.
• Indexations:
• Debt servicing component of the tariff seizes subsequent to repayment of debt (after 10 years of operation). Consequently, the reference tariff for Years 11-25 stands at 6.99 PKR/kWh.
Total Tariff =
19.0888 PKR/kWh
Debt Servicing:
11.972
ROE: 4.6996
O&M: 2.417
Ye
ar 1-1
0
O&M: 2.417
ROE: 4.6996
Total Tariff =
7.1168 PKR/kWh
Ye
ar 11
-25
*QASP has submitted that it has procured local financing at KIBOR plus 300 bps as against the allowed KIBOR plus 350 bps, in accordance with Authority's upfront tariff determination the savings are to be shared in the ratio of 60:40 between power purchaser and the sponsor respectively.
Levelized Tariff: 15.22 PKR/kWh 14.97 US Cents/kWh
• As per O&M contract O&M
• 10-year repayment period of loan Debt service – principal
• 350bps spread over KIBOR* Debt service – interest
• guaranteed 17% equity return ROE
• Linked to local CPI O&M (Local – 80%)
• Linked to US CPI and USD/PKR parity O&M (Foreign – 20%)
• Linked to fluctuations in KIBOR Debt service – interest
• Linked to USD/PKR parity ROE

12
•DEADLINE FOR SUBMISSION OF EOI & SOQ
• BIDDER DUE DILIGENCE • SUBMISSION OF COMMENTS, CLARIFICATIONS ON BIDDING DOCUMENTS FROM PREQUALIFIED BIDDERS • PRE-BID MEETING (IF REQUIRED)
• RECEIPT AND EVALUATION OF SOQS •ANNOUNCEMENT OF PREQUALIFIED BIDDERS AND ISSUANCE OF BIDDING DOCUMENTS •DUE DILIGENCE COMMENCEMENT
• SUBMISSION OF EARNEST MONEY • BIDDING / APPROVAL & ANNOUNCEMENT OF SUCCESSFUL BIDDER / ISSUANCE OF LOA • CCP APPROVAL • EXECUTION OF SPA / PAYMENT OF PURCHASE PRICE/ TRANSFER OF SHARES AND MANAGEMENT CONTROL
•DATA ROOM CLOSURE AND DUE DILIGENCE COMPLETION • ISSUANCE OF FINAL BIDDING DOCUMENTS AND ANNOUNCEMENT OF BIDDING DATE
TRANSACTION STEPS
• SUBMISSION OF EOI AND PROCESSING FEE • ISSUANCE OF RSOQ
FINANCIAL SNAPSHOT
13
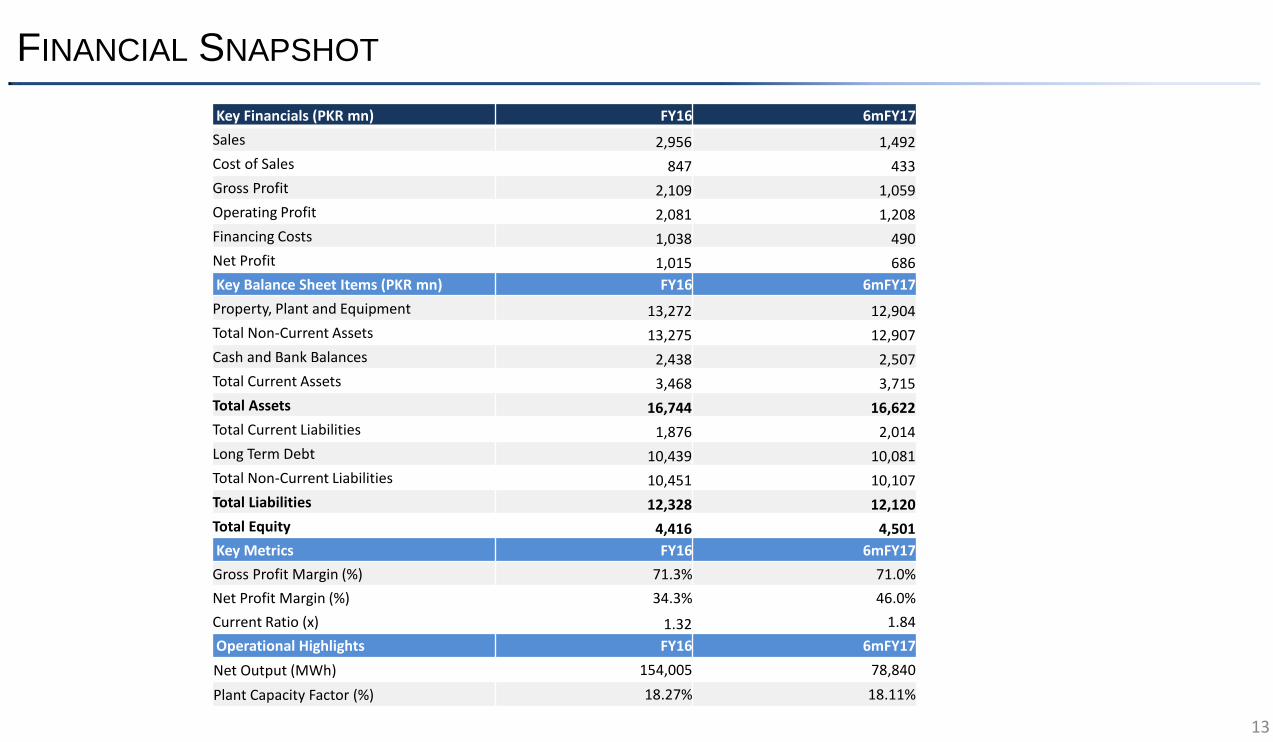
Key Financials (PKR mn) FY16 6mFY17
Sales 2,956 1,492
Cost of Sales 847 433
Gross Profit 2,109 1,059
Operating Profit 2,081 1,208
Financing Costs 1,038 490
Net Profit 1,015 686
Key Balance Sheet Items (PKR mn) FY16 6mFY17
Property, Plant and Equipment 13,272 12,904
Total Non-Current Assets 13,275 12,907
Cash and Bank Balances 2,438 2,507
Total Current Assets 3,468 3,715
Total Assets 16,744 16,622
Total Current Liabilities 1,876 2,014
Long Term Debt 10,439 10,081
Total Non-Current Liabilities 10,451 10,107
Total Liabilities 12,328 12,120
Total Equity 4,416 4,501
Key Metrics FY16 6mFY17
Gross Profit Margin (%) 71.3% 71.0%
Net Profit Margin (%) 34.3% 46.0%
Current Ratio (x) 1.32 1.84
Operational Highlights FY16 6mFY17
Net Output (MWh) 154,005 78,840
Plant Capacity Factor (%) 18.27% 18.11%