![in the scientifi c, - UNESCOunesdoc.unesco.org/images/0018/001858/185859e.pdf · • Produced by Pierre Cardin, UNESCO ... `e C`m\igffc# Le`k\[ B`e^[fd f] ... ©Robert Lerich, ©Geewhiz,](https://static.fdocuments.us/doc/165x107/5af03f0f7f8b9abc788cee2f/in-the-scienti-c-produced-by-pierre-cardin-unesco-e-cmigffc-lek.jpg)
of knowledge in the A World of - UNESCOunesdoc.unesco.org/images/0018/001896/189685E.pdfA World of...
24
A World of IN THIS ISSUE EDITORIAL Natural Sciences Quarterly Newsletter Vol. 8, No. 4 October–December 2010 IN FOCUS 2. The growing role of knowledge in the global economy NEWS 11 UNESCO steps in to help Pakistan 11 An island kicks the oil habit 12 A science observatory for Latin America and the Caribbean 12 Social sciences growing in emerging economies 13 21 new World Heritage sites INTERVIEW 14 Jatna Supriatna on what Indonesia is doing to safeguard its biodiversity HORIZONS 17 The rise of innovation in India 21 The adventures of Patrimonito IN BRIEF 24 Diary 24 New releases The democratization of science The growing role of knowledge in the global economy, p.2 he UNESCO Science Report 2010 is being launched on World Science Day on 10 November, the theme of which is Rapprochement of Peoples and Cultures this year. In the following pages, we publish excerpts from the introductory chapter and that on India. Among the many trends identified by the report in its world tour of the status of science, one that stands out is the growing democratization of science. The rapid spread of technologies has opened up a dynamic space for the development of capacities worldwide. Even countries with a lesser scientific capacity are finding that they can acquire, adopt and sometimes even transform existing technology and thereby ‘leapfrog’ over certain costly invest- ments. One example is investment in infrastructure, such as land lines for telephones. Technological progress is allowing these countries to produce more knowledge and participate more actively in international networks and research partnerships with countries in both North and South. This trend is fostering a democratization of science worldwide. In turn, science diplomacy is becoming a key instrument of peace-building and sustainable development in international relations. The report depicts an increasingly competitive environment, one in which the flow of information, knowledge, personnel and investment has become a two-way traffic. China and India, for instance, are using their newfound economic might to invest in high-tech companies in Europe and elsewhere to acquire technological expertise overnight. China plans to recruit 2000 foreign experts over the next 5–10 years to work in its laboratories, research institutes, leading enterprises and universities. If more countries are participating in science, we are also seeing a shift in global influence. Driven largely by China, India and the Republic of Korea, Asia’s world share of gross domestic expenditure on research and development (GERD) rose from 27% to 32% between 2002 and 2007, largely to the detriment of the Triad composed of the European Union (EU), Japan and the USA, according to the UNESCO Institute for Statistics. China’s world share of GERD rose from 5.0% to 8.9% over the same period. In absolute terms, other large emerging economies are also spending more on R&D, among them Brazil, Mexico, South Africa and Turkey. The ‘Big Five’ composed of the Triad, China and Russian Federation nevertheless still account for three-quarters of researchers. If China is a hair’s breadth away from counting as many research- ers as the EU and USA, Brazil and India are taking energetic steps to remedy a shortage of skilled graduates. Brain drain is a growing concern for many developing countries. At least one-third of African researchers were living and working abroad in 2009, for example. The growing role of science diplomacy has strong implications for UNESCO. For more than 60 years, UNESCO has fostered international collaboration to promote the sharing of scientific information and data. Today, as UNESCO Director-General Irina Bokova writes in her Foreword to the report, at a time when science has tremendous power to shape the future of humanity and issues are of an increasingly global nature, ‘it no longer makes much sense to design science policy in purely national terms.’ Gretchen Kalonji Assistant Director-General for Natural Sciences T
Transcript of of knowledge in the A World of - UNESCOunesdoc.unesco.org/images/0018/001896/189685E.pdfA World of...

A World of
IN THIS ISSUE EDITORIAL
Natural Sciences Quarterly Newsletter
Vol. 8, No. 4 October–December 2010
IN FOCUS
2. The growing role of knowledge in
the global economy
NEWS
11 UNESCO steps in to help Pakistan
11 An island kicks the oil habit
12 A science observatory for Latin
America and the Caribbean
12 Social sciences growing
in emerging economies
13 21 new World Heritage sites
INTERVIEW
14 Jatna Supriatna on what
Indonesia is doing to safeguard
its biodiversity
HORIZONS
17 The rise of innovation in India
21 The adventures of Patrimonito
IN BRIEF
24 Diary
24 New releases
The democratization of science
The growing role of knowledge in the
global economy, p.2
he UNESCO Science Report 2010 is being launched on World Science Day on 10 November, the theme of which is Rapprochement of Peoples and Cultures this year. In the following
pages, we publish excerpts from the introductory chapter and that on India. Among the many trends identified by the report in its world tour of the status of science, one that stands out is the growing democratization of science.
The rapid spread of technologies has opened up a dynamic space for the development of capacities worldwide. Even countries with a lesser scientific capacity are finding that they can acquire, adopt and sometimes even transform existing technology and thereby ‘leapfrog’ over certain costly invest-ments. One example is investment in infrastructure, such as land lines for telephones. Technological progress is allowing these countries to produce more knowledge and participate more actively in international networks and research partnerships with countries in both North and South. This trend is fostering a democratization of science worldwide. In turn, science diplomacy is becoming a key instrument of peace-building and sustainable development in international relations.
The report depicts an increasingly competitive environment, one in which the flow of information, knowledge, personnel and investment has become a two-way traffic. China and India, for instance, are using their newfound economic might to invest in high-tech companies in Europe and elsewhere to acquire technological expertise overnight. China plans to recruit 2000 foreign experts over the next 5–10 years to work in its laboratories, research institutes, leading enterprises and universities.
If more countries are participating in science, we are also seeing a shift in global influence. Driven largely by China, India and the Republic of Korea, Asia’s world share of gross domestic expenditure on research and development (GERD) rose from 27% to 32% between 2002 and 2007, largely to the detriment of the Triad composed of the European Union (EU), Japan and the USA, according to the UNESCO Institute for Statistics. China’s world share of GERD rose from 5.0% to 8.9% over the same period. In absolute terms, other large emerging economies are also spending more on R&D, among them Brazil, Mexico, South Africa and Turkey.
The ‘Big Five’ composed of the Triad, China and Russian Federation nevertheless still account for three-quarters of researchers. If China is a hair’s breadth away from counting as many research-ers as the EU and USA, Brazil and India are taking energetic steps to remedy a shortage of skilled graduates. Brain drain is a growing concern for many developing countries. At least one-third of African researchers were living and working abroad in 2009, for example.
The growing role of science diplomacy has strong implications for UNESCO. For more than 60 years, UNESCO has fostered international collaboration to promote the sharing of scientific information and data. Today, as UNESCO Director-General Irina Bokova writes in her Foreword to the report, at a time when science has tremendous power to shape the future of humanity and issues are of an increasingly global nature, ‘it no longer makes much sense to design science policy in purely national terms.’
Gretchen Kalonji Assistant Director-General for Natural Sciences
T

A World of SCIENCE, Vol. 8, No. 4, October–December 20102
IN FOCUS
and the Triad composed of the EU, Japan and USA with respect to international trade, investment and intellectual property rights2. Together with the rapid diffusion of infor-mation and communication technologies (ICTs), the grow-ing membership of global institutional frameworks like the World Trade Organization (WTO) has sped up access to critical knowledge: China has only been a member of WTO since December 2001. This has levelled the playing field. In other words, this has enabled a greater number of countries to play by the same set of rules, even if not all countries have the same chances of success. As we shall see, these new economic powers are also challenging the traditional
France3.7% (4.8%)
North Africa0.3% (0.3%)
Asia32.2% (27.1%)
Japan12.9% (13.7%)
Oceania1.6% (1.4%)
0.1% (0.1%)
Argentina0.2% (0.1%)
Brazil1.8% (1.6%)
Russian Fed.2.0% (2.0%)
South Africa0.4% (0.3%)
China8.9% (5.0%)
India2.2% (1.6%)
USA32.6% (35.1%)
Canada2.1% (2.4%)
Mexico0.5% (0.5%)
Latin America& Caribbean3.0% (2.8%)
European Union 23.1% (26.1%)
U.K.3.4% (3.9%) Germany
6.3% (7.2%)
New Industrialized Asian economies
6.3% (5.1%)
Sub-Saharan Africa0.6% (0.5%)
Israel0.8% (0.9%)
Egypt0.1% (0.1%)
All Arab States0.4% (0.5%)
Europe27.4% (30.2%)
Turkey0.6% (0.4%)
Iran0.5% (0.3%)
Rep. of Korea3.6% (2.8%)
Commonwealth of Independent States in Asia
World shares of GERD, 2002 and 2007 (Figures for 2002 are within brackets.)
The growing role of knowledge in the global economyFrom 1996 to 2007, the world experienced an unbroken, historically unique period of rapid economic growth. This ‘growth spurt’ was driven largely by the widespread diffusion of new digital technologies and by the emergence of Brazil, China, India and South Africa on the world stage – four countries which alone represent 40% of the world population. The cycle was brought to a sudden, somewhat brutal halt when the fall-out from the ‘sub-prime’ mortgage crisis in the USA in the third quarter of 2008 triggered a global economic recession.
In the following excerpt from the introductory chapter to the UNESCO Science Report 2010, we examine some of the broad trends which have characterized the support system for science in recent years, including the impact of the global economic recession on investment in knowledge. Due to be launched at UNESCO in Paris on 10 November to mark World Science Day, the UNESCO Science Report 2010 takes up from where its predecessor left off five years ago.
Ten-year old Moriom attends school in Mirmur-Dhaka in Bangladesh
Between 1996 and 2007, real GDP per capita increased worldwide at an average annual rate of 1.88%1. At the broad continental level, the highest per capita growth was witnessed by East Asia and the Pacific (5.85%), Europe and Central Asia (4.87%) and South Asia (4.61%). This compares with 2.42% for the Middle East and North Africa, 2.00% for North America, 1.80% for Latin American and the Caribbean and 1.64% for sub-Saharan Africa. The greatest divergence in growth rates occurred in sub-Saharan Africa: in 28 countries, GDP per capita grew by more than 5% but more than half of the 16 countries which witnessed negative per capita growth rates were also in sub-Saharan Africa.
The emergence of the G20
The G20 is composed of the world’s 19 wealth-iest countries plus the European Union (EU). The former encompass the G8 plus the newly indus-trializing countries of Mexico and the Republic of Korea, some of the most populated countries in the world such as China, India, Brazil, the Russian Federation (Russia) and Indonesia, and a second layer of emerging economies that includes Turkey, Saudi Arabia, Argentina and South Africa (see table).
With their newfound economic weight, these countries are challenging many of the rules, regulations and standards which governed the G7
©U
NE
SCO
/GM
R A
kash
Sour
ce:
UN
ES
CO
Sci
ence
Rep
ort 2
010

3A World of SCIENCE, Vol. 8, No. 4, October–December 2010
dominance of the Triad when it comes to investment in research and development (R&D).
A shift in global influence
The world devoted 1.7% of GDP to R&D in 2007, a share that has remained stable since 2002. In monetary terms, however, this translates into US$ 1 146 billion3, an increase of 45% over 2002. This is slightly higher than the rise in GDP over the same period (43%).
Behind this increase lies a shift in global influence. Driven largely by China, India and the Republic of Korea, Asia’s world share has risen from 27% to 32%, to the detriment of the Triad. Most of the drop in the EU can be attributed to its three biggest members: France, Germany and the United Kingdom (UK). Other large emerging econo-mies are also spending more, such as Mexico and South Africa4. As for the shares of the wider Africa and the Arab States, these are low but stable and Oceania has progressed slightly. Many transition economies of Central and Eastern Europe are also gradually climbing back to the levels of investment they experienced under the Soviet Union, among them Russia.
One global trend is the unequal geographical develop-ment of R&D within countries, be they members of the Organisation for Economic Co-operation and Development (OECD) or emerging economies. In Brazil, for example, 40% of gross domestic expenditure on R&D (GERD) is spent in the São Paulo region; the proportion is as high as 51% in South Africa’s Gauteng Province.
China’s share of world expenditure on R&D is approaching its world share of GDP, unlike Brazil or India which still contribute much more to global GDP than to global GERD. Of note is that the situation is reversed for the Triad, even though the disparity is very small for the European Union. The Republic of Korea is an interest-ing case in point, in that it follows the pattern of the Triad. Korea’s world share of GERD is even double its world share of GDP. One of Korea’s top priorities is to raise its GERD/GDP ratio to as much as 5% by 2012.
In some cases, the rise in GERD has been a corollary of strong economic growth rather
than the reflection of greater R&D intensity. In Brazil and India, for example, the GERD/GDP ratio has remained stable, whereas in China it has climbed by 50% since 2002 to 1.54% (2008). Similarly, if the GERD/GDP ratio has declined in some African countries, this is not sympto-matic of a weaker commitment to R&D. It simply reflects an acceleration in economic growth thanks to oil extraction (Angola, Equatorial Guinea, Nigeria, etc) and other non-R&D-intensive sectors, thereby widening the gap between GERD and GDP. In 2008 alone, 14 African countries requested UNESCO’s assistance in science policy reviews.
If each country has different priorities, the urge to catch up
is irrepressible and has, in turn, driven economic growth worldwide to the highest level in recorded history.
The figure below correlates the density of both R&D and researchers for a number of key countries and regions. We can see that Russia still has a much greater number of researchers than financial resources in its R&D system. Three large newcomers can be seen emerging in the bottom left-hand side of the picture, namely China, Brazil and India, together with Iran and Turkey. Even Africa, as a continent, is today a sizeable contributor to the global R&D effort. The R&D intensity of these economies or their human capital might still be low but their contribution to the stock
World share of GERD and GDP for the G20, 2002 and 2007 (%)
Country/ Regional grouping
World share of GERD
World share of GDP
2002 2007 2002 2007
Argentina 0.1 0.2 0.6 0.8
Australia 1.3 1.4 1.3 1.2
Brazil 1.6 1.8 2.9 2.8
Canada 2.4 2.1 2.0 1.9
China 5.0 8.9 7.9 10.7
France 4.8 3.7 3.7 3.1
Germany 7.2 6.3 4.9 4.3
India 1.6 2.2 3.8 4.7
Indonesia 0.03 0.04 1.2 1.3
Italy 2.2 1.9 3.3 2.8
Japan 13.7 12.9 7.4 6.5
Mexico 0.5 0.5 2.1 2.3
Republic of Korea 2.8 3.6 2.0 1.9Russian Federation 2.0 2.0 2.8 3.2
Saudi Arabia 0.03 0.02 0.8 0.8
South Africa 0.3 0.4 0.7 0.7
Turkey 0.4 0.6 1.2 1.4
United Kingdom 3.9 3.4 3.7 3.2
USA 35.1 32.6 22.5 20.7 European Union 26.1 23.1 25.3 22.5 So
urce
: U
NE
SC
O S
cien
ce R
epor
t 201
0, d
ata
from
UIS
0.0 0.5 1.0 1.5 2.0 2.5 3.0 3.50
1 000
2 000
3 000
4 000
5 000
6 000
Res
earc
her
s p
er m
illio
n p
op
ula
tio
n
GERD as % of GDP
USAJapan
GermanyFranceRep. of Korea
UKIndiaRussiaBrazilAfricaTurkeyIranLeast developed countries
China
Global investment in R&D in absolute and relative terms, 2007
Sour
ce:
UN
ES
CO
Sci
ence
Rep
ort 2
010
N.B. The size of the circles reflects the size of GERD.

A World of SCIENCE, Vol. 8, No. 4, October–December 20104
IN FOCUS
France3.0% (3.2%)
Asia40.9% (35.5%)
Japan9.8% (11.1%)
Oceania2.0% (2.0%)
Commonwealth of Independent States in Asia
0.6% (0.7%)
Commonwealth of IndependentStates in Europe
7.6% (10.0%)
Argentina0.5% (0.4%)
Brazil1.7% (1.2%)
Russian Fed.6.5% (8.5%)
South Africa0.3% (0.2%)
China19.7% (13.9%)
India2.2% (2.3%)
USA20.0% (23.1%)
Mexico0.5% (0.5%)
Latin America& Caribbean3.5% (2.9%)
European Union20.1% (20.6%)
UK3.5% (3.4%) Germany
4.0% (4.6%)
New Industrialized Asian economies
6.0% (5.1%)
Sub-Saharan Africa0.8% (0.8%)
All Arab States1.7% (1.8%)
Europe29.5% (32.2%)
Turkey0.7% (0.4%)
Iran0.7% (–)
Rep. of Korea3.1% (2.4%)
Egypt0.7% (–)
NorthAfrica1.4% (1.4%)
Canada1.9% (2.0%)
World shares of researchers, 2002 and 2007 (Figures for 2002 are within brackets.)
From 2002 to 2007, the share of BERD in GDP rose sharply in Japan, China and Singapore, with a particularly steep curve observed in the Republic of Korea. The ratio remained more or less constant in Brazil, the EU and USA and even declined in Russia. As a result, the Republic of Korea caught up with Japan to become the new technological leader, Singapore came close to catching up to the USA and China rubbed shoulders with the European Union. Notwithstanding this, the BERD/GDP ratio still remains much lower in India and Brazil than in the Triad.
The rapid rise of China and India has had a knock-on effect on S&T capacity in Southeast Asia and Oceania. For example, the commodities boom led largely by India and China in recent years fed mining-related R&D in Australia, resulting in greater business R&D in this country.
The ‘Big Five’ accounts for three-quarters of researchers
In terms of sheer numbers of researchers, China is on the verge of overtaking both the USA and the EU (see map). These three giants each represent about 20% of the world’s stock of researchers. If we add Japan’s share (10%) and that of Russia (7%), this highlights the extreme concen-tration of researchers in the world: the ‘Big Five’ account for about 35% of the world population but three-quarters of all researchers. By contrast, a populous country like India still represents only 2.2% of the world total and the entire continents of Latin America and Africa just 3.5% and 2.2% respectively. Both Brazil and India suffer from a shortage of highly skilled graduates. India has taken energetic steps to remedy the situation with the decision to establish 30 new universities and raise student enrollment from less than 15 million in 2007 to 21 million by 2012.
of world knowledge is rising rapidly. By contrast, the group of least developed countries (LDCs) – the smallest circle in the figure – still plays a marginal role.
Catching up in business R&D
It is the trends in business investment in R&D (BERD) which best illustrate the rapid geographical changes taking place worldwide in privately funded R&D centres. Increasingly, multinational companies are decentralizing their research activities to parts of both the developed and developing worlds within a strategy to internalize R&D at the global level. For multinationals, this strategy reduces labour costs and gives companies easier access to markets, local human capital and knowledge, as well as to the host country’s natural resources.
The favoured destinations are the so-called Asian ‘tigers’, the ‘old’ newly industrialized countries in Asia, and, secondly, Brazil, India and China. However, this is no longer a one-way traffic: firms from emerging economies are now also buying up large firms in developed countries and thereby acquiring the firms’ knowledge capital, as the chapter on India neatly illustrates (see page 17). As a consequence, the global distribution of R&D effort between North and South is shifting rapidly. In 1990, more than 95% of R&D was being carried out in the developed countries and just seven economies within the OECD accounted for more than 92% of world R&D. By 2002, developed countries accounted for less than 83% of the total and by 2007 for only 76%. Furthermore, a number of countries not generally considered to be R&D-intensive are developing particular sectors like light engineering as a strategy for import substitution, among them Bangladesh and Cameroon.
Sour
ce:
UN
ES
CO
Sci
ence
Rep
ort 2
010

5A World of SCIENCE, Vol. 8, No. 4, October–December 2010
FranceAsia
Oceania
Commonwealth of Independent States in Asia
Commonwealth of IndependentStates in Europe
Argentina
Brazil
CubaEgypt
Russian Fed.
China
India
USA
Mexico
Latin America& Caribbean
European Union
U.K.Germany
New Industrialized Asian economies
Sub-Saharan Africa
IsraelAll Arab States
Europe
Turkey
South Africa
NorthAfrica
Canada
5.8% (6.4%)30.7% (24.2%)
Japan7.6% (10.0%)
3.4% (3.2%)
0.2% (0.2%)
3.3% (4.1%)
0.6% (0.6%)
2.7% (1.7%)
0.1% (0.1%)0.4% (0.4%)
2.7% (3.5%)
10.6% (5.2%)
3.7% (2.6%)
27.7% (30.9%)
0.8% (0.7%)
4.9% (3.8%)
36.5% (39.6%)
7.2% (8.3%)7.7% (8.9%)
6.4% (4.6%)
1.1% (0.9%)
1.0% (1.2%)1.4% (1.1%)
42.5% (45.5%)
1.8% (1.2%) Iran 1.1% (0.3%)
Rep. of Korea3.3% (2.3%)
0.5% (0.5%)
0.9% (0.7%)
4.4% (4.1%)
World shares of publications, 2002 and 2008 (Figures for 2002 are within brackets.)
used the writing-off of part of its debt to create a permanent fund in early 2009 which tripled the salaries of academics overnight. The number of academics has already swelled by about one-third and more scientific articles are now being produced by state universities.
South–North and North–North are the dominant direc-tions for migration but a much more varied array of desti-nations is emerging for the diaspora: South Africa, Russia, Ukraine, Malaysia and Jordan have all become attractive destinations for the highly skilled.
A second factor is that the existing diaspora acts as a useful departure point for the design of policies for more effective technology transfer and knowledge spillovers. This phenomenon motivates countries to elaborate policies to lure highly skilled expatriates back home. This was the case in the
In the Commonwealth of Independent States, it is the ageing Soviet-generation of researchers that is cause for concern: 40% of Russian researchers are above the official retirement age.
Although the share of researchers in the deve-loping world has grown considerably from 30% in 2002 to 38% in 2007, two-thirds of this growth can be attributed to China alone. Countries are training a lot more scientists and engineers than before but graduates are having trouble finding qualified posi-tions or attractive working conditions at home. As a result, migration of highly qualified researchers from South to North has become the characteristic feature of the past decade. A 2008 report by the UK Parliamentary Office cited OECD data indicating that, of the 59 million migrants living in OECD countries, 20 million were highly skilled.
Brain drain preoccupying developing countries
Brain drain has become a serious issue for many developing countries. For instance, a national survey by the Sri Lankan National Science Foundation found that the number of eco-nomically active scientists in Sri Lanka had dropped from 13 286 to 7 907 between 1996 and 2006. Meanwhile, in India, the substantial amount of foreign direct investment flowing into the country is also creating internal brain drain, as domestic firms cannot compete with the attractive com-pensation packages offered by foreign firms based in India.
At least one-third of all African researchers were living and working abroad in 2009. A growing number of African countries are tackling the root cause of this problem by raising the salaries of academics. Cameroon, for instance,
USA
Japan
Germany
Rep. of Korea
India
Russia Brazil
China
0.0
0.5
1.0
1.5
2.0
2.5
3.0
2000 2001 2002 2003 2004 2005 2006 2007
France UK
Singapore
2.16
1.77
0.54
0.14
0.91
2.05
1.34
1.73
1.18 1.11
0.47
2.68
1.93
0.80
0.37
1.15 1.08
2.65
1.74 1.77
1.29
0.50
Sour
ce:
UN
ES
CO
Sci
ence
Rep
ort 2
010
Sour
ce:
UN
ES
CO
Sci
ence
Rep
ort 2
010
BERD/GDP ratio for selected countries, 2007 (%)

A World of SCIENCE, Vol. 8, No. 4, October–December 20106
IN FOCUS
Republic of Korea in the past and can be seen in China and elsewhere today. The aim is to encourage the diaspora to use its skills acquired abroad to bring about structural change at home. Moreover, the diaspora may be invited to participate ‘from a distance’, if the prospect of a permanent return to the home country is unlikely. In Nigeria, Parliament approved the establishment of the Nigerians in the Diaspora Commission in 2010, the aim of which is to identify Nigerian specialists living abroad and encourage them to participate in Nigerian policy and project formulation.
China now second to the USA for publications
The USA still leads every other country when it comes to sci-entific output in absolute terms (see map on previous page). However, its world share (28%) has tumbled over the past six years by a greater margin than any other country. By contrast, China’s share has more than doubled in just six years and now represents more than 10% of the world total, second only to the USA. In terms of impact factor, however, or the citation rate for scientific papers, China still trails both the Triad and a number of other economic powers, including the Republic of Korea. After China come Japan and Germany. They are now on a par at just under 8% of world publications, Japan’s share having fallen farther than Germany’s since 2002.
As for the BRIC countries (Brazil, Russia, India and China), their world share has shown impressive growth, with the exception of Russia, which saw its share decline from 3.5% in 2002 to 2.7% in 2008.
Africa’s share made a leap of 25% between 2002 and 2008 to attain 2.0% of the world total. The rise was most noticeable in South Africa and the Maghreb but every African country saw a progression in the number of its articles recorded in the Science Citation Index. At the global level, scientific publishing is today dominated by a new triad; the USA, Europe and Asia. Given the size of Asia’s population, one would expect it to become the domi-nant scientific continent in the coming years.
Wide disparities in specialization
There are wide disparities in the specialization of countries. The first web in the figure on the right focuses on the tradi-tionally dominant scientific countries. The black octagon rep-resents the average, so the lines outside this octagon indicate a better-than-average performance in a given field. Of note is France’s specialization in mathematics, recently confirmed by the award of the Abel Prize – the mathematical equiva-lent of the Nobel Prize – to two French mathematicians in 2010. France also specializes in physics and Earth and space sciences, like Germany. As for Japan, it has several strengths: physics, chemistry, engineering and technology – but is weak in mathematics. Interestingly, both the USA and UK special-ize in biomedical research, clinical medicine and Earth and space sciences.
The second web focuses on the BRIC countries and Africa. Here, too, we observe some striking differences between countries in their scientific specialization. Russia shows a strong specialization in physics, mathematics and Earth and space sciences. Typically, China specializes in physics, chemistry, mathematics, engineering and techno-logy. By contrast, Africa and Brazil are strong in biology and India excels in chemistry.
Countries appear to choose areas for scientific know-ledge creation based on their own needs (clinical medicine), geographical opportunities (Earth and space sciences and biology) but also based on cultural affinities (mathematics, physics) and expertise born of industrial growth (chemistry).
Sour
ce:
UN
ES
CO
Sci
ence
Rep
ort 2
010
Scientific specialization in the BRIC countries and Africa
Biology
Biomedicalresearch
Physics
Clinicalmedicine
Engineering andtechnology
Earth and space
ChemistryMathematics
Average
USAJapanGermany
FranceUK
-0.25-0.20-0.15-0.10-0.050.000.050.100.15
Biology
Biomedicalresearch
Physics
Clinicalmedicine
Engineering andtechnology
Earth and space
ChemistryMathematics
Average
BrazilChinaIndia
Russian FederationAfrica
-0.7-0.6-0.5-0.4-0.3-0.2-0.10.00.10.20.30.40.5
Scientific specialization in Europe, Japan and the USA

7A World of SCIENCE, Vol. 8, No. 4, October–December 2010
FranceAsia
Japan
Oceania
– (–)
Commonwealth of IndependentStates in Europe
Brazil
Argentine
Russian Fed.
India
USA
Mexico
Latin America& Caribbean0.2% (0.3%)
European Union
U.K.Germany
New Industrialized Asian economies
Sub-Saharan Africa
IsraelAll Arab States
Europe
South Africa
Canada
4.6% (5.0%)31.9% (27.3%)
27.9% (24.9%)
0.2% (0.3%)
0.1% (0.1%)
0.0% (0.0%)
0.2% (0.3%)
China0.5% (0.3%)
0.2% (0.1%)
41.8% (44.2%)
0.0% (0.0%)
4.3% (4.3%)
2.5% (1.2%)
0.1% (0.1%)
0.9% (0.8%)0.1% (0.0%)
Rep. of Korea2.2% (0.9%)
0.1% (0.1%)
1.7% (1.7%)10.4% (11.5%)
1.8% (1.0%)
26.4% (28.6%)27.8% (30.3%)
World shares of patents granted by the Triadic patent families, 2002 and 2006 (Figures for 2002 are within brackets.)
Sour
ce:
UN
ES
CO
Sci
ence
Rep
ort 2
010
seen in the rate at which new computers, software, video games and mobile phones, for instance, are appearing on the market. High-tech firms are themselves largely respon-sible for this phenomenon, as they have deliberately set out to create new consumer needs by bringing out more sophisticated versions of their products every six months or so. This strategy is also a way of keeping ahead of the com-petition, wherever it may be. As a consequence, patents that used to be economically valid for several years now have a shorter lifespan. Developing new products and registering new patents every six months or so is an extremely labour- and investment-intensive exercise which obliges compa-nies to innovate at a frenetic rate. With the global recession, these companies are finding it harder to maintain this pace. In the USA, for instance, the pharmaceutical industry was already showing signs of stress before the recession hit, as the huge investment made in R&D does not appear to have resulted in many ‘blockbuster’ drugs recently.
Knowledge appropriation versus knowledge diffusion
We now take a look at the opposite variable to patents, the number of Internet users. This variable should enable us to see whether easier access to information and knowledge has provided opportunities for a more rapid diffusion of S&T. The data on Internet usage paint a very different picture to that for patents. We find that the BRIC countries and numerous developing countries are catching up quickly to the USA, Japan and major European countries for this indicator (see figure overleaf). This shows the crucial importance of the emergence of digital communications like Internet on the world distribution of S&T and, more broadly, on knowl-edge generation. The rapid diffusion of Internet in the South is one of the most promising new trends of this Millennium, as it is likely to bring about a greater convergence in access to S&T over time.
Patents reflect persistent inequality in private knowledge creation
One mirror of the success with which countries and regions are privately appropriating knowledge is the number of patents filed with the Triad patent offices in the USA, EU and Japan. Here, the dominance of the USA is striking, a sign of the US technology market’s role as the world’s leading private market for technology licenses. Japan, Germany and the Republic of Korea have the next-largest number of patent-holders. India’s share amounts to barely 0.2% of all Triadic patents, a share comparable to that of Brazil (0.1%) and Russia (0.2%). This illustrates the extreme concentration of patent applications in North America, Asia and Europe; the rest of the world barely accounts for 2% of the total stock. Most of Africa, Latin America and Asia play no role at all.
The majority of India’s patents are in chemistry-related fields. Interestingly, the introduction of the Indian Patent Act in 2005 to bring India into compliance with the Agreement on Trade-Related Aspects of Intellectual Property Rights (TRIPS) has not had a negative effect on the country’s phar-maceutical industry, contrary to predictions. Strong growth in R&D investment by the industry since 2000 was continu-ing unabated in 2008. However, most of these patents are being granted to foreign companies located in India, based on R&D projects carried out in India (see page 17).
Of all the indicators used in the UNESCO Science Report 2010, it is the patent indicator which points most strikingly to the inequality of knowledge creation at the global level.
What explains the huge volume of patents in some coun-tries? In developed countries, the lifespan of high-tech products is shortening, obliging companies to come up with new products more quickly than before. This can be
A World of SCIENCE, Vol. 8, No. 4, October–December 20108
IN FOCUS
Is the global economic recession bad for knowledge creation?
The global recession is likely to have had a severe impact on investment in knowledge across the globe, even though data on R&D for 2009–2010 are not yet available. Patents and publications will in turn be affected by the drop in R&D expenditure but this will probably occur in the longer run and affect scientific output less directly, owing to pipeline effects that smother sharp fluctuations. As for trends in educating the labour force, this sector tends to be less affected by short-term distortions.
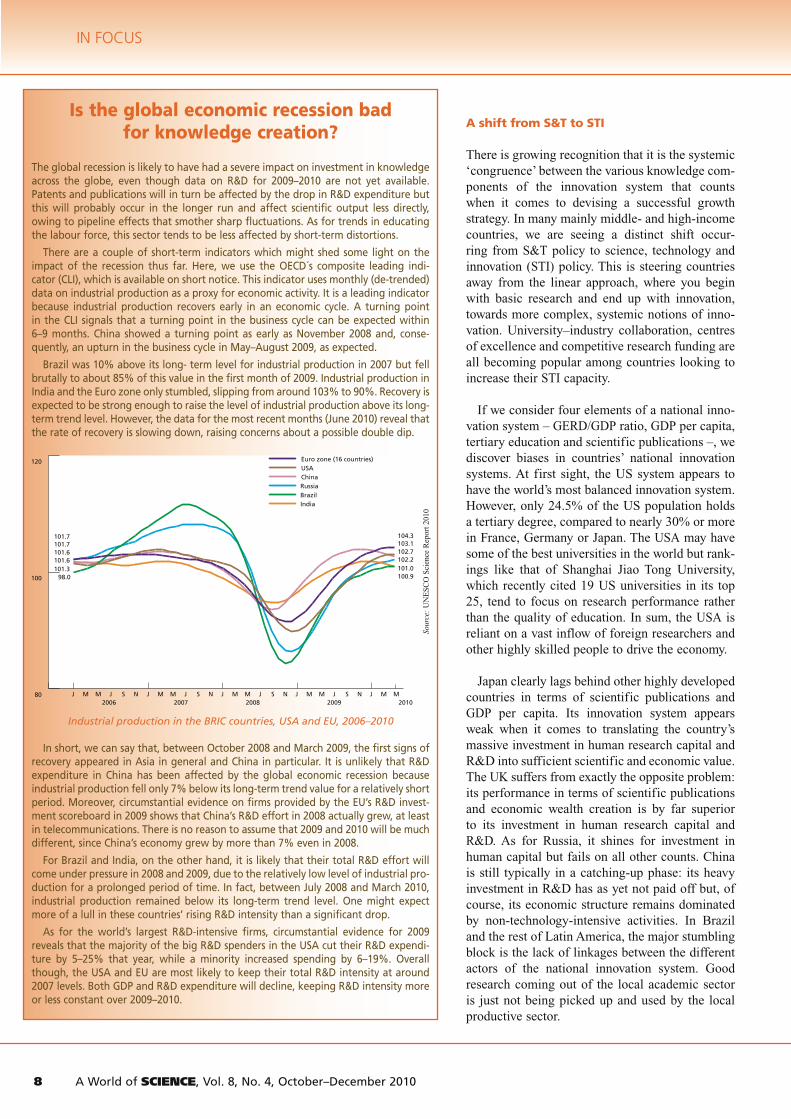
There are a couple of short-term indicators which might shed some light on the impact of the recession thus far. Here, we use the OECD´s composite leading indi-cator (CLI), which is available on short notice. This indicator uses monthly (de-trended) data on industrial production as a proxy for economic activity. It is a leading indicator because industrial production recovers early in an economic cycle. A turning point in the CLI signals that a turning point in the business cycle can be expected within 6–9 months. China showed a turning point as early as November 2008 and, conse-quently, an upturn in the business cycle in May–August 2009, as expected.
Brazil was 10% above its long- term level for industrial production in 2007 but fell brutally to about 85% of this value in the first month of 2009. Industrial production in India and the Euro zone only stumbled, slipping from around 103% to 90%. Recovery is expected to be strong enough to raise the level of industrial production above its long-term trend level. However, the data for the most recent months (June 2010) reveal that the rate of recovery is slowing down, raising concerns about a possible double dip.
In short, we can say that, between October 2008 and March 2009, the first signs of recovery appeared in Asia in general and China in particular. It is unlikely that R&D expenditure in China has been affected by the global economic recession because industrial production fell only 7% below its long-term trend value for a relatively short period. Moreover, circumstantial evidence on firms provided by the EU’s R&D invest-ment scoreboard in 2009 shows that China’s R&D effort in 2008 actually grew, at least in telecommunications. There is no reason to assume that 2009 and 2010 will be much different, since China’s economy grew by more than 7% even in 2008.
For Brazil and India, on the other hand, it is likely that their total R&D effort will come under pressure in 2008 and 2009, due to the relatively low level of industrial pro-duction for a prolonged period of time. In fact, between July 2008 and March 2010, industrial production remained below its long-term trend level. One might expect more of a lull in these countries’ rising R&D intensity than a significant drop.
As for the world’s largest R&D-intensive firms, circumstantial evidence for 2009 reveals that the majority of the big R&D spenders in the USA cut their R&D expendi-ture by 5–25% that year, while a minority increased spending by 6–19%. Overall though, the USA and EU are most likely to keep their total R&D intensity at around 2007 levels. Both GDP and R&D expenditure will decline, keeping R&D intensity more or less constant over 2009–2010.
A shift from S&T to STI
There is growing recognition that it is the systemic ‘congruence’ between the various knowledge com-ponents of the innovation system that counts when it comes to devising a successful growth strategy. In many mainly middle- and high-income countries, we are seeing a distinct shift occur-ring from S&T policy to science, technology and innovation (STI) policy. This is steering countries away from the linear approach, where you begin with basic research and end up with innovation, towards more complex, systemic notions of inno-vation. University–industry collaboration, centres of excellence and competitive research funding are all becoming popular among countries looking to increase their STI capacity.
If we consider four elements of a national inno-vation system – GERD/GDP ratio, GDP per capita, tertiary education and scientific publications –, we discover biases in countries’ national innovation systems. At first sight, the US system appears to have the world’s most balanced innovation system. However, only 24.5% of the US population holds a tertiary degree, compared to nearly 30% or more in France, Germany or Japan. The USA may have some of the best universities in the world but rank-ings like that of Shanghai Jiao Tong University, which recently cited 19 US universities in its top 25, tend to focus on research performance rather than the quality of education. In sum, the USA is reliant on a vast inflow of foreign researchers and other highly skilled people to drive the economy.
Japan clearly lags behind other highly developed countries in terms of scientific publications and GDP per capita. Its innovation system appears weak when it comes to translating the country’s massive investment in human research capital and R&D into sufficient scientific and economic value. The UK suffers from exactly the opposite problem: its performance in terms of scientific publications and economic wealth creation is by far superior to its investment in human research capital and R&D. As for Russia, it shines for investment in human capital but fails on all other counts. China is still typically in a catching-up phase: its heavy investment in R&D has as yet not paid off but, of course, its economic structure remains dominated by non-technology-intensive activities. In Brazil and the rest of Latin America, the major stumbling block is the lack of linkages between the different actors of the national innovation system. Good research coming out of the local academic sector is just not being picked up and used by the local productive sector.
Industrial production in the BRIC countries, USA and EU, 2006–2010
80
100
120
2006 2007 2008 2009 2010
104.3103.1102.7102.2101.0100.9
101.7101.7101.6101.6101.3
98.0
USAEuro zone (16 countries)
ChinaRussiaBrazilIndia
J M M J S N J M M J S N J M M J S N J M M J S N J M M
Sour
ce:
UN
ESC
O S
cien
ce R
epor
t 201
0

9A World of SCIENCE, Vol. 8, No. 4, October–December 2010
the verge of a structural break in the pattern of knowledge contribution to growth at the level of the global economy. This is also reflected in the arrival on the world scene of large, multinational firms from emerging countries which are mov-ing into a wide variety of sectors that range from mature industries such as steel-making, automobile manufacturing and consumer goods to high-tech industries like pharma-ceuticals and aircraft manufac- turing. Companies in these emer-ging economies are increasingly opting for cross-border mergers and acquisitions to secure technological knowledge overnight.
Countries can leapfrog over investment in infrastructure
The accumulating stock of ‘world knowledge’ is also crea-ting fantastic opportunities for emerging nations to attain higher levels of social welfare and productivity. It is in this sense that the old notion of a technological gap can today be considered a blessing for those economies possessing sufficient absorptive capacity and efficiency to enable them to exploit their ‘advantage of relative backward-ness’. Countries lagging behind can grow faster than the early leaders of technology by building on the backlog of unexploited technology and benefiting from lower risks. They are already managing to leapfrog over the expensive investment in infrastructure that mobilized the finances of developed countries in the 20th century, thanks to the development of wireless telecommunications and wire-less education (via satellites, etc), wireless energy (wind-mills, solar panels, etc) and wireless health (telemedicine, portable medical scanners, etc).
Other factors are also creating unique advantages in terms of knowledge growth. This is particularly well illustrated by the rapidly expanding pool of highly skilled labour in China and India, among others, the large numbers of redundant workers in farming and petty trade, the relative gain in the replacement of obsolete equipment with state-of-the-art technologies and the spillover effects of investment in new technology. The recognition of the importance of know-ledge acquisition is a common thread running through the UNESCO Science Report 2010. In Bangladesh, for instance, light engineering is producing import-substitution products that are creating employment and alleviating poverty via endogenous technologies that include ferries, power plants, machinery and spare parts. Bangladesh is also developing the high-tech sector of pharmaceuticals; it claims to be 97% self-sufficient in pharmaceuticals, which it is even exporting to Europe.
The past decade has challenged the statu quo
What conclusions can be drawn from the analysis above? First and foremost, the disparity in development levels from one country and region to another remains striking. In 2007, per capita income in the USA was estimated to be 30 times higher on average than in sub-Saharan Africa. The origin of this divergence in economic growth can be found in the disparate levels of investment in know-ledge over long periods of time. Even today, the USA still invests more in R&D than the rest of the G8 countries combined.
The past decade has challenged this picture, largely thanks to the rapid diffusion of digital technologies, which have made codified knowledge accessible worldwide. For sure, some early newcomers like the Republic of Korea had been steadily catching up to, and even leap-frogging over, countries, since the 20th century by first developing their industrial capacity then S&T. But others, such as China, Brazil or India, have initiated a new, three-way process of catching up simultaneously in the industrial, scientific and technological spheres.
Countries have been rapidly catching up both in terms of economic growth and investment in knowledge. This can be observed in the burgeoning number of graduates in science and engineering and in the rise in R&D expendi-ture. As a result, the traditional leadership of the USA has begun to be challenged over the past five years. The global economic recession has compounded the situation, even if it is too early for this to be fully encapsulated in the data. The USA has been harder hit than Brazil, China or India, thereby enabling these three countries to progress faster than they might have done otherwise. We seem to be on
Growth in Internet users, selected countries and groupings, 2002–2008
0 10 20 30 40 50 0
20
40
60
80
100
Korea
USA UK
Germany
Japan
OECD
Oceania
France
Brazil
Turkey Arab
States
Latin America
Argentina
Mexico
Cuba India
Russia
Egypt
China
Average annual growth 2002–2008
Inte
rnet
use
rs p
er 1
00 p
opul
atio
n (2
008)
sub-Saharan Africa
Iran
EU27
Sour
ce:
data
from
UN
ES
CO
Sci
ence
Rep
ort 2
010

A World of SCIENCE, Vol. 8, No. 4, October–December 201010
IN FOCUS
The Shanghai Synchrotron Radiation Facility completed in April 2009
© S
hang
hai S
ynch
rotr
on R
adia
tion
Faci
lity,
rep
rodu
ced
with
per
mis
sion
has emerged as an R&D priority when it was almost totally absent from the UNESCO Science Report 2005. As a general broad policy comment, one can today argue that laggard regions or nations always do well to improve their absorptive capacity and remove any ‘barriers’ preventing the flow of positive technological spillovers from technologically lead-ing economies, be they from the North or South.
Last but not least, national STI policies clearly face a radically new global landscape today, one in which the territorial policy focus is coming under severe pressure. On the one hand, the steep drop in the marginal cost of reproduction and diffusion of information has led to a world in which geographical borders are less and less rele-vant for research and innovation. Knowledge accumulation and knowledge diffusion can take place at a faster pace. This has revolutionized the internal and external organiza-tion of research and facilitated the implantation abroad of companies’ R&D centres. Moreover, there is clear evidence of a concentration of knowledge production and innovation emerging across a wider variety of countries than before within Asia, Africa and Latin America but this knowledge is also growing at a highly differentiated pace within coun-tries, wherever they may be.
Hugo Hollanders and Luc Soete5
To read or order the report, see page 24.
A growing emphasis on sustainability and green technologies
There is also a growing emphasis in STI policy on sustain-ability and green technologies. This trend can be found in practically every single chapter of the UNESCO Science Report 2010, even in parts of the world not generally charac-terized by a large STI effort, such as in the Arab region and sub-Saharan Africa. In both the USA and China, clean energy R&D is a priority. The Chinese government has even fixed a target of having non-fossil energy sources represent 15% of energy consumption by 2020. In Cuba, energy R&D and disaster monitoring and mitigation have become R&D priori-ties alongside the traditional development and production of pharmaceuticals, in light of the threat of stronger hurricanes, droughts, coral bleaching and flooding in future as a conse-quence of climate change. One of the most ambitious mega-projects involves the quest for a clean energy source. The International Thermonuclear Experimental Reactor (ITER) project is seeking to master nuclear fusion, which would produce no radioactive waste, unlike today’s nuclear fission technology. The reactor is due to be completed in France by 2018 within a project involving the Triad, China, India, the Republic of Korea and Russia.
The priority accorded to clean energy and climate research is having repercussions on S&T fields upstream. Space science and technology, for example, are a rapidly growing field in many developing and emerging countries. Driven by concerns about climate change and environmen-tal degradation, they are attempting to monitor their terri-tory more closely. This is often taking the form of North–South or South–South collaboration, as in the case of an ongoing partnership between Brazil and China, or via projects like Kopernicus–Africa involving the African Union and European Union. At the same time, space science and technology are of course being harnessed to provide ICT infrastructure for use in wireless applications in health, education and other fields. Climate change-related research
1. Growth rates reported in this section reflect the average annual increase between 1996 and 2007 of per capita GDP in constant 2000 US$ from World Bank data.
2. The great majority of the standards governing, for instance, trade in manu-factured goods, agriculture and services are based on US–EU norms.
3. Purchasing power parity dollars4. Between 2002 and 2007,GERD rose in Mexico from PPP US$ 4.2 billion
to PPP US$ 5.6 billion and in South Africa from PPP US$ 2.3 billion (2001) to PPP US$ 4.4 billion.
5. This article is based on the first chapter in the UNESCO Science Report 2010. Luc Soete is Director of UNU-Merit in the Netherlands. Hugo Hollanders is an economist and Senior Research Fellow at UNU–MERIT.
IN FOCUS

11A World of SCIENCE, Vol. 8, No. 4, October–December
NEWS
floodplain mapping and landslide hazard mapping. Among the areas agreed upon with the Government of Pakistan are: mapping and mod-elling of snow and ice cover; an evolutionary analysis of river mor-phology; urban planning for flood- resilient communities; the facilitation of transboundary data-sharing using WMO and UNESCO networks such as Flow Regimes from International Experimental and Network Data (FRIEND) and the International Flood Initiative; enhancing radar coverage of Pakistan to make it pos-sible to forecast flash floods and; the use of remote-sensed precipitation data for flood forecasting.
UNESCO is also working with the Pakistani authorities and international partners to help rehabilitate the edu-cation system, monitor and safeguard World Heritage sites threatened by floodwaters and reinforce humani-tarian information capacities.
For details: www.unesco.org/ihp; www.unesco.org/ihp/friend; to donate: www.unesco.org
An island kicks the oil habit
El Hierro has been a biosphere reserve since 2000. Wind-blown and surrounded by ocean, this most western of the Canary Islands off the coast of Morocco has decided to invest about 54 million in the construction of a wind-hydro power station that could make it the first island in the world to become entirely self-sufficient in electricity. The power station is due for completion in 2011.
The project entails building an integrated hydro-station and wind farm which will complement one another. When the wind blows strongly, as it often does, the five windmills perched on a crest of this steep volcanic island will produce enough energy to pipe salt water from the sea up a steep slope to a reservoir 700 m above sea level nestled in the volcanic crater. When the wind falters, the water in the reservoir will be released down the hillside into a lower reservoir, genera-ting power as it passes through the turbines.
The wind-hydro station is expected to produce 10 mega-watts, enough to fulfil all the electricity needs of the Spanish island’s 11 000 inhabitants (estimated at 4 megawatts) and the 60 000 tourists who visit in the summer. The energy generated is expected to save the islanders 2 million per year, enabling them to write off the project cost by 2040.
UNESCO steps in to help Pakistan
For weeks, the heaviest monsoon rains in 80 years battered Pakistan. Some 20 million people were directly affected, nearly 12% of the population. From 23 to 26 August, a multidisciplinary team of six scientists from UNESCO and associated centres of excellence visited Pakistan. As a result of this mission, an agreed integrated scien-tific plan has been developed in full co-operation with relevant Pakistani agencies to enhance Pakistan’s short- and long-term capacity to manage floods and related geohazards.
The first priority was to make sure flood victims had access to safe drinking water. Drinking water had been compromised by the extensive damage to water supplies in urban areas and to the network of ground-water wells in rural areas. The crisis was compounded by the damage done to major transportation networks.
The mission made a preliminary assessment of the least vulnerable aquifers to flooding. This mapping exercise was planned and conducted jointly by the Pakistani authorities, UNESCO’s Centre for Ground Water Resources Assessment and the International Association of Hydrogeologists.
In the longer term, UNESCO’s groundwater project will strengthen Pakistan’s capacity to provide safe drinking water in an emergency by assessing and identifying other aquifer systems that are least vulnerable to various types of natural disaster. Water governance policies and guidelines for manag-ing Pakistan’s groundwater resources in an emergency will also be established. The quality of groundwater will also be assessed in different parts of the country. For example, groundwater in the Peshawar area has a high fluoride and arsenic content. The project will also implement UNESCO’s guidelines for safe well-drilling.
Many Pakistanis lost their homes and livelihoods in the flooding. An assessment of Pakistan’s flood early warning system was conducted during the August mission jointly by Pakistan’s Department of Meteorology, UNESCO’s Inter-national Hydrological Programme, the World Meteorological Organization (WMO), the International Centre for Water Hazard and Risk Management in Japan and the UNESCO-IHE Institute for Water Education, among others. The causes of flooding in the Indus River Basin were also analysed.
In order to enhance Pakistan’s long-term resilience to floods, a UNESCO programme will develop a national Integrated Flood Management Decision Support System linked with
Phot
os: U
nite
d N
atio
ns/E
van
Schn
eide
r
Refugee camp set up in Pakistan after the August floods

A World of SCIENCE, Vol. 8, No. 4, October–December 201012
NEWS
Some 60% of funding is being provided by the El Hierro municipality, 30% by the Spanish firm ENDESA and 10% by the Instituto Tecnológico de Canarias, Gorona. Part of the investment will finance the construction of a desalination plant to provide water for irrigation.
The inhabitants of El Hierro don’t intend to stop at a wind and water tandem. There are plans to make the island’s cars 100% electric and to install solar panels on the island to produce hot water.
For details: www.insula-elhierro.com/en/wind_hydro.htm
A science observatory for Latin America and the Caribbean
The Science Policy Information Network (SPIN) was launched in Montevideo (Uruguay) on 15 September. SPIN is a revolutionary cluster of databases equipped with powerful graphic and analytical tools that has been devised for decision-makers and specialists in science, technology and innovation (STI) by UNESCO’s Regional Bureau for Science in Latin America and the Caribbean.
The UNESCO office in Montevideo has developed a methodo-logy for the standardization and systematization of data on STI policies in the 33 countries of Latin America and the Caribbean, together with a sophisticated information system that includes:
a detailed inventory in Spanish and English of each national ¸innovation system in the region, with a description of their institutional structure and details of their main programmes, priorities, performance, planning and strategies for interna-tional co-operation;a database encompassing all the relevant legal frameworks in ¸each country;an inventory with detailed descriptions of more than ¸900 different technical and financial science policy instru-ments implemented by the 33 countries in the region, divided into nine categories by objective and strategic goal, into 11 categories by type of facility and into 18 categories by type of beneficiary;a database containing 170 descriptions of national and inter- ¸national organizations and other NGOs which provide tech-nical and financial co-operation in science and technology. These institutions are classified by area and type of co-opera-tion, geographical focus and type of beneficiary;a powerful geo-referenced analytical software (Stat Planet) in ¸Spanish and English which includes more than 450 temporal series, some of them ranging from 1950 to the present time. These time series encompass different groups of indicators: economic, social, governance, gender, environmental, ICT and STI. The Stat Planet software also allows for an analytical esti-mation of correlations between pairs of indicators. The evolu-tion of different indicators can also be studied over time and compared with other regions or countries to allow decision-makers and specialists to detect different patterns in the data.
a digital library specializing in STI with over 800 titles pro- ¸duced by UNESCO;a tool allowing a full country report containing all SPIN ¸information to be exported in the form of a PDF file.
The office in Montevideo has begun exploring the possibi-lity with the UNESCO Institute for Statistics in Montreal (Canada) and the Division of Science Policy and Sustainable Development in Paris (France) of extending the SPIN platform to other parts of the world
To access the SPIN platform: http://spin.unesco.org.uy/ For details: [email protected]
Social sciences growing in emerging economies For a long time, the social sciences were dominated by Western universities. Today, they are gaining ground in Asia and in Latin America, says a report by the International Social Sciences Council (ISSC) released jointly with UNESCO on 25 June.
According to Knowledge Divides, North America and Europe still publish 75% of social science journals worldwide, with 85% of them partially or totally in English. Two-thirds of social science journals are published in the USA, the UK, the Netherlands and Germany. Worldwide, economics and psy-chology are the subject of the greatest number of articles.
Social sciences are developing, however, in emerging econo-mies. In Brazil, the number of social science researchers has prac-tically tripled in the past ten years. In China, the budget for social and human sciences has increased by 15–20% a year since 2003.
The strongest growth in the number of published articles can be observed in Latin America and Europe. The Russian Federation and wider Commonwealth of Independent States, on the other hand, have seen a sharp drop since the disap-pearance of the Soviet Union, due to the falling number of researchers and their ageing, while Russian universities struggle to attract new talent.
In sub-Saharan Africa, three-quarters of publications in social sciences emerge from a handful of universities located primarily in South Africa, Kenya and Nigeria. This situa-tion can be partly explained by brain drain, even if Africa is far from being the only region concerned. The authors note that one doctor of economics in three works in the USA and that nearly one doctor of social sciences in five was born abroad.
The authors observe that the world needs the social sciences more than ever, in order to confront the major challenges facing humanity, such as poverty, epidemics and climate change. Social sciences do not respond to these challenges as much as they should, mainly due to disparities in the research capacities of different countries.
To read or order the report, see page 24.

13A World of SCIENCE, Vol. 8, No. 4, October–December 2010
21 new World Heritage sites
The World Heritage Committee meeting wound up in Brasilia on 3 August with the inscription of four natural and 17 cultural sites, including one mixed site, Papahānaumokuākea (USA). Three countries saw their sites added for the first time: Kiribati, the Marshall Islands and Tajikistan. One existing natural site has also been recognized for its cultural values and thus becomes a mixed site, Ngorongoro Conservation Area (Tanzania).
The World Heritage Committee also removed the Galapagos Islands (Ecuador) from the List of World Heritage in Danger and added four sites to this list.: Bagrati Cathedral and Gelati Monastery (Georgia), the Rainforests of Atsinanana (Madagascar), Tombs of Buganda Kings (Uganda) and the Everglades National Park (USA).
The 11th century Georgian catedral was inscribed on the ‘dan-ger’ list, after the committee expressed serious concern about the irreversible consequences of a major reconstruction project.
In Uganda last March, fire almost completely destroyed the Muzibu Azaala Mpanga building dating from 1882, which contained four royal Buganda tombs. The building is to be recon-structed.
Concerning the rainforests of Atsinanana, the committee noted that Madagascar was continu-ing to provide export permits for illegally logged timber, despite a decree outlawing the exploita-tion and export or rosewood and ebony. The committee also noted that countries having rati-fied the World Heritage Convention were known destinations for this timber.
The Everglades were inscribed at the request of the USA. Home to the largest mangrove system in the Western Hemisphere, they are showing worrying signs of eutrophication as a result of nutrient pollution.
The following World Heritage sites have been extended: City of Graz – Historic Centre and Schloss Eggenberg (Austria);Pirin National Park (Bulgaria);Mines of Rammelsberg, Historic Town of Goslar and Upper Harz Water management System (Germany);Røros Mining Town and the Circumference (Norway);Churches of Moldavia;Prehistoric Rock-Art Sites in the Côa Valley and in Siega Verde (Portugal) and ;Monte San Giorgio (Italy).
The new inscriptions bring the total number of sites inscribed on the World Heritage List to 911.
The next session of the World Heritage Committee will take place in Bahrain in June 2011.
For details: http://whc.unesco.org
Frog in the Peak Wilderness Protected Area which comprises the new World Heritage site in Sri Lanka, together with the Horton Plains National Park and Knuckles Conservation Forest. Rising to 2 500 m above sea level, these montane forests are home to several endangered species, including the Sri Lankan leopard. The region is considered a biodiversity hotspot.
THE NEW NATURAL SITES
China China Danxia
France Pitons, Cirques and Remparts of Reunion Island
Kiribati Phoenix Islands Protected Area
Russian Fed. Putorana Plateau
Sri Lanka Central Highlands of Sri Lanka
THE NEW CULTURAL SITES
Australia Australian Convict Sites
Brazil São Francisco Square in the Town of São Cristovão
China Historic Monuments of Dengfeng, in the ‘Centre of Heaven and Earth’
France Episcopal City of Albi
India Jantar Mantar
Iran Sheikh Safi al-Din Khānegāh and Shrine Ensemble in Ardabil
Iran Tabriz Historical Bazaar Complex
Marshall Islands
Bikini Atoll, Nuclear Test Site
Mexico Camino Real de Tierra Adentro
Mexico Prehistoric Caves of Yagul and Mitla in the Central Valley of Oaxaca
Netherlands Seventeenth-century Canal Ring Area inside the Singelgracht, Amsterdam
Rep. of Korea Historic Villages of Korea: Hahoe and Yangdong
Saudi Arabia At Turaif District in ad-Dir’iyah
Tajikistan Proto-Urban site of Sarazm
THE NEW MIXED SITE
USA Papāhanaumokuākea
Papahanaumokuakea (USA) is a vast, isolated linear cluster of small, low-lying islands and atolls lying roughly 250 km to the northwest of the main Hawaiian Archipelago and ex-tending over some 1931 km. It is one of the largest marine protected areas in the world.
--
©U
NE
SCO
/Nam
al K
amal
goda
©U
NE
SCO

A World of SCIENCE, Vol. 8, No. 4, October–December 201014
INTERVIEW
Conservation International returned again in the summer of 2007 with an American film crew from the television station CBS and again discovered several new species. So in 2008, we mounted a final expedition, this time with the assistance of National Geographic magazine and the Smithsonian Institute, to chart the biodiversity of the Fojas and attempt to identify those species we had frustratingly only glimpsed on previous surveys. The 2008 expedition succeeded in cataloguing and recording species that had been missed on previous expeditions. We even found new taxa that we had not even imagined would be there, like the Imperial Pigeon (Ducula sp. nov). Having National Geographic photograph these species was a bonus, as it brings the splendid, unique biodiversity of the Fojas to many more people.
Where will your work take you next in Papua?
We now know that the Foja Mountains have generated hundreds of local endemic species. We ourselves have accumulated a list of well over 100 new plants and animals on our three expeditions. It just shows how much work still remains to document the Earth’s biodiversity.
The Foja Mountains and the adjacent Mamberamo Basin cover over 2 million ha of swamp forest. This natural wealth needs stewardship, not only by the local landowners but also by the provin-cial and national authorities. Conserving the Fojas and surrounding jungle and swamps will protect large amounts of standing carbon and peat, bountiful freshwater systems and incredible biodiversity.
Conservation International could never have visited Foja if it were not for our strong relationship with the local Kwerba and Papasena people, the indigenous landowners of these mountains. This took several years of engagement and collaboration that goes back in 2004, together with the Center of International Forestry Research (CIFOR) and its Multidisciplinary Landscape Assessment Methodology. Conservation International and CIFOR have helped local communities map their resources then design local regulations for conservation based on traditional law for these lands. In addition, our Indonesia Papua team at Conservation
How did you come across these new species?
The Fojas are perhaps the least disturbed and most pristine tropi-cal forest block on Earth: 300 000 ha of totally unroaded upland rainforest. This makes them of extreme interest to scientists keen to learn more about island biogeography and the processes of specia-tion. An added bonus is the likelihood of discovering new species.
The Foja mountains are isolated from the main mountain range running down the spine of New Guinea. As such, they are a cool mountain ‘island’ surrounded by a ‘sea’ of hotter lowland forest. Species in the Fojas are therefore cut off from the main central mountain range and may have evolved into different forms due to physical isolation and differing environmental conditions from their nearest relatives on other mountain ranges. To travel to the interior highlands above 1000 m requires a helicopter, which is very difficult to come by in the region!
US ornithologist and tropical ecologist Bruce Beehler first dreamt of visiting these mountains 20 years ago but many elements needed to be aligned before the first survey could be implemented in 2005 by scientists from Conservation International, the Indonesian Scientific Institute (Lembaga Ilmu Pengetahuan Indonesia: LIPI), South Australian Museum, Smithsonian Institute (USA), Harvard Arboretum (USA) and Indonesia’s Ministry of Forestry. All were anxious to discover the amazing biodiversity no doubt hidden in the Fojas, practically the last terrestrial place to be surveyed in Indonesia.
The 2005 expedition discovered a wealth of species, many endemic to the Fojas and many new to science, including a honeyeater (bird) and several taxa of frogs, lizards and plants, including five palms in the lowlands. It also confirmed the pre-sence of the Golden Mantled Tree-Kangaroo, deservedly given the name Dendrolagus pulcherrimus, meaning ‘most beautiful tree-kangaroo’. That 2005 trip also confirmed the place of origin of the long-lost six-wired bird-of-paradise (Parotia berlepschi), the presence of which was only known from a bird skin. Previously, the home of this bird had been a mystery and it had therefore been mistakenly placed with another species, P. carolae.
On 17 May, scientists announced the discovery of several mammal species, a reptile, an amphibian, a dozen insect species and a new bird
in a remote forest in the Foja Mountains of the Indonesian province of Papua. Participating in the expedition was Jatna Supriatna,
Vice-President of the Indonesian branch of Conservation International and a senior lecturer at the Graduate School of Conservation Biology within the University of Indonesia. Here, he explains the importance of this find and what Indonesia is doing to safeguard its remarkable biodiversity.
Jatna Supriatna
Indonesia has imposed a moratoriumon logging

15A World of SCIENCE, Vol. 8, No. 4, October–December 2010
International worked closely with the Papua provincial authorities to make certain they were fully engaged with our research and conservation activities in the Mamberamo region. At the same time, our Jakarta team had been working for many years with LIPI. That long-term partnership allowed us to create strong expe-dition teams that included the best Indonesian and international scientists. Today, the Governor of Papua, Barnabas Suebu, can see that this sort of exploratory biodiversity work makes an important contribution to Papua’s knowledge of its environment.
Conservation of the Foja mountains needs further work. In collaboration with the private sector in Papua and other partners, Conservation International has pioneered spatial planning metho-dology to optimize both conservation and development.
You have been in the field of conservation in Indonesia for more than 30 years. What changes have you seen over this time?
For more than 30 years, President Suharto gave away most of the country’s tropical forests in the form of concessions to his allies, fuelling the highest deforestation rates Indonesia had ever known, especially in Sumatra and Kalimantan, until his fall in 1998. Since democracy was restored, successive govern-ments have decentralized power too rapidly, causing chaos. President Megawati Sukarnoputri, for example, strived to establish six addi-tional national parks during her brief presidency but in parallel granted the rights to mine 13 existing parks. Under her successor, Abdurachman Wahid, a host of logging operations were given to non-professional logging compa-nies, smallholders and co-operatives.
The regional autonomy legislation, which came into effect in January 2001, is fundamentally reshaping the relationship between Jakarta and local authorities in all sectors, including forestry policy-making, legislation and administration. There are now more than 400 local decision-making bodies instead of just the one under Suharto. Provincial and district authorities are increasingly resistant to old-style centrally organized initiatives. Local governments are anxious to increase their revenue from natural resources, including by levying taxes on private and state-controlled operations. District and provincial assemblies are now allowed to pass local regulations, which may have negative or positive implications for forest conservation and indigenous live-lihoods. For example, one positive implication is that NGOs are lobbying for local regulations that will recognize indigenous rights to natural resources and promote sustainable use. One potential negative implication is that district administrators can now issue large numbers of permits for so-called small logging concessions: 100 ha if managed by local co-operatives; up to 10 000 ha for locally based companies.
This trend offers an opportunity for greater local participa-tion in decisions about resource allocation, greater accountability
by regional governments, a refocusing of central agencies on policy and oversight and, ultimately, more sustainable use of natural resources. However, unregulated decentralization also carries a sub-stantial risk of accelerating environmental degradation in the short term, which could cancel out its long-term benefit. Risk factors include lingering economic and political uncertainty; local natural resource agencies that have historically lacked authority and funds; official corruption; and a partial breakdown of law and order.
There is currently no binding legal framework for combating climate change after 2012. What role could Indonesia play in changing this situation?
In the absence of an international legal framework, Indonesia still needs to do several things. In terms of mitigation, firstly, it needs to improve the legal framework of the UN Collaborative Programme on Reducing Emissions from Deforestation and Forest Degradation in Developing Countries (REDD). Secondly, it needs to develop demonstration projects to build an understanding of how REDD will work in different districts and provinces and how benefits will be distributed. Thirdly, a financial monitoring, reporting and verifi-cation mechanism is critical.
President Susilo Bambang Yudhoyono committed to cutting Indonesia’s CO2 emissions by 26% at the G20 meeting in Pittsburgh (USA) in early 2009 and 40% if other nations made similar commitments. This promise can only be fulfilled if the government dramatically cuts the amount of permits it grants for forest conversion. Approximately one million
ha of forest are lost every year and illegal logging and wildlife trade are rampant. On 27 May this year, the Indonesian and Norwegian governments signed a Letter of Intent imposing a two-year moratorium on the exploitation of Indonesian peat and natural forests which also contains provi-
sions for combating illegal logging and forest crimes like poach-ing. In return, the Norwegian government has pledged up to US$1 billion to help preserve Indonesian forests. Recently, two local governors declared a moratorium of their own on logging in Aceh and Papua. If other governors followed their lead, this would reduce the rate of deforestation signifcantly in Indonesia. I think President Yudhoyono could also ask environmental NGOs and many other stakeholders to work with him in monitoring his policy on logging moratoriums in peat land area, the source of more than 50% of Indonesia’s carbon emissions.
A key avenue for obtaining compensation for the revenue we shall lose from limiting deforestation is REDD+. The + refers to the implications for indigenous people, local communities and forests under REDD projects. It is thus logical that the government should support REDD+ and make sure that it is adequately funded, preferably via market mechanisms. This is not to say that Indonesia must abandon palm oil and timber as sources of revenue, merely
Discovered in the Foja moutains in May, this species of blossom bat is nocturnal.
The world’s smallest wallaby, discovered in the Foja mountains in May
©Ti
m L
aman
, Nat
iona
l Geo
grap
hic

A World of SCIENCE, Vol. 8, No. 4, October–December 201016
INTERVIEW
AAA AAAAA A WoWoWooWWoW rlrlrllllld dd ddddd offofofofoff SCSCSCSCSCSCSSCCS IEIEIEIEIIEII NNCNCN EEE,, ,, ,, , VoVoVoVoVoVoVVoV lll.l.ll. 8 8 88 8,, ,,, NNNNNNNNNo.oo.o.oo 4 44, OcOcOOcOcOcOcOcOOcOcctotototootobebebebebbb r–r––DeDeDeDececececeeeembmbmbmbeeerrerr 2222222 2001010100010 00000001616166
ININI TTETERVRVVRVIEIEEEIEEWWWWWWWW
Remnant forest areas also need to be consolidated to form corridors between protected areas to save wildlife habitat. Given the chronic underfunding of wildlife conservation, there is huge potential for forest and wildlife protection through carbon-financed forest protection schemes. However, there are several barriers to large-scale adoption of such schemes, inclu- ding the need to first develop a ‘payment for ecosystem services’ mechanism.
Support also needs to be scaled up for local NGOs engaged in conservation to build a core group of stronger, long-term NGO partners. It may also be possible to attract other local NGO donors to back the initiative and distribute some funding through competitive grants.
We must also leverage large-scale conservation funding mechanisms. Several have been tapped for conservation in Sumatra, including the Debt for Nature Swap proposed by Germany and the UK, the Corporate Social Responsibility fund and the Tropical Forest Conservation Act (TFCA), adopted by the US Congress in 1998. Under TFCA, the US and Indonesian governments signed the largest debt-for-nature swap of its kind in June 2009 to reduce Indonesia’s debt payments to the USA
by nearly $30 million over eight years. In return, the Indonesian government is redirecting these funds towards tropical forest conservation. The US Treasury Department is providing a provisional allocation of $19.6 mil-lion. I was involved in developing this TFCA deal for the Sumatra conserva-tion fund and have been appointed to chair the oversight committee.
The needs for conserving biodiver-sity in Sumatra are arguably some of the most urgent on the planet.
However, they are too complex, varied and widespread for any one organization or donor to tackle successfully. What is needed is an integrated programme that can serve as a catalyst to encourage and foster alliances at the district level and address these needs in the short term, while setting up mechanisms to maintain these efforts over the long term. Successful models for improving the economic condition of communities living near protected areas while enhancing conservation should be replicated in Sumatra.
Interview by Robert Lee6
The photos on these pages are reproduced with the kind permission of wildlife photojournalist Tim Laman, who accompanied the expe-dition to the Foja mountains on behalf of National Geographic. See also timlaman.com
that we must not make ourselves a hostage to fortune by putting too many of our eggs in one basket. Our portfolio of revenue from our lands should include revenue from our standing forests.
Indonesia has learned that markets can take as much as they give: the collapse of the price of cloves in the 1990s damaged the livelihoods of many and the economy of Indonesia as a whole. If set up properly, REDD+ could offer us the chance to generate sustained revenue from one of the services that our forests provide: removing carbon from the atmosphere and storing it. REDD+ will have to remain competitive in the face of fluctuating commodity prices. But it will also support the other essential services that our forests provide for us, such as the protection of our freshwater supplies and fertile soils, among numerous other benefits.
The animated debate on REDD does not appear to trickle down to local stakeholders. What do you think needs to happen to engage them more?
There have been many discussions on REDD in Indonesia. To clarify the issues, Indonesia has compared its own REDD activities with those of other countries. However, these discussions have unfor-tunately not involved local governments, local communities or large stakeholders.
Indonesia is currently developing a national framework for REDD+ and preparing to embrace REDD interna-tionally. Some positive steps have been taken, such as the world’s first national legal regime for REDD in the form of the Forestry Ministerial Decree N° 30 of 2009. This framework defines the eligi-bility and rights to sell REDD credits in voluntary and expected compliance markets. There will also be benefits for government, community and project deve-lopers. It also stipulates the need to have a national working group on REDD, which in Indonesia is called REDDI.
However, Indonesia still needs to manage its finances and administer revenue better. Institutions must be strengthened to deal with corruption and fraud. We must impose accountability on recipients of public finance and promote equitable distri-bution of the benefits of REDD to minimize any negative impact on forest communities.
What do you consider to be the highest conservation priorities in Indonesia?
The highest priority is to make sure no more peat land and low-land tropical forest is converted for agriculture or into planta-tions, especially oil palm, rubber and other monocultures.
In addition, protected area management is in dire need of resources. National parks are chronically underfinanced and remain ineffective. Developing innovative sustainable fund-ing mechanisms could help address this, including piloting site-based models for generating revenue from water and carbon as part of climate change mitigation.
6. Deputy-Director and Programme Specialist in ecological sciences in UNESCO’s Regional Bureau for Science in Asia, located in Jakarta
A frog discovered in the Foja mountains in May
©Ti
m L
aman
, Nat
iona
l Geo
grap
hic

17A World of SCIENCE, Vol. 8, No. 4, October–December
HORIZONS
A third factor is that the knowledge intensity of India’s overall output has expanded. Currently, about 11% of India’s GDP comes from knowledge-intensive products and services. Also noteworthy is that growth in knowledge-intensive production surpasses that of the economy over-all. The majority of new companies belong to knowledge-intensive sectors and the number of knowledge-intensive enterprises has mushroomed over the past seven years or so. This trend is corroborated by the technology content of all industrial proposals implemented since the first reforms to liberalize the economy got underway in 1991. Once again, with the exception of the textile industry and a few others, the majority of new proposals emanate from technology-oriented industries in areas such as chemicals, energy, electrical equipment and so on.
A fourth factor is that foreign direct investment (FDI) from India has grown considerably, from just US$2 mil-lion in 1993 to about US $19 billion in 2009. This includes some high-profile technology-based acquisitions abroad by Indian companies. Examples are Tata Steel’s takeover of British industry giant Corus, Bharat Forge’s takeover of forging companies in Germany, the UK and USA, and Suzlon’s takeover of wind turbine companies in Germany.
The growing number of foreign acquisitions of ‘active targets’ – in technological jargon – has given Indian com-panies considerable access to the technological capacity of the acquired firms without their having to build this up assiduously from scratch. The same goes for mergers. Before Tata Steel’s purchase of Corus, Europe’s second-largest steel producer with annual revenue of around £12 billion, the Indian steelmaker did not hold a single American patent. The takeover brought it over 80 patents, as well as almost 1 000 research staff.
In addition, the number of foreign research and devel-opment (R&D) centres has grown from fewer than 100 in 2003 to about 750 by the end of 2009. Most of these R&D centres relate to information and communication
The rise of innovation in India has been precipitated by a number of factors. Firstly, India has emerged as the fifth-largest economy in the world in purchasing power parity (PPP) dollars, according to the World Bank. In relative terms, however, India’s economy is just half the size of China’s, which also happens to be growing at a faster rate: 8.7% in 2009 after progressing by 10% or more for six years in a row. India’s real GDP growth slipped back to 7% in 2007 and to less than 6% in 2009, after climbing from 5% in 2002 to a steady 9% in 2005–2007, according to the International Monetary Fund.
Secondly, there are many instances of innovation in the services sector, especially as concerns health care. Currently, the services sector accounts for two-thirds of GDP in India. Both the services and manufacturing sectors have been per-forming very well.
In the manufacturing sector, for instance, the release of Tata’s Nano brand in 2008 hailed the advent of ‘the world’s cheapest car’, at US$2 200. The car was designed at Italy’s Institute of Development in Automotive Engineering with component parts manufactured by an Indian subsi-diary of Bosch, a German company. Approximately two-thirds of the technology for Bosch products used in the Nano car is sourced from India. The initial production target is for 250 000 units per year.
In the health sector, the MAC 400 machine produced by General Electric’s John F. Welch Technology Centre in Bangalore records a patient’s electrocardiogram. As it is port-able, it can be used in rural areas to diagnose heart disease.
For a very long time, Indian policy-makers avoided using the explicit term of ‘innovation’ in policy documents dealing with technological activities. The word ‘innovation’ appears in a policy document for the first time in 2008, in the draft National Innovation Act. This development reflects a broad sentiment in both policy and business circles that the country is becoming more innovative – at least certain industries.
The rise of innovation in India
In recent years, there has been much discussion in expert circles and the popular press about the rise of innovation in India. In the following extract from the chapter on India in the UNESCO Science Report 2010, we explore the reasons behind this success story and the challenges that remain. Launch of the Tata Nano car at the Auto Expo in New Delhi
in January 2008. The car sells for about US$2 200.
Phot
o: B
. Bal
aji/F
lickr
.com

A World of SCIENCE, Vol. 8, No. 4, October–December 201018
HORIZONS
technologies and the automotive and pharmaceutical industries.
A fifth factor is that India has become more competitive in high-tech areas. Although manufactured exports are still dominated by low-tech products, the share of high-tech products has doubled in the past 20 years to 17%. India has become the world’s largest exporter of infor-mation technology (IT) services since 2005 and exports of aerospace products have been increasing at a rate of 74% per year, compared to 15% for world exports of these products. India is acknowledged to have consi-derable technological capability in the design and manufacture of space-craft and is now an acknowledged global leader in remote sensing. According to Futron’s 2009 ranking of ten entities in its Space Competitiveness Index, India ranks better than the Republic of Korea, Israel or Brazil.
However, the bulk of innovation in this area comes from the government sector rather than industry, a situation that is set to change. Aerospace exports from India have increased manifold in recent years, even if exports tend to be confined to aircraft parts or components. With approxi-mately 300 small and medium-sized enterprises active in this area, India is slowly emerging as one of the few developing countries to have a high-tech industry of the calibre of its aerospace industry.
A limited spillover of government research to civilian use
Government expenditure on R&D in India tends to focus on nuclear energy, defence, space, health and agriculture. The spillover of government research to civilian use is very limited, although in more recent times, conscious efforts have been made by the government to orient research more towards socio-economic goals. This is slowly beginning to produce results, especially in the area of space research with the development of environmental monitoring, satellite communications and so on.
The higher education sector in India is not a source of technology for industry. This may come as a surprise, as the Indian Institutes of Technology do collaborate with private industry. Unfortunately, however, cases of actual technology generation are few and far between, as much of R&D relates to basic research. Moreover, the insti-tutes tend to be extremely teaching-intensive institutions. It is estimated that the entire higher education sector in India contributes no more than 5% of GERD. It does
act as an important reservoir of skilled personnel, however, for the other actors in India’s national innovation system.
Currently, private compa-nies spend approximately four
times more than public enterprises on R&D and nearly three times more than government research institutes. In other words, private enterprises are moving towards the core of India’s innovation system. Four industries account for the lion’s share of investment in R&D, with the pharmaceutical and automotive industries topping the list. There is insufficient evidence to show that India’s entire industrial sector has become more innovative since 1991 but India’s pharmaceutical industry certainly has.
Remedying a shortage of trained personnel
Of late, industry has been complaining of serious short-ages in technically trained personnel. A study by the Federation of Indian Chambers of Commerce and Industry in 2007 revealed a 25% shortage of skilled personnel in the engineering sector.
A boy holds a Blackberry to his mother’s ear.
a
ntime
©U
NE
SCO
/Pan
kaj A
rora
©U
NE
SCO
/Abh
ijit D
ey
Village in West Bengal

19A World of SCIENCE, Vol. 8, No. 4, October–December 2010
Two issues have an impact on the potential supply of scientists and engineers for domestic businesses, in particu-lar. The first is the long-standing issue of the migration of highly skilled personnel from India to the West primarily. There is every indication that this brain drain has acce- lerated in recent times. The second issue concerns the grow-ing amount of FDI flowing into R&D. Foreign R&D centres are able to offer domestic researchers and R&D personnel better incentives than domestic businesses. As a result, India’s small stock of scientists and engineers may be lured to foreign R&D centres.
The central government in particular has reacted vigorously. In higher educa-tion, it is seeking to raise the gross enrol-ment ratio from 11% in 2007 to 21% by 2017, one of the targets of the Eleventh Five-Year Plan (2007–2012). One-quarter of the student body is currently enrolled in fields related to science and techno-logy (S&T), according to the UNESCO Institute for Statistics.
The government has opted to establish 30 new central universities from 2010 onwards, 14 of which will be ‘innovation universities’. Each innovation university is expected to focus on one area of signi-ficance to India, such as urbanization, environmental sustainability and public health.
In parallel, the government is doubling the number of Indian Institutes of Technology to 16 and establishing 10 new National Institutes of Technology, three Indian Institutes of Science Education and Research and 20 Indian Institutes of Information Technology to improve engineer-ing education.
This year, the government is also in the process of adopt-ing a policy of permitting foreign universities to enter the higher education system in India by establishing their own campuses or via joint ventures with existing universities and institutes.
The impact of the Indian Patent Act
One important policy change in recent years has been the adoption of the Indian Patent Act, which took effect on 1 January 2005. This ordinance sought to bring the country into compliance with the Agreement on Trade-Related Aspects of Intellectual Property Rights (TRIPS) of the World Trade Organization. The most distinguishing feature of this policy change is the recognition of both product and process patents, as opposed to solely proc-ess patents in the earlier Act of 1970. In bringing India into compliance with TRIPS, the intention was to restrict
innovation in the pharmaceutical industry in particular, where the lack of product patents had allowed firms to reverse-engineer known products at little cost. This 35-year learning period seems to have given the pharma firms the time they needed to acquire the skills crucial to inventing new chemical entities.
After the adoption of the Indian Patent Act, it was expected that R&D spending by the pharmaceutical indus-
try would slump. This reasoning was based on the belief that much of Indian R&D in pharmaceuticals still consisted of reverse-engineering. By requiring recognition of both product and process patents, it was thought that the amended Act would reduce the space for reverse-engineering. It turns out private pharmaceutical companies in India have actually con-tinued to register an increase in R&D investment of almost 35% per year (see figure).
In fact, some of the provisions in the Indian Patent Act have protected Indian pharma companies, even if the ordinance imposes a 20-year pro-tection period for product patents. For example, there is a provision for granting compulsory licences for the export of medicines to countries that have insufficient or no market-
ing capacity, to meet emergent public health situations, in accordance with the Doha Declaration on TRIPS and Public Health. This allows Indian companies to produce and export AIDS drugs to African and Southeast Asian countries. Another safeguard has been the introduction of a provision making patent rights for mailbox applications available only from the date of granting the patent rather than retrospectively from the date of publication. This provision has saved many Indian companies from being attacked for infringement of patent law by multinational companies that might otherwise have obtained patents for drugs already put on the market by Indian companies.
As for the impact of the Act on innovation in the agricul-ture, biotechnology and IT sectors, this aspect still needs to be analysed in depth.
The incredible feat of Indian pharma
Turnover by the Indian pharmaceuticals industry has grown from a modest US$300 million in 1980 to about US$19 bil-lion in 2008. India now ranks third world-wide after the USA and Japan in terms of the volume of production, with a 10% share of the world market. In terms of the value of produc-tion, it ranks 14th for a 1.5% global share.
0
5
10
0.12
16.30(2008)
15
20
1992 1995 1998 2001 2004 2007 2010
Sour
ce: U
NE
SCO
Sci
ence
Rep
ort 2
010
Average R&D expenditure per firm in India’s pharmaceutical industry,
1992–2008
Rs Crores

A World of SCIENCE, Vol. 8, No. 4, October–December 201020
Foreign companies dominate patents
India has improved its patenting record in the USA, with an acceleration over the past decade. Most Indian patents are utility patents, namely those for new inventions. However, most of these patents are in chemistry-related areas and most are being granted to foreign companies located in India, based on R&D projects they have carried out in India. This is a growing trend.
Similarly, the number of national patents granted by the India Patent Office has increased tremendously, even if over three-quarters are still granted to foreign entities. Once again, most of these patents concern chemistry and pharmaceutical-related areas. Thus, although the TRIPS compliance of the Indian Patents Act appears to have had a positive effect on patenting by Indian inventors, most of the patents granted to Indian inventors both in India and abroad are going to foreign companies.
India has certainly made great strides in space research, life sciences and especially in biopharmaceuticals and IT. Although domestic science continues to dominate, there is also a growing presence of foreign entities in India’s technology system.
The main challenge will be to improve both the quality and quantity of S&T personnel. Fortunately, policy- makers are seized of this problem and have taken energetic steps to remedy the situation, as we have seen. The future success of India’s national innovation system will depend on how well they succeed.
Sunil Mani7
In all, there are about 5000 foreign and Indian firms engaged in the manufacturing pharmaceuticals, which directly employ about 340 000 individuals. Much of industrial growth is fuelled by exports, which grew by 22% on average between 2003 and 2008. The top five destinations in 2008 were, in descending order, the USA, Germany, Russia, United Kingdom and China.
The industry has four key characteristics:
it is dominated by formulations, the process of com- ❐
bining different chemical substances to produce a drug, and employs over 400 active chemicals for use in drug manufacture, known as Active Pharmaceutical Ingredients;
it is very active in the global market for generics, even ❐
supplying developed countries;
it enables India to be self-sufficient in most drugs, as ❐
witnessed by a growing positive trade balance, and;
it is one of the most innovative industries in India, in ❐
terms of R&D and the number of patents granted, both in India and abroad.
One spin-off of India’s innovative capability in pharma-ceuticals is that it has become a popular destination for clinical trials, contract manufacturing and R&D outsourcing. These capabilities hold great promise for the Indian pharma industry, as an estimated US$103 billion of generic products are at risk of losing patents by 2012. Furthermore, the global market for contract manufacturing of prescription drugs is predicted to grow from US $26 billion to US $44 billion by 2015 or so. According to experts, the country has ‘good’ to ‘high’ skills in preclinical trials and Phase I clinical trials and ‘very high’ skills in Phase II and Phase III clinical trials.
A very recent trend observed in India’s pharma industry is the wave of cross-border mergers and acquisitions in which Indian companies have taken over foreign ones and foreign firms have in turn taken over Indian companies. The pharma industry has become one of India’s most globalized industries. One of the most high-profile take-overs concerns Ranbaxy, India’s largest pharma company and the country’s biggest producer of generic drugs. In 2008, Japanese pharma giant Daiichi Sankyo acquired a majority stake (35%) in Ranbaxy, at a cost of up to US$4.6 billion.
A sharp rise in publications
The most recent Thomson Reuters data confirm that India’s strength truly lies in chemistry, pharmacology and toxicol-ogy (see figure). The number of Indian articles recorded in the Science Citation Index has progressed rapidly, doubling between 2002 and 2008 to 36 261. If this growth rate is maintained, India’s publication record will be on par with most G8 nations within 7–8 years. India could even over-take them between 2015 and 2020.
7. Author of the chapter on India in the UNESCO Science Report 2010, Professor and Planning Commission Chair at the Centre for Development Studies in Trivandrum in the Indian State of Kerala: [email protected]
rmshichh of w by
fiveSA,
om-ce a
use tical
even
s, as
0 20 40 60 80 100
Biology
INDIA 20089 11 20 21 6 17 14
BRAZIL 200821 13 9 33 4 9 9
CHINA
20086 9 22 13 6 22 5 19
Biomedical research Chemistry Clinical medicine
Earth and space Engineering & technology
Mathematics Physics
Source: UNESCO Science Report 2010
Focus of Indian publications in 2008 by major field of science Brazil and China are given for comparison

21A World of SCIENCE, Vol. 8, No. 4, October–December 2010
In each adventure, Patrimonito comes to the rescue of a natural or cultural World Heritage site that is experiencing problems. The character was created in 1995 by a group of Spanish-speaking pupils during a work-shop at the First World Heritage Youth Forum in Bergen (Norway) and has since become an international mascot.
The cartoon series was launched in 2002 within a competition for secondary school pupils organized by UNESCO to celebrate the 30th anni-versary of the World Heritage Convention. The winning storyboards have been professionally animated and are distributed to schools in CD-ROM format.
So far, eight 4-minute films have been made. There is no dialogue but music and short texts accompany each film in one or more of the six official languages of UNESCO: Arabic, Chinese, English, French, Russian and Spanish.
The adventures of Patrimonito One of the themes of the International Year of Biodiversity is education. UNESCO’s World Heritage Education Programme has developed a series of short, animated cartoons for schools which depict the adventures of a character called Patrimonito, a heritage guardian whose name means ‘small heritage’ in Spanish.
HORIZONS
Five of these films follow the fortunes of cultural heritage:
the historic centre of Havana (Cuba); the wooden church in Urnes (Norway); the 11 churches built out of the rockface
in Lalibela (Ethiopia); historic monuments of Novgorod
(Russian Federation) and; the Old Town of Avila (Spain).
The remaining three focus on natural sites:
the Sub-Antarctic Islands (New Zealand); the Virunga Mountains (Democratic Republic
of Congo, Rwanda, Uganda) and; the Great Barrier Reef (Australia).
In the cartoon overleaf, we follow the adventures of Patrimonito in the Sub-Antarctic islands, which have been overrun by a horde of little pigs.
For details and to view these films: http://whc.unesco.org/en/patrimonito
In this film, Patrimonito visits the Great Barrier Island in 1980 (left), where he meets dugongs, turtles, schools of many different kinds of fish and colourful corals. He then returns with a young friend 20 years later, only to find that warming sea temperatures from climate change have bleached the corals. In the second still (right), Patrimonito has grabbed an anchor
before it can lodge in a coral on the seafloor and his young friend is picking up rubbish thrown overboard by the growing number of pleasure yachts in the area.
In this early scene from the film, poachers have come to the Virunga mountains to kill gorillas. One will be shot trying to protect its young then carried to a nearby village to be sold as bushmeat. Patrimonito will explain to the villagers why gorillas need protecting.

A World of SCIENCE, Vol. 8, No. 4, October–December 201022
HORIZONS
Some 150 years ago, the seas and cliffs south of New Zealand in the sub-Antarctic islands teemed with seals, seagulls, penguins and a great diversity of other species. The islands were home to ten of the world’s 24 albatross species.
One day in 1864, a sailing ship came into view. As the ship approached the islands, a storm brewed. The ship was tossed about by the high waves. With night falling, the captain accidentally ventured too close to the shore and the ship was thrown against the rocks.
The only survivors were two little pigs who managed to make it ashore on a barrel, a girl and a boy. The locals greeted them with curiosity rather than fear. It wasn’t long, however, until the two little pigs were causing trouble. One day, a pig came racing around a corner so fast that he knocked
a couple of penguins into the water! He then accidentally crushed the unprotected egg under his hoof.
The pigs were always hungry. When one of them saw a seagull sitting on a big, juicy egg, it would chase the seagull away then grab the egg and eat it. The pigs loved living on an island where they could find plenty to eat. Soon they were raising a family. They had a lot of piglets, who then had a
lot of piglets of their own. Within a few years, there were hundreds of pigs on the island.
Invasive little aliens: a Patrimonito adventure

23A World of SCIENCE, Vol. 8, No. 4, October–December 2010
He hopped in a dinghy and headed for the Sub-Antarctic Islands. The birds greeted him anxiously. The pigs kept breaking or eating their eggs, they said, and trampling the undergrowth. It was becoming impossible to raise a family. There was only one thing for it, Patrimonito realized.
Life became a nightmare for the birds. With the pigs eating or destroying their eggs, they were unable to raise any chicks. The bird population began to dwindle. As the years went by, there were fewer and fewer birds in the seas and skies.
By 2004, the situation had got so bad that Patrimonito decided to act.
The pigs would have to go! In a green meadow, Patrimonito sneaked up behind one of the pigs and threw a net over it. He was such a good pig-catcher that, within no time at all, he had captured all the pigs on the island. He piled them high in his dinghy and, with a cheery wave, he was off.
At last, the birds could raise their chicks in peace.
The bird population started to climb again and, by 2255, the seas and skies were once more teeming with birds. This is a true story. The introduction of pigs into the Sub-Antarctic Islands endangered the existing animal and plant populations.
That is why these pigs are called ‘invasive alien species’ and that is why they had to go!

International Year of Biodiversity: www.unesco.org/en/biodiversity
For sales publications: www.unesco.org/publishing A World of Science online: www.unesco.org/en/a-world-of-science
UNESCO Science Report 2010Edited by Susan Schneegans. Produced by Division for Science Policy and Sustainable Development. UNESCO Reference Series, UNESCO Publishing, 29.00 , ISBN 978-92-3-104132-7, English only, 536 pp. Executive Summary in Arabic, Chinese, English, French, Russian and Spanish.A global overview of the main developments in scientific research, innovation and higher education since 2005 is followed by chapters describing the situation in Latin America, the Caribbean, the European Union, Southeast Europe, the Arab states, sub-Saharan Africa, Central Asia, South and Southeast Asia and Oceania. These regional chapters are interspersed with national chapters on Brazil, Canada, China, Cuba, India, Iran, Japan, Republic of Korea, Russian Federation, Turkey and the USA. See also editorial and pages 2 and 17. For details: [email protected]; [email protected]; Download: www.unesco.org/science/psd
Measuring R&D: Challenges faced by Developing CountriesTechnical paper n°5. Produced by UNESCO Institute for Statistics, English only, 40 pp.The methodology for measuring R&D is detailed in the OECD’s Frascati Manual and has been in use now for almost 50 years. Despite this longevity, developing countries sometimes face problems in applying the manual’s standards to their particular situation. This technical paper provides guidance on challenges relevant to developing countries which may not be elaborated on clearly enough in the Frascati Manual. Issues covered include how countries can measure internal and international mobi-lity of the R&D workforce, clinical trials, software development and reverse engineering. For details: [email protected]; download: www.uis.unesco.org/template/pdf/S&T/TechPaper5_EN.pdf
ICTs Transforming Education – a Regional GuideBy Jonathan Anderson, UNESCO Bangkok, English only, 120 p.Guide designed to equip teachers and teacher trainers in the Asia–Pacific region with the compe-tencies and resources to use ICTs in teaching. Includes ‘snapshots’ written by innovative teachers and teacher educators in the region to show how ICT are being used to transform education. Download: http://unesdoc.unesco.org/images/0018/001892/189216E.pdf
Global Education Digest 2010Comparing Education Statistics across the World: Special Focus on GenderUNESCO Institute for Statistics/UNESCO Publishing, ISBN: 978-92-9189-088-0, English only , other language editions forthcoming, 276 pp.Boys and girls in only 85 countries will have equal access to primary and secondary education by 2015, if present trends continue. At the bachelor’s degree level, most countries have achieved gender parity in terms of graduates. Women account for 56% of graduates with master’s degrees. However, men account for 56% of all PhD graduates and 71% of researchers. Download: www.uis.unesco.org/template/pdf/ged/2010/GED_2010_EN.pdf ; see also: www.uis.unesco.org/publications/GED2010
We Love Our Geopark Seven-minute film written, animated and directed by Bex Glover, Severn Studios, English only.Traces the extraordinary geology of the English Riviera Geopark, part of the UNESCO Global Network of Geoparks, since the Devonian. View the film: www.youtube.com/watch?v=RATmkF9zXy4
Ciencia para la Paz y el DesarrolloEl Caso del Juramento Hipocrático
para Científicos Edited by Guillermo Lemarchand. Published by
UNESCO’s Regional Bureau for Science in Latin America and the Caribbean (Montevideo) in the series Documents and
Studies on Science Policy in Latin America and the Caribbean. Spanish only, 192 pp.
A collection of essays from a workshop organized by UNESCO at the University of Buenos Aires in 2008 on World Science Day (10 November). Summarizes an ongoing debate as to whether or not a code of ethics should be drawn up for scientists along the lines of the Hippocratic Oath for medical doctors. The annex includes the Science Agenda – Framework for Action adopted by the World Conference on Science (1999) which stated that ‘governments and NGOs, in particular scientific and scholarly organizations, should organize debates, including public debates, on the ethical implications of scientific work’ and that ‘scientific associations should define a code of ethics for their members.’ Download: unesdoc.unesco.org/images/0018/001884/188400S.pdf
World Social Science Report 2010 Knowledge DividesUNESCO Publishing / International Social Science Council, ISBN 978-92-3-104131-0,
28.00, English only, 444 pp. Executive Summary available in English, Chinese, French, Spanish and Russian.Status report. Social science from Western countries continues to exert the greatest global influence but the field is expanding rapidly in Asia and Latin America. See also page 12. Launched on 25 June at UNESCO in Paris. Download: http://unesdoc.unesco.org/images/0018/001883/188333e.pdf
UNESCO Haiti Produced by UNESCO Haïti office, English only.First issue of newsletter designed to inform readers of UNESCO’s efforts in education, science and culture to ‘build back better’ after the devastating earthquake of January 2010. For details (Head of office): [email protected]; editor: [email protected] Download (June issue): http://unesdoc.unesco.org/images/0018/001883/188343e.pdf
The International Thermodynamic Equation of Seawater – 2010Calculation and use of thermodynamic propertiesUNESCO-IOC Manuals and Guides Series 56. English only, 204 pp.Reviews and summarizes the work of the SCOR/IAPSO Working Group 127 on the Thermodynamics and Equation of State of Seawater. Outlines how the thermo-dynamic properties of seawater are evaluated using the standard adopted by the UNESCO-IOC at its 25th Assembly in June 2009. Describes how the ther-modynamic properties of seawater, ice and moist air are used in order to represent accurately the transport of heat in the ocean and the exchange of heat with the atmosphere and with ice. For background, see A World of Science, July 2009. Download: http://unesdoc.unesco.org/images/0018/001881/188170e.pdf
IN BRIEF
Diary
A W
orl
d o
f Sc
ien
ce is
a q
uar
terl
y n
ewsl
ette
r p
ub
lish
ed in
Ara
bic
, En
glis
h, F
ren
ch, R
uss
ian
(w
ww
.un
esco
.ru
) an
d S
pan
ish
by
the
Nat
ura
l Sci
ence
s Se
cto
r o
f th
e U
nit
ed N
atio
ns
Edu
cati
on
al, S
cien
tifi
c an
d C
ult
ura
l O
rgan
izat
ion
(U
NES
CO
), 1
, ru
e M
iolli
s, 7
5732
Par
is C
edex
15,
Fra
nce
. All
arti
cles
may
be
rep
rod
uce
d p
rovi
din
g t
hat
A W
orl
d o
f Sc
ien
ce, U
NES
CO
an
d t
he
auth
or
are
cred
ited
. IS
SN 1
815-
9583
Dir
ecto
r o
f Pu
blic
atio
n: G
retc
hen
Kal
on
ji; E
dit
or:
Su
san
Sch
nee
gan
s; L
ay-o
ut:
Yvo
nn
e M
ehl;
Prin
ted
in F
ran
ce b
y C
eler
. Th
is is
sue
was
pri
nte
d in
12
000
cop
ies.
R
egis
ter
for
free
e-s
ub
scri
pti
on
: y.m
ehl@
un
esco
.org
– F
ree
pri
nt
sub
scri
pti
on
fo
r lib
rari
es a
nd
inst
itu
tio
ns:
s.s
chn
eeg
ans@
un
esco
.org
, fax
: (33
1) 4
568
5827
. C
ove
r p
ho
to: I
n In
dia
, a b
oy
ho
lds
a B
lack
ber
ry t
o h
is m
oth
er’s
ear
. Ph
oto
: UN
ESC
O/P
anka
j Aro
ra
New Releases
CCiEl C
paraEdited
UNESCOand the Ca
Studies on SSpanish only,
A collection o
n
and n Latin
1–5 OctoberEuropean geoparks 9th conf. Municipal Theatre of Mytilene. Lesvos (Greece): [email protected] ; [email protected]
4–8 October 2010 Sandwatch Regional workshop on a combined approach to climate change adaptation and education for sustainable development (Phase I). Mahe (Seychelles): [email protected]; www.sandwatch.ca
11–13 OctoberEarth sciences and development of civilization in major river basinsIntl Conf. Luxor (Egypt): [email protected]; [email protected]
1–6 NovemberFrom Potential Conflict to Cooperation Potential UNESCO PCCP programme training
workshop for the Mekong River Basin countries. Covers negotiation processes, the principles of intl law and relevant treaties like the Mekong Agreement (1995). UNESCO-IHE Delft: www.unesco-ihe.org
4–5 November STI statistics and indicatorsCentral Asian regional consultation on collection and dissemination in transition econo-mies. Tashkent (Uzbekistan): [email protected]; [email protected]
6–9 NovemberSustainable Management of Marginal Drylands (SUMAMAD)8th intl project workshop. Bibliotheca Alexandrina (Egypt): [email protected]
8–10 novembreICTP after 45 (years): science and development for a changing world The future of basic science and its role in the developing world. ICTP Trieste (Italy): www.ictp.it
9–10 NovemberInterparliamentary STI Policies forum for MediterraneanOrganized by Division of Science Policy and Sustainable Development to mark World Science Day. UNESCO Paris: [email protected]
9–10 NovemberBiodiversityIntl symposium. Alexandria (Egypt): [email protected], [email protected]
9–13 November Iberoamerican Congress on Biosphere ReservesPuerto Morelos (Mexico): [email protected]
10 NovemberWorld Science Day for Peace and DevelopmentUNESCO co-ordinator: [email protected]
10 NovemberLaunch of UNESCO Science Report 2010Five authors will present the report’s findings. UNESCO Paris: [email protected]; www.unesco.org/science/psd/
10–11 NovemberChinese history of science and its interaction with other civilisationsIntl conf. UNESCO, CAST. Beijing (China): [email protected]; www.unesco.org/science/psd
26–29 NovemberInterparliamentary STI Policies forum for South AsiaOrganized by Division of Science Policy and Sustainable Development. New Delhi (India): [email protected]
6–8 DecemberTransboundary aquifersChallenges and new directions. Intl conference UNESCO Paris: www.isarm.net/conference2010