of in of - Geospatial Research...
30
_________________________________________________________________ Evidence of Persistent Exclusionary Effects of Land Use Policy within Historic and Projected Development Patterns in New Jersey: A Case Study of Monmouth and Somerset Counties __________________________ John Hasse, Ph.D., AICP John Reiser Alexander Pichacz Geospatial Research Laboratory June 2011 Rowan University
-
Upload
hoangkhanh -
Category
Documents
-
view
214 -
download
0
Transcript of of in of - Geospatial Research...

_________________________________________________________________
Evidence of Persistent Exclusionary Effects of Land Use Policy within Historic and Projected Development Patterns in New Jersey:
A Case Study of Monmouth and Somerset Counties
__________________________
John Hasse, Ph.D., AICP
John Reiser Alexander Pichacz
Geospatial Research Laboratory June 2011 Rowan University

Evidence of Persistent Exclusionary Effects of Land Use Policy within Historic and Projected Development Patterns in New Jersey: A Case Study of Monmouth and Somerset Counties
John Hasse, Ph.D., AICP John Reiser Alex Pichacz
Geospatial Research Laboratory Department of Geography & Environment
Rowan University 201 Mullica Hill Road Glassboro, NJ 08028 TEL: (856) 256‐4811 FAX: (856) 256‐4670
WEB: http://gis.rowan.edu
© 2011
Acknowledgements
Funding for this project was provided by the Fund for New Jersey via a research contract with the Fair Share Housing Center as well as a Rowan University non‐salary financial support grant. The conclusions and views expressed in the paper do not necessarily reflect those of the funding entities. The authors would like to acknowledge the New Jersey Department of Environmental Protection (NJDEP) for the Land Use Land Cover (LULC) data, as the primary data set analyzed in this report. Dynamic maps of New Jersey’s development patterns described within this report are available through the NJ Land Change Viewer web‐mapping application, available at http://gis.rowan.edu Finally, invaluable assistance for this report was provided by Rowan Department of Geography & Environment research assistants and staff including Anjelica Sinigaglio and Laura Ruthig.

3
Evidence of Persistent Exclusionary Effects of Land Use Policy within Historic and Projected
Development Patterns in New Jersey: A Case Study of Monmouth and Somerset Counties
Abstract This paper analyzes residential and non‐residential land use development patterns that have occurred over a two decade period and projects these patterns into the future through buildout modeling, in order to gain insight into the effects of New Jersey’s current land management policies and the persistence of exclusionary zoning influences. The research explores these patterns, first historically on a state‐wide basis, and then in a case study of two rapidly growing New Jersey counties, Monmouth and Somerset. The study evaluates recent land use trends using the New Jersey DEP Land Use/ Land Cover dataset, which provides a highly accurate inventory of land information spanning a time period for 1986 to 2007. The study then conducts a buildout analysis of future development trends based on existing zoning data for each case study county. The findings suggest that: A) New Jersey’s residential development has, contrary to the State Plan, followed a low‐density, sprawling pattern that reflects continued exclusionary zoning. B) Commercial and industrial land uses have been more consistent with the State Plan than residential, suggesting municipal zoning that welcomes retail and office development while discouraging high‐density residential development. C) Many higher density zones that do exist are identifiably Mt. Laurel zones within Smart Growth areas. This suggests that absent Mt. Laurel, residential development would be even less dense and less coordinated with the location of jobs than current patterns indicate. D) Going forward, the case study counties are over‐zoned for commercial and industrial development in terms of the number of jobs those areas may generate relative to the future housing that will be built under current zoning. It is argued that the findings in these recent and projected future land use patterns in the Garden State are evidence that exclusionary zoning effects still persist. The predominance of large lot residential subdivisions which current policy is producing is contrary to the objectives of the New Jersey State Development and Redevelopment Plan to foster a balanced mix of housing, sound land planning, conservation of natural resources and protection of the environment. By consuming practically all remaining residentially zoned land, large lot subdivisions are locking in a residential land use pattern that excludes many New Jersey households that cannot afford a large‐lot single‐family home the ability to live near their jobs.

4
Introduction
As the most densely populated state in the nation and adjacent to the first and fifth largest cities in North America, New Jersey has experienced major pressure for development since the early decades of the 20th century. The Garden State has struggled to employ a land management policy that balances the need for housing and commerce with the public obligation for protection of the environment and conservation of natural resources. By the 1970's it had become apparent that New Jersey's home rule land management system was resulting in some substantially problematic land development patterns that were failing in both their provisions for a balanced mix of housing and the conservation of natural resources. Swaths of rural lands were being consumed by scattered tracts of suburban development that were low density, poorly coordinated, auto‐dependent, and largely inaccessible to low and moderate income households. Such dispersed development patterns with all their inherent consequences have been described as "sprawl" in the literature (Peiser, 1989; Ewing, 1994; Ewing, 1997, Gordon and Richardson, 1997; Burchell and Shad, 1999; Galster et al, 2001; Hess, 2001; Hasse & Lathrop 2003, Hasse 2004). In 1970 Williams & Norman wrote a seminal analysis of how the locally administered zoning in New Jersey's home rule system was problematic in that it created development patterns that were exclusionary of low and moderate income households (Williams & Norman 1970). The discourse on exclusionary zoning progressed and in 1975 the first Mount Laurel New Jersey Supreme Court decisions recognized the responsibility of suburban communities to address and provide for regional housing needs for low and moderate income households. The 1983 Mount Laurel II decision reaffirmed the principles of the Mount Laurel I case and set in motion a number of legislative initiatives for addressing regional needs for housing and goals for regionally coordinated planning. In 1985 the Fair Housing Act was enacted, which created the Council on Affordable Housing (COAH). In 1986 Governor Kean signed into law the State Planning Act, which directed that the development of the State Development and Redevelopment Plan (State Plan) be prepared. The first preliminary State Plan was released by the State Planning Commission in 1988. The stated purpose of the State Plan was to:
Coordinate planning activities and establish Statewide planning objectives in the following areas: land use, housing, economic development, transportation, natural resource conservation, agriculture and farmland retention, recreation, urban and suburban redevelopment, historic preservation, public facilities and services, and intergovernmental coordination (N.J.S.A. 52:18A‐200(f)).
This paper analyzes whether there is evidence that exclusionary zoning practices are still at play. We attempt to answer this question through two main analyses: (1) the examination of residential and non‐residential development patterns that have occurred in the two decade period after COAH and the NJ State Plan have been in existence and (2) conducting a buildout analysis for Monmouth and Somerset Counties, two of the four counties that Williams and Norman used in their 1970's study. While there are many outcomes of COAH and the State Plan that can be (and have been) evaluated (Burchell et al 1992, Burchell et al 2000, Burchell & Dolfin 2009), this study focuses largely on past land use development patterns as guided by local zoning made evident in the physical composition of New Jersey's landscape and future likely development patterns based on current zoning.

Part I – St When COdevelopmmaps that2007). Thinto how 2007, 201categorie The analyresidentiadataset. R1.1). Comdeveloped(farmlandacres of hnew resid
This amouresidentiaresidentiaperiod thaestimatedincreasedduring theNew Jersedevelopm
tatewide Patt
AH & the Stament of a digitt represent oe dataset prothe Garden S10) utilized ths including im
ysis presentedal and commeResidential hommercial and d from 1986 td, forest, etc.)housing subdidential housin
Figureoccup
unt of residenal footprint. Yal developmeat the land usd 8.5 million, by 27%. In ee same two dey's populatioment neverthe
terns of Resid
te Plan were tal state‐widene of the moovides a highlyState has devee datasets to
mpacts to natu
d in this papeercial/industrousing represIndustrial lanto 2007, a tot) into residentvision built inng growth dev
e 1.1 Urban lanpies 2/3 of the
ntial acres devYet comparisont is not simpse data is avaor an increasessence, Newdecades of theon growth rateless increase
dential and N
developed ine land use mast detailed diy accurate aceloped over to provide a deural resource
r expands on rial land use psents roughlynd uses combtal of 227,198tial developmn only two developing ever
nd use in New Jdeveloped acr
veloped repron of the deveply driven by ilable, New Jee of 14%, wh
w Jersey’s reside study. The te slow even fed to an all‐tim
5
Non‐Resident
n the mid‐198ap. This mappgital land maccounting of Nhe past severetailed landsces such as farm
these previopatterns havey two‐thirds oined occupy 18 acres went fment. The shecades is remary day, statew
Jersey as of 20es in the state.
esents a 26.8elopment ratincreased poersey went frereas the incdential land glatest five yefurther whileme high (Hass
tial Growth, 1
80's the New Jping initiativeapping databaNew Jersey’s ral decades. cape analysis mland and fo
ous reports bye changed witof the develop11% of develfrom an openeer magnitudarkable, equawide, through
007. Residentia.
8% increase toes with popupulation. Durrom an estimacrease in acregrew nearly twar period of te the rate of ase and Lathro
1986‐2007
Jersey DEP ale has evolvedases in the nastate of land Hasse and Lalooking at allrest land loss
y focusing on thin the time ped land in Noped lands. On space land cde of over a qating to 22.4 fhout the 21 ye
al land
o the state's plation growthring the 1986ated 7.5 millies of residentiwice as fast athe study (20acres of resideop 2010).
lso began into a series ation (NJ DEP,use and a wiathrop (2001, land use s.
how the Statperiod of theew Jersey (figOf the gross lacategory uarter millionfootball fieldsear period.
pre‐1986 h indicates th6 to 2007 timeon residents ial developmeas population02‐2007) sawential
of , ndow
te's e gure and
n s of
hat e to an ent w

Evaluatin The NJ DEof develosubcategodevelopmcontain fivdensity/mclassificatGenerallydensity” c
Land Use Label – “HDensity ‐ Lot Size ‐
Land Use Label – “LDensity ‐ Lot Size – Figure 1.2 digital Lan
4 The fifthwhich cornumber, t
g the Pattern
EP Land Use/Lpment of resories of land ument, e.g., resve subclasses
multi family (stion scheme fy, the lowest ccategory; all o
Code ‐ 1110 High density oMore than 5 0.2 acres and
Code ‐ 1130Low density –1‐2 units per
– greater than
– residential cad Use / Land C
h category, 11rresponds to 0this category
n of Resident
Land Cover daidential acreauses being buidential and cs (figure 1.2) tmaller than 1follows a modcost form of cother categor
or multifamilyunits per acrd smaller
0 – single unit” acre
n 0.5 acres to
ategories as deCover dataset.
150 (mixed re0.3% of the tois excluded f
ial Densities
ata allows forage being fastuilt, not just dcommercial. Wthat decrease1/5 acre per lodified Andersoconstruction, ries reflect sin
y” e
1 acre
elineated by th
esidential), reotal residentirom this repo
6
r a more detater than popudeveloped vs.Within the gee in density (iot) to rural loon land use capartments angle‐family ho
Land UsLabel –DensityLot Size
Land UsLabel –DensityLot Size
he New Jersey D
presents onlyial land in Newort’s tables.
ailed examinaulation growt undevelopedeneral catego.e., increase iow density (locoding systemand townhomomes.
se Code ‐ 112– “Medium dey ‐ 2‐5 units pe ‐ greater th
se Code ‐ 114– “Rural – singy –less than 1e – greater th
Department of
y slightly morw Jersey. Sin
ation of the reth. The data cd but also typory of residentin lot size) froots greater tham (Anderson emes, are only
20 ensity – singleper acre han 0.2 acres
40 gle unit” 1 unite per achan 1 acre lots
f Environmenta
re than 688 acnce this is suc
easons for thecontain pe of tial the data om high an 1 acre).4 Tet al, 1976). found in the
e unit”
to 0.5 acres
re s
al Protection’s
cres statewidh an insignific
e rate
The
“high
de, cant

By compasignificantresidentiadensity wother han32% of neunits, in csubstantiasimilar incnumerousover the lneverthelstate.
5 Since largdevelopedwithin the ways of ancombined 2002) but tcategories
aring the residt shift can beal.5 Pre‐1986 while 43% wernd, exhibits suewly developeontrast, occual drop in lancrease in lands mechanismast two decaess, large‐lot
Figure 1.3 Reand medium
ger lots require and units devdataset and is
nalyzing the rellow‐density rethey only housconsumed 34%
dential growtidentified of residential lare dedicated tubstantial shred acres of reupied 67% of td dedicated td was dedicats implementedes, two third land consum
esidential devedensity reside
e more land foeloped. Whiles highly accuratationship betwesidential categsed 24% of the% of the land,
15%
Perc
Pre '8
h patterns pracres of landand use patteto low and rurinkage of lanesidential unitthe acres devto medium reted to large‐loed in New Jerds of the acremptive units th
lopment experntial pattern p
r each unit deve the number ote, the numbeween the two. gories occupiede population grbut housed 76
43%
10%
2
cent of ABy Resi
86 Developme
7
re‐1986 to thed dedicated frerns dedicatedral density und dedicated tts were placeveloped for hoesidential denot rural densitrsey to encoues developed hat have encr
rienced a markpre‐1986 (blue)
veloped, one mof acres of eachr of units is notHasse and Lathd over 66% of rowth. Conver6% of the popu
19%22%
2
Acres Dedential
ent '86‐
e 1986‐2007 rom high dend 58% of the nits. The 1986to high and med in this cateousing. This nsity units (1/ty (greater thurage more efinto residentroached on ru
ked shift from a) to predomina
must bear in mh category of rt distinguishedhrop (2007), fothe land consursely, the two culation growth.
24%1%
4
evelopedType
‐'07 Developm
study period sity residentiland acres to6 to 2007 stumedium densiegory. Low anmajor shift w/5 to 1/2 acrehan 1 acre lotfficient comptial housing wural landscap
a predominantantly low and r
mind the distincresidential dend, though thereor example, foumed for houscombined high.
46%
d
ment
(figure 1.3), ial to low deno high and medy period, onity housing. Ond rural densiwas due to thee lots) while a ts). In spite ofact developmwere, pes throughou
tly high rural
ction between nsity is containee may be otheund that the twing during T2 (her‐density
a nsity edium n the Only ty e f ment
ut the
acres ed r wo (1995‐

Residenti
Breaking dNew Jerseprovides adevelopmAdvocacyhas deline(Figure 1.4zones of tMeadowlplans in wchanneled(indicatedwhich devprotection Under theGrowth aprinciplesclustered choice anneighborhPlanning AresidentiaGrowth amanner thenvironmresources“open sparesource Planning A The SmartState PlanCenters (ethe PinelaRegional GVillages. Areas arecenters wAreas onlyPreservat Summarizthe Smarttwo majo
density patte
al Patterns b
down the distey Smart Growan additional ment patterns (formerly theeated a “Sma4) that consisthe NJ State Pands and Higwhich developd. The “Not Sd by yellow invelopment is n of the natu
e State Plan, rreas should ss such as: “micommunity dd opportunityhoods” amonAdvocacy, 20al growth in Nreas should ohat protects tent, conserves, and is coordace, farmlandpreservation”Advocacy 201
t Growth arenning Areas 1excluding critands, the SmaGrowth areasIn the Highlanalso State Pla
within Highlany; all land in Hion Areas is e
zing residentit Growth mapr findings. Th
ern for growth
by Smart Grow
tribution of rwth and Non‐angle on und. The NJ Office Office of Smrt Growth Arest of the comPlan, Pinelandhlands managpment is intenSmart Growth the map) arediscouraged ral resources
residential grtrive to exemxed land usesdesign; rangey; walkable g others (Off11). In contraNon‐Smart occur in a the es natural dinated with d, and scenic ” (Office of 11).
as in the map & 2 and Desical environmart Growth ars and Pinelannds, the Smaran Areas 1 & ds Planning Highlands excluded.
al growth by p results in he first findin
that occurred f
wth Planning
esidential de‐Smart Growtderstanding ce of Planningmart Growth) eas” map bined growthds, gement nded to be h areas” e zones in and is the priority
owth in Smarmplify smart gs; compact, of housing
ice of ast,
p portray ignated mental sites). reas are the ds Towns andrt Growth 2 and
g is
Figure Smart G
8
from 1986 to 2
g Areas
nsities by th areas
g
h
y.
rt rowth
In
d
1.4 Urban GroGrowth and No
2007 (red).
owth in relationon‐Smart Grow
n to the New Jewth areas
ersey’s

9
that during the 1986 to 2007 study period, more acres of residential growth actually occurred within Not Smart Growth areas than occurred within Smart Growth areas. The second major finding is the magnitude of large lot zoning not only throughout the Not Smart Growth areas but also occupying a significant amount of the Smart Growth areas, contrary to the objectives of State Plan. During the 21 years of the study, roughly 227,000 acres of residential growth occurred within the state. Looking only at residential development, 48% of the residential growth in terms of acres developed occurred in a Smart Growth area while 52% of acres of residential development occurred outside of the designated Smart Growth areas. In other words, more acres of land were developed for residential housing in Not Smart Growth areas than within Smart Growth designated areas. Once again, we must clarify that these data reflect acres developed, not units developed. Nonetheless, the fact that more acres of residential growth occurred outside the state's designated Smart Growth areas than within them speaks to the limited effectiveness that the State Plan has had on guiding development toward the most appropriate areas to accommodate growth and for conserving land in the Not Smart Growth areas. Displaying the amount of land developed for each residential category by the Smart Growth / Not Smart Growth planning areas reveals a number of patterns of interest. Within the Not Smart Growth areas (table 1.1), 92% of the residential development was low and rural density large lot development. If this represented a small proportion of the total land developed, large lots in rural areas would seem to be appropriate under the State Plan and probably not reflect significantly on affordable housing. But the extraordinary amount of land being consumed by large lot subdivisions and relatively small amount developed as medium or high density residential in the Not Smart Growth areas is effectively resulting in the Not Smart Growth areas of the State Plan becoming exclusive bedroom enclave communities for those who can afford large lot units. Table 1.1 Acres of residential growth 1986 – 2007 by Smart Growth / Not Smart Growth planning areas
Acres Developed in Smart Growth Areas
Percent of Acres Developed in Smart Growth Areas
Acres Developed in Not Smart Growth Areas
Percent of Acres Developed in Not Smart Growth Areas
1110 ‐ HIGH DENSITY Growth '86‐'07
19,381
18%
3,454 3%
1120 ‐ MEDIUM DENSITY Growth '86‐'07
44,575
41%
6,330 5%
1130 ‐ LOW DENSITY Growth '86‐'07
27,487
25%
20,224 17%
1140 ‐ RURAL Growth '86‐'07
16,212
15%
88,908 75%
Total Residential growth
107,779
100%
118,923 100%
Furthermore, the State Plan calls for growth that does occur in the Not Smart Growth areas to be consistent with Smart Growth principles (i.e. centers‐based in clusters or existing towns) so that the environs can be maintained to conserve natural resources. But only 8% of the 1986‐2007 residential growth that occurred in Not Smart Growth areas was medium or high density while 92% (over 109,000

10
acres) was low density residential that consumed formerly open lands. It should be noted that the contrast in residential densities between Not Smart Growth and Smart Growth reflects the fact that many of the Smart Growth planning areas have sewer. Therefore, these areas have the capacity to host higher density housing; much of the Not Smart Growth areas are not sewered. Nonetheless, the significant quantities of land being developed by large lot residential units in the Not Smart Growth areas does not bode well for providing a balanced mix of housing nor the conservation of natural resources. The pattern of 1986 to 2007 residential growth that occurred within the Smart Growth zones is equally interesting. The largest category of residential in terms of acres developed was 1120 – Medium Density (lots between 1/5 and 1/2 acres) which occupied 41%. High Density occupied 18%, while Low and Rural Density occupied 25% and 15%, respectively, of residential acres developed within the Smart Growth zones. While the distribution of land allotted to each residential category is more balanced than in the Not Smart Growth zones, it is difficult to argue that 40% of the land developed in lots greater than 1/2 acre within Smart Growth zones provides a balanced mix of land to accommodate the need for affordable units. Much as in the Not Smart Growth zones, significant areas of the Smart Growth zones are being developed as enclaves for those who can afford large lot units, a result arguably contrary to the State Plan and basic concerns of exclusionary zoning.
Overall, the pattern of residential development, when broken down by Smart Growth and Not Smart Growth zones, provides insight into the implications for affordable housing. The smallest lot size development has occurred within Smart Growth zones whereas lands developed outside of the smart growth zones are largely occupied by large lot, low density housing. Using lot size as an indicator of affordability, smaller lot size development at least provides the potential of homes affordable to a wide range of New Jersey residents, while in almost all parts of the state, large lot, low density housing is only affordable to a small part of the population. If New Jersey had an infinite amount of land and no zoning constraints, it would be reasonable to argue that the mix of housing being developed over the past two decades simply reflects the market for houses on larger lots and that smaller lots could always be available should the market demand them. However, New Jersey’s vacant land available for new development is rapidly depleting in large portions of the state; the building pattern that is currently imposed will create a land use pattern locked into place for decades, if not centuries, to come. Furthermore, it is not necessarily the case that those who can afford to buy these houses necessarily want housing on larger lots; they may have few, if any other, alternatives to large‐lot homes if they wish to live in a certain municipality, based on municipal zoning policies that only allow large‐lot homes to be built. In any event, if 2/3 of the land base in New Jersey’s future built‐out landscape is dedicated to large lot residential units, it is hard to argue that such a land use pattern will not be locking exclusionary housing patterns into place on scales of decades to centuries.

11
Commercial and Industrial Patterns
In addition to residential land uses, the NJ Land Use/Land Cover dataset also has several categories that can provide insight into how and where land devoted to industry and commerce (i.e., jobs) has been developed. Table 1.2 portrays the proportion of land area devoted to the two main land use categories that have employment implications: 1200 Commercial/Services and 1300 – Industrial.6 We examine two trends. First we look at the proportion of these land use categories compared to other land uses pre and post 1986. By 1986 these land uses combined occupied 174,191 acres, which at the time represented 14% of all of New Jersey’s developed land. During the 1986 to 2007 study period, commercial and industrial land uses combined added 36,558 acres of newly developed land (a growth of 21% in land area) for a total of 210,749 acres. But since residential grew even more rapidly during this time period, commercial/industrial land uses shrank as a total proportion of all land uses to 11% by 2007 (see figure 1.1). Bear in mind that population increased by a modest 14% during this time. So, in essence, the growth (in acres) devoted to commercial/industrial land use increased about 50% faster than population growth, whereas residential development increased about 100% faster than population growth.
Table 1.2 Acres of commercial and industrial land use pre 1986 and 1986 – 2007 growth by Smart Growth Planning Areas
1200 ‐ COMMERCIAL/
SERVICES
1300 INDUSTRIAL
Pre‐1986 Total Urban Acres
110,288 63,525
Pre‐1986 % of Total Urban
9.0% 5.2%
1986‐2007 Acres of Urban Growth
22,900 13,437
1986‐2007 % of Total Acres Urban Growth
6.5% 3.8%
1986‐2007 Acres Growth in Smart Growth
18,122 10,646
1986‐2007 % Growth in Smart Growth
79% 80%
Looking at the distribution of growth of industrial/commercial land use broken out by the Smart Growth / Not Smart Growth map, we can see that approximately 80% of these land uses were developed within
6 A third category, LU code 1500 ‐ INDUSTRIAL/COMMERCIAL COMPLEXES, comprises less than one‐tenth of one percent of the state’s land area, or a total of 599 acres, and as such is omitted from the charts in this analysis, though the very limited data in that category show a similar pattern.

12
Smart Growth zones. Therefore, land uses related to jobs have been successfully built within areas of the State Plan designated for growth. This contrasts with the residential land distributions, which had a majority of acres developed occur in the Not Smart Growth zones as explained above.
This divergence has important implications for the State Plan’s basic policy objectives. The State Plan envisions channeling most development — both residential and non‐residential – into Smart Growth areas, with those uses in close proximity to one another. Instead, New Jersey’s last two decades of development has succeeded in placing most of the acres of non‐residential development into Smart Growth Areas — but has left the majority of residential acres developed outside of those areas. Even the residential development within Smart Growth Areas is disproportionately low‐density development. As such, the Smart Growth Areas contain the state’s job centers and growth as indicated by commercial and industrial land use— but also a significant amount of large lot, low density units that most workers cannot afford. These patterns help explain NJ claiming the third highest commute to work (Census 2011) in spite of it being such a small state in territory.
Part II ‐ A
Existing Z
Counties
The statewexplored provide a recent dethese pattpaper loopatterns fgain insigoccur undare Monmcounties edevelopmMonmoutacres beinto be devAdditionathe four cNorman spublishedthe majorexplore fithe implic
Past Resid
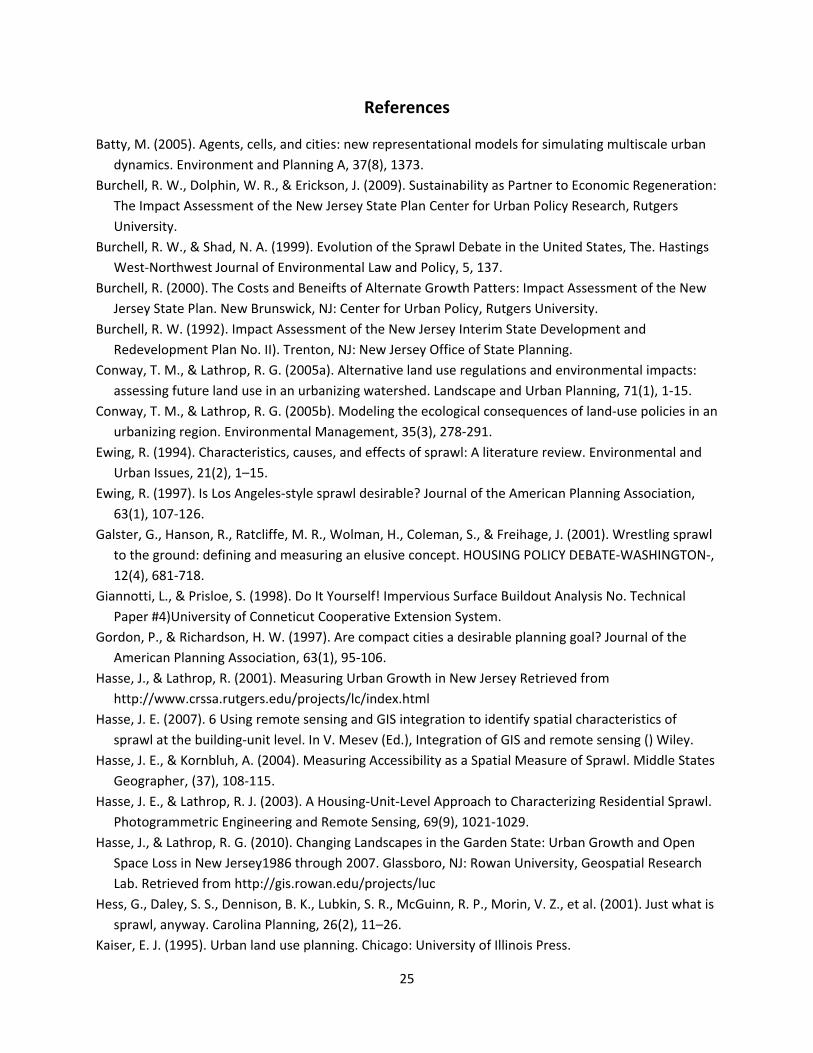
Figure 2.2counties wreveals is demonstrtwo decadand high dresidentiacolored d
7 Ocean anthan Some
A Case Study
Zoning for M
s
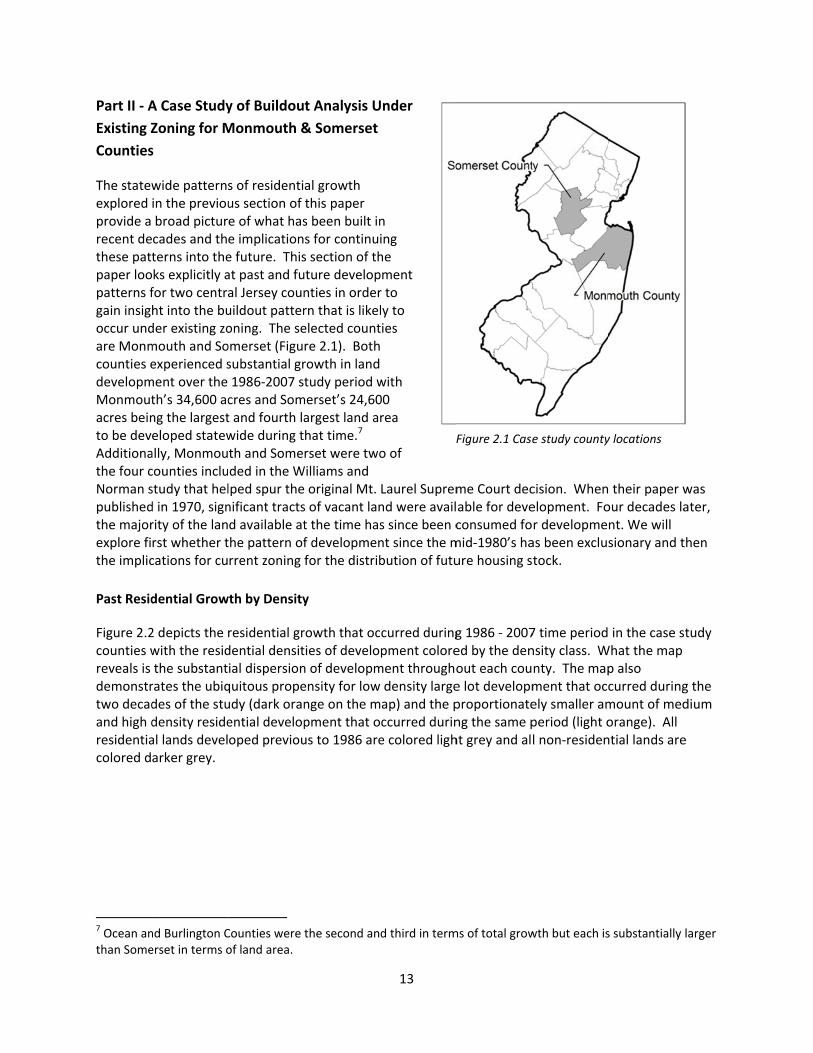
wide patternsin the previoubroad picturcades and thterns into theks explicitly afor two centraht into the buder existing zomouth and Soexperienced sment over the th’s 34,600 acng the largesteloped statewally, Monmoucounties inclustudy that held in 1970, signrity of the lanrst whether tcations for cu
dential Grow
2 depicts the with the residthe substantrates the ubiqdes of the studensity resideal lands develarker grey.
nd Burlington Cerset in terms o
y of Buildou
Monmouth &
s of residentius section of e of what hase implicatione future. Thisat past and fual Jersey counuildout patteroning. The seomerset (Figusubstantial gr1986‐2007 scres and Somt and fourth lawide during tth and Someded in the Wlped spur thenificant tractsd available atthe pattern ofrrent zoning
wth by Density
residential grdential densitial dispersionquitous propeudy (dark oranential developoped previou
Counties were of land area.
t Analysis U
& Somerset
al growth this paper s been built ins for continuis section of thuture developnties in orderrn that is likelelected countre 2.1). Bothrowth in landtudy period w
merset’s 24,60argest land ahat time.7 rset were two
Williams and original Mt. s of vacant lant the time hasf developmenfor the distrib
y
rowth that octies of develon of developmensity for lownge on the mpment that ous to 1986 are
the second an
13
Under
n ing he pment r to ly to ties with 00 rea
o of
Laurel Supremnd were avails since been cnt since the mbution of futu
curred duringpment colorement througho density largeap) and the pccurred durine colored ligh
d third in term
F
me Court decable for deveconsumed fomid‐1980’s haure housing s
g 1986 ‐ 2007ed by the denout each coue lot developmproportionateng the same pht grey and al
ms of total grow
Figure 2.1 Case
cision. Whenelopment. For developmeas been exclutock.
7 time periodnsity class. Wnty. The mapment that occely smaller amperiod (light ol non‐residen
wth but each is
e study county
their paper wour decades lant. We will sionary and t
in the case sWhat the map p also curred duringmount of medorange). All ntial lands are
s substantially
y locations
was ater,
then
tudy
g the dium
e
larger

F
y
t
d
1
Figure 2.2 Resi
years 1986 and
these counties
developed sma
1986 is colored
idential growth
d 2007. Rough
was dedicate
aller than ½ ac
d light grey in t
h by density cla
hly 72% of the l
to low density
re are depicted
the map and no
14
ass for Monmo
land developed
(dark orange c
d in lighter ora
on‐residential
outh and Some
d for residentia
color) lots of ½
ange. Resident
lands are colo
erset Counties b
al developmen
½ acre or larger
tial land develo
red dark grey.
between the
t in each of
r. Lots
oped before

Consideri
area, the
their deve
state’s pe
developed
are good
behind in
examining
Past Resid
Breaking o
can get an
counties s
within the
Growth A
its residen
trend in T
Growth a
ng that Monm
fact that they
elopment traj
ending buildo
d high to low
representatio
their buildou
g buildout un
Figure 2.3 S
and Low De
indicator co
affordable h
dential and N
out residentia
n idea of the
saw 18% of re
e Smart Grow
Areas (see tab
ntial growth (
Table 1.1, saw
reas.
10% 1
High
mouth and So
y are the 1st a
jectory signifi
ut. They also
density hous
onal counties
ut trajectories
der existing z
Somerset and M
ensity housing d
ounties for exam
housing.
Non‐Resident
al density clas
degree to wh
esidential lan
wth zones. Th
le 1.1). Howe
(60%) in Smar
w the majority
12%9%
Density
19De
N
omerset are t
and 4th fastest
icant in terms
o each have a
sing compare
for suggestin
s. As such, th
zoning and th
Monmouth Cou
development a
mining the imp
tial Growth by
sses by Smart
hich residentia
d developme
his is similar to
ever, the cou
rt Growth are
y of its residen
22%
15%19%
Medium Dens
986‐2007 Aevelopmen
New Jersey
15
he 6th and 13
t growth coun
s of these cou
similar profil
d to the state
ng trends that
hey make for
he implication
unties had simi
as the state as
plications of bu
y Smart Grow
t Growth and
al density ref
ent during the
o the statewi
nties differ in
eas while Som
ntial land dev
21% 2%
ity Low D
Acres of Rent By Dens
Somerset
3th largest cou
nties in terms
unties being e
le in terms of
e as a whole (
t are likely to
interesting ca
ns for the affo
ilar proportion
a whole makin
uildout under e
wth / Not‐Sm
d Not Smart G
flected the go
e study dedica
de value for h
n that Monmo
merset, more
velopment (5
23%20%
Density
esidentialsity Class
Monmouth
unties respect
s of acres dev
early represe
f the proporti
(Figure 2.3), m
o follow in cou
ase‐study cou
ordability of h
ns of High, Med
ng them good
existing zoning
mart Growth
Growth areas,
oals of the Sta
ated to high d
high density w
outh had sub
consistent w
3%) occur in
46%50% 52%
Rural Density
tively in total
veloped make
ntatives of th
on of recentl
meaning that
unties further
unties for
housing.
dium
g on
, (Table 2.1) w
ate Plan. Bot
density housi
within Smart
bstantially mo
with the statew
its Not Smart
%
y
land
es
he
y
they
r
we
h
ng
ore of
wide
t

16
Table 2.1 Residential Development by Smart Growth and Not Smart Growth Areas within Monmouth and Somerset Counties.
Monmouth
Smart Growth
MonmouthNot‐Smart Growth
Somerset Smart Growth
Somerset Not‐Smart Growth
1110‐HIGHDENSITY‐AcresGrowth'86‐'95‐%ofgrowthinzone'86‐'95
1,907 18%
216 3%
2,232 18%
185 1%
1120‐MEDIUMDENSITY‐AcresGrowth'86‐'95‐%ofgrowthinzone'86‐'95
2,608 24%
139 2%
4,368 35%
654 5%
1130‐LOWDENSITY‐AcresGrowth'86‐'95‐%ofgrowthinzone'86‐'95
3,537 33%
628 9%
3,607 29%
1,709 12%
1140‐RURAL‐AcresGrowth'86‐'95‐%ofgrowthinzone'86‐'95
2,769 26%
6,161 86%
2,169 18%
11,441 82%
TotalResidentialgrowthinzone
10,821 7,144 12,376 13,989
%oftotalresidentialincounty
60% 40% 47% 53%
Looking at commercial and industrial land developed between 1986 and 2007 by Smart Growth and Not
Smart Growth planning areas (Table 2.2) one can see a significantly better alignment of non‐residential
developed acres with the State Plan compared with residential acres developed, consistent with the
statewide pattern described in Table 1.2. Somerset had 86% of the acres of commercial and industrial
growth during the 1986 to 2007 period occur within a Smart Growth zone. This contrasted with only
60% of the residential acres of growth. In Monmouth, 78% of commercial/industrial acres developed
occurred within a Smart Growth zone and only 47% of residential acres developed occurred within a
Smart Growth zone.
Table 2.2 commercial and industrial acres developed from 1986 to 2007 within Smart Growth and Not Smart Growth zones.
SomersetSmart Growth
SomersetNot Smart Growth
MonmouthSmart Growth
Monmouth Not Smart Growth
LU 1200 Commercial
1,334 228 1,962 374
1300 Industrial
529 65 308 269
Total 1,863 293 2,270 642
pct total 86% 14% 78% 22%
The implications are thus: commercial/industrial land development in these counties has aligned fairly
well with the State Plan, but residential development has not aligned as well, meaning that housing is
not aligning well with jobs as envisioned in the State Plan.

17
Projecting Future Land Use Patterns under Current Zoning
The previous section looked backwards at land use patterns. We next examine potential future land use patterns that will result under current zoning policy. Geographic Information System (GIS) modeling of land use change is a useful tool for projecting the long‐term consequences of land management policy. Buildout analysis, also known as “cumulative impact assessment” (Kaiser, et al., 1995), projects land development potential to its maximum under current zoning and other land use regulation policies (Lacy 1992). Buildout analyses have generally been of interest to stakeholders dealing in issues of water quality and land planning. Thus, buildout analysis is often conducted at the watershed scale (Giannotti and Prisloe, 1998; Prisloe and Giannotti, 2000; Conway and Lathrop, 2005a and b). Additionally, it is a tool that has been embraced on a municipal level for projecting planning policy scenarios on a variety of economic and environmental variables (Kilpatrick and Wyckoff, 2002; Pfister et al., 2007). Various approaches to buildout analysis have been employed in New Jersey. For example, Conway and Lathrop (2005a and b) conducted buildout modeling in the Barnegat Bay watershed. The development of the Highlands Management Plan employed a comprehensive buildout analysis (NJ Highlands Council, 2008). Currently all New Jersey counties are conducting buildout studies for wastewater management analysis and planning through the Division of Watershed Management and Office of Planning & Sustainable Communities (http://www.nj.gov/dep/opsc/). While there are many approaches and different factors that can be incorporated into a buildout analysis, the complexity and detail that is possible can make an analysis become quite costly and require months to years to properly complete.8 Since our analysis was conducted with a streamlined budget and our interest is for a basic examination of the implication for land use patterns related to zoning policy and not for projecting water quality impacts or water capacity issues, we thus take a more straight forward approach primarily using base zoning density rather than add the complexities of sewer capacity or septic suitability, etc. The net effect is that our buildout projections present a maximum possible units scenario, which is likely an overestimate of what will actually be built under current zoning due to other constraints not included in our model.
Monmouth County – Case Study #1
Monmouth County is one of the most southern suburban counties in the greater New York City metropolitan area. As of 2010, Monmouth had a population of 630,380, an increase of 36% over the last four decades from its 1970 population of 461,849. As of 2007, which is the latest year for available land use data, Monmouth had a total of 145,376 acres of land urbanized, and 100,637 of those acres were residential. Projecting future buildout of Monmouth County entailed creating a numeric model that incorporated countywide zoning tables provided by Monmouth County and estimations of available vacant lands within each zone from the 2007 DEP Land Use/Land Cover data. The available lands map was generated by removing both developed land and known restricted areas, including wetlands and water bodies buffered to 50 feet, category 1 streams buffered to 300 feet, steep slopes greater than 15%, and preserved public and private lands, including farmland preservation and Green Acres acquisitions. By
8 New Jersey’s county‐level water quality buildout studies have been underway for several years and at the writing of this article, only a few have been completed.

18
overlaying the available lands map with zoning demarcation one can then multiply zoning densities to generate buildout potentials. Monmouth County benefits from having a county‐wide composite zoning map that combines all underlying municipal zoning into a unified zoning schema. The composite zoning map has a total of 25 different zones, each with a generalized description of use and zoning density. Details of the Monmouth mathematical model are provided in appendix B.
Monmouth Results
The residential component of this buildout analysis (Table 2.3) shows that the county’s current zoning allows 33,177 potential new housing units throughout the county. This total was broken into the four density ranges used in the DEP Land Use/Land Cover analysis, high, medium, low, and rural. The lowest density category, rural, is less than 1 unit per acre and has 12,993 potential new units. The low density category is between 1 and 2 units per acre has 2,222 potential new units. Medium density, between 2 and 5 units per acre, has 6,891 potential new units. The high density category is greater than 5 units per acre (what is necessary for apartment, townhouse, or smaller‐lot single family development) and has 11,071 potential new units.
Table 2.3 Monmouth County Residential Buildout Results
Zone Density Remaining Developable Land (acres)
Potential Units (# of homes)
High 1,022 2.7%
11,071 33.4%
Medium 2,936 7.8%
6,891 20.8%
Low 1,920 5.1%
2,222 6.7%
Rural 31,583 84.3%
12,993 39.2%
Under 3 percent of remaining residentially zoned land in the county is zoned for high density ‐ the only zone that can accommodate apartment or townhouse development, the lowest cost types of development. Additionally, over 80 percent of remaining residentially zoned land is zoned for fewer than one home per acre. Our analysis further explored the areas of high density zoning in which many high density units have been built or yet could be. A fair number of those zones within Monmouth County are zones that exist in order to fulfill Mt. Laurel requirements. For example, the largest single area of developable units of any kind exists in a single zone in Manalapan Township designated MF‐15 (multi‐family) by the county. A potential total of 2,454 homes (over one out of every five high‐density homes in the entire county) could be built at the median zone density of 19.55 units per acre on 157 acres of available land. This zone is designated to fulfill a portion of Manalapan Township’s Mt. Laurel obligation (http://www.nj.gov/dca/affiliates/coah/reports/compliance/1326.pdf). Similarly, areas of higher density along the Route 79 corridor in Marlboro reflect a development known as the Bluh and Batelli site which was rezoned according to Marlboro Township’s Mt. Laurel plan (http://www.nj.gov/dca/affiliates/coah/reports/petitions/1328r.pdf).

19
The commercial analysis was conducted using a similar approach to the residential analysis, by multiplying vacant, unrestricted land by the densities permitted by zoning. The model calculates that current commercial zoning contains 8,122 acres of available land, which allows for the county to add 121,517,596 square feet of commercial and industrial floor space. By using the floor area to jobs multiplier variables developed by COAH which range from 333 square feet to 1,000 square feet per job depending on the nature of the activity, this equates to the zoning accommodation of an additional 223,450 jobs.
Table 2.4 Monmouth County County‐Wide Buildout Results
Category Total number
Homes 33,177
Jobs 223,450
Jobs:Housing Ratio 6.74:1
A general rule of thumb in the planning literature suggests a jobs to housing units ratio of 1.5 to 1 with a range anywhere 1.3:1 to 1.7:1 (Weitz, 2003). Monmouth County zoning has the potential to create enough commercial and industrial floor area for 223,450 jobs with a maximum housing buildout of 33,177 housing units, a ratio of 6.74:1. This ratio of nearly 7 jobs for every new home suggests that the zoning of commercial/industrial land is not balanced with the zoning of residential lands in Monmouth County. If we look again to tables 2.1 and 2.2 showing the mismatch between housing and jobs of 1986 to 2007 development we can surmise that this pattern is, to a significant degree, related to zoning, given that current zoning shows similar patterns of allowing far more jobs than homes even within areas designated for growth. Current zoning is poised to continue that poor alignment of housing to jobs until buildout is reached in the coming decades (at which time that mismatch becomes locked in place).

20
Somerset County ‐ Case Study #2
Somerset County is a suburban county located on the southwestern corner of the greater New York City metropolitan area. As of the 2010 census, Somerset County had a population of 323,444; it has grown from a population of 198,372 in 1970, an increase of 63% over four decades. As of 2007 (the latest year for available land use data), Somerset had a total of 81,423 acres of land urbanized, and 59,633 acres of that were residential. The same buildout model used for Monmouth County could not be applied to Somerset since that county does not have a composite countywide zoning schema. We instead examined municipal zoning ordinances for every municipality in the county, which are kept on file at the County Department of Planning. Due to complications such as overlay zones, conditional uses or zones without clearly accessible density data, roughly one third of the zones did not have a single clearly definable zoning density value that could be used for a base in the model. This forced us to modify our modeling approach for the zones in question by using the 2007 New Jersey Land Use/ Land Cover data from NJDEP as a proxy to determine the residential densities that were previously developed within the zones in which the data was indefinable or missing. This approach assumes that the historical density of housing determined by NJDEP is consistent with the zoning for those areas. A detailed description of the buildout model for Somerset County is included in Appendix C.
Somerset Results
The residential component of this buildout analysis (Table 2.4) shows that Somerset County’s current zoning holds the potential for 14,802 new housing units countywide. Over 25,000 acres (86% of available land for residential) are zoned for Rural Density (less than 1 unit per acre) with a potential for 7,183 new units as projected by the model. The Low Density category is between 1 and 2 units per acre and there is 2,715 acres of land zoned for this density with a buildout of 2,871 potential new units. Medium density, between 2 and 5 units per acre, has 2,671 potential new units. The high density category is greater than 5 units per acre and has 2,077potential new units. It’s revealing to note that there is only 4% of available land zoned for the Medium Density and High Density types of land use combined, with 96% in the Rural Density and Low Density categories.
Table 2.5 Somerset County Residential Buildout Results
Zone Density Remaining Developable Land (acres)
Potential Units (# of homes)
High 278 1%
2,077 14%
Medium 950 3%
2,671 18%
Low 2,715 9%
2,871 19%
Rural 25,249 87%
7,183 49%

21
Like Monmouth, Somerset has zoned for a future residential pattern that is heavily skewed toward large lot residential development with large swaths of the available vacant land remaining zoned for residential lot sizes greater than one acre per home. This contrasts with less than one percent of developable residentially zoned land at densities where townhouses and apartments are possible.
An investigation of Somerset County’s high density zones again demonstrates the positive effect that Mt. Laurel has had in that county for providing high‐density, small lot options both in the past and the future. In Franklin Township, the Laduree, Springhill, and Society Hill at Franklin sites, all higher‐density areas identified in our analysis, are zoned that way consistent with the Township's Fair Share Plan (http://www.nj.gov/dca/affiliates/coah/reports/compliance/1808.pdf). The single area with high density zoning in Montgomery Township is a Mt. Laurel site, the “Tapestry II” inclusionary development (http://www.montgomery.nj.us/depts/landuse/FairShareAmendmentNov11_%202010.pdf). The Hills ‐ probably the county’s largest Mt. Laurel development ‐ is located in Bernards and Bedminster Township and shows up in our mapping as a significant high‐density zone, surrounded by lower‐density development. These and other Mt. Laurel zones have contributed a significant amount of the capacity for high density residential that already exists as well as for what can be built in the future under current zoning. Absent these zones, the land use pattern would have almost certainly been more dispersed, low density and as such, even more exclusionary than it is today. The commercial/industrial buildout model for Somerset County was modified in a similar manner as the residential model by multiplying vacant, unrestricted land by the densities permitted by zoning. Within each zone, the previous development within the zones was used to calibrate the projection of future development trajectories for generating buildout calculations. In these areas, the proportion of commercial and industrial land uses was projected forward to occur at the same proportion as urbanization occurred within the zone from 1986 to 2007 (See Appendix C for details of methodology). The analysis resulted in a total projected commercial/industrial floor area of 124,058,880 square feet. Normalizing the square footage by COAH floor area to jobs ratios, results in a total of 248,118 new jobs.
Table 2.6 Somerset County County‐Wide Buildout Results
Category Total number
Homes 14,802
Jobs 248,118
Jobs:Housing Ratio 16.7:1
The model projects that Somerset’s zoning has the capacity to provide housing for 14,802 new residential units while at the same time it has the capacity for nearly a quarter million jobs as indicated by zoned commercial/industrial floor area. This makes the number of jobs allowed under Somerset’s zoning more than 10 times that of the number of residents allowed, significantly out of proportion to the accepted jobs to housing ratio of 1.5:1 mentioned earlier. Analysis of buildout potential for commercial and industrial lands in Somerset County again demonstrates that municipalities have significantly over‐zoned for commercial and industrial and under zoned for higher density residential development, with Mt. Laurel related developments providing an exception to the general rule.

22
Part III – Summary of Findings
This study has examined evidence for exclusionary policies by looking at (1) historical land use development patterns, both statewide and within Monmouth and Somerset Counties, and (2) future development patterns through buildout modeling of Monmouth and Somerset Counties based on current zoning policy. Our analysis results in the following major findings: A) New Jersey’s residential development has, contrary to the State Plan, followed a low‐density, sprawling pattern that reflects continued exclusionary zoning.
1) Shift toward low density residential: Since 1986, development patterns have shifted to have fewer acres dedicated to high‐density residential development and more acres dedicated to large lot low‐density residential. Such large lot units are generally not accessible to low and moderate income households.
2) Large lot development is widespread even within Smart Growth Areas: While Smart Growth areas are intended to be where the majority of growth should occur and where most of the sewer infrastructure is located which allows for high density units, a significant chunk of residential land (40%) within Smart Growth areas is nevertheless still occurring in large lot subdivisions at densities of 2 homes per acre or less, which is highly inconsistent with the goals of the State Plan.
3) Residential Growth in Not Smart Growth Areas: The majority of land developed for residential land uses actually occurred within the Not Smart Growth zones of the State Plan rather than within the Smart Growth zones, which the State Plan designates as the primary areas for growth. This was primarily attributable to the predominance of large lot subdivisions in rural areas. A remarkable amount of rural open space is being rapidly consumed by large lot subdivisions, contrary to the State Plan’s call for development appropriate for rural areas and conservation of natural resources in these areas.
4) Not Smart Growth Areas developed in a highly segregating manner: While the majority of land developed for housing occurred in the Not Smart Growth Areas as mentioned above, over 90% of the acres developed for housing in the Not Smart Growth zones were low and rural density subdivisions (greater than ½ acre). Only 8% of acres developed in the Not Smart Growth zones were medium and high density residential even though the State Plan calls for compact, centers based development even in the Not Smart Growth planning areas.
5) Current zoning in Monmouth and Somerset Counties is slated to continue an exclusionary pattern: If current zoning is followed, a large majority of future development in these counties will be large lot, low‐density subdivisions in an even greater proportion than past patterns.
B) Commercial and industrial land uses have been more consistent with the State Plan than residential, suggesting municipal zoning that welcomes retail and office development while discouraging high‐density residential development.
6) Jobs have actually followed the State Plan: Statewide as well as within our case study counties, roughly 80 percent of commercial and industrial development occurred within the Smart Growth planning areas. These data contrast with the majority of acres of residential development that were outside of the Smart Growth Planning areas.

23
7) Jobs and housing not well coordinated: There is a geographic and quantitative mismatch between jobs as indicated by commercial and industrial lands uses and housing as related to Smart Growth areas of the State Plan.
C) Many higher density zones that do exist are identifiably Mt. Laurel zones within Smart Growth areas. This suggests that absent Mt. Laurel, residential development would be even less dense and less coordinated with the location of jobs than current patterns indicate.
8) A significant amount of the smaller lot size units that have been or will be built are in Mt. Laurel zones: At least as is indicated in Monmouth and Somerset case studies, Mt. Laurel polices have had a positive effect as demonstrated by the fact that a number of high density residential area are zones specifically intended for COAH obligations. While the evidence that we present suggests that exclusionary patterns have been prevalent, it is likely that situation would have been worse if there had been no provisions for municipalities to consider affordable housing in their master planning process.
D) Going forward, the case study counties are over‐zoned for commercial and industrial development in terms of the number of jobs those areas may generate relative to the future housing that will be built under current zoning which may be largely builtout within the span of the next two decades.
9) The case study counties have far more zoning for commercial and industrial development than residential: The study demonstrates an overabundance of land zoned for commercial and industrial zoning in terms of the jobs that would be generated but far less zoning for apartment, townhouse, and small‐lot single family home development in terms of number of residential units generated. The jobs:housing ratio in zoning is nearly 7:1 in Monmouth County and over 16:1 in Somerset County, far greater than the 1.5:1 ratio recognized as consistent with sound planning.
10) Pending Buildout will lock in exclusionary land use patterns: Residential land use patterns are
unlikely to change, especially in suburban areas, for decades if not centuries. One would be hard pressed to imagine the redevelopment of large lot single family subdivisions into more affordable units. As New Jersey builds out, these land use patterns will be locked into place for generations to come.
These findings suggest that exclusionary forces still persist within New Jersey’s municipal zoning system; that the Mt. Laurel case has provided a modest limitation on those forces; and that absent requirements for high‐density zones where affordable single‐family homes, apartments, and townhouses can be built, a deficit of those types of land uses would occur in the vast majority of New Jersey.
Conclusion
The New Jersey Landscape has changed dramatically since Williams and Norman wrote their seminal critique of exclusionary zoning four decades ago. And while predicting the future of land development is an extraordinarily difficult task, especially considering the lack of computer modeling capabilities in their time, their thesis on exclusionary zoning was remarkably on‐target at least for a number of important factors. What they correctly forewarned was that New Jersey's land use controls, largely controlled by local municipal zoning policy, would affect the distribution and quantity of housing across all economic classes of society in a manner that would have exclusionary consequences.

24
Whether local zoning functioned in an intentional or unintentional exclusionary manner for fiscal reasons (i.e. the ratable chase) or for demographic reasons (avoidance of school children to teach), or for more nefarious hidden motives related on class or race, the effect has been the same. According to our analysis, the exclusionary effects of zoning still persist four decades after the Williams and Norman study. In fact, zoning has resulted in a land use pattern that is substantially more segregated and more sprawling now than it was in 1970. It is likely that the imbalance in housing densities and lack of coordination of jobs with housing would have been even worse had the Mt. Laurel case and subsequent Mt. Laurel policies not been followed. Still, the overarching objectives of the State Plan for fostering sound planning process to meet the housing needs for all New Jersey residents has a long way go. The grossly unbalanced pattern of high and low density residential development being imposed on the New Jersey landscape certainly has implications for future affordability as well as for the sustainability of the state as a whole. Our once rural agriculturally productive regions of the state are becoming the wealthy exurban bedroom communities to high‐end employees whose jobs may be an hour and a half commute away. Likewise, working class residents throughout the state are relegated to search to the furthest suburban outskirts in order to find housing that is affordable, again resulting in large commute to work distances. This pattern helps to explain why such a small state as New Jersey has the third longest commute to work times of all 50 states (Census 2011). If New Jersey had an unlimited amount of vacant land, the consumption of large tracts by exclusive housing subdivisions would not be such an issue since there would always be additional lands in reserve that could absorb needs for affordable housing. But the next 40 years will likely see as much change as the last 40 since the Williams and Norman paper helped initiate the exclusionary housing debate. In the decades that lie ahead, absent any changes, New Jersey will use up the majority of its remaining residentially zoned vacant lands save for the most remote areas, even as an abundance of commercially zoned land that would be attractive from a market standpoint for housing development lies vacant. At that point and time virtually no vacant land will be available for housing of any type of residential development and the land use pattern will be locked into place for generations to come. Whether or not that future housing pattern is one of balanced and sustainable communities built on sustainable, Smart Growth principles or whether current trends of sprawl and housing segregation predominate will be ultimately determined by the land management policies that are in place today, including, to a large extent, the continued enforcement of the Mt. Laurel doctrine as a mild counterbalance to the overall trends discussed in this report. The evidence presented in this study suggests that the policies that are in place today have put us on track to a future of further sprawl and housing segregation.
25
References
Batty, M. (2005). Agents, cells, and cities: new representational models for simulating multiscale urban
dynamics. Environment and Planning A, 37(8), 1373.
Burchell, R. W., Dolphin, W. R., & Erickson, J. (2009). Sustainability as Partner to Economic Regeneration:
The Impact Assessment of the New Jersey State Plan Center for Urban Policy Research, Rutgers
University.
Burchell, R. W., & Shad, N. A. (1999). Evolution of the Sprawl Debate in the United States, The. Hastings
West‐Northwest Journal of Environmental Law and Policy, 5, 137.
Burchell, R. (2000). The Costs and Beneifts of Alternate Growth Patters: Impact Assessment of the New
Jersey State Plan. New Brunswick, NJ: Center for Urban Policy, Rutgers University.
Burchell, R. W. (1992). Impact Assessment of the New Jersey Interim State Development and
Redevelopment Plan No. II). Trenton, NJ: New Jersey Office of State Planning.
Conway, T. M., & Lathrop, R. G. (2005a). Alternative land use regulations and environmental impacts:
assessing future land use in an urbanizing watershed. Landscape and Urban Planning, 71(1), 1‐15.
Conway, T. M., & Lathrop, R. G. (2005b). Modeling the ecological consequences of land‐use policies in an
urbanizing region. Environmental Management, 35(3), 278‐291.
Ewing, R. (1994). Characteristics, causes, and effects of sprawl: A literature review. Environmental and
Urban Issues, 21(2), 1–15.
Ewing, R. (1997). Is Los Angeles‐style sprawl desirable? Journal of the American Planning Association,
63(1), 107‐126.
Galster, G., Hanson, R., Ratcliffe, M. R., Wolman, H., Coleman, S., & Freihage, J. (2001). Wrestling sprawl
to the ground: defining and measuring an elusive concept. HOUSING POLICY DEBATE‐WASHINGTON‐,
12(4), 681‐718.
Giannotti, L., & Prisloe, S. (1998). Do It Yourself! Impervious Surface Buildout Analysis No. Technical
Paper #4)University of Conneticut Cooperative Extension System.
Gordon, P., & Richardson, H. W. (1997). Are compact cities a desirable planning goal? Journal of the
American Planning Association, 63(1), 95‐106.
Hasse, J., & Lathrop, R. (2001). Measuring Urban Growth in New Jersey Retrieved from
http://www.crssa.rutgers.edu/projects/lc/index.html
Hasse, J. E. (2007). 6 Using remote sensing and GIS integration to identify spatial characteristics of
sprawl at the building‐unit level. In V. Mesev (Ed.), Integration of GIS and remote sensing () Wiley.
Hasse, J. E., & Kornbluh, A. (2004). Measuring Accessibility as a Spatial Measure of Sprawl. Middle States
Geographer, (37), 108‐115.
Hasse, J. E., & Lathrop, R. J. (2003). A Housing‐Unit‐Level Approach to Characterizing Residential Sprawl.
Photogrammetric Engineering and Remote Sensing, 69(9), 1021‐1029.
Hasse, J., & Lathrop, R. G. (2010). Changing Landscapes in the Garden State: Urban Growth and Open
Space Loss in New Jersey1986 through 2007. Glassboro, NJ: Rowan University, Geospatial Research
Lab. Retrieved from http://gis.rowan.edu/projects/luc
Hess, G., Daley, S. S., Dennison, B. K., Lubkin, S. R., McGuinn, R. P., Morin, V. Z., et al. (2001). Just what is
sprawl, anyway. Carolina Planning, 26(2), 11–26.
Kaiser, E. J. (1995). Urban land use planning. Chicago: University of Illinois Press.

26
Kilpatrick, E., & Wyckoff, M. (2002). Overzoning and Build Out Analysis. Planning and Zoning News,
Peiser, R. B. (1989). Density and urban sprawl. Land Economics, , 193‐204.
Pfister, J., Hultgren, J., Jacqz, C., & Taupler, R. (2007). Current and Future Land Use: GIS Applied. In M.
Hamin, L. Silka & P. Geigis (Eds.), Preserving And Enhancing Communities: A Guide for Citizens,
Planners, And Policymakers (pp. 255) University of Massachusetts Press.
Prisloe, M., Giannotti, L., & Sleavin, W. (2000). Determining impervious surfaces for watershed modeling
applications. Paper presented at the 8th National Nonpoint Source Monitoring and Modeling
Workshop, 1‐17.
Theobald, D. M., & Hobbs, N. T. (2002). A framework for evaluating land use planning alternatives:
protecting biodiversity on private land. Conservation Ecology, 6(1), 5.
Weitz, J., American Planning Association, & American Planning Association. Planning Advisory Service.
(2003). Jobs‐housing balance American Planning Association.
Williams Jr, N., & Norman, T. (1970). Exclusionary Land Use Controls: The Case of North‐Eastern New
Jersey. Syracuse L.Rev., 22, 475.

27
Appendix A ‐ Assumptions and Caveats
This study used land use patterns as in indicator or how affordable housing policy has played out over the past few decades as well as how it will likely play out in the future of two NJ counties based on zoning. In some ways land use is the ultimate proof of how policy will shape land. However, as with any analytical methods, there are a number of assumptions and caveats that must be mentioned by which one should understand about the findings in order to put them in context.
1) We look at acres developed and not units developed. Higher density residential development has, by its nature, more units per acre. So while development of land by low density large lot units consumes large regions of land, it actually houses fewer people. Therefore while more land was consumed for residential development outside of the Smart Growth areas of the State Plan, more units of development are likely to have occurred within the Smart Growth areas then outside of the Smart Growth Areas. Since the available land use data does not provide number of units, that exact number was not generated by the methods employed in this study.
2) Lot size may not be a perfect indicator of affordability. For example, it is possible that high‐end apartments can be located in high density areas or that an affordable house trailer could be on a 3 acre lot in a rural municipality. Nonetheless, for the purposes of this study we make the assumption that the more affordable units are on lots of high and medium density and that the low and rural density lots of greater than ½ are not affordable units.
3) Buildout modeling has limitations which must be understood in order to put the findings into context. The county buildout analysis currently being conducted for water quality planning is a case in point. Each county must customize the state model to the unique circumstances of the individual county. Not only must zoning be incorporated but also sewer and water capacity, ground water and septic suitability, as well as other factors. The state mandated buildout studies for each county have been underway for several years and at the date of this writing, only a few counties have completed their analysis. Not only must basic factors such as minimum lot size, maximum coverage and road frontage be incorporated but other more amorphous factors such as various overlay zones, conditional use zones and Planned Unit Development zoning each of which can result in a dramatically different outcome than what the base zoning proscribes. This is further complicated by the fact that zoning can and does change regularly. Our analysis simply calculates the maximum buildout based solely on base zoning. The other factors mentioned above would all have the effect of lessening the actual buildout numbers.
4) Vacant lands available for development are likely an overestimate of what can practically be developed. The available lands value was generated by mapping lands restricted to development utilizing the best available data. However, the data likely has omissions of preserved open space such as private conservation easements that are not centrally recorded as well as others. Some lands such as highway medians and clover leafs can register as available in the model when they are not, in actually, developable. And lastly, many of the areas that the model identifies as available are small patches that are located within larger parcels that have already been developed which are unlikely to receive additional development growth. While our available lands model is on par with state of the art GIS practices, all models have limitations which should be well understood by the users of the data. All these factors combine to make the available lands likely an overestimate of what can actually be built.

28
5) As with most buildout analysis, we do not include an analysis of redevelopment. While redevelopment is an important component of serving the need for low and moderate housing units, our primary focus is on the implications of land use policy for shaping the conversion of green fields into developed lands. We focus on new development for two reasons: The first is that the consumption of the state's rural land base by large lot development is the driving issue of concern for New Jersey at this historical moment since the loss of natural resources to this type of development is for the most part an irreversible process. Zoning is largely responsible for this pattern and is the nexus where housing policy and natural resource protection come together. The speed at which these resources are being lost warrant urgent attention and the majority of this loss is attributable to residential housing at low densities. The second reason why redevelopment is not examined in this study is that the GIS land use dataset is less well suited to analyzing redevelopment since changes within the same category of land use are not easily distinguished. As segments of New Jersey approach buildout, redevelopment will no doubt be the major new frontier for future housing policy. Exclusionary zoning may impact redevelopment just as it may impact greenfield development; lands that from a market perspective might be suitable for residential redevelopment often are zoned to allow commercial or industrial uses only. We save that for future research endeavors.

29
Appendix B – Monmouth County Buildout Model
Appendix C – Somerset County Buildout Model
Are technical descriptions of the buildout modeling methods utilized in this study. These appendices are
available on the study website.
http://gis.rowan.edu/projects/exclusionary
Appendix D – Land Use Category Descriptions
(Source: http://www.state.nj.us/dep/gis/digidownload/metadata/lulc02/anderson2002.html)
1110 Residential (High Density or Multiple dwelling)
This category contains either high‐density single units or multiple dwelling units on 1/8 to 1/5‐acre lots.
These areas are found in the densely populated urban zones and generally are characterized by
impervious surface coverage of ~65%.
1120 Residential (Single Unit, Medium Density)
This category is comprised of residential urban/suburban neighborhoods greater than 1/8 acre and up
to and including ½ acre lots. These areas generally contain impervious surface areas of ~30‐35%
1130 Residential (Single Unit, Low Density)
This category contains single unit residential neighborhoods with areas greater than ½ acre up to and
including 1‐acre lots. These areas generally contain impervious surface areas of ~20‐25%
1140 Residential (Rural, Single Unit)
This category contains single unit residential neighborhoods with areas between 1 acre and up to and
including 2‐acre lots. These areas generally contain impervious surface areas of ~15‐20% or less. This
type is found in sparsely populated regions surrounded by or adjacent to forested or agricultural lands.
Also included are estates or modern sub‐divisions with large lot sizes providing a density less than or
equal to 1 dwelling unit per acre. Impervious surface areas in the more rural settings can be as low as
5%.
1150 Mixed Residential
The mixed residential category is used for an area where various residential uses occur and the
individual uses cannot be separated at mapping scale (1 acre). Where more than 1/3 intermixture of
other residential use or uses occurs in a specific area, it is classified as mixed residential. Where the
inter‐mixtures of other residential land use or uses total less than 1/3 of the specified area, the
dominant land use category is applied. Impervious surface coverage in these areas can vary
significantly.

30
1200 COMMERCIAL & SERVICES
Areas that contain structures predominantly used for the sale of products and services are classified as
Commercial and Services.
The main building, secondary structures and supporting areas such as parking lots, driveways and
landscaped areas are also placed under this category, (unless the landscaped areas are greater than 1
acre in size in which case they are put into a separate category). Sometimes non‐commercial uses such
as residential or industrial intermix with commercial uses making it difficult to identify the predominant
land use. These categories are not separated out; but, if they exceed 1/3 of the total commercial area,
the Mixed Urban category (16) is used. Often, specific uses of some commercial and services buildings
cannot be easily identified from photography alone. Some supplemental information is required. These
areas generally have a high percentage of impervious surface coverage. Any of the specific uses listed
below may be included in the 1200 category, with the exception of Military Installations which are
delineated separately under the code 1211.
1300 INDUSTRIAL
This category encompasses a great variety of structure types and land uses. Light and heavy industry
are comprised of land uses where manufacturing, assembly or processing of products takes place.
Power generation is included here because of its similarity to heavy industry. These areas generally have
a high percentage of impervious surface coverage.
1500 INDUSTRIAL & COMMERCIAL COMPLEXES
The Industrial and Commercial Complexes category includes those industrial and commercial land uses
that typically occur together or in close proximity. These areas are commonly referred to as "Industrial
or Commercial Parks." The major types of business establishments located in these planned industrial
and commercial parks are light manufacturing, administration offices, research and development
facilities, and computer systems companies. Also found here are facilities for warehousing, wholesaling,
retailing and distributing.
Industrial and Commercial Complexes are usually located in suburban or rural areas. The key identifying
feature is the planned layout of buildings exhibiting the same or very similar construction. Other
identifying features include well‐kept lawns and landscaped areas, ample parking areas and common
roadways connecting buildings that also provide access to major highways. The lack of smokestacks,
storage tanks, raw materials or finished products, and waste signifies that no heavy industries are
present. These areas generally have a high percentage of impervious surface coverage (~85%) and some
may be up to 100%.