OF FINANCIAL CONDITION AND RESULTS OF OPERATIONS...
26
MANAGEMENT’S DISCUSSION and ANALYSIS OF FINANCIAL CONDITION AND RESULTS OF OPERATIONS For the year ended December 31, 2016 1 (in United States dollars, tabular amounts in millions, except where noted) Throughout this Management’s Discussion and Analysis (“MD&A”), Eldorado, we, us, our and the Company mean Eldorado Gold Corporation. This year means 2016. All dollar amounts are in United States dollars unless stated otherwise. The information in this MD&A is as of February 23, 2017. You should also read our audited consolidated financial statements for the year ended December 31, 2016. We prepare our consolidated financial statements in accordance with International Financial Reporting Standards (“IFRS”) as issued by the International Accounting Standards Board. We file them with appropriate regulatory authorities in Canada and the United States. You can find more information about Eldorado, including our Annual Information Form (“AIF”), on SEDAR at www.sedar.com. About Eldorado Based in Vancouver, Canada, Eldorado owns and operates mines around the world. Its activities involve all facets of the mining industry including exploration, development, production and reclamation. Operating gold mines: Kisladag, in Turkey (100%) Efemcukuru, in Turkey (100%) Gold projects: Olympias, in Greece (95%) Skouries, in Greece (95%) Perama Hill, in Greece (100%) Certej, in Romania (81%) Tocantinzinho, in Brazil (100%) Other mines: Stratoni – Lead and Zinc Concentrates, in Greece (95%) Vila Nova – Iron Ore, in Brazil (100%) Eldorado is listed on the following exchanges: Toronto Stock Exchange (“TSX”) under the symbol ELD New York Stock Exchange (“NYSE”) under the symbol EGO
-
Upload
nguyenthien -
Category
Documents
-
view
214 -
download
0
Transcript of OF FINANCIAL CONDITION AND RESULTS OF OPERATIONS...

MANAGEMENT’S DISCUSSION and ANALYSIS OF FINANCIAL CONDITION AND RESULTS OF OPERATIONS For the year ended December 31, 2016
1
(in United States dollars, tabular amounts in millions, except where noted)
Throughout this Management’s Discussion and Analysis (“MD&A”), Eldorado, we, us, our and the Company mean Eldorado Gold Corporation. This year means 2016. All dollar amounts are in United States dollars unless stated otherwise. The information in this MD&A is as of February 23, 2017. You should also read our audited consolidated financial statements for the year ended December 31, 2016. We prepare our consolidated financial statements in accordance with International Financial Reporting Standards (“IFRS”) as issued by the International Accounting Standards Board. We file them with appropriate regulatory authorities in Canada and the United States. You can find more information about Eldorado, including our Annual Information Form (“AIF”), on SEDAR at www.sedar.com.
About Eldorado Based in Vancouver, Canada, Eldorado owns and operates mines around the world. Its activities involve all facets of the mining industry including exploration, development, production and reclamation. Operating gold mines: Kisladag, in Turkey (100%) Efemcukuru, in Turkey (100%) Gold projects: Olympias, in Greece (95%) Skouries, in Greece (95%) Perama Hill, in Greece (100%) Certej, in Romania (81%) Tocantinzinho, in Brazil (100%) Other mines: Stratoni – Lead and Zinc Concentrates, in Greece (95%) Vila Nova – Iron Ore, in Brazil (100%) Eldorado is listed on the following exchanges: Toronto Stock Exchange (“TSX”) under the symbol ELD New York Stock Exchange (“NYSE”) under the symbol EGO
MANAGEMENT’S DISCUSSION and ANALYSIS OF FINANCIAL CONDITION AND RESULTS OF OPERATIONS For the year ended December 31, 2016
2
(in United States dollars, tabular amounts in millions, except where noted)
2016 Overview Selected Consolidated Financial Information (1)
Loss attributable to shareholders of the Company of $344.2 million or $0.48 per share, compared to
loss attributable to shareholders of the Company of $1,540.9 million or $2.15 per share in 2015. During 2016 the Company sold its Chinese assets for proceeds of $881.6 million, net of taxes. A loss
of $351.2 million was recorded on the sale of the assets.
Gross profit of $163.2 million compared to $125.6 million in 2015.
Liquidity was $1,138.5 million at year end, including $888.5 million in cash, cash equivalents, and term deposits, and $250.0 million in unused lines of credit (2015 - $667.6 million of liquidity).
Selected Performance Measures (2)
Gross profit from continuing gold mining operations of $158.7 million (2015 - $152.8 million).
Gold production, including discontinued operations and Olympias tailings retreatment of 486,025
ounces (2015 – 723,532 ounces).
Total cash costs averaged $621 per ounce (2015 – $606 per ounce).
All-in sustaining cash costs averaged $900 per ounce (2015 – $842).
Adjusted net earnings of $47.4 million ($0.07 per share) compared to adjusted net earnings of $13.2 million ($0.02 per share) in 2015.
Cash generated from continuing operating activities before changes in non-cash working capital was
$104.4 million (2015 – $76.6 million).
(1) In accordance with the requirements of IFRS 5 – “Non-current assets held for sale and discontinued operations”, the Company’s China segment has been classified as a discontinued operation for the year ended December 31, 2016, and accordingly the 2015 comparative information has been restated. Except where indicated, the financial and performance information presented in this MD&A includes discontinued operations.
(2) Throughout this MD&A we use cash operating cost per ounce, total cash costs per ounce, all-in sustaining cost per ounce, gross profit from gold mining operations, adjusted net earnings, and cash flow from operating activities before changes in non-cash working capital as additional measures of Company performance. These are non-IFRS measures. Please see page 11 for an explanation and discussion of these non-IFRS measures.
Sale of Chinese Assets
The Company sold its interest in Jinfeng to a wholly-owned subsidiary of China National Gold Group Corporation on September 6, 2016, and its interests in its other Chinese assets (Tanjianshan, White Mountain and Eastern Dragon) to an affiliate of Yintai Resources Co. Ltd. on November 22, 2016. Combined, the sales of the Company’s Chinese assets generated net proceeds of $881.6 million, net of taxes. A loss of $351.2 million was recorded on the sale of the assets.
Planned Retirement of President and Chief Executive Officer Announced
On January 6, 2017 the Company announced the planned retirement of President and Chief Executive Officer Paul Wright and named George Burns as his successor.

MANAGEMENT’S DISCUSSION and ANALYSIS OF FINANCIAL CONDITION AND RESULTS OF OPERATIONS For the year ended December 31, 2016
3
(in United States dollars, tabular amounts in millions, except where noted)
Summarized Annual Financial Results
Continuing Operations
2016 2015 2014
Gold revenues 388.6 440.0 521.3
Gold sold (ounces) 311,028 380,039 413,168
Average realized gold price ($/ounce) 1,249 1,158 1,266
Cash operating costs ($/ounce) 487 537 475
Total cash costs ($/ounce) 502 554 494
Gross profit from gold mining operations 158.7 152.8 262.1
Including Discontinued Operations
2016 2015 2014
Revenues 650.2 863.3 1,067.9
Gold revenues 605.9 823.8 980.9
Gold sold (ounces) 483,461 705,310 774,522
Average realized gold price ($/ounce) 1,253 1,168 1,266
Cash operating costs ($/ounce) 579 552 500
Total cash costs ($/ounce) 621 606 557
All-in sustaining cash cost ($/ounce) 900 842 779
Gross profit from gold mining operations 203.5 230.0 382.7
Adjusted net earnings 47.4 13.2 138.7
Net profit (loss) 1 (344.2) (1,540.9) 102.6
Earnings (loss) per share – basic ($/share) 1 (0.48) (2.15) 0.14
Earnings (loss) per share – diluted ($/share) 1 (0.48) (2.15) 0.14
Cash flow from operating activities 3 142.0 192.3 342.9
Capital spending – cash basis 320.3 396.0 410.7
Dividends paid – (Cdn$/share) 0.00 0.02 0.02
Cash, cash equivalents and term deposits 888.5 292.6 501.3
Total assets 4,797.9 5,464.9 7,393.6
Total long-term financial liabilities 2 692.2 698.8 745.5
(1) Attributable to shareholders of the Company. (2) Includes long-term debt net of deferred financing costs, other non-current liabilities, and asset retirement obligations. (3) Before changes in non-cash working capital.
Review of Annual Financial Results
Loss attributable to shareholders of the Company was $344.2 million, (or $0.48 per share), compared to a loss of $1,540.9 million, or $2.15 per share in 2015. The loss in 2016 was mainly due to the $351.2 million loss recorded on the sale of the Company’s Chinese assets as well as $13.0 million in transaction costs, and $17.2 million in unrealized non-cash losses on foreign exchange translation of deferred income tax balances. The loss in 2015 was mainly due to impairment losses, net of tax, in the amount of $1,423.0 million, and a deferred income tax charge of $63.5 million related to a change in income tax rates in Greece.
Adjusted net earnings for the year were $47.4 million ($0.07 per share) as compared with $13.2 million ($0.02 per share) for 2015. While gross profit from gold mining operations, including discontinued operations, were $26.5 million lower year over year, gross profit from Stratoni was $18.1 million higher. General and administrative expenses, defined pension plan expense, and share based payments fell a combined $8.9 million year over year. Tax expense fell approximately $22.0 million, excluding the impact of the sale of the Company’s Chinese assets, due to lower withholding taxes on dividends declared by

MANAGEMENT’S DISCUSSION and ANALYSIS OF FINANCIAL CONDITION AND RESULTS OF OPERATIONS For the year ended December 31, 2016
4
(in United States dollars, tabular amounts in millions, except where noted)
Company subsidiaries and a decrease in the effective tax rate related to lower taxable income from our Chinese operations which have a 25 percent income tax rate as compared to Turkey which has a 20 percent income tax rate. Foreign exchange loss was $2.7 million as compared with $15.0 million in 2015, as the value of the Canadian dollar and Brazilian real in comparison to the US dollar stabilized during 2016, after falling significantly during 2015.
Gold sales volumes decreased year over year, reflecting a decrease in gold production at Kisladag and the sale of the Company’s Chinese mines during the year. Gross profit from gold mining operations including discontinued operations fell due to lower sales volumes and higher unit costs, partly offset by higher gold prices. Gross profit from continuing gold mining operations (Kisladag and Efemcukuru) increased slightly year over year on higher realized gold prices and lower unit operating costs.
Summarized Quarterly Financial Results – including discontinued operations
2016 Q1 Q2 Q3 Q4 2016
Revenues 164.1 171.5 174.0 140.6 650.2
Gold revenues 160.0 162.7 156.0 127.2 605.9
Gold sold (ounces) 133,467 128,090 116,882 105,022 483,461
Average realized gold price ($/ounce) 1,198 1,270 1,335 1,211 1,253
Cash operating costs ($/ounce) 603 607 566 531 579
All-in sustaining cash cost ($/ounce) 886 933 890 880 900
Gross profit from gold mining operations 41.2 55.5 64.6 42.2 203.5
Adjusted net earnings (loss) (0.7) 11.7 33.5 2.9 47.4
Net profit (loss) 1 (2.5) (329.9) 20.7 (32.5) (344.2)
Earnings (loss) per share – basic ($/share) 1 (0.00) (0.46) 0.03 (0.05) (0.48)
Earnings (loss) per share – diluted ($/share) 1 (0.00) (0.46) 0.03 (0.05) (0.48)
Cash flow from operating activities 2 25.1 38.1 52.9 25.9 142.0
2015 Q1 Q2 Q3 Q4 2015
Revenues 238.3 214.2 211.5 199.3 863.3
Gold revenues 224.0 204.2 206.2 189.4 823.8
Gold sold (ounces) 181,820 170,056 182,124 171,310 705,310
Average realized gold price ($/ounce) 1,232 1,201 1,132 1,105 1,168
Cash operating costs ($/ounce) 521 569 552 567 552
All-in sustaining cash cost ($/ounce) 729 900 835 914 842
Gross profit from gold mining operations 77.1 61.4 53.1 38.4 230.0
Adjusted net earnings 19.5 17.0 (4.0) (19.3) 13.2
Net profit (loss) 1 (8.2) (198.6) (96.1) (1,238.0) (1,540.9)
Earnings per share – basic ($/share) 1 (0.01) (0.28) (0.13) (1.73) (2.15)
Earnings per share – diluted ($/share) 1 (0.01) (0.28) (0.13) (1.73) (2.15)
Cash flow from operating activities 2 58.9 61.9 43.4 28.1 192.3
(1) Attributable to shareholders of the Company (2) Before changes in non-cash working capital
Review of Quarterly Results
Loss attributable to shareholders of the Company for the quarter was $32.5 million ($0.05 per share) as compared to a loss for the quarter ended December 31, 2015 of $1,238.0 million ($1.73 per share). Adjusted earnings were $2.9 million as compared to 2015 adjusted loss of $19.3 million. The main factors that impacted adjusted earnings for the fourth quarter year over year were lower sales volumes partly offset by higher gold prices. During the fourth quarter of 2015 the Company recorded an impairment

MANAGEMENT’S DISCUSSION and ANALYSIS OF FINANCIAL CONDITION AND RESULTS OF OPERATIONS For the year ended December 31, 2016
5
(in United States dollars, tabular amounts in millions, except where noted)
charge attributable to shareholders of the Company, net of taxes, of $1,249.6 million mainly related to its Skouries project.
Operations Review and Outlook
Gold Operations
CONTINUING OPERATIONS: 2016 2015 2017 Outlook
Kisladag
Ounces produced 211,161 281,280 230,000 – 245,000
Cash operating costs ($/ounce) 474 543 500 – 550
Total cash cost ($/ounce) 488 558 n/a
Sustaining capex $39.8 $30.6 $45.0
Efemcukuru
Ounces produced 98,364 100,482 95,000 – 105,000
Cash operating costs ($/ounce) 514 521 525 – 575
Total cash cost ($/ounce) 530 540 n/a
Sustaining capex 23.5 24.1 25.0
Olympias
Ounces produced (1) 2,774 16,396 40,000 – 50,000
Sustaining Capex (2) n/a n/a n/a
SUBTOTAL: CONTINUING OPERATIONS
Ounces produced 312,299 398,158 365,000 – 400,000
Cash operating costs ($/ounce) 487 537 485 - 535
Total cash cost ($/ounce) 502 554 n/a
Sustaining capex 63.3 54.7 70.0
DISCONTINUED OPERATIONS:
Tanjianshan
Ounces produced 49,266 97,563 n/a
Cash operating costs ($/ounce) 819 473 n/a
Total cash cost ($/ounce) 970 646 n/a
Sustaining capex 2.1 14.7 n/a
Jinfeng
Ounces produced 68,195 149,655 n/a
Cash operating costs ($/ounce) 705 587 n/a
Total cash cost ($/ounce) 791 669 n/a
Sustaining capex 6.7 10.0 n/a
White Mountain
Ounces produced 56,265 78,156 n/a
Cash operating costs ($/ounce) 731 653 n/a
Total cash cost ($/ounce) 773 691 n/a
Sustaining capex 9.9 15.5 n/a
TOTAL INCLUDING DISCONTINUED OPERATIONS:
Ounces produced 486,025 723,532 365,000 – 400,000
Cash operating costs ($/ounce) 579 552 485 – 535
Total cash cost ($/ounce) 621 606 n/a
Sustaining capex 82.0 94.9 70.0
(1) Includes production from tailings retreatment in 2015 and 2016. (2) Planned 2017 construction and development capital spending of $30.0 million at Olympias.

MANAGEMENT’S DISCUSSION and ANALYSIS OF FINANCIAL CONDITION AND RESULTS OF OPERATIONS For the year ended December 31, 2016
6
(in United States dollars, tabular amounts in millions, except where noted)
Annual Review – Operations Kisladag
Gold production at Kisladag was lower year over year mainly due to a substantial buildup of leach pad inventory during 2016 resulting from higher leach pad lifts and slower leaching in comparison with 2015. In the fourth quarter, additional sets of carbon columns were placed into production, which contributed to a drawdown in leach pad inventory in the final two months of the year. Year over year, fewer ore tonnes were placed on the leach pad at a higher head grade due to the phasing out of run-of-mine ore. Cash operating costs were lower year over year as a result of the higher head grade. Capital expenditures included capitalized waste stripping, leach pad construction, equipment overhauls and various process improvements.
Efemcukuru
Gold production at Efemcukuru was consistent year over year as higher milled tonnes and recoveries compensated for lower average treated head grade. Lower cash operating costs were the result of continued cost reduction initiatives. Capital spending included costs related to capitalized underground development, tailings dam expansion.
Operating Data 2016 2015
Tonnes placed on pad 16,565,254 19,146,685
Average treated head grade (g/t Au) 0.80 0.70
Gold (ounces)
- Produced 211,161 281,280
- Sold 211,284 280,892
Cash operating costs ($/ounce) 474 543
Total cash costs ($/ounce) 488 558
Financial Data
Gold revenues $263.2 $326.5
Depreciation and depletion $39.5 $46.5
Gross profit from mining operations $120.5 $121.2
Sustaining capital expenditures $39.8 $30.6
Operating Data 2016 2015
Tonnes milled 476,528 454,863
Average treated head grade (g/t Au) 7.40 7.82
Average recovery rate (to concentrate) 92.2% 91.7%
Gold (ounces)
- Produced 98,364 100,482
- Sold 99,744 99,147
Cash operating costs ($/ounce) 514 521
Total cash costs ($/ounce) 530 540
Financial Data
Gold revenues $125.4 $113.5
Depreciation and depletion $34.2 $30.3
Gross profit from mining operations $38.2 $28.0
Sustaining capital expenditures $23.5 $24.1

MANAGEMENT’S DISCUSSION and ANALYSIS OF FINANCIAL CONDITION AND RESULTS OF OPERATIONS For the year ended December 31, 2016
7
(in United States dollars, tabular amounts in millions, except where noted)
Tanjianshan
The table above reflects operations through November 22, 2016, the date of sale of Tanjianshan. Gold production at Tanjianshan was lower year over year mainly due to lower grade and tonnage from the JLG pit as well as an extended mill shutdown for repairs during the third quarter. Cash operating costs per ounce were higher year over year mainly due to lower production and head grade. Capital expenditures included resource drilling and development of the Qinlongtan deep decline. Jinfeng
The table above reflects operations through September 6, 2016, the date of sale of Jinfeng. Jinfeng performed within expectations up to the date of sale. The impact of the completion of open pit mining in the second quarter of 2015 resulted in lower tonnages, grades and higher cash operating costs in 2016.
Operating Data 2016 2015
Tonnes milled 766,697 1,303,863
Average treated head grade (g/t Au) 3.32 4.13
Average recovery rate 83.2% 86.2%
Gold (ounces)
- Produced 68,195 149,655
- Sold 66,902 149,552
Cash operating costs ($/ounce) 705 587
Total cash costs ($/ounce) 791 669
Financial Data
Gold revenues $84.3 $176.6
Depreciation and depletion $8.8 $37.2
Gross profit from mining operations $22.5 $39.3
Sustaining capital expenditures $6.7 $10.0
Operating Data 2016 2015
Tonnes milled 869,964 1,060,176
Average treated head grade (g/t Au) 1.90 3.14
Average recovery rate 78.5% 82.4%
Gold (ounces)
- Produced 49,266 97,563
- Sold 49,266 97,563
Cash operating costs ($/ounce) 819 473
Total cash costs ($/ounce) 970 646
Financial Data
Gold revenues $62.2 $115.5
Depreciation and depletion $1.3 $25.3
Gross profit from mining operations $3.6 $26.8
Sustaining capital expenditures $2.1 $14.7
MANAGEMENT’S DISCUSSION and ANALYSIS OF FINANCIAL CONDITION AND RESULTS OF OPERATIONS For the year ended December 31, 2016
8
(in United States dollars, tabular amounts in millions, except where noted)
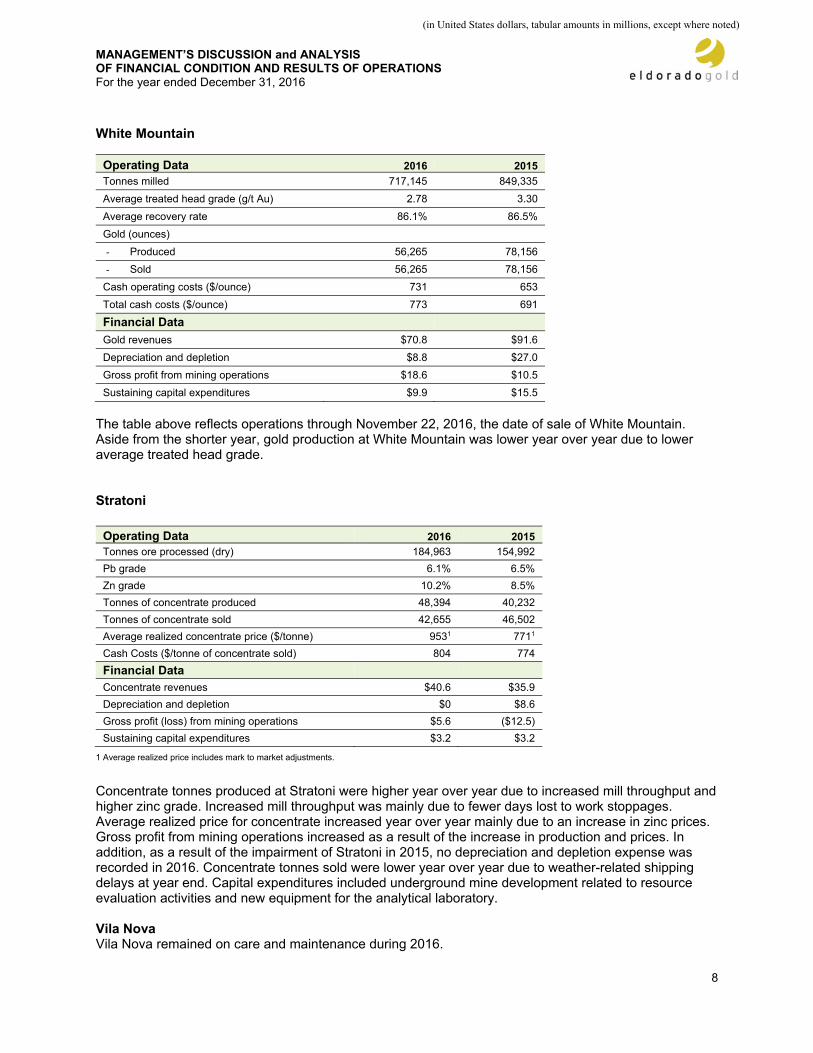
White Mountain
The table above reflects operations through November 22, 2016, the date of sale of White Mountain. Aside from the shorter year, gold production at White Mountain was lower year over year due to lower average treated head grade. Stratoni
1 Average realized price includes mark to market adjustments.
Concentrate tonnes produced at Stratoni were higher year over year due to increased mill throughput and higher zinc grade. Increased mill throughput was mainly due to fewer days lost to work stoppages. Average realized price for concentrate increased year over year mainly due to an increase in zinc prices. Gross profit from mining operations increased as a result of the increase in production and prices. In addition, as a result of the impairment of Stratoni in 2015, no depreciation and depletion expense was recorded in 2016. Concentrate tonnes sold were lower year over year due to weather-related shipping delays at year end. Capital expenditures included underground mine development related to resource evaluation activities and new equipment for the analytical laboratory. Vila Nova Vila Nova remained on care and maintenance during 2016.
Operating Data 2016 2015
Tonnes milled 717,145 849,335
Average treated head grade (g/t Au) 2.78 3.30
Average recovery rate 86.1% 86.5%
Gold (ounces)
- Produced 56,265 78,156
- Sold 56,265 78,156
Cash operating costs ($/ounce) 731 653
Total cash costs ($/ounce) 773 691
Financial Data
Gold revenues $70.8 $91.6
Depreciation and depletion $8.8 $27.0
Gross profit from mining operations $18.6 $10.5
Sustaining capital expenditures $9.9 $15.5
Operating Data 2016 2015
Tonnes ore processed (dry) 184,963 154,992
Pb grade 6.1% 6.5%
Zn grade 10.2% 8.5%
Tonnes of concentrate produced 48,394 40,232
Tonnes of concentrate sold 42,655 46,502
Average realized concentrate price ($/tonne) 9531 7711
Cash Costs ($/tonne of concentrate sold) 804 774
Financial Data
Concentrate revenues $40.6 $35.9
Depreciation and depletion $0 $8.6
Gross profit (loss) from mining operations $5.6 ($12.5)
Sustaining capital expenditures $3.2 $3.2

MANAGEMENT’S DISCUSSION and ANALYSIS OF FINANCIAL CONDITION AND RESULTS OF OPERATIONS For the year ended December 31, 2016
9
(in United States dollars, tabular amounts in millions, except where noted)
Annual Review – Development Projects Olympias Olympias retreated 87,350 tonnes of tailings during the first quarter of 2016 at a grade of 2.47 grams per tonne, and produced 2,774 ounces of gold in concentrate. Tailings retreatment ended in February 2016 and construction of the Phase 2 plant began. Completion and commissioning of the Phase 2 plant is projected to be in the first quarter of 2017. Underground mine development and access rehabilitation continued at Olympias in 2016 in readiness for commencement of underground ore production scheduled for the first quarter 2017. A total of 3,680 meters of development and rehabilitation was completed during the year together with 21,400 meters of orebody definition drilling. Construction of the initial stage of the new Kokkinolakas tailings management facility (“TMF”) advanced substantially, and commissioning is expected by mid-2017. Capital costs totalled $132.1 million, consisting of mine construction, Phase 2 plant construction, Kokkinolakas TMF construction and capitalized cost for tailings retreatment. Skouries Due to delays with the issuance of routine permits and licenses by the Greek permitting authorities, the Company suspended the development at Skouries in early 2016. The majority of construction works were on hold during the first half of the year while environmental protection works and care and maintenance activities continued. On May 9, 2016, the Company received approval of the updated revised Technical Study. The construction team was remobilised in June and development ramped up over the following months. A total of $43.5 million was spent at Skouries, excluding capitalized exploration and capitalized interest. Following internal reviews and engineering studies a decision was made to convert waste management at Skouries from paste to dry stack tailings. This decision facilitates mining of higher-value underground ore, and significantly reduces the site’s environmental footprint. Engineering design work was initiated for a single integrated waste management facility and associated filtration plant during mid-2016; the basic engineering for the revised scope progressed during the final quarter of 2016, with detailed engineering expected to start early in 2017. During 2016, work was also completed on the pre-feasibility study for the Skouries underground mine design; feasibility level engineering is scheduled to be developed in 2017. Tocantinzinho The Company applied for installation licences for the site, road, and power line and initiated basic engineering for Tocantinzinho during 2016. Capital costs incurred at Tocantinzinho totalled $6.0 million for engineering, permitting, land agreements, mobile equipment, and site works including minor camp infrastructure and access road improvements. Completion of basic engineering for the site and detailed engineering for some infrastructure is expected to be completed in 2017 leading to a construction decision and advancement of permitting. Certej Engineering work continued during 2016 at Certej on metallurgical test work and trade off studies with a focus on further optimizations to improve the project and increase the level of engineering confidence. Work continued on amendments to the existing environmental permits to reflect the proposed changes, and such work will continue to be the focus of efforts in 2017. A total of $11.6 million was spent on Certej, mainly on geotechnical and metallurgical testing, site preparation and engineering studies. Perama Hill Perama Hill remains on care and maintenance pending receipt of the necessary permits.

MANAGEMENT’S DISCUSSION and ANALYSIS OF FINANCIAL CONDITION AND RESULTS OF OPERATIONS For the year ended December 31, 2016
10
(in United States dollars, tabular amounts in millions, except where noted)
Annual Review – Exploration A total of $26.2 million was spent on exploration and evaluation programs in 2016. Exploration drilling totaled 51,000 meters and was conducted at 16 projects including early-stage, brownfields and in-mine programs in Turkey, Brazil, Greece, Serbia and Romania. Turkey At Efemcukuru, surface drilling programs tested extensions to previously defined mineralized zones within the Kokarpinar vein system. Greenfields reconnaissance exploration programs evaluated grassroots targets in the eastern Pontide belt and associated with Cenozoic volcanic centres in western Turkey. Brazil In Brazil, option agreements were signed for the large Borborema and Nazareno license areas. Mapping and geochemical sampling programs were conducted on both of these license areas as well as at the Mara Rosa project. An initial drilling program was completed on the Vulture target at Borborema. Greece Exploration in Greece included drilling programs at the Fisoka porphyry target and at the Rian prospect near the Skouries deposit. At Mavres Petres, an exploration crosscut was driven into the hangingwall of the Stratoni Fault, enabling systematic underground exploration and definition drilling of the untested down-dip and along-strike extensions to the orebody projected to begin in early 2017. Romania In Romania, drilling was conducted at the Brad, Sacaramb, Certej North and Bolcana projects. At Sacaramb, drillholes targeted along-strike extensions of historically mined high-grade vein systems. Two holes tested deeper levels of the Bolcana porphyry system, and porphyry and epithermal targets peripheral to the Bolcana system were tested on the adjacent Certej North license. Serbia In Serbia, the Company completed acquisition of the KMC project from Euromax Resources Ltd. and acquired five new early-stage licenses. Drilling at KMC tested the Copper Canyon, Gravina and Shanac areas. A large gold-rich magnetite skarn system was identified at Shanac, and further drilling is scheduled to be performed in 2017.
MANAGEMENT’S DISCUSSION and ANALYSIS OF FINANCIAL CONDITION AND RESULTS OF OPERATIONS For the year ended December 31, 2016
11
(in United States dollars, tabular amounts in millions, except where noted)
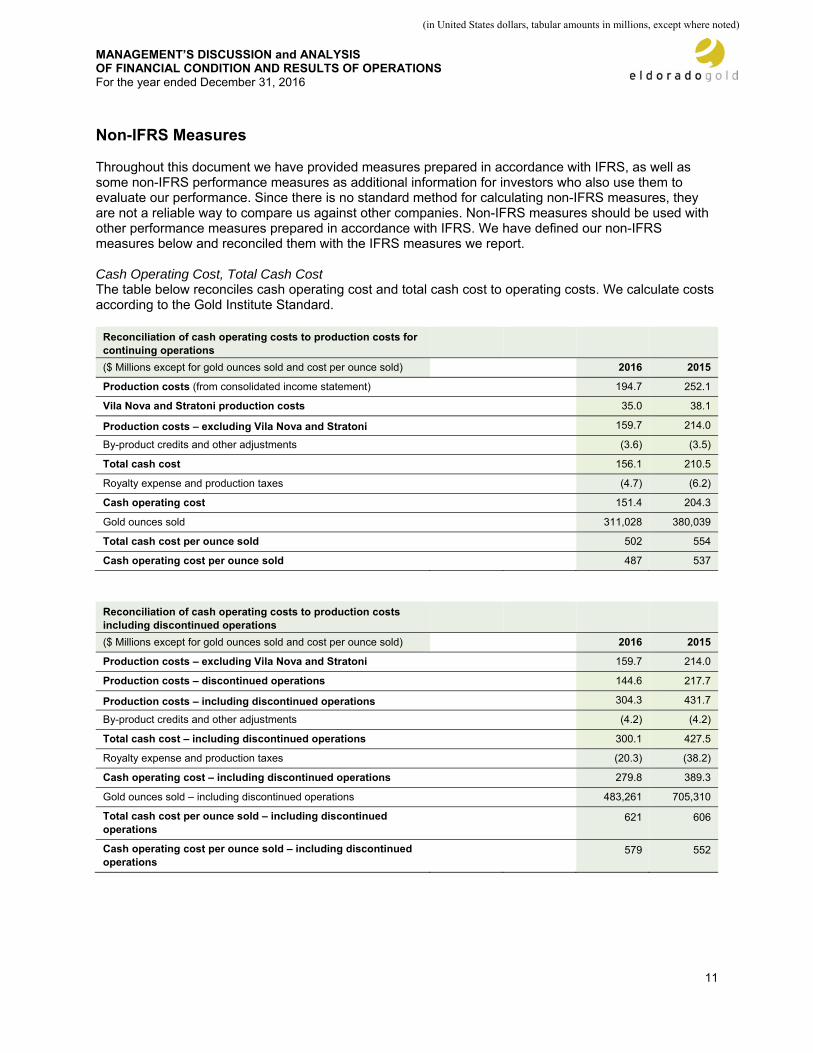
Non-IFRS Measures Throughout this document we have provided measures prepared in accordance with IFRS, as well as some non-IFRS performance measures as additional information for investors who also use them to evaluate our performance. Since there is no standard method for calculating non-IFRS measures, they are not a reliable way to compare us against other companies. Non-IFRS measures should be used with other performance measures prepared in accordance with IFRS. We have defined our non-IFRS measures below and reconciled them with the IFRS measures we report. Cash Operating Cost, Total Cash Cost The table below reconciles cash operating cost and total cash cost to operating costs. We calculate costs according to the Gold Institute Standard.
Reconciliation of cash operating costs to production costs for continuing operations
($ Millions except for gold ounces sold and cost per ounce sold) 2016 2015
Production costs (from consolidated income statement) 194.7 252.1
Vila Nova and Stratoni production costs 35.0 38.1
Production costs – excluding Vila Nova and Stratoni 159.7 214.0
By-product credits and other adjustments (3.6) (3.5)
Total cash cost 156.1 210.5
Royalty expense and production taxes (4.7) (6.2)
Cash operating cost 151.4 204.3
Gold ounces sold 311,028 380,039
Total cash cost per ounce sold 502 554
Cash operating cost per ounce sold 487 537
Reconciliation of cash operating costs to production costs including discontinued operations
($ Millions except for gold ounces sold and cost per ounce sold) 2016 2015
Production costs – excluding Vila Nova and Stratoni 159.7 214.0
Production costs – discontinued operations 144.6 217.7
Production costs – including discontinued operations 304.3 431.7
By-product credits and other adjustments (4.2) (4.2)
Total cash cost – including discontinued operations 300.1 427.5
Royalty expense and production taxes (20.3) (38.2)
Cash operating cost – including discontinued operations 279.8 389.3
Gold ounces sold – including discontinued operations 483,261 705,310
Total cash cost per ounce sold – including discontinued operations
621 606
Cash operating cost per ounce sold – including discontinued operations
579 552

MANAGEMENT’S DISCUSSION and ANALYSIS OF FINANCIAL CONDITION AND RESULTS OF OPERATIONS For the year ended December 31, 2016
12
(in United States dollars, tabular amounts in millions, except where noted)
All-in Sustaining Cash Cost All-in sustaining costs are calculated by taking total cash costs and adding sustaining capital expenditures, corporate administrative expenses, exploration and evaluation costs, and reclamation cost accretion. Sustaining capital expenditures are defined as those expenditures which do not increase annual gold ounce production at a mine site, and exclude all expenditures at the Company’s projects. Certain other cash expenditures, including tax payments, dividends and financing costs are also not included. The Company believes that this measure represents the total costs of producing gold from current operations, and provides the Company and other stakeholders of the company with additional information of the Company’s operational performance and ability to generate cash flows. The Company reports this measure on a gold ounces sold basis.
Calculation of all-in sustaining cash costs including discontinued operations
2016 2015
($ Millions except for gold ounces sold and all-in sustaining cash cost per ounce sold)
Total cash cost – including discontinued operations 300.1 427.5
Sustaining capital spending at operating gold mines 82.0 94.9
Exploration spending at operating gold mines 5.0 10.4
General and administrative expenses 48.0 61.4
All-in sustaining cash costs – including discontinued operations
435.1 594.2
Gold ounces sold – including discontinued operations 483,461 705,310
All-in sustaining cash cost per ounce sold – including discontinued operations
900 842
(1) Excludes G&A expenses related to business development activities and projects. Includes share based payments expense and defined benefit pension plan expense as well as asset retirement obligation accretion expense.
Cash Flow from Operations before Changes in Non-cash Working Capital We use cash flow from operations (or operating activities) before changes in non-cash working capital to supplement our consolidated financial statements, and calculate it by not including the period to period movement of non-cash working capital items, like accounts receivable, advances and deposits, inventory, accounts payable and accrued liabilities. We believe this provides an alternative indication of our cash flow from operations and may be meaningful to investors in evaluating our past performance or future prospects. It is not meant to be a substitute for cash flow from operations (or operating activities), which we calculate according to IFRS. Adjusted Net Earnings The Company has included non-IFRS performance measures, adjusted net earnings and adjusted net earnings per share, throughout this document. Adjusted net earnings excludes gains/losses and other costs incurred for acquisitions and disposals of mining interests, impairment charges, unrealized and non-cash realized gains/losses of financial instruments and foreign exchange impacts on deferred income tax. The Company also excludes net earnings and losses of certain associates that the Company does not view as part of the core mining operations. The Company excludes these items from net earnings to provide a measure which allows the Company and investors to evaluate the results of the underlying core operations of the Company and its ability to generate cash flow. Accordingly, it is intended to provide additional information and should not be considered in isolation or as a substitute for measures of performance prepared in accordance with IFRS.

MANAGEMENT’S DISCUSSION and ANALYSIS OF FINANCIAL CONDITION AND RESULTS OF OPERATIONS For the year ended December 31, 2016
13
(in United States dollars, tabular amounts in millions, except where noted)
The following table provides a reconciliation of adjusted net earnings to the consolidated financial statements for the years ended December 31:
Reconciliation of adjusted net earnings to consolidated net earnings (loss)
($ Millions except for weighted average shares and earnings per share) 2016 2015
Net (loss) earnings attributable to shareholders (344.2) (1,540.9)
Loss on disposition of subsidiary, net of taxes 351.2 0.0
Impairment loss on property, plant and equipment, net of tax 0.0 1,423.0
Write-down of assets net of tax 4.5 28.5
Loss on disposal of assets 2.1 0.2
Losses (gains) on available-for-sale securities 3.6 0.0
Impact of change in Greek income tax rate 0.0 60.4
Transaction costs related to sale of Chinese assets 13.0 3.1
Unrealized losses (gains) on foreign exchange translation of deferred income tax balances
17.2 38.9
Total adjusted net earnings (loss) 47.4 13.2
Weighted average shares outstanding 716,587 716,586
Adjusted net earnings ($/share) 0.07 0.02
1 Attributable to shareholders of the Company Gross Profit from Gold Mining Operations Gross profit from gold mining operations represents gross revenues from gold mining operations less production costs and depreciation, depletion and amortization related to those operations. Financial Condition & Liquidity Operating Activities Operating activities before changes in non-cash working capital (including discontinued operations) generated $142.0 million in cash in 2016, compared to $192.3 million in 2015. Investing Activities The Company invested $320.3 million in capital expenditures this year including discontinued operations. Evaluation and development expenditures, including capitalized drilling programs and Olympias tailings retreatment, totalled $199.5 million while sustaining capital spending at our producing mines totalled $85.2 million ($82.0 million at our producing gold mines and $3.2 million at Stratoni). We also spent $3.4 million on land acquisitions in Turkey and Romania. A total of $31.7 million in bond interest was also charged to capital projects. The remaining $0.5 million related to fixed assets for our corporate offices in Canada, Brazil, Turkey, Greece, and Romania. In addition, cash proceeds of $3.7 million related to gold concentrate sales proceeds from tailings retreatment were recorded as cash flows from investing activities. Financing Activities The Company drew down $70 million on its revolving credit facility during the year. This amount was fully repaid as at October 6, 2016.

MANAGEMENT’S DISCUSSION and ANALYSIS OF FINANCIAL CONDITION AND RESULTS OF OPERATIONS For the year ended December 31, 2016
14
(in United States dollars, tabular amounts in millions, except where noted)
Capital Resources
2016 2015
Cash, cash equivalents and term deposits 888.5 292.6
Working capital 1,001.5 335.4
Restricted collateralized accounts 0.2 0.2
Debt – current and long-term 591.6 589.4
Management believes that the working capital at December 31, 2016, together with future cash flows from operations and, where appropriate, selected financing sources, including available credit lines, are sufficient to support our planned and foreseeable commitments, and dividends, if declared, in 2017 and beyond. Contractual Obligations As at December 31, 2016
Within 1 year 2 to 3 years 4 to 5 years Over 5 years Total
Debt - - 600.0 - 600.0
Capital leases 0.7 0.5 0.4 - 1.6
Operating leases 13.2 5.9 3.5 4.7 27.3
Purchase obligations 73.2 1.0 0.2 - 74.4
Totals 87.1 7.4 604.1 4.7 703.3
Purchase obligations relate primarily to mine development expenditures in Greece and mine operating costs in Turkey. The table does not include interest on debt. As at December 31, 2016, Hellas Gold (“Hellas”) had entered into off-take agreements pursuant to which Hellas agreed to sell a total of 65,000 dry metric tonnes of zinc concentrates, 15,000 dry metric tonnes of lead/silver concentrates, and 18,000 dry metric tonnes of gold concentrate through the financial year ending December 31, 2017. In April 2007, Hellas agreed to sell to Silver Wheaton (Caymans) Ltd. (“Silver Wheaton”) all of the payable silver contained in lead concentrate produced within an area of approximately seven square kilometres around Stratoni. The sale was made in consideration of a prepayment to Hellas of $57.5 million in cash, plus a fixed price per ounce of payable silver to be delivered of the lesser of $3.90 and the prevailing market price per ounce, adjusted higher every April by 1%. For the period April 2016 through March 2017, this amount is equal to $4.14 per ounce. In October 2015 the agreement with Silver Wheaton was amended to provide an increase in the price per ounce of payable silver to be delivered to Hellas based on Hellas achieving certain exploration drilling milestones. In May 2013, the Company, in connection with Hellas Gold, entered into a Letter of Guarantee in favour of the Greek Ministry of Environment, Energy and Climate Change, in the amount of EUR50.0 million, as security for the due and proper performance of rehabilitation works committed in connection with the Environmental Impact Assessment approved for the Kassandra Mines (Stratoni, Olympias and Skouries). The Letter of Guarantee is renewed annually and expires on July 26, 2026. The Letter of Guarantee has an annual fee of 57 basis points. As at December 31, 2016, Tuprag Metal Madencilik Sanayi Ve Ticaret A.S. (“Tuprag”) had entered into off-take agreements pursuant to which Tuprag agreed to sell a total of 45,000 dry metric tonnes of gold concentrate through the financial year ending December 31, 2017.

MANAGEMENT’S DISCUSSION and ANALYSIS OF FINANCIAL CONDITION AND RESULTS OF OPERATIONS For the year ended December 31, 2016
15
(in United States dollars, tabular amounts in millions, except where noted)
Debt Revolving Credit Facility In November 2012, the Company entered into a $375.0 million revolving credit facility with a syndicate of banks (“the credit facility”). The credit facility was due to mature on November 23, 2016. In June 2016, the Company amended and restated the existing revolving credit agreement (“the amended and restated credit agreement” or “ARCA”) and reduced the available credit to $250.0 million with the option to increase by an additional $100.0 million through an accordion feature. The maturity date was also extended to June 13, 2020. The ARCA continues to be secured by the shares of SG Resources and Tuprag, wholly owned subsidiaries of the Company. The ARCA contains covenants that restrict, among other things, the ability of the Company to incur aggregate unsecured indebtedness exceeding $850.0 million, incur secured indebtedness exceeding $200.0 million and permitted unsecured indebtedness exceeding $150.0 million. The ARCA also contains restrictions for making distributions in certain circumstances, selling material assets and conducting business other than that which relates to the mining industry. Significant financial covenants include a maximum Net Debt to Earnings before Interest, Taxes, Depreciation and Amortization (“EBITDA”) of 3.5:1 and a minimum EBITDA to Interest of 3:1. The Company is in compliance with these covenants at December 31, 2016. Loan interest is variable dependent on a Net Leverage ratio pricing grid. The Company’s current net leverage ratio is approximately -1.9:1. At this ratio, interest charges and fees are as follows: LIBOR plus margin of 2.0% and undrawn standby fee of 0.50%. Fees of $2.0 million were paid on the amendment dated June 2016. This amount has been deferred as pre-payment for liquidity services and is being amortized to financing costs over the term of the credit facility. As at December 31, 2016, the prepaid loan cost on the balance sheet was $1.8 million. No amounts were drawn down under the ARCA as at December 31, 2016. Senior Notes On December 10, 2012, the Company completed an offering of $600.0 million senior notes ("the notes") at par value, with a coupon rate of 6.125% due December 15, 2020. The notes pay interest semi-annually on June 15 and December 15. The Company received proceeds of $589.5 million from the offering, which is net of the commission payment. The notes are redeemable by the Company in whole or in part, for cash:
a) At any time prior to December 15, 2016 at a redemption price equal to 100% of the aggregate principal amount of the notes at the treasury yield plus 50 basis points, and any accrued and unpaid interest;
b) b) on and after the dates provided below, at the redemption prices, expressed as a percentage of principal amount of the notes to be redeemed, set forth below, plus accrued and unpaid interest on the notes:
December 15, 2016 103.063% December 15, 2017 101.531% 2018 and thereafter 100.000%
The early prepayment prices are to reimburse the lender for lost interest for the remaining term. The fair market value of the notes as at December 31, 2016 is $609.0 million.

MANAGEMENT’S DISCUSSION and ANALYSIS OF FINANCIAL CONDITION AND RESULTS OF OPERATIONS For the year ended December 31, 2016
16
(in United States dollars, tabular amounts in millions, except where noted)
Defined Benefit Plans
The Company operates defined benefit pension plans in Canada with two components: a registered pension plan (“the Canadian Pension Plan”) and a supplementary pension plan (“the SERP”). During the second quarter of 2012, the SERP was converted into a Retirement Compensation Arrangement (“RCA”), a trust account. As it is a trust account, the assets in the account are protected from the Company’s creditors. The RCA requires the Company to remit 50% of any contributions and any realized investment gains to the Receiver General of Canada as refundable tax. These plans, which are only available to certain qualifying employees, provide benefits based on an employee’s years of service and final average earnings at retirement. Annual contributions related to these plans are actuarially determined and made at or in excess of minimum requirements prescribed by legislation. Eldorado’s plans have actuarial valuations performed for funding purposes. The Canadian Pension Plan last had an actuarial valuation performed as of January 1, 2014 for funding purposes with the next required valuation as of January 1, 2017. The SERP’s last valuation was on January 1, 2016 for funding purposes and the next valuation will be prepared in accordance with the terms of the pension plan. The measurement date to determine the pension obligation and assets for accounting purposes was December 31, 2016. The SERP is designed to provide supplementary pension benefits to qualifying employees affected by the maximum pension limits under the Income Tax Act pursuant to the registered Canadian Pension Plan. Further, the Company is not required to pre-fund any benefit obligation under the SERP. Cash contributed to the Canadian Pension Plan and the SERP was $1.7 million (2015 – $2.8 million). Cash payments totaling $0.5 million were made directly to beneficiaries during the year (2015 – $0.1 million). The Company expects to contribute $0.1 million to the Canadian Pension Plan and $1.1 million to the SERP in 2017.
Equity
Common Shares Outstanding
- as of February 23, 2017
- as of December 31, 2016
716,587,134
716,587,134
Share purchase options - as of February 23, 2017 (Weighted average exercise price per share: Cdn$7.04)
34,047,084
Managing Risk This section describes the types of risks we are exposed to and our objectives and policies for managing them (please read the Company’s AIF for additional information). We monitor risk using our risk management review process. Management prepares a risk assessment report every quarter outlining our operational and financial risks. The Board reviews the report to evaluate and assess the risks we are exposed to in various markets, and discusses the steps management takes to manage and mitigate them. Financial Risk Liquidity Risk Liquidity risk is the risk that we cannot meet our financial obligations. The Company mitigates liquidity risk through the implementation of its capital management policy by spreading the maturity dates of

MANAGEMENT’S DISCUSSION and ANALYSIS OF FINANCIAL CONDITION AND RESULTS OF OPERATIONS For the year ended December 31, 2016
17
(in United States dollars, tabular amounts in millions, except where noted)
investments over time, managing its capital expenditures and operational cash flows, and by maintaining adequate lines of credit. We use a rigorous planning, budgeting and forecasting process to help determine the funds we will need to support our ongoing operations and our expansion plans. Management believes that the working capital at December 31, 2016, together with future cash flows from operations and, where appropriate, selected financing sources, is sufficient to support our planned and foreseeable commitments in 2017 and beyond. Credit Risk Credit risk is the risk that the counterparty to a financial instrument will not meet its obligations and will cause the Company to incur a financial loss. The Company limits counterparty risk by entering into business arrangements with high credit-quality counterparties, limiting the amount of exposure to each counterparty and monitoring the financial condition of counterparties. For cash, cash equivalents and accounts receivable, credit risk is represented by the carrying amount on the balance sheet. Payment for metal sales is normally in advance or within fifteen days of shipment depending on the buyer. The historical level of customer defaults is negligible which reduces the credit risk associated with trade receivables at December 31, 2016. We invest our cash and cash equivalents in major financial institutions and in government issuances, according to our short-term investment policy. The credit risk associated with these investments is considered to be low. As at December 31, 2016, we hold a significant amount of cash and cash equivalents with two financial institutions. Currency Risk We sell gold in US dollars, but our costs are mainly in US dollars, Canadian dollars, Turkish lira, Brazilian real, Euros, Romanian lei. An increase in the value of any of these currencies against the US dollar can increase our production costs and capital expenditures, which can affect future cash flows. The Company has a risk management policy that includes hedging its foreign exchange exposure to reduce the risk associated with currency fluctuations. The Company currently does not have any currency hedges, but may hedge in the future. The table below shows our assets and liabilities and debt denominated in currencies other than the US dollar at December 31, 2016. We recognized a loss of $2.7 million on foreign exchange this year, compared to a loss of $15.0 million in 2015.
(thousands)
Canadian dollar
Australian dollar
Euro Turkish lira
Chinese renminbi
Swedish krona
Romanian lei
Great British pound
Brazilian real
Cash and cash equivalents
7,985 461 25,743 2,423 11,799 1,774 11,147 217 22,035
Marketable securities
38,036 - - - - - - - -
Accounts receivable and other
1,694 4 19,045 41,600 3,052 - 6,756 - 8,350
Accounts payable and accrued liabilities
(13,211) (663) (39,138) (38,043) (10,239) - (6,085) - (5,505)
Other non-current liabilities
- - (5,596) (14,741) - - - - -
Net balance 34,504 (198) 54 (8,761) 4,612 1,774 11,818 217 24,880
Equivalent in US dollars
25,697 (143) 57 (2,489) 665 195 2,746 268 7,634

MANAGEMENT’S DISCUSSION and ANALYSIS OF FINANCIAL CONDITION AND RESULTS OF OPERATIONS For the year ended December 31, 2016
18
(in United States dollars, tabular amounts in millions, except where noted)
Accounts receivable and other current and long-term assets relate to goods and services taxes, income taxes, value-added taxes and insurance receivables. Based on the balances at December 31, 2016, a 10% increase/decrease in the exchange rates on that date would have resulted in a decrease/increase of approximately $3.5 million in profit before taxes. Interest Rate Risk Interest rates determine how much interest we pay on our debt, and how much we earn on our cash and cash equivalents, which can affect future cash flows.
All of our debt is in the form of notes with a fixed interest rate of 6.125%. However borrowings under the ARCA are at variable rates of interest and any borrowings would expose the Company to interest rate cost and interest rate risk. In the future we may enter into interest rate swaps that involve the exchange of floating for fixed rate interest payments in order to reduce interest rate volatility. Price Risk Our profitability depends on the price of gold, which can fluctuate widely, and is affected by many factors beyond our control, including the sale or purchase of gold by central banks and financial institutions, interest rates, exchange rates, inflation or deflation, fluctuations in the value of the US dollar and foreign currencies, global and regional supply and demand, speculative actions, and the political and economic conditions of the world’s major gold-producing countries. The cost of production, development and exploration varies depending on the market prices of certain mining consumables, including diesel fuel and electricity. Electricity is regionally priced in Turkey and semi-regulated by the Turkish government, which reduces the risk of price fluctuations. The Company currently does not have any long term gold hedges or other commodity hedges, but we may hedge in the future.
Sensitivity Analysis for Key Variables
A change of Would change our
after-tax net earnings by
Currency values against the US dollar 10% $3.5 million
Price of gold (based on the expectations and assumptions we used in our 2017 outlook)
10% $34.4 million
Interest rate on variable interest debt 10% n/a (1)
Price of diesel fuel 10% $1.5 million (1) The Company did not have any variable interest debt outstanding at the end of 2016.
Other Risks and Uncertainties In addition to the financial risks identified above, we face a number of other risks and uncertainties. Certain key risks are set out below. Geopolitical Climate We operate in five countries outside of North America: Turkey, Brazil, Romania, Serbia and Greece. Our operations in these countries may be subject to political, economic and other risks that may affect our future operations and financial position. We review these and other risks related to the business in foreign countries on an ongoing basis. Such reviews may cause us to re-evaluate and realign our business objectives and strategic direction from time to time, including considering suspension of projects or disposition of certain assets. Mineral Tenure and Permits Acquiring title to mineral properties is a detailed and time-consuming process. We take steps, in accordance with industry standards, to verify and secure legal title to mineral properties that we have, or are seeking, an interest in. Although we take every precaution to ensure that legal title to our properties is

MANAGEMENT’S DISCUSSION and ANALYSIS OF FINANCIAL CONDITION AND RESULTS OF OPERATIONS For the year ended December 31, 2016
19
(in United States dollars, tabular amounts in millions, except where noted)
properly recorded in our name, there can be no assurance we will ultimately secure title on every property. Legal title to our properties depends on the laws in the countries we operate in, and their appropriate and consistent application. Activities in the nature of our business and operations can only be conducted pursuant to a wide range of permits and licenses obtained or renewed in accordance with the relevant laws and regulations in the countries in which we operate. The duration and success of each permitting process are contingent upon many factors that we do not control. In the case of foreign operations, granting of government approvals, permits and licenses is, as a practical matter, subject to the discretion of the applicable governments or government officials There is no assurance that we will be able to obtain or renew the permits we need to conduct our business and operations, in a timely manner, or at all, or that we will be in a position to comply with all conditions that are imposed. The failure to obtain or renew certain permits, or the imposition of extensive conditions upon certain permits, could have a material adverse effect on our business, results of operations, financial condition and share price. Metal Price Volatility The profitability of our operations is significantly affected by changes in gold and other metal prices. Gold and metal prices can fluctuate widely and are influenced by many factors as noted above, beyond our control, If metal prices decline significantly, or decline for an extended period of time, we might not be able to continue our operations, develop our properties, or fulfill our obligations under our permits and licenses, or under our agreements with our partners. This could result in losing our interest in some or all of our properties, or being forced to sell them, which could have a negative effect on our business, results of operations, financial condition and share price. Development and Mining Operations Substantial expenditures are required to build mining and processing facilities for new properties. The capital expenditures and time required to develop new mines are considerable and changes in cost or construction schedules can significantly increase both the time and capital required to build the project. The project development schedules are dependent on obtaining the governmental approvals necessary for the operation of a project, and the timeline to obtain these government approvals is often beyond our control. Mine development projects typically require a number of years and significant expenditures during the development phase before production is possible .It is not unusual in the mining industry for new mining operations to experience unexpected problems during the start-up phase, resulting in delays and requiring more capital than anticipated. The business of gold mining involves many operational risks and hazards. We work to reduce the risks associated with our projects by setting high operational standards, hiring and training appropriately skilled personnel, and making improvements to our operations. We maintain adequate insurance to cover normal business risk. We rely on a number of key employees. Our success depends on attracting and retaining qualified personnel in a competitive labour environment. The cost and results of our exploration and development programs affect our profitability and value. The life of a mine is fixed based on its mineral reserves, so we actively seek to replace and expand our reserves, mainly through exploration, acquisition and the development of our existing operations. Exploring for minerals involves many risks and may not lead to new economically viable mining operations or yield new reserves to replace and expand current reserves. Our reserve estimates are based on certain assumptions and affected by the inherent limitations of the estimation process.

MANAGEMENT’S DISCUSSION and ANALYSIS OF FINANCIAL CONDITION AND RESULTS OF OPERATIONS For the year ended December 31, 2016
20
(in United States dollars, tabular amounts in millions, except where noted)
Foreign Investment and Operations Most of our activities and investments are in foreign countries including operations and / or exploration and development projects in Brazil, Greece, Romania, Serbia and Turkey. These investments are subject to risks normally associated with conducting business in foreign countries. Some risks are more prevalent in less developed countries or those with emerging economies, including: • uncertain political and economic environments; • risks of war, regime changes and civil disturbances or other risks; • risk of adverse changes in laws or policies of particular countries, including government royalties and taxation; • delays in or the inability to obtain necessary government permits, approvals and consents; • limitations on ownership and repatriation of earnings; • foreign exchange controls and currency devaluations; • import and export regulations, including restrictions on exporting gold; and • exposure to occupation of our project sites for political or other purposes. In all jurisdictions where we operate, we are regarded as a foreign entity and consequently we may be subject to greater restrictions and requirements in these jurisdictions. The occurrence of any of these risks could have a material adverse effect on our business, results of operations, financial condition and share price. We review these and other risks related to the business in foreign countries on an ongoing basis. Such reviews may cause us to re-evaluate and realign our business objectives and strategic direction from time to time, including considering suspension of projects or disposition of certain assets. Environment There may be environmental hazards at our mines or projects that we are unaware of. We may be liable for any associated losses, or be forced to do extensive remedial cleanup or pay for governmental remedial cleanup, even if the hazards were caused by previous or existing owners or operators of the property, past or present owners of adjacent properties or by natural conditions. The costs of any cleanup could have a material and adverse effect on our operations and profitability. Laws, Regulations and Permits Our activities are subject to extensive federal, provincial, state and local laws and regulations governing environmental protection and employee health and safety. We must obtain government permits and provide associated financial assurance to conduct certain activities. We are also subject to various conditions related to reclamation that are imposed under federal, state or provincial air, water quality and mine reclamation rules and permits. We have budgeted for future capital and operating expenditures to obtain such permits and maintain compliance with these environmental, health and safety laws, however, any changes to these laws in the future could have an adverse effect on our financial condition, liquidity or results of operations and could delay our ability to obtain such permits. If these laws are not complied with, we may face injunctions, damages and penalties, or our permits could be suspended or revoked. There is no assurance that we have been, or will be, in compliance with environmental, health and safety laws at all times, that our compliance will not be challenged, or that the cost of complying with current or future laws will not have a material and adverse effect on our future cash flow, results of operations and financial condition. Litigation All industries, including the mining industry, are subject to legal claims that are with and without merit. We are currently involved in various routine legal and regulatory proceedings. It’s unlikely that the final outcome of these routine proceedings will have a material and adverse effect on our financial condition or

MANAGEMENT’S DISCUSSION and ANALYSIS OF FINANCIAL CONDITION AND RESULTS OF OPERATIONS For the year ended December 31, 2016
21
(in United States dollars, tabular amounts in millions, except where noted)
results of operations; however, defense and settlement costs can be substantial, even for claims that are without merit. Due to the inherent uncertainty of the litigation process and dealings with regulatory bodies, there is no assurance that any legal or regulatory proceeding will be resolved in a manner that will not have a material and adverse effect on our future cash flow, results of operations or financial condition.
These are not the only risks that could have a material adverse effect on our business, results of operations, financial condition and share price and other risks may become more material to the Company in the future or the above risks could diminish in importance, depending on the current circumstances of our business and operations.
You should carefully review each of the risk factors set out in our most recently filed AIF, which risk factors provide a detailed discussion of the foregoing risks as well as a detailed discussion of other relevant risks. The discussion under “Risk Factors in our Business” in our most recent AIF, filed on SEDAR under our Company name, is incorporated by reference in this document.
Other Information Critical Accounting Policies and Estimates We are required to make estimates that affect the amount of assets, liabilities, contingent liabilities revenue and expenses we report. We have identified the following critical accounting policies and estimates. You can find all of our significant accounting policies in note 3 of our 2016 consolidated financial statements. Inventories We value finished goods (including metal concentrates, dore and iron ore), work-in-process, heap leach ore and stockpiled ore at the average production cost or its net realizable value – whichever is lower. We consider ore stacked on our leach pads and in process at our mines as work-in-process inventory and record their value in earnings, and include them in the cost of sales based on ounces of gold sold, using the following assumptions in our estimates:
the amount of gold we estimate is in the ore stacked on the leach pads the amount of gold we expect to recover from the stacks the amount of gold and other metals in the mill circuits the amount of gold and other metals in concentrates the gold and other metal prices we expect to realize when the gold and other metals is sold.
If our estimates or assumptions are inaccurate, we could be required to write down the value we have recorded on our work-in-process inventories, which would reduce our earnings and working capital. At December 31, 2016, the average cost of inventory was below its net realizable value. Reserves and Resources Our estimates for Kisladag, Efemcukuru, Perama Hill, Tocantinzinho, Skouries, Olympias, Stratoni, Piavitsa, Sapes, Certej and Vila Nova are based on the definitions adopted by the Canadian Institute of Mining, Metallurgy and Petroleum, and in compliance with Canadian National Instrument 43-101 – Standards of Disclosure for Mineral Projects (NI 43-101), developed by the Canadian Securities Administrators.
You will not be able to compare the mineral reserve and resources information in this report with similar information from U.S. companies. The United States Securities & Exchange Commission (SEC) defines a

MANAGEMENT’S DISCUSSION and ANALYSIS OF FINANCIAL CONDITION AND RESULTS OF OPERATIONS For the year ended December 31, 2016
22
(in United States dollars, tabular amounts in millions, except where noted)
mineral reserve as the part of a mineral deposit that can be economically and legally extracted or produced. It does not recognize the terms measured, indicated and inferred mineral resources (mining terms under NI 43-101), and does not accept them in reports and registration statements. You should not assume that:
the mineral reserves defined in this report qualify as reserves under SEC standards the measured and indicated mineral resources in this report will ever be converted to reserves the inferred mineral resources in this report are economically mineable, or will ever be upgraded
to a higher category. Mineral resources which are not mineral reserves do not have demonstrated economic viability.
Value Beyond Proven and Probable Reserves (“VBPP”) On acquisition of a mineral property, we prepare an estimate of the fair value of the exploration potential of that property and record this amount as an asset, called value beyond proven and probable, as at the date of acquisition. As part of our annual business cycle, we prepare estimates of proven and probable reserves for each mineral property. The change in reserves, net of production, is used to determine the amount to be converted from VBPP to proven and probable reserves subject to amortization. Property, Plant and Equipment We depreciate most of our mining properties, plant and equipment using the unit-of-production method, where the value of property is reduced as reserves are depleted. We base this on mining rates and our estimates of reserves. If these change, we could be required to write down the recorded value of our mining properties, plant and equipment, or to increase the amount of future depreciation, depletion and amortization expense, both of which would reduce our earnings and net assets. At each reporting period if there are indicators of an impairment of property, plant and equipment we assess whether there has been impairment. In the event of impairment we would be required to write down the recorded value of our mining properties, plant and equipment, which would reduce our earnings and net assets. For producing properties, we base our assessment on the future net cash flows we expect the property will generate. There may be an impairment if metal prices have declined, production costs have increased, or metal recoveries are lower than previously estimated. For non-producing properties, we base our assessment on whether there are factors that might indicate the need for a write-down. There may be an impairment if we believe current economics or permitting issues will prevent us from recovering the costs we have deferred for the property. Goodwill and Impairment Testing We account for business combinations using the purchase method of accounting. We record the fair market value of assets acquired and liabilities assumed as of the date of acquisition, and record any excess of the purchase price over fair value as goodwill. When the excess is negative it is recognized immediately in income. The assumptions underlying fair value estimates are subject to significant risks and uncertainties. We review and evaluate the carrying amount of goodwill in the fourth quarter of every fiscal year, and when events or changes in circumstances suggest that the carrying amount may not be fully recoverable. Management is required to make a judgment with respect to which CGU’s should be grouped together for goodwill testing purposes, including the assessment of operating segments, the highest level at which goodwill can be tested.

MANAGEMENT’S DISCUSSION and ANALYSIS OF FINANCIAL CONDITION AND RESULTS OF OPERATIONS For the year ended December 31, 2016
23
(in United States dollars, tabular amounts in millions, except where noted)
To test the recoverability of the carrying amount of goodwill we compare the fair value of our cash generating units (“CGU’s”) or operating segments to their carrying amounts. Calculating the estimated fair values of these CGU’s or operating segments requires management to make estimates and assumptions with respect to future production levels, operating and capital costs in our life-of-mine (“LOM”) plans, long-term metal prices, foreign exchange rates and discount rates. Changes in any of the assumptions or estimates used in determining the fair values could impact the impairment analysis. If a CGU’s or operating segment’s carrying value exceeds its fair value, we compare its carrying value to the implied fair value of its goodwill, and charge the amount the carrying value exceeds fair value to operations. Asset Retirement Obligations We estimate the mine closure date, the discount rate, the inflation rate and the timing reclamation costs to determine the carrying value of an asset retirement obligation. Income Taxes We record income taxes using income tax rates we expect to apply in the years we estimate the various temporary differences will be recovered or settled. Where the tax laws and regulations are unclear or subject to varying interpretations, these estimates could change, and materially affect the amount of income tax liabilities recorded at the balance sheet date. Pension Plans We use various actuarial assumptions to estimate our obligations and expenses, including a long-term estimate of the expected rate of return on plan assets, the discount rate, the rate of salary escalation and the average remaining service period of active employees expected to receive benefits.
Upcoming Changes in Accounting Standards The following standards have been published and are mandatory for Eldorado’s annual accounting periods no earlier than January 1, 2018: • IFRS 2 ‘Share-Based Payments’ – In June 2016, the IASB issued final amendments to this standard. IFRS 2 clarifies the classification and measurement of share-based payment transactions. These amendments deal with variations in the final settlement arrangements including: (a) accounting for cash-settled share-based payment transactions that include a performance condition, (b) classification of share-based payment transactions with net settlement features, and (c) accounting for modifications of share-based payment transactions from cash-settled to equity. IFRS 2 is effective for annual reporting periods beginning on or after January 1, 2018, with early adoption permitted. The Company is currently evaluating the extent of the impact of the adoption of this standard.
Key assumptions – pension plans
December 31, 2016 December 31, 2015
Pensionplan SERP
Pension plan SERP
Expected long-term rate of return on plan assets 3.9% 3.9% 4.0% 4.0%
Discount rate beginning of year 3.9% 3.9% 4.0% 4.0%
Discount rate end of year 3.9% 3.9% 4.0% 4.0%
Rate of salary escalation 2.0 2.0 2.0 2.0
Average remaining service period of active employees expected to receive benefits
7.1 years 7.1 years 8.5 years 8.5 years

MANAGEMENT’S DISCUSSION and ANALYSIS OF FINANCIAL CONDITION AND RESULTS OF OPERATIONS For the year ended December 31, 2016
24
(in United States dollars, tabular amounts in millions, except where noted)
• IFRS 9 ‘Financial Instruments’ – This standard was published in July 2014 and replaces the existing guidance in IAS 39, ‘Financial Instruments: Recognition and Measurement’. IFRS 9 includes revised guidance on the classification and measurement of financial instruments, including a new expected credit loss model for calculating impairment on financial assets, and the new general hedge accounting requirements. It also carries forward the guidance on recognition and derecognition of financial instruments from IAS 39. IFRS 9 is effective for annual reporting periods beginning on or after January 1, 2018, with early adoption permitted. The Company is currently evaluating the extent of the impact of the new standard, particularly in the accounting of its long-term receivables and assets available-for-sale. • IFRS 15 ‘Revenue from Contracts with Customers’ – This standard contains a single model that applies to contracts with customers and two approaches to recognising revenue: at a point in time or over time. The model features a contract-based five-step analysis of transactions to determine whether, how much and when revenue is recognized. New estimates and judgmental thresholds have been introduced, which may affect the amount and/or timing of revenue recognized. This standard is effective for annual reporting periods beginning on or after January 1, 2018, with early adoption permitted. The Company is currently evaluating the extent of the impact of the adoption of this standard as some of its gold sales are subject to pricing adjustments. • IFRS 16 ‘Leases’ – This standard was published in January 2016 and replaces the existing guidance in IAS 17, ‘Leases’. IFRS 16 introduces a single accounting model for lessees and for all leases with a term of more than 12 months, unless the underlying asset is of low value. A lessee will be required to recognize a right-of-use asset, representing its right to use the underlying asset, and a lease liability, representing its obligation to make lease payments. The accounting treatment for lessors will remain largely the same as under IAS 17. IFRS 16 is effective for annual reporting periods beginning on or after January 1, 2019, with early adoption permitted. Although it is anticipated for all office building leases to come on balance sheet at the time of adoption, this is not expected to have a significant impact on the Company’s consolidated financial statements. However, the Company continues its evaluation of other leases that might have an impact on its consolidated financial statements with the adoption of this standard. There are other new standards, amendments to standards and interpretations that have been published and are not yet effective. The Company believes they will have no material impact on its consolidated financial statements. Disclosure controls and procedures Disclosure controls and procedures are designed to provide reasonable assurance that material information is gathered and reported to senior management, including the CEO and CFO, as appropriate to allow for timely decisions about public disclosure. Management, including the CEO and CFO, has evaluated the effectiveness of the design and operation of our disclosure controls and procedures as at December 31, 2016, as defined in the rules of the U.S. Securities and Exchange Commission and Canadian Securities Administrators. Based on this evaluation, they concluded that our disclosure controls and procedures are effective in providing reasonable assurance that the information required to be disclosed in reports we filed or submitted under United States and Canadian securities legislation was recorded, processed, summarized and reported within the time periods specified in those rules. Internal controls over financial reporting Management, including the CEO and CFO, is responsible for establishing and maintaining adequate internal control over financial reporting, and used the framework issued by the Committee of Sponsoring Organizations of the Treadway Commission (2013) to evaluate the effectiveness of our controls in 2016. Based on this evaluation, management concluded that our internal control over financial reporting was effective as at December 31, 2016 and provided a reasonable assurance of the reliability of our financial reporting and preparation of the financial statements.

MANAGEMENT’S DISCUSSION and ANALYSIS OF FINANCIAL CONDITION AND RESULTS OF OPERATIONS For the year ended December 31, 2016
25
(in United States dollars, tabular amounts in millions, except where noted)
No matter how well designed; however, any system of internal control has inherent limitations. Even systems determined to be effective can provide only reasonable assurance of the reliability of financial statement preparation and presentation.
KPMG LLP, an independent registered public accounting firm, has audited the effectiveness of internal control over financial reporting, and has expressed their opinion in their report included with our annual consolidated financial statements in Form 40-F.
Changes in internal control over financial reporting There have been no changes in our internal control over financial reporting during the year ended December 31, 2016 that have materially affected, or are reasonably likely to materially affect, our internal control over financial reporting.
Qualified Person Except as otherwise noted, Paul Skayman, P. Eng., the Company’s Chief Operating Officer, is the Qualified Person under NI 43-101 who approved the scientific or technical information contained in this MD&A and has verified the technical data disclosed in this document. Forward-looking information and risks This MD&A includes statements and information about what we expect to happen in the future. When we discuss our strategy, plans, outlook, and future financial and operating performance, price of gold and other commodities, cash costs targets; production and expenditures, our mineral reserve and resource estimates, our proposed exploration, development and acquisitions; our expectations as to future performance at our mines, or other things that have not yet happened in this review, we are making statements considered to be forward-looking information or forward-looking statements under Canadian and United States securities laws. We refer to them in this document as forward-looking information.
Key things to understand about the forward-looking information in this document:
• It typically includes words and phrases about the future, such as: plan, expect, forecast, intend, anticipate, believe, estimate, budget, continue, projected, scheduled, may, could, would, might, will, as well as the negative of these words and phrases.
• Although it represents our current views, which we consider to be reasonable, we can give no assurance that the forward-looking information will prove to be accurate.
• It is based on a number of assumptions, estimates and opinions including things like the future price of gold and other commodities, the political, economic, permitting and legal environment in which we operate, currency exchange rates, anticipated costs and spending, production, mineral reserve and resource estimates and metallurgical recoveries, impact of acquisitions, dispositions, suspensions or delays on our business and our ability to achieve our goals.
• It is also subject to the risks associated with our business, including • volatility of global and local economic climate and geopolitical risk • title, permitting and licensing risks, • gold and other metal price and currency volatility and the impact of any hedging activities, • risks associated with mining operations and development, • risks of operating in foreign countries, • regulatory risks, • actual and estimated production and cost of production, • discrepancies between actual and estimated mineral reserves and resources, • the speculative nature of gold exploration, • acquisition risks, and • other risks that are set out in our Annual Information Form.
If our assumptions prove to be incorrect or the risks materialize, our actual results and events may vary materially from what we currently expect.

MANAGEMENT’S DISCUSSION and ANALYSIS OF FINANCIAL CONDITION AND RESULTS OF OPERATIONS For the year ended December 31, 2016
26
(in United States dollars, tabular amounts in millions, except where noted)
Forward-looking information is designed to help you understand management’s current views of our near and longer term prospects, and it may not be appropriate for other purposes. We will not necessarily update this information unless we are required to by securities laws.
The Company’s operations are subject to a number of risks and other uncertainties, including risks related to the Company’s foreign operations, government, environmental and other regulations and operating costs. Occurrence of various factors and uncertainties of risk cannot be accurately predicted and could cause actual results to differ significantly from our current expectations and result in a material adverse effect on the Company’s operations or profitability. A comprehensive discussion of the Company’s risks and uncertainties is set out in our Annual Information Form dated March 30, 2016. By this reference we hereby incorporate this discussion as a part of this MD&A. The reader is directed to carefully review this discussion for a proper understanding of these risks and uncertainties.