of .,Constrained Optimization. in the .Conceptual Design ... · Use of .,Constrained Optimization....
39
-J NASA Technical Paper 1762 J . . ". . i Use of .,Constrained Optimization. in the .Conceptual Design of- a ' ' Medium-Range. Subsonic Transport - - . Steven M. Sliwa , I . DECEMBER 1980 ' , https://ntrs.nasa.gov/search.jsp?R=19810007524 2018-06-08T08:30:24+00:00Z
Transcript of of .,Constrained Optimization. in the .Conceptual Design ... · Use of .,Constrained Optimization....

- J
NASA Technical Paper 1762 J
. . ". . i
Use of .,Constrained Optimization. in the .Conceptual Design of- a ' '
Medium-Range. Subsonic Transport
- - .
Steven M. Sliwa
, I .
DECEMBER 1980 ' ,
https://ntrs.nasa.gov/search.jsp?R=19810007524 2018-06-08T08:30:24+00:00Z

TECH LIBRARY KAFB, NM
NASA Technical Paper 1762
Use of Constrained Optimization in the Conceptual Design of a Medium-Range Subsonic Transport
Steven M. Sliwa Laqley Research Ceuter Hamnpton, Virginia
National Aeronautics and Space Administration
Scientific and Technical Information Branch
0134878
1980
SUMMARY
Constrained parameter optimization was used to perform the optimal con- ceptual design of a medium-range transport configuration. The impact of choosing a given performance index was studied, and the required income for a 15-percent return-on-investment was proposed as a figure-of-merit. A number of design constants and constraint functions were systematically varied to document the sensitivities of the optimal design to a variety of economic and technological assumptions. A comparison was made for each of the parameter variations between the baseline configuration and the optimally redesigned configuration.
INTRODUCTION
As new technologies are developed for subsonic transport aircraft, they are sometimes evaluated through rudimentary trade studies upon frozen con- figurations. The proposed improvements in technology are sometimes added with only minor alterations based upon the airplane designer's intuition. Perfor- mance gains may be obtained without redesigning the airplane to take advantage of the new technologies. However, it is obvious that such an approach is sub- optimal and may either exaggerate improvements if operational constraints are not properly accounted for or may not yield the maximum potential of the pro- posed technology.
Generally, in studies in which geometric change is allowed to enhance the airplane performance, it too is done in a suboptimal fashion. The geometry is modified to improve subgoals based upon engineering judgment. Some of these modifications might even adversely affect the economic goals of the airline industry which uses the product. Supercritical airfoil technology, for example, could be used to increase cruise Mach number, decrease drag, or decrease structural weight, depending upon how the designer chooses to reconfigure the transport design. These design changes, which are used to take advantage of supercritical aerodynamics, could be beneficial with respect to some measures of performance but are harmful with respect to others.
In addition to needing a systematic approach for evaluating the adoption of new technologies or the impact of economic factors upon airplane design, an automated procedure is required to obtain reasonable turnaround time coupled with improved accuracy. The approach used in this report is that of con- strained parameter optimization. A performance index is minimized in the presence of operational, performance, regulatory, and flying-qualities con- straints. This procedure optimizes the aircraft configuration for a given set of independent design parameters, provided the aircraft operation has been properly modeled and is consistent with the level of accuracy desired in pre- liminary design.

Direct optimization techniques have been used for airplane design wi th varying degrees of success i n previous studies (for example, refs. 1 t o 3 ) . However, many of these uses suffered from some of t h e following: inappro- priate choice of performance indices; inadequate set of independent design variables; inaccurate model of the airplane and its environment: and exclusion of important operational constraints. Furthermore, despite the growing com- putational capabili t ies i n industry, there has been reluctance to adopt and expand such direct optimization procedures as a resul t of numerical convergence problems. If the airplane design problem is properly posed, numerical optimi- zation techniques could potentially be an efficient tool for performing con- ceptual design studies, for example, evaluation of the application of new technologies.
A number of new technologies to augment the performance of transport air- planes have been proposed and are being developed for potential use by industry. I n order to assess the potential benefits of u t i l i z i n g these new technologies, a computer program was developed as a preliminary design tool for transports ( ref . 4 ) . The computer program has been used to perform a sensi t ivi ty analysis of relaxed-static-stabil i ty augmentation systems, and to perform an analysis of the impact of choosing unaugmented longitudinal-flying-qualities design c r i t e r i a upon the performance and configuration of a medium-range transport ( refs . 5 and 6 ) . The resul ts from using t h i s computer program, Optimal Pre- liminary Design of Transports (OPDOT), to study the impact of selecting per- formance indices and imposing constraints upon the design of a transport are reported i n t h i s paper.
The choice of performance index, the parameter about which the configura- tion is optimized, has a significant bearing upon the effectiveness of the a i r - craf t to accomplish its mission. Typically, however, the a i rcraf t is much m r e sensitive to t h e constraints that are imposed upon the performance, configura- tion, and operation. I t is important to ascer ta in these sensi t ivi t ies because many of the mission-related constraints and constants have t radi t ional ly been chosen by the designer or the airline i n a heuristic fashion. For instance, stage length and passenger capacity are examples of marketing decisions that the manufacturer or the a i r l ines m u s t make. Valuable information about the relative trade-offs of these decisions could be obtained i n an e f f ic ien t way from constrained numerical optimization. I n the present study, a computer pro- gram was used to perform such a s tudy for a medium-range transport w i t h a fuel- e f f ic ien t mission profile similar to the one to which the next generation of jet transports is expected to adhere.
SYMBOLS AND ABBREVIATIONS
ARt
A%
a
B
horizontal-tail aspect ratio, (Tail span) 2/St
wing-trapezoidal aspect ratio, (Wing span) 2/Sw
speed of sound, km/hr M(L/D) a
Breguet range factor , km, B = , . .
TSFC
2

CAS
CD
CL
Cm, o
CMS
c.g.
D
df
DOC
DOC'
FS
g
hcr
I
Ireq
1
Ireq
I1
Ir eq
IOC
J
k
L
Rf
L/D
LFL
aircraft purchase price, 1980 U.S. dollars
drag coefficient, D/qS
lift coefficient, L/qS
pitching moment coefficient at zero lift
aircraft maintenance cost per block hour, 1980 U.S. dollars
center of gravity
drag, N
fuselage diameter, m
direct operating cost per block hour, 1980 U.S. dollars
direct operating cost per flight, 1980 U.S. dollars
fuel price, 1980 dollars/liter (dollars/gallon)
acceleration due to gravity, 9.8 m/sec2
cruise altitude, m
income per block hour, 1980 U.S. dollars
income required per flight for an annual return-on-investment of 15 percent, 1980 U.S. dollars
income required per kilometer for annual return-on-investment of 15 percent, 1980 U.S. dollars
income required per seat-flight for annual return-on-investment of 15 percent, 1980 U.S. dollars
indirect operating cost per block hour, 1980 U.S. dollars
unaugmented performance index
conversion factor from annual income to per flight income, k = l/Number of flights per year
lift, N
fuselage length, m
airplane aerodynamic efficiency, CL/CD
landing field length, m
3

cruise Mach number M
MAC
MLA
n
ANG
OPDOT
P
9
R
ROI
S
St
SW
SM
T
t/c
TOFL
TSFC
tx
U
mean aerodynamic chord, m
maneuver load alleviation
seating capacity
margin in center-of-gravity between aft center-of-gravity limit and landing gear position to insure sufficient nose gear steering, percent MAC
computer program, Optimal Preliminary Design of Transports
parameter held constant during design optimization
f ree-stream dynamic pressure , N/m2
design range, km
annual return-on-investment, percent
lifting surface area, m2
horizontal-tail area, m2
wing area, m2
static margin, percent MAC
installed thrust, N
wing thickness ratio, Maximum wing-section thickness/Wing-section chord
balanced take-off field length, m
thrust specific fuel consumption, Fuel weight per unit time/Thrust force
annual tax rate
annual utilization, block hours per year
volume for passenger seating, m3
weight overrun in a given component, N
gross take-off weight for design mission, N
aftmost center-of-gravity position, percent MAC
landing gear position, percent MAC

OF .fuel efficiency, seat-kilometers per liter
h wing sweep, deg
x wing taper ratio
Subscripts:
a approach
av available
cg center-of-gravity
cr cruise
f fuselage
F fuel
b3 landing gear
max max imum
req required
t tail
to ta ke-of f
W wing
A bar over a symbol denotes a normalized value. A superscript asterisk denotes the optimum value of a quantity.
METHOD OF CALCULATION
The general optimization scheme for OPDOT (ref. 4 ) is shown in figure 1. Nominal values for a set of independent design variables are used as input along with the required design constants for specifying nonvarying geometries, mission economic factors, mission profile data, and the nonlinear aerodynamic terms. The 12 independent design variables chosen for this study are shown in table I along with the allowable ranges which act as side constraints that are applied directly to the design state. The major wing planform parameters - wing area, wing aspect ratio, wing taper ratio, wing thickness ratio, Mach number, and wing sweep angle - were chosen to be degrees of freedom and were expected to have the most impact upon the design. Tail sizing was accomplished by including tail area, tail aspect ratio, and center-of-gravity position as independent design variables, which were expected to have only a small impact upon the transport
5

s i z i n g . L a s t l y , f u s e l a g e l e n g t h , f u s e l a g e diameter, a n d i n s t a l l e d t h r u s t were kept as independen t des ign va r i ab le s to m a t c h t h e a i r p l a n e s i z e to t h e m i s s i o n and wing planform.
The set o f i ndependen t des ign va r i ab le s are incremented by t h e o p t i m i z e r logic i n a n attempt to improve t h e d e s i g n . The performance index (parameter to be op t imized) is determined from the independent des ign var iab les and in for - mat ion from the da t a base . Th i s i ndex is s e l e c t e d from a list of possible per- formance indices . The performance indices which were cons ide red are l i s t e d i n t a b l e I.
The c o n s t r a i n t f u n c t i o n s , i n v o l v i n g i n e q u a l i t y r e l a t i o n s h i p s , r e p r e s e n t o p e r a t i o n a l , f l y i n g - q u a l i t i e s , a n d p e r f o r m a n c e c o n s t r a i n t s a n d are based upon c e r t i f i c a t i o n r e g u l a t i o n s , m i s s i o n d e f i n i t i o n , or common s e n s e . C o n s t r a i n t s are i n t e g r a t e d i n t o t h e o p t i m i z a t i o n process by adding a p e n a l t y to t h e pe r fo rmance i ndex fo r each cons t r a in t v io l a t ion . Each pena l ty term is propor- t i o n a l to t h e square of t h e v i o l a t i o n times a weight ing factor. The perfor- mance index p l u s t h e s e p e n a l t y terms form what is c a l l e d a n augmented perfor- mance f u n c t i o n . I f t h e w e i g h t i n g factor is s u f f i c i e n t l y l a r g e , m i n i m i z i n g t h e augmented performance function is e q u i v a l e n t to f i n d i n g t h e minimum performance i n d e x w h i l e s a t i s f y i n g a l l t h e c o n s t r a i n t s . When it is d e s i r a b l e to maximize the per formance index rl~, ROI, or (L/D)max, the op t imiza t ion problem is conver ted to a minimization problem by c h a n g i n g t h e s i g n . C o n s t r a i n t s t h a t are n e a r l y v i o l a t e d a t a s o l u t i o n p o i n t are i d e n t i f i e d as a c t i v e .
The numer i ca l op t imiza t ion l og ic wh ich i t e r a t e s t he i ndependen t des ign v a r i a b l e s to minimize the augmented function is a s u b j e c t o f i n t e n s e r e s e a r c h i n n e a r l y a l l f i e l d s o f e n g i n e e r i n g . S u r v e y s i n c l u d i n g a v a r i e t y of g r a d i e n t methods t h a t may b e a p p l i c a b l e to a i r p l a n e d e s i g n are i n c l u d e d i n r e f e r e n c e s 1 and 7. A d e s c r i p t i o n of a f eas ib l e d i r ec t ion / sea rch me thod coup led w i th a g r a d i e n t method for t h e f i n a l s t a g e is c o n t a i n e d i n r e f e r e n c e 8. The p rev ious s tud ie s and t he au tho r ' s expe r i ence i nd ica t e t ha t t hese me thods su f f e red from n u m e r i c a l d i f f i c u l t i e s when a n a l y t i c a l e q u a t i o n s were n o t a v a i l a b l e to p rov ide t h e g r a d i e n t s and a l s o f r o m i n i t i a l i z a t i o n p r o b l e m s when t h e number o f a c t i v e c o n s t r a i n t s was l a r g e w i t h r e s p e c t to t h e number of independent des ign var i - a b l e s . When a i r c r a f t d e s i g n is posed as a numer ica l op t imiza t ion problem, it is common to lack a n a l y t i c a l g r a d i e n t s and an i n i t i a l l y f e a s i b l e s o l u t i o n .
A d i rec t s equen t i a l s ea rch s implex a lgo r i thm, wh ich is e x p l a i n e d a n d i l l u s - t r a t e d i n r e f e r e n c e s 9 and 10 , was u t i l i z e d to o v e r c o m e t h e s e d i f f i c u l t i e s . It is e x t r e m e l y r e l i a b l e a n d r o b u s t i n terms of c o n v e r g e n c e , a l b e i t it s u f f e r s from slow convergence i n r eg ions of the i ndependen t des ign va r i ab le s w i th l o w gra- d i e n t s of the performance index. I t can be argued that computer resources are much cheaper than the manpower r equ i r ed to s u p e r v i s e o t h e r more e f f i c i e n t a l g o - r i thms which need f requent ad jus tments to i n s u r e proper convergence. Therefore , t h e r o b u s t n e s s a n d r e l i a b i l i t y o f t h e s i m p l e x a l g o r i t h m make it a h i g h l y d e s i r - a b l e o n e to use.
Dur ing t he i t e r a t ion , t he op t imize r rou t ine wh ich con ta ins t he s equen t i a l s imp lex a lgo r i thm sends t he va lues o f t he i ndependen t des ign va r i ab le s and t he d e s i g n c o n s t a n t s to the pe r fo rmance func t ion eva lua t ion rou t ines . A schemat ic
6

representation of the calling sequence for'the performance index evaluation routines is shown in figure 2.
Airplane weight was estimated by simulating the design mission and repeat- ing it until the hypothesized gross take-off weight at the beginning of a weight iteration was within k0.22 N of the sum of the individual airplane component weights, the payload, and the fuel weight. Industry statistics for the air- plane component weights came from references 11 to 1 4 and were functions of all the independent design variables, the gross take-off weight, and about 20 of the design constants input through the data base. The fuel weight was calculated by summing estimates of the following mission segments: (1 ) taxi; ( 2 ) take-off and climb; ( 3 ) cruise; (4 ) descent; (5) taxi; and (6) reserve.
The mission profile as modeled is shown in figure 3 . It consists pri- marily of a multiple-step cruise/climb approximation to an optimal fuel pro- file. The cruise portion is broken into 1 0 equally spaced segments, and Breguet-type relationships are used for calculating the amount of fuel burned during each segment (ref. 11). Comparisons with optimum, continuous-flight profiles (ref. 15) show differences of less than 5 percent.
Parasite drag was calculated from a component buildup including compres- sibility and Reynolds number effects using references 11 and 14 to 17. Cal- culations of stability and control derivatives were typical of those used in preliminary design (refs. 18 and 19) and included empirical adjustments from aerodynamic wind-tunnel and flight data (refs. 20 to 24) for compressibility, elasticity, and the use of supercritical airfoil sections. Induced drag was estimated using nonlinear corrections to parabolic drag polars for airfoil- section camber (ref. 25) and by adding terms for the tail induced drag and wing-tail interference drag (ref. 26). An iterative, nonlinear trim routine was used for determining the wing and tail loads in both cruise and approach phases of flight.
The cost data were approximated from industry statistics for manufacturing, maintenance, and the other components of direct operating costs as well as the indirect operating costs (refs. 11, 13, and 27 to 30). The direct operating cost is an augmented form of the industry standard, and it includes the fol- lowing: maintenance, depreciation, delay, crew, flight attendant, control, support, spares, insurance, landing fee, and fuel. Indirect operating cost is composed of the following elements: maintenance burden, food, movies, pas- senger insurance, miscellaneous passenger expenses, advertising, sales com- missions, reservations, passenger handling, baggage handling, cargo handling, and servicing. A simple return-on-investment is calculated in the following manner :
r 1
I I - Doc - Ioc ROI = (1 - tx)"/ x 100
Hourly income, I, minus direct and indirect operating costs, DOC and IOC, is the profit per hour. Determining the after-taxes profit using tx as the
7

tax rate and multiplying by the annual utilization, U, and then dividing by the airplane purchase price minus the 10-percent investment tax credit, 0.9CA$, yield the annual return-on-investment.
Additionally, another economic performance index considered in the present study is the income required per flight for a 15-percent return-on-investment Ireq- It basically involves solving for I in equation (1) and converting to a per flight basis as follows:
(0.01) + D O C + I O C k
(1 - tx)U 1 where k is a conversion factor from annual income to per flight income.
To provide a basis for performing the trade studies, a baseline mission was chosen. Table I1 lists the design constants chosen for the baseline mission that were used along with the indicated ranges of independent design variables and constraint functions which are listed in table I.
RESULTS AND DISCUSSION
Program Validation
The key feature of this method of airplane conceptual design is that an optimizer is used in conjunction with an analysis tool. This analysis tool accepts as input a set of independent design variables, usually airplane geom- etries or key mission variables, and some design constants, and then the tool returns as output a performance index in addition to a set of violated con- straints. The optimizer will iterate the independent design variables until a convergence criterion is satisfied. Hence, the accuracy of a design study per- formed using this method is primarily a function of the accuracy of the analysis code. It is expected that sections of computer code for evaluation of the per- formance index and constraint function can always be enhanced to improve the model of the relationships between the design variables and the airplane operating environment. Although this report is meant to be primarily an illus- tration of an approach for implementing constrained optimization into airplane design and a demonstration of the potential flexibility that it affords, it may be useful to consider the accuracy of the model used in the analysis section of the computer program used herein.
The prime advantages OPDOT has over other optimizations for airplane design are that it ( 1 ) includes airplane geometric parameters (e.g., wing and tail planform) as independent design variables; (2) has a moderately extensive set of industry statistics for weight and economics; ( 3 ) contains a fairly complete representation of the drag aerodynamics and engine performance; ( 4 ) generates stability and control derivatives for flying-quality analyses; ( 5 ) includes a model for the interference effects between the wing and tail; (6) iterates non- linear force and moment equations to satisfy longitudinal trim requirements;
8

and (7 ) c o n t a i n s a set of equat ions o f mot ion for both performance and f lying q u a l i t y a n a l y s i s . The key l i m i t a t i o n i n p r e c i s i o n is p r o b a b l y t h e i n d u s t r y s ta t is t ical r e l a t i o n s h i p s i n ( 2 ) above which are expec ted to be a c c u r a t e w i t h i n about 10 pe rcen t . However, s i n c e t h e p r i m a r y u s e of t h i s d e s i g n tool is t h e
, . comparison of c o n f i g u r a t i o n s r e s u l t i n g from v a r y i n g t h e m i s s i o n d e f i n i t i o n s , d e s i g n c o n s t r a i n t s , or l e v e l s of t echno logy , r e l a t ive t r ade -o f f s and t r ends are more i m p o r t a n t t h a n t h e a b s o l u t e p r e c i s i o n of predic t ing the per formance index .
Miss ion and des ign var iab les for a popular medium-range t r i j e t des igned i n t h e e a r l y . 1 9 6 0 ' ~ were i n p u t to t h e a n a l y s i s s e c t i o n of the computer code w i t h o u t t h e o p t i m i z e r a t t a c h e d as a means of p a r t i a l l y v e r i f y i n g t h e p r o g r a m accuracy. Although some levels of t echno logy ( e .g . , supe rc r i t i ca l aero- dynamics) and the fue l -e f , f ic ien t miss ion prof i le implied i n OPDOT d i f f e r e d s i g n i f i c a n t l y from t h e c o n v e n t i o n a l t r i j e t , good agreement was ob ta ined for some of the key parameters t h a t were computed. Each of the component weights was wi th in 1 8 p e r c e n t of t h e actual. The o v e r a l l w e i g h t was w i t h i n 1 2 p e r c e n t , t h e f u e l b u r n was w i t h i n 9 percent , and ra t ios of f u e l weight and payload to g r o s s take-off weight were w i t h i n 5 p e r c e n t of actual. A d d i t i o n a l l y , a com- p a r i s o n o f t h e d i rec t o p e r a t i n g cost componen t s w i th one a i r l i ne ' s estimates showed t h a t OPDOT was w i t h i n 4 to 1 8 p e r c e n t o f t h e a c t u a l v a l u e s . T h e s e numbers a r e c o n s i d e r e d to be good for concep tua l t r anspor t des ign .
I n a n e f f o r t to v a l i d a t e t h e o v e r a l l o p t i m i z a t i o n as being a useful model of the p re l imina ry des ign p rocess , t he mi s s ion and des ign cons t ra in ts f rom the b a s e l i n e c o n f i g u r a t i o n o f a s t u d y o f t h e a p p l i c a t i o n o f a c t i v e c o n t r o l s to a modern t r a n s p o r t (ref. 31 ) were i n p u t i n t o OPDOT. Af te r pe r fo rming t he opti- miza t ion , t he i ndependen t des ign va r i ab le s ag reed w i th in 5 to 1 5 p e r c e n t of the p red ic t ions f rom the , p re l imina ry des ign s tudy reported i n r e f e r e n c e 31. Individual weight components were wi th in 1 2 p e r c e n t , t h e cost and f u e l components were w i t h i n 10 percent , and t h e ratios o f f u e l to g ross t ake -o f f weight and payload to gross t ake-of f weight were wi th in 5 p e r c e n t o f t h e es t imates f rom re ference 31. A l b e i t c e r t a i n areas of improvement can be i d e n t i f i e d f o r t h e models con ta ined w i th in OPDOT, the p receding compar isons tend t o i n d i c a t e t h a t enough of the aspec ts o f the p re l iminary des ign problem have been modeled to y i e l d v a l u a b l e i n s i g h t s d u r i n g t r a d e s t u d i e s a t t h e con- c e p t u a l d e s i g n l e v e l .
Pe r fo rmance Index Sens i t i v i ty
Choosing an index for the op t imiza t ion has r ece ived some a t t e n t i o n i n past p re l imina ry des ign s tud ie s , fo r example , r e f e rences 1 and 32 to 36. It is a complex i s sue s ince the func t ion should be real and s ing le-va lued in order for t h e o p t i m i z a t i o n process to be app l i cab le . T ry ing to develop a c r i t e r i o n a r t i f i c i a l l y t h a t e n c o m p a s s e s many ob jec t ives t h rough a we igh ted a lgeb ra i c sum- mation adds to t h e c o m p l e x i t y , a n d t h e a r b i t r a r y n a t u r e of choosing weights d e t r a c t s from t h e g e n e r a l a p p l i c a b i l i t y of t h e r e s u l t s . C l a s s i c a l l y , w e i g h t and/or drag were minimized during design trade s t u d i e s . b r e r e c e n t l y , i n s y s t e m s s t u d i e s , d i r e c t o p e r a t i n g cost and fue l u sage have become t h e most impor tan t cri teria. I t is o b v i o u s t h a t f r o m t h e s t a n d p o i n t o f p r o d u c t market- i n g , i f a r e l i a b l e economic factor could be estimated i n a reasonably unambig-
9

uous sense w i t h regard to actual airplane operation, it would be preferable to an intermediate airplane performance result .
Return-on-investment ROI has been generally regarded as the richest of the available economic variables (ref. 32). Direct operating cost suffers from an ambiguity i n that the methods of calculation adhere to no universally accepted standard a t the present time. A s previously discussed, an augmented version of a standard industry model is used i n the present paper. However, there remains the issue of which method represents the proper breakdown of direct operating costs and indirect operating costs. Because of the complete accounting of a l l costs, ROI avoids t h i s issue and is, therefore, thought to be a more desirable index for the purposes of the present paper. Unfortunately, some problems remain unresolved even when ROI is used as a performance index.
A fundamental problem i n u s i n g annual return-on-investment is trying to determine the income term for equation (1). I t requires predicting the impact of price and t r a f f i c growth upon supply and demand. The assumption that trying to maximize a i r l i n e ROI is equivalent to optimizing the transport manufacturer's p rof i tab i l i ty is typically used and is rel ied upon i n t h i s analysis. Even so, major complaints about using a i r l i n e ROI are that it requires modeling income, which is different for each city-pair and each a i r l i ne ; and, it requires air- l ine income s t a t i s t i c s as a function of the important design parameters which are not readily available to the designer. Since a major portion of ROI is the income generated by the transport airplane, the simple formulas used for estimating t h i s i n the past tended to negate t h e accuracy of the rest of the analysis. It has been shown that relatively minor modifications to t h e assump- tions used for developing the income resu l t i n s ignif icant ly different implica- tions during trade studies (ref. 3 4 ) .
I n t h i s paper a performance index which has not previously been considered i n optimizations is proposed as a means of a l leviat ing some of the adverse effects of assuming an income model. Although t h i s index is s t r ic t ly cos t - derived, it should s t i l l give to the designer an economically rich, single- valued parameter which can be used to market the probable economic success of a given configuration to the airlines. The income required per fl ight for a 15-percent annual return-on-investment Ireq is chosen as t h i s figure-of-merit. It is comprised ent i re ly of the cost elements of ROI and is equivalent to the per f l i gh t income required to exceed the predicted costs by enough margin to realize the 1 5 percent ROI.
Specifically, u s i n g Ireq as the performance index eli.minates the need to assume a passenger load factor and an average income per seat-kilometer for the mission range, as is required for computing R O I . Additionally, using Ireq negates the necessity of assuming breakdown of income sources from the payload, i . e . , f i r s t c l a s s , economy class , and cargo. Its prime advantage then is that it eliminates the designer's need to develop a comprehensive income model for each a i r l i ne and yet has the same design sens i t iv i t ies tha t would be required to optimize the airline's profitability. Since the value of Ireq can be returned for a number of design and economic ranges, it can be easi ly adapted to specific city-pairs, multiple stage lengths, or average missions.
10

I
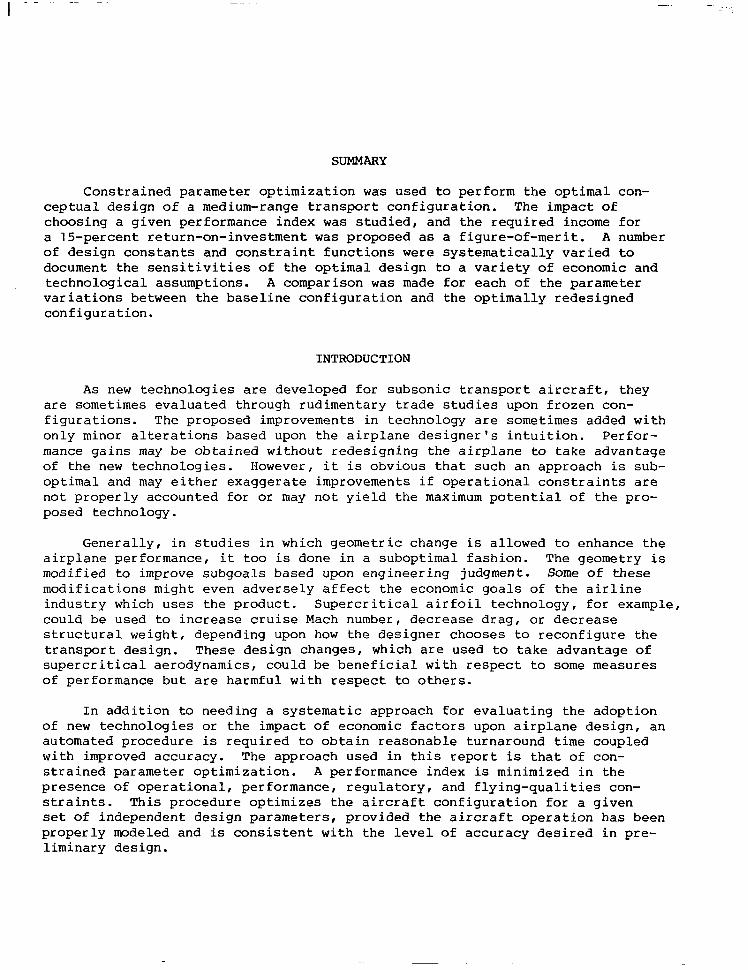
The r e s u l t s of pe r fo rming t he op t imiza t ion u s ing t he base l ine mi s s ion and c o n s t r a i n t s for each of t h e p e r f o r m a n c e i n d i c e s c u r r e n t l y a v a i l a b l e i n OPDOT are g i v e n i n table 111. A c h a r t w i t h t h e e n g i n e e r i n g u n i t s of table I11 conver t ed to pe rcen t deg rada t ion w i th respect to t h e optimum v a l u e o b t a i n e d f o r e a c h i n d e x is shown as table IV. Optimizing to maximum aerodynamic e f f ic iency (L/D)nax resu l ted in an ex t remely heavy and impractical c o n f i g u r a t i o n when compared with op t imiz ing to other performance indices . Opt imizing to (L/D)max is i n f e r i o r i n terms of economic considerat ions.
S i n c e t h e p r i m a r y v a r i a b l e i n t h e cost r e l a t i o n s is ope ra t ing we igh t , op t imiz ing to a minimum purchase price and a minimum take-off weight induced n e a r l y i d e n t i c a l c o n f i g u r a t i o n s w i t h r e l a t i v e l y l o w wing aspect ra t ios and wing sweep angles . Given the small d i f f e r e n c e s i n tables 111 and IV between optimiz- i ng to direct o p e r a t i n g cost per block hour , direct o p e r a t i n g cost per f l i g h t , re turn-on-investment , and the incoine required per f l i g h t for a 15-percent annual re turn-on-investment , it c o u l d b e i n f e r r e d t h a t Ireq would be a good compro- mise because it is as good as t h e o t h e r i n d i c e s w h i l e a t t h e saxe time, it s o l v e s some of the p rev ious ly ment ioned probiems. Addi t iona l ly , convergence of the computer program was as good or b e t t e r for Ireq than for t h e o t h e r per- fo rmance i nd ices , i nd ica t ing t ha t i ts use enhances robustness .
Although t rends similar to t h o s e o b s e r v e d i n r e f e r e n c e 33 are shown, t h e r e e x i s t s i g n i f i c a n t d i f f e r e n c e s . For example, there were unusual resu l t s i n t h a t p a p e r f o r t h e cases i n which the des ign was opt imized to noneconomical ly der ived per formance ind ices . In those cases, it is p r o b a b l e t h a t t h e r e g r e s s i o n a n a l y - sis which was u t i l i z e d b r o k e down or was good o n l y i n a ne ighborhood of the nominal des ign po in t . Typica l ly , when approximations t o cons t r a ined op t imiza - t i o n are u s e d f o r a i r p l a n e d e s i g n , c o n s t r a i n t s are no longer on the boundar ies and may b e v i o l a t e d . I n f a c t , many o f t h e n o n l i n e a r i n t e r a c t i o n s are n o t modeled when pe r tu rba t ions f rom the nomina l become la rge . This would expla in t h e l a r g e departure from t h e expec ted resu l t s e x h i b i t e d by t h e c o n f i g u r a t i o n s of r e f e r e n c e 11 which were opt imized for fuel weight and take-off weight. Such p r o b l e m s i l l u s t r a t e t h e a d v a n t a g e of u s i n g d i r e c t o p t i m i z a t i o n to f i n d a more accurate r e p r e s e n t a t i o n of t h e compromises and t rade-of fs requi red dur ing o p t i m a l a i r c r a f t d e s i g n .
E s s e n t i a l l y a l l o p t i m i z a t i o n s i n t a b l e 111, w i t h t h e e x c e p t i o n o f t h e (L/D)* case, have the same set o f a c t i v e c o n s t r a i n t s . The f o l l o w i n g c o n s t r a i n t f u n c t i o n s were a c t i v e a t t h e s o l u t i o n s : s u f f i c i e n t t h r u s t i n cruise, s u f f i c i e n t f r i c t i o n for n o s e w h e e l s t e e r i n g , s u f f i c i e n t c a b i n volume f o r p a s s e n g e r s , s t a t i c margin of 5 p e r c e n t or more in app roach a t a f t c e n t e r - o f - g r a v i t y limit, and adequa te e l eva to r power to uns t i ck t he nose gea r prior to l i f t - o f f . A d d i t i o n - a l l y , t h e f o l l o w i n g s i d e c o n s t r a i n t s upon the i ndependen t des ign va r i ab le s were a c t i v e : Mach number g r e a t e r t h a n or e q u a l to 0.8, and wing thickness r a t io less than or e q u a l to 0.14. The on ly excep t ion was t h e case for maximum L/D, which o p t e d f o r t h e t h i n n e s t wing possible (t/c = 0.09) and went to t h e smallest d i ame te r fu se l age coup led w i th t he l onges t l eng th fu se l age poss ib l e . I t a lso converged upon the maximum allowable t rapezoidal-wing aspect ratio, 14. These unreasonable va lues for t h e i n d e p e n d e n t d e s i g n v a r i a b l e s i l l u s t r a t e t h e imprac- t i c a l i t y of u s i n g t h i s i n t e r m e d i a t e p e r f o r m a n c e v a r i a b l e as a f igure-of -mer i t (performance index) for cons t r a ined op t imiza t ion .
11

A set o f d e s i g n cases were also c o n s i d e r e d w i t h t h e lower Mach number con- s t r a i n t r e d u c e d to 0.6. A l l b u t t h r e e d e s i g n cases immediately converged to t h i s Mach number. Direct o p e r a t i n g cost per f l i g h t c o n v e r g e d to a Mach number of 0 .65, the speed a t which wing c o m p r e s s i b i l i t y e f f e c t s became s i g n i f i c a n t w i t h t h e minimum a l l o w a b l e sweep a n g l e (loo). Return-on-investment and the income r e q u i r e d p e r f l i g h t f o r a 15-percent annual return-on-investment tend to con- verge a t a Mach number o f n e a r l y 0.7, which corresponds to t h e maximum speed w i t h o u t c o m p r e s s i b i l i t y e f f e c t s f o r a low sweep angle of 15O. Apparently, some compromise i n s t ruc tura l weight was warran ted to enhance p roduc t iv i ty based upon the economic assumpt ions o f the per formance func t ion .
T h i s e x p e r i e n c e i n d i c a t e s t h a t t h e p r o p o s e d f i g u r e - o f - m e r i t IrFq, t h e income per f l i g h t r e q u i r e d to g e n e r a t e a 15-percent R O I , h a s t h e deslrable p r o p e r t i e s f o r u s e i n c o n s t r a i n e d o p t i m i z a t i o n . The index Ireq was robust i n terms of convergence; it was s e n s i t i v e to t h e key independent des ign var iab les ; and it appeared to be an excel lent economic compromise between the other eco- nomic ind ices . Poss ib ly , t he 15 -pe rcen t s t anda rd for t h e R O I is open to deba te as be ing inappropr ia te , espec ia l ly in today ' s economic envi ronment . However, a t t h e c o n c e p t u a l d e s i g n l e v e l , t h e absolute magnitude of a p a r t i c u l a r r u n is not of pr ime importance. The s i g n i f i c a n t f a c t o r s are t h e r e l a t i v e c o m p a r i s o n s du r ing trade s t u d i e s . A l i m i t e d number of cases us ing Ireq f o r t h e p e r f o r - mance index were r u n w i t h d i f f e r e n t l e v e l s o f required R O I , and approximately t h e same v a l u e s f o r t h e optimum independen t des ign va r i ab le s were ob ta ined . For th i s r ea son and t he ones men t ioned p rev ious ly , Ireq is assumed to be a v i a b l e and use fu l pa rame te r fo r a performance index, no matter wha t l eve l of R O I is r e q u i r e d .
S e n s i t i v i t y to Parameter V a r i a t i o n s
A s a means o f i l l u s t r a t i n g t h e ease with which a trade s tudy can be per - formed wi th d i rec t op t imiza t ion and to g a i n some i n s i g h t i n t o t h e i m p a c t o f choos ing cons t r a in t s , de f in ing mi s s ions , and dec id ing upon t e c h n o l o g y l e v e l s , a p a r a m e t e r s e n s i t i v i t y s t u d y was pe r fo rmed fo r t he base l ine mi s s ion . Table V is a compi l a t ion o f ra tes of change of performance index from a series o f o p t i m i z a t i o n s u s i n g v a r i a t i o n s i n s e v e r a l d e s i g n c o n s t a n t s a n d c o n s t r a i n t f u n c - t ions. Approximately 5- a n d 1 0 - p e r c e n t v a r i a t i o n s i n a p a r a m e t e r o r c o n s t r a i n t were made; and rates of change were calculated, numerical ly normalized, and a v e r a g e d f o r d i r e c t o p e r a t i n g cost per b lock hour and income per f l igh t requi red f o r a 15-percent ROI. The s e n s i t i v i t y ra t ios were c a l c u l a t e d by t h e f o l l o w i n g q u a t i on :
12

The numbers i n t a b l e V were g e n e r a t e d f r o m t h e o p t i m i z a t i o n s w i t h t h e f u l l set of 12 i n d e p e n d e n t d e s i g n v a r i a b l e s p r e v i o u s l y d e f i n e d , w i t h a weak conver- gence c r i t e r ion , and w i th on ly one res tar t . Restarts are a u x i l i a r y calls to t h e o p t i m i z e r w i t h a new i n i t i a l g u e s s f o r t h e i n d e p e n d e n t d e s i g n v a r i a b l e s and are necessa ry to i n s u r e t h a t a g l o b a l minimum has been found. Hence, the results are thought to be on ly r ep resen ta t ive o f t he o rde r o f magn i tude o f r e l a t i v e s e n s i t i v i t i e s . I n u s i n g t h i s t a b l e , t h e reader should be wary tha t t h e u n i t s f o r DOC are d o l l a r s per block hour, which is a popular way of report- i n g t h e s e r e s u l t s , w h i l e Ireq h a s u n i t s of d o l l a r s per f l i g h t , which is proposed as a more realist ic way o f p r e s e n t i n g t h e d a t a . I n terms of p e r c e n t of parameter c h a n g e , t h e s e n s i t i v i t i e s are g r e a t e s t for p e r c e n t v a r i a t i o n s i n Mach number , we igh t i nc rease , l oad a l l ev ia t ion , and r ange . In con t r a s t , t he des ign is f a i r l y i n s e n s i t i v e to p e r c e n t c h a n g e s i n maximum l i f t c o e f f i c i e n t , s t a t i c m a r g i n , and maintenance costs. I t should be no ted , however , tha t the ease of r e a l i z i n g a 1-percent change in a pa rame te r va r i e s cons ide rab ly w i th t h e p h y s i c a l n a t u r e o f t h e p a r a m e t e r . A s e x p e c t e d , s i n c e f u e l is such a l a r g e component of Doc and IrFq, pa rame te r changes wh ich have t he l a rges t i n f luence on fue l u sage have t he b lgges t impact upon t h e outcome.
I n d i c a t i o n s f r o m t a b l e V are t h a t t h e d e s i g n s f r o m o p t i m i z i n g d i r e c t o p e r a t i n g cost pe r block hour were more s e n s i t i v e to Mach number v a r i a t i o n s and fue l p r i ce changes t han were the des igns f rom op t imiz ing t he income r e q u i r e d p e r f l i g h t f o r a 15-percent ROI. T h i s is because fue l cost m a k e s up a g r e a t e r p r o p o r t i o n of Doc, and t h e f i x e d u t i l i z a t i o n a s s u m p t i o n , w h i c h is a l a r g e p a r t of Ireq, g e n e r a l l y requires a h ighe r optimum Mach number. O the rwise , t he t w o per formance ind ices have reasonably close s e n s i t i v i t i e s i n terms of t h e t r e n d s to t h e set of pa rame te r s shown.
Accepting Ireq as a re l iab le and robus t f i gu re -o f -mer i t , a more thorough a n a l y s i s o f t h e s e n s i t i v i t y o f t h e optimum Ire des ign to parameter and con- s t r a i n t v a r i a t i o n s was then performed. To f a c i y i t a t e i n t e r a c t i v e c o m p u t i n g , t he i ndependen t des ign va r i ab le s were reduced from 1 2 to 9. The independent d e s i g n v a r i a b l e s t h a t t e n d e d to be a g a i n s t s i d e c o n s t r a i n t b o u n d a r i e s were i n p u t as des ign cons tan ts , which is e q u i v a l e n t to a s s u m i n g e q u a l i t y c o n s t r a i n t s . S p e c i f i c a l l y , Mach number (0.8), wing t a p e r r a t io (0.38), and wing thickness r a t io ( 0 . 1 4 ) were i n p u t as c o n s t a n t d e s i g n p a r a m e t e r s for the remaining s tud ie s .
Parameter or c o n s t r a i n t v a r i a t i o n s were per formed in four ca tegor ies : mis- s i o n d e f i n i t i o n s , e c o n o m i c a s s u m p t i o n s , p r o d u c t i o n p r e d i c t i o n s , a n d t e c h n o l o g y improvements. Each f a c t o r was var ied th rough a range thought to be reasonable i n terms o f y i e l d i n g i n f o r m a t i o n f o r t h e t r a n s p o r t d e s i g n e r or consumer. Since some n o n l i n e a r v a r i a t i o n s e x i s t e d , t h e s e were then p lo t ted showing percent s a v i n g s or p e r c e n t i n c r e a s e i n Ireq as a func t ion o f t he pa rame te r va r i a t ion . Where a p p l i c a b l e , ' a c u r v e is also shown d e p i c t i n g t h e Ireq v a r i a t i o n w i t h t h e independen t des ign va r i ab le s f i xed a t the nomina l va lues fo r t he optimum base- l i n e c o n f i g u r a t i o n . The d i f f e rence be tween t he t w o c u r v e s i l l u s t r a t e s t h e con- t r i b u t i o n to t h e Ireq v a r i a t i o n d u e to o p t i m a l l y c o n f i g u r i n g t h e a i r p l a n e f o r each parameter var ia t lon. Comparing these curves shows the benefi ts f rom opt i - m a l l y r e s i z i n g t h e a i r c r a f t as well as t h e r e l a t i v e economic s e n s i t i v i t y to u n c e r t a i n t i e s i n p r e d i c t i n g parameter v a l u e s . A d d i t i o n a l l y , t a b l e V I shows t h e
1 3

n u m e r i c a l s e n s i t i v i t i e s of t h e optimal d e s i g n variables, t h e o p t i m a l l y r e s i z e d Ireq a n d t h e b a s e l i n e Ireq to t h e parameter v a r i a t i o n s .
Miss ion de f in i t i on . - The l a n d i n g f i e l d l e n g t h , Mach number c o n s t r a i n t s , des ign range , and sea t ing capacity were va r i ed . The s e n s i t i v i t y o f Iyeq to t h e r e s p e c t i v e parameter v a r i a t i o n s is shown i n f i g u r e s 4 to 7 . ' Reducing the f i e l d l e n g t h r e s u l t e d i n a r a p i d l y i n c r e a s i n g Ireq, r e q u i r i n g s i g n i f i c a n t con- f i g u r a t i o n c h a n g e s to o p t i m a l l y s a t i s f y t h e c o n s t r a i n t s . The fol lowing inde- penden t va r i ab le s needed i nc reases of 10 pe rcen t or more for a 300-meter d e c r e a s e i n f i e l d l e n g t h : %, gf , S t , and Xcg. On the o the r hand , AR,, ARt, and A r e q u i r e d s u b s t a n t i a l d e c r e a s e s i n magnitude.
The importance of r e s i z i n g w h i l e c h o o s i n g Mach number is shown i n f i g u r e 5. Although the performance is h i g h l y s e n s i t i v e t o Mach number a t c r u i s e , s e l e c t i o n of Mach number is one of the items needed for t h e m a r k e t i n g o r i e n t e d d e c i s i o n d e t e r m i n i n g t h e d e s i r a b i l i t y o f d e c r e a s i n g t h e b l o c k time, among o t h e r f a c t o r s . An inc rease o f 0.1 i n t h e n o m i n a l Mach number saved I p e r c e n t i n b l o c k time bu t cost 0.8 p e r c e n t i n I r e q if t h e a i r c r a f t was o p t i m a l l y r e s i z e d a n d 1 . 4 p e r c e n t i n Ireq f o r t h e b a s e l i n e c o n f i g u r a t i o n . As e x p e c t e d f o r t h e f i x e d wing th i ck - nes s ra t io , f a i r l y l a r g e c h a n g e s i n wing sweep and aspect r a t i o were ob ta ined when o p t i m a l l y r e s i z e d .
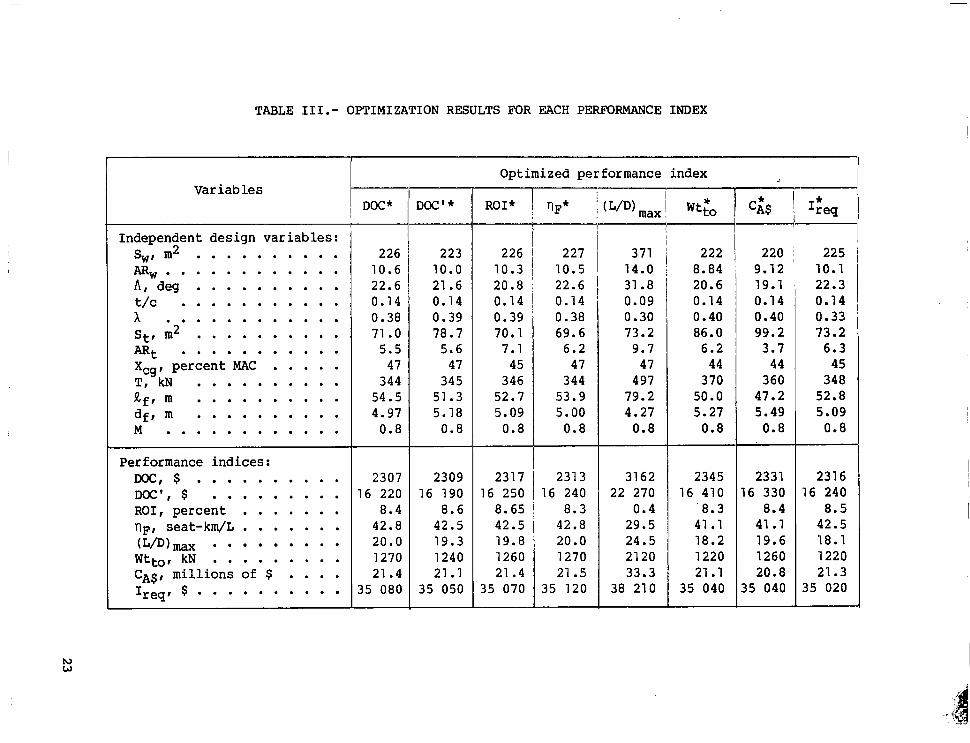
Choos ing des ign range and sea t ing capac i ty is also an impor tan t compromise decision between performance and economy, a s i l l u s t r a t e d i n f i g u r e s 6 and 7. The improvement i n Ireq from a d e c r e a s e i n r a n g e is due p r i n c i p a l l y to t h e f i x e d u t i l i z a t i o n a s s u m p t i o n and to t h e decrease i n t h e y o u n t o f f u e l u s e d . The income r e q u i r e d per kilometer for a 15-percent ROI (Ireq) shows n e a r l y 2 p e r c e n t s a v i n g s (when opt imized to Ireq) wi th a 15 -pe rcen t dec rease i n range. Range c h a n g e s r e q u i r e d o n l y m o d e r a t e c h a n g e s i n a i r c r a f t s i z e . I n c o n t r a s t , d e c r e a s i n g t h e s e a t i n g c a p a c i t y d e c r e a s e d Ireq bu t i nc reased I;eq, t h e income required per seat to g e n e r a t e a 15-percent ROI. As a n t i c i p a t e d , f a i r l y s i g n i f i c a n t s i z e c h a n g e s were ob ta ined as t h e a i r c ra f t was r econf igu red for d i f f e r e n t s e a t i n g capacities. The b a s e l i n e c o n f i g u r a t i o n results are n o t ex tended beyond the nominal base l ine va lues in f igures 6 and 7 because con- s t r a i n t v i o l a t i o n s i n d i c a t e t h a t t h e d e s i g n s are i n f e a s i b l e .
Economic assumptions.- As impl ied p rev ious ly , the economic assumpt ions made d u r i n g v e h i c l e d e s i g n a f f e c t t h e o p t i m i z a t i o n r e s u l t s . The impact o f f u e l price a n d a n n u a l u t i l i z a t i o n are two such assumpt ions . The augmenta- t i o n i n Ireq due to f u e l p r i c e i n c r e a s e s is f a i r l y s e v e r e , s i n c e a t $0.23 per l i t e r ($1.00 per g a l l o n ) , f u e l is a l r e a d y a s i g n i f i c a n t p o r t i o n o f t h e o v e r a l l o p e r a t i n g costs. I t shou ld be no t i ced ( f ig . 8) t h a t o p t i m a l l y r e s i z i n g t h e a i rc raf t s a v e s 1 p e r c e n t i n Ireq compared w i t h t h e b a s e l i n e con- f i g u r a t i o n a t a 50 -pe rcen t fue l price i n c r e a s e , i n d i c a t i n g a s i z a b l e b e n e f i t (approximate ly 3 p e r c e n t i n f u e l ) from p r o p e r l y p r e d i c t i n g t h e f u e l price dur ing p r e l i m i n a r y d e s i g n s t u d i e s a n d m a k i n g t h e f a i r l y s m a l l c h a n g e s to o p t i m i z e a i r - c r a f t c o n f i g u r a t i o n .
The impact of v a r y i n g t h e a n n u a l u t i l i z a t i o n U ( f i g . 9) does not resul t i n much v a r i a t i o n i n t h e c o n f i g u r a t i o n i f t h e o p t i m i z e r is al lowed to w o r k upon the nomina l w i th t he changes i n U. In o ther words , a l though U is a major component of equation ( 2 ) and does have a v e r y s i g n i f i c a n t impact upon t h e mag-
1 4

n i t u d e o f t h e optimum Ireq, i ts c h o i c e for t h e o p e r a t i o n model does n o t s i g - n i f i c a n t l y i m p a c t t h e p r e l l m i n a r y d e s i g n p r o c e s s . S i n c e t h i s is an obvious resul t , it might be c o n s i d e r e d a n i n d i c a t i o n t h a t t h e o p t i m i z a t i o n i n OPDOT is converging to c o n s i s t e n t r e s u l t s .
P roduc t ion p red ic t ions . - The d e s i g n e r m u s t estimate t h e p u r c h a s e price of t h e a i r p l a n e , its gross t ake-of f weight , and the cost of m a i n t a i n i n g t h e air- frame, engines, and systems. The need to a c c u r a t e l y p r e d i c t t h e i n i t i a l purchase price and the per hour maintenance cost is shown i n f i g u r e 10 to n o t a l te r t h e optimum d e s i g n s i g n i f i c a n t l y , s i n c e t h e d i f f e r e n c e s b e t w e e n t h e o p t i m a l l y r e s i z e d c o n f i g u r a t i o n s a n d b a s e l i n e c o n f i g u r a t i o n s are small. These two costs, h o w e v e r , s e r i o u s l y a f f e c t t h e absolute magnitude of the income r e q u i r e d per f l i g h t f o r a 15-percent annual return-on-investment.
I n c o n t r a s t , f i g u r e 11 shows tha t weight changes have a l a r g e i m p a c t upon the economy and d e s i g n o f t h e b a s e l i n e c o n f i g u r a t i o n . An i n c r e a s e o f 8900 N (2000 l b f ) i n t h e w e i g h t o f a component costs about 1.5 p e r c e n t i n Ireq. I f t h e a i r p l a n e c o u l d be b u i l t w i t h a decrease o f 4450 N (1000 l b f ) i n t h e empty weight , it cou ld be r e s i zed to save a l i t t l e over 1 p e r c e n t i n Ireq. When t h e a i r c r a f t was n o t r e s i z e d to take advantage of weight decrease ( p r i n c i p a l l y through using wing area r e d u c t i o n s ) , o n l y h a l f of t h e b e n e f i t s i n IrFq were o b t a i n e d . C a l c u l a t i o n s of t h e p e r f o r m a n c e o f t h e f i x e d b a s e l i n e c o n f l g u r a t i o n wi th assumed weight overpruns d id n o t s a t i s f y t h e p e r f o r m a n c e c o n s t r a i n t s a n d a r e n o t p l o t t e d i n f i g u r e 11. An a d d i t i o n a l p e n a l t y would have to be added to r e f l e c t t h e i n c r e a s e s i n i n s t a l l e d t h r u s t a n d wing area t h a t would be needed t o a c h i e v e t h e d e s i g n o b j e c t i v e s . The l a rge d i f f e rences be tween t he optimum and b a s e l i n e c o n f i g u r a t i o n s i l l u s t r a t e t h e o b v i o u s i m p o r t a n c e of c o r r e c t l y p r e d i c t - i ng t he we igh t o f t he p roduc t ion a i rp l anes du r ing concep tua l des ign . Pe rhaps t h i s i n d i c a t e s t h e n e e d f o r r e f i n i n g t h e w e i g h t e s t i m a t i o n t e c h n i q u e s a v a i l a b l e a t t h i s l e v e l o f p r e l i m i n a r y d e s i g n .
Technology improvements.- As a m e a n s o f a s s e s s i n g t h e p o t e n t i a l b e n e f i t s of technology improvements, a v a r i e t y o f p a r a m e t e r s were varied on the nominal b a s e l i n e c o n f i g u r a t i o n . The technology changes tha t were cons ide red i nc lude v a r i a t i o n s o f t h e f o l l o w i n g : w i n g d r a g , t h r u s t s p e c i f i c f u e l c o n s u m p t i o n , p i t c h i n g moment c o e f f i c i e n t , empty weight structure, l o a d a l l e v i a t i o n , maximum l i f t c o e f f i c i e n t , and s t a t i c margin.
The wing d r a g c o e f f i c i e n t was v a r i e d t o see the improvements that could be o b t a i n e d i f wing aerodynamic eff ic iency could be enhanced. I t is shown i n f i g u r e 1 2 t h a t a 10-percent improvement in drag a t z e r o l i f t y i e l d e d s l i g h t l y over 1 p e r c e n t s a v i n g s i n t h e income r e q u i r e d per f l i g h t for a 15-percent ROI. When t h e a i r c r a f t was no t r econf igu red to take advan tage o f t he wing d r a g improvement, only about 65 percent of the improvement was r e a l i z e d . The non- l i n e a r v a r i a t i o n i n t h e c u r v e is i n f a v o r o f l a r g e r c h a n g e s .
I f engine technology improvements could be a c h i e v e d , l a r g e r e d u c t i o n s i n Ireq could be r e a l i z e d ( f i g . 13). The b e n e f i t s cascaded th rough t he des ign process because as less f u e l was required, the empty weight could be reduced a l o n g w i t h t h e s i z e . When t h e n o m i n a l b a s e l i n e c o n f i g u r a t i o n was n o t r e s i z e d to take advantage of the syne rg i sm f rom improv ing t h rus t spec i f i c fue l con- sumpt ion , on ly ha l f o f t he s av ings were o b t a i n a b l e .
15
. . .

OPDOT was programmed wi th the assumpt ion tha t a s u p e r c r i t i c a l a i r f o i l sec- t i o n was u t i l i z e d to improve the drag and/or s t r u c t u r a l c h a r a c t e r i s t i c s . A c h a r a c t e r i s t i c of such sections, however, is a s u b s t a n t i a l p i t c h i n g moment, which could have a s i g n i f i c a n t impact upon t h e c o n f i g u r a t i o n . I t is shown i n f i g u r e 7 4 t h a t i f r e s e a r c h is a b l e to ach ieve a 50-percent reduct ion in p i tch ing- moment c o e f f i c i e n t a t z e r o l i f t , CmIOI n e a r l y a l - p e r c e n t s a v i n g s i n Ireq is r e a l i z a b l e . About 75 p e r c e n t of t h e s e b e n e f i t s came from being able to recon- f i g u r e t h e n o m i n a l b a s e l i n e d e s i g n , w h i l e a b o u t 25 percent of the improvements came from a r e d u c t i o n i n t h e t a i l l i f t used to trim t h e l a r g e p i t c h i n g moments.
I f t h e s t r u c t u r a l e f f i c i e n c y c o u l d b e e n h a n c e d , f o r example through new m a t e r i a l s , v e r y l a r g e g a i n s could be ob ta ined . The syne rg i sm poss ib l e f rom the use of new materials is d e p i c t e d i n f i g u r e 1 5 as a l - p e r c e n t s a v i n g s i n Ireq f o r e v e r y l - p e r c e n t r e d u c t i o n i n empty weight . Only ha l f tha t ra te o f ga in was ach ievab le when the nomina l con f igu ra t ion was n o t r e s i z e d . Also i n d i c a t e d i n f igure 75 is t h e a n t i c i p a t e d s y n e r g i s m i n w e i g h t r e d u c t i o n from improving t h e s t r u c t u r a l e f f i c i e n c y .
Two a c t i v e c o n t r o l s c o n c e p t s were c o n s i d e r e d n e x t , l o a d a l l e v i a t i o n a n d r e l axed s ta t ic s t a b i l i t y . Maneuver l o a d a l l e v i a t i o n is shown by f i g u r e 16 to be a concept wi th some l a r g e p o t e n t i a l g a i n s . Assuming there were no added weight or costs f r o m u t i l i z i n g t h e c o n c e p t , a 0 .2g i nc remen ta l r educ t ion i n t he des ign limit l o a d r e s u l t e d i n a 2 -pe rcen t s av ings i n Ire . A s a p recau t iona ry s t a t emen t , it shou ld be po in t ed o u t t h a t f a t i g u e l o a d s an% other dynamic modes (which probably become c r i t i c a l when s t r u c t u r a l m a t e r i a l is removed t o reduce t h e d e s i g n u l t i m a t e maneuver loads ) were not modeled. Hence, th is analysis is p r o b a b l y o v e r l y o p t i m i s t i c . Even so, i f t he nomina l base l ine conf igu ra t ion was no t r e s i zed and j u s t t h e f o r e c a s t w e i g h t s a v i n g s b e n e f i t s were inc luded , about h a l f t h e b e n e f i t s were r e a l i z e d .
The n a t u r e of t h e b a s e l i n e c o n f i g u r a t i o n p r e v e n t e d t h e o p t i m i z e r from achiev ing less than a -6.8-percent s ta t ic margin during s t a t i c m a r g i n v a r i a t i o n s ( f i g . 1 7 ) . Again assuming no weight or cost p e n a l t y , when t h e s t a t i c m a r g i n was reduced from the nominal of 5 p e r c e n t t o t h e lowest ach ievab le (-6.8 p e r c e n t ) 1 . 8 p e r c e n t i n Ireq was saved. A more tho rough s tudy o f t he bene f i t s o f d e s i g n i n g t r a n s p o r t s w i t h r e l a x e d s t a t i c s t a b i l i t y u s i n g OPDOT is p r e s e n t e d i n r e f e r e n c e s 5 and 6.
A t t h e p r e l i m i n a r y d e s i g n s t a g e , t h e a e r o d y n a m i c i s t m u s t c h o o s e t h e l e v e l o f c o m p l e x i t y f o r h i g h - l i f t d e v i c e s . Making t h e u n r e a l i s t i c a s s u m p t i o n of no p e n a l t y f o r a d d i n g g r e a t e r l i f t i n g c a p a b i l i t y ( i . e . , cost or w e i g h t ) , f i g - u r e 78 shows t h e g a i n s t h a t were ob ta ined from t h e o p t i m i z e r . The s e n s i t i v i t y is r e l a t i v e l y l a r g e a n d , a s e x p e c t e d , r e s u l t e d i n a d j u s t m e n t s t o wing area wi th minor changes in wing sweep and wing a s p e c t r a t i o r e q u i r e d to s a t i s f y t h e l a n d - i n g f i e l d l e n g t h c o n s t r a i n t s .
T r a d e - s t u d i e s . - S e e i n g t h e s e n s i t i v i t i e s a b o u t t h e n o m i n a l p a r a m e t e r s f o r t h e b a s e l i n e c o n f i g u r a t i o n , t h e d e s i g n e r c a n make some i n i t i a l d e c i s i o n s a b o u t po ten t i a l changes a t t he p re l imina ry des ign l eve l . Fo r example , it might be proposed to add a more complex f l a p s y s t e m a t a cost o f a 4450-N (1000-lbf) i nc rease i n we igh t and a 0 . 5 - p e r c e n t i n c r e a s e i n p u r c h a s e p r i c e to g e t a g a i n of 0.2 i n C L , ~ ~ ~ . I f s u p e r p o s i t i o n of the curves can be assumed, then a
16

potential savings of 0.4 percent in Ireq could be achieved from summing the appropriate components of figures 10, 11 , and 1 8.
Given the possibility that the proposed improvement in the airplane system could enhance the aircraft operational economy, a more complete analysis of the proposed changes could then be pursued. The data modeling the improvements should be inserted into the appropriate modules in an optimum design program like OPDOT. To yield the maximum synergism possible, each concept change needs to be implemented through optimally redesigning the configuration as a means of investigating the relative trade-offs. In fact, there are cases when significant improvements in some components yield little or even negative economic improvement in the aircraft design.
CONCLUDING REMARKS
A constrained parameter optimization technique for the preliminary design of an optimal, medium-range transport has been performed. A result of this study is that income required per flight for a 15-percent return-on-investment *reg was shown to be a robust, economically rich performance index for use as a figure-of-merit for numerical optimizations. This performance index had the advantage of being useful as an indication of profitability without requiring detailed income information or assumptions.
As a means of illustrating its use as a conceptual design tool, direct optimization was used to perform an interactive sensitivity study to parameter variations for a variety of design constants and constraint functions. The optimal design in terms of aircraft geometry was shown to be relatively insen- sitive to certain design assumptions and economic parameters although impacting the magnitude of optimized Ireq. The insensitive parameters included the following: annual utilization, aircraft purchase price, and aircraft mainten- ance costs. In contrast, choosing landing field length, Mach number, design range, seating capacity, and fuel price were mission or economic choices that had significant impacts upon the optimal configurations as well as on the value of optimum Ireq.
A series of design optimizations was made for a number of potential technology-based improvements. Sizable savings in Ireq were possible with moderate enhancements in structural efficiency, engine fuel consumption, and maneuver load alleviation. Modest gains were observed with reductions in wing drag coefficient, wing pitching moment, and static margin. In all these cases, the maximum benefits were realized only after the baseline configuration was optimally resized. It is thus concluded that the feasibility and future use- fulness of constrained parameter optimization for aircraft design have been demonstrated.
Langley Research Center National Aeronautics and Space Administration Hampton, VA 23665 November 20, 1980
17

REFERENCES
1. Piggott, B. A. M.; and Taylor, B. E.: Application of Numerical Optimisa- tion Techniques to the Preliminary Design of a Transport Aircraft. Tech. Rep. 71074, British R.A.E., Apr. 1971.
2. Ardema, M. D.; Harper, M.; Smith, C. L.; Waters, M. H.; and Williams, L. J.: Conceptual Design of Reduced Energy Transports. AIAA Paper 75-303, Feb. 1975.
3. Hague, D. S.; Glatt, C. R.; and Jones, R. T.: Integration of Aerospace Vehicle Performance and Design Optimization. AIAA Pa2er No. 72-948, Sept. 1 972.
4. Sliwa, Steven M.; and Arbuckle, P. Douglas: OPDOT: A Computer Program f o r the Optimum Preliminary Design of a.Transport Airplane. NASA TM-81857, 1980.
5. Sliwa, Steven M.: Impact of Longitudinal Flying Qualities Upon the Design of a Transport With Active Controls. AIAA-80-1570, Aug. 1980.
6. Sliwa, Steven M.: Economic Evaluation of Unaugmented-Flying-Qualities Design Criteria for a Transport Configured To Take Maximum Advantage of Relaxed-Static-Stability Augmentation Systems. NASA TP-1760, 1980.
7. Hague, D. S . ; and Glatt, C. R. : A Guide to the Automated Engineering and Scientific Optimization Program - AESOP. Contract NAS 2-4507, Space Div. , Boeing Co. , [1968]. (Available as NASA CR-73201.)
8. Vanderplaats, Garret N.: CONMIN - A Fortran Program for Constrained Func- tion Minimization. User's Manual. NASA TM X-62,282, 1973.
9. Olssond D. M.: A Sequential Simplex Program for Solving Minimization Problems. J. Qual. Technol., vol. 6 , no. 1 , Jan. 1974, pp. 53-57.
10. Olsson, Donald M.; and Nelson, Lloyd S . : The Nelder-Mead Simplex Procedure for Function Minimization. Technometrics, vol. 17, no. 1, Feb. 1975, pp. 45-51.
11 . Nicol.ai, Leland M.: Fundamentals of Aircraft Design. School of Eng., Univ. of Dayton, Dayton, Ohio, c.1975.
12. Oman, B. H.: Vehicle Design Evaluation Program. NASA CR-145070, 1977.
13. Anderson, R. D. ; Flora, C. C. ; Nelson, R. M. ; Raymond, E. I. ; a.nd Vincent, J. H.: Development of Weight and Cost Estimates for Lifting Surfaces With Active Controls. NASA CR-144937, 1976.
14. Kyser, Albert C.: An Elementary Analysis of the Effect of Sweep, Mach Number, and Lift Coefficient on Wing-Structure Weight. NASA TM-74072, 1977.

15. Aggarwal, R.; et al.: An Analysis of Fuel Conserving Operational Procedures and Design Modifications for Bomber/Transport Aircraft. AFFDL TR-78-96, Volume 11, U . S . Air Forcer July 1978.
16. Perkins, Courtland D.; and Hage, Robert E.: Airplane Performance Stability and Control. John Wiley & Sons, c.1949.
17. Hoerner , Sighard F. : Fluid-Dynamic Drag. Hoerner Fluid Dynamics (Brick Town, N. J.), c.1965.
18. US- Stability and Control Datcom. Contracts AE'33(616)-6460 and F33615-76-C-3061, MeDonnell Douglas Corp., Oct. 1960. (Revised Apr. 1978. )
19. Roskam, Jan: Methods for Estimating Stability and Control Derivatives of Conventional Subsonic Airplanes. Publ. by the author (Dep. Aerosp. Eng., Univ. of Kansas, Lawrence, Kansas), c.1973.
20. Harris, Charles D.: Aerodynamic Characteristics of a 14-Percent-Thick NASA Supercritical Airfoil Designed for a Normal-Force Coefficient of 0.7. NASA TM X-72712, 1975.
21. Bartlett, Dennis W.: Wind-Tunnel Investigation of Several High Aspect-Ratio Supercritical Wing Configurations on a Wide-Body-Type Fuselage. NASA TM X-71996, 1977.
22. Heffley, R. K.; et al.: Aircraft Handling Qualities Data. NASA CR-2144, 1972.
23. Seckel, Edward: Stability and Control of Airplanes and Helicopters. Academic Press, Inc., c.1964.
24. McRuer, Duane; Ashkenas, Irving; and Graham, Dunstan: Aircraft Dynamics and Automatic Control. Princeton Univ. Press, 1973.
25. Loftin, Laurence K . , Jr.: Subsonic Aircraft: Evolution and the Matching of Size to Performance. NASA RP-1060, 1980.
26. McLaughlin, Milton D.: Calculations, and Comparison With an Ideal Minimum, of Trimmed Drag for Conventional and Canard Configurations Having Various Levels of Static Stability. NASA TN D-8391, 1977.
27. American Airlines: A New Method for Estimating Current and Future Transport Aircraft Operating Economics. NASA CR-145190 (Rev.), 1978.
28. Maddalon, Dalo V.: Estimating Airline Operating Costs. NASA TM-78694, 1978.
29. Stoessel, Robert F.: A Proposed Standard Method for Estimating Airline Indirect Operating Expense. Rep. No. LW70-500Rr Lockheed-Georgia CO., May 1970.
19

T ---..-
30. Assessment o f t h e A p p l i c a t i o n of Advanced Technologies to Subsonic CTQL Transpor t Aircraft. NASA CR-112242, 1973.
31. Boeing Commercial Ai rp lane Co.: I n t e g r a t e d A p p l i c a t i o n of A c t i v e C o n t r o l s (IAAC) Technology to a n Advanced Subsonic Transport Project - I n i t i a l ACT Conf igu ra t ion Des ign S tudy , F ina l Report. NASA CR-159249, 1980.
32. Cormery, Gilbert: Compromise Between Economic Concerns and Application of New Technologies i n t h e D e f i n i t i o n of a New A i r p l a n e P r o j e c t . A Collec- t i o n of Techn ica l Pape r s - AIAA/RAeS/CASI/AAAF A t l a n t i c A e r o n a u t i c a l Conference, Mar. 1979, pp. 62-71. ( A v a i l a b l e a s AIAA Paper 79-0693.)
33. Jensen, S. C.; Rett ie, I. H.; and Barber, E. A.: The Role of F i g u r e s of Merit in Design Optimization and Technology Assessment. A I A A Paper 79-0234, Jan. 1979.
34. Ardema, Mark D.: S e n s i t i v i t y of Transpor t Aircraft Performance and Economics to Advanced Technology and Cruise Mach Number. NASA TM X-62,336, 1974.
35. Kirkpatrick, D. L. I.; and Larcombe, M. J.: In i t i a l -Des ign Op t imisa t ion on C i v i l a n d M i l i t a r y A i r c r a f t . A i r c r a f t D e s i g n I n t e g r a t i o n a n d O p t i m i z a - t i o n - Volume I , AGARD-CP-147-Volume I , 1974, pp. 19-1 - 19-18.
36. Osterbeck, P. G.; S u t t o n , R. C.; and Hawkins, L. D.: I n t roduc ing C o s t E f f e c t i v e n e s s i n t o t h e T a c t i c a l A i r p l a n e D e s i g n Cycle i n a Cost E f f e c t i v e Manner. AIAA Paper 79-0235, Jan. 1979.
20

TABLE I.- LIST OF D E F I N I N G PARAMETERS FOR OPDOT
(a) Upper and lower limits of independent design variables
Independent design variable Lower limit Upper limit
Wing area, s,, m2 . . . . . . . . . . . . . . . . . . . . . 93 Wing aspect ra t io , ARw . . . . . . . . . . . . . . . . . . . 3 Wing sweep angle, A , deg . . . . . . . . . . . . . . . . . . 10 Wing t h i c k n e s s ra t io , t/c . . . . . . . . . . . . . . . . . 0 . 1 0 Wing taper ra t io , 1 . . . . . . . . . . . . . . . . . . . . 0.25 Horizontal- ta i l area, St , m2 . . . . . . . . . . . . . . . . 9 . 2 9 Horizontal- ta i l aspect ra t io , ARt . . . . . . . . . . . . . 2 Aftmost center-of-gravity, XCg, percent MAC . . . . . . . . . 0 Ins ta l led th rus t , T, kN . . . . . . . . . . . . . . . . . . 1 7 0 Fuselage length, L f , m . . . . . . . . . . . . . . . . . . 3 6 . 6 Fuselage diameter, df, m . . . . . . . . . . . . . . . . . . 5 . 6 6 Cruise Mach number, M . . . . . . . . . . . . . . . . . . . 0.8
372 1 4 45
0 .14 0 . 5 0
1 5 0 12
1 0 0 6 6 7
7 9 . 2 6 . 1 0
0.9
(b) Baseline function limits of avai lable constraint funct ions
Available constraint function Baseline function limits
T h r u s t for cruise/climb Tav
Treq - 2 1
Tav -2 1
Treq
. . . . . . . . . . . . . . . . . . . . . .
Second-segment climb gradient . . . . . . . . . . . . . . . . . . .
Missed-approach climb gradient Tav - 2 1 . . . . . . . . . . . . . . . . . . .
eq
Landing f ie ld l ength , m . . . . . . . . . . . . . . . . . . . . . . LFL 6 2 1 3 0 Take-off f ie ld l ength , m . . . . . . . . . . . . . . . . . . . . . TOFL 6 2 4 3 0 Nosewheel s teer ing t rac t ion . . . . . . . . . . . . . . . . . . . . Xcg 5 X l g - ANG
WLKeCJ
WLav Passengervolume . . . . . . . . . . . . . . . . . . . . . . . . . . 6 1
Cruise a l t i tude , m . . . . . . . . . . . . . . . . . . . . . . . . . h,, 2 9100 Cruise wing l i f t c o e f f i c i e n t . . . . . . . . . . . . . . . . . . . . S t a t i c margin (c ru ise and approach), percent MAC
C L , ~ S 0.7 SM 2 5
T a i l l i f t c o e f f i c i e n t i n approach . . . . . . . . . . . . . . . . . . . . . . . . . .
C L , t 2 -0.8
N o s e g e a r u n s t i c k L t , av
L t , req . . . . . . . . . . . . . . . . . . . . . . . . . 2 1
(c) Available performance indices
Direct operating cost per block hour, WC Direct operating cost per f l ight, wc' Return-on-investment, ROI Fuel efficiency, 'IF Maximum g l i d e r a t i o , (L/D)max Take-off gross weight, W t t o Airplane purchase price, CAS Income required per f l ight for
15 percent ROI, Ireq
21

TABLE 11.- KEY DESIGN CONST.WTS USED FOR DESIGN OPTIMIZATION
(a) Mission
D e s i g n r a n g e . km . . . . . . . . . . . . . . . . . . . . . . . . . . . . . . . . . 5600 Nuvber o f s e a t s . . . . . . . . . . . . . . . . . . . . . . . . . . . . . . . . . 200 Cargo, N . . . . . . . . . . . . . . . . . . . . . . . . . . . . . . . . . . . . . . 3 3 4 0 0 Maximum l i f t c o e E f i c i e n t . . . . . . . . . . . . . . . . . . . . . . . . . . . . . . 3.15
Take-off f i e l d r equ i r emen t , m 2430 Landing f i e l d r equ i r emen t , m 2130 . . . . . . . . . . . . . . . . . . . . . . . . . . . .
. . . . . . . . . . . . . . . . . . . . . . . . . . .
(b) Geometry
. . . . . . . . . . . . . . . . . . . . . . . . . . . . . Wing g e o m e t r i c t v i s t . deg Wing i n c i d e n c e ang le . deg
T a i l t h i c k n e s s r a t io . . . . . . . . . . . . . . . . . . . . . . . . . . . . . . . . T a i l s w e e p a n g l e . d e g . . . . . . . . . . . . . . . . . . . . . . . . . . . . . . . T a i l t a p e r r a t i o . . . . . . . . . . . . . . . . . . . . . . . . . . . . . . . . . . V e r t i c a l - t a i l s w e e p , d e g . . . . . . . . . . . . . . . . . . . . . . . . . . . . . . Ratio o f r u d d e r a r e a to v e r t i c a l - t a i l a r e a . . . . . . . . . . . . . . . . . . . . . Ratio of e l e v a t o r c h o r d to h o r i z o n t a l - t a i l c h o r d . . . . . . . . . . . . . . . . . . R a t i o o f f l a p s p a n to wing span . . . . . . . . . . . . . . . . . . . . . . . . . . Maximum f l a p d e f l e c t i o n , d e g . . . . . . . . . . . . . . . . . . . . . . . . . . . . Height o f aerodynamic cen ter above c .g . , percent MAC . . . . . . . . . . . . . . . . Height oE t h r u s t v e c t o r a b o v e c - g . , p e r c e n t PAC . . . . . . . . . . . . . . . . . . H e i g h t o f h o r i z o n t a l t a i l above c .g . . . . . . . . . . . . . . . . . . . . . . . . . Number o f e n g i n e s . . . . . . . . . . . . . . . . . . . . . . . . . . . . . . . . .
. . . . . . . . . . . . . . . . . . . . . . . . . . . . .
(c) Economics
F u e l cost. $/L . . . . . . . . . . . . . . . . . . . . . . . . . . . . . . . . . . . Load f a c t o r . . . . . . . . . . . . . . . . . . . . . . . . . . . . . . . . . . . . Passenger revenue. $/seat-km . . . . . . . . . . . . . . . . . . . . . . . . . . . . U t i l i z a t i o n . U. hr /y r . . . . . . . . . . . . . . . . . . . . . . . . . . . . . . . D e p r e c i a t i o n p e r i o d . y r . . . . . . . . . . . . . . . . . . . . . . . . . . . . . . R e s i d u a l v a l u e . p e r c e n t . . . . . . . . . . . . . . . . . . . . . . . . . . . . . . axr rate, t x . . . . . . . . . . . . . . . . . . . . . . . . . . . . . . . . . . . Year of s tudy . . . . . . . . . . . . . . . . . . . . . . . . . . . . . . . . . . . Assumed a n n u a l i n f l a t i o n r a t e . . . . . . . . . . . . . . . . . . . . . . . . . . . Nurrber of p r o t o t y p e a i r c r a f t . . . . . . . . . . . . . . . . . . . . . . . . . . . . A i r c r a f t f l e e t s i z e . . . . . . . . . . . . . . . . . . . . . . . . . . . . . . . . I n i t i a l p r o d u c t i o n rate. pe r IK) . . . . . . . . . . . . . . . . . . . . . . . . . . F u l l p r o d u c t i o n r a t e . p e r mo . . . . . . . . . . . . . . . . . . . . . . . . . . . . E n g i n e e r i n g r a t e (1974) . $/hr . . . . . . . . . . . . . . . . . . . . . . . . . . . T o o l i n g r a t e (1974) . $/hr . . . . . . . . . . . . . . . . . . . . . . . . . . . . . Labor r a t e (1974) . $/hr . . . . . . . . . . . . . . . . . . . . . . . . . . . . . . Engines fo r test a i r c r a f t . . . . . . . . . . . . . . . . . . . . . . . . . . . . . Ratio o f manufac tu re r ' s a i rErame we igh t to take-off weight . . . . . . . . . . . . .
(d ) Misce l l aneous
Maximum dynamic p ressure . N/m2 . . . . . . . . . . . . . . . . . . . . . . . . . . . Pressurized volume. m3 . . . . . . . . . . . . . . . . . . . . . . . . . . . . . . . Number o f a t t e n d a n t s Number o f p i l o t s
A i r c o n d i t i o n i n g f l o w r a t e . kg/min . . . . . . . . . . . . . . . . . . . . . . . . . A u t o p i l o t c h a n n e l s ( w i t h m u l t i p l e x e r s ) . . . . . . . . . . . . . . . . . . . . . . . Maintenance complexi ty factor G e n e r a t o r c a p a c i t y . kV-A
Hydraul ics volume f low ra te . L/min . . . . . . . . . . . . . . . . . . . . . . . . . Number o f i n e r t i a l p l a t f o r a s y s t e m s . . . . . . . . . . . . . . . . . . . . . . . . Ratio o f f i r s t class to economy class s e a t i n g . . . . . . . . . . . . . . . . . . . Maximum speed. m/sec . . . . . . . . . . . . . . . . . . . . . . . . . . . . . . . . A i r f o i l d e s i g n l i f t c o e f f i c i e n t . . . . . . . . . . . . . . . . . . . . . . . . . . B a s e l i n e e n g i n e . . . . . . . . . . . . . . . . . . . . . . . . . . . . . . . . . . E l e v a t o r s e r v o time c o n s t a n t . sec . . . . . . . . . . . . . . . . . . . . . . . . . Curved windshield S u p e r c r i t i c a l a i r f o i l t e c h n o l o g y Some non l inea r ae rodynamics t e rms
. . . . . . . . . . . . . . . . . . . . . . . . . . . . . . . . . . . . . . . . . . . . . . . . . . . . . . . . . . . . . . . . . .
. . . . . . . . . . . . . . . . . . . . . . . . . . . . . . . . . . . . . . . . . . . . . . . . . . . . . . . . .
Ratio o f aux i l i a ry -power -un i t on - t ime to engine on-t ime . . . . . . . . . . . . . .
2 5
0 .10 30
0 . 4 35
0.30 0 .25
0 .6 45
8 -12
0 2
0 . 2 0 0 . 5 5
3200 4 . 9
14 12
0 .48 1980 0 . 0 7
2 250 0 . 5
5 19.55 14.00 10.90
3 0.75
178.2 5.13
3
200 8
750 5
1 . 6 300
1 0.1
248.5 0.15
0 . 4 CF-6
0.1
22
.
TABLE 111.- OPTIMIZATION RESULTS FOR EACH PERFORMANCE INDEX
Variables
Independent design variables: . . . . . . . . . . . . . . . AR. . . . . . . . . . . . . . . . . . . . . . . . . . . . t/c . . . . . . . . . . . . . . . . . . . . . . . . . . . . . . . . . . . . . . . ARt . . . . . . . . . . . ........... MAC . . . . . . . . . . . . . . . . . . . . . . . . . . . . . . . . . . . . . . . . . . . . . . . . . . . . . . . . . . . .
~~~~~
Performance indices: m. $ . . . . . . . . . . W'. $ . . . . . . . . . ROI. percent . . . . . . . T ~ F ~ seat-km/L . . . . . . . (L/D)max . .
W t t o r kN . . . . . . . . . CAS' millions of $ . . . . Ireqr $ . . . . . . . . . .
-+ 226 10.6 22.6 0.14 0.38 71 . 0 5.5 47 344 54.5 4.97 0.8
223 10.0 21.6 0.14 0.39 78.7 5.6 47 345 51.3 5.18 0.8
2307 16 220
8.4 42.8 20.0 1270 21.4
35 080
2309 16 190
8.6 42.5 19.3 1240 21.1
35 050
Optimized performance
ROI*
'I 226 1 10.3 I I 20.8 ~
0.14 0.39 ~
70.1 1 7.1 1 346 1 45 1
52.7 5.09 0.8
227 10.5 22.6 0.14 0.38 69.6 6.2 47 344 53.9 5.00 0.8
371 ~ 14.0 1 31.8
0.09 I 0.30
1 73.2 9.7 47
I 497 79.2 4.27 0.8
231 7 16 250 8.65 42.5 19.8 1260 21.4
35 070
231 3 16 240
8.3 42.8 20.0 1270 21.5
35 120
31 62 22 270
0.4 29.5 24.5 21 20 33.3
38 210
index .
222 j 8.84 20.6 j 0.14 ~
0.40 ~
86.0 ~
6.2 ~
370 1 50.0 I 5.27 i
0.8
44 I
220 j
19.1 / / 9.12
0.14 .. 0.40 '
99.2 3.7 44 360 47.2 5.49 0.8
225 10.1 22.3 0.14 0.33 73.2 6.3 45 348 52.8 5.09 0.8
2345 16 410
'8.3 41.1 18.2 1220 21.1
35 040
2331 16 330
8.4 41.1 19.6 1260 20.8
35 040
2316 16 240
8.5 42.5 18.1 1220 21.3
35 020
h) W

TABLE 1V.- PERCENT DEGRADATION OF A PERFORMANCE INDEX WITH RESPECT TO
OPTIMUM WHEN CONFIGURED TO ALTERNATE PERFORMANCE INDEX
Optimized performance index Doc
DOC* . . Doc'* . . ROI* . . qF* . (L/D) Wt *to * - . . Ireq *
. . . . . . . . . . . . . . . . . . . . . . . . . . . . . . . .
0 0.09 0.43 0.26 37.1 1.65 1.04
~ 0.39
Doc'
0.19 0
0.37 0.31 37.5 1.36 0.86 0.31
Percent degradation
RO I
0.11 2.89
Wtto ( L/D 1 max QF
4.10 18.4 .58 0.80 21.2 1.64 0
0 26.1 0.80 1.73 3.28 20 .o 4.11 2.89
0 25.7 4.11 ,4.05 73.77 0 31.2 95.38 4.10 18.4 0 4.05 3.28 19.2 0.69
CAS
2.88 1.44 2.88 3.37
60.10 1.44
0 2.40
1 Ireq
0.17 0.09 0.14 0.29 9.11 0.06 0.06
0
!

TABLE V.- SENSITIVITY OF OPTIMUM DOC AND OPTIMUM 1,-
DESIGNS To PARAMETER AND CONSTRAINT VARIATIONS
Varied parameter, p
Mission: Range Landing field length Mach number
Economic : Fuel price Annual utilization
Production: Aircraft price Ma in tenance Weight overruna
Technological: Maximum lift coefficient Maneuver load alleviation Static margin
Symbol
R LFL M
FS U
CAS CMS A wt
CL , max MLA SM
0.37 -.31 .69
.37 -.31
.31
.028
.73
-.019 -. 48 .0014
1.06 -. 33 .32
.18 "47
.44
.058
.77
-. 021 -. 46 .OOl 1
aIncrease in performance index per 4450-N weight overrun.
25

TABLE VI.- SENSITIVITY OF PERFORMANCE INDEX AND AIRPLANE GEOMETRY "0 PARAMETER VARIATIONS
Performance sensitivities Geometry sensitivities
- i Varied parameter, p
-
i
-.79 j .60 :
Mission: Landing field length Mach number Design range Seating capacity
I j Economic : j Fuel price i Annual utilization
-1.05 .95 .36 .62
-. 03 .20
-1.64 -. 12 8.51
-.06 -. 61 1.70
-1.92 -1 .21 -. 58
.14
0.51 -1.97 -.08 .49
-. 07 .lo
.38 -. 27 6.08
0.32 3.74 .24 -. 02
.02
.41
3.21 .05
3.67
-0.30 2.18 .45 .46
.001 -.06
1.36 .08
6.21
-.52 -. 63 1.35
-1.96 -.69
-0.61 1.44 1.47 .10
.52
.85
1.86 .34
9.45
-1.56 -. 97 -.43 -2.1
1.16 -2.02 -1.69 -1.12
-1 6 -.33
2.54 .16
-3.24
.80 1.21 .59
-0.07 .82 .38 -. 25
.34
.ll
.76
.17 -1.08
-.30 -. 33 -.09
-0.21 .72 .96 .50
.16 -.37
.46
.06 16.2
.ll -. 38
.02 -1.44 -. 22
"-" 0.48 .84 .23
.20 -.39
.47
.07 9.90
.08
Production: Airplane price Maintenance cost Weight overrunb
;
i
I -.20 i .003.
! !
i
!
I
Technological : Wing drag coefficient Engine efficiency Pitching moment Structural efficiency Maximum lift coefficient Load alleviation Static marginC
.66 1 .18
.07 I -.25
.96 12.8
.50 ' 1.57
.90 1 -.23
.33 ' -.14
.32 ' .32
1.88 j 1.22 !
-.36 -.15 -13 j -""
-. 92 "-" -10.1 * 5.9 i 1.68
-.30 I -4.9
-. 25 1.83
-1 .24 -1.02
%onfiguration same as baseline (not optimally resized). bSensitivity of unnormalized performance index or geometric variable to a 1-percent
CUnnormalized. weight overrun.

I
(12)
DES IGN %3 RATIO DES IGN VARIABLES FUSELAGE LENGTH
H O R I Z O W A L - T A I L AREA T A I L A S P E C T R A T I O TECHNOLOGY LEVEL
M R U S T ETC . ETC .
CONSTANTS E Y k & R 1 E s
f " C . G . NONLlflEAR AERO BASELINE ENGINE
PERFORMANCE ulc ROI BASE L I D
F U E L ETC . FUNCTIONS .
FUNCTION DATA
I req
W t CONSTRAINT -c
( 5 2 ) ENGINE-OUT PERFORMANCE F I E L D LENGTH
I F L Y I N G Q U A L I T I E S
CONTROL POWER GEOMETRY CONSTRAINTS
ET,-
Figure 1.- Generalized flow diagram for OPDOT.
DOC ROI PERFORMANCE INDEX
COST ' COMPUTATION
1 i IOC MANUFACTURING MAINTENANCE
t t M I S S I O N
CRUISE STEP
ENGINE
DRAG
STABILITY AND CONTROL
FEATURES INDUSTRY STATISTICS FOR COSTS AND WEIGHTS
DATCOM-TYPE STABILITY AND CONTROLDERIVATIVES
NON-LINEAR, ITERATIVE TRIM SOLUTION
MULTIPLE-STEP. SUBOPTIMALCRUISE~LIMB
GENERALIZED INTERFERENCE DRAG
COMPUTER GRAPHICS OUTPUT OPTION
Figure 2.- Schematic representation of performance function calculation hierarchy.
27

_ _ . ._ . . . ".
C L I M B
B * AT
11,000 rn
C L I M B TO /
ALTITUDE
600 rn
CRUISElCLIMB AT CRU I SElCL I M B AT 98%
O R I G I N
Figure 3.- Mission profile used in OPDOT.
4 - SAVINGS -
IN ' r e q -4 - 70 -8 -
-12 - 0 BASELINE WITH NOMINAL LFL (2130 m ) -16
-24 - -20 - -OPTIMALLY RES IZED
I I I I 'I I "_I
1400 1600 1800 2000 2200 2400 2600 2800 3000 rn I I I LA
5000 6000 7000 8OOO 9000 ft MAXIMUM LANDING F IELD DISTANCE
Figure 4.- Sensitivity of optimum 1r-q to landing field length constraint.
28

I - -
I
OPTIMALLY RES IZED BASELINE CONFIGURATION M I S S I O N B L O C K T I M E
""
5 - "- 4 -
/= 3 - 0 BASELINE AT NOMINAL M /"
SAVINGS 2 - Ireq / * WITH
RESPECT TO
BASELINE. -1 70 -2
-3
1 ""L - 0 -
-
- - " _
- / * -
/"
I I I I I
.75 .76 .77 .78 .79 .80 .81 .82 .83 .84
CRUISE MACH NUMBER
Figure 5.- Impact of cruise Mach number upon transport design.
20 - OPTIMALLY RES IZED
"" BASELINE CONFIGURATION 0 BASELINE WITH NOMINAL
RANGE (5600 km 1
BASELINE. -8 -
% -12 - - -16
-20 -24 - 1 -1 I I I I I 1 I
-
4500 5000 5500 6000 6500 km I I I
2500 27 5 0 3oooo 3250 3500 n. mi. I ~. .~ I
DES IGN RANGE
Figure 6.- Impact of design range upon transport design.
29
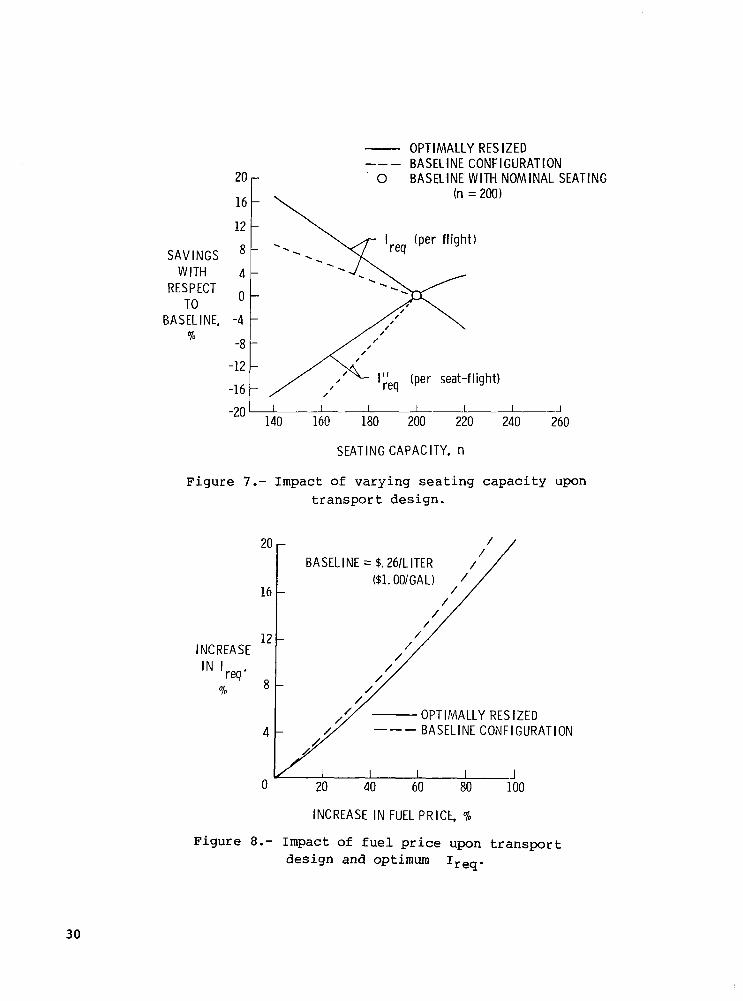
SAVINGS WITH
RESPECT TO
BASELINE, %
20
12
- 16
-
-
8 -
4 -
0 -
-4 -
-8 -
-12 -
-16 -
OPTIMALLY RES IZED "_ BASELINE CONFIGURATION 0 BASELINE WITH NOMINAL SEAT
(n = 200)
. . .
'\ lyeq (per seat-flight) I
-20' ' I I I 'A 140 160 180 200 220 240 260
SEATING CAPACITY, n
Figure 7.- Impact of varying seating capacity upon transport design.
20
16
INCREASE 12
IN Ireq. 70 8
4
0
/ /
BA SEL I NE = $. 26/L ITER (81.001GAL)
/ //
/ / /L OPTIMALLY BASELINE CONFIGURATION RES IZED
/
I I I I J 20 40 60 80 100
INCREASE I N FUEL PRICE, %
'ING
Figure 8.- Impact of fuel price upon transport design and optimum Ireq.
30

INCREASE
IN lreq. %
20 -
15 -
10 -
5 -
0 -
- OPTIMALLY RES IZED BASELINE CONFIGURATION -”
0 BASELINE WITH NOMINAL U
-5 I I I I 1 I 1800 2000 2200 2400 2600 2800 3000 3200 3400
ANNUAL UTIL IZATION, block h r l y r
I
F igure 9.- Impact of a n n u a l u t i l i z a t i o n a s s u n p t i o n upon t r anspor t des ign and optimal Ireq.
12
10
8
INCREASE IN I 6
req’ 70
4
2
0
OPTIMALLY RES IZED
SE P R I C E
MAINTENANCE COST PER HOUR ”
5 10 15 20 25 30
/I MAINTENANCE COST PER HOUR ”
5 10 15 20 25 30
INCREASE IN COST, %
Figure 1 0.- Impact of i n c r e n e n t s i n a i r p l a n e p u r c h a s e price and per block hour maintenance cost upon t r a n s p o r t d e s i g n .
31

10
OPTIMALLY RESIZED BASELINE CONFIGURATION
0 NOMINAL WEIGHT OVERRUN (0 N ) ”-
4 2 :I 0
-2
-4
-6
-8 -10 I I I I I I I I
-10 0 10 20 30 40 50 60 kN 1 I I I I I I
-2 0 2 4 6 8 10 i 2 x lo3 Ibf COMPONENT WEIGHT INCREASE
Figure 7 1 . - Impact of weight increases upon the design and optimum Ireq of a transport.
SAVINGS
IN I req’ 7 0
2.5
2. 0
1.5
1.0
. 5
0
-. 5
/ /
/ /
/ /
OPTIMALLY RESIZED BASELINE CONFIGURATION
0 BASELINE WITH NOMINAL DRAG ---
/ I I I I I I 1
-5 0 5 10 15 20 25 30 IMPROVEMENT IN WING DRAG COEFFICIENT,%
Figure 12.- Impact of reductions i n wing drag coefficient upon the design and optimm Ireq of a transport.
32
10
8
6 SAVINGS
I N $eq' 4
7 0
2
0
-2
0
OPTIMALLY RESIZED BASELINE CONFIGURATION
0 BASELINE WITH NOMINAL TSFC
I I I I I I -5 0 5 10 15 20 25
IMPROVEMENT IN TSFC, k
Figure 13.- Impact of technology improvements to reduce engine f u e l c o n s u n p t i o n upon des ign and optimum Ireq of t h e t r a n s p x t .
OPTIMALLY RES IZED BASELINE CONFIGURATION
0 BASELINE WITH NOMINAL C . /
SAVINGS 1 1
/ "" ""
O K - -
-1 (r - ".I ~~ 1" "". ~-1~ 2 I I I I -10 0 10 20 30 40 50 60 70 80
DECREASE IN CRUISE P ITCHINGMOMENT COEFFICIENT, %
F i g u r e 14.- S e n s i t i v i t y of optimun design to r e d u c t i o n s i n t h e h igh p i tch ing manents assuned in the supercritical aerodynamic mode 1.
33

f
25
20
. SAVINGS 15 WITH
RESPECT 10 TO
BASELINE, 7 0 5
0
-5
A I RPLANE GROSS WE I GHT
/
/
/
I req
OPTIMALLY RESIZED BASELINE CONFIGURATION "_
O NOMINAL STRUCTURAL REDUCTION (0%) I I I I I I
-5 0 5 10 15 20 25
REDUCTION IN AIRPLANE EMPTY WEIGHT, 70
Figure 15.- Impact of structural efficiency of basic construction materials upon optimun transport design.
SAVINGS WITH
RESPECT TO
BASELINE, %
OPTIMALLY RES IZED BASELINE CONFIGURATION
7 - OPERATING EMPTY WEIGHT
6 -
0 .1 . 2 . 3 . 4 . 5 .6 . 7 . 8
INCREMENTAL REDUCTION I N D E S I G N L I M I T LOAD, g units
Figure 16.- Impact of reducing design limit load factors w i t h active controls.
34

5 r .
SAV INGS IN
Ireql %
2 1 x
-1
4 - 3 - 2 - 1- 0 -
-1 -
-2 - OVERR I DE
\ \ \ 2
CONTROL CONSTRAINTS
-3 -4
-
- 0 BASELINE WITH NOMINAL SM (5%)
-5 - -OPTIMALLY RES IZED -6 I I I I I I I I 1
-25 -20 -15 -10 -5 0 5 10 15 20 M I N I M U M ALLOWABLE STATIC MARGIN, %MAC
CONSTRAINTS
" I l l l l l l l l l
OVERR I DE
0 BASELINE WITH NOMINAL SM (5%) -5 -6
-OPTIMALLY RES IZED
-25 -20 -15 -10 -5 0 5 10 15 20 M I N I M U M ALLOWABLE STATIC MARGIN, %MAC
Figure 17.- Impact of reductions i n s t a t i c margin constraints upon Ireq of an optimun transport.
10 -
8 - 6 - 4 -
SAVINGS -
0 - IN Ireq' -2 -
7" -4
- - OPTIMALLY RESIZED -6
-
-8 - 0 BASELINE WITH NOMINAL C (3.15) -10 - -12 I I I I I I I 1
L. max
2.4 2.8 3.2 3.6 4.0
MAXIMUM LIFT COEFFICIENT IN LANDING CONFIGURATION, C L. max
Figure 18.- Impact of changes i n maximun l i f t c o e f f i c i e n t on the optimum Ireq of a transport.
35

1. Report No. 2. Government Accession No. NASA TP-1762
.. "_ 4. Title and Subtitle
USE OF CONSTRAINED OPTIMIZATION IN THE CONCEPTUAL DESIGN OF A MEDIUM-RANGE SUBSONIC TRANSPORT
7. Author(s1 -~
Steven M. Sliwa
9. Performing Organization Name and Address
NASA Langley Research Center Hampton, VA 23665
3. Recipient's Catalog No.
6. Performing Organization Code
505-34-33-05 8. Performing Organization Report No.
I L-13946 2 10. Work Unit No.
1 11. Contract or Grant No. I
~~ ~~ " . . _ ~- 13. Type of Report and Period Covered
12. Sponsoring Agency Name and Address
National Aeronautics and Space Administration Washington, DC 20546
15. Supplementary Notes
~~~ . "~ " ." . - . ~ - ~ - .
16. Abstract
Constrained parameter optimization was used to perform the optimal conceptual design of a medium-range transport configuration. The impact of choosing a given performance index was studied, and the required income for a 15-percent return- on-investment was proposed as a figure-of-merit. A number of design constants and constraint functions were systematically varied to document the sensitivities of the optimal design to a variety of economic and technological assumptions. A comparison was made for each of the parameter variations between the baseline configuration and the optimally redesigned configuration.
- " . -._. . . " - .~. -~
Constrained optimization Nonlinear programming Economics Sensitivity to design parameters Subject Category 05
19. Security Classif. (of this report) 20. Security Classif. (of this page)
Unclassified Unclassified
For sale by the Natlonal Technical Information Servlce. Sprlnefleld. Vlrglnla 22161
NASA-Lanql ey, 1980
Y

$5 l a
National Aeronautics and Space Administration
Washington, D.C. 20546
THIRD-CLASS BULK RATE
Official Business - .
Penalty for Private Use, $300 "
' .-
. . 1 1 IU,A, 011281 ~ 0 0 9 0 3 ~ s
DEPT O F THE A I R FORCE AI? WEAPONS L A B O R A T O f i l Y ATTN: TECHNICAL L I B B A R Y (SUI,) K I R T L A N D AFB NM 8 7 1 1 7
,
. - , .
- 1 Postage and Fees Paid National Aeronautics and Space Administration NASA451
. - ,
Postal Manual) Do Not Return If Undeliverable (Section 158
, .