Clarus 590-690 Gas Chromatography Consumables and Supplies ...

EXECUTIVE SUMMARY OF
DRAFT EIA REPORT
OF
CLARUS CHEM PVT. LTD
For
Proposed Bulk Drug Intermediates
Manufacturing Unit
AT
SY NO: 173/B1, OBULAPURAM VILLAGE,
D.HIREHAL MANDAL, ANANTAPUR DISTRICT,
ANDHRA PRADESH
PREPARED BY
Rightsource Industrial Solutions Pvt. Ltd
Plot No: 203, H.No:5-36/203, Prashanthi Nagar,
IDA, Kukatpally, Hyderabad – 500072.
Ph: 040-65873137, 23070602, 23075699, 40126589.
Fax: 040-23070602. Mail: [email protected]
NABET Accreditation No. NABET/EIA/1518/SA 038
Executive Summary of Draft EIA Report Clarus Chem Pvt. Ltd.
Prepared By Rightsource Industrial Solutions Pvt. Ltd. Page - 1 -
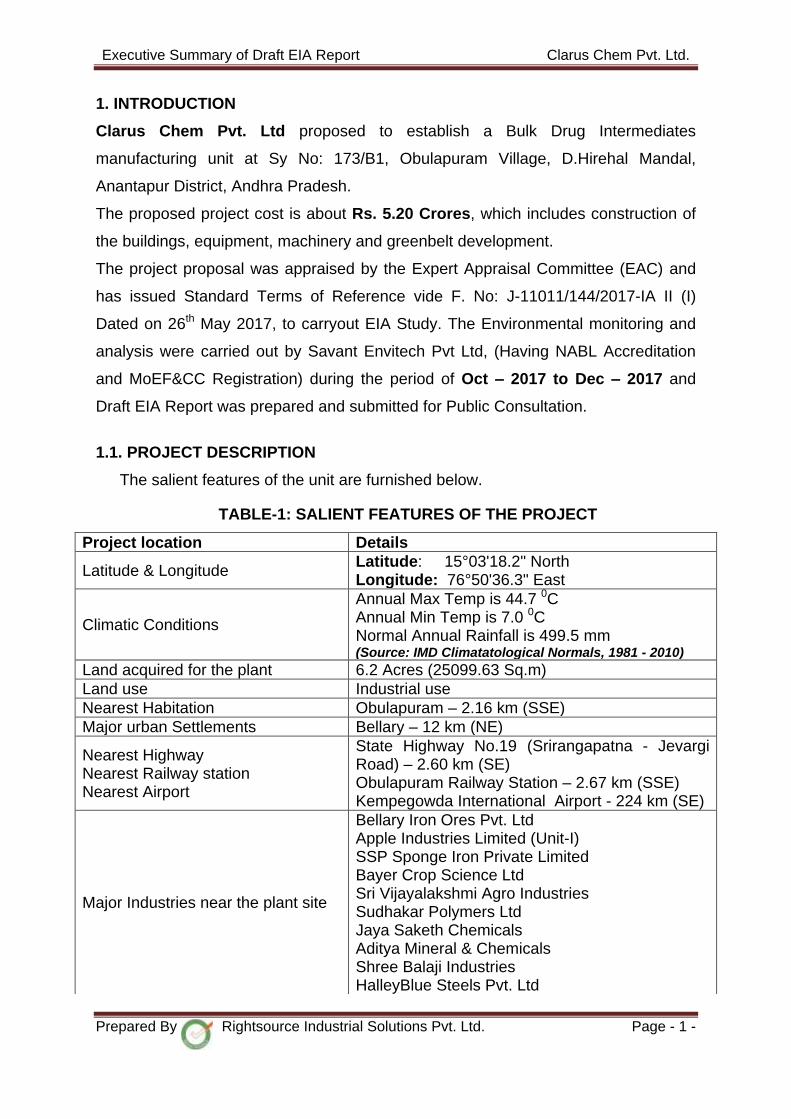
1. INTRODUCTION
Clarus Chem Pvt. Ltd proposed to establish a Bulk Drug Intermediates
manufacturing unit at Sy No: 173/B1, Obulapuram Village, D.Hirehal Mandal,
Anantapur District, Andhra Pradesh.
The proposed project cost is about Rs. 5.20 Crores, which includes construction of
the buildings, equipment, machinery and greenbelt development.
The project proposal was appraised by the Expert Appraisal Committee (EAC) and
has issued Standard Terms of Reference vide F. No: J-11011/144/2017-IA II (I)
Dated on 26th May 2017, to carryout EIA Study. The Environmental monitoring and
analysis were carried out by Savant Envitech Pvt Ltd, (Having NABL Accreditation
and MoEF&CC Registration) during the period of Oct – 2017 to Dec – 2017 and
Draft EIA Report was prepared and submitted for Public Consultation.
1.1. PROJECT DESCRIPTION
The salient features of the unit are furnished below.
TABLE-1: SALIENT FEATURES OF THE PROJECT
Project location Details
Latitude & Longitude Latitude: 15°03'18.2" North Longitude: 76°50'36.3" East
Climatic Conditions
Annual Max Temp is 44.7 0C Annual Min Temp is 7.0 0C Normal Annual Rainfall is 499.5 mm (Source: IMD Climatatological Normals, 1981 - 2010)
Land acquired for the plant 6.2 Acres (25099.63 Sq.m)
Land use Industrial use
Nearest Habitation Obulapuram – 2.16 km (SSE)
Major urban Settlements Bellary – 12 km (NE)
Nearest Highway Nearest Railway station Nearest Airport
State Highway No.19 (Srirangapatna - Jevargi Road) – 2.60 km (SE) Obulapuram Railway Station – 2.67 km (SSE) Kempegowda International Airport - 224 km (SE)
Major Industries near the plant site
Bellary Iron Ores Pvt. Ltd Apple Industries Limited (Unit-I) SSP Sponge Iron Private Limited Bayer Crop Science Ltd Sri Vijayalakshmi Agro Industries Sudhakar Polymers Ltd Jaya Saketh Chemicals Aditya Mineral & Chemicals Shree Balaji Industries HalleyBlue Steels Pvt. Ltd

Executive Summary of Draft EIA Report Clarus Chem Pvt. Ltd.
Prepared By Rightsource Industrial Solutions Pvt. Ltd. Page - 2 -
2.0 PROCESS DESCRIPTION
The manufacturing process of Bulk Drug Intermediates consists of chemical
synthesis extending to stages of processing involving different type of chemical
reactions. Total production capacity of proposal will be 45 TPM. (Given in Table -2).
The unit will take adequate control measures for storage and handling of Raw
materials and cylinders with in factory premises.
TABLE- 2: PROPOSED PRODUCTS AND QUANTITIES
S. No. Name of the Product Quantity in
TPM
1 1-(2,3 Dichlorophenyl) piperazine Hydrochloride (Aripiparazol Intermediate)
6
2 1-(4-Methoxy-Phenyl)-4-(4-Nitro-Phenyl)-Piperazine(Itraconazole Intermediate)
6
3 1-Acetyl-4-(Hydroxy Phenyl) Piperazine(Itraconazole Intermediate)
6
4 4-Phenyl butanol (Intermediate) 2
5 5-Cyano Phthalide (Citalopram Intermediate)
5
6 Bis (2-chloroethyl) amine Hydrochloride (Itraconazole Intermediate)
6
7 Diphenyl (Piperidin-4-yl) Methanol (Fexofenadine intermediate)
6
8 n-Acetyl Piperzine(Intermediate) 2
9 N-Methyl-1-Napthalenemethylamine Hydrochloride(Terbinafine Hydrochloride)
6
Total 45
2.1 RESOURCE REQUIREMENT & INFRASTRUCTURE FACILITIES
A) Land Use Details:
The proposed unit is in an existing area of 6.20 Acres (25099.63 SQM), the usage
details are given table 3.
Karthik Mineral Industries
National Parks None within 10 km radius
Wild life sanctuary None
Water Bodies within 10 km radius Tungabhadra High Level Canal – 9.1 km (NE) Gokulapur Halla – 8.0 km (W)
Reserve Forest within 10 km radius
Bellary R.F. - 0.10 km (N) Mincheri R.F.2.75 km (SE) Metriki R.F. - 5.00 km (W) Hirehalu R.F. - 6.55 km (SW)
Executive Summary of Draft EIA Report Clarus Chem Pvt. Ltd.
Prepared By Rightsource Industrial Solutions Pvt. Ltd. Page - 3 -
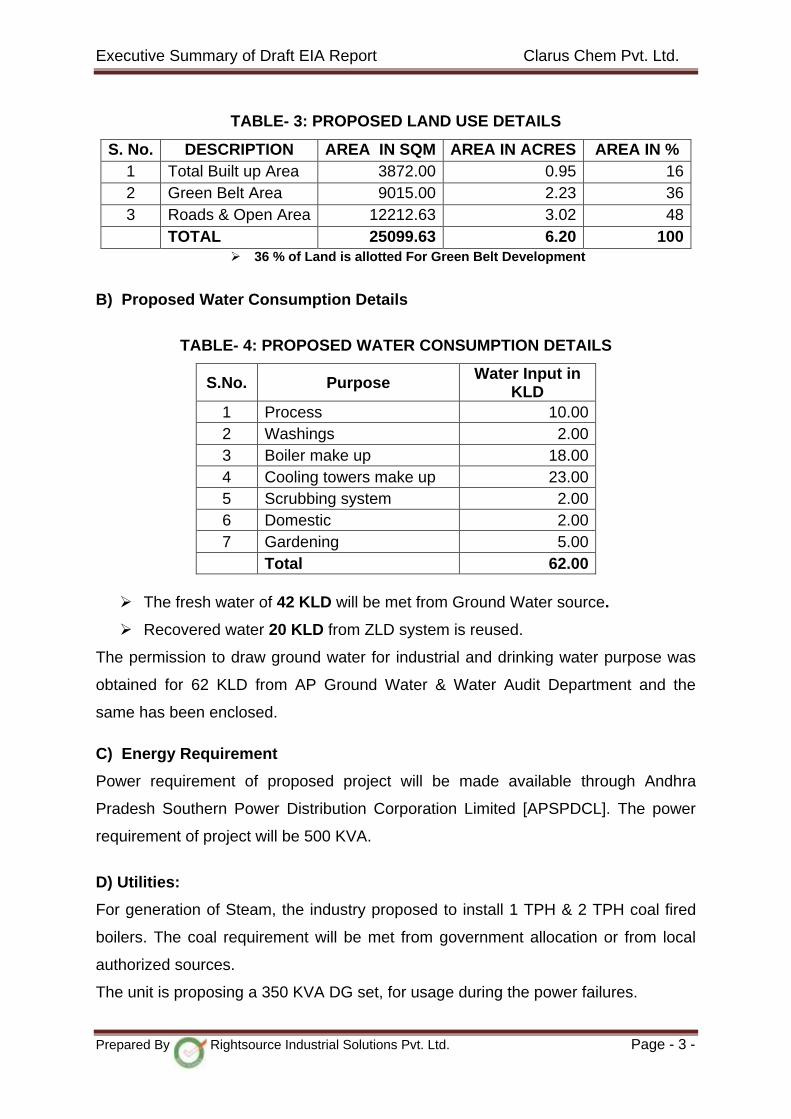
TABLE- 3: PROPOSED LAND USE DETAILS
S. No. DESCRIPTION AREA IN SQM AREA IN ACRES AREA IN %
1 Total Built up Area 3872.00 0.95 16
2 Green Belt Area 9015.00 2.23 36
3 Roads & Open Area 12212.63 3.02 48
TOTAL 25099.63 6.20 100
36 % of Land is allotted For Green Belt Development
B) Proposed Water Consumption Details
TABLE- 4: PROPOSED WATER CONSUMPTION DETAILS
S.No. Purpose Water Input in
KLD
1 Process 10.00
2 Washings 2.00
3 Boiler make up 18.00
4 Cooling towers make up 23.00
5 Scrubbing system 2.00
6 Domestic 2.00
7 Gardening 5.00
Total 62.00
The fresh water of 42 KLD will be met from Ground Water source.
Recovered water 20 KLD from ZLD system is reused.
The permission to draw ground water for industrial and drinking water purpose was
obtained for 62 KLD from AP Ground Water & Water Audit Department and the
same has been enclosed.
C) Energy Requirement
Power requirement of proposed project will be made available through Andhra
Pradesh Southern Power Distribution Corporation Limited [APSPDCL]. The power
requirement of project will be 500 KVA.
D) Utilities:
For generation of Steam, the industry proposed to install 1 TPH & 2 TPH coal fired
boilers. The coal requirement will be met from government allocation or from local
authorized sources.
The unit is proposing a 350 KVA DG set, for usage during the power failures.

Executive Summary of Draft EIA Report Clarus Chem Pvt. Ltd.
Prepared By Rightsource Industrial Solutions Pvt. Ltd. Page - 4 -
The emission details are presented in table No.6 & 7.
TABLE- 5: DETAILS OF UTILITIES
TABLE- 6: EMISSION CHARACTERISTIC DETAILS OF PROPOSED BOILER
Particulars Units 1.0 TPH Coal fired
Boiler 2.0 TPH Coal fired
Boiler
Type of Fuel -- Indian Coal with CV of 4000 kcal/kg to
5000 kcal/kg
Indian Coal with CV of 4000 kcal/kg to
5000 kcal/kg
Coal Consumption TPD 2.5 8.0
Ash Content % 35 35
Sulphur Content % 0.4 0.4
No. of Stacks No 1 1
Height of stack M 30 30
Diameter of Stack M 0.30 0.35
Temperature of Flue Gas oC 170 175
Velocity of Flue Gas m/s 14 14
Particulate Matter gm/sec 0.17 0.23
Sulphur dioxide emission gm/sec 0.33 0.69
Oxides of Nitrogen emission gm/sec 0.76 1.58
TABLE- 7: STACK EMISSION DETAILS OF PROPOSED DG SET
Capacity in KVA
Emission of SPM in mg/Nm3
Emission Of SO2 in mg/Nm3
Emission of NOx in mg/Nm3
Stack dia. in m
Flue Gas Temp. in OC
Stack Height in (m)
Flue gas Velocity in m/sec.
350 KVA 70.0 135.0 160.0 0.30 290 10 20.50
E) Pollution Control Equipment:
i) Cyclone separator: The denser particles which are carried away by boiler flue
gases will get separated in the cyclone separator and collected in the bottom of the
cyclone separator at a definite interval.
S. No Description Capacity
1 Coal fired boiler 1 TPH & 2 TPH
2 D.G. Set 350 KVA
3 Cooling Towers 100 TR & 250 TR
4 Electricity supply from APSPDCL.
500 KVA
Fuel
5 Coal 10.5 TPD
6 Diesel 56 Liters/Day
Executive Summary of Draft EIA Report Clarus Chem Pvt. Ltd.
Prepared By Rightsource Industrial Solutions Pvt. Ltd. Page - 5 -
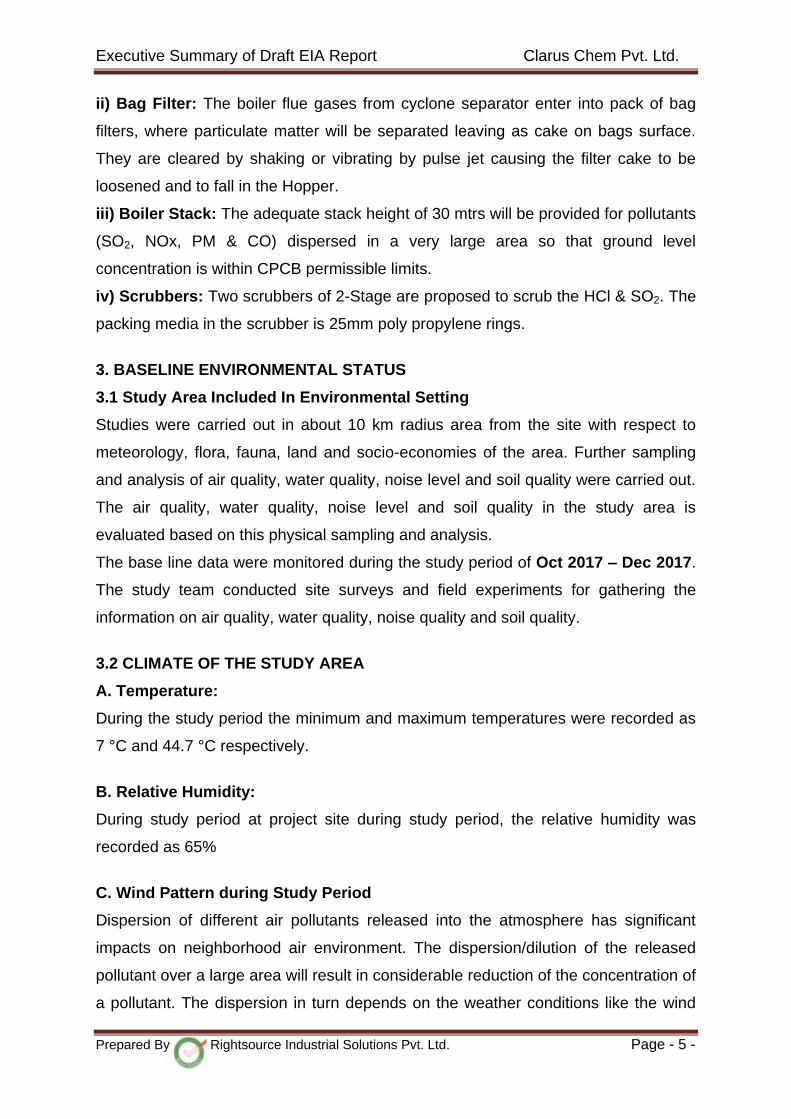
ii) Bag Filter: The boiler flue gases from cyclone separator enter into pack of bag
filters, where particulate matter will be separated leaving as cake on bags surface.
They are cleared by shaking or vibrating by pulse jet causing the filter cake to be
loosened and to fall in the Hopper.
iii) Boiler Stack: The adequate stack height of 30 mtrs will be provided for pollutants
(SO2, NOx, PM & CO) dispersed in a very large area so that ground level
concentration is within CPCB permissible limits.
iv) Scrubbers: Two scrubbers of 2-Stage are proposed to scrub the HCl & SO2. The
packing media in the scrubber is 25mm poly propylene rings.
3. BASELINE ENVIRONMENTAL STATUS
3.1 Study Area Included In Environmental Setting
Studies were carried out in about 10 km radius area from the site with respect to
meteorology, flora, fauna, land and socio-economies of the area. Further sampling
and analysis of air quality, water quality, noise level and soil quality were carried out.
The air quality, water quality, noise level and soil quality in the study area is
evaluated based on this physical sampling and analysis.
The base line data were monitored during the study period of Oct 2017 – Dec 2017.
The study team conducted site surveys and field experiments for gathering the
information on air quality, water quality, noise quality and soil quality.
3.2 CLIMATE OF THE STUDY AREA
A. Temperature:
During the study period the minimum and maximum temperatures were recorded as
7 °C and 44.7 °C respectively.
B. Relative Humidity:
During study period at project site during study period, the relative humidity was
recorded as 65%
C. Wind Pattern during Study Period
Dispersion of different air pollutants released into the atmosphere has significant
impacts on neighborhood air environment. The dispersion/dilution of the released
pollutant over a large area will result in considerable reduction of the concentration of
a pollutant. The dispersion in turn depends on the weather conditions like the wind

Executive Summary of Draft EIA Report Clarus Chem Pvt. Ltd.
Prepared By Rightsource Industrial Solutions Pvt. Ltd. Page - 6 -
speed, wind direction, temperature, relative humidity, mixing height, cloud cover and
also the rainfall in the area.
Wind speed and direction data recorded during the study period is useful in
identifying the influence of meteorology on the air quality of the area. Wind roses on
sixteen sector basis have been drawn. Wind directions and wind speed frequency
observed during study period is given in Table 3.5 and wind rose diagrams are given
in Figure 3.7
The following observations can be made from the collected data;
Calm period is observed to be 16.9 % during the time of monitoring.
The predominant wind direction is S & SE.
Other than predominant wind directions wind was blowing in E direction.
Average wind speed 2.73 m/s
Mostly the wind speeds are observed to be in the range of 0.5 - 2.1 m/sec,
2.1-3.6 m/Sec, 3.6 -5.7 m/Sec, with frequency of distribution percentages
ranges from 37.7, 16.2, & 15.2.
D. Rainfall
No rainfall during the study period at plant site. Average Annual Rainfall is 499.5
mm.
3.3 SAMPLING LOCATION DETAILS
Total eight locations were selected for Base line status. Air, Water & Noise results
are presented in Table 10, 11 & 12 respectively.
3.4 AMBIENT AIR QUALITY
The ambient air monitoring was carried out for 24 hours a day, twice a week for 12
week per location in the study area. Ambient Air Quality Monitoring (AAQM) was
carried out at eight locations during period of Oct 2017 – Dec 2017.
1. Particulate Matter (PM10)
2. The maximum and minimum concentrations for PM10 were recorded in the
study area showed 98th percentile values in the range of 54.7 – 60.8 μg/ m3.
The maximum concentration 60.8 μg/ m3 were recorded at sampling locations
at Project Site. The concentrations of PM10 are well below the CPCB standard
of 100 μg/ m3.
Executive Summary of Draft EIA Report Clarus Chem Pvt. Ltd.
Prepared By Rightsource Industrial Solutions Pvt. Ltd. Page - 7 -
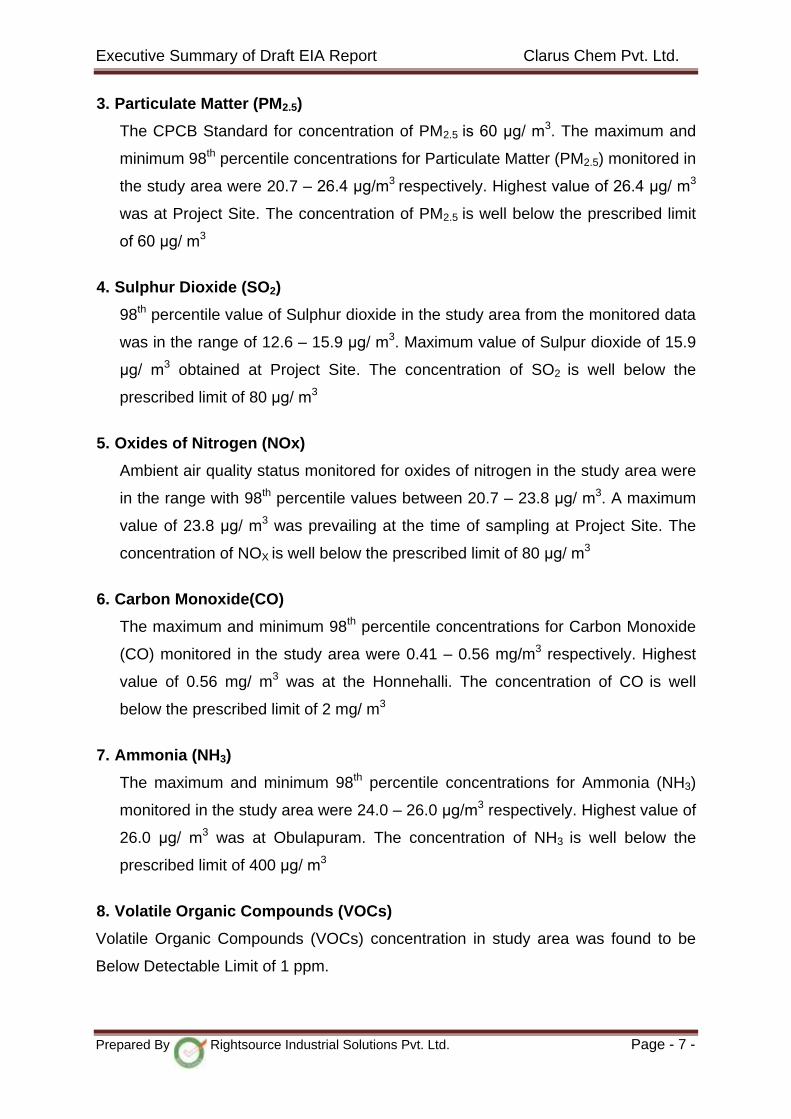
3. Particulate Matter (PM2.5)
The CPCB Standard for concentration of PM2.5 is 60 μg/ m3. The maximum and
minimum 98th percentile concentrations for Particulate Matter (PM2.5) monitored in
the study area were 20.7 – 26.4 μg/m3 respectively. Highest value of 26.4 μg/ m3
was at Project Site. The concentration of PM2.5 is well below the prescribed limit
of 60 μg/ m3
4. Sulphur Dioxide (SO2)
98th percentile value of Sulphur dioxide in the study area from the monitored data
was in the range of 12.6 – 15.9 μg/ m3. Maximum value of Sulpur dioxide of 15.9
μg/ m3 obtained at Project Site. The concentration of SO2 is well below the
prescribed limit of 80 μg/ m3
5. Oxides of Nitrogen (NOx)
Ambient air quality status monitored for oxides of nitrogen in the study area were
in the range with 98th percentile values between 20.7 – 23.8 μg/ m3. A maximum
value of 23.8 μg/ m3 was prevailing at the time of sampling at Project Site. The
concentration of NOX is well below the prescribed limit of 80 μg/ m3
6. Carbon Monoxide(CO)
The maximum and minimum 98th percentile concentrations for Carbon Monoxide
(CO) monitored in the study area were 0.41 – 0.56 mg/m3 respectively. Highest
value of 0.56 mg/ m3 was at the Honnehalli. The concentration of CO is well
below the prescribed limit of 2 mg/ m3
7. Ammonia (NH3)
The maximum and minimum 98th percentile concentrations for Ammonia (NH3)
monitored in the study area were 24.0 – 26.0 μg/m3 respectively. Highest value of
26.0 μg/ m3 was at Obulapuram. The concentration of NH3 is well below the
prescribed limit of 400 μg/ m3
8. Volatile Organic Compounds (VOCs)
Volatile Organic Compounds (VOCs) concentration in study area was found to be
Below Detectable Limit of 1 ppm.
Executive Summary of Draft EIA Report Clarus Chem Pvt. Ltd.
Prepared By Rightsource Industrial Solutions Pvt. Ltd. Page - 8 -
The ambient air quality monitoring results indicates that the overall air quality in the
study area is within permissible standards prescribed by NAAQ Standards.

Executive Summary of Draft EIA Report Clarus Chem Pvt. Ltd.
Prepared By Rightsource Industrial Solutions Pvt. Ltd. Page - 9 -
TABLE- 8: THE MAXIMUM, MINIMUM & 98TH PERCENTILE VALUES FOR ALL THE
SAMPLING LOCATIONS
Code Name of
Sampling Location
PM 10(µg/M3) PM 2.5(µg/M
3) SO2(µg/M
3) NOX(µg/M
3) CO (mg/M
3) NH3 (µg/M
3)
Min Max 98th
Min Max 98th
Min Max 98th
Min Max 98th
Min Max 98th
Min Max 98th
A1 Project Site 56.8 61.4 60.8 22.5 26.5 26.4 12.5 15.9 15.9 20.7 23.8 23.8 0.28 0.41 0.41 22.0 26.0 25.5
A2 Belagallu Tanda 56.3 59.4 59.3 20.5 26.1 26.0 10.5 14.6 14.4 18.4 22.6 22.6 0.28 0.43 0.42 21.7 24.1 24.1
A3 Honnehalli 57.3 59.7 59.6 21.4 25.2 24.9 11.5 13.9 13.8 19.2 21.9 21.9 0.37 0.59 0.56 21.0 25.0 25.0
A4 Mincheri 56.1 59.8 59.7 20.9 24.5 24.2 11.6 13.6 13.5 19.2 21.7 21.6 0.36 0.48 0.47 21.0 25.0 25.0
A5 Obulapuram 46.8 57.8 57.6 18.6 23.9 23.8 10.1 13.4 13.1 18.2 21.4 21.2 0.32 0.48 0.47 20.0 26.0 26.0
A6 Dandinahirehalupete
49.6 56.8 56.2 18.6 20.7 20.7 10.4 12.7 12.6 18.2 20.7 20.7 0.31 0.47 0.47 21.0 26.0 25.5
A7 Basapur 51.2 58.2 58.0 18.4 20.8 20.8 10.2 13.4 13.1 18.2 21.4 21.0 0.36 0.46 0.44 21.0 24.0 24.0
A8 Hirehalu Siddapuram
50.4 54.7 54.7 20.4 23.1 23.0 11.4 13.7 13.6 19.4 21.9 21.9 0.30 0.50 0.50 21.0 26.0 25.5
NAAQ Standards’ 100 60 80 80 2 400
Executive Summary of Draft EIA Report Clarus Chem Pvt. Ltd.
Prepared By Rightsource Industrial Solutions Pvt. Ltd. Page - 10 -
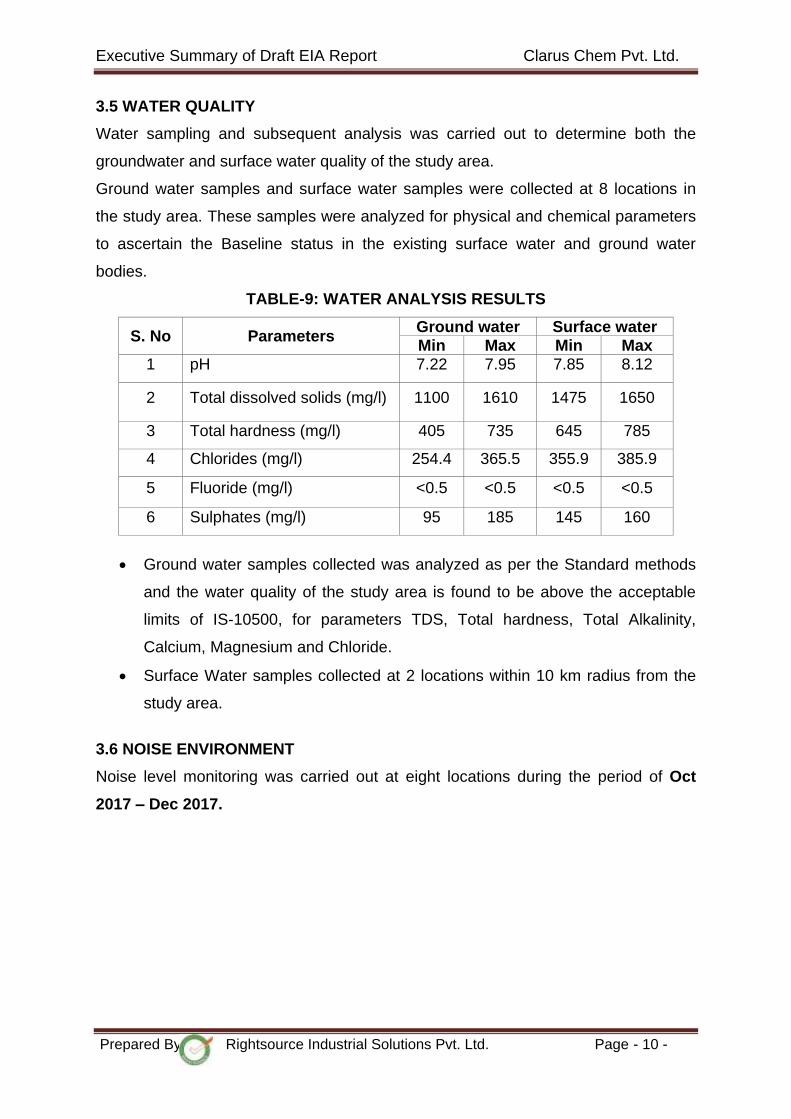
3.5 WATER QUALITY
Water sampling and subsequent analysis was carried out to determine both the
groundwater and surface water quality of the study area.
Ground water samples and surface water samples were collected at 8 locations in
the study area. These samples were analyzed for physical and chemical parameters
to ascertain the Baseline status in the existing surface water and ground water
bodies.
TABLE-9: WATER ANALYSIS RESULTS
S. No Parameters Ground water Surface water Min Max Min Max
1 pH 7.22 7.95 7.85 8.12
2 Total dissolved solids (mg/l) 1100 1610 1475 1650
3 Total hardness (mg/l) 405 735 645 785
4 Chlorides (mg/l) 254.4 365.5 355.9 385.9
5 Fluoride (mg/l) <0.5 <0.5 <0.5 <0.5
6 Sulphates (mg/l) 95 185 145 160
Ground water samples collected was analyzed as per the Standard methods
and the water quality of the study area is found to be above the acceptable
limits of IS-10500, for parameters TDS, Total hardness, Total Alkalinity,
Calcium, Magnesium and Chloride.
Surface Water samples collected at 2 locations within 10 km radius from the
study area.
3.6 NOISE ENVIRONMENT
Noise level monitoring was carried out at eight locations during the period of Oct
2017 – Dec 2017.
Executive Summary of Draft EIA Report Clarus Chem Pvt. Ltd.
Prepared By Rightsource Industrial Solutions Pvt. Ltd. Page - 11 -
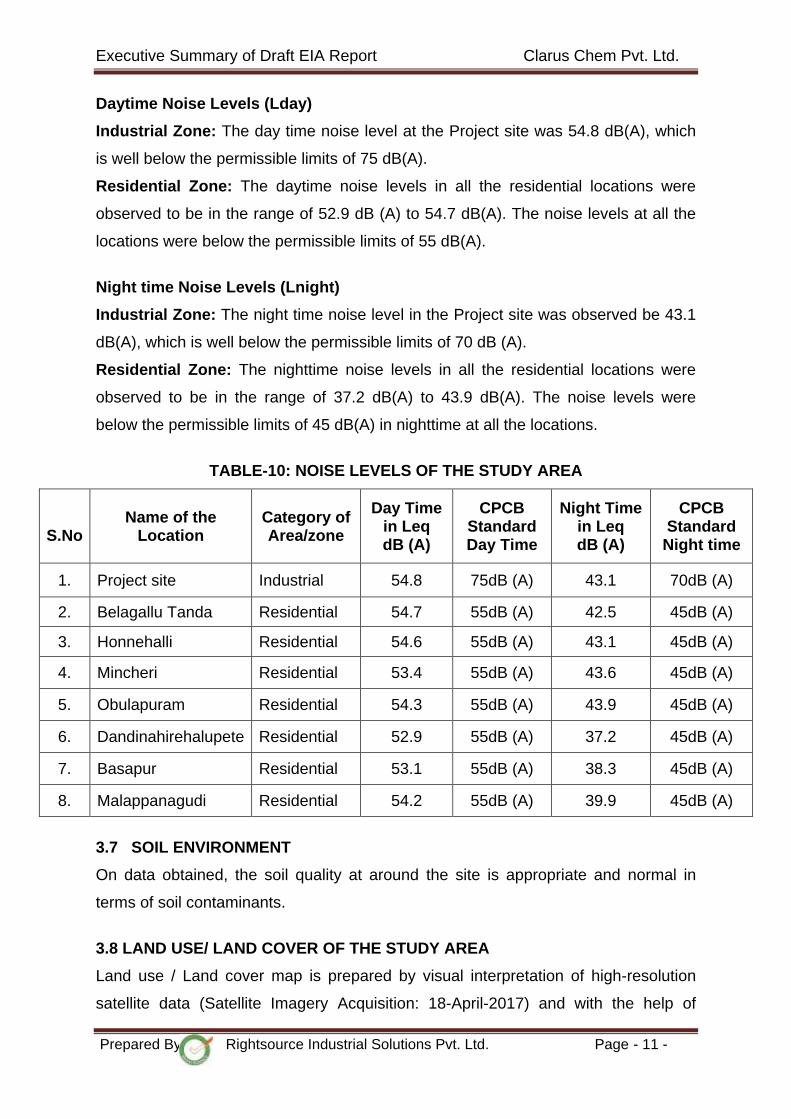
Daytime Noise Levels (Lday)
Industrial Zone: The day time noise level at the Project site was 54.8 dB(A), which
is well below the permissible limits of 75 dB(A).
Residential Zone: The daytime noise levels in all the residential locations were
observed to be in the range of 52.9 dB (A) to 54.7 dB(A). The noise levels at all the
locations were below the permissible limits of 55 dB(A).
Night time Noise Levels (Lnight)
Industrial Zone: The night time noise level in the Project site was observed be 43.1
dB(A), which is well below the permissible limits of 70 dB (A).
Residential Zone: The nighttime noise levels in all the residential locations were
observed to be in the range of 37.2 dB(A) to 43.9 dB(A). The noise levels were
below the permissible limits of 45 dB(A) in nighttime at all the locations.
TABLE-10: NOISE LEVELS OF THE STUDY AREA
S.No
Name of the
Location
Category of Area/zone
Day Time in Leq dB (A)
CPCB Standard Day Time
Night Time in Leq dB (A)
CPCB Standard Night time
1. Project site Industrial 54.8 75dB (A) 43.1 70dB (A)
2. Belagallu Tanda Residential 54.7 55dB (A) 42.5 45dB (A)
3. Honnehalli Residential 54.6 55dB (A) 43.1 45dB (A)
4. Mincheri Residential 53.4 55dB (A) 43.6 45dB (A)
5. Obulapuram Residential 54.3 55dB (A) 43.9 45dB (A)
6. Dandinahirehalupete Residential 52.9 55dB (A) 37.2 45dB (A)
7. Basapur Residential 53.1 55dB (A) 38.3 45dB (A)
8. Malappanagudi Residential 54.2 55dB (A) 39.9 45dB (A)
3.7 SOIL ENVIRONMENT
On data obtained, the soil quality at around the site is appropriate and normal in
terms of soil contaminants.
3.8 LAND USE/ LAND COVER OF THE STUDY AREA
Land use / Land cover map is prepared by visual interpretation of high-resolution
satellite data (Satellite Imagery Acquisition: 18-April-2017) and with the help of

Executive Summary of Draft EIA Report Clarus Chem Pvt. Ltd.
Prepared By Rightsource Industrial Solutions Pvt. Ltd. Page - 12 -
Survey of India Topographic maps on 1: 50,000 scale. Two seasons’ data (Summer
year 2017) is used for the delineation of different units. The units are confirmed by
the ground truth/field visits.
TABLE-11: LAND USE / LAND COVER OF THE STUDY AREA
S. No LANDUSE Area in SQ.KM
Area in Percentage (%)
1 Built Up Land 24.806 7.9
2 Water Bodies 10.676 3.4
3 Forest 48.984 15.6
4 Crop Land 171.444 54.6
5 Waste Lands 58.090 18.5
Total 314.00 100
3.9 DEMOGRAPHIC AND SOCIO-ECONOMIC PROFILE
The total population of the study area is 47,010 in which male and female
population constitutes about 50.70% and 49.30% in the study area
respectively.
The literate male and female in the study area are 13,661 and 8,936 which
implies that the percentage of literacy rate is 41.33% with male and 22.46%
with female respectively.
In the study area the main and marginal workers are 16,550 (35.2%) and
4,403 (3.36%) respectively of the total population while the remaining 26,057
(55.42%) constitutes non-workers
All the Villages, in the study area, are electrified – both for Domestic Purpose
and common facilities like, Street Lights, Public Water Pumping, etc. and also
are provided with Domestic Water.
4.0 IDENTIFICATION, PREDICTION & MITIGATION MEASURES
4.1 Expected Air Environment
A. PROCESS EMISSIONS DETAILS
The Predicted Process emissions are SO2, O2, CO2 & HCl which are liberated from
manufacturing process of proposed products.

Executive Summary of Draft EIA Report Clarus Chem Pvt. Ltd.
Prepared By Rightsource Industrial Solutions Pvt. Ltd. Page - 13 -
TABLE-12: PROCESS EMISSION DETAILS
S. No. Name of the Gas Quantity Treatment Method
1 Carbon dioxide 14 Kg/Day Dispersed into the atmosphere
2 Sulphur dioxide 272 Kg/Day Scrubbed by using Caustic Lye Solution
3 Hydrogen chloride 372 Kg/Day Scrubbed by using chilled water media
4 Oxygen 7 Kg/Day Dispersed into the atmosphere
4.2 PROPOSED PROCESS EMISSION CONTROL SYSTEM
Scrubbers with 300 mm (Diameter) X 3 meters (Height) & 300mm (Diameter) X 3
meters (Height) capacities will be installed for control of process emissions. The
Schematic diagram of emission control system is given below.
FIGURE-1: SCHEMATIC DIAGRAM OF PROPOSED EMISSION CONTROL
SYSTEM
B. EMISSIONS FROM BOILER
The Particulate matter generated from 1 TPH & 2 TPH Boilers will be controlled by
using cyclone separator followed by bag filters. The sulphur dioxide (SO2) and
oxides of nitrogen (NOX) from boiler will be dispersed in to atmosphere by providing
adequate stack height of 30 meters for effective dispersion and dilution.
Executive Summary of Draft EIA Report Clarus Chem Pvt. Ltd.
Prepared By Rightsource Industrial Solutions Pvt. Ltd. Page - 14 -
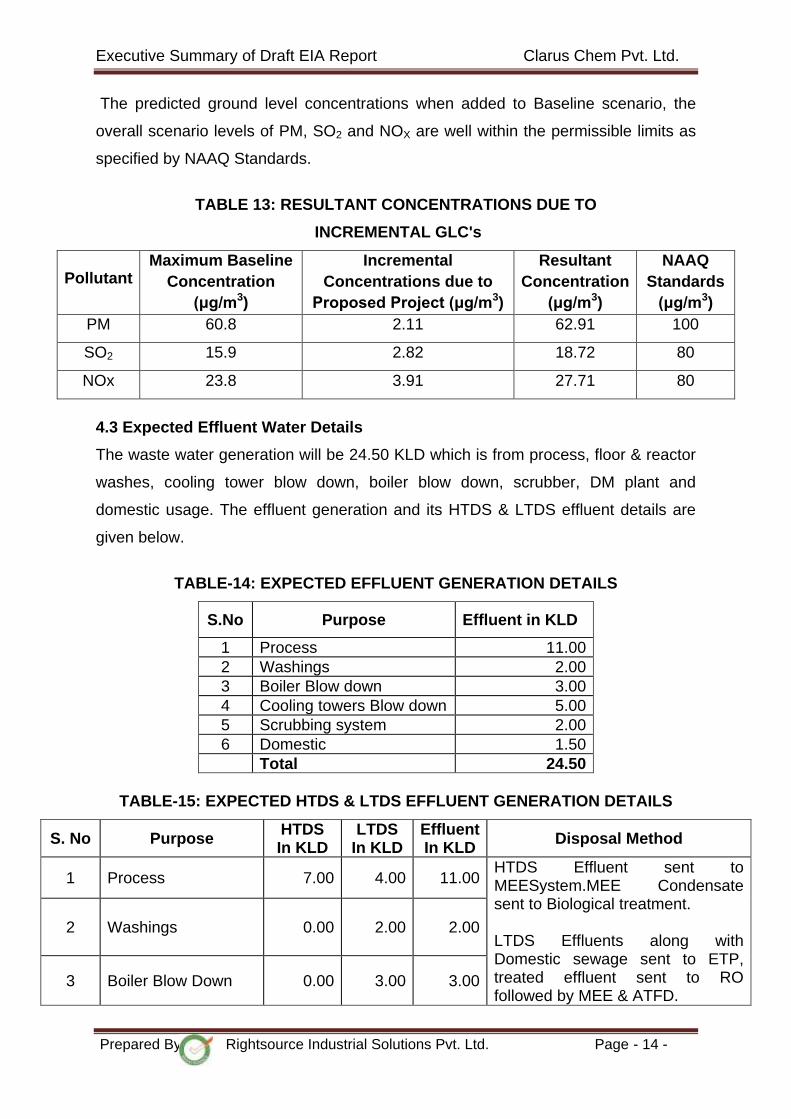
The predicted ground level concentrations when added to Baseline scenario, the
overall scenario levels of PM, SO2 and NOX are well within the permissible limits as
specified by NAAQ Standards.
TABLE 13: RESULTANT CONCENTRATIONS DUE TO
INCREMENTAL GLC's
Pollutant Maximum Baseline
Concentration
(μg/m3)
Incremental
Concentrations due to
Proposed Project (μg/m3)
Resultant
Concentration
(μg/m3)
NAAQ
Standards
(μg/m3)
PM 60.8 2.11 62.91 100
SO2 15.9 2.82 18.72 80
NOx 23.8 3.91 27.71 80
4.3 Expected Effluent Water Details
The waste water generation will be 24.50 KLD which is from process, floor & reactor
washes, cooling tower blow down, boiler blow down, scrubber, DM plant and
domestic usage. The effluent generation and its HTDS & LTDS effluent details are
given below.
TABLE-14: EXPECTED EFFLUENT GENERATION DETAILS
S.No Purpose Effluent in KLD
1 Process 11.00
2 Washings 2.00
3 Boiler Blow down 3.00
4 Cooling towers Blow down 5.00
5 Scrubbing system 2.00
6 Domestic 1.50
Total 24.50
TABLE-15: EXPECTED HTDS & LTDS EFFLUENT GENERATION DETAILS
S. No Purpose HTDS In KLD
LTDS In KLD
Effluent In KLD
Disposal Method
1 Process 7.00 4.00 11.00 HTDS Effluent sent to MEESystem.MEE Condensate sent to Biological treatment. LTDS Effluents along with Domestic sewage sent to ETP, treated effluent sent to RO followed by MEE & ATFD.
2 Washings 0.00 2.00 2.00
3 Boiler Blow Down 0.00 3.00 3.00

Executive Summary of Draft EIA Report Clarus Chem Pvt. Ltd.
Prepared By Rightsource Industrial Solutions Pvt. Ltd. Page - 15 -
4 Cooling towers Blow Down
0.00 5.00 5.00
RO Permeate and MEE Condensate water recovered for reuse MEE Salts collected and disposed to TSDF.
5 Scrubbing system 2.00 0.00 2.00
6 Domestic 0.00 1.50 1.50
Total 9.00 15.50 24.50
Effluent Treatment / Disposal: Zero Liquid Discharge (ZLD) concept consisting of
steam stripper, MEE system, ATFD, Biological Treatment and RO will be installed to
treat the effluents generated from plant and to reuse the treated water.
The MEE System with 20 KLD Capacity & RO system with 25 KLD Capacity will be
installed for treatment of effluents generated from plant operations.
4.4 Noise Environment
The main sources of noise pollution in the plant operations are Boiler, Reactors, DG
Set, compressors and other Noise generating units. Vehicular movements during
operation phase for loading / unloading of raw materials and finished products and
transporting activity may also increases the noise levels.
All the noise generating equipments like motors, gear boxes and compressors will be
regularly maintained with lubricating material to avoid noise generation. DG set will
be provided with acoustic enclosures. A thick greenbelt will be developed along the
periphery of the plant boundaries to minimize the noise pollution from the source.
4.5 Land Environment
The plant activities are unlikely to alter the land-use pattern in the project site. The
unit will take adequate measures for storage, handling and disposal of hazardous
waste. Hence, there will be no significant adverse impact on land environment.
4.6 Ecological Environment
Detailed flora and fauna studies were carried in the study area. As per baseline
studies, there are no endangered, threatened & protected plants and animal species
were recorded in the study area. Hence, no significant adverse impact is envisaged
on ecology.
Executive Summary of Draft EIA Report Clarus Chem Pvt. Ltd.
Prepared By Rightsource Industrial Solutions Pvt. Ltd. Page - 16 -
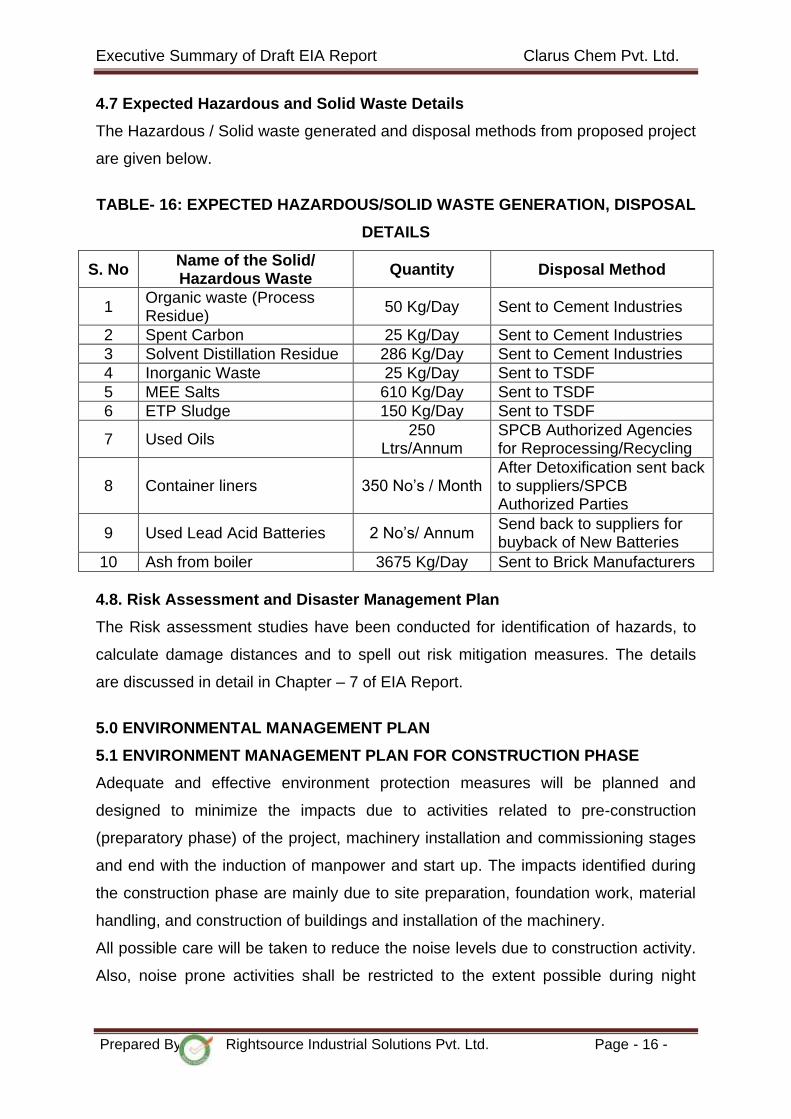
4.7 Expected Hazardous and Solid Waste Details
The Hazardous / Solid waste generated and disposal methods from proposed project
are given below.
TABLE- 16: EXPECTED HAZARDOUS/SOLID WASTE GENERATION, DISPOSAL
DETAILS
S. No Name of the Solid/ Hazardous Waste
Quantity Disposal Method
1 Organic waste (Process Residue)
50 Kg/Day Sent to Cement Industries
2 Spent Carbon 25 Kg/Day Sent to Cement Industries
3 Solvent Distillation Residue 286 Kg/Day Sent to Cement Industries
4 Inorganic Waste 25 Kg/Day Sent to TSDF
5 MEE Salts 610 Kg/Day Sent to TSDF
6 ETP Sludge 150 Kg/Day Sent to TSDF
7 Used Oils 250
Ltrs/Annum SPCB Authorized Agencies for Reprocessing/Recycling
8 Container liners 350 No’s / Month After Detoxification sent back to suppliers/SPCB Authorized Parties
9 Used Lead Acid Batteries 2 No’s/ Annum Send back to suppliers for buyback of New Batteries
10 Ash from boiler 3675 Kg/Day Sent to Brick Manufacturers
4.8. Risk Assessment and Disaster Management Plan
The Risk assessment studies have been conducted for identification of hazards, to
calculate damage distances and to spell out risk mitigation measures. The details
are discussed in detail in Chapter – 7 of EIA Report.
5.0 ENVIRONMENTAL MANAGEMENT PLAN
5.1 ENVIRONMENT MANAGEMENT PLAN FOR CONSTRUCTION PHASE
Adequate and effective environment protection measures will be planned and
designed to minimize the impacts due to activities related to pre-construction
(preparatory phase) of the project, machinery installation and commissioning stages
and end with the induction of manpower and start up. The impacts identified during
the construction phase are mainly due to site preparation, foundation work, material
handling, and construction of buildings and installation of the machinery.
All possible care will be taken to reduce the noise levels due to construction activity.
Also, noise prone activities shall be restricted to the extent possible during night
Executive Summary of Draft EIA Report Clarus Chem Pvt. Ltd.
Prepared By Rightsource Industrial Solutions Pvt. Ltd. Page - 17 -
particularly during the period of 10 PM to 6 AM in order to have minimum
environmental impact.
5.2 ENVIRONMENT MANAGEMENT PLAN FOR OPERATIONAL PHASE
A) Air Pollution Management
The industry will take measures for reduction of fugitive emissions emanating
out of process reactions by providing vent condensers.
Good ventilation will be provided to reduce the workroom concentrations.
Fugitive emissions will be reduced by providing vent condensers to the all the
reactors.
Adequate stack height of 30 Mtrs will be provided to the 1 TPH & 2 TPH coal
fired boilers.
Stack monitoring facilities for the periodic monitoring of the stack to verify the
compliance of the stipulated norms. Apart from this Cyclone Separator, Bag
filters will be provided to the boiler.
In order to minimize the air pollution, unit will develop greenbelt in and around
its premises.
B) Water Pollution Management
Effluent generated in the plant will be treated in Proposed ZLD system.
The industry is proposing to install a MEE System with 20 KLD capacity,
Biological Treatment system of 25 KLD and RO system with 25 KLD
capacities for treatment of 24.50 KLD effluents generated from plant
operations.
Total Water requirement is 62 KLD out of which 20 KLD water recovered from
ZLD system is reused. The fresh water of 42 KLD will be met from ground
water source.
Unit is proposed to recharge ground water through roof water harvesting pits
in the project area and rain water harvesting pits outside plant area wherever
possible to balance the water table.
Use of high-pressure hoses for cleaning the floor and process equipment to
reduce the amount of wastewater generated during washings.
Executive Summary of Draft EIA Report Clarus Chem Pvt. Ltd.
Prepared By Rightsource Industrial Solutions Pvt. Ltd. Page - 18 -
C) Noise Pollution Management
Noise suppression measures such as enclosures, buffers and / or protective
measures will be provided, if required.
Extensive oiling, lubrication and preventive maintenance will be carried out for
the machineries and equipments to reduce noise generation.
Greenbelt Development.
D) Hazardous & Solid Waste Management
To reduce the quantity of solid / hazardous waste generation as well as possible
contamination of land (soil) due to spillages / leaks from the plant operations,
following Mitigation measures are proposed:
There will not be any leakages / spillage from the raw-materials storage.
The generated Hazardous waste will be stored on floor with suitable packing
and this dedicated area will be covered with the roof.
The records on quantity of hazardous waste generation and disposal will be
maintained for each category and possibilities will be explored for
minimization and reuse.
E) Green Belt
Greenbelt will be developed in an area of 2.23 Acres (9015 Sq.m). The industry will
spend 4 Lakhs as capital cost for planting of samplings. Lists of plants suitable for
greenbelt as per the local agro climatic conditions are given in the EIA Report.
F) Solvent Recovery
Solvents will be recovered upto 95% using distillation column and necessary cooling
condensers.
5.3 ENVIRONMENT MANAGEMENT CELL
Clarus Chem Pvt. Ltd will have a dedicated Environmental Management Cell with
experienced staff to look after the proper environmental management of the plant
including operation & maintenance of all pollution control facilities.

Executive Summary of Draft EIA Report Clarus Chem Pvt. Ltd.
Prepared By Rightsource Industrial Solutions Pvt. Ltd. Page - 19 -
5.4 ENVIRONMENT MONITORING PROGRAM
Regular monitoring of environmental parameters is of immense importance to
assess the status of environment during project operation. The regular monitoring
will be carried out with the MoEF&CC Registration / NABL Accredited Laboratory.
6. PROPOSED ROOF WATER HARVESTING
Roof top rainwater harvesting is one of the appropriate options for augmenting
ground water recharge/ storage in this industry.
The following table gives expected quantity of rain water harvesting using buildings
area Roof top.
TABLE- 17: AVAILABLE RAINWATER (ANNUAL) FOR HARVESTING
Description Area (m2) Rainfall
(m/Annum) Runoff
coefficient Total Rainwater
(m3/Annum)
Roof Area 3872 0.49 0.8 1517.82
Total available rainwater (in m3/annum) 1518
FIGURE-2: PROPOSED ROOF WATER HARVESTING STRUCTURE
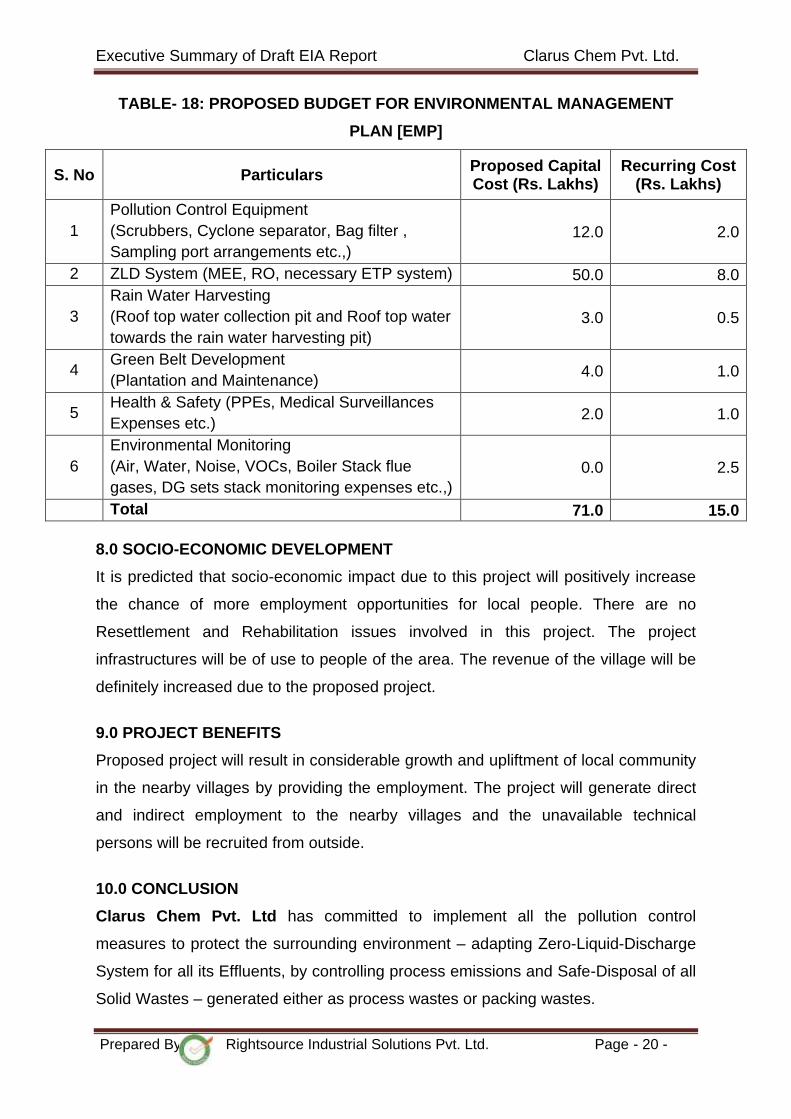
7. EMP BUDGET
The unit has proposed for 71 Lakhs as capital cost and 15 Lakhs as recurring cost
for environment pollution control measures.
Executive Summary of Draft EIA Report Clarus Chem Pvt. Ltd.
Prepared By Rightsource Industrial Solutions Pvt. Ltd. Page - 20 -
TABLE- 18: PROPOSED BUDGET FOR ENVIRONMENTAL MANAGEMENT
PLAN [EMP]
S. No Particulars Proposed Capital Cost (Rs. Lakhs)
Recurring Cost (Rs. Lakhs)
1
Pollution Control Equipment
(Scrubbers, Cyclone separator, Bag filter ,
Sampling port arrangements etc.,)
12.0 2.0
2 ZLD System (MEE, RO, necessary ETP system) 50.0 8.0
3
Rain Water Harvesting
(Roof top water collection pit and Roof top water
towards the rain water harvesting pit)
3.0 0.5
4 Green Belt Development
(Plantation and Maintenance) 4.0 1.0
5 Health & Safety (PPEs, Medical Surveillances
Expenses etc.) 2.0 1.0
6
Environmental Monitoring
(Air, Water, Noise, VOCs, Boiler Stack flue
gases, DG sets stack monitoring expenses etc.,)
0.0 2.5
Total 71.0 15.0
8.0 SOCIO-ECONOMIC DEVELOPMENT
It is predicted that socio-economic impact due to this project will positively increase
the chance of more employment opportunities for local people. There are no
Resettlement and Rehabilitation issues involved in this project. The project
infrastructures will be of use to people of the area. The revenue of the village will be
definitely increased due to the proposed project.
9.0 PROJECT BENEFITS
Proposed project will result in considerable growth and upliftment of local community
in the nearby villages by providing the employment. The project will generate direct
and indirect employment to the nearby villages and the unavailable technical
persons will be recruited from outside.
10.0 CONCLUSION
Clarus Chem Pvt. Ltd has committed to implement all the pollution control
measures to protect the surrounding environment – adapting Zero-Liquid-Discharge
System for all its Effluents, by controlling process emissions and Safe-Disposal of all
Solid Wastes – generated either as process wastes or packing wastes.

Executive Summary of Draft EIA Report Clarus Chem Pvt. Ltd.
Prepared By Rightsource Industrial Solutions Pvt. Ltd. Page - 21 -
The project can definitely improve the regional, state and national economy.
Industrial growth is an indication of all-round Socio-Economic Development – by
generating local Employment and Business Opportunities. The implementation of
this project will definitely improve the physical and social infrastructure of the
surrounding area.