of CHART - Coordinated Highways Action Response Teamchartinput.umd.edu/ppt/Final Report 2002.pdf ·...
79
of CHART - Coordinated Highways Action Response Team - ( Final Report ) Prepared by Dr. Gang-Len Chang, Professor Ying Liu, Pei-Wei Lin Nan Zou, Research Assistants Department of Civil and Environmental Engineering University of Maryland, College Park and Jean Yves Point-Du-Jour Office of Traffic and Safety State Highway Administration of Maryland November 2003
Transcript of of CHART - Coordinated Highways Action Response Teamchartinput.umd.edu/ppt/Final Report 2002.pdf ·...
of
CHART
- Coordinated Highways Action Response Team -
( Final Report )
Prepared by
Dr. Gang-Len Chang, Professor Ying Liu, Pei-Wei Lin
Nan Zou, Research Assistants
Department of Civil and Environmental Engineering University of Maryland, College Park
and
Jean Yves Point-Du-Jour
Office of Traffic and Safety State Highway Administration of Maryland
November 2003
I
PERFORMANCE EVALUATION OF CHART 2002 THE REAL-TIME INCIDENT MANAGEMENT SYSTEM
- SOC
- TOC
- SOC
- TOC
II
LIST OF TERMS AND ABBREVIATIONS
0-9
10-46 – Incident code - Assistance to Driver 10-50 – Incident code - Minor Incident / Accident
A AOC – Authority Operations Center Arrival Time – Time when the response unit arrived to the scene ATM – Asynchronous Transport Mode ATMS – Advanced Transportation Management System AVCM – ATM Video Control Manager AVL – Automated Vehicle Location
B BWI – Baltimore/Washington International Airport
C C2IOC – CHART 2 Interim Operational Capability CCTV – Closed Circuit Television CHART – Coordinated Highways Action Response Team Cleared Time – Time when the scene is cleared and normal traffic conditions are restored COTS – Commercial Off-the-Shelf CPOC – CHART Proof of Concept
D DBM – Maryland Department of Budget and Management DGS – Maryland Department of General Services
E EOC – Emergency Operations Center EORS – Emergency Operations Reporting System ERU – Emergency Response Unit ETP – Emergency Traffic Patrol
F FITM – Freeway Incident Traffic Management FMS – Field Management Station FPU – Field Processing Unit
G GIS – Geographic Information System GUI – Graphical User Interface
H HAR – Highway Advisory Radio
I IEN – Information Exchange Network IDT – Incident Duration Time IOTC – Interim Operational Telecommunications Capability ISP – Information Service Provider ITS – Intelligent Transportation System
M MDOT – Maryland Department of Transportation MSHA – Maryland State Highway Administration MdTA – Maryland Transportation Authority MSP – Maryland State Police

III
N NOVA – Northern Virginia Traffic Management System NTSC – National Television Standards Committee
O OOTS – Office of Traffic and Safety
P PC – Personal Computer
R RGB – Red, Green, Blue (computer graphics display) Received Time – Time when the information on incident occurrence was received by the
operator Response Time – Time period between receiving information on incident and arrival of
response unit on the scene S
SNMP – Simple Network Management Protocol SOC – Statewide Operations Center SONNET – Synchronous Optical Network SQL – Structured Query Language
T TAR – Travelers Advisory Radio TAT – Travelers Advisory Telephone TOC – Traffic Operations Center
U UMD – University of Maryland at College Park
V VMS (DMS/CMS) – Variable Message Sign (Dynamic/Changeable Message Sign)
W WWW – World Wide Web

IV
ACKNOWLEDGMENTS
The authors would like to thank Mr. Michael Zezeski, Mr. Thomas Hicks, Mr. Douglas R. Rose, and Mr. Eric Tabacek for their constant encouragement and numerous constructive comments during the entire research period of this project. This study would not have been completed without their strong support.
We are certainly indebted to SHA senior managers who offered many suggestions regarding the report organization and presentation in a CHART monthly board meeting. We would also like to extend our appreciation to Mr. Howard Simons, from MDOT, and, technical staff in both the CHART program and the Office of Traffic and Safety, especially the operators of the Statewide Operations Center and the two other satellite Traffic Operations Centers, who assisted us in collecting and organizing the entire 2002 incident response data for this study.

V
EXECUTIVE SUMMARY
Objectives
This report presents the performance evaluation results of CHART in Year 2002, including both operations efficiency and the resulting benefits. This is part of the annual CHART performance review conducted by the Civil Engineering Department of The University of Maryland at College Park and MSHA staff for Maryland State Highway Administration (MSHA).
Similar to all previous studies, the focus of this evaluation work is to assess the effectiveness of the Maryland CHART program with an emphasis on its ability to detect and manage incidents on major freeways and highways. The efficiency of the entire incident management operations along with its resulting benefits also constitutes the core of the study.
The evaluation study consisted of two phases. Whereas the focus of Phase 1 was on defining the objectives, identifying the available data, and developing the methodology, the core of Phase 2 was to reliably assess the efficiency of the incident management program and to estimate its resulting benefits from data available in the Year 2002 CHART incident operation records. As some information essential for efficiency and benefit assessment was not available in the CHART-II database, this study presents only those evaluation results that can be directly computed from incident management data or derived with reliable statistical methods.
Available Data for Analysis
In Year 1996, an evaluation study with respect to the incident response system of CHART was conducted by COMSIS (COMSIS, 1996). In performing the evaluation, the Year 1994 incident management data from the Traffic Operations Center were considered, but not used due to various reasons. Thus, its conclusions were mostly grounded on either the information from other states or from nationwide average data published by the Federal Highway Administration.
To ensure the quality of evaluation and also to consider the opening of the Statewide Operations Center (SOC) in August 1995, all members involved in the evaluation study concluded that a reliable analysis should be based on the actual performance data from the CHART program. Thus, the Year 1996 incident management data were collected and used in the pilot evaluation analysis conducted jointly by the University of Maryland and MSHA staff (Chang and Point-Du-Jour, 1998). This pioneering study inevitably faced the difficulty of having a data set with sufficient information for analysis, as it was the first time for CHART to identify and organize all previous performance records for a rigorous evaluation.
VI
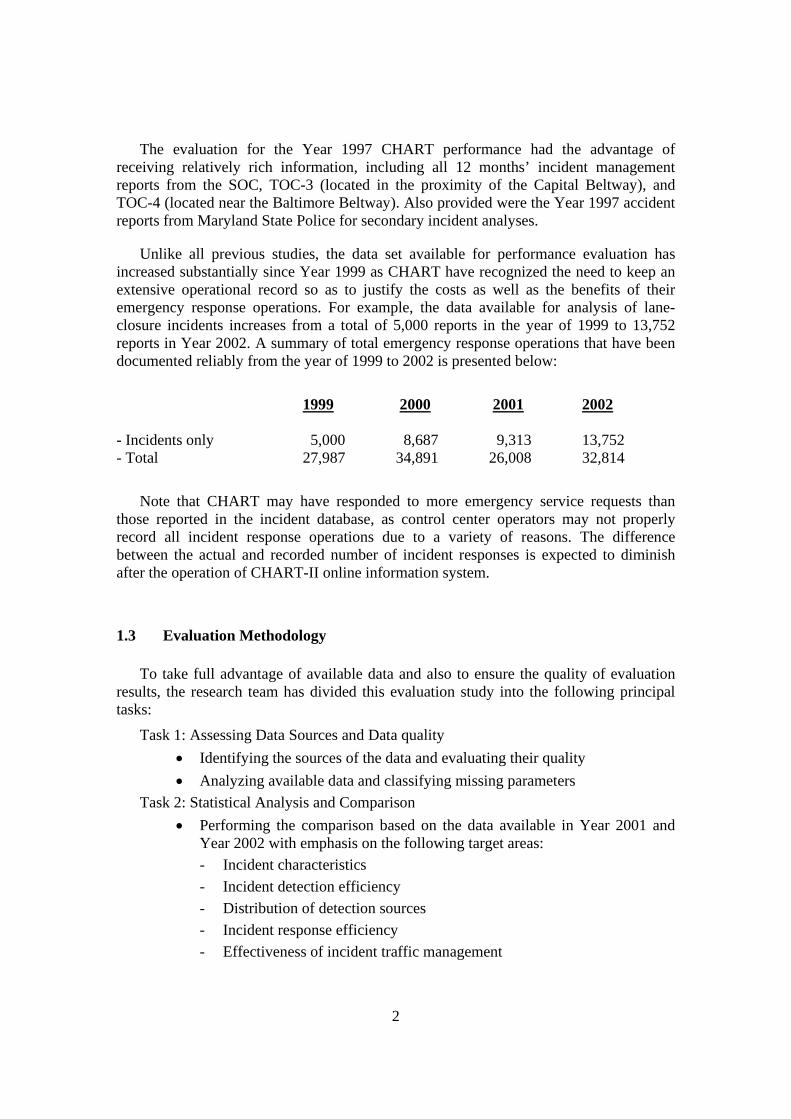
The evaluation for the Year 1997 CHART performance had the advantage of receiving relatively rich information, including all 12 months’ incident management reports from the SOC, TOC-3 (located in the proximity of the Capital Beltway), and TOC-4 (located near the Baltimore Beltway). Also provided were the Year 1997 accident reports from Maryland State Police for secondary incident analyses.
Unlike all previous studies, the data set available for performance evaluation has increased substantially since Year 1999 as CHART have recognized the need to keep an extensive operational record so as to justify the costs as well as the benefits of their emergency response operations. As an example, the data available for analysis of lane-closure related incidents increases from a total of 2,567 reports in the year of 1997 to 13,752 reports in Year 2002. A summary of total emergency response operations that have been documented reliably from the year of 1997 to 2002 is presented below:
1999 2000 2001 2002 - Incidents only 5,000 8,687 9,313 13,752 - Total 27,987 34,891 26,008 32,814
Note that the dataset available in the Year 1997 evaluation did not reflect the actual number of incident operations managed by CHART. It was mainly for a pilot study and served as the basis for comparing subsequent evaluation analyses. Also note that CHART may have responded to more emergency service requests than those reported in the incident database, as control center operators may not properly record all incident response operations for a variety of reasons. The difference between the actual and recorded number of incident responses is expected to diminish since the operation of the CHART-II online information system.
Evolution of Evaluation Work
Over the past five years, CHART has consistently worked on improving its data recording for both major and minor incidents. Hence, the quantity and quality of incident reports available for performance analysis have increased substantially since Year 1999.
In response to the improvement in data availability, the evaluation work has also been evolved from its infancy of using all available data to a new stage of demanding data quality and employing only reliable information in the performance as well as benefit analysis. Thus, from Year 1999 the performance evaluation report for CHART has included one new subject, the data quality analysis. This is aimed to ensure a sustained improvement in the quality of incident-related data so that all potential benefits due to efficient CHART operations can be estimated reliably.
Note that starting from February 2001, all incidents and requests of emergency assistance, regardless of responding by CHART or not, have all been recorded in the

VII
CHART-II information system. Hence, Chapter 2 of this report is devoted to the following two vital subjects: the procedures to construct an emergency response report for each recorded incident and driver assistance request from CHART-II database, and the data quality of each critical performance-related variable. Overall, the quality of available data for evaluation has been improved significantly since the operation of CHART-II system. The efforts needed for performing the evaluation, however, have not been reduced, because the current CHART-II is only partially completed and the information associated with each incident is distributed in different categories of sub-databases. Besides, some incident-location-related information remains documented in a text format that cannot be processed automatically with a data analysis program.
Distribution of Incidents
The evaluation methodology was developed to take full advantage of all available data sets that have the acceptable quality. It started with analyses of incident characteristics by the blockage frequency, duration, and blocked lanes.
With respect to severe incidents, the analysis results indicate that in Year 2002 there were a total of 2,268 incidents resulting in one-lane blockage, 1,684 incidents causing two-lane closures, and about 1,207 incidents blocking more than two lanes. In addition, there were a total of 21,107 shoulder incidents during the same period due either to disabled vehicles or minor incidents. A comparison of lane-blockage incident data over the past four years is summarized below:
1999 2000 2001 2002 - Shoulder 6,164 27,370 17,593 21,107 - 1 lane 2,376 3,195 2,357 2,268 - 2 lanes 1,106 2,169 1,407 1,684 - 3 lanes 186 478 403 571 - >= 4 lanes 137 347 432 636
Overall, the incidents, including shoulder-lane blockages, on freeways were mostly distributed along four major commuting corridors: I-495/95 experienced a total of 9,652 incidents; and I-695, I-270, and I-95 had 7,916, 1,474, and 3,211 incidents, respectively. Thus, CHART had managed, on average, 26 emergency response requests per day on I-495/95 alone, and 21, 4, and 8 responses along the other three main commuting freeways. The distribution of incidents on these major commuting corridors between 1999-2002 is presented below:

VIII
1999 2000 2001 2002 - I-495/95 11,182 11,404 9,524 9,652 - I-695 3,946 7,704 5,165 7,916 - I-270 1,967 1,767 1,277 1,474 - I-95 1,948 2,779 2,296 3,211
However, it should be mentioned that most incidents on major commuting freeways did not block traffic for more than one hour. For instance, about 88.2 percent of incidents responded to by TOC-3 in Year 2002 were recovered in less than 30 minutes. A similar pattern exists in the TOC-4 data, where about 95.8 percent of incidents had the duration, less than one hour. This could be attributed to both the nature of the incidents and, more likely, the efficient response of CHART emergency operations units. The distribution of lane-blockage incident duration between 1999-2002 is summarized below:
Duration 1999 2000 2001 2002 (Hr) > 0.5 8,307 7,057 8,581 8,693 >=0.5 & <1 816 2,138 969 1,002 >=1 & < 2 418 743 356 446 >= 2 376 518 227 347
In brief, it is clear that the highway network covered by CHART remain plagued by a high frequency of incidents, ranging from about 20 minutes to more than 2 hours. Those incidents were apparently one of the primary contributors to the traffic congestion in the entire region, especially on those major commuting highway corridors such as I-495/95, I-695, I-270, and I-95.
Efficiency of Operations
In evaluating the efficiency of an incident management program, it is essential to cover three vital aspects: detection, response, and recovery of traffic conditions. Unfortunately, data needed for performing the detection and complete response time analysis are not yet available under the current CHART data system, and the MSHA patrols and Maryland State Police (MSP) remain the main sources for detecting and reporting incidents for CHART.
One of the indicators related to the detection is the average response time that refers to the elapsed time from receiving the incident calls to having emergency response units arriving at the incident site. The Year 2002 data indicated that on average it took 12.85 minutes for the TOC-3, 13.65 minutes for TOC-4, and 13.51 minutes for SOC to respond to a reported incident. Overall, CHART, as shown in the following statistics, has demonstrated a steady improvement on its response time over the past 4 years:
IX
Response time 1999 2000 2001 2002 (min) TOC-3 16.95 14.96 13.90 12.85 TOC-4 N/A 15.43 14.53 13.65 SOC 17.00 19.14 13.70 13.51 Average 16.95 15.22 13.84 13.10
To understand the contribution of the incident management program, this study has computed and compared the average incident duration of responded and non-responded incidents. For instance, for those one-lane-blockage incidents SHA patrol did not respond to, the average operation time was about 21.1 minutes, longer than the average of 18.5 minutes for the same type of one-lane-blockage incidents managed by CHART/SHA (i.e., with SHA patrols).
Taking into account all types of incidents, the average incident duration with and without the management by SHA response units was found to be 28 minutes and 39 minutes, respectively. Thus, based on the available record in Year 2002, the operations of CHART/SHA resulted in about a 28 percent reduction of the average incident duration. The performance improvement of CHART/SHA from the year 1999 to 2002 is summarized below:
with CHART without CHART (min) (min) 1999 42 93 2000 33 77 2001 29 51 2002 28 39
Resulting Benefits
The benefits attributed to the CHART/SHA operations that were estimable directly from the available data include assistance to drivers, and reduction in driver delay time, fuel consumption, emissions, and secondary incidents. The CHART/SHA operations in Year 2002 responded to a total of 13,752 lane blockage incidents, and provided assistance to 19,062 highway drivers who may otherwise cause incidents or rubbernecking delays to the highway traffic. CHART’s contribution to reduction in incident duration has also resulted in a potential reduction of 377 secondary incidents. In addition, efficient removals of stationary vehicles or large debris on travel lanes by CHART patrol units may have prevented 343 potential lane-changing-related collisions in Year 2002, as approaching vehicles under those conditions are forced to perform unsafe mandatory lane changes that are likely to result in some crashes.
X
The direct benefits of reduction in delay time and fuel consumption were estimated with CORSIM, a traffic simulation program produced by FHWA. It has been found that the operations of CHART/SHA in Year 2002 resulted in a total delay time reduction of 29.98 million vehicle-hours, and a total fuel consumption reduction of approximately 5.06 million gallons. A comparison of direct benefits from 1999 to 2002 is summarized below:
Total Direct Benefits No. of Incidents (dollar) 1999 345.08 27,987 2000 378.41 34,891 2001 402.75 26,008 2002 467.97 32,814
Recommendations
The primary recommendations based on the performance of CHART in Year 2002 are summarized below:
- Evaluating the performance of incident response and management, including both recording quality at a monthly or quarterly basis so that all critical evaluation results can be fed back to responsible CHART stuff in a timely manner.
- Including the benefits of delay and fuel consumption due to a potential reduction in decrease in secondary incidents in CHART 2003 evaluation.
- Efficiently integrating CHART incident response database with police accident data so as to have a complete picture of statewide incident record.
- Training operators to effectively record all essential operations-related data such as cleared time (only 32.1% available in Year 2002 database).
- Improving the data structure used in the CHART-II system for recording the incident location as the information item with the current narrative text format requires laborious manual search and input of associated highway segments.
- Developing an integrated performance database that consists not only of incident reports but of all data, such as traffic volume, needed for direct benefit computation or estimation of safety-related contribution, including potential reduction in secondary incidents and lane-changing-related accidents due to a quick removal of stationary vehicles or some debris on highway travel lanes.
- Improving the use of freeway service patrols and dynamically assigning their locations based on both the spatial distribution of incidents along freeway

XI
segments and the probability of having incidents at different times of a day so that the average response time can be reduced as expected.
Note that a database converted from CHART-II system and comprehensive evaluation results performed by the research team are available in the Web site (http://chartinput.umd.edu/).
i
TABLE OF CONTENTS
LIST OF TERMS AND ABBREVIATIONS.....................................................................II ACKNOWLEDGMENTS ..................................................................................................... IV EXECUTIVE SUMMARY.....................................................................................................V
Objectives .........................................................................................................................V Available Data for Analysis..............................................................................................V Evolution of Evaluation Work........................................................................................ VI Distribution of Incidents ................................................................................................VII Efficiency of Operations...............................................................................................VIII Resulting Benefits........................................................................................................... IX Recommendations.............................................................................................................X
TABLE OF CONTENTS.......................................................................................................... i LIST OF FIGURES ....................................................................................................................... iii LIST OF TABLES ........................................................................................................................ iv CHAPTER 1: INTRODUCTION.......................................................................................1
1.1 Background....................................................................................................................... 1 1.2 Available Data for Performance Evaluation..................................................................... 1 1.3 Evaluation Methodology .................................................................................................. 2
CHAPTER 2: DATA QUALITY FOR THE EVALUATION STUDY ..................5
2.1 Data Availability and Data Processing Procedures .......................................................... 5 2.2 Comparison of Key Performance-Related Data ............................................................... 8
CHAPTER 3: ANALYSIS OF DATA CHARACTERISTICS................................15
3.1 Distribution of Incidents and Disabled Vehicles by Weekday and Weekend, and by Peak and Off-Peak Hours .......................................................................................... 15
3.2 Distribution of Incidents and Disabled Vehicles by Road.............................................. 16 3.3 Distribution of Incidents and Disabled Vehicles by Location........................................ 18 3.4 Distribution of Incidents and Disabled Vehicles by Lane Blockage Type..................... 26 3.5 Comparison of Incident Duration ................................................................................... 30 3.6 Distribution of Incidents and Disabled Vehicles by Blockage Duration........................ 31
CHAPTER 4: DETECTION EFFICIENCY AND EFFECTIVENESS .................33
4.1 Evaluation of Detection Efficiency and Effectiveness ................................................... 33 4.2 Response Rate for Detected Incidents ............................................................................ 33 4.3 Distribution of Incidents and Disabled Vehicles among Detection Sources.................. 34

ii
CHAPTER 5: EFFICIENCY OF RESPONSE AND MANAGEMENT ...............38 5.1 Analysis of Response Efficiency .................................................................................... 38 5.2 Reduction in Incident Duration ...................................................................................... 40
CHAPTER 6: BENEFITS FROM THE INCIDENT MANAGEMENT BY
CHART ........................................................................................................42 6.1 Estimation of Benefits .................................................................................................... 42 6.2 Assistance to Drivers ...................................................................................................... 42 6.3 Potential Reduction in Secondary Incidents ................................................................... 45 6.4 Estimated Benefits due to Efficient Removal of Stationary Vehicles from Travel
Lanes............................................................................................................................... 47 6.5 Direct Benefits to Highway Users .................................................................................. 48 6.6 Emission Reduction Benefits.......................................................................................... 49
CHAPTER 7: COMPARISON OF CHART PERFORMANCE..............................52
7.1 Data Availability and Quality......................................................................................... 52 7.2 CHART Performance ..................................................................................................... 54
CHAPTER 8: CONCLUSIONS AND RECOMMENDATIONS ...........................60
8.1 Conclusions..................................................................................................................... 60 8.2 Recommendations and Further Development ................................................................ 61
References ........................................................................................................................62
iii
LIST OF FIGURES Figure 1.1 Graphical Illustration of Technical Terms Associated with Incident
Operations...................................................................................................... 3 Figure 2.1 Data Processing Procedure ............................................................................ 7 Figure 2.2 Summary of Data Quality Based on All Available Reports .......................... 8 Figure 2.3 Summary of Data Quality Based on All Available Reports (Cont.).............. 9 Figure 3.1 Distribution of Incidents/Disabled Vehicles by Road in Year 2002 ........... 17 Figure 3.2 Comparison for the Distribution of Incidents/Disabled Vehicles by Road
..................................................................................................................... 17 Figure 3.3 Distribution of Incidents/Disabled Vehicles by Location on I-495/I-95 in
Year 2002..................................................................................................... 19 Figure 3.4 Comparison of Incidents/Disabled Vehicles Distribution by Location on
I-495/I-95 between Year 2001 and Year 2002 ............................................ 19 Figure 3.5 Distribution of Incidents/Disabled Vehicles by Location on I-95 in Year
2002 ............................................................................................................. 21 Figure 3.6 Comparison of Incidents/Disabled Vehicles Distribution by Location on
I-95............................................................................................................... 21 Figure 3.7 Distribution of Incidents/Disabled Vehicles by Location on I-270 in Year
2002 ............................................................................................................. 22 Figure 3.8 Comparison of Incidents/Disabled Vehicles Distribution by Location on
I-270............................................................................................................. 23 Figure 3.9 Distribution of Incidents/Disabled Vehicles by Location on I-695 in Year
2002 ............................................................................................................. 24 Figure 3.10 Comparison of Incidents/Disabled Vehicles Distribution by Location on
I-695............................................................................................................. 25 Figure 3.11 Distribution of Incidents by Lane Blockage in Year 2002 .......................... 26 Figure 3.12 Comparison of Incidents/Disabled Vehicles Distribution by Lane
Blockage ...................................................................................................... 26 Figure 3.13 Distribution of Lane Blockages due to Incidents by Road in Year 2002 .... 27 Figure 3.14 Distribution of Lane Blockages due to Incidents and Disabled Vehicles
by Major Freeways in the Washington Region ........................................... 28 Figure 3.15 Distribution of Lane Blockages due to Incidents and Disabled Vehicles
by Major Highways in the Baltimore Region.............................................. 29 Figure 3.16 Distribution of Lane Blockages and Duration by Road in Year 2002 (due
to Both Incidents and Disabled Vehicles) ................................................... 30 Figure 3.17 Distribution of Incidents/Disabled Vehicles by Duration in Year 2002...... 31 Figure 4.1 Distribution of Incident/Disabled Vehicles by Detection Sources in Year
2002 [2001].................................................................................................. 34 Figure 4.2 Distribution of Incident/Disabled Vehicles by Detection Sources from
TOC-3 in Year 2002 [2001] ........................................................................ 36 Figure 4.3 Distribution of Incident/Disabled Vehicles by Detection Sources from
TOC-4 in Year 2002 [2001] ........................................................................ 37 Figure 5.1 The Overall Average Response Time.......................................................... 39 Figure 6.1 Nature of Driver Assistance Requests in Year 2002 and Year 2001........... 43 Figure 6.2 Nature of Driver Assistance Requests for TOC-3 ....................................... 44
iv
Figure 6.3 Nature of Driver Assistance Requests for TOC-4 ....................................... 44 Figure 6.4 Distribution of Reported Secondary Incidents ............................................ 46 Figure 6.5 Flow Chart of the Procedures for Approximating the Potentially Reduced
Lane-Changing-Related Accidents due to Operations of CHART.............. 48 Figure 6.6 Reduction in Delays due to CHART/MSHA Operations ............................ 49 Figure 7.1 Comparison of Available Data by Type from Year 1999 to Year 2002...... 52 Figure 7.2 Comparison of Data Quality ........................................................................ 53 Figure 7.3 Comparison of Data Quality − Time Parameters......................................... 54 Figure 7.4 Comparison of Average Response Time by Emergency Operations
Centers ......................................................................................................... 55 Figure 7.5 Comparison of Average Incident Duration with and without SHA
Patrol............................................................................................................ 56 Figure 7.6 Comparison of Incident Duration with and without SHA Patrol (One-
Lane Blockage) ............................................................................................ 57 Figure 7.7 Comparison of Total Number of Driver Assistance Cases.......................... 57 Figure 7.8 Comparison of Driver Assistance − Flat Tires ............................................ 58 Figure 7.9 Comparison of Driver Assistance − Gas Shortage ...................................... 58 Figure 7.10 Comparison of Direct Benefits to Highway Users ...................................... 59 LIST OF TABLES Table 2.1 Comparison of Available Data between Year 2002, 2001 and 2000............. 6 Table 2.2 Data Quality Analysis with Respect to Detection Source in Year 2002 ..... 10 Table 2.3 Distribution of Emergency Responses by Each Operations Center in
Year 2002..................................................................................................... 10 Table 2.4 Data Quality Analysis with Respect to Incident Nature in Year 2002 ........ 11 Table 2.5 Data Quality Analysis with Respect to Road and Location in Year 2002... 12 Table 2.6 Data Quality Analysis with Respect to Lane/Shoulder Blockage in Year
2002 ............................................................................................................. 13 Table 2.7 Data Quality Analysis with Respect to Time in Year 2002......................... 14 Table 3.1 Distribution of Incidents/Disabled Vehicles by Weekdays and
Weekends..................................................................................................... 15 Table 3.2 Distribution of Incidents/Disabled Vehicles by Peak and Off-peak
Periods ......................................................................................................... 16 Table 3.3 Comparison of Incidents/Disabled Vehicles Distribution by Duration ....... 32 Table 5.1 The Average Response Time for Incidents/Disabled Vehicles in Year
2002 ............................................................................................................. 39 Table 5.2 Comparison of Incident Durations for Various Types of Lane Blockages
(With and Without CHART/SHA) .............................................................. 40 Table 6.1 Reduction of Potentially Incidents due to CHART Operations................... 48 Table 6.2 Total Direct Benefits to Highway Users in Year 2002................................ 50 Table 6.3 Delay and Emissions Reductions due to CHART/MSHA Operations for
Washington and Baltimore regions.............................................................. 51

1
CHAPTER 1: INTRODUCTION 1.1 Background
CHART (Coordinated Highways Action Response Team) is the highway incident management program of the Maryland State Highway Administration. Initiated in the mid 80’s as “Reach the Beach,” it has been extended to a statewide program headquartered in Hanover, Maryland, where the integrated Statewide Operations Center (SOC) is located. The SOC is also supported by three satellite traffic operations centers (TOC), one being seasonal. Most of the field operations of CHART are also supported by the maintenance units. The current network covered by CHART consists of both statewide freeways and major arterials.
CHART comprises four major components: traffic monitoring, incident response, traveler information, and traffic management. Among those four components, the incident response and traveler information systems have received increasing attention from the general public, media, and transportation professionals.
The objective of this study was to assess the effectiveness of CHART’s operations, including its incident detection, response, and traffic management on the interstate freeways as well as major arterials. The assessment work also covers the CHART benefits estimation, as such benefits are essential for MSHA to receive the sustained support for all their ongoing programs from both the general public and state policymakers.
1.2 Available Data for Performance Evaluation
In Year 1996, an evaluation study with respect to the incident response system of CHART was conducted by COMSIS (COMSIS, 1996). In performing the evaluation, the Year 1994 incident management data from the Traffic Operations Center were considered, but not used due to various reasons. Thus, its conclusions were mostly grounded on either the information from other states or from nationwide average data published by the Federal Highway Administration.
To ensure the quality of evaluation and also to consider the opening of the Statewide Operations Center (SOC) in August 1995, all members involved in the evaluation study concluded that a reliable analysis should be based on the actual performance data from the CHART program. Thus, the Year 1996 incident management data were collected and used in the pilot evaluation analysis conducted jointly by the University of Maryland and MSHA staff (Chang and Point-Du-Jour, 1998). This pioneering study inevitably faced the difficulty of having a data set with sufficient information for analysis, as it was the first time for CHART to identify and organize all previous performance records for a rigorous evaluation.
2
The evaluation for the Year 1997 CHART performance had the advantage of receiving relatively rich information, including all 12 months’ incident management reports from the SOC, TOC-3 (located in the proximity of the Capital Beltway), and TOC-4 (located near the Baltimore Beltway). Also provided were the Year 1997 accident reports from Maryland State Police for secondary incident analyses.
Unlike all previous studies, the data set available for performance evaluation has increased substantially since Year 1999 as CHART have recognized the need to keep an extensive operational record so as to justify the costs as well as the benefits of their emergency response operations. For example, the data available for analysis of lane-closure incidents increases from a total of 5,000 reports in the year of 1999 to 13,752 reports in Year 2002. A summary of total emergency response operations that have been documented reliably from the year of 1999 to 2002 is presented below:
1999 2000 2001 2002 - Incidents only 5,000 8,687 9,313 13,752 - Total 27,987 34,891 26,008 32,814
Note that CHART may have responded to more emergency service requests than those reported in the incident database, as control center operators may not properly record all incident response operations due to a variety of reasons. The difference between the actual and recorded number of incident responses is expected to diminish after the operation of CHART-II online information system.
1.3 Evaluation Methodology
To take full advantage of available data and also to ensure the quality of evaluation results, the research team has divided this evaluation study into the following principal tasks:
Task 1: Assessing Data Sources and Data quality • Identifying the sources of the data and evaluating their quality • Analyzing available data and classifying missing parameters
Task 2: Statistical Analysis and Comparison • Performing the comparison based on the data available in Year 2001 and
Year 2002 with emphasis on the following target areas: - Incident characteristics - Incident detection efficiency - Distribution of detection sources - Incident response efficiency - Effectiveness of incident traffic management

3
Task 3: Benefit Analysis • Reduction in total delay time due to CHART/SHA operations • Reduction in fuel consumption due to CHART/SHA operations • Reduction in total emissions due to CHART/SHA operations • Reduction in secondary incidents due to CHART/SHA operations • Reduction in potential accidents due to the efficient removal of stationary
vehicles in travel lanes by CHART/SHA response team
Note that the above tasks do not include the estimation of some indirect impacts such as the reduction in travel time and fuel savings from potentially reduced secondary incidents, the associated medical and legal costs, and improvement of the commuting environment. This is primarily due to the fact that most of such data are not available at that stage. Thus, the results of this study can be used not only to picture the approximate benefits and performance of CHART, but also to assist MSHA in identifying and collecting additional critical data for future analysis.
Figure 1.1 lays out the major parameters necessary for evaluating the effectiveness and efficiency of an incident management system. It should be mentioned that in most cases the incident occurrence time is not available, the exception being those detected by CCTV. Another parameter that is difficult to measure is the preparation time – the time period between detection of an incident and dispatch of the response units. Thus, this evaluation does not include the efficiency of incident detection and response preparation.
Figure 1.1 Graphical Illustration of Technical Terms Associated with Incident Operations
* Partial Recovery* CompleteRecovery
Occurrence ofIncidents
Detectionof Incidents
Dispatch ofResponse Units
Arrival at theIncident Site
CompleteRecovery
PreparationTime
TravelTime
ClearanceTime
DetectionTime
Response Time
Incident Duration
Not available Not available

4
This evaluation report is organized as follows:
Next chapter is focused on assessing the data quality available for year 2002 CHART performance evaluation, including the total available incident reports, the percentage of missing data for each critical performance parameter, and comparison of data quality between year 2001 and year 2002.
Chapter 3 is devoted to statistical analysis of incident data characteristics, including distributions of incidents and disabled vehicles by weekday and weekend, by road, by location, by lane-blockage type, and by lane-blockage duration. Also included is a comparison of the average incident duration incurred by different types of incidents.
Chapter 4 is comprised of detailed report with respect to incident detection efficiency and effectiveness, including detection rate, distribution of detection sources for various types of incidents and driver requests of assistances.
Chapter 5 is concentrated on evaluating the incident response efficiency for various types of incidents and drivers assists, based on the difference between the incident report time an the arrival time of an emergency response unit. Also included is the assessment of incident clearance efficiency based on the arrival time of emergency response units and the incident clearance time.
Chapter 6 is mainly designed to estimate all direct benefits associated with CHART operations, including the total reduction in delays, fuel consumption, emissions, and secondary incidents. A significant number of driver assistance requests responded by CHART patrol units is also included in this chapter, as such services can not only provide direct benefits to drivers, but also minimize potential rubbernecking impacts on the highway traffic.
Note that to facilitate the review and comparison of CHART’s performance over the past several years, Chapter 7 has summarized all key performance statistics between 1999-2002, including data quality, response time, incident duration, and resulting benefits. Concluding comments along with recommendations for future evaluation are reported in the last chapter.

5
CHAPTER 2: DATA QUALITY FOR THE EVALUATION STUDY
This chapter presents the data quality available for the CHART 2002 performance evaluation study, including a comparison with the data from the same study in Year 2001. The analysis and comparison will be focused on the following two aspects:
1. Available data for analysis: In Year 2002, CHART performance evaluation study received a total of 32814 reports. During Year 2001, CHART has migrated to CHART II database completely. So, all the data for evaluation in Year 2002 is obtained from CHART II database directly.
In Section 2.1, a more detailed analysis on data availability will be provided, followed by a brief illustration of the data processing procedures that have been implemented to construct our evaluation database for the new CHART II system.
2. A detailed data quality analysis: To ensure the quality of the evaluation results, a detailed analysis with respect to each critical information item is provided in Section 2.2. Year 2001 data is used for comparison in this section. Note that the data from January 1st to February 11th in Year 2001 was recorded on paper forms; the data for the rest of the Year 2001 was recorded in CHART II database.
2.1 Data Availability and Data Processing Procedures
In the Year 2002, CHART performance evaluation study received a total of 32814 emergency response reports for analysis. All the data for Year 2002 was recorded in the CHART II database since the migration was completed in Year 2001.
In the CHART II database, all emergency response cases, including both minor cases (former short forms) and severe cases (former long forms), were recorded in the same format. Those 32814 emergency response cases were categorized into two groups, incidents and disabled vehicles.
A summary of a total available data for performance evaluation in Year 2002, Year 2001 and Year 2000 is shown in Table 2.1. Please note that all data in Year 2000 was based on paper forms.

6
Table 2.1 Comparison of Available Data between Year 2002, 2001 and 2000
Year 2002 Year 2001 Year 2000 Available Records
Records Total (%) Records Total
(%) Records Total (%)
Disabled Veh 13,752 41.9 15,236 58.6 N/A N/A CHART II Database Incident 19,062 58.1 8,743 33.6 N/A N/A
Short Form N/A N/A 1,763 6.8 32,440 93.0 Paper Form Long Form N/A N/A 266 1.0 2,451 7.0
Total 32,814 100 26,008 100 34,891 100
Before February 2001, all CHART data was recorded on paper forms. The evaluation team developed the chart data input program to convert paper-based information into an evaluation database. Last year, in order to adopt data from newly introduced CHART II database, the evaluation team interpreted the entire structure of the CHART II database and developed the system to convert data from CHART II database to Microsoft Access format via ODBC database engine. Then, another program was developed to convert data from Microsoft Access database to Excel format for analysis.
In Year 2002, the evaluation team simplified the conversion procedure and improved
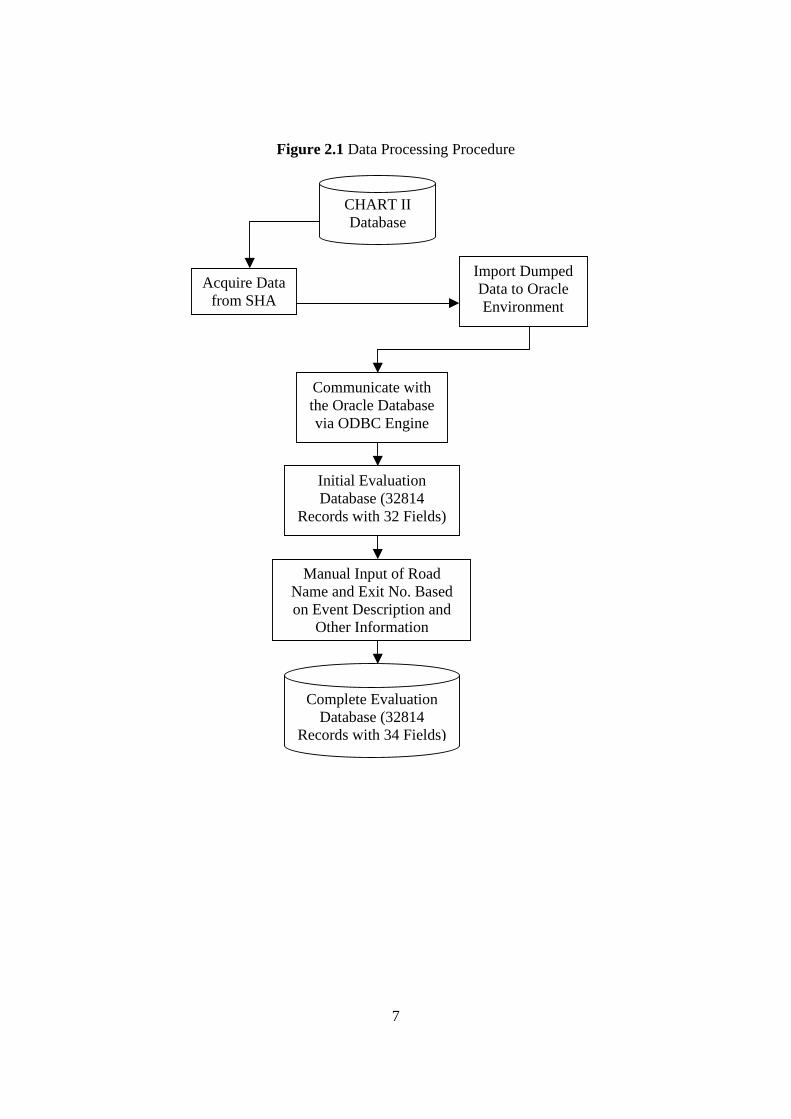
the programs. Through newly developed program, the evaluation team was able to obtain all required data from CHART II database for analysis directly. The data conversion procedure is shown in Figure 2.1.
7
Figure 2.1 Data Processing Procedure
CHART II Database
Acquire Data from SHA
Import Dumped Data to Oracle Environment
Communicate with the Oracle Database via ODBC Engine
Initial Evaluation Database (32814
Records with 32 Fields)
Manual Input of Road Name and Exit No. Based on Event Description and
Other Information
Complete Evaluation Database (32814
Records with 34 Fields)
8
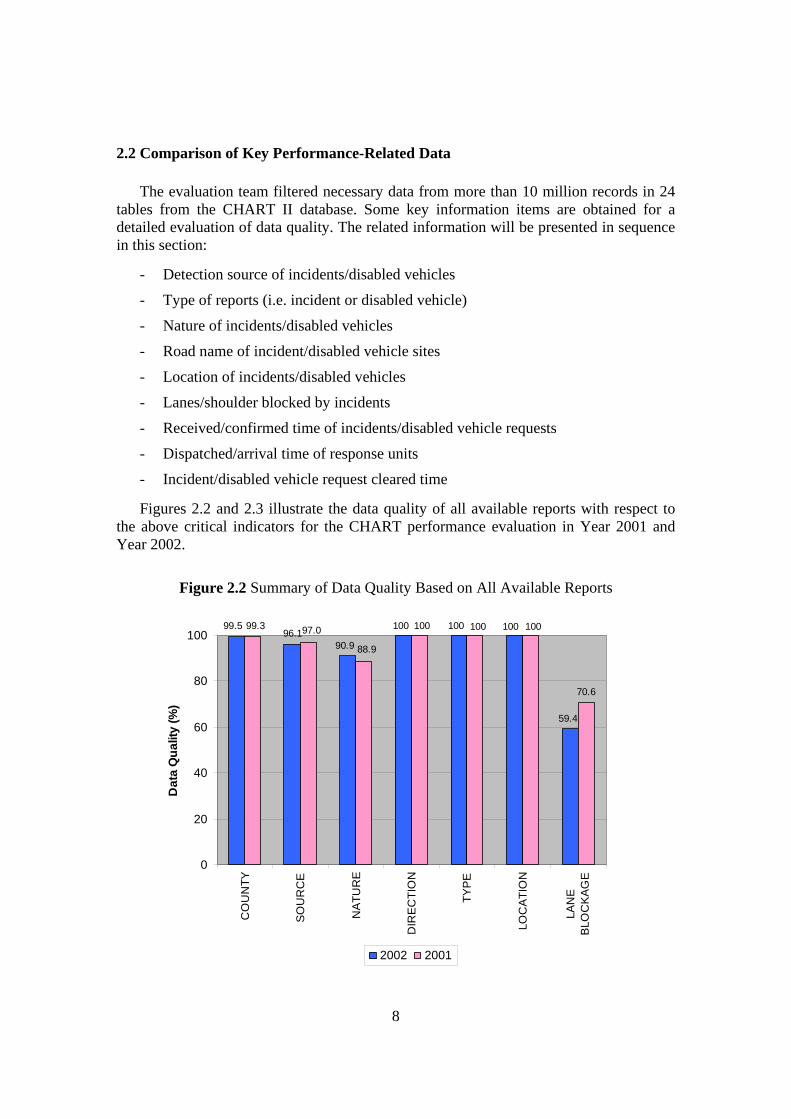
2.2 Comparison of Key Performance-Related Data
The evaluation team filtered necessary data from more than 10 million records in 24 tables from the CHART II database. Some key information items are obtained for a detailed evaluation of data quality. The related information will be presented in sequence in this section:
- Detection source of incidents/disabled vehicles
- Type of reports (i.e. incident or disabled vehicle)
- Nature of incidents/disabled vehicles
- Road name of incident/disabled vehicle sites
- Location of incidents/disabled vehicles
- Lanes/shoulder blocked by incidents
- Received/confirmed time of incidents/disabled vehicle requests
- Dispatched/arrival time of response units
- Incident/disabled vehicle request cleared time
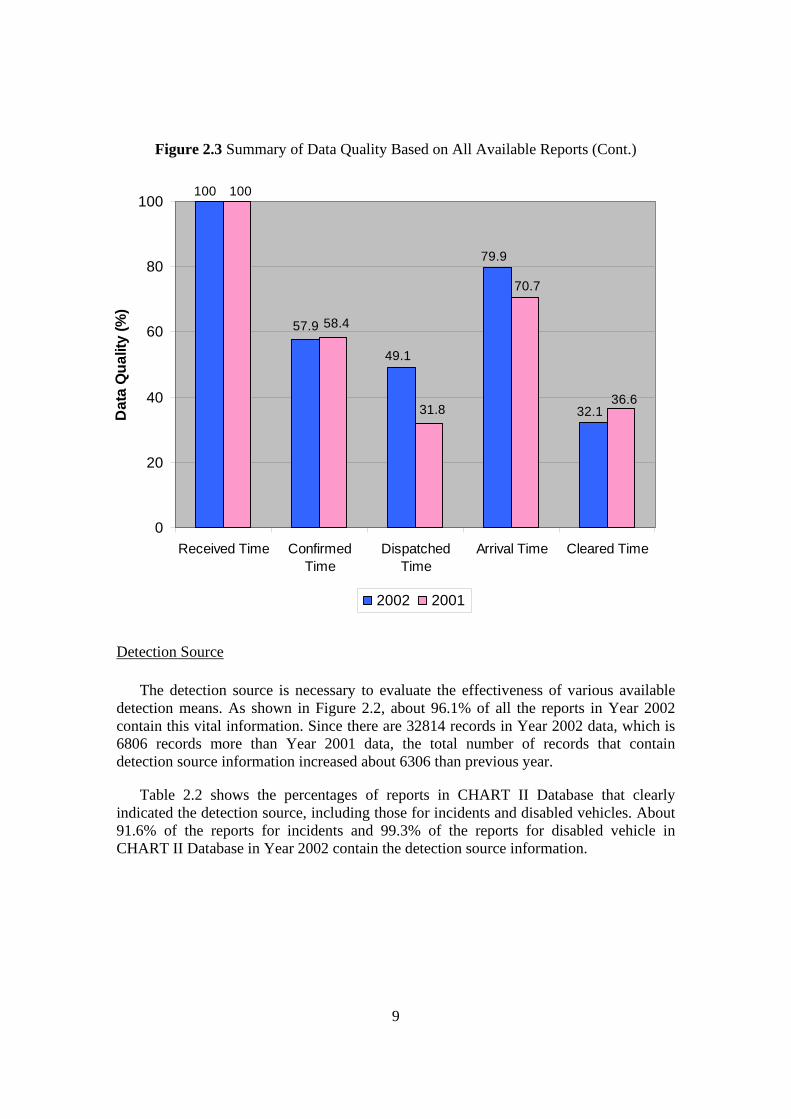
Figures 2.2 and 2.3 illustrate the data quality of all available reports with respect to the above critical indicators for the CHART performance evaluation in Year 2001 and Year 2002.
Figure 2.2 Summary of Data Quality Based on All Available Reports
96.1
70.6
59.4
100100100
90.9
99.5 100100100
88.9
97.099.3
0
20
40
60
80
100
CO
UN
TY
SO
UR
CE
NA
TUR
E
DIR
EC
TIO
N
TYP
E
LOC
ATI
ON
LAN
EB
LOC
KA
GE
Dat
a Q
ualit
y (%
)
2002 2001
9
Figure 2.3 Summary of Data Quality Based on All Available Reports (Cont.)
57.9
100
49.1
79.9
32.1
100
58.4
31.8
70.7
36.6
0
20
40
60
80
100
Received Time ConfirmedTime
DispatchedTime
Arrival Time Cleared Time
Dat
a Q
ualit
y (%
)
2002 2001
Detection Source
The detection source is necessary to evaluate the effectiveness of various available detection means. As shown in Figure 2.2, about 96.1% of all the reports in Year 2002 contain this vital information. Since there are 32814 records in Year 2002 data, which is 6806 records more than Year 2001 data, the total number of records that contain detection source information increased about 6306 than previous year.
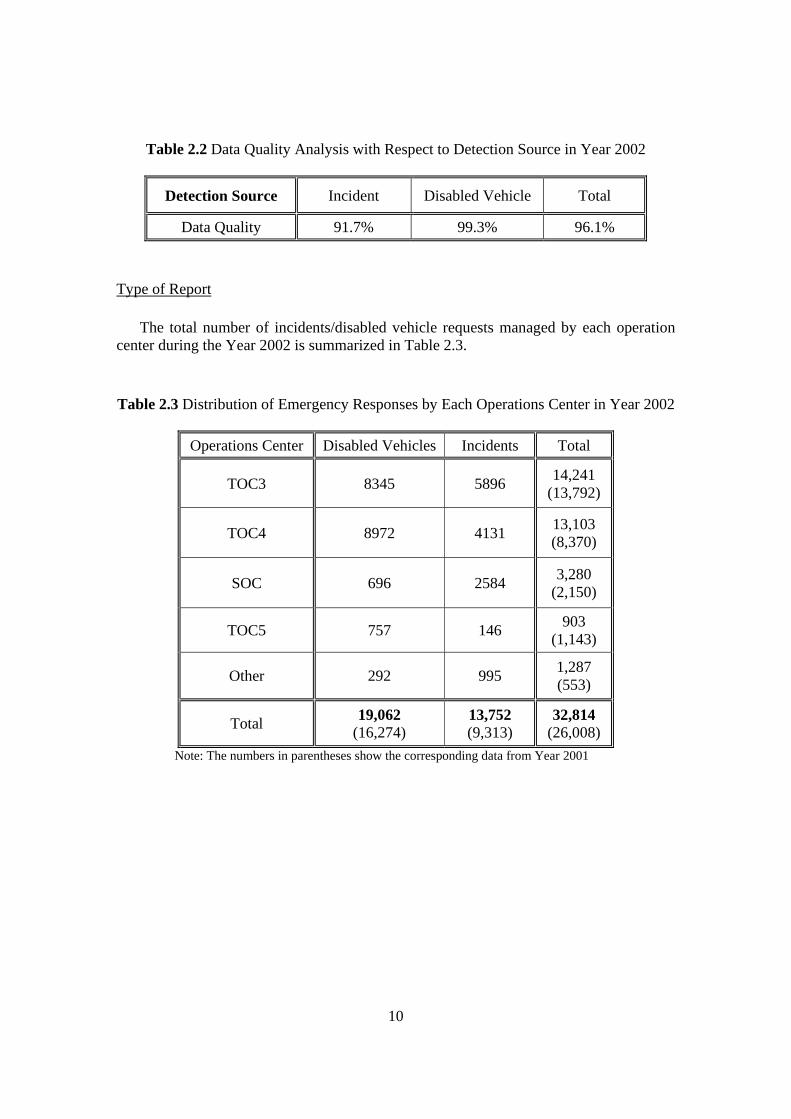
Table 2.2 shows the percentages of reports in CHART II Database that clearly indicated the detection source, including those for incidents and disabled vehicles. About 91.6% of the reports for incidents and 99.3% of the reports for disabled vehicle in CHART II Database in Year 2002 contain the detection source information.
10
Table 2.2 Data Quality Analysis with Respect to Detection Source in Year 2002
Detection Source Incident Disabled Vehicle Total
Data Quality 91.7% 99.3% 96.1%
Type of Report
The total number of incidents/disabled vehicle requests managed by each operation center during the Year 2002 is summarized in Table 2.3.
Table 2.3 Distribution of Emergency Responses by Each Operations Center in Year 2002
Operations Center Disabled Vehicles Incidents Total
TOC3 8345 5896 14,241 (13,792)
TOC4 8972 4131 13,103 (8,370)
SOC 696 2584 3,280 (2,150)
TOC5 757 146 903 (1,143)
Other 292 995 1,287 (553)
Total 19,062 (16,274)
13,752 (9,313)
32,814 (26,008)
Note: The numbers in parentheses show the corresponding data from Year 2001

11
The incident/disabled vehicle reports provided by CHART in Year 2002 cover a total of 13,752 incidents over the entire year, including both major incidents and minor incidents. Over the same period, 19,062 reports were associated with disabled vehicle requests, which bring the total percentage of reports with valid type information to 100% comparing to 98.4% in Year 2001.
The CHART II Database classifies all records into two types, namely, incidents and disabled vehicles/driver assistance. However, major incidents and minor incidents are not distinguished in the CHART II Database. According to this classification, the CHART II Database includes 13,752 incidents for both major and minor incidents, and 19,062 driver assistance requests.
Nature of Incidents/Disabled Vehicles
This field of data can be used to classify the nature of incidents, which include vehicle on fire, debris in roadway, collision-personal injury, collision-property damage, collision-fatality, disabled on road, emergency roadwork, police activity, off-road activity, and other. The reports for disabled vehicles actually cover all the following emergency response operations: abandoned vehicle, tire change, hot shot, water shortage, gas shortage, directions, own disposition, call for service, relay operators, gone on arrival, and others.
As shown in Figure 2.2, it has been found that about 90.9 percent of emergency response reports in the Year 2002 indicated the nature of operations. Compared with 88.9 percent in Year 2001 and only 49.6 percent in Year 2000, CHART has sustained its improvement in this regard.
Table 2.4 shows the percentage of data with valid nature information for incidents, disabled vehicles, and total reports in CHART II Database. In the CHART II Database, up to 88.9 percent provided the information about the nature.
Table 2.4 Data Quality Analysis with Respect to Incident Nature in Year 2002
Nature Incident Disabled Vehicle Total
Data Quality 87.9% 93.1% 90.9%
12
Location and Road Name Associated with Each Response Operation
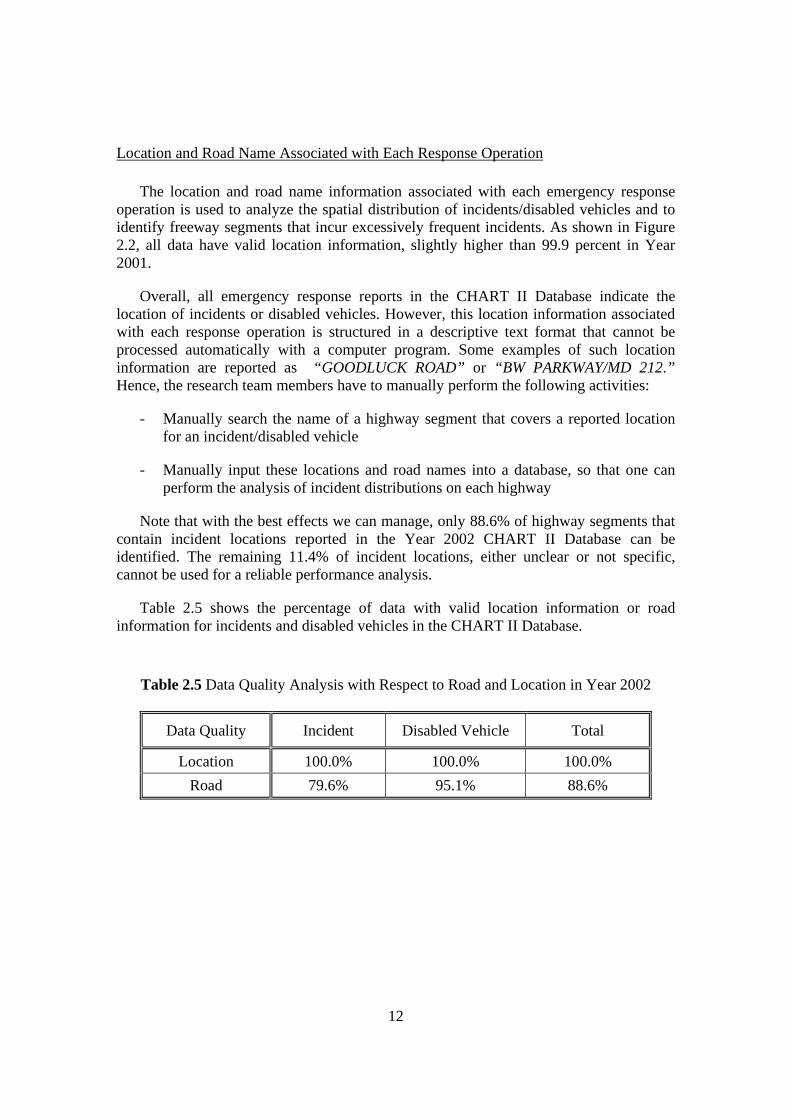
The location and road name information associated with each emergency response operation is used to analyze the spatial distribution of incidents/disabled vehicles and to identify freeway segments that incur excessively frequent incidents. As shown in Figure 2.2, all data have valid location information, slightly higher than 99.9 percent in Year 2001.
Overall, all emergency response reports in the CHART II Database indicate the location of incidents or disabled vehicles. However, this location information associated with each response operation is structured in a descriptive text format that cannot be processed automatically with a computer program. Some examples of such location information are reported as “GOODLUCK ROAD” or “BW PARKWAY/MD 212.” Hence, the research team members have to manually perform the following activities:
- Manually search the name of a highway segment that covers a reported location for an incident/disabled vehicle
- Manually input these locations and road names into a database, so that one can perform the analysis of incident distributions on each highway
Note that with the best effects we can manage, only 88.6% of highway segments that contain incident locations reported in the Year 2002 CHART II Database can be identified. The remaining 11.4% of incident locations, either unclear or not specific, cannot be used for a reliable performance analysis.
Table 2.5 shows the percentage of data with valid location information or road information for incidents and disabled vehicles in the CHART II Database.
Table 2.5 Data Quality Analysis with Respect to Road and Location in Year 2002
Data Quality Incident Disabled Vehicle Total
Location 100.0% 100.0% 100.0% Road 79.6% 95.1% 88.6%
13
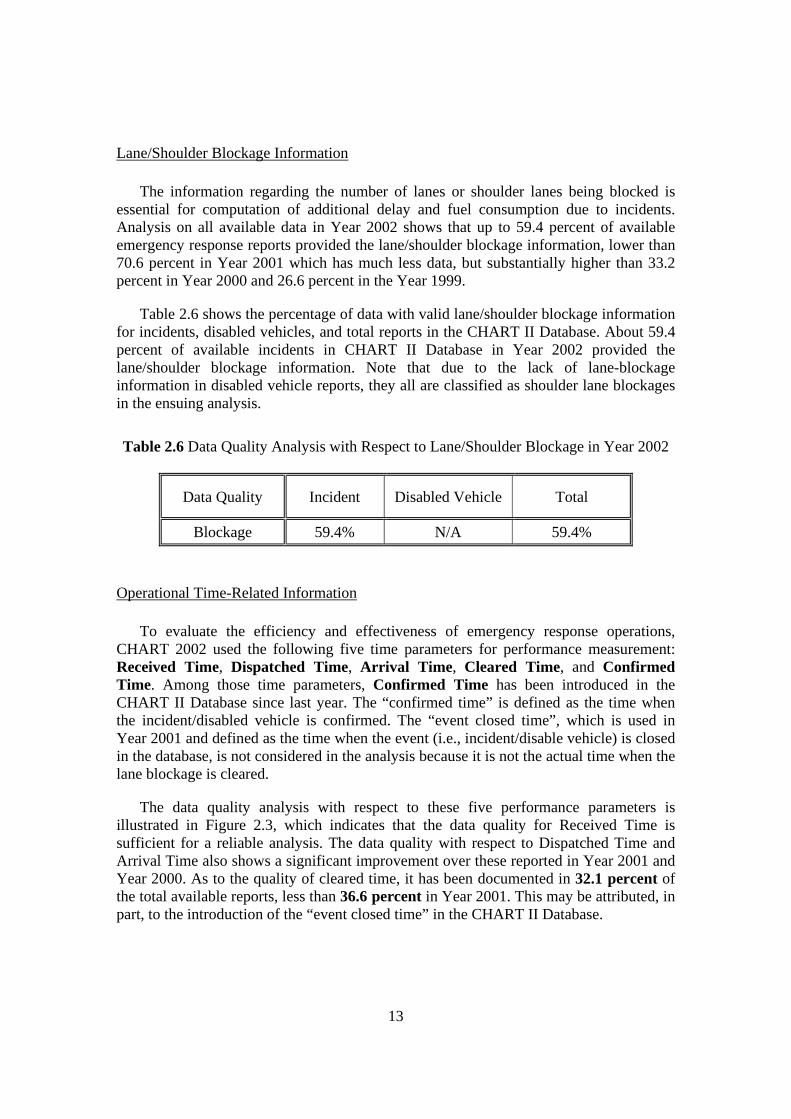
Lane/Shoulder Blockage Information
The information regarding the number of lanes or shoulder lanes being blocked is essential for computation of additional delay and fuel consumption due to incidents. Analysis on all available data in Year 2002 shows that up to 59.4 percent of available emergency response reports provided the lane/shoulder blockage information, lower than 70.6 percent in Year 2001 which has much less data, but substantially higher than 33.2 percent in Year 2000 and 26.6 percent in the Year 1999.
Table 2.6 shows the percentage of data with valid lane/shoulder blockage information for incidents, disabled vehicles, and total reports in the CHART II Database. About 59.4 percent of available incidents in CHART II Database in Year 2002 provided the lane/shoulder blockage information. Note that due to the lack of lane-blockage information in disabled vehicle reports, they all are classified as shoulder lane blockages in the ensuing analysis.
Table 2.6 Data Quality Analysis with Respect to Lane/Shoulder Blockage in Year 2002
Data Quality Incident Disabled Vehicle Total
Blockage 59.4% N/A 59.4%
Operational Time-Related Information
To evaluate the efficiency and effectiveness of emergency response operations, CHART 2002 used the following five time parameters for performance measurement: Received Time, Dispatched Time, Arrival Time, Cleared Time, and Confirmed Time. Among those time parameters, Confirmed Time has been introduced in the CHART II Database since last year. The “confirmed time” is defined as the time when the incident/disabled vehicle is confirmed. The “event closed time”, which is used in Year 2001 and defined as the time when the event (i.e., incident/disable vehicle) is closed in the database, is not considered in the analysis because it is not the actual time when the lane blockage is cleared.
The data quality analysis with respect to these five performance parameters is illustrated in Figure 2.3, which indicates that the data quality for Received Time is sufficient for a reliable analysis. The data quality with respect to Dispatched Time and Arrival Time also shows a significant improvement over these reported in Year 2001 and Year 2000. As to the quality of cleared time, it has been documented in 32.1 percent of the total available reports, less than 36.6 percent in Year 2001. This may be attributed, in part, to the introduction of the “event closed time” in the CHART II Database.

14
Table 2.7 shows the percentage of data with valid time information for incidents and disabled vehicles in the CHART II Database. Overall, except for the cleared time, the application of the CHART II Database has improved the quality of available data.
Table 2.7 Data Quality Analysis with Respect to Time in Year 2002
Data Quality Incident Disabled Vehicle Total
Received Time 100.0% 100.0% 100.0% Confirmed Time 54.9% 60.1% 57.9% Dispatched Time 70.5% 33.8% 49.1%
Arrival Time 65.9% 90.0% 79.9% Cleared Time 28.3% 34.8% 32.1%
In summary, CHART staffs have made significant progress in documenting their performance and keeping incident-operations-related information in Year 2002. The full use of the CHART II Database for Year 2002 has an obvious positive impact on data quality improvement. But much remains to be improved, as evidenced in the above statistics of data quality evaluation. CHART operators should be aware that their contribution to mitigating traffic congestion, assisting driving populations, and improving the overall driving environments would not be underestimated only if more quality data were available for analysis and for justifying the resulting benefits.
15
CHAPTER 3: ANALYSIS OF DATA CHARACTERISTICS
To improve both incident management and traffic safety, the evaluation work starts with a comprehensive analysis of the spatial distribution of incidents/disabled vehicles and their key characteristics, which are
- Distribution of incidents/disabled vehicles by weekday and weekend
- Distribution of incidents/disabled vehicles by peak and off-peak hours
- Distribution of incidents/disabled vehicles by road
- Distribution of incidents/disabled vehicles by location
- Distribution of incidents/disabled vehicles by lane blockage
- Distribution of incidents/disabled vehicles by blockage duration
With the above information, one can better design the incident management strategies, including distributing patrol vehicles around freeway segments of a high incident frequency, assessing the impact areas under the average and the worst incident scenarios, and identifying hazardous highway segments from both the safety and operations perspectives.
3.1 Distribution of Incidents and Disabled Vehicles by Weekday and Weekend, and
by Peak and Off-Peak Hours
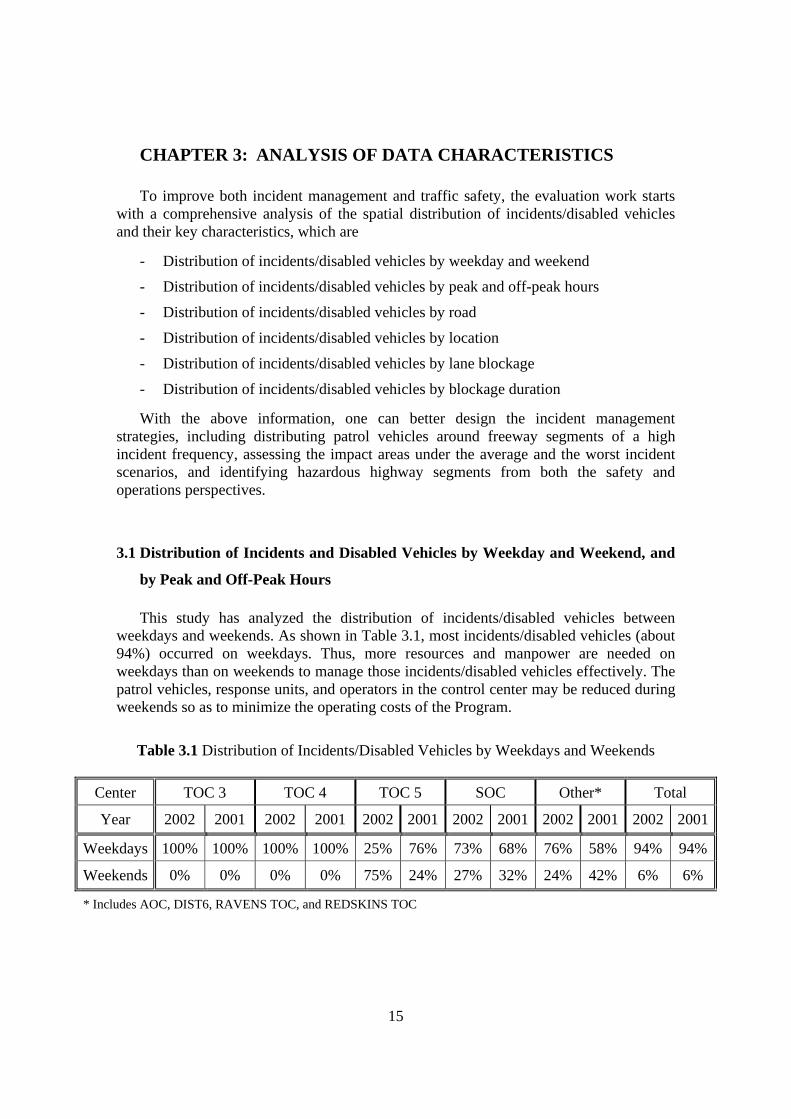
This study has analyzed the distribution of incidents/disabled vehicles between weekdays and weekends. As shown in Table 3.1, most incidents/disabled vehicles (about 94%) occurred on weekdays. Thus, more resources and manpower are needed on weekdays than on weekends to manage those incidents/disabled vehicles effectively. The patrol vehicles, response units, and operators in the control center may be reduced during weekends so as to minimize the operating costs of the Program.
Table 3.1 Distribution of Incidents/Disabled Vehicles by Weekdays and Weekends
Center TOC 3 TOC 4 TOC 5 SOC Other* Total
Year 2002 2001 2002 2001 2002 2001 2002 2001 2002 2001 2002 2001
Weekdays 100% 100% 100% 100% 25% 76% 73% 68% 76% 58% 94% 94%
Weekends 0% 0% 0% 0% 75% 24% 27% 32% 24% 42% 6% 6%
* Includes AOC, DIST6, RAVENS TOC, and REDSKINS TOC

16
As defined in the 1999 CHART evaluation, peak hours in this study were set to be from 7:00 AM to 9:30 AM and from 4:00 PM to 6:30 PM. About 43% of overall incidents/disabled vehicles reported in Year 2002 data set occurred during such congested periods, slightly lower than that of 49% in Year 2001 (see Table 3.2).
Table 3.2 Distribution of Incidents/Disabled Vehicles by Peak and Off-peak Periods
Center TOC 3 TOC 4 TOC 5 SOC Other* Total
Year 2002 2001 2002 2001 2002 2001 2002 2001 2002 2001 2002 2001
Peak 45% 53% 49% 59% 13% 15% 24% 25% 26% 20% 43% 49%Off-Peak 55% 47% 51% 41% 87% 85% 76% 75% 74% 80% 57% 51%
No Info 0% 0% 0% 0% 0% 0% 0% 0% 0% 0% 0% 0%
* Includes AOC, DIST6, RAVENS TOC, and REDSKINS TOC
3.2 Distribution of Incidents and Disabled Vehicles by Road
Figures 3.1 and 3.2 present the frequency distribution of incident/disabled vehicles by road, where the distribution of incidents and disabled vehicles for the CHART II Database is presented in Figure 3.1, and the comparison of the entire record of Year 2002 with Year 2001 is shown in Figure 3.2.

17
Figure 3.1 Distribution of Incidents/Disabled Vehicles by Road in Year 2002 38
24
1424
618
2649
263
392
372 62
5
109
10 167
80 137
273
2809
5828
1787
856
5267
312 91
9
1009
1170
13 4
484
22 25
425 94
1
0
1000
2000
3000
4000
5000
6000
7000I-4
95/I-
95
I-95
road
I-270
I-695
I-70
road
I-83
295
US
50
US
1
370
795
895 68 97
othe
rs
Freq
uenc
y
Incident Disabled Vehicle
Figure 3.2 Comparison for the Distribution of Incidents/Disabled Vehicles by Road
9652
3211
1474
7916
575 13
11
1381 1795
122
14
651
102
162 69
8
3750
4
3027
337
7051340
70
1730
1103
648
366
5165
127722
96
9524
0
2000
4000
6000
8000
10000
12000
I-495
/I-95
I-95
road
I-270
I-695
I-70
road
I-83
295
US
50
US
1
370
795
895 68 97
othe
rs
Freq
uenc
y
2002 2001

18
Based on the statistics in these figures, it is clear that the four major commuting freeways, I-495/95 (Capital Beltway), I-695 (Baltimore Beltway), I-95 (from Delaware border to Capital Beltway), and I-270, had a very large number of incidents/disabled vehicles, significantly higher than all other highways. For example, I-495/95 experienced a total of 9,652 incidents/disabled vehicles in the year of 2002, and I-695 had a total of 7,916 incidents/ disabled vehicles during the same period. I-95 and I-270 were plagued by 3,211 and 1,474 incidents/disabled vehicles, respectively, in Year 2002.
The frequency distribution of incidents/disabled vehicles indicates that CHART responded to about 26 incidents/disabled vehicles per day for I-495/95 alone, about 22 incidents/disabled vehicles per day along I-695; and 9 and 4 incidents/disabled vehicles per day, respectively, for I-95 and I-270. The same data for I-495/95, I-695, I-95 and I-270 in Year 2001 are 26, 14, 6 and 3 cases per day respectively. Other major freeways, such as I-70, I-83, I-795, US-50, and MD-295, also experienced a large number of incidents/disabled vehicles during Year 2002.
It should be noted that both I-95 and I-270 are connected to I-495/95, and are the main contributors of traffic congestion on I-495 during daily commuting periods. Because of the high traffic demand on I-495, any incurred incident is likely to have vehicles queued back to both I-95 and I-270, thus causing serious congestion on those two freeways. Such an interdependent nature of incidents between primary commuting freeways should be taken into account in prioritizing and implementing incident management strategies.
Conceivably, contending with such a high frequency of incidents on all those major commuting freeways is a challenging task from either the traffic safety or congestion mitigation perspective. Development of effective strategies to improve both the driving conditions and driver behavior will be regarded as priority tasks. Since those incidents also resulted in lane blockage on congested freeways, all agencies responsible for highway operations and safety ought to take the implementation of an efficient incident management program as one of their priority tasks.
3.3 Distribution of Incidents and Disabled Vehicles by Location
To best allocate patrol vehicles and response units to hazardous highway segments, this study has also analyzed the distribution of incidents/disabled vehicles by location along major freeways. By grouping the total number of incidents and disabled vehicles between two consecutive exits as an indicator, Figure 3.3 presents the geographical distribution of incidents and disabled vehicles on I-495/95 from the Chart II Database. Figure 3.4 illustrates the comparison results between Year 2001 and Year 2002 with respect to the total emergency responses, including incidents and disabled vehicles.

19
Figure 3.3 Distribution of Incidents/Disabled Vehicles by Location on I-495/I-95 in Year 2002
351
176
315
288 301
169
517
116
84
240
140
354
238
137 15
8 170
277
409
256
149
112 12
8 153
142
71
97
43
6364
197
302
257
122
193
191
124
101
78
128
193
97106
46
75
197
79
142
10513
0
72
55
74
228
110
193
203
0
100
200
300
400
500
600
1&2
2&3
3&4
4&7
7&9
9&11
11&1
5
15&1
6
16&1
7
17&1
9
19&2
0
20&2
2
22&2
3
23&2
4
24&2
5
25&2
7
27&2
8
28&2
9
29&3
0
30&3
1
31&3
3
33&3
4
34&3
5
35&3
6
36&3
8
38&3
9
39&4
0
40&4
1
Exits
Freq
uenc
y
Incident Disabled Vehicle
Figure 3.4 Comparison of Incidents/Disabled Vehicles Distribution by Location on I-495/I-95 between Year 2001 and Year 2002
443
714
191
547
366
470
711
453
138
212
295
606
454
295
297
460
590
260
199
209
98
485
232
384
294
259
21523
7
346
130
248
39344
5
248
554
188
184
124
113
105
378
595
476
229
422
240
306
475
351
12314
8
661
231
37439
5
275
0
100
200
300
400
500
600
700
800
1&2
2&3
3&4
4&7
7&9
9&11
11&
15
15&
16
16&
17
17&
19
19&
20
20&
22
22&
23
23&
24
24&
25
25&
27
27&
28
28&
29
29&
30
30&
31
31&
33
33&
34
34&
35
35&
36
36&
38
38&
39
39&
40
40&
41
Exits
Freq
uenc
y
2002 2001
20
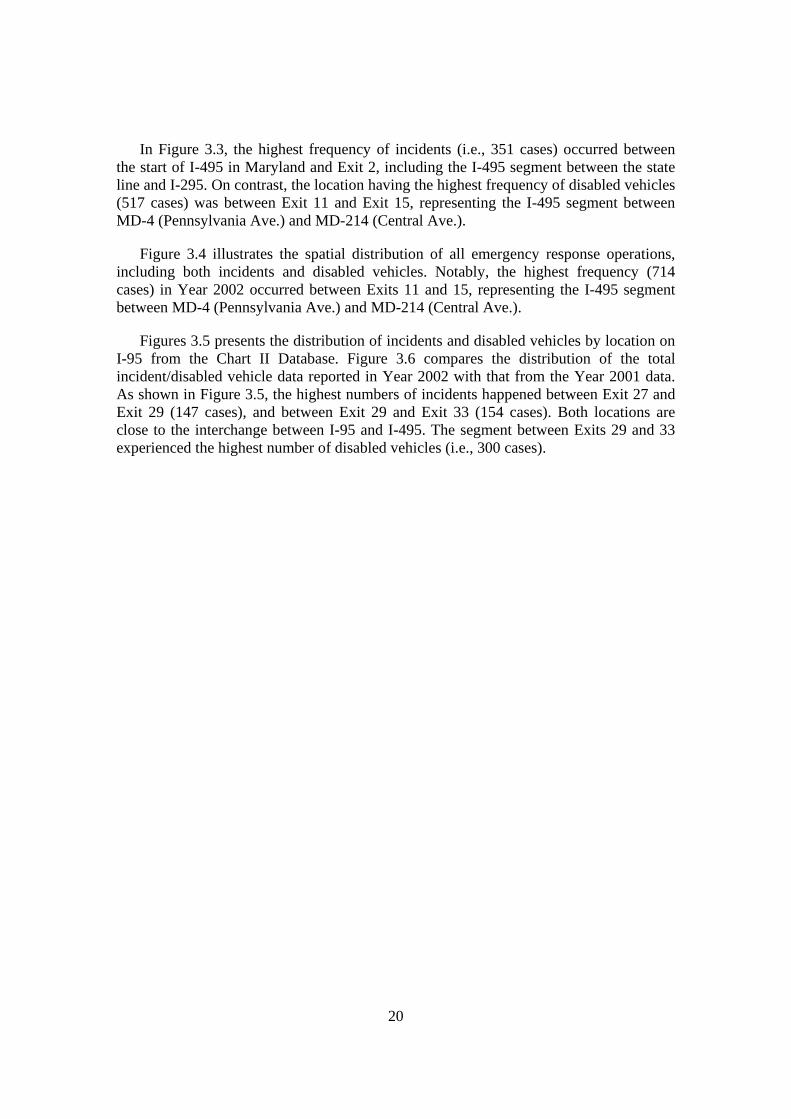
In Figure 3.3, the highest frequency of incidents (i.e., 351 cases) occurred between the start of I-495 in Maryland and Exit 2, including the I-495 segment between the state line and I-295. On contrast, the location having the highest frequency of disabled vehicles (517 cases) was between Exit 11 and Exit 15, representing the I-495 segment between MD-4 (Pennsylvania Ave.) and MD-214 (Central Ave.).
Figure 3.4 illustrates the spatial distribution of all emergency response operations, including both incidents and disabled vehicles. Notably, the highest frequency (714 cases) in Year 2002 occurred between Exits 11 and 15, representing the I-495 segment between MD-4 (Pennsylvania Ave.) and MD-214 (Central Ave.).
Figures 3.5 presents the distribution of incidents and disabled vehicles by location on I-95 from the Chart II Database. Figure 3.6 compares the distribution of the total incident/disabled vehicle data reported in Year 2002 with that from the Year 2001 data. As shown in Figure 3.5, the highest numbers of incidents happened between Exit 27 and Exit 29 (147 cases), and between Exit 29 and Exit 33 (154 cases). Both locations are close to the interchange between I-95 and I-495. The segment between Exits 29 and 33 experienced the highest number of disabled vehicles (i.e., 300 cases).

21
Figure 3.5 Distribution of Incidents/Disabled Vehicles by Location on I-95 in Year 2002
51 46 42
56
31
19 20
31
14
68
203
300
103
65
97
152
128
264
83
4037
639
65
124
43505146
78
60
154
147
116
3537
5520
18
01
4750
33
69
0
50
100
150
200
250
300
350
27&2
9
29&3
3
33&3
5
35&3
8
38&4
1
41&4
3
43&4
6
46&4
7
47&4
9
49&5
0
50&5
1
51&5
2
52&5
3
53&5
4
54&5
5
55&5
6
56&5
7
57&5
9
59&6
0
60&6
1
61&6
4
64&6
7
67&7
4
74&7
7
77&1
09
Exits
Freq
uenc
y
Incident Disabled Vehicle
Figure 3.6 Comparison of Incidents/Disabled Vehicles Distribution by Location on I-95
84 96 89
74
33 24 25 37
15
69
388
350
454
129
181
111
148
202
171
388
148
10 3 6
74 7577
230
140
124
6666
112
439
106
31
12 19 12 11 14 8 21
4 10
129
57
19 8 16
050
100150
200250
300350
400450
500
27&2
9
29&3
3
33&3
5
35&3
8
38&4
1
41&4
3
43&4
6
46&4
7
47&4
9
49&5
0
50&5
1
51&5
2
52&5
3
53&5
4
54&5
5
55&5
6
56&5
7
57&5
9
59&6
0
60&6
1
61&6
4
64&6
7
67&7
4
74&7
7
77&1
09
Exits
Freq
uenc
y
2002 2001

22
Overall, for both incidents and disabled vehicles, the segment of I-95 between Exits 29 and 33 demanded the highest number of incident responses, and had a total frequency of 454 in Year 2002 compared with 439 in the previous year. The segment near the interchange between I-495 and I-95 had the third largest number of overall incident responses, i.e., 350 in Year 2002 compared with 388 in Year 2001. The segment of I-95 between Exits 47 and 49 (between I-195 and I-695) suffered the second largest number, about 388 emergency requests in Year 2002 compared with 230 in Year 2001.
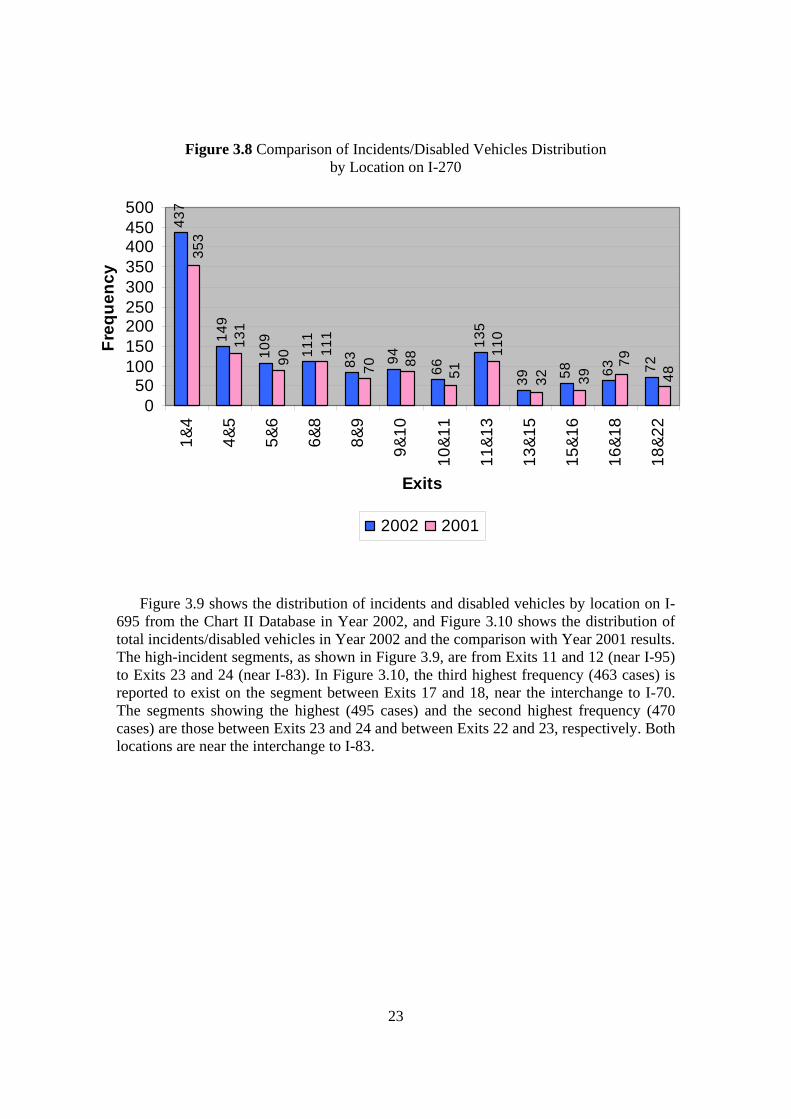
Figure 3.7 represents the same spatial distribution of incidents/disabled vehicles data on I-270 for Year 2002. The comparison of emergency operation data between Year 2002 and Year 2001 is shown in Figure 3.8. In Figure 3.7, the segment between Exits 1 and 4 on I-270 was recorded to have the highest numbers of incidents and disabled vehicles, being 198 and 239, respectively. In Figure 3.8 as well, the highest frequency occurred between Exit 1 and Exit 4, which is 437 compared with 353 in Year 2001. Overall, the incident/disabled vehicle frequency appears to decrease linearly with its distance from the Capital Beltway.
Figure 3.7 Distribution of Incidents/Disabled Vehicles by Location on I-270
in Year 2002
198
53 43 40 42 39
26
46
14 22 18
32
239
96
66 71
41
55
40
89
25 36 45 40
0
50
100
150
200
250
300
1&4
4&5
5&6
6&8
8&9
9&10
10&
11
11&
13
13&
15
15&
16
16&
18
18&
22
Exits
Freq
uenc
y
Incident Disabled Vehicle
23
Figure 3.8 Comparison of Incidents/Disabled Vehicles Distribution by Location on I-270
437
149
109
111
83 94
66
135
39 58 63 7248
79
3932
110
51
8870
111
90
131
353
050
100150200250300350400450500
1&4
4&5
5&6
6&8
8&9
9&10
10&1
1
11&1
3
13&1
5
15&1
6
16&1
8
18&2
2
Exits
Freq
uenc
y
2002 2001
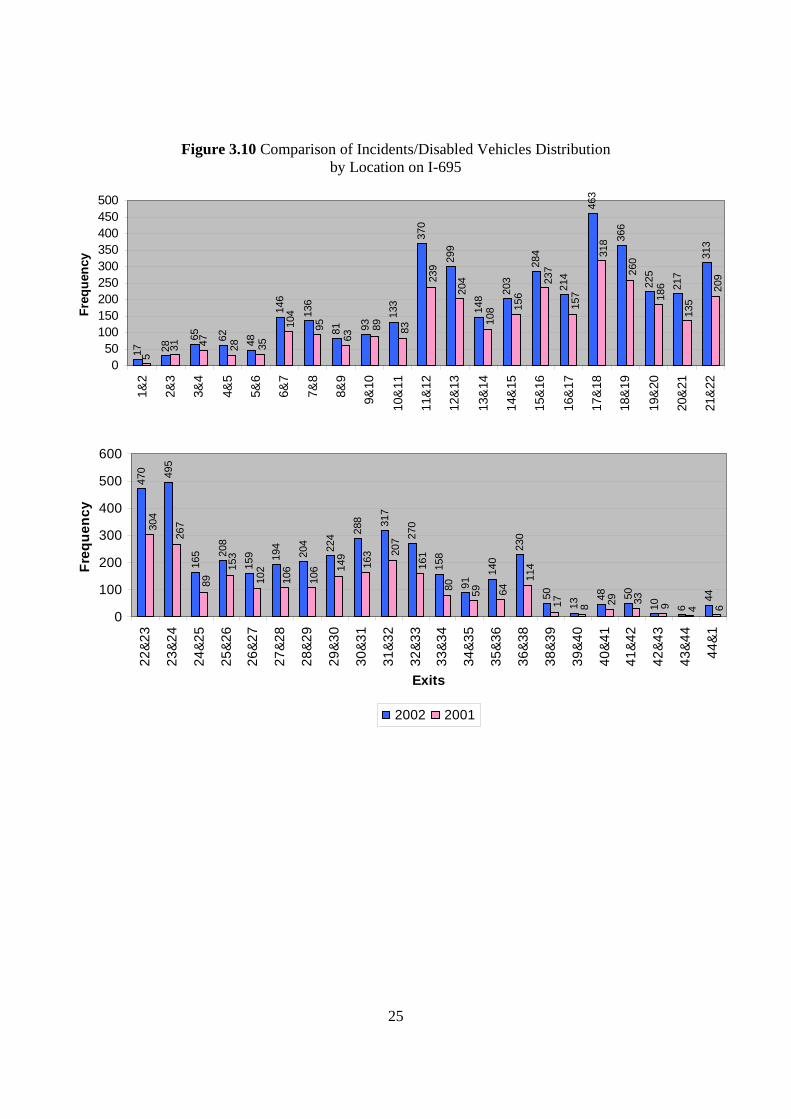
Figure 3.9 shows the distribution of incidents and disabled vehicles by location on I-695 from the Chart II Database in Year 2002, and Figure 3.10 shows the distribution of total incidents/disabled vehicles in Year 2002 and the comparison with Year 2001 results. The high-incident segments, as shown in Figure 3.9, are from Exits 11 and 12 (near I-95) to Exits 23 and 24 (near I-83). In Figure 3.10, the third highest frequency (463 cases) is reported to exist on the segment between Exits 17 and 18, near the interchange to I-70. The segments showing the highest (495 cases) and the second highest frequency (470 cases) are those between Exits 23 and 24 and between Exits 22 and 23, respectively. Both locations are near the interchange to I-83.

24
Figure 3.9 Distribution of Incidents/Disabled Vehicles by Location on I-695 in Year 2002
7 9 25 22 1254 44 36 33 45
173
137
7094 10
671
154
113
73 63 7112
9 144
5376 55 47 5180 95 9874
40 34 41 6118 5 14 7 4 334
0
50
100
150
200
250
300
350
400
1&2
3&4
5&6
7&8
9&10
11&
12
13&
14
15&
16
17&
18
19&
20
21&
22
23&
24
25&
26
27&
28
29&
30
31&
32
33&
34
35&
36
38&
39
40&
41
42&
43
44&
1
Freq
uenc
y
10 1940 40 36
92 9245 60
8819
716
278
109
178
143
309
253
152
154
242
341
351
112 13
210
4 147
153
144 19
3 219
196
118
5799
169
328
34 436 3 10
0
50
100
150
200
250
300
350
400
1&2
3&4
5&6
7&8
9&10
11&
12
13&
14
15&
16
17&
18
19&
20
21&
22
23&
24
25&
26
27&
28
29&
30
31&
32
33&
34
35&
36
38&
39
40&
41
42&
43
44&
1
Exits
Freq
uenc
y
Incident Disabled Vehicle
25
Figure 3.10 Comparison of Incidents/Disabled Vehicles Distribution by Location on I-695
17 28
65 62 48
146
136
81 93
133
370
299
148 20
3
284
214
463
366
225
217
313
5
31 47
209
13518
6
26031
8
157
237
156
108
20423
9
8389
63
95104
3528
050
100150200250300350400450500
1&2
2&3
3&4
4&5
5&6
6&7
7&8
8&9
9&10
10&
11
11&
12
12&
13
13&
14
14&
15
15&
16
16&
17
17&
18
18&
19
19&
20
20&
21
21&
22
Freq
uenc
y
470 49
5
165 20
8
159 19
4
204 224 28
8 317
270
158
91
140
230
50
13
48 50
10 6
446493329817
114
645980
16120
7
163
149
106
106
10215
3
89
26730
4
0
100
200
300
400
500
600
22&2
3
23&2
4
24&2
5
25&2
6
26&2
7
27&2
8
28&2
9
29&3
0
30&3
1
31&3
2
32&3
3
33&3
4
34&3
5
35&3
6
36&3
8
38&3
9
39&4
0
40&4
1
41&4
2
42&4
3
43&4
4
44&1
Exits
Freq
uenc
y
2002 2001

26
3.4 Distribution of Incidents and Disabled Vehicles by Lane Blockage Type
Figure 3.11 illustrates the distribution of incidents by lane blockage, where most incidents out of 2,268 one-lane blockages were one-lane blockage. The overall distribution of incidents and disabled vehicles by lane blockage and the comparison with Year 2001 results is illustrated in Figure 3.12. Note that all reported disabled vehicles in Year 2002 are classified as shoulder lane blockages.
Figure 3.11 Distribution of Incidents by Lane Blockage in Year 2002
2045
143
211322
68
212
2346
1684
346
1836
571
81
583
636
600
1296
0
500
1000
1500
2000
2500
Same Direction Opposite Direction Both Direction
Lane Blockage
Freq
uenc
y
Shoulder 1 Lane 2 Lanes 3 Lanes >= 4 Lanes
Figure 3.12 Comparison of Incidents/Disabled Vehicles Distribution
by Lane Blockage
2110
7
2268
1684
571
636
1759
3
2357
1407
403
432
0
5000
10000
15000
20000
25000
Shoulder 1 Lane 2 Lanes 3 Lanes >= 4 Lanes
Lane Blockage
Freq
uenc
y
2002 2001
27
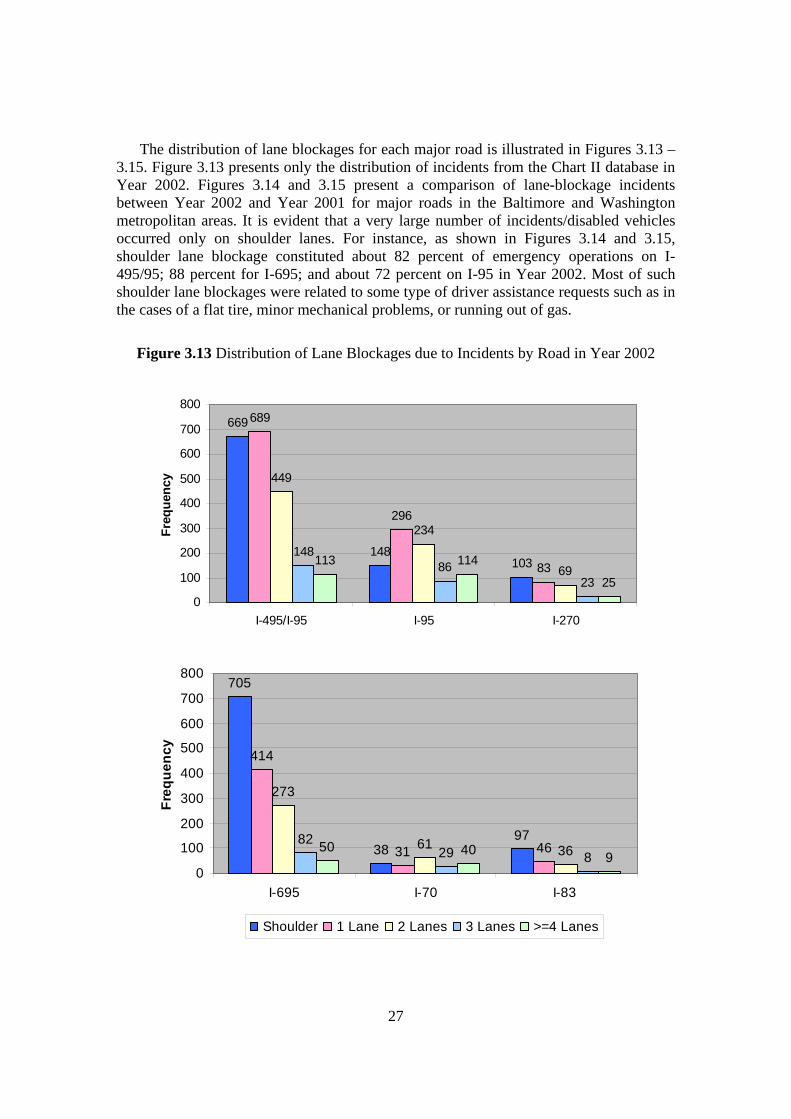
The distribution of lane blockages for each major road is illustrated in Figures 3.13 – 3.15. Figure 3.13 presents only the distribution of incidents from the Chart II database in Year 2002. Figures 3.14 and 3.15 present a comparison of lane-blockage incidents between Year 2002 and Year 2001 for major roads in the Baltimore and Washington metropolitan areas. It is evident that a very large number of incidents/disabled vehicles occurred only on shoulder lanes. For instance, as shown in Figures 3.14 and 3.15, shoulder lane blockage constituted about 82 percent of emergency operations on I-495/95; 88 percent for I-695; and about 72 percent on I-95 in Year 2002. Most of such shoulder lane blockages were related to some type of driver assistance requests such as in the cases of a flat tire, minor mechanical problems, or running out of gas.
Figure 3.13 Distribution of Lane Blockages due to Incidents by Road in Year 2002
669
148103
689
296
83
449
234
69148
8623
113 114
250
100
200
300
400
500
600
700
800
I-495/I-95 I-95 I-270
Freq
uenc
y
705
3897
414
31 46
273
61 3682
29 850 40 9
0
100
200
300
400
500
600
700
800
I-695 I-70 I-83
Freq
uenc
y
Shoulder 1 Lane 2 Lanes 3 Lanes >=4 Lanes

28
Figure 3.14 Distribution of Lane Blockages due to Incidents and Disabled Vehicles by Major Freeways in the Washington Region
6497
1935
959
689
296
83
449
234
69148
86 23113
114
25
0
1000
2000
3000
4000
5000
6000
7000
I-495/I-95 I-95 I-270
Freq
uenc
y
6423
1532
87412
93
166
13153
3
158
62133
62 2688 59 160
1000
2000
3000
4000
5000
6000
7000
I-495/I-95 I-95 I-270
Freq
uenc
y
Shoulder 1 Lane 2 Lanes 3 Lanes >=4 Lanes
Year 2002
Year 2001
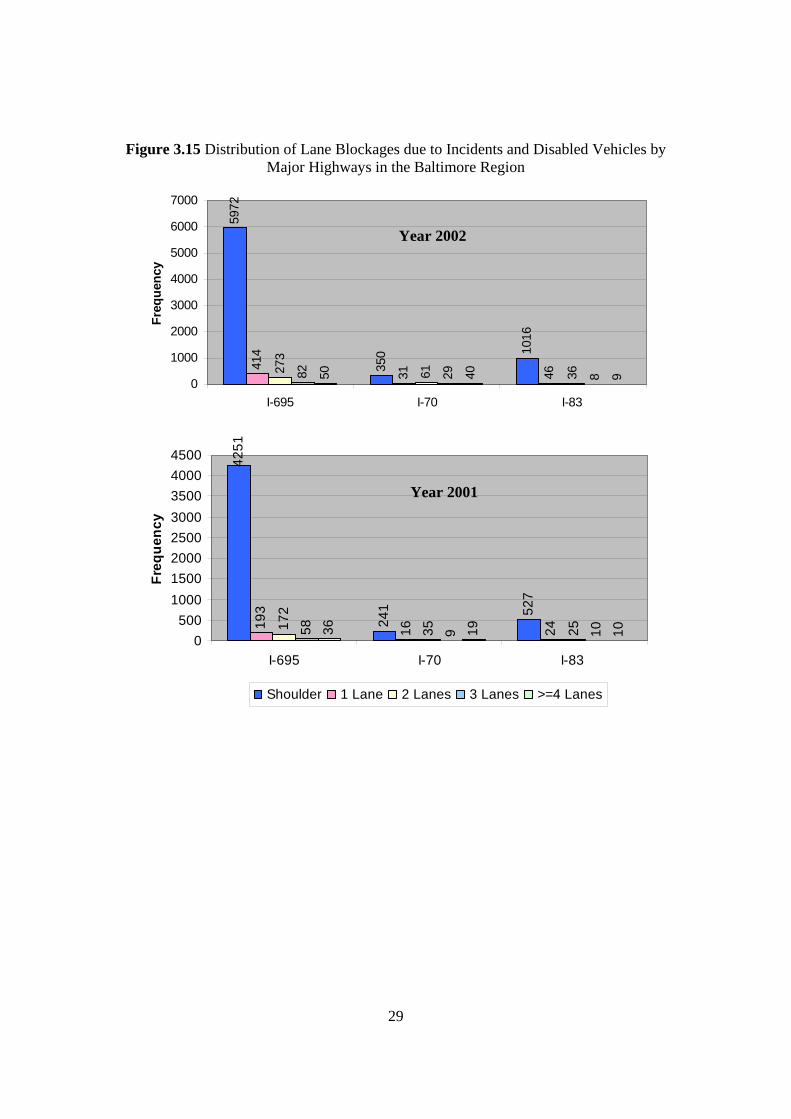
29
Figure 3.15 Distribution of Lane Blockages due to Incidents and Disabled Vehicles by Major Highways in the Baltimore Region
5972
350 10
16
414
31 46273
61 3682 29 850 40 90
1000
2000
3000
4000
5000
6000
7000
I-695 I-70 I-83
Freq
uenc
y
4251
241 52
7
193
16 24172
35 2558 9 1036 19 100500
10001500200025003000350040004500
I-695 I-70 I-83
Freq
uenc
y
Shoulder 1 Lane 2 Lanes 3 Lanes >=4 Lanes
Year 2002
Year 2001
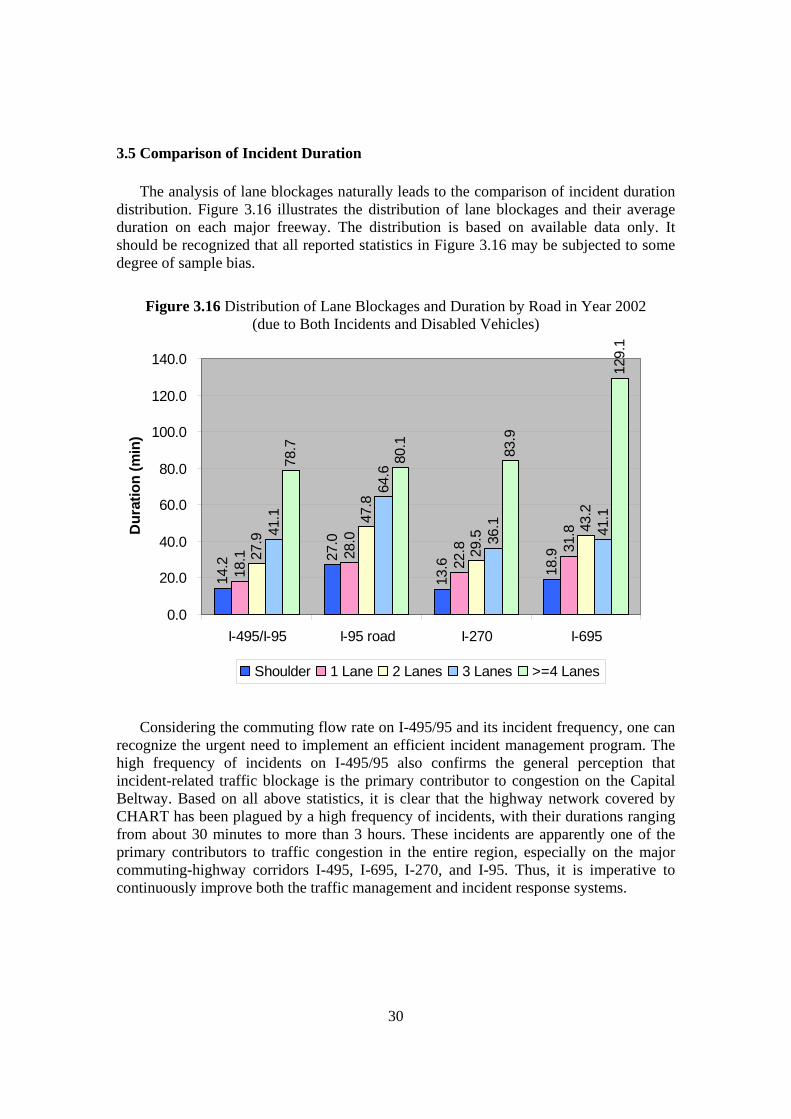
30
3.5 Comparison of Incident Duration
The analysis of lane blockages naturally leads to the comparison of incident duration distribution. Figure 3.16 illustrates the distribution of lane blockages and their average duration on each major freeway. The distribution is based on available data only. It should be recognized that all reported statistics in Figure 3.16 may be subjected to some degree of sample bias.
Figure 3.16 Distribution of Lane Blockages and Duration by Road in Year 2002
(due to Both Incidents and Disabled Vehicles)
14.2 27
.0
13.6 18
.9
18.1 28
.0
22.8 31
.8
27.9
47.8
29.5
43.2
41.1
64.6
36.1 41
.1
78.7
80.1 83.9
129.
10.0
20.0
40.0
60.0
80.0
100.0
120.0
140.0
I-495/I-95 I-95 road I-270 I-695
Dur
atio
n (m
in)
Shoulder 1 Lane 2 Lanes 3 Lanes >=4 Lanes
Considering the commuting flow rate on I-495/95 and its incident frequency, one can recognize the urgent need to implement an efficient incident management program. The high frequency of incidents on I-495/95 also confirms the general perception that incident-related traffic blockage is the primary contributor to congestion on the Capital Beltway. Based on all above statistics, it is clear that the highway network covered by CHART has been plagued by a high frequency of incidents, with their durations ranging from about 30 minutes to more than 3 hours. These incidents are apparently one of the primary contributors to traffic congestion in the entire region, especially on the major commuting-highway corridors I-495, I-695, I-270, and I-95. Thus, it is imperative to continuously improve both the traffic management and incident response systems.

31
3.6 Distribution of Incidents and Disabled Vehicles by Blockage Duration
This section presents the distribution of incidents by lane-blockage duration on the network covered by CHART. As shown in Figure 3.17, most disabled vehicles in the Chart II Database did not block traffic for more than half an hour. For instance, the number of disabled vehicles with duration shorter than 30 minutes was about 93%, while the number of incidents shorter than the same duration of 30 minutes was 65%.
Note that although most incurred incidents in Year 2002 were not severe, their impacts were so significant as to cause traffic blockage and congestion during peak hours. The clearance of such blockages generally did not require special equipment, and hence the resulting incident duration depended mainly upon the travel time of incident response units.
Figure 3.17 Distribution of Incidents/Disabled Vehicles by Duration in Year 2002
2531
648 365 334
6162
354 81 130
1000
2000
3000
4000
5000
6000
7000
<0.5 >=0.5 & <1 >=1 & <2 >=2
Duration (hour)
Freq
uenc
y
Incident Disabled Vehicle
Note: Only available data are counted.
Table 3.3 represents the distribution of total records in Year 2002 and its comparison with Year 2001 data. About 12% of reported incidents/disabled vehicles managed by TOC-3 had blocked traffic for more than 30 minutes and about 14% and 10% for TOC-4 and TOC-5, respectively, for the same type of emergency requests in Year 2002. For SOC, about 50% of reported incidents lasted more than one hour. Overall, about 17% of those responded to by CHART lasted more than 30 minutes in Year 2002.
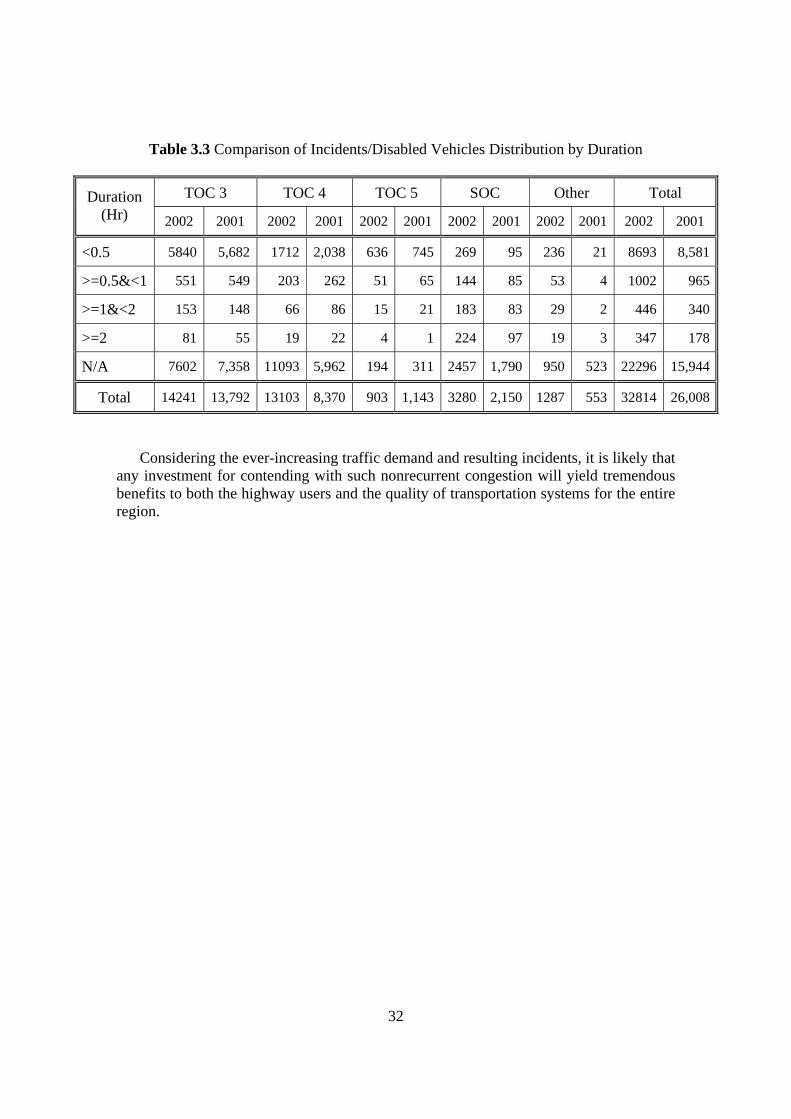
32
Table 3.3 Comparison of Incidents/Disabled Vehicles Distribution by Duration
TOC 3 TOC 4 TOC 5 SOC Other Total Duration (Hr) 2002 2001 2002 2001 2002 2001 2002 2001 2002 2001 2002 2001
<0.5 5840 5,682 1712 2,038 636 745 269 95 236 21 8693 8,581
>=0.5&<1 551 549 203 262 51 65 144 85 53 4 1002 965
>=1&<2 153 148 66 86 15 21 183 83 29 2 446 340
>=2 81 55 19 22 4 1 224 97 19 3 347 178
N/A 7602 7,358 11093 5,962 194 311 2457 1,790 950 523 22296 15,944
Total 14241 13,792 13103 8,370 903 1,143 3280 2,150 1287 553 32814 26,008
Considering the ever-increasing traffic demand and resulting incidents, it is likely that any investment for contending with such nonrecurrent congestion will yield tremendous benefits to both the highway users and the quality of transportation systems for the entire region.
33
CHAPTER 4: DETECTION EFFICIENCY AND EFFECTIVENESS
4.1 Evaluation of Detection Efficiency and Effectiveness
The evaluation of incident detection efficiency and effectiveness shall, in general, cover the following critical issues:
- The overall incident detection rate and false-alarm rate
- The average duration from the onset of an incident until the traffic control center has actually been informed
- The ratio between the total number of detected incidents and those being responded to immediately by the incident response team
- The distribution of incident detection sources
Since CHART has not implemented any automatic incident detection system, it naturally offers no information for evaluating the detection and false-alarm rates. The second issue, concerning how long it takes the traffic control center to receive an incident report from various sources after it has occurred, also cannot be assessed in this study. This is because the current incident management report, completed by operators in the traffic control center, does not contain such information. As such, the evaluation of detection efficiency and effectiveness can focus only on the incident response rate and distribution of detection sources.
4.2 Response Rate for Detected Incidents
Note that the response rate discussed in this chapter is defined as the ratio between the total numbers of traffic incidents reported to the CHART control center and those managed by the CHART/MSHA incident/disabled vehicle response teams. Based on the Year 2002 incident management record, this overall response rate was about 90% compared with the rate of 85% in Year 2001.
Similar to those in the previous year, existing incident reports available in CHART do not indicate the reasons for not responding to some incidents. It appears that most of such incidents were either incurred during very light traffic periods or were not so severe as to cause any significant traffic blockage or delay.
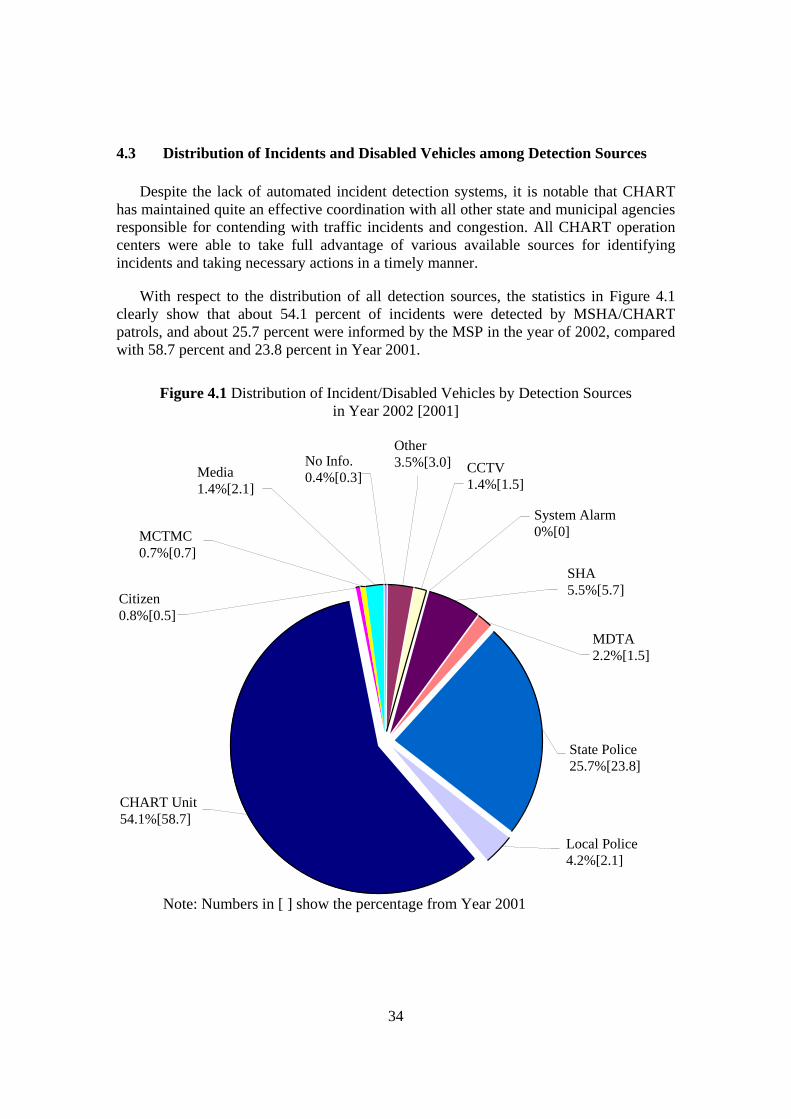
34
4.3 Distribution of Incidents and Disabled Vehicles among Detection Sources
Despite the lack of automated incident detection systems, it is notable that CHART has maintained quite an effective coordination with all other state and municipal agencies responsible for contending with traffic incidents and congestion. All CHART operation centers were able to take full advantage of various available sources for identifying incidents and taking necessary actions in a timely manner.
With respect to the distribution of all detection sources, the statistics in Figure 4.1 clearly show that about 54.1 percent of incidents were detected by MSHA/CHART patrols, and about 25.7 percent were informed by the MSP in the year of 2002, compared with 58.7 percent and 23.8 percent in Year 2001.
Figure 4.1 Distribution of Incident/Disabled Vehicles by Detection Sources
in Year 2002 [2001]
CHART Unit 54.1%[58.7]
Local Police 4.2%[2.1]
State Police 25.7%[23.8]
MDTA 2.2%[1.5]
MCTMC 0.7%[0.7]
Citizen 0.8%[0.5]
SHA 5.5%[5.7]
System Alarm 0%[0]
Media 1.4%[2.1]
Other 3.5%[3.0] No Info.
0.4%[0.3] CCTV 1.4%[1.5]
Note: Numbers in [ ] show the percentage from Year 2001
35
Although this may have reflected an effective interaction between state traffic and police departments, it may also raise some concerns about the detection efficiency due to potential human-factor issues. For instance, some significant delay may occur in the series of action chains, including the elapsed time for motorists to notice an incident and place the call, the processing time for the police department to confirm and forward the message, and time for the traffic control center to take necessary actions.
Assuming that every incident can be detected immediately and reported to the traffic control center, it is still not uncommon to see that the time duration from the beginning of an incident to the arrival of incident management units could be excessively long due to some potential human-factors-related delay in the entire response process. Thus, it would be desirable for CHART to have some reliable means, such as having an automated incident detection and dispatching system, that can minimize any potential operational delay in response to a reported incident. All other information, including police reports, can certainly be used as supplemental sources to further confirm or better understand the incident condition.
Figure 4.2 illustrates the distribution of detection sources for the Traffic Operation Center 3, and Figure 4.3 does that for TOC 4. Numbers in parentheses indicate the data for Year 2001. As presented in those figures, it is evident that MSHA patrols (Chart Unit) in Year 2002 took the primary role for detecting and responding to reported highway incidents/disabled vehicles.

36
Figure 4.2 Distribution of Incident/Disabled Vehicles by Detection Sources from TOC-3 in Year 2002 [2001]
CHART Unit 59.6%[60.4] Local Police
0.4%[0.6]
State Police 22.4%[22.9]
MDT 0.0%[0.0]
MCTMC 1.3%[1.1]
Citizen 0.4%[0.3]
SHA 4.4%[4.8]
System Alarm 0.0%[0.0]
Media 2.7%[3.6]
Other 6.5%[4.4]
No Info. 0.1%[0.2]
CCTV 1.9%[1.7]
Note: Numbers in [ ] show the percentage from Year 2001
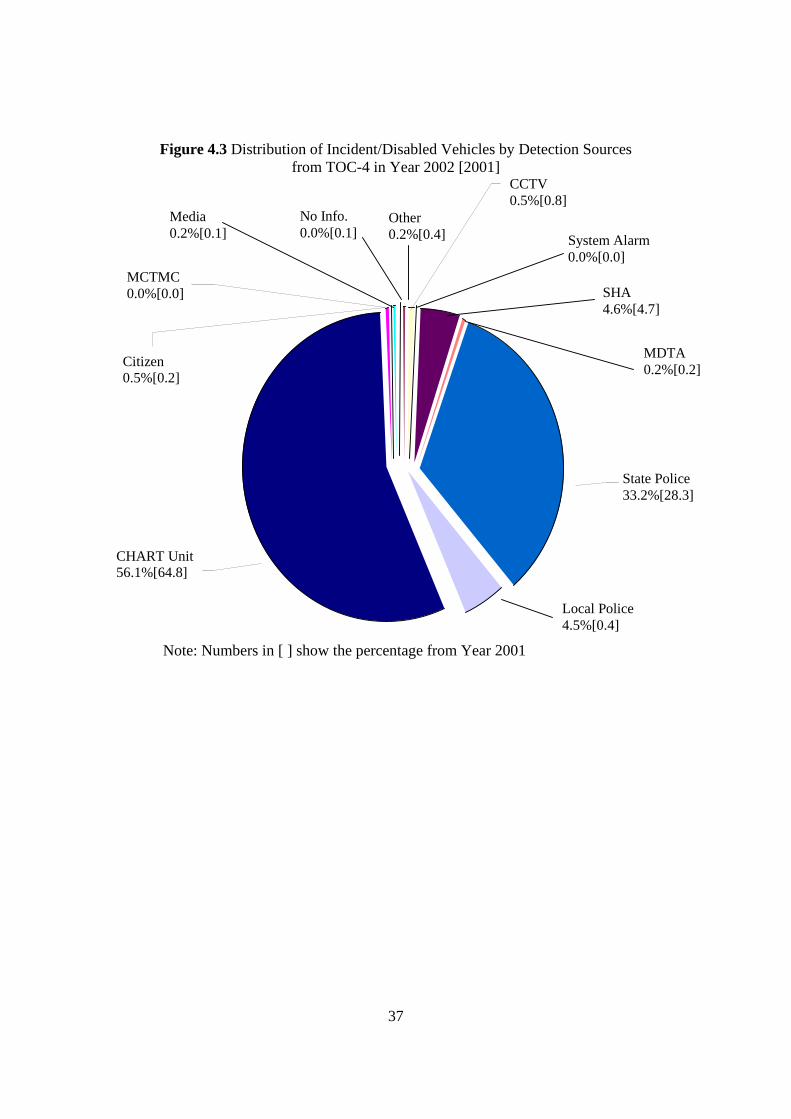
37
Figure 4.3 Distribution of Incident/Disabled Vehicles by Detection Sources from TOC-4 in Year 2002 [2001]
CHART Unit 56.1%[64.8]
Local Police 4.5%[0.4]
State Police 33.2%[28.3]
MDTA 0.2%[0.2]
MCTMC 0.0%[0.0]
Citizen 0.5%[0.2]
SHA 4.6%[4.7]
System Alarm 0.0%[0.0]
Media 0.2%[0.1]
Other 0.2%[0.4]
No Info. 0.0%[0.1]
CCTV 0.5%[0.8]
Note: Numbers in [ ] show the percentage from Year 2001

38
CHAPTER 5: EFFICIENCY OF RESPONSE AND MANAGEMENT
5.1 Analysis of Response Efficiency
To analyze the efficiency of incident management operated by CHART/MSHA, it is essential to focus on the following aspects:
- Travel Time – or how long it takes an incident response unit to reach the reported incident site after the control center has been informed via various detection sources
- Response Travel Distance – what is the average travel distance for incident response units to reach the identified incident site
- Clearance Time – how long it takes the incident response team to clear various types of incidents
- Reduction in incident duration – how many minutes of the incident blockage time has been reduced due to the operations of CHART/MSHA incident response units
Having information on all the above vital aspects will enable MSHA to have a clear picture of the efficiency at every stage of incident management and operations. For instance, the information on the average travel time will shed light on the effectiveness of interactions between the traffic control center and the offices responsible for dispatching incident response units. If the time between the arrival of response units and the incident report was found to be unexpectedly long, it would be an indication of having inadequate response units, or an operating process that may easily cause operators to incur delay in calling for dispatching operations.
The information on the first aspect, along with the data on the distribution of travel distance to incident sites, shall also enable MSHA to evaluate its routing strategies for emergency response units and to assess whether the current equipment is sufficient to respond to the increasing number of incidents during peak periods. One may consider placing some available incident response units along highway segments identified to have a high incident frequency at different times of a day so as to minimize the incident response time.
Since the current incident reports do not contain information on travel distance, the evaluation of management efficiency has focused mainly on the distribution of response times and incident duration. Note that the response time, as presented in Chapter 1, should be the time difference between the actual time the incident has occurred and the time the response vehicle arrives at the scene. Since it is difficult to know the actual time of the incident occurrence, the response time used in this study is based on the difference between the time the Response Center has received the call and the time the response unit

39
has arrived at the site of the incident. The average response times for incidents and disabled vehicles were computed to be about 13.60 minutes and 12.69 minutes in Year 2002, respectively, as shown in Table 5.1.
Table 5.1 The Average Response Time for Incidents/Disabled Vehicles in Year 2002
Records Type Incidents Disabled Vehicles Total
Average Response Time (min) 12.69 13.60 13.10
Number of Reports 6,431 5,302 11,733
The average response time for all types of incidents for Year 2002 is given in Figure 5.1. The average response time for all emergency operations by CHART in Year 2002 was 13.10 minutes, compared with 13.84 minutes in Year 2001.
Figure 5.1 The Overall Average Response Time
12.8
5
13.6
5
9.31
13.5
1
8.21
13.1
0
13.9
0
14.5
3
9.55
13.7
0
7.24
13.8
4
0.00
2.00
4.00
6.00
8.00
10.00
12.00
14.00
16.00
TOC3 TOC4 TOC5 SOC Other Average
Ave
rage
Res
pons
e Ti
me
(min
)
2002 2001
Note: 1) Data used here are those with response time >= 60 seconds and <= 1 hours, 2) The percentage shows the amount of data available
48%
36%
41%
41%
22%
16%
22%
60%
68%
23
%
36%
45%
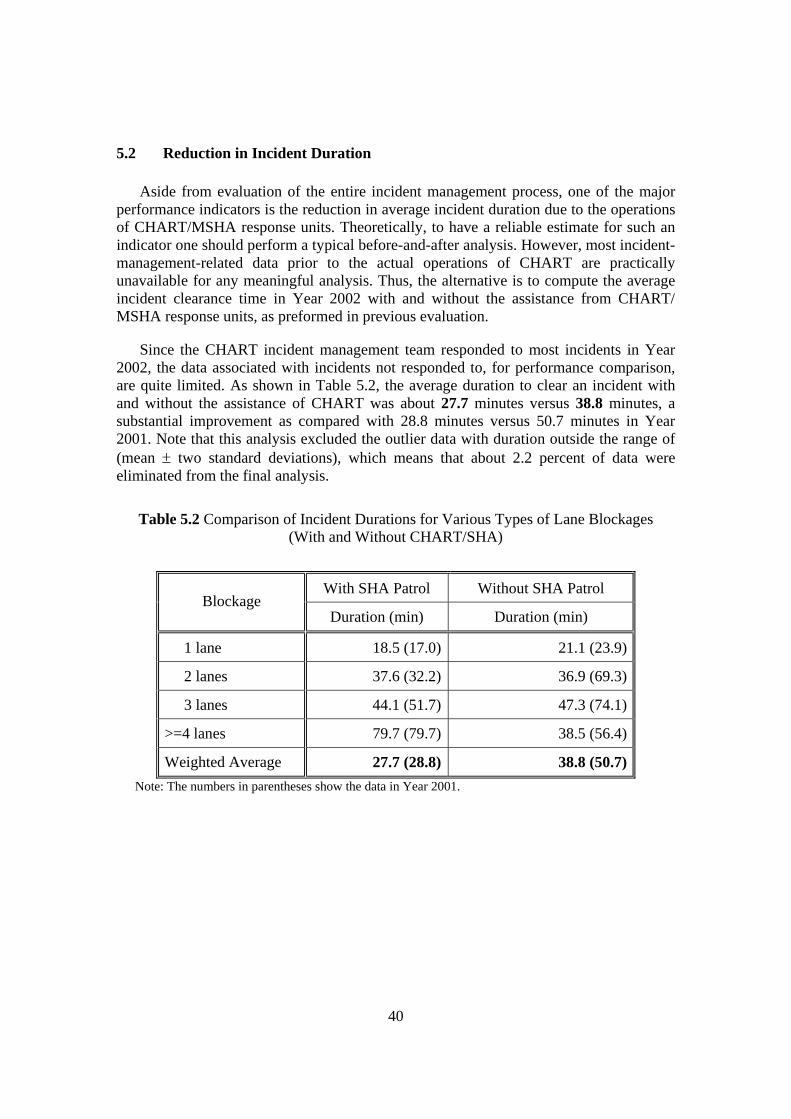
40
5.2 Reduction in Incident Duration
Aside from evaluation of the entire incident management process, one of the major performance indicators is the reduction in average incident duration due to the operations of CHART/MSHA response units. Theoretically, to have a reliable estimate for such an indicator one should perform a typical before-and-after analysis. However, most incident-management-related data prior to the actual operations of CHART are practically unavailable for any meaningful analysis. Thus, the alternative is to compute the average incident clearance time in Year 2002 with and without the assistance from CHART/ MSHA response units, as preformed in previous evaluation.
Since the CHART incident management team responded to most incidents in Year 2002, the data associated with incidents not responded to, for performance comparison, are quite limited. As shown in Table 5.2, the average duration to clear an incident with and without the assistance of CHART was about 27.7 minutes versus 38.8 minutes, a substantial improvement as compared with 28.8 minutes versus 50.7 minutes in Year 2001. Note that this analysis excluded the outlier data with duration outside the range of (mean ± two standard deviations), which means that about 2.2 percent of data were eliminated from the final analysis.
Table 5.2 Comparison of Incident Durations for Various Types of Lane Blockages
(With and Without CHART/SHA)
With SHA Patrol Without SHA Patrol Blockage
Duration (min) Duration (min)
1 lane 18.5 (17.0) 21.1 (23.9)
2 lanes 37.6 (32.2) 36.9 (69.3)
3 lanes 44.1 (51.7) 47.3 (74.1)
>=4 lanes 79.7 (79.7) 38.5 (56.4)
Weighted Average 27.7 (28.8) 38.8 (50.7) Note: The numbers in parentheses show the data in Year 2001.

41
Based on the results shown in Table 5.1, it seems that with the assistance of CHART/MSHA response units, the clearance duration was substantially reduced for all types of incidents, ranging from one-lane to multiple-lane closures. On average, CHART contributed to about a 29 percent reduction in its incident blockage duration in Year 2002, a slight decrease compared with the Year 2001 record, which was about 43 percent. Overall, the reduction in incident recovery time has certainly contributed to a significant savings on travel time, fuel consumption, and other related social-impact costs due to non-recurrent congestion.
In review of the above statistics, one can notice that the average incident duration for those without assistance from CHART/SHA has also been reduced significantly across most types of lane-blockage incidents. For instance, the average unresponded incident duration was 38.8 minutes in Year 2002, shorter than the average of 50.7 minutes in Year 2001. This seems to reflect the fact that efficient response to incidents so as to minimize nonrecurrent congestion and its impacts on the driving population has received increasing attention among all responsible agencies.
42
CHAPTER 6: BENEFITS FROM THE INCIDENT MANAGEMENT
BY CHART
6.1 Estimation of Benefits
Despite the well-recognized benefits from an efficient incident management system, most state highway agencies, including MSHA, are facing the pressing need to justify their system investment and operating costs, especially in view of the diminishing resources and the increasing demand for infrastructure renovation. Thus, quantifying the benefits from the operation of an incident management system is one of the essential tasks for CHART evaluation.
Because of the concern for ensuring the quality of analysis under the data limitations as well as resource constraints, the benefit assessment of CHART has always focused only on those either directly measurable or quantifiable from the incident reports. Such direct benefits, both to roadway users and to the entire community, are classified as follows:
- Assistance to drivers
- Reduction in secondary incidents
- Reduction in driver delay time
- Reduction in vehicle operating hours;
- Reduction in fuel consumption
- Reduction in emissions
Some other indirect impacts, such as improving the air quality, vitalizing the local economy, and increasing network mobility, are not included in the evaluation report.
6.2 Assistance to Drivers
Among all 32,814 incident reports available in the CHART Database, it has been found that there were a total of 19,062 incidents associated with requests from drivers for some types of assistance such as flat tire, shortage of gas, or mechanical problems, as shown in Figure 6.1. This number is higher than the 16,274 assistance requests from drivers in Year 2001. The utilization of the Chart II Database has resulted in a substantial reduction in unknown types of incident reports. Out of 19,062 assistance requests from drivers, a total of 4,567 were related to “out of gas” and “tire changes” of vehicles, compared with 4,138 cases in Year 2001.

43
Figure 6.1 Nature of Driver Assistance Requests in Year 2002 and Year 2001 2,
286
1,30
7 3,25
0
451
486 1,31
7
423
6,56
4
1,27
2
298 1,40
8
19,0
62
2,23
2
1,62
1
2,98
1
418
533
1,15
7
332
4,76
7
1,08
8
185 960
16,2
74
0
5,000
10,000
15,000
20,000
25,000A
band
oned
Veh
icle
Oth
er
Tire
Cha
nge
Hot
Sho
t
Wat
er
Gas
Dire
ctio
ns
Ow
nD
ispo
sitio
n
Cal
l for
Serv
ice
Rel
ayO
pera
tor
Gon
e on
Arriv
al
Nature
Freq
uenc
y
2002 2001
Note that according to CHART operators, its response teams actually responded to many more assistance requests from drivers than the documented 19,062 assists. However, most of those unreported driver assists did not need major effort or equipment from the response team, and thus were not always recorded.
Conceivably, the prompt response of CHART incident management units to such requests has not only been greatly appreciated by the general public, but has also contributed directly to minimizing the potential rubbernecking effects on the traffic, especially during peak hours, that could result in excessive delay. Thus, despite the difficulty in precisely quantifying the impacts of such assistance, it will undoubtedly be counted as one of the major direct benefits.
The overall distribution of assistance requests from drivers (named Disabled Vehicle in the Chart II Database) by nature in Years 2002 and 2001 can be seen in Figure 6.1. Among those, the distribution managed by TOC-3 and TOC-4 is illustrated in Figures 6.2 and 6.3, respectively.

44
Figure 6.2 Nature of Driver Assistance Requests for TOC-3
843
501 14
54
221
214 65
7
108
3186
610
107 444
8345
807
885 14
91
205
284 65
7
86
2928
609
67 474
8493
01,0002,0003,0004,0005,0006,0007,0008,0009,000
Aban
done
dVe
hicl
e
Oth
er
Tire
Cha
nge
Hot
Sho
t
Wat
er
Gas
Dire
ctio
ns
Ow
nD
ispo
sitio
n
Cal
l for
Serv
ice
Rel
ayO
pera
tor
Gon
e on
Arriv
al
Tota
l
Nature
Freq
uenc
y
2002 2001
Figure 6.3 Nature of Driver Assistance Requests for TOC-4
1034
500 15
03
165
212 558
274
2981
613
178 95
4
8972
1138
422 12
49
169
180
430
182
1590
452
112 48
4
6408
01,0002,0003,0004,0005,0006,0007,0008,0009,000
10,000
Aba
ndon
edV
ehic
le
Oth
er
Tire
Cha
nge
Hot
Sho
t
Wat
er
Gas
Dire
ctio
ns
Ow
nD
ispo
sitio
n
Cal
l for
Serv
ice
Rel
ayO
pera
tor
Gon
e on
Arri
val
Tota
l
Nature
Freq
uenc
y
2002 2001

45
6.3 Potential Reduction in Secondary Incidents
It has been well recognized that one major accident may incur a number of relatively minor secondary incidents due to a dramatic change in the traffic condition, such as the rapid spreading of queue length and a substantial drop in the traffic flow speed. The likelihood of having such incidents increases consistently with the incident duration and the congestion level. Thus, an efficient recovery of incident blockage may not only directly benefit drivers in the traffic queue, but also reduce potential incidents for incoming vehicles that may further deteriorate the traffic condition.
Note that there is no universal definition for “secondary incidents” in the transportation literature, unless the nature of incidents can be known directly from the field data. Grounded on the experience from our previous work, this study has adopted a definition for secondary incidents that accounts for incidents caused by rubbernecking effects in the opposite traffic direction:
- Incidents incurred within two hours from the onset of a primary incident and also within two miles downstream of the primary incident location; or
- Incidents incurred in the opposite direction that are within a half-hour from the onset of a primary incident and lie within a half-mile either downstream or upstream of the primary incident location.
For convenience of comparison, Figure 6.4 presents the distribution of secondary incidents under different definitions based on the Year 2002 Accident Database provided by the Maryland State Police Department. Notably, under the selected definition, there were 941 secondary incidents that occurred in Year 2002. As the frequency of secondary incidents reveals a clear positive correlation with the primary incident duration, it is conceivable that without implementing the incident management program the resulting number of secondary incidents would be significantly higher.

46
Figure 6.4 Distribution of Reported Secondary Incidents
480
582661
535
663758
592
741
852
646
815
941
334363390420
0
100
200
300
400
500
600
700
800
900
1000
0.5 hr 1 hr 1.5 hrs 2 hrsDuration After the Primary Incident (Hour)
Cum
ulat
ive
Num
ber o
f Sec
onda
ry
Inci
dent
s
For convenience but without loss of generality, one may assume such a correlation as linear in nature and estimate the potential reduction in the total secondary incidents due to CHART/MSHA response units as follows:
- Reported number of secondary incidents: 941
- The estimated number of secondary incidents without CHART/MSHA response units (that has resulted in a 28.6% reduction on the average incident duration): 941/(1-0.286) = 1,318
- The number of potentially reduced secondary incidents due to the operations of CHART: 1,318 – 941 = 377
Note that each of those 377 secondary incidents, if it actually occurs, may further prolong its primary incident duration and result in additional loss of travel time, additional fuel consumption, and more congestion on surface streets. Such impacts and accompanying benefits are not computed in this report, due to data limitations, but should be investigated in a future study.

47
6.4 Estimated Benefits due to Efficient Removal of Stationary Vehicles from Travel
Lanes
As have been commonly observed around incident sites, many drivers are forced to perform undesirable lane-changing maneuvers because of lane-blockages. Considering the fact that a large number of traffic accidents have happened from improper lane changes, it is likely that a prolonged incident operation may result in accidents. Thus, the operation of CHART/MSHA that has contributed to efficient removals of stationary vehicles in travel lanes may directly prevent some potential lane-changing-related accidents around incident sites. This study has attempted to explore such a benefit with limited available data. The research method and procedures are summarized below:
Scope of Analysis: Only those incidents taking place on I-495/95, I-95, I-270, I-695, I-70, I-83, MD-295, and US-50 during peak periods are included in the analysis.
Procedures:
• Performing field observations of lane-changing frequency, flow rate, speed, and density on a segment I-495/I-95 over both peak and off-peak periods
• Developing a statistical relation between the number of nonmandatory lane changes and traffic conditions
• Computing the ratio between the total number of lane-blockage-related incidents and the total number of lane changes over the given freeway segment estimated with the developed statistical models; for instance, the analysis result indicates that about 5,330 nonmandatory lane changes on I-495/95 will cause one accident
• Computing the number of lane changes for those incidents resulting in lane blockages, based on the incident duration, number of lanes being blocked, and the approximate traffic volume on those blocked lanes
• Estimating the potentially reduced accidents for each freeway, based on the estimated number of lane changes for each recorded incident and the ratio between an accident and the number of undesirable lane-changing maneuvers
An illustration of the estimation procedures is presented in Figure 6.5, and the estimated results for those target freeways are reported in Table 6.1. Note that this estimation has focused only on the peak period, as the relation between lane-changing maneuvers and accidents during the off-peak hours is found to be statistically uncorrelated in our limited data set.

48
Figure 6.5 Flow Chart of the Procedures for Approximating the Potentially Reduced Lane-Changing-Related Accidents due to Operations of CHART
No. and type of
blockagesper peak-hours
per day
Number of potential incidentsreduced by CHART operations
due to effective removals ofvehicles in a travel lane
No. of lanechanges withinthe peak period
Number of lanechanges at anincident scene
Blockageduration
with & w/outCHART
Dailypeak-volumes
Lengthof a segment
No. ofincidentsduring the
peak period
Lane changes toIncident Ratio
Table 6.1 Reduction of Potentially Incidents due to CHART Operations
Road Name I-495/ I-95 I-95 I-270 I-695 I-70 I-83 MD-
295 US-50 Total
Year 2001 107 105 10 71 12 10 5 23 343
Year 2000 174 79 13 65 2 10 7 20 379
6.5 Direct Benefits to Highway Users
As reported in previous CHART evaluation studies, the computation of additional delays and fuel consumption due to CHART operations is performed with the following models:
1.784.18.219.10 Duration)Incident ()LanesofNo.Total
Blocked Lane of No.()umeTrafficVol(eDelay ×××=∆ −
1.699.027.277.10 Duration)Incident ()LanesofNo.Total
Blocked Lane of No.()umeTrafficVol(eFuel ×××=∆ −
where ∆Delay is excessive delay due to incidents and ∆Fuel is additional fuel consumption due to incidents.
Prior to the use of above equations, all roads covered by CHART were divided into homogenous segments based on geometry (number of lanes) and volume (peak-hour).
Number of Potential Incidents

49
The overall computation results indicate that all incidents that occurred in Year 2002 may result in a total of 135.23 million veh-hr delays without CHART/MSHA operations. In contrast, due to the efficient response and management of CHART, the total vehicle delay has been reduced to 105.25 million hours, about 29.98 million hours less than without the assistance of CHART/MSHA.
Figure 6.6 Reduction in Delays due to CHART/MSHA Operations
Million Veh - Hrs
Reduction in delay due to CHART = 29.98 (25.80) million veh-hrs
Total delay if without CHART
Total delay with CHART (59.73)
0
Million Veh - Hrs
Total delay if without CHART
Total delay with CHART
135.23 (85.53)
105.25
0
Numbers in parentheses show 2001 result
Overall, the total benefits in term of reduction in total delay time and fuel consumption, based on the same parameters used in Year 2001, for convenience of comparison can be summarized as follows:
- Total delay savings: 29.98 million hours = $ 429.87 million ($14.34/hour)
- Total fuel consumption reduction: 5.06 million gallons = $ 5.06 million ($1/gal.)
6.6 Emission Reduction Benefits
The estimated reductions in vehicle emissions were based on the following parameters provided by MDOT (which have been used for air pollution evaluation in both the Baltimore and Washington D.C. areas) and the total delay reduction of 29.98 million vehicle hours due to CHART/MSHA operations:
HC: 391.89 tons (13.073 grams per hour of delay);
CO: 4402 tons (146.831 grams per hour of delay);
NO: 187.69 tons (6.261 grams per hour of delay).

50
Using the cost parameter of $6,700/ton for HC, $6,360/ton for CO, and $12,875/ton for NO (Patrick, 1998), the above reduction in emission has resulted in a total savings of 33.04 million dollars.
Thus, as shown in Table 6.2, the operation of CHART/MSHA in Year 2002 has generated a total benefit of 467.97 million dollars (= $429.87 M + $5.06 M + $33.04 M), higher than the benefit of 402.75 million dollars in Year 2001.
Table 6.2 Total Direct Benefits to Highway Users in Year 2002
Reduction due to
CHART Amount Unit rate in dollar (million)
Delay (million veh-hrs)
29.98 (25.80) $14.34/hour 429.87
(369.97) Fuel consumption (million gallons)
5.06 (4.35) $1/gal. 5.06
(4.35) HC 391.89 (337.3) $6,700/ton CO 4,402 (3,788) $6360/ton Emissions
(million tons) NO 187.69 (161.5) $12,875/ton
33.04 (28.43)
Total (million dollars) $ 467.97 (402.75) Note: The numbers in parentheses show the result in Year 2001
In addition to the above total benefits, this study has further computed the reduction in delay emissions in the Baltimore and Washington regions due to CHART/MSHA operations. The results are summarized in Table 6.3. As shown in that table, the delay reduction for the Washington region in Year 2002 was 71,700 hours/day compared with 65,640 in Year 2001; the delay reduction for the Baltimore region has increased when comparing with previous year (43,597 vs. 33,590). The reduction in emissions for the Washington region was 78,589 dollars/day compared with $72,180 in the previous year. For the Baltimore region, the emissions reduction was 48,474 dollars/day in Year 2002 compared to $37,180 in Year 2001.
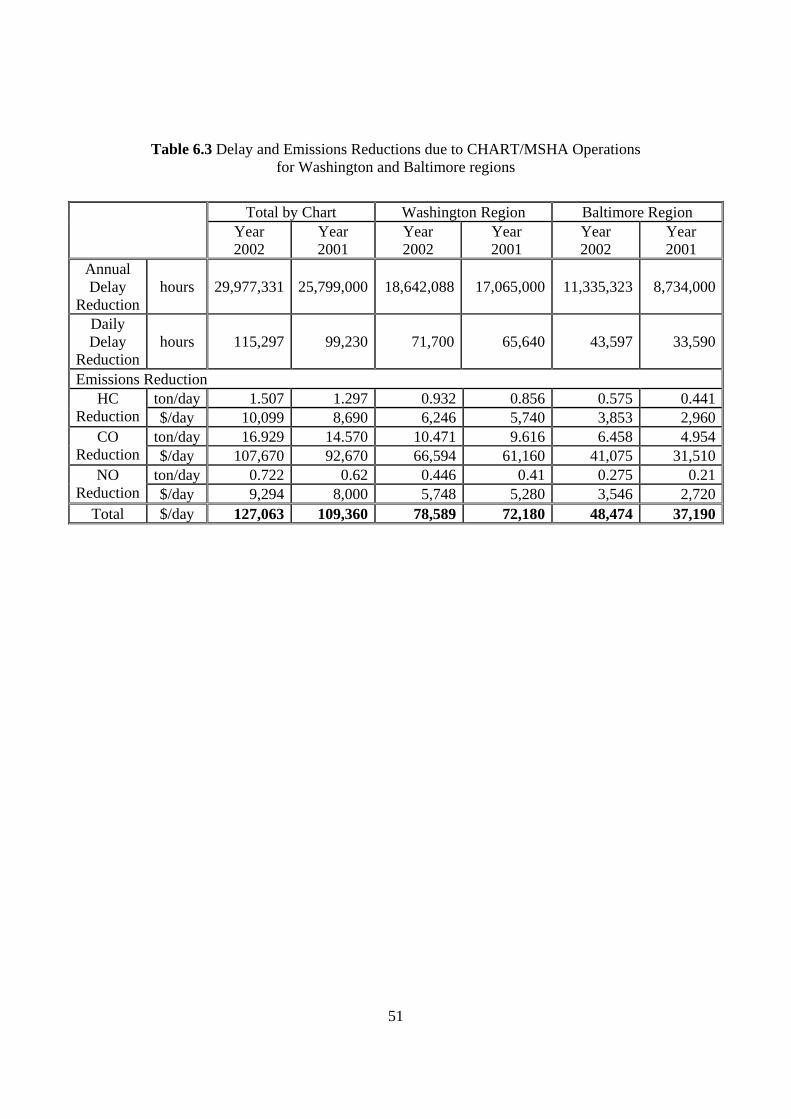
51
Table 6.3 Delay and Emissions Reductions due to CHART/MSHA Operations for Washington and Baltimore regions
Total by Chart Washington Region Baltimore Region
Year 2002
Year 2001
Year 2002
Year 2001
Year 2002
Year 2001
Annual Delay
Reduction hours 29,977,331 25,799,000 18,642,088 17,065,000 11,335,323 8,734,000
Daily Delay
Reduction hours 115,297 99,230 71,700 65,640 43,597 33,590
Emissions Reduction ton/day 1.507 1.297 0.932 0.856 0.575 0.441HC
Reduction $/day 10,099 8,690 6,246 5,740 3,853 2,960ton/day 16.929 14.570 10.471 9.616 6.458 4.954CO
Reduction $/day 107,670 92,670 66,594 61,160 41,075 31,510ton/day 0.722 0.62 0.446 0.41 0.275 0.21NO
Reduction $/day 9,294 8,000 5,748 5,280 3,546 2,720Total $/day 127,063 109,360 78,589 72,180 48,474 37,190
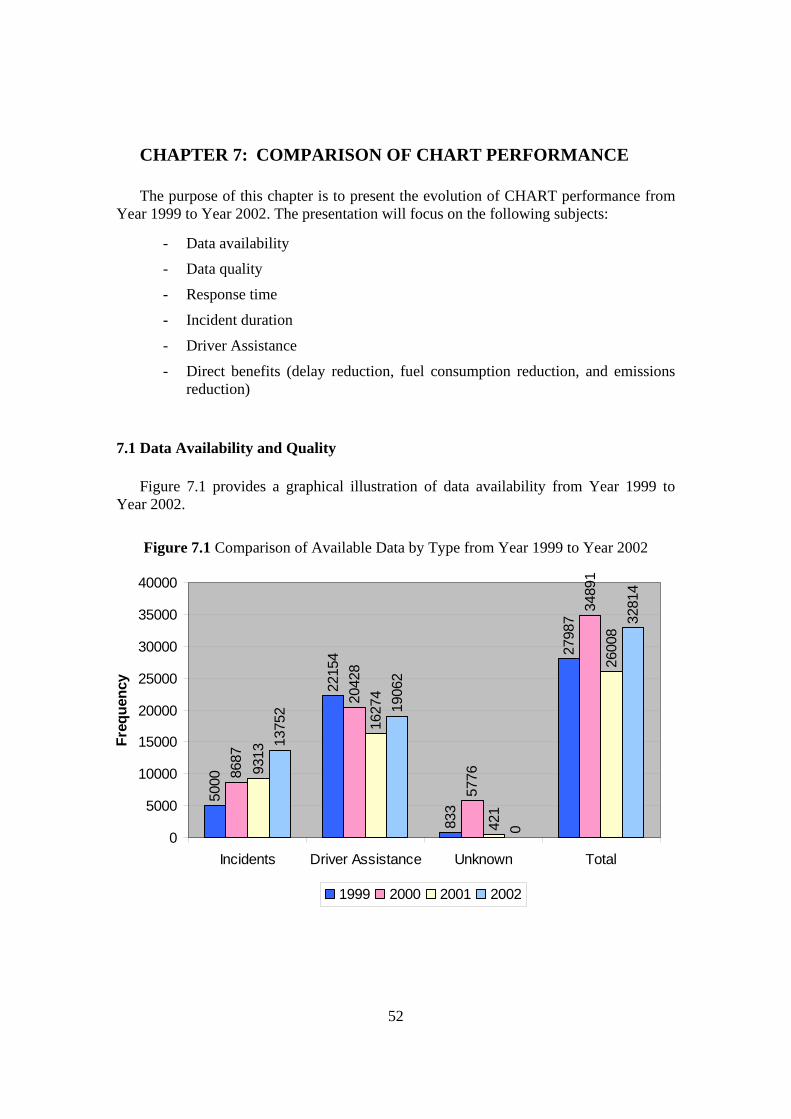
52
CHAPTER 7: COMPARISON OF CHART PERFORMANCE
The purpose of this chapter is to present the evolution of CHART performance from Year 1999 to Year 2002. The presentation will focus on the following subjects:
- Data availability
- Data quality
- Response time
- Incident duration
- Driver Assistance
- Direct benefits (delay reduction, fuel consumption reduction, and emissions reduction)
7.1 Data Availability and Quality
Figure 7.1 provides a graphical illustration of data availability from Year 1999 to Year 2002.
Figure 7.1 Comparison of Available Data by Type from Year 1999 to Year 2002
5000
2215
4
833
2798
7
8687
2042
8
5776
3489
1
9313
1627
4
421
2600
8
1375
2 1906
2
0
3281
4
0
5000
10000
15000
20000
25000
30000
35000
40000
Incidents Driver Assistance Unknown Total
Freq
uenc
y
1999 2000 2001 2002

53
Overall, the number of incidents data available for analysis seems to increase over time, while the number of driver assists exhibits a decreasing trend. On average, CHART responded to more than 30,000 requests of driver assistance from Year 1999 to Year 2002.
Figure 7.2 and Figure 7.3 illustrate the data quality with respect to all critical parameters used in the CHART performance evaluation from Year 1999 to Year 2002. These critical parameters include detection source, type of incidents, nature, lane blockage, location, received time, confirmed time, dispatched time, arrival time, cleared time, and event closed time.
Figure 7.2 Comparison of Data Quality
92.3 96
.8
28.5
69.7
20.2
78.587
.4
81.8
49.6
88.1
33.2
94.397.0
98.4
84.0
70.8
99.9
96.1
100.
0
90.9
59.4
100.
0
N/A
N/A
0.010.020.030.040.050.060.070.080.090.0
100.0
DetectionSource
Type ofIncident
Nature Road Name LaneBlockage
Location
Perc
enta
ge
1999 2000 2001 2002
Note that in Year 2002, all emergency response reports were from the CHART-II Database. Among these key parameters, the road name parameter is not available in the current CHART-II database. Thus, one needs to manually search the road name associated with each location parameter and input it in the database. The quality of all other critical parameters in the available reports has shown a steady improvement over time.

54
Figure 7.3 Comparison of Data Quality − Time Parameters
37.7
10.3
42.4
82.9
9.3
26.4
65.4
99
53.9
30.4 39
.2
100
57.9
49.1
32.1
N/A
N/A
N/A
66.9
79.9
0102030405060708090
100
ReceivedTime
ConfirmedTime
DispatchedTime
Arrival Time Cleared Time
Perc
enta
ge
1999 2000 2001 2002
The most critical time parameters are received time, arrival time, and cleared time, as those are essential for computing the response time and incident duration. As shown in Figure 7.3, the percentages of data with well-documented received time and arrival time have increased over time; but the cleared time has decreased in Year 2001 and Year 2002, due likely to the introduction of “event closed time.”
7.2 CHART Performance
This section summarizes the statistics associated with the response time for each operations center, the incident duration with and without SHA patrol by lane blockage type, the driver assistance, and the direct benefits to highway users.

55
Response Time
Figure 7.4 presents the average response time for all emergency operations centers from Year 1999 to Year 2002.
Figure 7.4 Comparison of Average Response Time by Emergency Operations Centers
16.9
5 17
16.9
5
14.9
6
15.4
3
19.1
4
15.2
2
13.9
14.5
3
13.7
13.8
4
12.8
5
13.6
5
13.5
1
13.1
N/A
02468
101214161820
TOC3 TOC4 SOC Average
Res
pons
e Ti
me
(min
)
1999 2000 2001 2002
Overall, the average response times for all operations centers have reduced steadily since Year 2000. For instance, the average response time of TOC-3 has gone from 16.95 minutes in Year 1999 to 12.85 minutes in Year 2002.

56
Incident Duration
Figure 7.5 illustrates the average incident duration with and without SHA patrol participation from Year 1997 to Year 2002. Figure 7.6 summarizes the comparison of incident duration for one-lane blockage with and without SHA patrol participation. As shown in Figures 7.5 and 7.6, the average incident duration either with or without CHART has been reduced significantly over the past five years, indicating that all agencies involved in incident response and operations have substantially improved their efficiency.
Figure 7.5 Comparison of Average Incident Duration with and without SHA Patrol
42
93
33
77
29
51
27.7 38
.80
102030405060708090
100
with SHA Patrol without SHA Patrol
Inci
dent
Dur
atio
n (m
in)
1999 2000 2001 2002
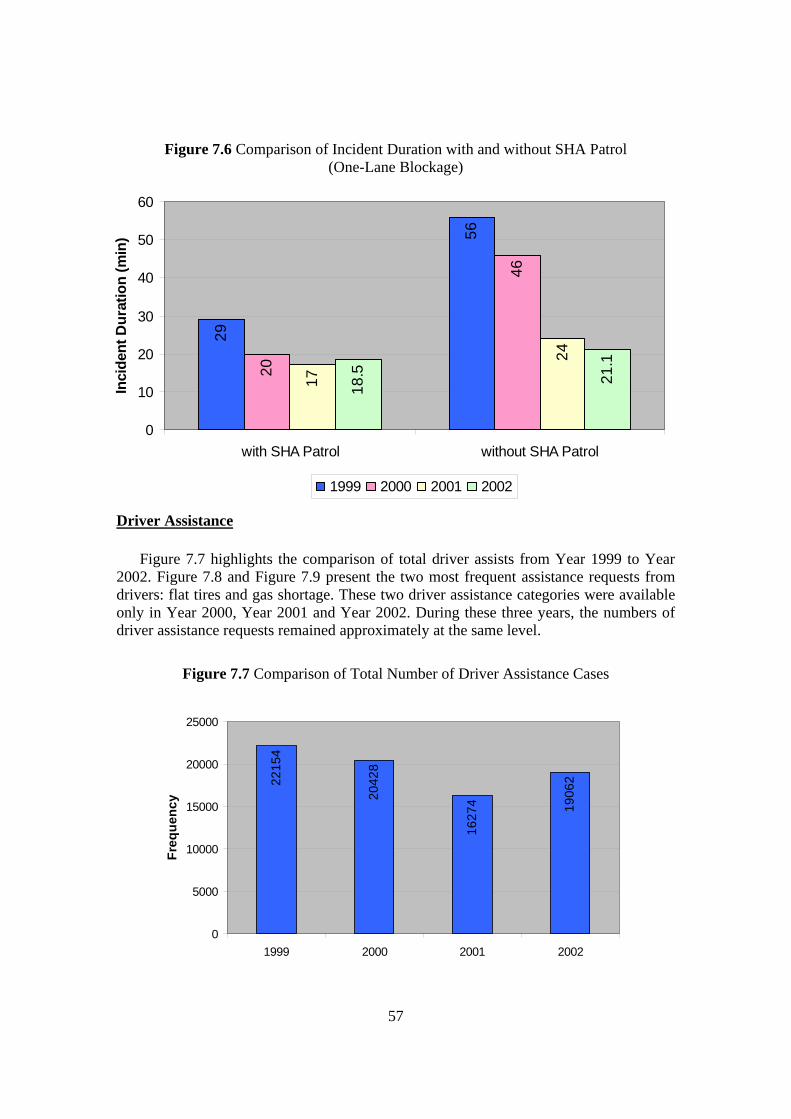
57
Figure 7.6 Comparison of Incident Duration with and without SHA Patrol (One-Lane Blockage)
29
56
20
46
17
24
18.5 21
.1
0
10
20
30
40
50
60
with SHA Patrol without SHA Patrol
Inci
dent
Dur
atio
n (m
in)
1999 2000 2001 2002
Driver Assistance
Figure 7.7 highlights the comparison of total driver assists from Year 1999 to Year 2002. Figure 7.8 and Figure 7.9 present the two most frequent assistance requests from drivers: flat tires and gas shortage. These two driver assistance categories were available only in Year 2000, Year 2001 and Year 2002. During these three years, the numbers of driver assistance requests remained approximately at the same level.
Figure 7.7 Comparison of Total Number of Driver Assistance Cases
2215
4
2042
8
1627
4 1906
2
0
5000
10000
15000
20000
25000
1999 2000 2001 2002
Freq
uenc
y

58
Figure 7.8 Comparison of Driver Assistance − Flat Tires
2979
2981 32
50
N/A
0
500
1000
1500
2000
2500
3000
3500
1999 2000 2001 2002
Freq
uenc
y
Figure 7.9 Comparison of Driver Assistance − Gas Shortage
1252
1157
1317
N/A
0
200
400
600
800
1000
1200
1400
1999 2000 2001 2002
Freq
uenc
y
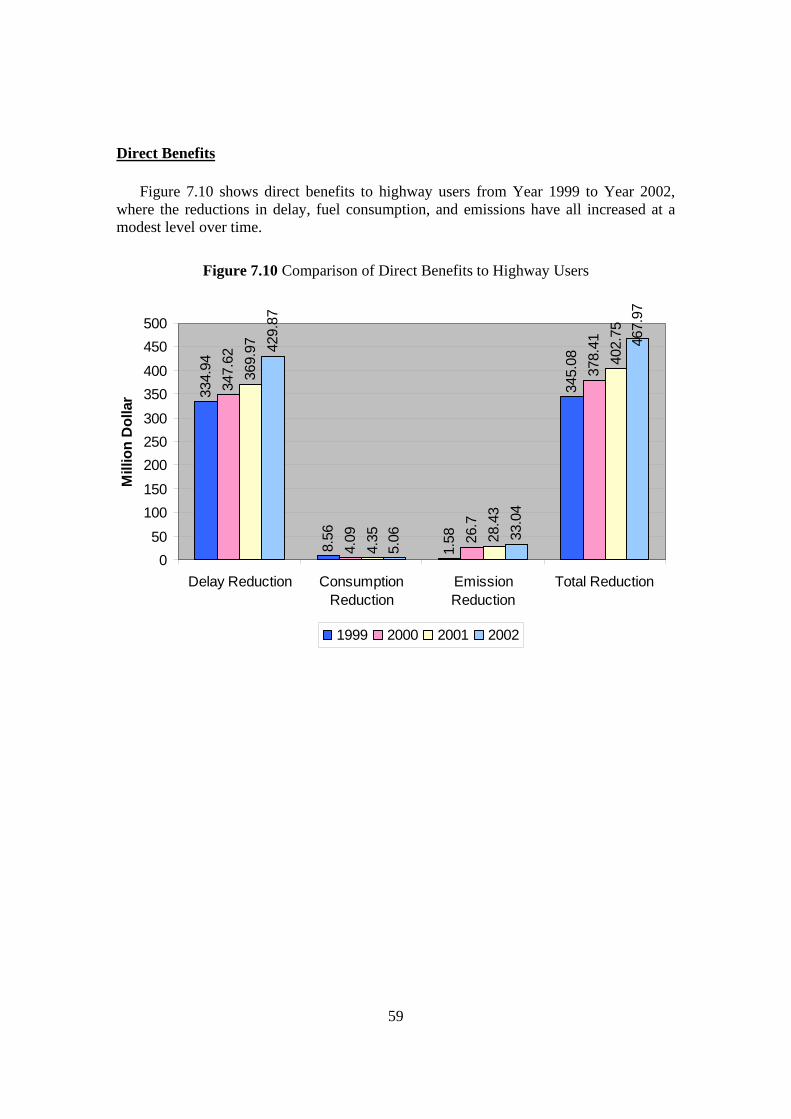
59
Direct Benefits
Figure 7.10 shows direct benefits to highway users from Year 1999 to Year 2002, where the reductions in delay, fuel consumption, and emissions have all increased at a modest level over time.
Figure 7.10 Comparison of Direct Benefits to Highway Users
334.
94
8.56
1.58
345.
08
347.
62
4.09 26
.7
378.
41
369.
97
4.35 28
.43
402.
75
429.
87
5.06 33
.04
467.
97
050
100150
200250300
350400
450500
Delay Reduction ConsumptionReduction
EmissionReduction
Total Reduction
Mill
ion
Dol
lar
1999 2000 2001 2002
60
CHAPTER 8: CONCLUSIONS AND RECOMMENDATIONS
8.1 Conclusions
Based on our previous research results and experience, this study has performed a rigorous evaluation of CHART’s performance in the year 2002, and has computed the resulting benefits due to its operations under the constraints of the availability and quality of the data. In response to the availability of the CHART-II system, the study has expanded its research scope to include a comprehensive data quality evaluation, intending to provide the basis for further enhancement of the CHART-II Database.
Overall, CHART has made significant progress in both recording and quality improvement of the data, especially after the use of the CHAR-II Database, although much remains to be improved to reliably account for all associated benefits.
CHART’s efficiency in responding to and managing incidents has also been improved substantially. For instance, the average response time has been reduced from 13.84 minutes in the year 2001 to 13.10 minutes in the year 2002, and the average incident duration has also been shortened from 29 minutes to 28 minutes over the same period. The total benefits due to CHART operations have also increased from $400 million in Year 2001 to around $460 million in Year of 2002.
In summary, the operations of CHART by MSHA in the year 2002 have yielded significant benefits in the following areas:
- Assistance to drivers’ service requests;
- Reduction in the trip delay time;
- Reduction in the fuel consumption cost; and
- Reduction in emissions.
More indirect benefits could be estimated provided that essential data regarding traffic conditions before and after incidents were collected during each operation. Such benefits include
- All impacts associated with secondary incidents;
- Potential impacts on neighboring surface streets during incidents; and
- Reduction in the overall stress to drivers in major commuting corridors
The aforementioned benefits, along with ever-increasing congestion and incidents, certainly justify the need to better manage and continuously upgrade the current incident response program. However, “an efficient incident response” cannot alone effectively reduce the number of primary highway incidents. Considering the current volume level on major commuting highways, it is undoubtedly true that commuters, even under an efficient incident response system, remain likely to face a long delay for any encountered

61
incident. Thus, taking “preventive measures” to minimize the likelihood of having incidents should be viewed, at least, as necessary as implementing an incident management program. An in-depth analysis of the nature of incidents and their spatial distribution has offered some insight into developing safety-improvement measures.
8.2 Recommendations and Further Development
The primary recommendations based on the performance of CHART in Year 2002 are summarized below:
- Evaluating the performance of incident response and management, including both recording quality at a monthly or quarterly basis so that all critical evaluation results can be fed back to responsible CHART stuff in a timely manner.
- Including the benefits of delay and fuel consumption due to a potential reduction in decrease in secondary incidents in CHART 2003 evaluation.
- Efficiently integrating CHART incident response database with police accident data so as to have a complete picture of statewide incident record.
- Training operators to effectively record all essential operations-related data such as cleared time (only 32.1% available in Year 2002 database).
- Improving the data structure used in the CHART-II system for recording the incident location as the information item with the current narrative text format requires laborious manual search and input of associated highway segments.
- Developing an integrated performance database that consists not only of incident reports but of all data, such as traffic volume, needed for direct benefit computation or estimation of safety-related contribution, including potential reduction in secondary incidents and lane-changing-related accidents due to a quick removal of stationary vehicles or some debris on highway travel lanes.
- Improving the use of freeway service patrols and dynamically assigning their locations based on both the spatial distribution of incidents along freeway segments and the probability of having incidents at different times of a day so that the average response time can be reduced as expected.
62
References
1. Amos, G., Shakas, C., and Avery, M., “Incident management systems – lessons
learned,” the 2nd World Cogress of ITS, Yokohama, 1995.
2. Carson, J. L., Legg, B., Mannering, F. L., Nam, D., and Nee, J., “Area incident
management programs effective? Findings from Washington State,” TRB, 78th annual
meeting, 1999.
3. Chang, G. L., and Point-du-Jour, J. Y., Performance evaluation of CHART – the real
time incident management system in Year 2000, final report, March 2002.
4. Chang, G. L., and Point-du-Jour, J. Y., Performance evaluation of CHART, incident
management program in 1999, final report, July 2001.
5. Chang, G. L., and Point-du-Jour, J. Y., Performance and benefit evaluation for
CHART, incident management program in 1997, final report, September 2000.
6. Chang, G. L., and Point-du-Jour, J. Y., Performance and benefit evaluation for
CHART, incident management program in 1996, final report, September 1998.
7. CHART incident response evaluation report by COMSIS, 1996.
8. Cuciti, P., and Janson, B., Courtesy patrol pilot program, final Report, Colorado
Department of Transportation, 1993.
9. DeCorla-Souza, P., Cohen, H., Haling, D., and Hunt, J., “Using STEAM for benefit-
cost analysis of transportation alternatives,” Transportation Research Record 1649,
1998.
10. DeCorla-Souza, P., Gardener, B., Culp, M., Everett, J., Ngo, C., and Hunt, J.,
“Estimating costs and benefits of transportation corridor alternatives,” Transportation
Research Record 1606, 1997.
11. Fenno, D., W., and Ogden, M., A., “Freeway service patrols, a state of the practice,”
Transportation Research Record 1634, 1998.
63
12. Gillen, D., & Li, J., Evaluation methodologies for ITS applications, California PATH.
University of California, Institute of Transportation Studies, Berkley, CA, 1999.
13. Gillen, D., Li, J., Dahlgren, J., and Chang, E., Assessing the benefits and costs of ITS
projects: volume 1. methodology, California PATH, University of California, Institute
of Transportation Studies, Berkley, CA, March, 1999.
14. Incident reports for 1997 from statewide operation center, Traffic Operation Center 3
and 4, State Highway Administration, Maryland.
15. ITS benefits database, US Department of Transportation, September 30, 2001.
16. Karimi, A., and Gupta, A., “Incident management system for santa monica smart
corridor,” ITE 1993 Compendium of Technical Papers.
17. Maryland State Police Accident Report in 1997.
18. Maryland Wages by Occupation, Department of Business and Economic
Development, Maryland.
19. Meyer, M., “A toolbox for alleviating traffic congestion and enhancing mobility,”
ITE, 1996.
20. Meyer, M., and Miller, E., Urban transportation planning: a decision oriented
approach, 2nd edition, International Edition 2001, McGraw-Hill, 2001.
21. Rossi, P.H., and Freeman, H.E. Evaluation: a systematic approach, 5th edition, Sage
Publications, Inc., Newbury Park, California, 1993.
22. Skabardonis, A., Petty, K., Noeimi, H., Rydzewski, D., and Varaiy, P. P., “I-880 field
experiment: database development and incident delay estimation procedures”,
Transportation Research Record 1554, 1996.
23. “Evaluating safety and health impacts, TDM impacts on road safety, Personal
security and public health,” TDM Encyclopedia. http://www.vtpi.org/tdm/tdm58.htm