of California, San Diego La Jolla, California 92093-0085 University of California, San Diego...
50
. . . . . . . . . . .. .. ······· ······ .. ········ Report No. SSRP- 96/01 February 1996 . . .. ·· . . . . . . . STRUCTURAL SYSTEMS RESEARCH PROJECT STRUCTlTRAL RESPONSE ASSESSMENT OF SOIL NAIL WALL FACINGS Executive Summary of Experimental and Analytical Investigations by F. Seible Final Report to CH2M Hill Denver, CO, and the Federal Highway Administration under Demonstration Project DP-103. Division of Structural Engineering University of California, San Diego La Jolla, California 92093-0085
Transcript of of California, San Diego La Jolla, California 92093-0085 University of California, San Diego...

middotmiddotmiddotmiddotmiddotmiddotmiddot middotmiddotmiddotmiddotmiddotmiddot middotmiddotmiddotmiddotmiddotmiddotmiddotmiddot
Report No
SSRP- 9601
February 1996
middotmiddot
STRUCTURAL SYSTEMS
RESEARCH PROJECT
STRUCTlTRAL RESPONSE ASSESSMENT OF SOIL NAIL WALL FACINGS
Executive Summary of Experimental and
Analytical Investigations
by
F Seible
Final Report to CH2M Hill Denver CO and the Federal Highway
Administration under Demonstration Project DP-103
Division of Structural Engineering
University of California San Diego
La Jolla California 92093-0085
University of California San Diego
Division of Structural Engineering
Structural Systems Research Project
Report No SSRP-9601
STRUCTURAL RESPONSE ASSESSMENT OF SOIL NAIL
WALL FACINGS
Executive Summary of Experimental and
Analytical Investigations
by
Frieder Seible PhD PE
Professor and Chair Division of Structural Engineering
Final Report to CH2M Hill Denver CO and
the Federal Highway Administration
under Demonstration Project DP-103
Division of Structural Engineering
University of California San Diego
La Jolla California 92093-0085
February 1996
TABLE OF CONTENTS
DISOAIMER ii
ABSTRACf ili
1 rnTRODUCTION 1
2 THE EXPERIMENTAL TEST PROGRAM 3
21 Single Nail Facing Panel Tests 3
22 Nine Nail Facing Panel Test 11
3 THE ANALYTICAL INVESTIGATIONS 21
31 Analytical Model Development 21
32 Analytical Parameter Studies 28
33 Analytical Case Studies 30
4 SUMMARY ANDCONCLUSIONS 42
REFERENCES 43
ACKNOWLEDGMENTS 44
DISCLAIMER
Any opinions findings conclusions or recommendations in this report are those of the author
and do not necessarily reflect the views of CH2M Hill or the Federal Highway Administration
ll
ABSTRACT
In support of the development of rational design models and guidelines for soil nail wall
facings the overall response behavior of soil nail wall facing panels under increasing nail load
andor nail head displacements was investigated to determine the behavior limit states that form the
basis for LRFD and service design criteria The experimental investigations conducted at the
Charles Lee Powell Structural Research Laboratories at the University of California San Diego
consisted of six full-scale single nail facing panelsoil structure interaction tests and one large scale
nine nail facing panelsoil structure interaction test The experimental test results were used to
calibrate and validate a nonlinear analysis model which allowed the investigation of nonlinear
facing panel material response with full soil structure interaction
The validated analytical model was subsequently used for extensive parameter studies on
temporary and permanent facing panels investigating the influence of variations in soil reaction
properties facing panel material characteristics facing panel dimensions and nail head spacing
and anchor plate dimensions
The loaddeformation response for temporary soil middotnail wall facing panels was found to be
ductile in nature even when punching shear failure modes occurred due to the soil reaction under
the nail head and membrane action provided by the facing panel reinforcement in the nail head
vicinity Only the overlaid permanent facing panel did not show signs of imminent failure due to
internal delamination and punching failure not visible on the facing panel surface
The analytical parameter studies showed that the nail load or facing capacity was most
influenced by the facing panel thickness the bearing plate size and the soil stiffness assumptions
whereas reinforcement ratios and soil nail spacings primarily affected the deformation states which
can be directly attributed to the highly coupled soil structure interaction effects
ill
1 INTRODUCTION
The Federal Highway Administration demonstration project DP-103 [1] had the objective to
develop consistent and rational design procedures for temporary and permanent soil nail walls and
soil nail wall facings see Figs 1 and 2 Temporary soil nail wall facings typically consist of thin
shotcrete panels reinforced at the nominal panel mid-depth with welded wire fabric and waler bars
see Fig 2 whereas permanent soil nail wall facing panels are typically cast-in-place in front of a
temporary wall see Fig 1 with uniformly spaced mild reinforcement and headed stud anchors at
the nail head plates see Figs 1 and 2 However thicker permanent shotcrete facing panels for
soil nail walls have been contemplated and used in some applications
In any case comprehensive design models for soil nail walls based on limit state design
principles (LRFD or Service Limit States) require that the behavior limit states of all of the systems
components namely (1) the soil (2) the nail (3) the nail head and (4) the facing panel are known
to develop overall consistent and reliable design criteria and concepts In order to assess the
behavior limit states of the nail head and facing panel for a large range of realistic geometric and
mechanical parameter variations a nonlinear analysis model was developed [2 3] which allowed
in particular the study of various soil reaction assumptions and their complex interaction with the
nonlinear material response of the soil nail wall facing panel in the form of cracking and crushing
of the concrete as well as yielding of the reinforcing steel
Prior to broad based parameter studies of the soil structure interaction limit state behavior of
soil nail wall facing panels the developed analytical model was calibrated with full-scale tests on
single naillsoil supported facing panels [4 5] and verified by a full-scale nine nail facing panel test
[6] in the Charles Lee Powell Structural Research Laboratories at the University of California San
Diego The validated computer model was subsequently used to investigate the influence of
different design parameters and variations on the soil nail wall facing panel response [7] and for
specific case studies of commonly encountered temporary and permanent soil nail wall facing
geometries and soil conditions [8]
It is the objective of this report to summarize both the analytical model development and
parameter studies as well as the full-scale experimental investigations used for the validation of the
analytical model in direct support of the soil nail wall design guideline development under FHW A
DP-103 Detailed information on the analytical model development the full-scale single and nine
nail tests and the parameter and case studies can be found in the referenced reports
1
FIG I Permanent Soil Nail Wall Construdion FIG 2 Temporary Soil Nail Wall Prior to
Permanent Fadng Application
2 THE EXPERilVIENTAL TEST PROGRAM
The experimental test program consisted of two types of tests namely ( 1) single nail tests and
(2) a nine nail facing panel test All tests were conducted at full-scale or close to typically
encountered prototype scales Since each test was a one-of-a-kind test no statistical value can be
assigned to the test program rather the experimental test programs had the principal objective to
allow calibration and verification of the developed analytical model Such a model validation
consists of two phases namely ( 1) the calibration phase where the model is used to trace
experimental response results to determine if the model has sufficient parameters to allow the
phenomenological description of the observed behavior with parameter adjustments based on
measured material properties and rational material models and (2) the verification phase where the
model is used to predict experimental behavior prior to the actual test
For the calibration phase of the soil nail wall facing model a series of six single nail facing
panel tests was conducted in a specially designed and constructed soil box test apparatus see Fig
3 where single soil nails are pulled through solid supported facing panels The fmal model
verification was performed via a nine nail test see Fig 4 where the nine nail arrangement
simulated the facing panel continuity and thus more realistic boundary conditions than those
modeled in the single nail tests with a free panel edge Both test programs are summarized in the
following
21 Single Nail Facing Panel Tests
The single nail facing panel test program consisted of one calibration panel (cast-in-place
concrete) and five soil nail wall facing panel tests The single nail calibration test [4] was designed
and performed as shake-down test for the soil box test apparatus and the test instrumentation as
well as a first benchmark for the analytical model development The five production single nail
tests represented commonly encountered facing panel designgeometrysupport differences to
provide a representative behavior response variation for the analytical model calibration Variations
in the five production tests ranged from temporary shotcrete facings to a permanent (overlaid)
facing panels different dimensions of the anchor plate and different reinforcement types (ie with
and without waler bars) as well as differences in the support conditions to investigate different
failure modes An overview of all six single nail facing panel tests is provided in Table 1
The single nail facing panel test was designed to simulate realistic soil structure interaction
under the nail head but with free boundary condition along the panel edges to simplify testing and
test data interpretation This simplification is justified by the single nail test objective of analytical
3
FIG 3 Single Nail Facing Panel Test
FIG 4 Nine Nail Facing Panel Test
4
TABLE 1 Single Nail Facing Panel Test Matrix (15 x 15 m panels)
Anchor Plate Concrete
Test Panel Type Support Panel Reinforcement [A36] Strength
Specimen Condition Dimensions [mm] fc [MPa]
Shake- 100 mm compacted Grade 75 weldedmiddot Grade 276 Down Test precast soil wire mesh 60
6 X 6 W20 X 20 waler 13 X 200 X 200
bars
Production 100mm 2x 241 Test No1 temporary compacted 6 X 6 W21 X 21 13 X 200 X 200
shotcrete soil
Production 100 mm 4x 241 Test No2 temporary compacted 6 X 6 W21 X 21 - 25 X 200 X 200
shotcrete soil
Production 100mm 3x 241 Test No3 temporary compacted 6 X 6 W21 X 21 2 4 13 X 200 X 200
shotcrete soil ew
Production 100 mm shear ring 241 Test No4 temporary 06 m diam 6 X 6 W21 X 21 2 4 25 X 200 X 200
shotcrete ew
Production 100 mm 5x 241 Test No5 shotcrete compacted 6 X 6 W29 X 29 2 4 19 X 200 X 200 276
+200 mm soil + 6 300 mm in ew with 4 headed overlay
cast-in-overlay studs
place overlay
model calibration with subsequent more realistic (continuous) boundary conditions for the
parameter studies and the nine nail verification test
The geometry and dimensions of the single nail soil box are depicted in Fig 5 and details on
the design of the single nail facing panel test apparatus can be found in [4] The test sequence
consisted of ( 1) the construction of the shotcrete facing panels against plywood forms in the
vertical position (2) the placement of the panels on the compacted soil in the soil box (3) the
placement of the nail and nail head in the form of a high strength bar in a PVC sleeve and anchor
plate ( 4) the instrumentation with displacement transducers and soil pressure cells at strategic
panel locations (5) the testing of the panel by pulling the nailnail head against the facing panel (6)
the observation of the failure mode subsequent to the test and (7) the test data reduction and
reporting
5
Botton View
Front Elevo tlon
i
I ~
lt N 1pound) -__
bullo
I 1
t----tiGO [ 1524-mm]t----1
-v v
1 I 1 I
Top BottoM BeaM View w6x12
Top Edge BeaM L8x6x34
BottoM Pta te Top Edge BeaM L8x6x34
12 [127MM] thick
[7 Side BeaM w6xl2
Side Elevo tlon
l
ttI1 I
FIG 5 Geometry and Dimensions - Soil Nail Test Box
0
Side Plote 12 [12 7MM] thick
I
I
I I I
1 lt N 1pound) -
1
(mm)
0 8 16 24 32 40 48 180 BOO
160 720
e o Test 1 640 140 v v Test 2 3 c Test 3 t t Test 4 560
120 Q o Test 5
- 480 Ill
2lt 100 -~
400 ~ -tl - laquo 80 0
113 320
60 240
40 160
20 80
0 0 00 04 08 12 16 20
___ l~p_~cement (inches)
FIG 6 Nail Head Load vs Displacement Response Envelope
The single nail production tests [5] showed the following key response characteristics
1 The nail head load-deformation response of the temporary shotcrete facing panels (tests 1 2
and 3) was very ductile as can be seen from Fig 6 All three panels failed in a combined
flexural and punching shear failure
2 Panel 4 which was not supported by soil but by a 06 m 0 ring of elastomeric pads failed as
expected in punching shear at a nominal punching shear stress level of 025 [F [MPa] with
reference to the total facing panel thickness as will be discussed later However even in test
4 the nail load capacity stabilized with increasing panel deformations subsequent to an initial
capacity loss at the onset of the punching failure see Fig 6 due to membrane action in the
reinforcement under the nail head
3 The permanent (300 mm thick) facing panel showed the expected higher stiffness and nail load
capacity in Fig 6 but since the deformations were measured against the permanent facing
panel surface delamination between the temporary shotcrete facing and the permanent overlay
actually showed a reduction in panel deformation after the internal punching shear failure which
resulted in a potential failure mode without visual warning in the form of large facing panel
deformations a failure behavior which needs to be appropriately reflected in the design
guidelines
4 Facing panel nail line deformations depicted in Fig 7 clearly show the influence of added waler
bars anchor plate thickness panel thickness and soil reaction stiffness Since each subsequent
test compacted the soil in the single nail box more a direct comparison of test results needs to
consider this difference in soil reaction stiffness As can be seen from Fig 7 significant uplift
along the panel edges occurred in tests 1 and 3 where the soil compaction was at a minimum
Note that the tests 2 and 3 were not performed in sequence but rather test 3 before test 2
5 The soil reaction stiffness measurements in Fig 8 also show the continued compaction effect
from each test Furthermore since each single nail panel was placed in cured form in the soil
box and not shot against the soil an initial settlement or soft branch is noticeable in all soil
stiffness measurement At higher deformation levels for the panels where uplift of the corners
and panel edges occured Fig 8 also shows a softening branch at the end of the test which is
indicative of soil failure under the nail head This soil failure occurs only in cases where the
panel uplift no longer provides soil confinement Trilinear soil stiffness characteristics derived
from the single nail tests as part of the analytical model calibration are also depicted in Fig 8
8
(mm) -760 -570 -380 -190 0 190 380 570 760
20 50 1
0 o Test 1 40 15 v v Test 2 0 o Test 3 0 o Test 5 30
10
- 20 rn Ql 1 r 05 ()
= 10 -
J E = 00 Ql 0 E s _ Ql ()
tO -10 ~ -05
Cl -20
-10 -30
-15 -40
-20 -50 -30 -24 -18 -12 -6 0 6 12 18 24 30
Gage Distance from Center (inches)
FIG 7 Surface Displacement Profile 1 at 40 kips Concentrated Load
6 The failure modes in the temporary shotcrete facing panels loaded against soil can be
characterized as flexural-tension-shear failures which can be explained as follows First radial
flexural cracks originate from the nail head at the soil side of the facing panels Second a
concentric radial tension field develops around the nail head indicated by a circumferential crack
pattern see Fig 9 with radius around the nail head influenced by the relative soil and facing
stiffness Finally punching shear failure originating from the anchor plate and spreading with
an approximate 45 failure cone through the panel depth forms the third failure mechanism see
Fig 10 This sequence of three mechanisms as well as the membrane action provided by the
reinforcement and the support provided by the soil under the nail head all result in very large
deformations and noticeable distress prior to any significant capacity degradation which makes
the temporary shotcrete facing failure a very ductile failure mode On the other hand the above
discussed punching shear failure and delamination in the overlaid permanent facing panel
occurred without prior warning but at very high nail loads
7 Punching shear failures though not as brittle as discussed above were found to occur at
nominal shear stress levels of 025 Fc [MPa] when referenced to a nominal vertical failure
plane through the full panel depth where the 45deg punching cone originating from the anchor
plate intersects the center of the facing
22 Nine Nail Facing Panel Test
The nine nail facing panel test [6] was conducted as final validation test for the analytical
modeL The plan geometry of the nine nail test is depicted in Fig 11 with a 120 m nail spacing in
both directions The depth of soil was also 120 m based on St Venant s assumption of a uniform
stress state in a homogeneous medium
The facing panel construction differed from the single nail facing panel test in that the 100 mm
shotcrete panel was directly shot onto the sand filled box thus consolidating the sand during the
casting operation and ensuring good contact between the soil and the facing panel The nominal
concrete strength for the panel was 276 MPa but at the day of testing the actual concrete strength
was 50 higher The reinforcement of the 100 mm thick temporary facing panel consisted of 6 x
6 W29 x 29 welded wire fabric and 2 4 waler bars each way at each nail head line The anchor
plate dimensions were 19 x 203 x 203 mm
All nine nails were uniformly loaded through a common manifold up to the onset of punching
shear failure Subsequently the external nail loads were locked-off and kept constant while the
center nail (nail 5 Fig 11) was continued to be pulled through the facing panel
11
HG 9 IJistress Pattern at Top of Test Panel 2
HG 10 Punching Shea- Distress Patter-n at Bottom of T~st 1 Panel after Test
12
General observations from the nine nail test can be summarized as follows
1 The load-deformation behavior in general and for the center nail in particular was very ductile
as depicted in Fig 12 consistent with the observations from the single nail tests The
analytical prediction of the load-deformation behavior of the center nail head was offset from
the test results by the amount of the reduced initial soil stiffness as observed and implemented
based on the single nail test results However the different construction of the nine nail panel
by shotcreting against the soil eliminated this initial reduced soil stiffness phase Furthermore
the free panel perimeter edge still allowed some uplift whereas in the center nail vicinity
continuous confinement was provided to the soil by the facing panel Changing the trilinear
soil reaction stiffness characteristics used in the predictive model to linear characteristics but
with reduced stiffness towards the outer regions of the nine nail facing panel as shown in Fig
12 resulted in a diagnostic post-test analysis which correlated well with the experimental
results
2 The justification for the linear soil stiffness characterization was also provided by the soil
pressure measurements between nails 4 and 5 which are reduced to a pressuredeformation
relationship in Fig 13 for the center nail location The actual soil pressure profile between
nails 5 and 4 is depicted in Fig 14 for various nail load levels Note that after a nail load of
311 kN only the center nail 5 was loaded while all the other nail loads were kept constant
3 The crack pattern evolution in the nine nail test on the exposed side of the facing panel is
depicted in Fig 15 for various nail load levels The first visible cracks develop in the negative
moment regions between nail lines followed by circumferential tension cracks around the nail
heads and ultimately punching shear cracks originating from the anchor plate perimeter Thus
the sequential distress patterns are consistent with the fmdings from the single nail tests at
slightly higher nail loads due to the panel continuity The above described distress patterns are
also depicted in Fig 16 for the circumferential tension mechanisms and in Fig 17 for the
punching shear failures
4 Nominal punching shear stress levels as described for the single nail facing tests slightly
exceeded 04 -jf [MPa] for the center nail and were thus 15 x higher than for the single nail
tests which can be attributed to the higher soil capacities in the continuous panel case
13
12 (S868cm)
rmiddotmiddot [12Ultm] lt[12Uom]l
I
reg 3
r 6 reg 9
l I
4 [121 9cm]
9 2 + 9 8
- - - - 12 [3658cm]
I
J reg 1 ~ 4 reg 7
Scm)
Nor th I Sout h
FIG 11 Nail Head Location and Numbering
14
-Ul
(rrim)
0 10 20
100
90
80
70
60
50
40 160 kipsft 3
30
20
10
30 40
PCYCO reaulla 9-nall teaL precHcUon trllinear 1prlng model 00 -02 50 ldplfl-3 Ot -08 300 ldpbullft-3 08- 100 ldpsft-3
100 kipsft 3
50
450
400
350
300
200
150
100
50
0~~~~~~~~~~~~~--~~--~~--~~------~~r-~--rO
00 04 08 12 16 20 Displacement (inches)
FIG 12 Nail Head Load vs Displacement Response 9-Nail Test
-l
260
240
220
200
180
-160 bull-I Ill p
-- 140 QJ 1-t j Ill Ill QJ 1-t
0
120
100
80
60
40
0 200 400
~
(mm)
600 800 1000
1 20 kips 6696 kN 2 30 kips 1334 kN 3 40 kips 1779 kN 4 50 kips 2224 kN 5 60 kips 2669 kN 6 70 kips 3114 kN 7 BO kips 3559 kN B 076 Inch (193 mm) 9 102 kips (4542 kN)
1200 1400 1600 1800
16
bull bull 14
5 12
bull 4 bull
10
-08 ~
06
04
~1~~~~~ii~~ii~~~~~sectl~~~~~~~~~0
middot2
200j
00 0 12 24 36 48 60
Pressure Gage Location Measured from Center (inches)
FIG 14 Soil Pressure Gage Profile
72
a) Nail Load 30 kips
c) Nail Load 50 kips
b) Nail Load 40 kips
d) Nail Load Over 65 kips
FIG 15 Top Surface Crack Pattern
18
FIG 16 Top of Panel Final Distress Pattern
19
a) Punching Failure Top and Bottom of Panel
b) Crack Pattern and Imprint of Center Nail Punching Cone
FIG 17 Close-up of Facing Panel Failure Modes
20
3 THE ANALYTICAL INVESTIGATIONS
The analytical model development parameter studies and case studies are described in detail in
[2 3 7 and 8] and are summarized in reference to the above experimental program in the
following
31 Analytical Model Development
For the detailed nonlinear analysis of soil nail wall facing panels the computer code PCYCO
[2] was adopted since critical facing panel response limit states such as cracking of the concrete
yielding of the reinforcement crushing of the concrete etc can be modeled
PCYCO is the latest in a series of nonlinear analysis programs for structural concrete members
and systems developed at the University of California San Diego specifically for the prediction
and diagnostic of reinforced or prestressed concrete or masonry systems test performed at the
Powell Structural Research Laboratories The PCYCO program is a research tool and not a
production type program hence code clarity was chosen over program efficiency whenever it was
necessary
The plate or slab element in PCYCO which was used to model soil nail wall facings is a nineshy
node Lagrangean isoparametric flat shell element in which the concrete is represented as a layered
media and the steel reinforcement is overlaid and connected at the nodes by compatibility
requirements see Fig 18 The basic plate bending behavior is modeled after the Reissner-Mindlin
theory for shear deformable plates and the constitutive model for concrete is based on the
orthotropic model of Darwin and Pecknold as well as on the modified compression field theory by
Collins and Vecchio An object-oriented programming philosophy has been adopted in the
development of the PCYCO program This programming philosophy considers the element
kinematics independently of the material constitutive models As a result a researcher can develop
a new constitutive model which can be inherited by the existing element types Similarly a
researcher can create a new element type which can inherit any of the existing constitutive models
with minimal programming effort A common output data base ensures that element deformations
forces strains and stresses of a new element type can easily be incorporated into the existing postshy
processing programs
The following material nonlinearities can be considered (a) cracking of concrete (b) softening
and crushing of concrete (c) yielding and strain hardening of reinforcement steel (d) nonlinear
stress-strain behavior including the Baushinger effect (cyclic model only) (e) material anisotropy
21
I Ll_ I I x middotmiddot--middotmiddot--
ossible Deformation Mces
a) Nine Node Element
Integration
Stations
--Concrete
Layers
Reference
Plane
Steel Layers
b) Layering Through Element Depth
FIG 18 PCYCO Reinforced Concrete Flat Shell Element
(f) confmement effects in concrete (g) tension stiffening effect of reinforced concrete (after
cracking) and (h) prestressing effects on both steel and concrete These effects are introduced in
the analytical model through equivalent uniaxial orthotropic rotating constitutive relationships for
each individual concrete or steel layer The constitutive relationships for concrete and steel can
either be linear nonlinear elastic or nonlinear inelastic and fully cyclic The nonlinear elastic
constitutive models were chosen for the subsequent soil nail wall facing analyses
A preliminary model validation [3] 102 mm thick precast concrete single nail panel test [4]
showed that the characterization of soil springs supporting the facing panel in the form of a linear
elastic Winkler foundation needed some modifications to account for observed effects such as ( 1)
uplift along the free edge of the single nail panel (2) stiffening of the soil due to compaction during
the test and (3) softening of the spring support once the soil failure limit state is reached
First the linear elastic soil spring model see Fig 19a was replaced with an elastic linear
compression and tension gap model see Fig 19b for uplift simulation Then a bilinear
constitutive relationship for soil spring compression was introduced see Fig 19c followed by
refinement to a trilinear compression model to simulate the observed soil dislocation under the
loading area at high nail loads Finally to model possible permanent soil pressure states against
the back of the soil nail wall facing at higher wall depth a cut-off pressure correction in the form of
a baseline shift on the load in the soil spring model see dashed horizontal axis in Fig 19d was
introduced to the PCYCO program in direct support of the SSI (soil structure interaction) modeling
of a concrete facing under increasing nail loaddisplacement limit states
Based on load-deflection measurements in the single nail panel tests and parallel soil pressure
cell readings during the test both a calibration of the soil spring stiffness models described above
as well as a verification by direct comparison of the soil spring load-deformation behavior with the
pressure cell readings were performed
Analytical model discretizations used by both single and nine nail test analyses are depicted in
Fig 20 and show that due to symmetry of structure and loading only a quarter of each test panel
needs to be modeled with appropriate boundary conditions along the lines of synunetry allowing
vertical displacements and rotations perpendicular to the boundary line and no rotations about the
boundary axis
a) The Single Nail Tests
Subsequent to each single nail laboratory test [5]the trilinear spring stiffnesses were adjusted
such as to provide a close correlation with the observed load-deformation characteristics at the nail
23
p
a) Linear Base Model
p
Compression
Tens-ion
c) J~ilinear Compression and
Tension Gap Model
middotp
Tension
b) Linear Compression and
Tension Gap Model
p
cul-of I
A
A
sr~~---------_____________
Tension
d) Trilinear Compression and Tension
Gap Model with Same Line Shift
FIG 19 Elastic PCYCO 1-D Spring Model Development
24
X I t J3X5lmm 2x102mm 2x 203 mm I
~ steel OPICho plategt
bull noil position
a) Finite Element Mesh for the Single Nail Panels J
I 1 102 703 305 305 203 2x 10² 203 middot 305 t-1 __t-----t___-----lt---------t-1 c_middot ---t-1 middot ---tf___-+-1 --1
mrn
~ ~
~
I bullbull umiddotmiddot
~~ ~ ~
~ ~
b) Finite Element Mesh for Nine Nail Panel
FIG 20 Analytical 1lodel Discretizations
25
~ steel oncho- plote
e noil position
~
head This calibration was performed for single nail test 1 2 3 and 5 only since test 4
represented a punching shear test without soil support conditions or SSI
The analytical post-test load-deflection traces for tests 1 2 3 and 5 shown in Fig 21 are
in direct comparison to the experimentally observed nail head load-displacement curves The fact
that experimentally observed load-deflection curves can be traced after the test with the adjusted
analytical model is in-itself no statement of qualification for the analytical model It only shows
that the model has sufficient parameters and characteristics which allow a good trace to be
established However two additional conditions are very important to the model validation
namely (1) the fact that only soil spring stiffness were adjusted and measured material properties
for f = concrete strength fer= the cracking strength as determined from standard cylinder and
beam tests and fY = reinforcement yield based on bar pull tests or manufacturer supplied batch data
were used and not varied as part of the model calibration and that (2) measured soil pressures and
deflection profiles along the soil pressure cell line allowed for an independent experimental
verification of the analytically employed soil pressures or spring load vs deflection data as
depicted already in Fig 8 While the correlation in Fig 8 between experimental and analytical data
certainly could be improved the general soil spring behavior characteristics has been verified
Based on Figs 21 and 8 the validity of the trilinear model for the single nail facing panel tests was
established The trilinear break points in the soil spring stiffness are seemingly independent of soil
condition and correspond to nail head displacements of 51 mm and 152 mm respectively The
individual segment spring stiffnesses for the trilinear models listed in Fig 8 correspond exactly to
those used to generate the analytical traces in Fig 21
b) The Nine Nail Test
The calibrated analytical model was now used to predict the behavior of the nine nail test
already shown in Fig 12 in a true class A or pretest prediction in order to validate the analytical
tool prior to the detail parameter studies A 78470157 M~ trilinear soil spring model was m
adopted for the nine nail test assuming that the density and compaction of the soil would resemble
those of the first single nail test see Fig 8 test 1
A direct comparison of the class A prediction and the experimentally measured loadshy
deflection behavior at the center nail depicted in Fig 12 shows that the analytical model
consistently over-predicts displacements for a given nail load level On the other hand once the
initial soft spring stiffness up to a displacement of 51 mm is eliminated very close agreement
between experiment and analysis can be expected since it results effectively only in a lateral shift of
the analysis curve towards the origin by an amount equal to the displacement during the initial
26
(mm) middotmiddot-middot-middotmiddot ------- --- ----~---~ middot- middot-(mm ___
0 8 16 24 32 40 0 8 16 24 32 40 48 56 45 200 JO 400
40 a so 75
35 PCYCO results test I 150 30(
30 60 =oo~ middot middot middotmiddot middot Test2 (121894) 250
325
E wosect a 45 zoosect ~ 3 20 3 150
15 30
50 100 10
15 5 50
0 0 0 0 00 04 08 12 16 00 04 OB 12 16 20 24
Dloplocemenl (Inches) Dlpla~omenl (Inches)
a) Test 1 b) Test 2
--------- ~-- ---------
(rnm)
(mm)
N 0 8 16 24 32 40 48 56 00 10 20 30 40 50 60 70 80 90 100
-J 90 400 200 880 PCYCO results test 5
350 175 Test 5 (41995) 800 75
720 _Punching 300 150 Shear
Failure 640 60
250 125 560
145 zoosect J 480~ ~ 100 3
400 9 3 150
30 75 320
100 50 240
15 160 50 25
DO
0 0 0 04 08 12 16 20 24 000 010 020 030 040 050
Displacemenl (lnchos) Dlsplacemenl (Inches)
c) Test 3 d) Test 5 FIG 21 Nail Head Load vs Displacement Response Calibration
spring stiffness phase Finally the adopted zone model with three zones of linear elastic springs
as outlined in Fig 12 shows excellent agreement with the experimental results Since for the
center nail the center soil stiffness or confmement is of importance the linear center soil stiffness
of 34 MNm3 was plotted in Fig 13 together with the measured pressure cell data in the center nail
vicinity as well as with the original soil stiffness model used in the prediction Very close
agreement between the linear 34 MNm3 selected soil spring stiffness and the measured pressure
cell data exists and can certainly be viewed as a very important validation of the developed PCYCO
soil nail wall facing SSI model
32 Analytical Parameter Studies
The objective of the parameter study was to identify the influence of parameter variations on the
load-deflection behavior at the nail head All parameter variations occurred within realistic
prototype bounds of actual soil nail wall facing properties In order to evaluate the influence of
each individual variable only one parameter at a time was adjusted and its influence on the soil nail
facing behavior analyzed with respect to a common baseline case
This baseline case assumed the dimensions reinforcement ratios and design material
properties listed in Table 2 for a representative temporary shotcrete wall facing and a 153 m nail
spacing Parameters investigated can be grouped in five general categories of (1) soil (2) facing
panel (3) bearing plate (4) reinforcement and (5) concrete properties
Other parameters and constants used in the analytical model which were not subject to the
parameter study reflect basic material characteristics for concrete and reinforcement as obtained
from the tests The concrete cracking strength fer was always taken as 10 of the nominal
compressiOn strength f~ the concrete modulus was evaluated following ACI 318 standard
procedures
Since for the soil structure interaction analysis the soil characteristics clearly have a dominant
effect four separate soil related parameters were investigated namely the subgrade reaction
coefficient related to the soil density the load-deformation behavior of the soil approximated by a
linear bilinear or trilinear relationship the diameter of the grout column around the nail from overshy
drilling or break-out of soil in the nail head vicinity and finally a permanent cut-off soil pressure
behind the wall facing panel The influence of facing panel geometry captured by the two
parameters of facing panel thickness and soil nail spacing were also investigated The steel bearing
plate size was varied both in thickness and square side dimensions in the form of a linear elastic
overlay element in the plate region Finally variations in material quantities and properties were
28
evaluated by adding to the standard baseline 6 x 6 W 21 x 21 welded wire mesh two waler bars
in both directions ranging from 4 to 6 in reinforcement size
Two different edge boundary conditions were investigated for each of the parameter studies
namely a free edge and a clamped edge condition with rotational constraints or fixity against
rotations about the panel edges The first or free boundary condition was the one used in the single
nail experiments [5] and does not represent realistic field conditions except at the edges or corners
of soil nail walls whereas the clamped edge condition again based on symmetry relationships
reflects prototype conditions in a continuous multi nail wall of infinite dimensions under uniform
loading conditions
TABLE 2 Baseline Panel Properties and Parameter Range
PARAMETER BASELINE PARAMETER MODEL RANGE
Subgrade Reaction k 267 ~ 157 - 376 ~~ Coefficient m m
Stiffness Variation D trilinear linear bilinear trilinear
SOIL Grout Column D 203 mm 0-406 mrn Diameter
Permanent Soil pcut-off 0 kPa 0-287 kPa Pressure
Facing Thickness tslab 102 mm 102-203 mrn
FACING Soil Nail Spacing snail 153 m 122- 183 m PANEL
Finite Element FR M5 M4M5M6 Discretization
BEARING Plate Thickness tplate 19 mm 127 - 318 mm
PLATE bplate 203 x 203 mm Plate Size 102 x 102 mm 305 x 305 mm
REINFORCE Welded Wire Fabric wmesh I 6 X 6 w 21 X 21 none
-MENT 24 24-26 WalerBars ff
CONCRETE Design Compression f 276 MPa 207 - 345 MPa c Strength
29
The above outlined parameters were investigated subsequently by individually varying one of
them through the range indicated in Table 2 always starting with the reference baseline case A
total of eight groups of parameter studies were performed and are labeled in the following with A
through H representing
A Grout Column Diameter Variations
B Soil Stiffness Characterization
C Permanent Cut-off Pressure Influence
D Effects of Bearing Plate Dimensions
E Moment Capacity or Reinforcement Ratio Variation
F Facing Thickness Variation
G Concrete Strength Influence
H Soil Nail Spacing Variations
Results from the above parameter studies are graphically depicted in Fig 22A-H
Parameter studies have shown that the nail load or facing capacity is most influenced by the
facing panel thickness by the bearing plate size and the soil stiffness assumptions whereas soil
model variations reinforcement ratios and soil nail spacings primarily affect the deformation states
and not so much the nail loads The evaluated shear stress indicators as multiples of jf showed
the largest dependence on the assumed grout column diameter and on the actual concrete
compression strength Single nail tests showed that punching shear failures are possible when the
shear indicators exceed the parameter studies clearly indicate for which of the investigated
parameter variations and parameter combinations this punching shear failure scenario becomes
more likely For example low concrete strength combined with a large grout column can quickly
result in a punching shear failure mode However both test and analyses clearly showed that
punching shear does only occur at large deformation states and is preceded by significant inelastic
flexural action in the form of cracking yielding and large relative facing panel deformations which
will provide significant warning prior to punching shear failure at least in thin temporary shotcrete
facings
33 Analytical Case Studies
The same analytical model with the exception of linear tension gap springs instead of trilinear
springs was employed for case studies on representative soil nail wall facing designs which are
presented in the following In addition to the twelve case studies the effects of different
reinforcement ratios both uniformly distributed and concentrated along nail head strips on the nail
30
700
_600 rn 0
2 -500 t1 ttl
I 0 J 400 CC QJ
J e 3oo
J
= ~
~ 200 0 u
100
Note Numbers indicate nominal shear stress in terms of nbullsqrt(fc)
middot~Dia = 0 in IHgt-ampampltl Di a = 4 in -- Dia = 8 in (Baseline) _ Dia = 12 in ~Dia = 16 in
00 ~------r------------r---~-~
700
600 -rn 0
2 -500 d ttl
s 400 CC
QJ J
~ 300 J
= Q)
g 200 0 u
100
00
00 00
01 02 03 04 05 06 07 08 09 Displacement Under Concentrated Load (inches)
a) Grout Column Parameter Study (Multi Nail) A
Note Numbers indicate nominal shear middotstress in terms of nbullsqrt(fc)
= 100 kef = 170 kef (Baseline) = 240 kef
01 02 03 04 05 06 07 08 09 Displacement Under Concentrated Load (inches)
bl) Soil Stiffness Parameter Study Bl
FIG 22 Soil Nail Facing Parameter Study
31
10
10
__ _ - ---~--- --- middotmiddotmiddot---~~--~~~- ----- --middot-middotmiddot ---
700 ---------------------~------------------------~
-rn Q
600
2 -500 d cd
3 400 d
Q) -+-) e 3oo -+-)
Q)
~ 200 0 u
100
Note Numbers indicate nominal shear stress in terms of nbullsqrt(fc)
~ Linear Soil Model ampe-e-a-pound~ Bilinear Soil Model -- Trilinear Soil Model
00 ~--~---~---------r-----r--~~-~ 00 01 02 03 04 05 06 07 08 09
Displacement Under Concentrated Load inches
b2) Soil Model Parameter Study B2
10
700 ~------------~-----~---------
-rn Q
600
2 -500 d cd
3 400 d
Q) -+-) e 3oo -+-)
Q)
~ 200 0 u
100
Note Numbers indicate nominal shear stress in terms of nbullsqrt(fc)
-- P = 0 psf (Baseline) ~ P = 300 psf ltgt-ltgt-e-a-lt~ P = 6 0 0 p sf
00 4L~-~-~~--~~~------------------~ 00 01 02 03 04 05 06 07 08 09
Displacement Under Concentrated Load inches
c) Soil Cut-off Pressure Parameter Study C
FIG 22 Soil Nail Facing Parameter Study (continued)
32
10
700 -----------------------~------------------~--~
_soo Ill ~ g
--500 d 10
s 400 d Cl) e 3oo = Ql
g 200 0 u
100
Note Numbers indicate nominal shear stress in terms of nsqrt(fc)
~ Bearing Plate Thickness = 12 in --- Bearing Plate Thickness = 34 in (Baseline) ~ Bearing Plate Thickness = 1 in - Bearing Plate Thickness = 1 14 in
0 0 +-----------+--------------------------------------1 00 01 02 03 04 05 06 07 08 09
Displacement Under Concentrated Load (inches)
dl) Bearing Plate Thickness Parameter Study Dl
10
600 --------------~------------~--
-Ill ~
700
middot~ 600 -d ~ 500
I
g 400 Ill Jlt
~ 300 Cl)
0
sect 200 u
100
I I
~-------~-----~--
G-EHHHgt 4 x 4 in Bearing Plate 8 X 8 in Bearing Plate (Baseline
12 x 12 in Bearing Plate
00 ~~--r-~~--~~~--~~----r-~---r-~-----r~~ 00 01 02 03 04 05 06 07 06 09
Displacement Under Concentrated Load (inches) -~---middotmiddotmiddotmiddotmiddotmiddotmiddot ~~-~-middot-------
d2) Bearing Plate Size Parameter Study D2
FIG 22 Soil Nail Facing Parameter Study (continued)
33
10
600 -----------------------~--------------~--------
--500 A
a -C 400 IS
) 3 -g 300 ~ IS
~ ~ 200 ~
d 0 u
100
Note Numbers indicate nominal shear stress in terms of nbullsqrt(fc)
--- 2 4 middotWaler Bars irho=025~~ (Baseline) lHrlrlirio 2 5 Waler Bars middot rho=035lil ~ 2 6 Waler Bars rho=046~
00 4L-r~-----r---------------------~
-I) A ~ -C IS
s C Q) ~
~ d Q) ~
1= 0 u
00
1000
900
BOO
700
600
500
400
300
200
100
00 00
01 02 o3 04 os 06 07 oa o9 Displacement Under Concentrated Load (inches)
e) Yield Moment Parameter Study E
Note Numbers indicate nominal shear stress in terms of nbullsqrt(fc)
--- Thickness = 4 in (Baseline) ~ Thickness = 6 in Thickness = B in
10
01 02 03 04 05 06 07 OB 09 10 Displacement Under Concentrated Load (inches
f) Slab Thickness Parameter Study F
FIG 22 Soil Nail Facing Parameter Study (continued)
34
--- 500 p
- 400 ca 0
I
-g 300 ca b sect 200 CJ ~ 0 u
100
Note Numbers indicate nominal shear stress in terms of nbullsqrt(fc)
CHHHH) fc = 3000 psi -- fc = 4000 psi (Baseline) ~ fc = 5000 psi
00 ~~--r-~~--~~~--------------------__ 00
600
--- 500 ~
~ - 400 ca 0
I
~ 300 tl1
1-o
sect 200 CJ ~ 0 u
100
01 02 03 04 05 06 07 08 09 Displacement Under Concentrated Load (inches)
g) Concrete Strength Parameter Study G
10
4~ 4
Note Numbers indicate nominal shear stress in terms of nbullsqrt(fc)
~ 4 ft Soil Nail Spacing 5 Ct Soil Nail Spacing (Baseline)
6 ft Soil Nail Spacing
00 ~-----~--~-+--r----r-~----~--~~--~-r--r-~--~ 00 01 02 03 04 05 06 07 08 09
Displacement Under Concentrated Load (inches)
h) Nail Spacing Pressure Parameter Study H
FIG 22 Soil Nail Facing Parameter Study (continued)
35
10
head load-deformation response were investigated to demonstrate the complex interaction between
facing stiffnesscapacity and the Winkler spring simulation of the soil loading
A total of twelve case studies of representative soil nail wall facing designs were investigated
half of them for typical 102 mm temporary shotcrete facings and the other half for 203 mm
permanent shotcrete or cast-in-place wall facings All analyses were based on a 183 m typical nail
head module in both directions with other constant design parameters listed in Table 3
The six temporary shotcrete facing cases had nail head plates of 203 mm square dimensions
with a 19 mm plate thickness effective soil reaction moduli varying between 94 MNm3 and 376
MNm3 and total reinforcement ratios referenced to the 183 m x 102 mm facing cross-section of p = 0222 and 0465 including both uniformly distributed welded wire fabric and waler bars in
the nail head strips
The 203 mm thick permanent shotcrete or cast-in-place wall facing case studies were based in
addition to the constant case parameters in Table 3 on 229 mm square and 25 mm thick nail head
plates Reinforcement for the permanent facings consisted of 3 waler bars along the nail head
strips and uniformly distributed mild reinforcement on a 305 mm spacing in both directions with
overall reinforcement ratios of p = 0313 and 0484
A summary of all twelve case study parameter variations is provided in the case study
pafameter matrix in Table 4 Results from the individual case studies are summarized in the
following in the form of nail head load versus nail head deflection relationships All analyses
were performed for continuous facing panels with the 183 m nail spacings in both directions
TABLE 3 Constant Reference Case Parameters
Concrete Properties f 276 MPa
Facing Materials waler bars fy 455MPa Steel Properties wire fabric fy 517 MPa
Cutoff Pressure P c 287 kNm Soil Properties
Grout Column Diameter DGC 203mm
Headed-Stud Spacing SHs 152mm
Headed-Stud Body Diameter dHs 19mm ij
Nail Head Parameters Headed-Stud Head Diameter dH 32mm
Cover to Headed Stud CHs 51mm
Cover to Plate CPL Omm
Nail Spacing S 152mm
36
TABLE 4 Case Study Parameter Matrix
Case Facing Plate Plate Soil Waler at Reinforce-Thickness Width Thickness Effective Steel Steel ment
hp bPL tPL ks Ratio (mrn) (Iniii) (mrn) (MNm3
) 0 () 1 102 203 19 94 2-4 W20-6x6
2 102 203 19 188 2-4 W20-6x6 0222
3 102 203 19 376 2-4 W20-6x6
4 102 203 19 94 2-5 W40-4x4
5 102 203 19 188 2-5 W40-4x4 0465
6 102 203 19 376 2-5 W40-4x4
7 203 229 25 94 3-4 1 4 reg 12
8 203 229 25 188 3-4 4 12 0313
9 203 229 25 376 3-4 4 12
10 203 229 25 94 3-5 5 12
11 203 229 25 188 3-5 5 12 0484
12 203 229 25 376 3-5 5 12
The load-deflection response for the temporary shotcrete facing panels with 102 mrn thickness
is depicted in Fig 23 for different reinforcing patterns and soil reaction coefficients As can be
seen from the response analyses in Fig 23 the soil reaction coefficient has a significant influence
on the nail headfacing capacity Furthermore the facing panel capacity clearly seems to increase
with increasing reinforcement ratios which is somewhat contradictory to the findings in the initial
analytical parameter study [7] However more than doubling the overall reinforcement ratio from
0222 to 0465 increases the nail load capacity at a nail head displacement of 203 mm by only
20 to 30 for the different soil reaction coefficients which is still significantly less than would
be expected from the simplified assumption that a doubling of the reinforcement amount should
also approximately double the facing capacity
The load-deflection response characteristics obtained from the permanent facing case studies
are depicted in Fig 24 for reinforcement ratios of p = 0313 and 0484 respectively Again
the influence of the soil reaction coefficient was very pronounced particularly at the lower
deformation limit states ie nail head displacements of 102 mrn or less whereas subsequent to
the onset of reinforcement yielding and first concrete crushing this influence of the soil reaction
coefficient seemed to diminish
37
Increases in the reinforcement ratio by a factor of 04840313 = 155 resulted in nail head
capacity increases at the 203 rnrn nail head displacement limit state of only 75 to 15 with the
larger increases for the lower soil reaction coefficients Again this capacity was less than expected
based on the increase in overall reinforcement ratio
To investigate the reasons for this observed behavior further additional parametric studies
were performed where the parameter variations consisted of the reinforcement ratio and the
reinforcement distribution as will be explained in the following
The first set of parameter studies into the influence of the facing reinforcing patterns addressed
a baseline case of a temporary 102 rnrn shotcrete facing with a W 20 - 6 x 6 mesh and a soil
reaction coefficient of 376 MNm3 all other variables are as defined in Tables 3 and 4 The
parameter variations consisted of 2 waler bars in each direction in the form of 2 3 2 4 2 5 and
2 6 grade 60 bars resulting in overall reinforcement ratios between 016 and 039
The resulting load-deflection response at the nail head is depicted in Fig 25a for all four cases
and shows that reinforcement amount changes in the form of waler bars or strip reinforcement have
very little effect on the load-deformation characteristics of the facing panels At the 20 rnrn nail
head displacement limit state only a 10 increase in nail head capacity can be observed over the
depicted reinforcement ratio range
Using instead of concentrated reinforcement along the nail head lines in the form of waler
bars only distributed reinforcement amount variations as depicted in Fig 25b a wider range of
load-deflection response curves is obtained with an increase of around 20 in load capacity at the
20 rnrn nail head displacement limit state over the same reinforcement ratio range of 015 to
04 Thus the influence of the reinforcement distribution had a greater effect on the facing
capacity than the reinforcement amount The same findings were obtained for similar case studies
in 8 in (203 rnrn) permanent facing panels
Explanations for the observed behavior can be found in the facing panel deformation profiles
and the interaction between the facing panels and the soil reaction springs The soil spring
stiffnesses and the reinforcement distribution together with the resulting deformation profile
changes have a significantly larger influence on the nail head facing capacities than the overall
reinforcement amounts
38
~
m p
700
2 600 -d Ill 500 0 ~
] 400 Ill
- 300 Q) 0 ~ 0 200 u
100
00 00
~
m p
BOO
700
2 600 -d laquo 500 0 ~
] 400 ~
~ 300 Ql
0
sect 200 u
100
a)
00 00
Soil Stiffness
middot---- k= GO kef -- k= 120 kef - - - k= 240 kef
shy
Case 3
- ----
Facing Thickness = 40 inches Plate Width = 80 Inches
Plate Thickness = 075 inches Waler Steel = 2 4 MeshMat Steel = W20-6x6
01 02 03 04 05 06 07 08 09 Displacement Under Concentrated Load (inches)
Nail Head Load-Deflection Behavior Cases 1 to 3
Soil Stiffness
middotmiddot--- k= GO kef -- k= 120 kef - - - k= 240 kef --- Case 5
bullbullbullbullbullbullbull -middotmiddotmiddotmiddotmiddotmiddot Case 4
-middot -middot middot middotmiddot
-middot -middot --
middot Facing Thickness = 40 inches Plate Width = 60 inches Plate Thickness = 075 inches Waler Steel = 2 5 MeshMat Steel = W40-4x4
01 02 03 04 05 06 07 08 09 Displacement Under Concentrated Load (inches)
--middot----middotmiddotmiddotmiddotmiddot-----
10
b) Nail Head Load-Deflection Behavior Cases 4 to 6
FIG 23 Temporary Facing Panel Case Studies
39
2000
1800 -- ~ 1600
1400 C1
~ 1200 I
C1 1000 Q) cd 800 a Q)
600 ()
Q 0 u 400
200
00
1800 -- amp 1600
-1400 C1
~ 1200 I
~ 1000 cd ~ 000 Q Q)
() 600 1 0 u 400
200
00
a)
Soil Stiffness
middot---- k= 00 kcC -- k= 120 kef bull - - k= 240 kef
middotmiddot ---middot _ -
I
Case 9 ~-
~--~Case 8
Case 1
Facing Thickness = 60 inches Plate Width = 90 inches Plate Thickness = 100 inches Waler Steel = 3 14
middot MeshMot Steel = 4- at 12 inches
01 02 03 04 05 06 07 08 09 10 Displacement Under Concentrated Load (inches)
Nail Head Load-Deflection Behavior Cases 7 to 9
Soil SlifncS9 Case 12
middot---- k= 00 kef -- k= 120 kef bull - - k= 24 0 kef
_ -middotmiddotmiddotmiddotmiddotmiddotmiddotmiddotmiddotmiddotmiddotmiddot
~-~
____ _
bullbullbullbull -middot Case 10
F11cing Thickness = 00 incl1e11 Plate Width = 90 Inches Plate Thickness = 100 inches Walcr Steel = 3 84 MeshMol Sleel = It at 12 Inches
00 4-~~-----~----------------------~ 00 01 02 03 04 05 06 07 00 09
Displacement Under Concentrated Load (inches)
b) Nail Head Load-Deflection Behavior Cases 10 to 12
FIG 24 Permanent Facing Panel Case Studies
40
10
1000
900 -[] 800 0 a - 700 d Ill
600 0 l
0 500 QJ _ Ill
400 _ ~ QJ omiddot 300 a 0 u
[]
0
~
d Ill 0
l
d QJ _ Ill
_ ~ QJ (J
~ 0 u
200
100
00 00
1000
900
800
700
600
500
400
300
200
100
00 00
Baseline Properlies
Facing Thickness = 40 inches Plale Widlh = 110 inches Plale Thickness = 075 Inches K = 240 kd
Case A - 2~3 Wnler Bars irho = 016111 Case B - 2 4 Wnler Bars rho = 02211 Case C - 2 5 Wnler Bars rho = 030Z Case D - 2 6 Walcr Bars rho = 03~
W20x20 - 6x6 Mesh Cut-off Pressure = 06 Ksr
01 02 03 04 05 06 07 08 09 10 Displacementmiddot Under Concentrated Load (inches)
a) Strip Reinforcement
I I Distributed Reinforcement p = p~
Focing Thickness = 40 inches Plate Width = llO inches Plate Thickness = 075 Inches K = 240 kef
Cul-off Pressure = 00 Ksf 04l1
01 02 03 04 05 06 07 06 09 10 Displacement Under Concentrated Load inches)
b) Distributed Reinforcement
FIG 25 Reinforcement Ratio Effect on Nail Head Load-Deflection Behavior
41
4 SUMMARY AND CONCLUSIONS
In direct support of the FHW A demonstration project DP-1 03 and the development of I
cmhprehensive and rational limit state design models for soil nail walls the influence of parameter ~
variations on the response behavior of soil nail wall facing panels was investigated
i
i The parameter studies were performed with a specially developed nonlinear finite element
model which can capture material nonlinearities in the shotcrete or cast-in-place soil nail wall facing I
as ~ell as in the supporting soil reactions thus modeling the complex nonlinear soil structure
interaction
The analytical model was calibrated with test results from six full-scale single nail tests
conducted in a specially designed and constructed soil box and verified by means of a full-scalemiddot
nine nail facing panel test The model validation was achieved with direct measurements of the soil I
pressure under the facing panel and a one-on-one comparison with pressure or soil reaction
stiifness values used in the analytical model Results from both the analytical model and the full- scale experiments showed that for typical temporary shotcrete facing panels very ductile failure
modes can be expected due to membrane action in the reinforcement and direct soil support under J
potential punching shear cones Thus failure mechanisms with significant warning through large
deformations prior to capacity loss are likely Only in overlayed permanent walls this large
deformation warning is lost since punching and delamination of the temporary facing panel can
occur behind the permanent wall facing without any visible signs of distress The analytical
parameter studies furthermore showed that the nail load or facing capacity was most influenced by
the facing panel thickness the bearing plate size and the soil stiffness assumptions whereas
rei~forcement ratios and nail spacings primarily affected the deformation states to the highly
cm1pled soil structure interaction effect
j Case studies with common design details encountered in soil nail wall projects reconfirmed
th~se findings and can now be used as the basis for detailed design model developments in direct
SU]Jport ofFHW A demonstration project DP-103
42
-middotmiddotmiddotmiddot---
[1]( I~
[3]li i
[4] ~
[51]
REFERENCES
FHW A Soil Nail Wall Demonstration Project DP-103 Design Manual Goldermiddot
Associates Inc Redmond Washington Dec 1995
Ktirkchtibasche AG and Seible F PCYCO - Program for Cyclic Analysis of
Concrete Structures User Reference Guide Structural Systems Research Project
University of California San Diego Report No TR-9407 January 1994
Predictive and Diagnostic Analysis Model for Soil Nail Wall Facings - Single Nail Facing
Calibration SEQAD Consulting Engineers Report No 9410 to CH2M Hill Denver
October 1994
Seible F Ellery M and Latham CT Single Nail Facing Calibration Test Structural
Systems Research Project University of California San Diego Test Report No TR-
9403 October 1994
Seible F Ellery M and Kugler A Soil Nail Walls- The Single Nail Facing Panel
Test Program Structural Systems Research Project University of California San Diego
Test Report No TR-9502 August 1995
[6]1 Seible F Ellery M and Kugler A Soil Nail Walls - The Nine Nail Facing Test i
Program Structural Systems Research Project University of California San Diego Test
Report No TR-9503 May 1995
Analytical Parameter Study of Soil Nail Wall Facing Response SEQAD Consulting
Engineers Report No 95111 to CH2M Hill Denver August 1995
Analytical Case Study of Soil Nail Wall Facing Response SEQAD Consulting Engineers
Report No 9513 to CH2M Hill Denver November 1995
43
ACKNOWLEDGMENTS
The described research was made possible with funding from the Federal Highway
Administration (FHW A) under Demonstration Project DP-1 03 and the superb and relentless
leadership guidance and prodding by Ron Chassie FHW A Portland Oregon and Jim Keeley
FHW A Denver Colorado
The steering committee for the project which contributed invaluably with their discussions and
questions to the experimental and analytical program consisted of John Byrne Golder Associates
Redmond Washington Ron Chassie FHW A Portland Oregon Jim Keeley FHW A Denver
Colorado Bob Mast ABAM Federal Way Washington Jim Moese Caltrans Sacramento
California Larry Reasch CH2M Hill Denver Colorado and Chris W olschlag Golder
Associates Redmond Washington
44
--

University of California San Diego
Division of Structural Engineering
Structural Systems Research Project
Report No SSRP-9601
STRUCTURAL RESPONSE ASSESSMENT OF SOIL NAIL
WALL FACINGS
Executive Summary of Experimental and
Analytical Investigations
by
Frieder Seible PhD PE
Professor and Chair Division of Structural Engineering
Final Report to CH2M Hill Denver CO and
the Federal Highway Administration
under Demonstration Project DP-103
Division of Structural Engineering
University of California San Diego
La Jolla California 92093-0085
February 1996
TABLE OF CONTENTS
DISOAIMER ii
ABSTRACf ili
1 rnTRODUCTION 1
2 THE EXPERIMENTAL TEST PROGRAM 3
21 Single Nail Facing Panel Tests 3
22 Nine Nail Facing Panel Test 11
3 THE ANALYTICAL INVESTIGATIONS 21
31 Analytical Model Development 21
32 Analytical Parameter Studies 28
33 Analytical Case Studies 30
4 SUMMARY ANDCONCLUSIONS 42
REFERENCES 43
ACKNOWLEDGMENTS 44
DISCLAIMER
Any opinions findings conclusions or recommendations in this report are those of the author
and do not necessarily reflect the views of CH2M Hill or the Federal Highway Administration
ll
ABSTRACT
In support of the development of rational design models and guidelines for soil nail wall
facings the overall response behavior of soil nail wall facing panels under increasing nail load
andor nail head displacements was investigated to determine the behavior limit states that form the
basis for LRFD and service design criteria The experimental investigations conducted at the
Charles Lee Powell Structural Research Laboratories at the University of California San Diego
consisted of six full-scale single nail facing panelsoil structure interaction tests and one large scale
nine nail facing panelsoil structure interaction test The experimental test results were used to
calibrate and validate a nonlinear analysis model which allowed the investigation of nonlinear
facing panel material response with full soil structure interaction
The validated analytical model was subsequently used for extensive parameter studies on
temporary and permanent facing panels investigating the influence of variations in soil reaction
properties facing panel material characteristics facing panel dimensions and nail head spacing
and anchor plate dimensions
The loaddeformation response for temporary soil middotnail wall facing panels was found to be
ductile in nature even when punching shear failure modes occurred due to the soil reaction under
the nail head and membrane action provided by the facing panel reinforcement in the nail head
vicinity Only the overlaid permanent facing panel did not show signs of imminent failure due to
internal delamination and punching failure not visible on the facing panel surface
The analytical parameter studies showed that the nail load or facing capacity was most
influenced by the facing panel thickness the bearing plate size and the soil stiffness assumptions
whereas reinforcement ratios and soil nail spacings primarily affected the deformation states which
can be directly attributed to the highly coupled soil structure interaction effects
ill
1 INTRODUCTION
The Federal Highway Administration demonstration project DP-103 [1] had the objective to
develop consistent and rational design procedures for temporary and permanent soil nail walls and
soil nail wall facings see Figs 1 and 2 Temporary soil nail wall facings typically consist of thin
shotcrete panels reinforced at the nominal panel mid-depth with welded wire fabric and waler bars
see Fig 2 whereas permanent soil nail wall facing panels are typically cast-in-place in front of a
temporary wall see Fig 1 with uniformly spaced mild reinforcement and headed stud anchors at
the nail head plates see Figs 1 and 2 However thicker permanent shotcrete facing panels for
soil nail walls have been contemplated and used in some applications
In any case comprehensive design models for soil nail walls based on limit state design
principles (LRFD or Service Limit States) require that the behavior limit states of all of the systems
components namely (1) the soil (2) the nail (3) the nail head and (4) the facing panel are known
to develop overall consistent and reliable design criteria and concepts In order to assess the
behavior limit states of the nail head and facing panel for a large range of realistic geometric and
mechanical parameter variations a nonlinear analysis model was developed [2 3] which allowed
in particular the study of various soil reaction assumptions and their complex interaction with the
nonlinear material response of the soil nail wall facing panel in the form of cracking and crushing
of the concrete as well as yielding of the reinforcing steel
Prior to broad based parameter studies of the soil structure interaction limit state behavior of
soil nail wall facing panels the developed analytical model was calibrated with full-scale tests on
single naillsoil supported facing panels [4 5] and verified by a full-scale nine nail facing panel test
[6] in the Charles Lee Powell Structural Research Laboratories at the University of California San
Diego The validated computer model was subsequently used to investigate the influence of
different design parameters and variations on the soil nail wall facing panel response [7] and for
specific case studies of commonly encountered temporary and permanent soil nail wall facing
geometries and soil conditions [8]
It is the objective of this report to summarize both the analytical model development and
parameter studies as well as the full-scale experimental investigations used for the validation of the
analytical model in direct support of the soil nail wall design guideline development under FHW A
DP-103 Detailed information on the analytical model development the full-scale single and nine
nail tests and the parameter and case studies can be found in the referenced reports
1
FIG I Permanent Soil Nail Wall Construdion FIG 2 Temporary Soil Nail Wall Prior to
Permanent Fadng Application
2 THE EXPERilVIENTAL TEST PROGRAM
The experimental test program consisted of two types of tests namely ( 1) single nail tests and
(2) a nine nail facing panel test All tests were conducted at full-scale or close to typically
encountered prototype scales Since each test was a one-of-a-kind test no statistical value can be
assigned to the test program rather the experimental test programs had the principal objective to
allow calibration and verification of the developed analytical model Such a model validation
consists of two phases namely ( 1) the calibration phase where the model is used to trace
experimental response results to determine if the model has sufficient parameters to allow the
phenomenological description of the observed behavior with parameter adjustments based on
measured material properties and rational material models and (2) the verification phase where the
model is used to predict experimental behavior prior to the actual test
For the calibration phase of the soil nail wall facing model a series of six single nail facing
panel tests was conducted in a specially designed and constructed soil box test apparatus see Fig
3 where single soil nails are pulled through solid supported facing panels The fmal model
verification was performed via a nine nail test see Fig 4 where the nine nail arrangement
simulated the facing panel continuity and thus more realistic boundary conditions than those
modeled in the single nail tests with a free panel edge Both test programs are summarized in the
following
21 Single Nail Facing Panel Tests
The single nail facing panel test program consisted of one calibration panel (cast-in-place
concrete) and five soil nail wall facing panel tests The single nail calibration test [4] was designed
and performed as shake-down test for the soil box test apparatus and the test instrumentation as
well as a first benchmark for the analytical model development The five production single nail
tests represented commonly encountered facing panel designgeometrysupport differences to
provide a representative behavior response variation for the analytical model calibration Variations
in the five production tests ranged from temporary shotcrete facings to a permanent (overlaid)
facing panels different dimensions of the anchor plate and different reinforcement types (ie with
and without waler bars) as well as differences in the support conditions to investigate different
failure modes An overview of all six single nail facing panel tests is provided in Table 1
The single nail facing panel test was designed to simulate realistic soil structure interaction
under the nail head but with free boundary condition along the panel edges to simplify testing and
test data interpretation This simplification is justified by the single nail test objective of analytical
3
FIG 3 Single Nail Facing Panel Test
FIG 4 Nine Nail Facing Panel Test
4
TABLE 1 Single Nail Facing Panel Test Matrix (15 x 15 m panels)
Anchor Plate Concrete
Test Panel Type Support Panel Reinforcement [A36] Strength
Specimen Condition Dimensions [mm] fc [MPa]
Shake- 100 mm compacted Grade 75 weldedmiddot Grade 276 Down Test precast soil wire mesh 60
6 X 6 W20 X 20 waler 13 X 200 X 200
bars
Production 100mm 2x 241 Test No1 temporary compacted 6 X 6 W21 X 21 13 X 200 X 200
shotcrete soil
Production 100 mm 4x 241 Test No2 temporary compacted 6 X 6 W21 X 21 - 25 X 200 X 200
shotcrete soil
Production 100mm 3x 241 Test No3 temporary compacted 6 X 6 W21 X 21 2 4 13 X 200 X 200
shotcrete soil ew
Production 100 mm shear ring 241 Test No4 temporary 06 m diam 6 X 6 W21 X 21 2 4 25 X 200 X 200
shotcrete ew
Production 100 mm 5x 241 Test No5 shotcrete compacted 6 X 6 W29 X 29 2 4 19 X 200 X 200 276
+200 mm soil + 6 300 mm in ew with 4 headed overlay
cast-in-overlay studs
place overlay
model calibration with subsequent more realistic (continuous) boundary conditions for the
parameter studies and the nine nail verification test
The geometry and dimensions of the single nail soil box are depicted in Fig 5 and details on
the design of the single nail facing panel test apparatus can be found in [4] The test sequence
consisted of ( 1) the construction of the shotcrete facing panels against plywood forms in the
vertical position (2) the placement of the panels on the compacted soil in the soil box (3) the
placement of the nail and nail head in the form of a high strength bar in a PVC sleeve and anchor
plate ( 4) the instrumentation with displacement transducers and soil pressure cells at strategic
panel locations (5) the testing of the panel by pulling the nailnail head against the facing panel (6)
the observation of the failure mode subsequent to the test and (7) the test data reduction and
reporting
5
Botton View
Front Elevo tlon
i
I ~
lt N 1pound) -__
bullo
I 1
t----tiGO [ 1524-mm]t----1
-v v
1 I 1 I
Top BottoM BeaM View w6x12
Top Edge BeaM L8x6x34
BottoM Pta te Top Edge BeaM L8x6x34
12 [127MM] thick
[7 Side BeaM w6xl2
Side Elevo tlon
l
ttI1 I
FIG 5 Geometry and Dimensions - Soil Nail Test Box
0
Side Plote 12 [12 7MM] thick
I
I
I I I
1 lt N 1pound) -
1
(mm)
0 8 16 24 32 40 48 180 BOO
160 720
e o Test 1 640 140 v v Test 2 3 c Test 3 t t Test 4 560
120 Q o Test 5
- 480 Ill
2lt 100 -~
400 ~ -tl - laquo 80 0
113 320
60 240
40 160
20 80
0 0 00 04 08 12 16 20
___ l~p_~cement (inches)
FIG 6 Nail Head Load vs Displacement Response Envelope
The single nail production tests [5] showed the following key response characteristics
1 The nail head load-deformation response of the temporary shotcrete facing panels (tests 1 2
and 3) was very ductile as can be seen from Fig 6 All three panels failed in a combined
flexural and punching shear failure
2 Panel 4 which was not supported by soil but by a 06 m 0 ring of elastomeric pads failed as
expected in punching shear at a nominal punching shear stress level of 025 [F [MPa] with
reference to the total facing panel thickness as will be discussed later However even in test
4 the nail load capacity stabilized with increasing panel deformations subsequent to an initial
capacity loss at the onset of the punching failure see Fig 6 due to membrane action in the
reinforcement under the nail head
3 The permanent (300 mm thick) facing panel showed the expected higher stiffness and nail load
capacity in Fig 6 but since the deformations were measured against the permanent facing
panel surface delamination between the temporary shotcrete facing and the permanent overlay
actually showed a reduction in panel deformation after the internal punching shear failure which
resulted in a potential failure mode without visual warning in the form of large facing panel
deformations a failure behavior which needs to be appropriately reflected in the design
guidelines
4 Facing panel nail line deformations depicted in Fig 7 clearly show the influence of added waler
bars anchor plate thickness panel thickness and soil reaction stiffness Since each subsequent
test compacted the soil in the single nail box more a direct comparison of test results needs to
consider this difference in soil reaction stiffness As can be seen from Fig 7 significant uplift
along the panel edges occurred in tests 1 and 3 where the soil compaction was at a minimum
Note that the tests 2 and 3 were not performed in sequence but rather test 3 before test 2
5 The soil reaction stiffness measurements in Fig 8 also show the continued compaction effect
from each test Furthermore since each single nail panel was placed in cured form in the soil
box and not shot against the soil an initial settlement or soft branch is noticeable in all soil
stiffness measurement At higher deformation levels for the panels where uplift of the corners
and panel edges occured Fig 8 also shows a softening branch at the end of the test which is
indicative of soil failure under the nail head This soil failure occurs only in cases where the
panel uplift no longer provides soil confinement Trilinear soil stiffness characteristics derived
from the single nail tests as part of the analytical model calibration are also depicted in Fig 8
8
(mm) -760 -570 -380 -190 0 190 380 570 760
20 50 1
0 o Test 1 40 15 v v Test 2 0 o Test 3 0 o Test 5 30
10
- 20 rn Ql 1 r 05 ()
= 10 -
J E = 00 Ql 0 E s _ Ql ()
tO -10 ~ -05
Cl -20
-10 -30
-15 -40
-20 -50 -30 -24 -18 -12 -6 0 6 12 18 24 30
Gage Distance from Center (inches)
FIG 7 Surface Displacement Profile 1 at 40 kips Concentrated Load
6 The failure modes in the temporary shotcrete facing panels loaded against soil can be
characterized as flexural-tension-shear failures which can be explained as follows First radial
flexural cracks originate from the nail head at the soil side of the facing panels Second a
concentric radial tension field develops around the nail head indicated by a circumferential crack
pattern see Fig 9 with radius around the nail head influenced by the relative soil and facing
stiffness Finally punching shear failure originating from the anchor plate and spreading with
an approximate 45 failure cone through the panel depth forms the third failure mechanism see
Fig 10 This sequence of three mechanisms as well as the membrane action provided by the
reinforcement and the support provided by the soil under the nail head all result in very large
deformations and noticeable distress prior to any significant capacity degradation which makes
the temporary shotcrete facing failure a very ductile failure mode On the other hand the above
discussed punching shear failure and delamination in the overlaid permanent facing panel
occurred without prior warning but at very high nail loads
7 Punching shear failures though not as brittle as discussed above were found to occur at
nominal shear stress levels of 025 Fc [MPa] when referenced to a nominal vertical failure
plane through the full panel depth where the 45deg punching cone originating from the anchor
plate intersects the center of the facing
22 Nine Nail Facing Panel Test
The nine nail facing panel test [6] was conducted as final validation test for the analytical
modeL The plan geometry of the nine nail test is depicted in Fig 11 with a 120 m nail spacing in
both directions The depth of soil was also 120 m based on St Venant s assumption of a uniform
stress state in a homogeneous medium
The facing panel construction differed from the single nail facing panel test in that the 100 mm
shotcrete panel was directly shot onto the sand filled box thus consolidating the sand during the
casting operation and ensuring good contact between the soil and the facing panel The nominal
concrete strength for the panel was 276 MPa but at the day of testing the actual concrete strength
was 50 higher The reinforcement of the 100 mm thick temporary facing panel consisted of 6 x
6 W29 x 29 welded wire fabric and 2 4 waler bars each way at each nail head line The anchor
plate dimensions were 19 x 203 x 203 mm
All nine nails were uniformly loaded through a common manifold up to the onset of punching
shear failure Subsequently the external nail loads were locked-off and kept constant while the
center nail (nail 5 Fig 11) was continued to be pulled through the facing panel
11
HG 9 IJistress Pattern at Top of Test Panel 2
HG 10 Punching Shea- Distress Patter-n at Bottom of T~st 1 Panel after Test
12
General observations from the nine nail test can be summarized as follows
1 The load-deformation behavior in general and for the center nail in particular was very ductile
as depicted in Fig 12 consistent with the observations from the single nail tests The
analytical prediction of the load-deformation behavior of the center nail head was offset from
the test results by the amount of the reduced initial soil stiffness as observed and implemented
based on the single nail test results However the different construction of the nine nail panel
by shotcreting against the soil eliminated this initial reduced soil stiffness phase Furthermore
the free panel perimeter edge still allowed some uplift whereas in the center nail vicinity
continuous confinement was provided to the soil by the facing panel Changing the trilinear
soil reaction stiffness characteristics used in the predictive model to linear characteristics but
with reduced stiffness towards the outer regions of the nine nail facing panel as shown in Fig
12 resulted in a diagnostic post-test analysis which correlated well with the experimental
results
2 The justification for the linear soil stiffness characterization was also provided by the soil
pressure measurements between nails 4 and 5 which are reduced to a pressuredeformation
relationship in Fig 13 for the center nail location The actual soil pressure profile between
nails 5 and 4 is depicted in Fig 14 for various nail load levels Note that after a nail load of
311 kN only the center nail 5 was loaded while all the other nail loads were kept constant
3 The crack pattern evolution in the nine nail test on the exposed side of the facing panel is
depicted in Fig 15 for various nail load levels The first visible cracks develop in the negative
moment regions between nail lines followed by circumferential tension cracks around the nail
heads and ultimately punching shear cracks originating from the anchor plate perimeter Thus
the sequential distress patterns are consistent with the fmdings from the single nail tests at
slightly higher nail loads due to the panel continuity The above described distress patterns are
also depicted in Fig 16 for the circumferential tension mechanisms and in Fig 17 for the
punching shear failures
4 Nominal punching shear stress levels as described for the single nail facing tests slightly
exceeded 04 -jf [MPa] for the center nail and were thus 15 x higher than for the single nail
tests which can be attributed to the higher soil capacities in the continuous panel case
13
12 (S868cm)
rmiddotmiddot [12Ultm] lt[12Uom]l
I
reg 3
r 6 reg 9
l I
4 [121 9cm]
9 2 + 9 8
- - - - 12 [3658cm]
I
J reg 1 ~ 4 reg 7
Scm)
Nor th I Sout h
FIG 11 Nail Head Location and Numbering
14
-Ul
(rrim)
0 10 20
100
90
80
70
60
50
40 160 kipsft 3
30
20
10
30 40
PCYCO reaulla 9-nall teaL precHcUon trllinear 1prlng model 00 -02 50 ldplfl-3 Ot -08 300 ldpbullft-3 08- 100 ldpsft-3
100 kipsft 3
50
450
400
350
300
200
150
100
50
0~~~~~~~~~~~~~--~~--~~--~~------~~r-~--rO
00 04 08 12 16 20 Displacement (inches)
FIG 12 Nail Head Load vs Displacement Response 9-Nail Test
-l
260
240
220
200
180
-160 bull-I Ill p
-- 140 QJ 1-t j Ill Ill QJ 1-t
0
120
100
80
60
40
0 200 400
~
(mm)
600 800 1000
1 20 kips 6696 kN 2 30 kips 1334 kN 3 40 kips 1779 kN 4 50 kips 2224 kN 5 60 kips 2669 kN 6 70 kips 3114 kN 7 BO kips 3559 kN B 076 Inch (193 mm) 9 102 kips (4542 kN)
1200 1400 1600 1800
16
bull bull 14
5 12
bull 4 bull
10
-08 ~
06
04
~1~~~~~ii~~ii~~~~~sectl~~~~~~~~~0
middot2
200j
00 0 12 24 36 48 60
Pressure Gage Location Measured from Center (inches)
FIG 14 Soil Pressure Gage Profile
72
a) Nail Load 30 kips
c) Nail Load 50 kips
b) Nail Load 40 kips
d) Nail Load Over 65 kips
FIG 15 Top Surface Crack Pattern
18
FIG 16 Top of Panel Final Distress Pattern
19
a) Punching Failure Top and Bottom of Panel
b) Crack Pattern and Imprint of Center Nail Punching Cone
FIG 17 Close-up of Facing Panel Failure Modes
20
3 THE ANALYTICAL INVESTIGATIONS
The analytical model development parameter studies and case studies are described in detail in
[2 3 7 and 8] and are summarized in reference to the above experimental program in the
following
31 Analytical Model Development
For the detailed nonlinear analysis of soil nail wall facing panels the computer code PCYCO
[2] was adopted since critical facing panel response limit states such as cracking of the concrete
yielding of the reinforcement crushing of the concrete etc can be modeled
PCYCO is the latest in a series of nonlinear analysis programs for structural concrete members
and systems developed at the University of California San Diego specifically for the prediction
and diagnostic of reinforced or prestressed concrete or masonry systems test performed at the
Powell Structural Research Laboratories The PCYCO program is a research tool and not a
production type program hence code clarity was chosen over program efficiency whenever it was
necessary
The plate or slab element in PCYCO which was used to model soil nail wall facings is a nineshy
node Lagrangean isoparametric flat shell element in which the concrete is represented as a layered
media and the steel reinforcement is overlaid and connected at the nodes by compatibility
requirements see Fig 18 The basic plate bending behavior is modeled after the Reissner-Mindlin
theory for shear deformable plates and the constitutive model for concrete is based on the
orthotropic model of Darwin and Pecknold as well as on the modified compression field theory by
Collins and Vecchio An object-oriented programming philosophy has been adopted in the
development of the PCYCO program This programming philosophy considers the element
kinematics independently of the material constitutive models As a result a researcher can develop
a new constitutive model which can be inherited by the existing element types Similarly a
researcher can create a new element type which can inherit any of the existing constitutive models
with minimal programming effort A common output data base ensures that element deformations
forces strains and stresses of a new element type can easily be incorporated into the existing postshy
processing programs
The following material nonlinearities can be considered (a) cracking of concrete (b) softening
and crushing of concrete (c) yielding and strain hardening of reinforcement steel (d) nonlinear
stress-strain behavior including the Baushinger effect (cyclic model only) (e) material anisotropy
21
I Ll_ I I x middotmiddot--middotmiddot--
ossible Deformation Mces
a) Nine Node Element
Integration
Stations
--Concrete
Layers
Reference
Plane
Steel Layers
b) Layering Through Element Depth
FIG 18 PCYCO Reinforced Concrete Flat Shell Element
(f) confmement effects in concrete (g) tension stiffening effect of reinforced concrete (after
cracking) and (h) prestressing effects on both steel and concrete These effects are introduced in
the analytical model through equivalent uniaxial orthotropic rotating constitutive relationships for
each individual concrete or steel layer The constitutive relationships for concrete and steel can
either be linear nonlinear elastic or nonlinear inelastic and fully cyclic The nonlinear elastic
constitutive models were chosen for the subsequent soil nail wall facing analyses
A preliminary model validation [3] 102 mm thick precast concrete single nail panel test [4]
showed that the characterization of soil springs supporting the facing panel in the form of a linear
elastic Winkler foundation needed some modifications to account for observed effects such as ( 1)
uplift along the free edge of the single nail panel (2) stiffening of the soil due to compaction during
the test and (3) softening of the spring support once the soil failure limit state is reached
First the linear elastic soil spring model see Fig 19a was replaced with an elastic linear
compression and tension gap model see Fig 19b for uplift simulation Then a bilinear
constitutive relationship for soil spring compression was introduced see Fig 19c followed by
refinement to a trilinear compression model to simulate the observed soil dislocation under the
loading area at high nail loads Finally to model possible permanent soil pressure states against
the back of the soil nail wall facing at higher wall depth a cut-off pressure correction in the form of
a baseline shift on the load in the soil spring model see dashed horizontal axis in Fig 19d was
introduced to the PCYCO program in direct support of the SSI (soil structure interaction) modeling
of a concrete facing under increasing nail loaddisplacement limit states
Based on load-deflection measurements in the single nail panel tests and parallel soil pressure
cell readings during the test both a calibration of the soil spring stiffness models described above
as well as a verification by direct comparison of the soil spring load-deformation behavior with the
pressure cell readings were performed
Analytical model discretizations used by both single and nine nail test analyses are depicted in
Fig 20 and show that due to symmetry of structure and loading only a quarter of each test panel
needs to be modeled with appropriate boundary conditions along the lines of synunetry allowing
vertical displacements and rotations perpendicular to the boundary line and no rotations about the
boundary axis
a) The Single Nail Tests
Subsequent to each single nail laboratory test [5]the trilinear spring stiffnesses were adjusted
such as to provide a close correlation with the observed load-deformation characteristics at the nail
23
p
a) Linear Base Model
p
Compression
Tens-ion
c) J~ilinear Compression and
Tension Gap Model
middotp
Tension
b) Linear Compression and
Tension Gap Model
p
cul-of I
A
A
sr~~---------_____________
Tension
d) Trilinear Compression and Tension
Gap Model with Same Line Shift
FIG 19 Elastic PCYCO 1-D Spring Model Development
24
X I t J3X5lmm 2x102mm 2x 203 mm I
~ steel OPICho plategt
bull noil position
a) Finite Element Mesh for the Single Nail Panels J
I 1 102 703 305 305 203 2x 10² 203 middot 305 t-1 __t-----t___-----lt---------t-1 c_middot ---t-1 middot ---tf___-+-1 --1
mrn
~ ~
~
I bullbull umiddotmiddot
~~ ~ ~
~ ~
b) Finite Element Mesh for Nine Nail Panel
FIG 20 Analytical 1lodel Discretizations
25
~ steel oncho- plote
e noil position
~
head This calibration was performed for single nail test 1 2 3 and 5 only since test 4
represented a punching shear test without soil support conditions or SSI
The analytical post-test load-deflection traces for tests 1 2 3 and 5 shown in Fig 21 are
in direct comparison to the experimentally observed nail head load-displacement curves The fact
that experimentally observed load-deflection curves can be traced after the test with the adjusted
analytical model is in-itself no statement of qualification for the analytical model It only shows
that the model has sufficient parameters and characteristics which allow a good trace to be
established However two additional conditions are very important to the model validation
namely (1) the fact that only soil spring stiffness were adjusted and measured material properties
for f = concrete strength fer= the cracking strength as determined from standard cylinder and
beam tests and fY = reinforcement yield based on bar pull tests or manufacturer supplied batch data
were used and not varied as part of the model calibration and that (2) measured soil pressures and
deflection profiles along the soil pressure cell line allowed for an independent experimental
verification of the analytically employed soil pressures or spring load vs deflection data as
depicted already in Fig 8 While the correlation in Fig 8 between experimental and analytical data
certainly could be improved the general soil spring behavior characteristics has been verified
Based on Figs 21 and 8 the validity of the trilinear model for the single nail facing panel tests was
established The trilinear break points in the soil spring stiffness are seemingly independent of soil
condition and correspond to nail head displacements of 51 mm and 152 mm respectively The
individual segment spring stiffnesses for the trilinear models listed in Fig 8 correspond exactly to
those used to generate the analytical traces in Fig 21
b) The Nine Nail Test
The calibrated analytical model was now used to predict the behavior of the nine nail test
already shown in Fig 12 in a true class A or pretest prediction in order to validate the analytical
tool prior to the detail parameter studies A 78470157 M~ trilinear soil spring model was m
adopted for the nine nail test assuming that the density and compaction of the soil would resemble
those of the first single nail test see Fig 8 test 1
A direct comparison of the class A prediction and the experimentally measured loadshy
deflection behavior at the center nail depicted in Fig 12 shows that the analytical model
consistently over-predicts displacements for a given nail load level On the other hand once the
initial soft spring stiffness up to a displacement of 51 mm is eliminated very close agreement
between experiment and analysis can be expected since it results effectively only in a lateral shift of
the analysis curve towards the origin by an amount equal to the displacement during the initial
26
(mm) middotmiddot-middot-middotmiddot ------- --- ----~---~ middot- middot-(mm ___
0 8 16 24 32 40 0 8 16 24 32 40 48 56 45 200 JO 400
40 a so 75
35 PCYCO results test I 150 30(
30 60 =oo~ middot middot middotmiddot middot Test2 (121894) 250
325
E wosect a 45 zoosect ~ 3 20 3 150
15 30
50 100 10
15 5 50
0 0 0 0 00 04 08 12 16 00 04 OB 12 16 20 24
Dloplocemenl (Inches) Dlpla~omenl (Inches)
a) Test 1 b) Test 2
--------- ~-- ---------
(rnm)
(mm)
N 0 8 16 24 32 40 48 56 00 10 20 30 40 50 60 70 80 90 100
-J 90 400 200 880 PCYCO results test 5
350 175 Test 5 (41995) 800 75
720 _Punching 300 150 Shear
Failure 640 60
250 125 560
145 zoosect J 480~ ~ 100 3
400 9 3 150
30 75 320
100 50 240
15 160 50 25
DO
0 0 0 04 08 12 16 20 24 000 010 020 030 040 050
Displacemenl (lnchos) Dlsplacemenl (Inches)
c) Test 3 d) Test 5 FIG 21 Nail Head Load vs Displacement Response Calibration
spring stiffness phase Finally the adopted zone model with three zones of linear elastic springs
as outlined in Fig 12 shows excellent agreement with the experimental results Since for the
center nail the center soil stiffness or confmement is of importance the linear center soil stiffness
of 34 MNm3 was plotted in Fig 13 together with the measured pressure cell data in the center nail
vicinity as well as with the original soil stiffness model used in the prediction Very close
agreement between the linear 34 MNm3 selected soil spring stiffness and the measured pressure
cell data exists and can certainly be viewed as a very important validation of the developed PCYCO
soil nail wall facing SSI model
32 Analytical Parameter Studies
The objective of the parameter study was to identify the influence of parameter variations on the
load-deflection behavior at the nail head All parameter variations occurred within realistic
prototype bounds of actual soil nail wall facing properties In order to evaluate the influence of
each individual variable only one parameter at a time was adjusted and its influence on the soil nail
facing behavior analyzed with respect to a common baseline case
This baseline case assumed the dimensions reinforcement ratios and design material
properties listed in Table 2 for a representative temporary shotcrete wall facing and a 153 m nail
spacing Parameters investigated can be grouped in five general categories of (1) soil (2) facing
panel (3) bearing plate (4) reinforcement and (5) concrete properties
Other parameters and constants used in the analytical model which were not subject to the
parameter study reflect basic material characteristics for concrete and reinforcement as obtained
from the tests The concrete cracking strength fer was always taken as 10 of the nominal
compressiOn strength f~ the concrete modulus was evaluated following ACI 318 standard
procedures
Since for the soil structure interaction analysis the soil characteristics clearly have a dominant
effect four separate soil related parameters were investigated namely the subgrade reaction
coefficient related to the soil density the load-deformation behavior of the soil approximated by a
linear bilinear or trilinear relationship the diameter of the grout column around the nail from overshy
drilling or break-out of soil in the nail head vicinity and finally a permanent cut-off soil pressure
behind the wall facing panel The influence of facing panel geometry captured by the two
parameters of facing panel thickness and soil nail spacing were also investigated The steel bearing
plate size was varied both in thickness and square side dimensions in the form of a linear elastic
overlay element in the plate region Finally variations in material quantities and properties were
28
evaluated by adding to the standard baseline 6 x 6 W 21 x 21 welded wire mesh two waler bars
in both directions ranging from 4 to 6 in reinforcement size
Two different edge boundary conditions were investigated for each of the parameter studies
namely a free edge and a clamped edge condition with rotational constraints or fixity against
rotations about the panel edges The first or free boundary condition was the one used in the single
nail experiments [5] and does not represent realistic field conditions except at the edges or corners
of soil nail walls whereas the clamped edge condition again based on symmetry relationships
reflects prototype conditions in a continuous multi nail wall of infinite dimensions under uniform
loading conditions
TABLE 2 Baseline Panel Properties and Parameter Range
PARAMETER BASELINE PARAMETER MODEL RANGE
Subgrade Reaction k 267 ~ 157 - 376 ~~ Coefficient m m
Stiffness Variation D trilinear linear bilinear trilinear
SOIL Grout Column D 203 mm 0-406 mrn Diameter
Permanent Soil pcut-off 0 kPa 0-287 kPa Pressure
Facing Thickness tslab 102 mm 102-203 mrn
FACING Soil Nail Spacing snail 153 m 122- 183 m PANEL
Finite Element FR M5 M4M5M6 Discretization
BEARING Plate Thickness tplate 19 mm 127 - 318 mm
PLATE bplate 203 x 203 mm Plate Size 102 x 102 mm 305 x 305 mm
REINFORCE Welded Wire Fabric wmesh I 6 X 6 w 21 X 21 none
-MENT 24 24-26 WalerBars ff
CONCRETE Design Compression f 276 MPa 207 - 345 MPa c Strength
29
The above outlined parameters were investigated subsequently by individually varying one of
them through the range indicated in Table 2 always starting with the reference baseline case A
total of eight groups of parameter studies were performed and are labeled in the following with A
through H representing
A Grout Column Diameter Variations
B Soil Stiffness Characterization
C Permanent Cut-off Pressure Influence
D Effects of Bearing Plate Dimensions
E Moment Capacity or Reinforcement Ratio Variation
F Facing Thickness Variation
G Concrete Strength Influence
H Soil Nail Spacing Variations
Results from the above parameter studies are graphically depicted in Fig 22A-H
Parameter studies have shown that the nail load or facing capacity is most influenced by the
facing panel thickness by the bearing plate size and the soil stiffness assumptions whereas soil
model variations reinforcement ratios and soil nail spacings primarily affect the deformation states
and not so much the nail loads The evaluated shear stress indicators as multiples of jf showed
the largest dependence on the assumed grout column diameter and on the actual concrete
compression strength Single nail tests showed that punching shear failures are possible when the
shear indicators exceed the parameter studies clearly indicate for which of the investigated
parameter variations and parameter combinations this punching shear failure scenario becomes
more likely For example low concrete strength combined with a large grout column can quickly
result in a punching shear failure mode However both test and analyses clearly showed that
punching shear does only occur at large deformation states and is preceded by significant inelastic
flexural action in the form of cracking yielding and large relative facing panel deformations which
will provide significant warning prior to punching shear failure at least in thin temporary shotcrete
facings
33 Analytical Case Studies
The same analytical model with the exception of linear tension gap springs instead of trilinear
springs was employed for case studies on representative soil nail wall facing designs which are
presented in the following In addition to the twelve case studies the effects of different
reinforcement ratios both uniformly distributed and concentrated along nail head strips on the nail
30
700
_600 rn 0
2 -500 t1 ttl
I 0 J 400 CC QJ
J e 3oo
J
= ~
~ 200 0 u
100
Note Numbers indicate nominal shear stress in terms of nbullsqrt(fc)
middot~Dia = 0 in IHgt-ampampltl Di a = 4 in -- Dia = 8 in (Baseline) _ Dia = 12 in ~Dia = 16 in
00 ~------r------------r---~-~
700
600 -rn 0
2 -500 d ttl
s 400 CC
QJ J
~ 300 J
= Q)
g 200 0 u
100
00
00 00
01 02 03 04 05 06 07 08 09 Displacement Under Concentrated Load (inches)
a) Grout Column Parameter Study (Multi Nail) A
Note Numbers indicate nominal shear middotstress in terms of nbullsqrt(fc)
= 100 kef = 170 kef (Baseline) = 240 kef
01 02 03 04 05 06 07 08 09 Displacement Under Concentrated Load (inches)
bl) Soil Stiffness Parameter Study Bl
FIG 22 Soil Nail Facing Parameter Study
31
10
10
__ _ - ---~--- --- middotmiddotmiddot---~~--~~~- ----- --middot-middotmiddot ---
700 ---------------------~------------------------~
-rn Q
600
2 -500 d cd
3 400 d
Q) -+-) e 3oo -+-)
Q)
~ 200 0 u
100
Note Numbers indicate nominal shear stress in terms of nbullsqrt(fc)
~ Linear Soil Model ampe-e-a-pound~ Bilinear Soil Model -- Trilinear Soil Model
00 ~--~---~---------r-----r--~~-~ 00 01 02 03 04 05 06 07 08 09
Displacement Under Concentrated Load inches
b2) Soil Model Parameter Study B2
10
700 ~------------~-----~---------
-rn Q
600
2 -500 d cd
3 400 d
Q) -+-) e 3oo -+-)
Q)
~ 200 0 u
100
Note Numbers indicate nominal shear stress in terms of nbullsqrt(fc)
-- P = 0 psf (Baseline) ~ P = 300 psf ltgt-ltgt-e-a-lt~ P = 6 0 0 p sf
00 4L~-~-~~--~~~------------------~ 00 01 02 03 04 05 06 07 08 09
Displacement Under Concentrated Load inches
c) Soil Cut-off Pressure Parameter Study C
FIG 22 Soil Nail Facing Parameter Study (continued)
32
10
700 -----------------------~------------------~--~
_soo Ill ~ g
--500 d 10
s 400 d Cl) e 3oo = Ql
g 200 0 u
100
Note Numbers indicate nominal shear stress in terms of nsqrt(fc)
~ Bearing Plate Thickness = 12 in --- Bearing Plate Thickness = 34 in (Baseline) ~ Bearing Plate Thickness = 1 in - Bearing Plate Thickness = 1 14 in
0 0 +-----------+--------------------------------------1 00 01 02 03 04 05 06 07 08 09
Displacement Under Concentrated Load (inches)
dl) Bearing Plate Thickness Parameter Study Dl
10
600 --------------~------------~--
-Ill ~
700
middot~ 600 -d ~ 500
I
g 400 Ill Jlt
~ 300 Cl)
0
sect 200 u
100
I I
~-------~-----~--
G-EHHHgt 4 x 4 in Bearing Plate 8 X 8 in Bearing Plate (Baseline
12 x 12 in Bearing Plate
00 ~~--r-~~--~~~--~~----r-~---r-~-----r~~ 00 01 02 03 04 05 06 07 06 09
Displacement Under Concentrated Load (inches) -~---middotmiddotmiddotmiddotmiddotmiddotmiddot ~~-~-middot-------
d2) Bearing Plate Size Parameter Study D2
FIG 22 Soil Nail Facing Parameter Study (continued)
33
10
600 -----------------------~--------------~--------
--500 A
a -C 400 IS
) 3 -g 300 ~ IS
~ ~ 200 ~
d 0 u
100
Note Numbers indicate nominal shear stress in terms of nbullsqrt(fc)
--- 2 4 middotWaler Bars irho=025~~ (Baseline) lHrlrlirio 2 5 Waler Bars middot rho=035lil ~ 2 6 Waler Bars rho=046~
00 4L-r~-----r---------------------~
-I) A ~ -C IS
s C Q) ~
~ d Q) ~
1= 0 u
00
1000
900
BOO
700
600
500
400
300
200
100
00 00
01 02 o3 04 os 06 07 oa o9 Displacement Under Concentrated Load (inches)
e) Yield Moment Parameter Study E
Note Numbers indicate nominal shear stress in terms of nbullsqrt(fc)
--- Thickness = 4 in (Baseline) ~ Thickness = 6 in Thickness = B in
10
01 02 03 04 05 06 07 OB 09 10 Displacement Under Concentrated Load (inches
f) Slab Thickness Parameter Study F
FIG 22 Soil Nail Facing Parameter Study (continued)
34
--- 500 p
- 400 ca 0
I
-g 300 ca b sect 200 CJ ~ 0 u
100
Note Numbers indicate nominal shear stress in terms of nbullsqrt(fc)
CHHHH) fc = 3000 psi -- fc = 4000 psi (Baseline) ~ fc = 5000 psi
00 ~~--r-~~--~~~--------------------__ 00
600
--- 500 ~
~ - 400 ca 0
I
~ 300 tl1
1-o
sect 200 CJ ~ 0 u
100
01 02 03 04 05 06 07 08 09 Displacement Under Concentrated Load (inches)
g) Concrete Strength Parameter Study G
10
4~ 4
Note Numbers indicate nominal shear stress in terms of nbullsqrt(fc)
~ 4 ft Soil Nail Spacing 5 Ct Soil Nail Spacing (Baseline)
6 ft Soil Nail Spacing
00 ~-----~--~-+--r----r-~----~--~~--~-r--r-~--~ 00 01 02 03 04 05 06 07 08 09
Displacement Under Concentrated Load (inches)
h) Nail Spacing Pressure Parameter Study H
FIG 22 Soil Nail Facing Parameter Study (continued)
35
10
head load-deformation response were investigated to demonstrate the complex interaction between
facing stiffnesscapacity and the Winkler spring simulation of the soil loading
A total of twelve case studies of representative soil nail wall facing designs were investigated
half of them for typical 102 mm temporary shotcrete facings and the other half for 203 mm
permanent shotcrete or cast-in-place wall facings All analyses were based on a 183 m typical nail
head module in both directions with other constant design parameters listed in Table 3
The six temporary shotcrete facing cases had nail head plates of 203 mm square dimensions
with a 19 mm plate thickness effective soil reaction moduli varying between 94 MNm3 and 376
MNm3 and total reinforcement ratios referenced to the 183 m x 102 mm facing cross-section of p = 0222 and 0465 including both uniformly distributed welded wire fabric and waler bars in
the nail head strips
The 203 mm thick permanent shotcrete or cast-in-place wall facing case studies were based in
addition to the constant case parameters in Table 3 on 229 mm square and 25 mm thick nail head
plates Reinforcement for the permanent facings consisted of 3 waler bars along the nail head
strips and uniformly distributed mild reinforcement on a 305 mm spacing in both directions with
overall reinforcement ratios of p = 0313 and 0484
A summary of all twelve case study parameter variations is provided in the case study
pafameter matrix in Table 4 Results from the individual case studies are summarized in the
following in the form of nail head load versus nail head deflection relationships All analyses
were performed for continuous facing panels with the 183 m nail spacings in both directions
TABLE 3 Constant Reference Case Parameters
Concrete Properties f 276 MPa
Facing Materials waler bars fy 455MPa Steel Properties wire fabric fy 517 MPa
Cutoff Pressure P c 287 kNm Soil Properties
Grout Column Diameter DGC 203mm
Headed-Stud Spacing SHs 152mm
Headed-Stud Body Diameter dHs 19mm ij
Nail Head Parameters Headed-Stud Head Diameter dH 32mm
Cover to Headed Stud CHs 51mm
Cover to Plate CPL Omm
Nail Spacing S 152mm
36
TABLE 4 Case Study Parameter Matrix
Case Facing Plate Plate Soil Waler at Reinforce-Thickness Width Thickness Effective Steel Steel ment
hp bPL tPL ks Ratio (mrn) (Iniii) (mrn) (MNm3
) 0 () 1 102 203 19 94 2-4 W20-6x6
2 102 203 19 188 2-4 W20-6x6 0222
3 102 203 19 376 2-4 W20-6x6
4 102 203 19 94 2-5 W40-4x4
5 102 203 19 188 2-5 W40-4x4 0465
6 102 203 19 376 2-5 W40-4x4
7 203 229 25 94 3-4 1 4 reg 12
8 203 229 25 188 3-4 4 12 0313
9 203 229 25 376 3-4 4 12
10 203 229 25 94 3-5 5 12
11 203 229 25 188 3-5 5 12 0484
12 203 229 25 376 3-5 5 12
The load-deflection response for the temporary shotcrete facing panels with 102 mrn thickness
is depicted in Fig 23 for different reinforcing patterns and soil reaction coefficients As can be
seen from the response analyses in Fig 23 the soil reaction coefficient has a significant influence
on the nail headfacing capacity Furthermore the facing panel capacity clearly seems to increase
with increasing reinforcement ratios which is somewhat contradictory to the findings in the initial
analytical parameter study [7] However more than doubling the overall reinforcement ratio from
0222 to 0465 increases the nail load capacity at a nail head displacement of 203 mm by only
20 to 30 for the different soil reaction coefficients which is still significantly less than would
be expected from the simplified assumption that a doubling of the reinforcement amount should
also approximately double the facing capacity
The load-deflection response characteristics obtained from the permanent facing case studies
are depicted in Fig 24 for reinforcement ratios of p = 0313 and 0484 respectively Again
the influence of the soil reaction coefficient was very pronounced particularly at the lower
deformation limit states ie nail head displacements of 102 mrn or less whereas subsequent to
the onset of reinforcement yielding and first concrete crushing this influence of the soil reaction
coefficient seemed to diminish
37
Increases in the reinforcement ratio by a factor of 04840313 = 155 resulted in nail head
capacity increases at the 203 rnrn nail head displacement limit state of only 75 to 15 with the
larger increases for the lower soil reaction coefficients Again this capacity was less than expected
based on the increase in overall reinforcement ratio
To investigate the reasons for this observed behavior further additional parametric studies
were performed where the parameter variations consisted of the reinforcement ratio and the
reinforcement distribution as will be explained in the following
The first set of parameter studies into the influence of the facing reinforcing patterns addressed
a baseline case of a temporary 102 rnrn shotcrete facing with a W 20 - 6 x 6 mesh and a soil
reaction coefficient of 376 MNm3 all other variables are as defined in Tables 3 and 4 The
parameter variations consisted of 2 waler bars in each direction in the form of 2 3 2 4 2 5 and
2 6 grade 60 bars resulting in overall reinforcement ratios between 016 and 039
The resulting load-deflection response at the nail head is depicted in Fig 25a for all four cases
and shows that reinforcement amount changes in the form of waler bars or strip reinforcement have
very little effect on the load-deformation characteristics of the facing panels At the 20 rnrn nail
head displacement limit state only a 10 increase in nail head capacity can be observed over the
depicted reinforcement ratio range
Using instead of concentrated reinforcement along the nail head lines in the form of waler
bars only distributed reinforcement amount variations as depicted in Fig 25b a wider range of
load-deflection response curves is obtained with an increase of around 20 in load capacity at the
20 rnrn nail head displacement limit state over the same reinforcement ratio range of 015 to
04 Thus the influence of the reinforcement distribution had a greater effect on the facing
capacity than the reinforcement amount The same findings were obtained for similar case studies
in 8 in (203 rnrn) permanent facing panels
Explanations for the observed behavior can be found in the facing panel deformation profiles
and the interaction between the facing panels and the soil reaction springs The soil spring
stiffnesses and the reinforcement distribution together with the resulting deformation profile
changes have a significantly larger influence on the nail head facing capacities than the overall
reinforcement amounts
38
~
m p
700
2 600 -d Ill 500 0 ~
] 400 Ill
- 300 Q) 0 ~ 0 200 u
100
00 00
~
m p
BOO
700
2 600 -d laquo 500 0 ~
] 400 ~
~ 300 Ql
0
sect 200 u
100
a)
00 00
Soil Stiffness
middot---- k= GO kef -- k= 120 kef - - - k= 240 kef
shy
Case 3
- ----
Facing Thickness = 40 inches Plate Width = 80 Inches
Plate Thickness = 075 inches Waler Steel = 2 4 MeshMat Steel = W20-6x6
01 02 03 04 05 06 07 08 09 Displacement Under Concentrated Load (inches)
Nail Head Load-Deflection Behavior Cases 1 to 3
Soil Stiffness
middotmiddot--- k= GO kef -- k= 120 kef - - - k= 240 kef --- Case 5
bullbullbullbullbullbullbull -middotmiddotmiddotmiddotmiddotmiddot Case 4
-middot -middot middot middotmiddot
-middot -middot --
middot Facing Thickness = 40 inches Plate Width = 60 inches Plate Thickness = 075 inches Waler Steel = 2 5 MeshMat Steel = W40-4x4
01 02 03 04 05 06 07 08 09 Displacement Under Concentrated Load (inches)
--middot----middotmiddotmiddotmiddotmiddot-----
10
b) Nail Head Load-Deflection Behavior Cases 4 to 6
FIG 23 Temporary Facing Panel Case Studies
39
2000
1800 -- ~ 1600
1400 C1
~ 1200 I
C1 1000 Q) cd 800 a Q)
600 ()
Q 0 u 400
200
00
1800 -- amp 1600
-1400 C1
~ 1200 I
~ 1000 cd ~ 000 Q Q)
() 600 1 0 u 400
200
00
a)
Soil Stiffness
middot---- k= 00 kcC -- k= 120 kef bull - - k= 240 kef
middotmiddot ---middot _ -
I
Case 9 ~-
~--~Case 8
Case 1
Facing Thickness = 60 inches Plate Width = 90 inches Plate Thickness = 100 inches Waler Steel = 3 14
middot MeshMot Steel = 4- at 12 inches
01 02 03 04 05 06 07 08 09 10 Displacement Under Concentrated Load (inches)
Nail Head Load-Deflection Behavior Cases 7 to 9
Soil SlifncS9 Case 12
middot---- k= 00 kef -- k= 120 kef bull - - k= 24 0 kef
_ -middotmiddotmiddotmiddotmiddotmiddotmiddotmiddotmiddotmiddotmiddotmiddot
~-~
____ _
bullbullbullbull -middot Case 10
F11cing Thickness = 00 incl1e11 Plate Width = 90 Inches Plate Thickness = 100 inches Walcr Steel = 3 84 MeshMol Sleel = It at 12 Inches
00 4-~~-----~----------------------~ 00 01 02 03 04 05 06 07 00 09
Displacement Under Concentrated Load (inches)
b) Nail Head Load-Deflection Behavior Cases 10 to 12
FIG 24 Permanent Facing Panel Case Studies
40
10
1000
900 -[] 800 0 a - 700 d Ill
600 0 l
0 500 QJ _ Ill
400 _ ~ QJ omiddot 300 a 0 u
[]
0
~
d Ill 0
l
d QJ _ Ill
_ ~ QJ (J
~ 0 u
200
100
00 00
1000
900
800
700
600
500
400
300
200
100
00 00
Baseline Properlies
Facing Thickness = 40 inches Plale Widlh = 110 inches Plale Thickness = 075 Inches K = 240 kd
Case A - 2~3 Wnler Bars irho = 016111 Case B - 2 4 Wnler Bars rho = 02211 Case C - 2 5 Wnler Bars rho = 030Z Case D - 2 6 Walcr Bars rho = 03~
W20x20 - 6x6 Mesh Cut-off Pressure = 06 Ksr
01 02 03 04 05 06 07 08 09 10 Displacementmiddot Under Concentrated Load (inches)
a) Strip Reinforcement
I I Distributed Reinforcement p = p~
Focing Thickness = 40 inches Plate Width = llO inches Plate Thickness = 075 Inches K = 240 kef
Cul-off Pressure = 00 Ksf 04l1
01 02 03 04 05 06 07 06 09 10 Displacement Under Concentrated Load inches)
b) Distributed Reinforcement
FIG 25 Reinforcement Ratio Effect on Nail Head Load-Deflection Behavior
41
4 SUMMARY AND CONCLUSIONS
In direct support of the FHW A demonstration project DP-1 03 and the development of I
cmhprehensive and rational limit state design models for soil nail walls the influence of parameter ~
variations on the response behavior of soil nail wall facing panels was investigated
i
i The parameter studies were performed with a specially developed nonlinear finite element
model which can capture material nonlinearities in the shotcrete or cast-in-place soil nail wall facing I
as ~ell as in the supporting soil reactions thus modeling the complex nonlinear soil structure
interaction
The analytical model was calibrated with test results from six full-scale single nail tests
conducted in a specially designed and constructed soil box and verified by means of a full-scalemiddot
nine nail facing panel test The model validation was achieved with direct measurements of the soil I
pressure under the facing panel and a one-on-one comparison with pressure or soil reaction
stiifness values used in the analytical model Results from both the analytical model and the full- scale experiments showed that for typical temporary shotcrete facing panels very ductile failure
modes can be expected due to membrane action in the reinforcement and direct soil support under J
potential punching shear cones Thus failure mechanisms with significant warning through large
deformations prior to capacity loss are likely Only in overlayed permanent walls this large
deformation warning is lost since punching and delamination of the temporary facing panel can
occur behind the permanent wall facing without any visible signs of distress The analytical
parameter studies furthermore showed that the nail load or facing capacity was most influenced by
the facing panel thickness the bearing plate size and the soil stiffness assumptions whereas
rei~forcement ratios and nail spacings primarily affected the deformation states to the highly
cm1pled soil structure interaction effect
j Case studies with common design details encountered in soil nail wall projects reconfirmed
th~se findings and can now be used as the basis for detailed design model developments in direct
SU]Jport ofFHW A demonstration project DP-103
42
-middotmiddotmiddotmiddot---
[1]( I~
[3]li i
[4] ~
[51]
REFERENCES
FHW A Soil Nail Wall Demonstration Project DP-103 Design Manual Goldermiddot
Associates Inc Redmond Washington Dec 1995
Ktirkchtibasche AG and Seible F PCYCO - Program for Cyclic Analysis of
Concrete Structures User Reference Guide Structural Systems Research Project
University of California San Diego Report No TR-9407 January 1994
Predictive and Diagnostic Analysis Model for Soil Nail Wall Facings - Single Nail Facing
Calibration SEQAD Consulting Engineers Report No 9410 to CH2M Hill Denver
October 1994
Seible F Ellery M and Latham CT Single Nail Facing Calibration Test Structural
Systems Research Project University of California San Diego Test Report No TR-
9403 October 1994
Seible F Ellery M and Kugler A Soil Nail Walls- The Single Nail Facing Panel
Test Program Structural Systems Research Project University of California San Diego
Test Report No TR-9502 August 1995
[6]1 Seible F Ellery M and Kugler A Soil Nail Walls - The Nine Nail Facing Test i
Program Structural Systems Research Project University of California San Diego Test
Report No TR-9503 May 1995
Analytical Parameter Study of Soil Nail Wall Facing Response SEQAD Consulting
Engineers Report No 95111 to CH2M Hill Denver August 1995
Analytical Case Study of Soil Nail Wall Facing Response SEQAD Consulting Engineers
Report No 9513 to CH2M Hill Denver November 1995
43
ACKNOWLEDGMENTS
The described research was made possible with funding from the Federal Highway
Administration (FHW A) under Demonstration Project DP-1 03 and the superb and relentless
leadership guidance and prodding by Ron Chassie FHW A Portland Oregon and Jim Keeley
FHW A Denver Colorado
The steering committee for the project which contributed invaluably with their discussions and
questions to the experimental and analytical program consisted of John Byrne Golder Associates
Redmond Washington Ron Chassie FHW A Portland Oregon Jim Keeley FHW A Denver
Colorado Bob Mast ABAM Federal Way Washington Jim Moese Caltrans Sacramento
California Larry Reasch CH2M Hill Denver Colorado and Chris W olschlag Golder
Associates Redmond Washington
44
--
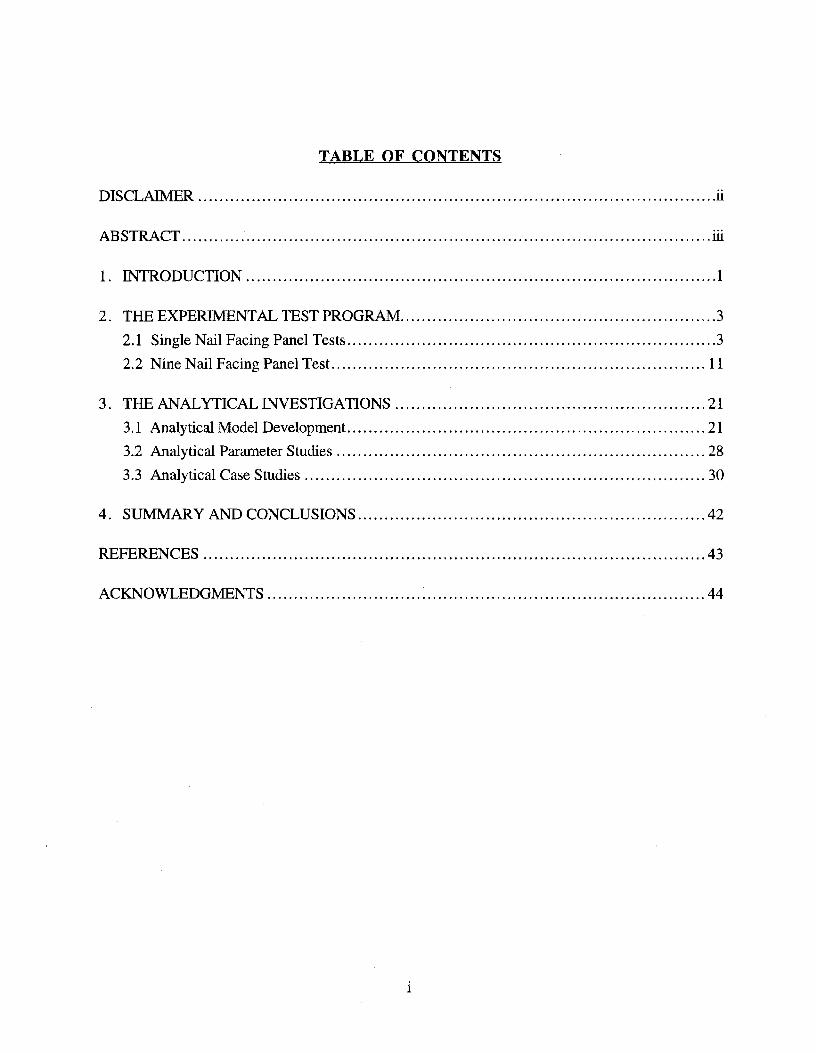
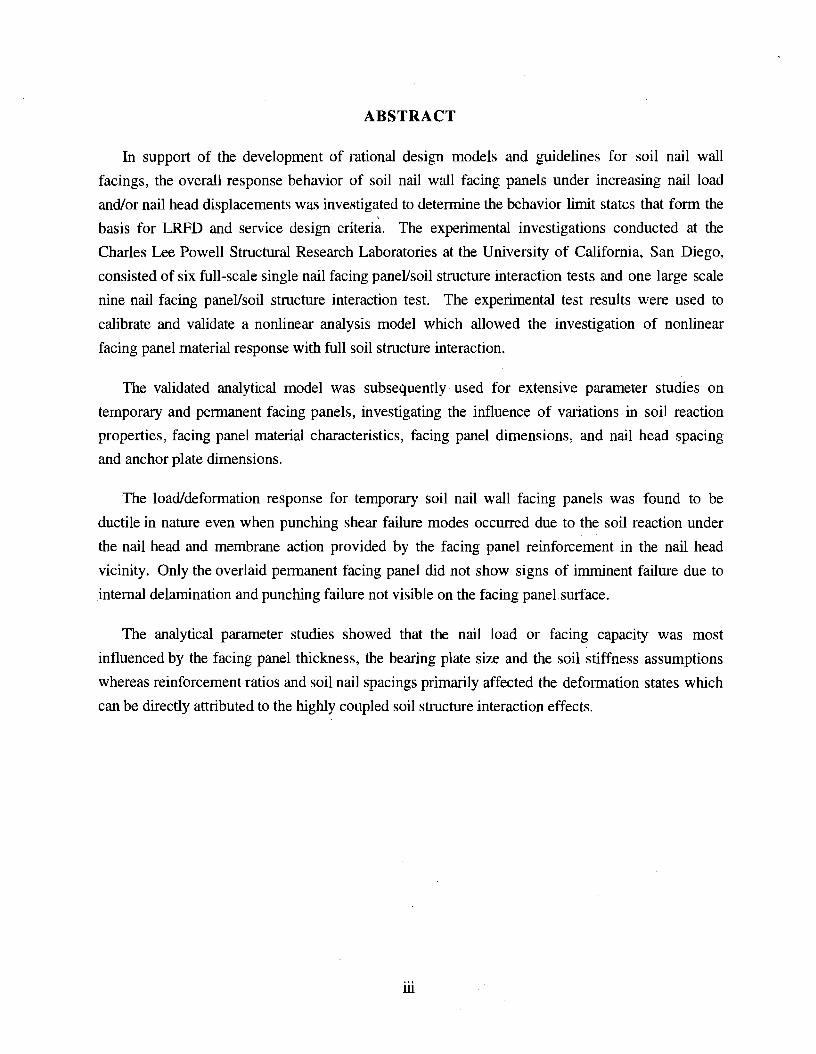
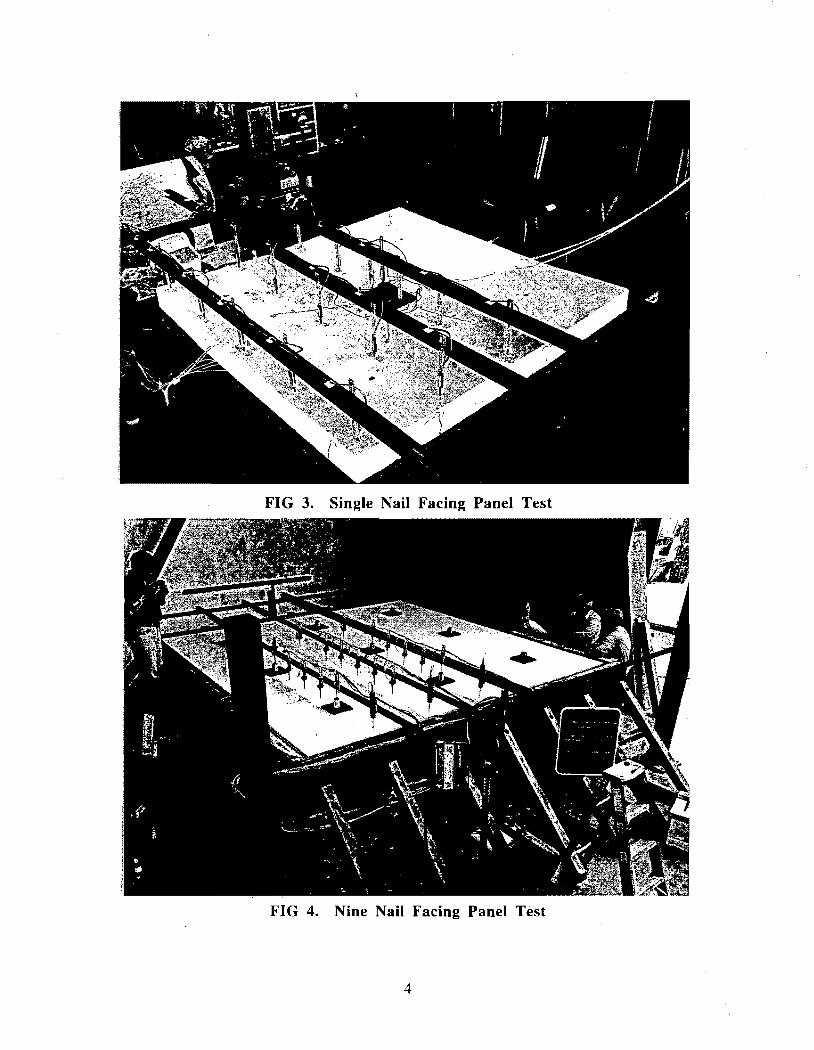
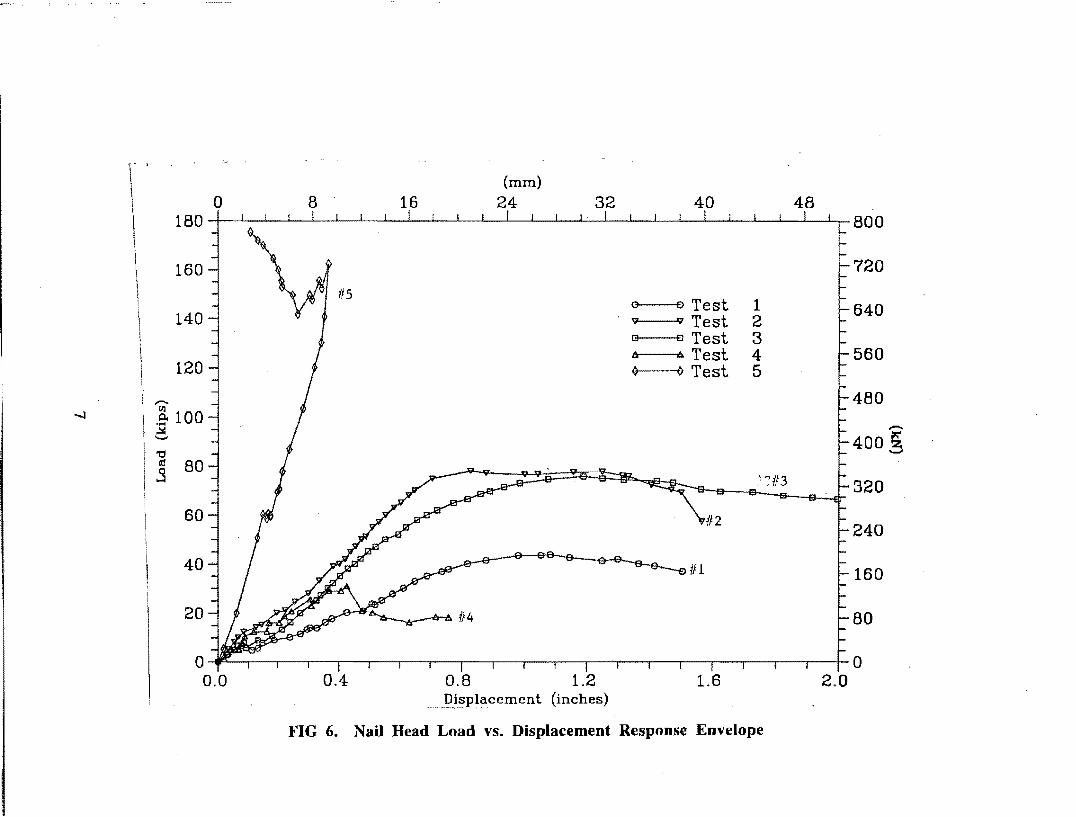
(mm)
0 8 16 24 32 40 48 180 BOO
160 720
e o Test 1 640 140 v v Test 2 3 c Test 3 t t Test 4 560
120 Q o Test 5
- 480 Ill
2lt 100 -~
400 ~ -tl - laquo 80 0
113 320
60 240
40 160
20 80
0 0 00 04 08 12 16 20
___ l~p_~cement (inches)
FIG 6 Nail Head Load vs Displacement Response Envelope
The single nail production tests [5] showed the following key response characteristics
1 The nail head load-deformation response of the temporary shotcrete facing panels (tests 1 2
and 3) was very ductile as can be seen from Fig 6 All three panels failed in a combined
flexural and punching shear failure
2 Panel 4 which was not supported by soil but by a 06 m 0 ring of elastomeric pads failed as
expected in punching shear at a nominal punching shear stress level of 025 [F [MPa] with
reference to the total facing panel thickness as will be discussed later However even in test
4 the nail load capacity stabilized with increasing panel deformations subsequent to an initial
capacity loss at the onset of the punching failure see Fig 6 due to membrane action in the
reinforcement under the nail head
3 The permanent (300 mm thick) facing panel showed the expected higher stiffness and nail load
capacity in Fig 6 but since the deformations were measured against the permanent facing
panel surface delamination between the temporary shotcrete facing and the permanent overlay
actually showed a reduction in panel deformation after the internal punching shear failure which
resulted in a potential failure mode without visual warning in the form of large facing panel
deformations a failure behavior which needs to be appropriately reflected in the design
guidelines
4 Facing panel nail line deformations depicted in Fig 7 clearly show the influence of added waler
bars anchor plate thickness panel thickness and soil reaction stiffness Since each subsequent
test compacted the soil in the single nail box more a direct comparison of test results needs to
consider this difference in soil reaction stiffness As can be seen from Fig 7 significant uplift
along the panel edges occurred in tests 1 and 3 where the soil compaction was at a minimum
Note that the tests 2 and 3 were not performed in sequence but rather test 3 before test 2
5 The soil reaction stiffness measurements in Fig 8 also show the continued compaction effect
from each test Furthermore since each single nail panel was placed in cured form in the soil
box and not shot against the soil an initial settlement or soft branch is noticeable in all soil
stiffness measurement At higher deformation levels for the panels where uplift of the corners
and panel edges occured Fig 8 also shows a softening branch at the end of the test which is
indicative of soil failure under the nail head This soil failure occurs only in cases where the
panel uplift no longer provides soil confinement Trilinear soil stiffness characteristics derived
from the single nail tests as part of the analytical model calibration are also depicted in Fig 8
8
(mm) -760 -570 -380 -190 0 190 380 570 760
20 50 1
0 o Test 1 40 15 v v Test 2 0 o Test 3 0 o Test 5 30
10
- 20 rn Ql 1 r 05 ()
= 10 -
J E = 00 Ql 0 E s _ Ql ()
tO -10 ~ -05
Cl -20
-10 -30
-15 -40
-20 -50 -30 -24 -18 -12 -6 0 6 12 18 24 30
Gage Distance from Center (inches)
FIG 7 Surface Displacement Profile 1 at 40 kips Concentrated Load
6 The failure modes in the temporary shotcrete facing panels loaded against soil can be
characterized as flexural-tension-shear failures which can be explained as follows First radial
flexural cracks originate from the nail head at the soil side of the facing panels Second a
concentric radial tension field develops around the nail head indicated by a circumferential crack
pattern see Fig 9 with radius around the nail head influenced by the relative soil and facing
stiffness Finally punching shear failure originating from the anchor plate and spreading with
an approximate 45 failure cone through the panel depth forms the third failure mechanism see
Fig 10 This sequence of three mechanisms as well as the membrane action provided by the
reinforcement and the support provided by the soil under the nail head all result in very large
deformations and noticeable distress prior to any significant capacity degradation which makes
the temporary shotcrete facing failure a very ductile failure mode On the other hand the above
discussed punching shear failure and delamination in the overlaid permanent facing panel
occurred without prior warning but at very high nail loads
7 Punching shear failures though not as brittle as discussed above were found to occur at
nominal shear stress levels of 025 Fc [MPa] when referenced to a nominal vertical failure
plane through the full panel depth where the 45deg punching cone originating from the anchor
plate intersects the center of the facing
22 Nine Nail Facing Panel Test
The nine nail facing panel test [6] was conducted as final validation test for the analytical
modeL The plan geometry of the nine nail test is depicted in Fig 11 with a 120 m nail spacing in
both directions The depth of soil was also 120 m based on St Venant s assumption of a uniform
stress state in a homogeneous medium
The facing panel construction differed from the single nail facing panel test in that the 100 mm
shotcrete panel was directly shot onto the sand filled box thus consolidating the sand during the
casting operation and ensuring good contact between the soil and the facing panel The nominal
concrete strength for the panel was 276 MPa but at the day of testing the actual concrete strength
was 50 higher The reinforcement of the 100 mm thick temporary facing panel consisted of 6 x
6 W29 x 29 welded wire fabric and 2 4 waler bars each way at each nail head line The anchor
plate dimensions were 19 x 203 x 203 mm
All nine nails were uniformly loaded through a common manifold up to the onset of punching
shear failure Subsequently the external nail loads were locked-off and kept constant while the
center nail (nail 5 Fig 11) was continued to be pulled through the facing panel
11
HG 9 IJistress Pattern at Top of Test Panel 2
HG 10 Punching Shea- Distress Patter-n at Bottom of T~st 1 Panel after Test
12
General observations from the nine nail test can be summarized as follows
1 The load-deformation behavior in general and for the center nail in particular was very ductile
as depicted in Fig 12 consistent with the observations from the single nail tests The
analytical prediction of the load-deformation behavior of the center nail head was offset from
the test results by the amount of the reduced initial soil stiffness as observed and implemented
based on the single nail test results However the different construction of the nine nail panel
by shotcreting against the soil eliminated this initial reduced soil stiffness phase Furthermore
the free panel perimeter edge still allowed some uplift whereas in the center nail vicinity
continuous confinement was provided to the soil by the facing panel Changing the trilinear
soil reaction stiffness characteristics used in the predictive model to linear characteristics but
with reduced stiffness towards the outer regions of the nine nail facing panel as shown in Fig
12 resulted in a diagnostic post-test analysis which correlated well with the experimental
results
2 The justification for the linear soil stiffness characterization was also provided by the soil
pressure measurements between nails 4 and 5 which are reduced to a pressuredeformation
relationship in Fig 13 for the center nail location The actual soil pressure profile between
nails 5 and 4 is depicted in Fig 14 for various nail load levels Note that after a nail load of
311 kN only the center nail 5 was loaded while all the other nail loads were kept constant
3 The crack pattern evolution in the nine nail test on the exposed side of the facing panel is
depicted in Fig 15 for various nail load levels The first visible cracks develop in the negative
moment regions between nail lines followed by circumferential tension cracks around the nail
heads and ultimately punching shear cracks originating from the anchor plate perimeter Thus
the sequential distress patterns are consistent with the fmdings from the single nail tests at
slightly higher nail loads due to the panel continuity The above described distress patterns are
also depicted in Fig 16 for the circumferential tension mechanisms and in Fig 17 for the
punching shear failures
4 Nominal punching shear stress levels as described for the single nail facing tests slightly
exceeded 04 -jf [MPa] for the center nail and were thus 15 x higher than for the single nail
tests which can be attributed to the higher soil capacities in the continuous panel case
13
12 (S868cm)
rmiddotmiddot [12Ultm] lt[12Uom]l
I
reg 3
r 6 reg 9
l I
4 [121 9cm]
9 2 + 9 8
- - - - 12 [3658cm]
I
J reg 1 ~ 4 reg 7
Scm)
Nor th I Sout h
FIG 11 Nail Head Location and Numbering
14
-Ul
(rrim)
0 10 20
100
90
80
70
60
50
40 160 kipsft 3
30
20
10
30 40
PCYCO reaulla 9-nall teaL precHcUon trllinear 1prlng model 00 -02 50 ldplfl-3 Ot -08 300 ldpbullft-3 08- 100 ldpsft-3
100 kipsft 3
50
450
400
350
300
200
150
100
50
0~~~~~~~~~~~~~--~~--~~--~~------~~r-~--rO
00 04 08 12 16 20 Displacement (inches)
FIG 12 Nail Head Load vs Displacement Response 9-Nail Test
-l
260
240
220
200
180
-160 bull-I Ill p
-- 140 QJ 1-t j Ill Ill QJ 1-t
0
120
100
80
60
40
0 200 400
~
(mm)
600 800 1000
1 20 kips 6696 kN 2 30 kips 1334 kN 3 40 kips 1779 kN 4 50 kips 2224 kN 5 60 kips 2669 kN 6 70 kips 3114 kN 7 BO kips 3559 kN B 076 Inch (193 mm) 9 102 kips (4542 kN)
1200 1400 1600 1800
16
bull bull 14
5 12
bull 4 bull
10
-08 ~
06
04
~1~~~~~ii~~ii~~~~~sectl~~~~~~~~~0
middot2
200j
00 0 12 24 36 48 60
Pressure Gage Location Measured from Center (inches)
FIG 14 Soil Pressure Gage Profile
72
a) Nail Load 30 kips
c) Nail Load 50 kips
b) Nail Load 40 kips
d) Nail Load Over 65 kips
FIG 15 Top Surface Crack Pattern
18
FIG 16 Top of Panel Final Distress Pattern
19
a) Punching Failure Top and Bottom of Panel
b) Crack Pattern and Imprint of Center Nail Punching Cone
FIG 17 Close-up of Facing Panel Failure Modes
20
3 THE ANALYTICAL INVESTIGATIONS
The analytical model development parameter studies and case studies are described in detail in
[2 3 7 and 8] and are summarized in reference to the above experimental program in the
following
31 Analytical Model Development
For the detailed nonlinear analysis of soil nail wall facing panels the computer code PCYCO
[2] was adopted since critical facing panel response limit states such as cracking of the concrete
yielding of the reinforcement crushing of the concrete etc can be modeled
PCYCO is the latest in a series of nonlinear analysis programs for structural concrete members
and systems developed at the University of California San Diego specifically for the prediction
and diagnostic of reinforced or prestressed concrete or masonry systems test performed at the
Powell Structural Research Laboratories The PCYCO program is a research tool and not a
production type program hence code clarity was chosen over program efficiency whenever it was
necessary
The plate or slab element in PCYCO which was used to model soil nail wall facings is a nineshy
node Lagrangean isoparametric flat shell element in which the concrete is represented as a layered
media and the steel reinforcement is overlaid and connected at the nodes by compatibility
requirements see Fig 18 The basic plate bending behavior is modeled after the Reissner-Mindlin
theory for shear deformable plates and the constitutive model for concrete is based on the
orthotropic model of Darwin and Pecknold as well as on the modified compression field theory by
Collins and Vecchio An object-oriented programming philosophy has been adopted in the
development of the PCYCO program This programming philosophy considers the element
kinematics independently of the material constitutive models As a result a researcher can develop
a new constitutive model which can be inherited by the existing element types Similarly a
researcher can create a new element type which can inherit any of the existing constitutive models
with minimal programming effort A common output data base ensures that element deformations
forces strains and stresses of a new element type can easily be incorporated into the existing postshy
processing programs
The following material nonlinearities can be considered (a) cracking of concrete (b) softening
and crushing of concrete (c) yielding and strain hardening of reinforcement steel (d) nonlinear
stress-strain behavior including the Baushinger effect (cyclic model only) (e) material anisotropy
21
I Ll_ I I x middotmiddot--middotmiddot--
ossible Deformation Mces
a) Nine Node Element
Integration
Stations
--Concrete
Layers
Reference
Plane
Steel Layers
b) Layering Through Element Depth
FIG 18 PCYCO Reinforced Concrete Flat Shell Element
(f) confmement effects in concrete (g) tension stiffening effect of reinforced concrete (after
cracking) and (h) prestressing effects on both steel and concrete These effects are introduced in
the analytical model through equivalent uniaxial orthotropic rotating constitutive relationships for
each individual concrete or steel layer The constitutive relationships for concrete and steel can
either be linear nonlinear elastic or nonlinear inelastic and fully cyclic The nonlinear elastic
constitutive models were chosen for the subsequent soil nail wall facing analyses
A preliminary model validation [3] 102 mm thick precast concrete single nail panel test [4]
showed that the characterization of soil springs supporting the facing panel in the form of a linear
elastic Winkler foundation needed some modifications to account for observed effects such as ( 1)
uplift along the free edge of the single nail panel (2) stiffening of the soil due to compaction during
the test and (3) softening of the spring support once the soil failure limit state is reached
First the linear elastic soil spring model see Fig 19a was replaced with an elastic linear
compression and tension gap model see Fig 19b for uplift simulation Then a bilinear
constitutive relationship for soil spring compression was introduced see Fig 19c followed by
refinement to a trilinear compression model to simulate the observed soil dislocation under the
loading area at high nail loads Finally to model possible permanent soil pressure states against
the back of the soil nail wall facing at higher wall depth a cut-off pressure correction in the form of
a baseline shift on the load in the soil spring model see dashed horizontal axis in Fig 19d was
introduced to the PCYCO program in direct support of the SSI (soil structure interaction) modeling
of a concrete facing under increasing nail loaddisplacement limit states
Based on load-deflection measurements in the single nail panel tests and parallel soil pressure
cell readings during the test both a calibration of the soil spring stiffness models described above
as well as a verification by direct comparison of the soil spring load-deformation behavior with the
pressure cell readings were performed
Analytical model discretizations used by both single and nine nail test analyses are depicted in
Fig 20 and show that due to symmetry of structure and loading only a quarter of each test panel
needs to be modeled with appropriate boundary conditions along the lines of synunetry allowing
vertical displacements and rotations perpendicular to the boundary line and no rotations about the
boundary axis
a) The Single Nail Tests
Subsequent to each single nail laboratory test [5]the trilinear spring stiffnesses were adjusted
such as to provide a close correlation with the observed load-deformation characteristics at the nail
23
p
a) Linear Base Model
p
Compression
Tens-ion
c) J~ilinear Compression and
Tension Gap Model
middotp
Tension
b) Linear Compression and
Tension Gap Model
p
cul-of I
A
A
sr~~---------_____________
Tension
d) Trilinear Compression and Tension
Gap Model with Same Line Shift
FIG 19 Elastic PCYCO 1-D Spring Model Development
24
X I t J3X5lmm 2x102mm 2x 203 mm I
~ steel OPICho plategt
bull noil position
a) Finite Element Mesh for the Single Nail Panels J
I 1 102 703 305 305 203 2x 10² 203 middot 305 t-1 __t-----t___-----lt---------t-1 c_middot ---t-1 middot ---tf___-+-1 --1
mrn
~ ~
~
I bullbull umiddotmiddot
~~ ~ ~
~ ~
b) Finite Element Mesh for Nine Nail Panel
FIG 20 Analytical 1lodel Discretizations
25
~ steel oncho- plote
e noil position
~
head This calibration was performed for single nail test 1 2 3 and 5 only since test 4
represented a punching shear test without soil support conditions or SSI
The analytical post-test load-deflection traces for tests 1 2 3 and 5 shown in Fig 21 are
in direct comparison to the experimentally observed nail head load-displacement curves The fact
that experimentally observed load-deflection curves can be traced after the test with the adjusted
analytical model is in-itself no statement of qualification for the analytical model It only shows
that the model has sufficient parameters and characteristics which allow a good trace to be
established However two additional conditions are very important to the model validation
namely (1) the fact that only soil spring stiffness were adjusted and measured material properties
for f = concrete strength fer= the cracking strength as determined from standard cylinder and
beam tests and fY = reinforcement yield based on bar pull tests or manufacturer supplied batch data
were used and not varied as part of the model calibration and that (2) measured soil pressures and
deflection profiles along the soil pressure cell line allowed for an independent experimental
verification of the analytically employed soil pressures or spring load vs deflection data as
depicted already in Fig 8 While the correlation in Fig 8 between experimental and analytical data
certainly could be improved the general soil spring behavior characteristics has been verified
Based on Figs 21 and 8 the validity of the trilinear model for the single nail facing panel tests was
established The trilinear break points in the soil spring stiffness are seemingly independent of soil
condition and correspond to nail head displacements of 51 mm and 152 mm respectively The
individual segment spring stiffnesses for the trilinear models listed in Fig 8 correspond exactly to
those used to generate the analytical traces in Fig 21
b) The Nine Nail Test
The calibrated analytical model was now used to predict the behavior of the nine nail test
already shown in Fig 12 in a true class A or pretest prediction in order to validate the analytical
tool prior to the detail parameter studies A 78470157 M~ trilinear soil spring model was m
adopted for the nine nail test assuming that the density and compaction of the soil would resemble
those of the first single nail test see Fig 8 test 1
A direct comparison of the class A prediction and the experimentally measured loadshy
deflection behavior at the center nail depicted in Fig 12 shows that the analytical model
consistently over-predicts displacements for a given nail load level On the other hand once the
initial soft spring stiffness up to a displacement of 51 mm is eliminated very close agreement
between experiment and analysis can be expected since it results effectively only in a lateral shift of
the analysis curve towards the origin by an amount equal to the displacement during the initial
26
(mm) middotmiddot-middot-middotmiddot ------- --- ----~---~ middot- middot-(mm ___
0 8 16 24 32 40 0 8 16 24 32 40 48 56 45 200 JO 400
40 a so 75
35 PCYCO results test I 150 30(
30 60 =oo~ middot middot middotmiddot middot Test2 (121894) 250
325
E wosect a 45 zoosect ~ 3 20 3 150
15 30
50 100 10
15 5 50
0 0 0 0 00 04 08 12 16 00 04 OB 12 16 20 24
Dloplocemenl (Inches) Dlpla~omenl (Inches)
a) Test 1 b) Test 2
--------- ~-- ---------
(rnm)
(mm)
N 0 8 16 24 32 40 48 56 00 10 20 30 40 50 60 70 80 90 100
-J 90 400 200 880 PCYCO results test 5
350 175 Test 5 (41995) 800 75
720 _Punching 300 150 Shear
Failure 640 60
250 125 560
145 zoosect J 480~ ~ 100 3
400 9 3 150
30 75 320
100 50 240
15 160 50 25
DO
0 0 0 04 08 12 16 20 24 000 010 020 030 040 050
Displacemenl (lnchos) Dlsplacemenl (Inches)
c) Test 3 d) Test 5 FIG 21 Nail Head Load vs Displacement Response Calibration
spring stiffness phase Finally the adopted zone model with three zones of linear elastic springs
as outlined in Fig 12 shows excellent agreement with the experimental results Since for the
center nail the center soil stiffness or confmement is of importance the linear center soil stiffness
of 34 MNm3 was plotted in Fig 13 together with the measured pressure cell data in the center nail
vicinity as well as with the original soil stiffness model used in the prediction Very close
agreement between the linear 34 MNm3 selected soil spring stiffness and the measured pressure
cell data exists and can certainly be viewed as a very important validation of the developed PCYCO
soil nail wall facing SSI model
32 Analytical Parameter Studies
The objective of the parameter study was to identify the influence of parameter variations on the
load-deflection behavior at the nail head All parameter variations occurred within realistic
prototype bounds of actual soil nail wall facing properties In order to evaluate the influence of
each individual variable only one parameter at a time was adjusted and its influence on the soil nail
facing behavior analyzed with respect to a common baseline case
This baseline case assumed the dimensions reinforcement ratios and design material
properties listed in Table 2 for a representative temporary shotcrete wall facing and a 153 m nail
spacing Parameters investigated can be grouped in five general categories of (1) soil (2) facing
panel (3) bearing plate (4) reinforcement and (5) concrete properties
Other parameters and constants used in the analytical model which were not subject to the
parameter study reflect basic material characteristics for concrete and reinforcement as obtained
from the tests The concrete cracking strength fer was always taken as 10 of the nominal
compressiOn strength f~ the concrete modulus was evaluated following ACI 318 standard
procedures
Since for the soil structure interaction analysis the soil characteristics clearly have a dominant
effect four separate soil related parameters were investigated namely the subgrade reaction
coefficient related to the soil density the load-deformation behavior of the soil approximated by a
linear bilinear or trilinear relationship the diameter of the grout column around the nail from overshy
drilling or break-out of soil in the nail head vicinity and finally a permanent cut-off soil pressure
behind the wall facing panel The influence of facing panel geometry captured by the two
parameters of facing panel thickness and soil nail spacing were also investigated The steel bearing
plate size was varied both in thickness and square side dimensions in the form of a linear elastic
overlay element in the plate region Finally variations in material quantities and properties were
28
evaluated by adding to the standard baseline 6 x 6 W 21 x 21 welded wire mesh two waler bars
in both directions ranging from 4 to 6 in reinforcement size
Two different edge boundary conditions were investigated for each of the parameter studies
namely a free edge and a clamped edge condition with rotational constraints or fixity against
rotations about the panel edges The first or free boundary condition was the one used in the single
nail experiments [5] and does not represent realistic field conditions except at the edges or corners
of soil nail walls whereas the clamped edge condition again based on symmetry relationships
reflects prototype conditions in a continuous multi nail wall of infinite dimensions under uniform
loading conditions
TABLE 2 Baseline Panel Properties and Parameter Range
PARAMETER BASELINE PARAMETER MODEL RANGE
Subgrade Reaction k 267 ~ 157 - 376 ~~ Coefficient m m
Stiffness Variation D trilinear linear bilinear trilinear
SOIL Grout Column D 203 mm 0-406 mrn Diameter
Permanent Soil pcut-off 0 kPa 0-287 kPa Pressure
Facing Thickness tslab 102 mm 102-203 mrn
FACING Soil Nail Spacing snail 153 m 122- 183 m PANEL
Finite Element FR M5 M4M5M6 Discretization
BEARING Plate Thickness tplate 19 mm 127 - 318 mm
PLATE bplate 203 x 203 mm Plate Size 102 x 102 mm 305 x 305 mm
REINFORCE Welded Wire Fabric wmesh I 6 X 6 w 21 X 21 none
-MENT 24 24-26 WalerBars ff
CONCRETE Design Compression f 276 MPa 207 - 345 MPa c Strength
29
The above outlined parameters were investigated subsequently by individually varying one of
them through the range indicated in Table 2 always starting with the reference baseline case A
total of eight groups of parameter studies were performed and are labeled in the following with A
through H representing
A Grout Column Diameter Variations
B Soil Stiffness Characterization
C Permanent Cut-off Pressure Influence
D Effects of Bearing Plate Dimensions
E Moment Capacity or Reinforcement Ratio Variation
F Facing Thickness Variation
G Concrete Strength Influence
H Soil Nail Spacing Variations
Results from the above parameter studies are graphically depicted in Fig 22A-H
Parameter studies have shown that the nail load or facing capacity is most influenced by the
facing panel thickness by the bearing plate size and the soil stiffness assumptions whereas soil
model variations reinforcement ratios and soil nail spacings primarily affect the deformation states
and not so much the nail loads The evaluated shear stress indicators as multiples of jf showed
the largest dependence on the assumed grout column diameter and on the actual concrete
compression strength Single nail tests showed that punching shear failures are possible when the
shear indicators exceed the parameter studies clearly indicate for which of the investigated
parameter variations and parameter combinations this punching shear failure scenario becomes
more likely For example low concrete strength combined with a large grout column can quickly
result in a punching shear failure mode However both test and analyses clearly showed that
punching shear does only occur at large deformation states and is preceded by significant inelastic
flexural action in the form of cracking yielding and large relative facing panel deformations which
will provide significant warning prior to punching shear failure at least in thin temporary shotcrete
facings
33 Analytical Case Studies
The same analytical model with the exception of linear tension gap springs instead of trilinear
springs was employed for case studies on representative soil nail wall facing designs which are
presented in the following In addition to the twelve case studies the effects of different
reinforcement ratios both uniformly distributed and concentrated along nail head strips on the nail
30
700
_600 rn 0
2 -500 t1 ttl
I 0 J 400 CC QJ
J e 3oo
J
= ~
~ 200 0 u
100
Note Numbers indicate nominal shear stress in terms of nbullsqrt(fc)
middot~Dia = 0 in IHgt-ampampltl Di a = 4 in -- Dia = 8 in (Baseline) _ Dia = 12 in ~Dia = 16 in
00 ~------r------------r---~-~
700
600 -rn 0
2 -500 d ttl
s 400 CC
QJ J
~ 300 J
= Q)
g 200 0 u
100
00
00 00
01 02 03 04 05 06 07 08 09 Displacement Under Concentrated Load (inches)
a) Grout Column Parameter Study (Multi Nail) A
Note Numbers indicate nominal shear middotstress in terms of nbullsqrt(fc)
= 100 kef = 170 kef (Baseline) = 240 kef
01 02 03 04 05 06 07 08 09 Displacement Under Concentrated Load (inches)
bl) Soil Stiffness Parameter Study Bl
FIG 22 Soil Nail Facing Parameter Study
31
10
10
__ _ - ---~--- --- middotmiddotmiddot---~~--~~~- ----- --middot-middotmiddot ---
700 ---------------------~------------------------~
-rn Q
600
2 -500 d cd
3 400 d
Q) -+-) e 3oo -+-)
Q)
~ 200 0 u
100
Note Numbers indicate nominal shear stress in terms of nbullsqrt(fc)
~ Linear Soil Model ampe-e-a-pound~ Bilinear Soil Model -- Trilinear Soil Model
00 ~--~---~---------r-----r--~~-~ 00 01 02 03 04 05 06 07 08 09
Displacement Under Concentrated Load inches
b2) Soil Model Parameter Study B2
10
700 ~------------~-----~---------
-rn Q
600
2 -500 d cd
3 400 d
Q) -+-) e 3oo -+-)
Q)
~ 200 0 u
100
Note Numbers indicate nominal shear stress in terms of nbullsqrt(fc)
-- P = 0 psf (Baseline) ~ P = 300 psf ltgt-ltgt-e-a-lt~ P = 6 0 0 p sf
00 4L~-~-~~--~~~------------------~ 00 01 02 03 04 05 06 07 08 09
Displacement Under Concentrated Load inches
c) Soil Cut-off Pressure Parameter Study C
FIG 22 Soil Nail Facing Parameter Study (continued)
32
10
700 -----------------------~------------------~--~
_soo Ill ~ g
--500 d 10
s 400 d Cl) e 3oo = Ql
g 200 0 u
100
Note Numbers indicate nominal shear stress in terms of nsqrt(fc)
~ Bearing Plate Thickness = 12 in --- Bearing Plate Thickness = 34 in (Baseline) ~ Bearing Plate Thickness = 1 in - Bearing Plate Thickness = 1 14 in
0 0 +-----------+--------------------------------------1 00 01 02 03 04 05 06 07 08 09
Displacement Under Concentrated Load (inches)
dl) Bearing Plate Thickness Parameter Study Dl
10
600 --------------~------------~--
-Ill ~
700
middot~ 600 -d ~ 500
I
g 400 Ill Jlt
~ 300 Cl)
0
sect 200 u
100
I I
~-------~-----~--
G-EHHHgt 4 x 4 in Bearing Plate 8 X 8 in Bearing Plate (Baseline
12 x 12 in Bearing Plate
00 ~~--r-~~--~~~--~~----r-~---r-~-----r~~ 00 01 02 03 04 05 06 07 06 09
Displacement Under Concentrated Load (inches) -~---middotmiddotmiddotmiddotmiddotmiddotmiddot ~~-~-middot-------
d2) Bearing Plate Size Parameter Study D2
FIG 22 Soil Nail Facing Parameter Study (continued)
33
10
600 -----------------------~--------------~--------
--500 A
a -C 400 IS
) 3 -g 300 ~ IS
~ ~ 200 ~
d 0 u
100
Note Numbers indicate nominal shear stress in terms of nbullsqrt(fc)
--- 2 4 middotWaler Bars irho=025~~ (Baseline) lHrlrlirio 2 5 Waler Bars middot rho=035lil ~ 2 6 Waler Bars rho=046~
00 4L-r~-----r---------------------~
-I) A ~ -C IS
s C Q) ~
~ d Q) ~
1= 0 u
00
1000
900
BOO
700
600
500
400
300
200
100
00 00
01 02 o3 04 os 06 07 oa o9 Displacement Under Concentrated Load (inches)
e) Yield Moment Parameter Study E
Note Numbers indicate nominal shear stress in terms of nbullsqrt(fc)
--- Thickness = 4 in (Baseline) ~ Thickness = 6 in Thickness = B in
10
01 02 03 04 05 06 07 OB 09 10 Displacement Under Concentrated Load (inches
f) Slab Thickness Parameter Study F
FIG 22 Soil Nail Facing Parameter Study (continued)
34
--- 500 p
- 400 ca 0
I
-g 300 ca b sect 200 CJ ~ 0 u
100
Note Numbers indicate nominal shear stress in terms of nbullsqrt(fc)
CHHHH) fc = 3000 psi -- fc = 4000 psi (Baseline) ~ fc = 5000 psi
00 ~~--r-~~--~~~--------------------__ 00
600
--- 500 ~
~ - 400 ca 0
I
~ 300 tl1
1-o
sect 200 CJ ~ 0 u
100
01 02 03 04 05 06 07 08 09 Displacement Under Concentrated Load (inches)
g) Concrete Strength Parameter Study G
10
4~ 4
Note Numbers indicate nominal shear stress in terms of nbullsqrt(fc)
~ 4 ft Soil Nail Spacing 5 Ct Soil Nail Spacing (Baseline)
6 ft Soil Nail Spacing
00 ~-----~--~-+--r----r-~----~--~~--~-r--r-~--~ 00 01 02 03 04 05 06 07 08 09
Displacement Under Concentrated Load (inches)
h) Nail Spacing Pressure Parameter Study H
FIG 22 Soil Nail Facing Parameter Study (continued)
35
10
head load-deformation response were investigated to demonstrate the complex interaction between
facing stiffnesscapacity and the Winkler spring simulation of the soil loading
A total of twelve case studies of representative soil nail wall facing designs were investigated
half of them for typical 102 mm temporary shotcrete facings and the other half for 203 mm
permanent shotcrete or cast-in-place wall facings All analyses were based on a 183 m typical nail
head module in both directions with other constant design parameters listed in Table 3
The six temporary shotcrete facing cases had nail head plates of 203 mm square dimensions
with a 19 mm plate thickness effective soil reaction moduli varying between 94 MNm3 and 376
MNm3 and total reinforcement ratios referenced to the 183 m x 102 mm facing cross-section of p = 0222 and 0465 including both uniformly distributed welded wire fabric and waler bars in
the nail head strips
The 203 mm thick permanent shotcrete or cast-in-place wall facing case studies were based in
addition to the constant case parameters in Table 3 on 229 mm square and 25 mm thick nail head
plates Reinforcement for the permanent facings consisted of 3 waler bars along the nail head
strips and uniformly distributed mild reinforcement on a 305 mm spacing in both directions with
overall reinforcement ratios of p = 0313 and 0484
A summary of all twelve case study parameter variations is provided in the case study
pafameter matrix in Table 4 Results from the individual case studies are summarized in the
following in the form of nail head load versus nail head deflection relationships All analyses
were performed for continuous facing panels with the 183 m nail spacings in both directions
TABLE 3 Constant Reference Case Parameters
Concrete Properties f 276 MPa
Facing Materials waler bars fy 455MPa Steel Properties wire fabric fy 517 MPa
Cutoff Pressure P c 287 kNm Soil Properties
Grout Column Diameter DGC 203mm
Headed-Stud Spacing SHs 152mm
Headed-Stud Body Diameter dHs 19mm ij
Nail Head Parameters Headed-Stud Head Diameter dH 32mm
Cover to Headed Stud CHs 51mm
Cover to Plate CPL Omm
Nail Spacing S 152mm
36
TABLE 4 Case Study Parameter Matrix
Case Facing Plate Plate Soil Waler at Reinforce-Thickness Width Thickness Effective Steel Steel ment
hp bPL tPL ks Ratio (mrn) (Iniii) (mrn) (MNm3
) 0 () 1 102 203 19 94 2-4 W20-6x6
2 102 203 19 188 2-4 W20-6x6 0222
3 102 203 19 376 2-4 W20-6x6
4 102 203 19 94 2-5 W40-4x4
5 102 203 19 188 2-5 W40-4x4 0465
6 102 203 19 376 2-5 W40-4x4
7 203 229 25 94 3-4 1 4 reg 12
8 203 229 25 188 3-4 4 12 0313
9 203 229 25 376 3-4 4 12
10 203 229 25 94 3-5 5 12
11 203 229 25 188 3-5 5 12 0484
12 203 229 25 376 3-5 5 12
The load-deflection response for the temporary shotcrete facing panels with 102 mrn thickness
is depicted in Fig 23 for different reinforcing patterns and soil reaction coefficients As can be
seen from the response analyses in Fig 23 the soil reaction coefficient has a significant influence
on the nail headfacing capacity Furthermore the facing panel capacity clearly seems to increase
with increasing reinforcement ratios which is somewhat contradictory to the findings in the initial
analytical parameter study [7] However more than doubling the overall reinforcement ratio from
0222 to 0465 increases the nail load capacity at a nail head displacement of 203 mm by only
20 to 30 for the different soil reaction coefficients which is still significantly less than would
be expected from the simplified assumption that a doubling of the reinforcement amount should
also approximately double the facing capacity
The load-deflection response characteristics obtained from the permanent facing case studies
are depicted in Fig 24 for reinforcement ratios of p = 0313 and 0484 respectively Again
the influence of the soil reaction coefficient was very pronounced particularly at the lower
deformation limit states ie nail head displacements of 102 mrn or less whereas subsequent to
the onset of reinforcement yielding and first concrete crushing this influence of the soil reaction
coefficient seemed to diminish
37
Increases in the reinforcement ratio by a factor of 04840313 = 155 resulted in nail head
capacity increases at the 203 rnrn nail head displacement limit state of only 75 to 15 with the
larger increases for the lower soil reaction coefficients Again this capacity was less than expected
based on the increase in overall reinforcement ratio
To investigate the reasons for this observed behavior further additional parametric studies
were performed where the parameter variations consisted of the reinforcement ratio and the
reinforcement distribution as will be explained in the following
The first set of parameter studies into the influence of the facing reinforcing patterns addressed
a baseline case of a temporary 102 rnrn shotcrete facing with a W 20 - 6 x 6 mesh and a soil
reaction coefficient of 376 MNm3 all other variables are as defined in Tables 3 and 4 The
parameter variations consisted of 2 waler bars in each direction in the form of 2 3 2 4 2 5 and
2 6 grade 60 bars resulting in overall reinforcement ratios between 016 and 039
The resulting load-deflection response at the nail head is depicted in Fig 25a for all four cases
and shows that reinforcement amount changes in the form of waler bars or strip reinforcement have
very little effect on the load-deformation characteristics of the facing panels At the 20 rnrn nail
head displacement limit state only a 10 increase in nail head capacity can be observed over the
depicted reinforcement ratio range
Using instead of concentrated reinforcement along the nail head lines in the form of waler
bars only distributed reinforcement amount variations as depicted in Fig 25b a wider range of
load-deflection response curves is obtained with an increase of around 20 in load capacity at the
20 rnrn nail head displacement limit state over the same reinforcement ratio range of 015 to
04 Thus the influence of the reinforcement distribution had a greater effect on the facing
capacity than the reinforcement amount The same findings were obtained for similar case studies
in 8 in (203 rnrn) permanent facing panels
Explanations for the observed behavior can be found in the facing panel deformation profiles
and the interaction between the facing panels and the soil reaction springs The soil spring
stiffnesses and the reinforcement distribution together with the resulting deformation profile
changes have a significantly larger influence on the nail head facing capacities than the overall
reinforcement amounts
38
~
m p
700
2 600 -d Ill 500 0 ~
] 400 Ill
- 300 Q) 0 ~ 0 200 u
100
00 00
~
m p
BOO
700
2 600 -d laquo 500 0 ~
] 400 ~
~ 300 Ql
0
sect 200 u
100
a)
00 00
Soil Stiffness
middot---- k= GO kef -- k= 120 kef - - - k= 240 kef
shy
Case 3
- ----
Facing Thickness = 40 inches Plate Width = 80 Inches
Plate Thickness = 075 inches Waler Steel = 2 4 MeshMat Steel = W20-6x6
01 02 03 04 05 06 07 08 09 Displacement Under Concentrated Load (inches)
Nail Head Load-Deflection Behavior Cases 1 to 3
Soil Stiffness
middotmiddot--- k= GO kef -- k= 120 kef - - - k= 240 kef --- Case 5
bullbullbullbullbullbullbull -middotmiddotmiddotmiddotmiddotmiddot Case 4
-middot -middot middot middotmiddot
-middot -middot --
middot Facing Thickness = 40 inches Plate Width = 60 inches Plate Thickness = 075 inches Waler Steel = 2 5 MeshMat Steel = W40-4x4
01 02 03 04 05 06 07 08 09 Displacement Under Concentrated Load (inches)
--middot----middotmiddotmiddotmiddotmiddot-----
10
b) Nail Head Load-Deflection Behavior Cases 4 to 6
FIG 23 Temporary Facing Panel Case Studies
39
2000
1800 -- ~ 1600
1400 C1
~ 1200 I
C1 1000 Q) cd 800 a Q)
600 ()
Q 0 u 400
200
00
1800 -- amp 1600
-1400 C1
~ 1200 I
~ 1000 cd ~ 000 Q Q)
() 600 1 0 u 400
200
00
a)
Soil Stiffness
middot---- k= 00 kcC -- k= 120 kef bull - - k= 240 kef
middotmiddot ---middot _ -
I
Case 9 ~-
~--~Case 8
Case 1
Facing Thickness = 60 inches Plate Width = 90 inches Plate Thickness = 100 inches Waler Steel = 3 14
middot MeshMot Steel = 4- at 12 inches
01 02 03 04 05 06 07 08 09 10 Displacement Under Concentrated Load (inches)
Nail Head Load-Deflection Behavior Cases 7 to 9
Soil SlifncS9 Case 12
middot---- k= 00 kef -- k= 120 kef bull - - k= 24 0 kef
_ -middotmiddotmiddotmiddotmiddotmiddotmiddotmiddotmiddotmiddotmiddotmiddot
~-~
____ _
bullbullbullbull -middot Case 10
F11cing Thickness = 00 incl1e11 Plate Width = 90 Inches Plate Thickness = 100 inches Walcr Steel = 3 84 MeshMol Sleel = It at 12 Inches
00 4-~~-----~----------------------~ 00 01 02 03 04 05 06 07 00 09
Displacement Under Concentrated Load (inches)
b) Nail Head Load-Deflection Behavior Cases 10 to 12
FIG 24 Permanent Facing Panel Case Studies
40
10
1000
900 -[] 800 0 a - 700 d Ill
600 0 l
0 500 QJ _ Ill
400 _ ~ QJ omiddot 300 a 0 u
[]
0
~
d Ill 0
l
d QJ _ Ill
_ ~ QJ (J
~ 0 u
200
100
00 00
1000
900
800
700
600
500
400
300
200
100
00 00
Baseline Properlies
Facing Thickness = 40 inches Plale Widlh = 110 inches Plale Thickness = 075 Inches K = 240 kd
Case A - 2~3 Wnler Bars irho = 016111 Case B - 2 4 Wnler Bars rho = 02211 Case C - 2 5 Wnler Bars rho = 030Z Case D - 2 6 Walcr Bars rho = 03~
W20x20 - 6x6 Mesh Cut-off Pressure = 06 Ksr
01 02 03 04 05 06 07 08 09 10 Displacementmiddot Under Concentrated Load (inches)
a) Strip Reinforcement
I I Distributed Reinforcement p = p~
Focing Thickness = 40 inches Plate Width = llO inches Plate Thickness = 075 Inches K = 240 kef
Cul-off Pressure = 00 Ksf 04l1
01 02 03 04 05 06 07 06 09 10 Displacement Under Concentrated Load inches)
b) Distributed Reinforcement
FIG 25 Reinforcement Ratio Effect on Nail Head Load-Deflection Behavior
41
4 SUMMARY AND CONCLUSIONS
In direct support of the FHW A demonstration project DP-1 03 and the development of I
cmhprehensive and rational limit state design models for soil nail walls the influence of parameter ~
variations on the response behavior of soil nail wall facing panels was investigated
i
i The parameter studies were performed with a specially developed nonlinear finite element
model which can capture material nonlinearities in the shotcrete or cast-in-place soil nail wall facing I
as ~ell as in the supporting soil reactions thus modeling the complex nonlinear soil structure
interaction
The analytical model was calibrated with test results from six full-scale single nail tests
conducted in a specially designed and constructed soil box and verified by means of a full-scalemiddot
nine nail facing panel test The model validation was achieved with direct measurements of the soil I
pressure under the facing panel and a one-on-one comparison with pressure or soil reaction
stiifness values used in the analytical model Results from both the analytical model and the full- scale experiments showed that for typical temporary shotcrete facing panels very ductile failure
modes can be expected due to membrane action in the reinforcement and direct soil support under J
potential punching shear cones Thus failure mechanisms with significant warning through large
deformations prior to capacity loss are likely Only in overlayed permanent walls this large
deformation warning is lost since punching and delamination of the temporary facing panel can
occur behind the permanent wall facing without any visible signs of distress The analytical
parameter studies furthermore showed that the nail load or facing capacity was most influenced by
the facing panel thickness the bearing plate size and the soil stiffness assumptions whereas
rei~forcement ratios and nail spacings primarily affected the deformation states to the highly
cm1pled soil structure interaction effect
j Case studies with common design details encountered in soil nail wall projects reconfirmed
th~se findings and can now be used as the basis for detailed design model developments in direct
SU]Jport ofFHW A demonstration project DP-103
42
-middotmiddotmiddotmiddot---
[1]( I~
[3]li i
[4] ~
[51]
REFERENCES
FHW A Soil Nail Wall Demonstration Project DP-103 Design Manual Goldermiddot
Associates Inc Redmond Washington Dec 1995
Ktirkchtibasche AG and Seible F PCYCO - Program for Cyclic Analysis of
Concrete Structures User Reference Guide Structural Systems Research Project
University of California San Diego Report No TR-9407 January 1994
Predictive and Diagnostic Analysis Model for Soil Nail Wall Facings - Single Nail Facing
Calibration SEQAD Consulting Engineers Report No 9410 to CH2M Hill Denver
October 1994
Seible F Ellery M and Latham CT Single Nail Facing Calibration Test Structural
Systems Research Project University of California San Diego Test Report No TR-
9403 October 1994
Seible F Ellery M and Kugler A Soil Nail Walls- The Single Nail Facing Panel
Test Program Structural Systems Research Project University of California San Diego
Test Report No TR-9502 August 1995
[6]1 Seible F Ellery M and Kugler A Soil Nail Walls - The Nine Nail Facing Test i
Program Structural Systems Research Project University of California San Diego Test
Report No TR-9503 May 1995
Analytical Parameter Study of Soil Nail Wall Facing Response SEQAD Consulting
Engineers Report No 95111 to CH2M Hill Denver August 1995
Analytical Case Study of Soil Nail Wall Facing Response SEQAD Consulting Engineers
Report No 9513 to CH2M Hill Denver November 1995
43
ACKNOWLEDGMENTS
The described research was made possible with funding from the Federal Highway
Administration (FHW A) under Demonstration Project DP-1 03 and the superb and relentless
leadership guidance and prodding by Ron Chassie FHW A Portland Oregon and Jim Keeley
FHW A Denver Colorado
The steering committee for the project which contributed invaluably with their discussions and
questions to the experimental and analytical program consisted of John Byrne Golder Associates
Redmond Washington Ron Chassie FHW A Portland Oregon Jim Keeley FHW A Denver
Colorado Bob Mast ABAM Federal Way Washington Jim Moese Caltrans Sacramento
California Larry Reasch CH2M Hill Denver Colorado and Chris W olschlag Golder
Associates Redmond Washington
44
--
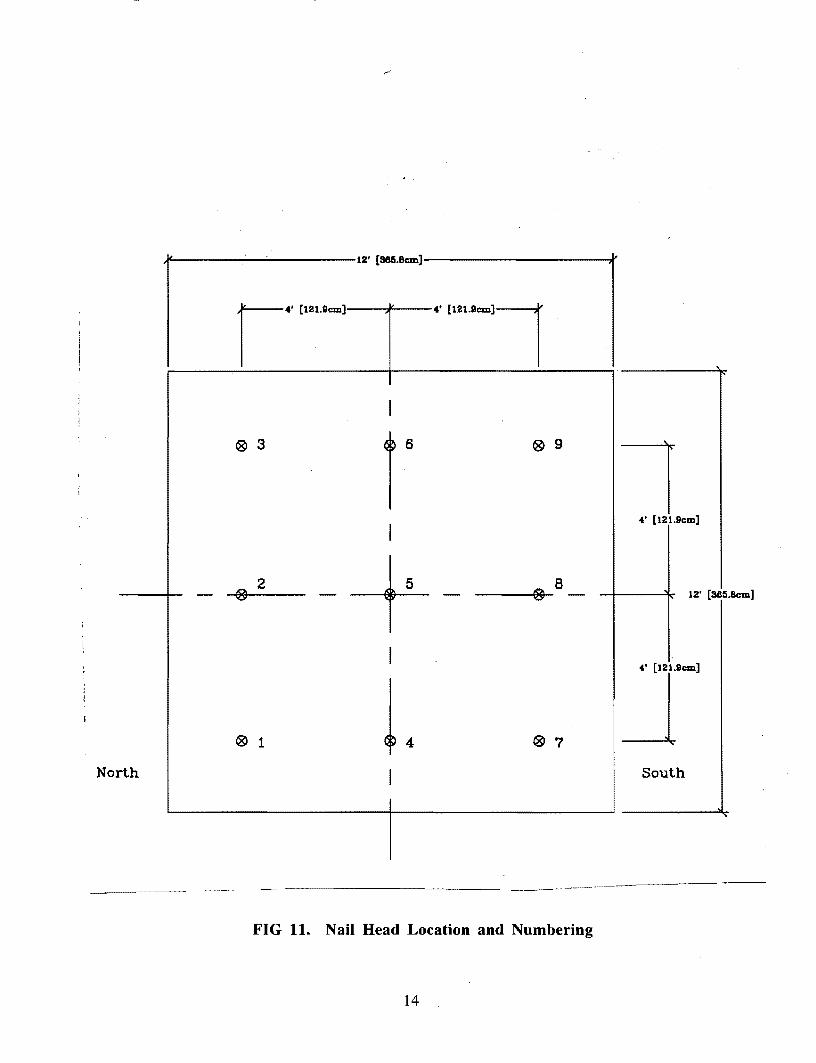
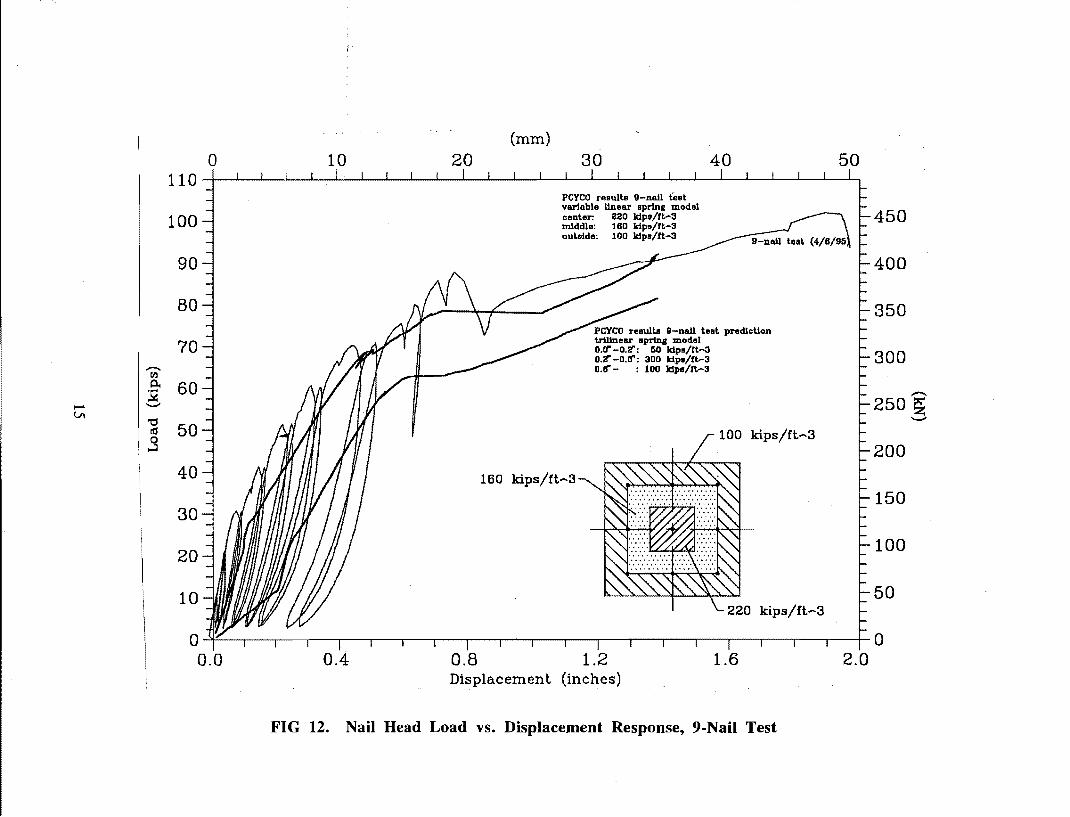

p
a) Linear Base Model
p
Compression
Tens-ion
c) J~ilinear Compression and
Tension Gap Model
middotp
Tension
b) Linear Compression and
Tension Gap Model
p
cul-of I
A
A
sr~~---------_____________
Tension
d) Trilinear Compression and Tension
Gap Model with Same Line Shift
FIG 19 Elastic PCYCO 1-D Spring Model Development
24
X I t J3X5lmm 2x102mm 2x 203 mm I
~ steel OPICho plategt
bull noil position
a) Finite Element Mesh for the Single Nail Panels J
I 1 102 703 305 305 203 2x 10² 203 middot 305 t-1 __t-----t___-----lt---------t-1 c_middot ---t-1 middot ---tf___-+-1 --1
mrn
~ ~
~
I bullbull umiddotmiddot
~~ ~ ~
~ ~
b) Finite Element Mesh for Nine Nail Panel
FIG 20 Analytical 1lodel Discretizations
25
~ steel oncho- plote
e noil position
~
head This calibration was performed for single nail test 1 2 3 and 5 only since test 4
represented a punching shear test without soil support conditions or SSI
The analytical post-test load-deflection traces for tests 1 2 3 and 5 shown in Fig 21 are
in direct comparison to the experimentally observed nail head load-displacement curves The fact
that experimentally observed load-deflection curves can be traced after the test with the adjusted
analytical model is in-itself no statement of qualification for the analytical model It only shows
that the model has sufficient parameters and characteristics which allow a good trace to be
established However two additional conditions are very important to the model validation
namely (1) the fact that only soil spring stiffness were adjusted and measured material properties
for f = concrete strength fer= the cracking strength as determined from standard cylinder and
beam tests and fY = reinforcement yield based on bar pull tests or manufacturer supplied batch data
were used and not varied as part of the model calibration and that (2) measured soil pressures and
deflection profiles along the soil pressure cell line allowed for an independent experimental
verification of the analytically employed soil pressures or spring load vs deflection data as
depicted already in Fig 8 While the correlation in Fig 8 between experimental and analytical data
certainly could be improved the general soil spring behavior characteristics has been verified
Based on Figs 21 and 8 the validity of the trilinear model for the single nail facing panel tests was
established The trilinear break points in the soil spring stiffness are seemingly independent of soil
condition and correspond to nail head displacements of 51 mm and 152 mm respectively The
individual segment spring stiffnesses for the trilinear models listed in Fig 8 correspond exactly to
those used to generate the analytical traces in Fig 21
b) The Nine Nail Test
The calibrated analytical model was now used to predict the behavior of the nine nail test
already shown in Fig 12 in a true class A or pretest prediction in order to validate the analytical
tool prior to the detail parameter studies A 78470157 M~ trilinear soil spring model was m
adopted for the nine nail test assuming that the density and compaction of the soil would resemble
those of the first single nail test see Fig 8 test 1
A direct comparison of the class A prediction and the experimentally measured loadshy
deflection behavior at the center nail depicted in Fig 12 shows that the analytical model
consistently over-predicts displacements for a given nail load level On the other hand once the
initial soft spring stiffness up to a displacement of 51 mm is eliminated very close agreement
between experiment and analysis can be expected since it results effectively only in a lateral shift of
the analysis curve towards the origin by an amount equal to the displacement during the initial
26
(mm) middotmiddot-middot-middotmiddot ------- --- ----~---~ middot- middot-(mm ___
0 8 16 24 32 40 0 8 16 24 32 40 48 56 45 200 JO 400
40 a so 75
35 PCYCO results test I 150 30(
30 60 =oo~ middot middot middotmiddot middot Test2 (121894) 250
325
E wosect a 45 zoosect ~ 3 20 3 150
15 30
50 100 10
15 5 50
0 0 0 0 00 04 08 12 16 00 04 OB 12 16 20 24
Dloplocemenl (Inches) Dlpla~omenl (Inches)
a) Test 1 b) Test 2
--------- ~-- ---------
(rnm)
(mm)
N 0 8 16 24 32 40 48 56 00 10 20 30 40 50 60 70 80 90 100
-J 90 400 200 880 PCYCO results test 5
350 175 Test 5 (41995) 800 75
720 _Punching 300 150 Shear
Failure 640 60
250 125 560
145 zoosect J 480~ ~ 100 3
400 9 3 150
30 75 320
100 50 240
15 160 50 25
DO
0 0 0 04 08 12 16 20 24 000 010 020 030 040 050
Displacemenl (lnchos) Dlsplacemenl (Inches)
c) Test 3 d) Test 5 FIG 21 Nail Head Load vs Displacement Response Calibration
spring stiffness phase Finally the adopted zone model with three zones of linear elastic springs
as outlined in Fig 12 shows excellent agreement with the experimental results Since for the
center nail the center soil stiffness or confmement is of importance the linear center soil stiffness
of 34 MNm3 was plotted in Fig 13 together with the measured pressure cell data in the center nail
vicinity as well as with the original soil stiffness model used in the prediction Very close
agreement between the linear 34 MNm3 selected soil spring stiffness and the measured pressure
cell data exists and can certainly be viewed as a very important validation of the developed PCYCO
soil nail wall facing SSI model
32 Analytical Parameter Studies
The objective of the parameter study was to identify the influence of parameter variations on the
load-deflection behavior at the nail head All parameter variations occurred within realistic
prototype bounds of actual soil nail wall facing properties In order to evaluate the influence of
each individual variable only one parameter at a time was adjusted and its influence on the soil nail
facing behavior analyzed with respect to a common baseline case
This baseline case assumed the dimensions reinforcement ratios and design material
properties listed in Table 2 for a representative temporary shotcrete wall facing and a 153 m nail
spacing Parameters investigated can be grouped in five general categories of (1) soil (2) facing
panel (3) bearing plate (4) reinforcement and (5) concrete properties
Other parameters and constants used in the analytical model which were not subject to the
parameter study reflect basic material characteristics for concrete and reinforcement as obtained
from the tests The concrete cracking strength fer was always taken as 10 of the nominal
compressiOn strength f~ the concrete modulus was evaluated following ACI 318 standard
procedures
Since for the soil structure interaction analysis the soil characteristics clearly have a dominant
effect four separate soil related parameters were investigated namely the subgrade reaction
coefficient related to the soil density the load-deformation behavior of the soil approximated by a
linear bilinear or trilinear relationship the diameter of the grout column around the nail from overshy
drilling or break-out of soil in the nail head vicinity and finally a permanent cut-off soil pressure
behind the wall facing panel The influence of facing panel geometry captured by the two
parameters of facing panel thickness and soil nail spacing were also investigated The steel bearing
plate size was varied both in thickness and square side dimensions in the form of a linear elastic
overlay element in the plate region Finally variations in material quantities and properties were
28
evaluated by adding to the standard baseline 6 x 6 W 21 x 21 welded wire mesh two waler bars
in both directions ranging from 4 to 6 in reinforcement size
Two different edge boundary conditions were investigated for each of the parameter studies
namely a free edge and a clamped edge condition with rotational constraints or fixity against
rotations about the panel edges The first or free boundary condition was the one used in the single
nail experiments [5] and does not represent realistic field conditions except at the edges or corners
of soil nail walls whereas the clamped edge condition again based on symmetry relationships
reflects prototype conditions in a continuous multi nail wall of infinite dimensions under uniform
loading conditions
TABLE 2 Baseline Panel Properties and Parameter Range
PARAMETER BASELINE PARAMETER MODEL RANGE
Subgrade Reaction k 267 ~ 157 - 376 ~~ Coefficient m m
Stiffness Variation D trilinear linear bilinear trilinear
SOIL Grout Column D 203 mm 0-406 mrn Diameter
Permanent Soil pcut-off 0 kPa 0-287 kPa Pressure
Facing Thickness tslab 102 mm 102-203 mrn
FACING Soil Nail Spacing snail 153 m 122- 183 m PANEL
Finite Element FR M5 M4M5M6 Discretization
BEARING Plate Thickness tplate 19 mm 127 - 318 mm
PLATE bplate 203 x 203 mm Plate Size 102 x 102 mm 305 x 305 mm
REINFORCE Welded Wire Fabric wmesh I 6 X 6 w 21 X 21 none
-MENT 24 24-26 WalerBars ff
CONCRETE Design Compression f 276 MPa 207 - 345 MPa c Strength
29
The above outlined parameters were investigated subsequently by individually varying one of
them through the range indicated in Table 2 always starting with the reference baseline case A
total of eight groups of parameter studies were performed and are labeled in the following with A
through H representing
A Grout Column Diameter Variations
B Soil Stiffness Characterization
C Permanent Cut-off Pressure Influence
D Effects of Bearing Plate Dimensions
E Moment Capacity or Reinforcement Ratio Variation
F Facing Thickness Variation
G Concrete Strength Influence
H Soil Nail Spacing Variations
Results from the above parameter studies are graphically depicted in Fig 22A-H
Parameter studies have shown that the nail load or facing capacity is most influenced by the
facing panel thickness by the bearing plate size and the soil stiffness assumptions whereas soil
model variations reinforcement ratios and soil nail spacings primarily affect the deformation states
and not so much the nail loads The evaluated shear stress indicators as multiples of jf showed
the largest dependence on the assumed grout column diameter and on the actual concrete
compression strength Single nail tests showed that punching shear failures are possible when the
shear indicators exceed the parameter studies clearly indicate for which of the investigated
parameter variations and parameter combinations this punching shear failure scenario becomes
more likely For example low concrete strength combined with a large grout column can quickly
result in a punching shear failure mode However both test and analyses clearly showed that
punching shear does only occur at large deformation states and is preceded by significant inelastic
flexural action in the form of cracking yielding and large relative facing panel deformations which
will provide significant warning prior to punching shear failure at least in thin temporary shotcrete
facings
33 Analytical Case Studies
The same analytical model with the exception of linear tension gap springs instead of trilinear
springs was employed for case studies on representative soil nail wall facing designs which are
presented in the following In addition to the twelve case studies the effects of different
reinforcement ratios both uniformly distributed and concentrated along nail head strips on the nail
30
700
_600 rn 0
2 -500 t1 ttl
I 0 J 400 CC QJ
J e 3oo
J
= ~
~ 200 0 u
100
Note Numbers indicate nominal shear stress in terms of nbullsqrt(fc)
middot~Dia = 0 in IHgt-ampampltl Di a = 4 in -- Dia = 8 in (Baseline) _ Dia = 12 in ~Dia = 16 in
00 ~------r------------r---~-~
700
600 -rn 0
2 -500 d ttl
s 400 CC
QJ J
~ 300 J
= Q)
g 200 0 u
100
00
00 00
01 02 03 04 05 06 07 08 09 Displacement Under Concentrated Load (inches)
a) Grout Column Parameter Study (Multi Nail) A
Note Numbers indicate nominal shear middotstress in terms of nbullsqrt(fc)
= 100 kef = 170 kef (Baseline) = 240 kef
01 02 03 04 05 06 07 08 09 Displacement Under Concentrated Load (inches)
bl) Soil Stiffness Parameter Study Bl
FIG 22 Soil Nail Facing Parameter Study
31
10
10
__ _ - ---~--- --- middotmiddotmiddot---~~--~~~- ----- --middot-middotmiddot ---
700 ---------------------~------------------------~
-rn Q
600
2 -500 d cd
3 400 d
Q) -+-) e 3oo -+-)
Q)
~ 200 0 u
100
Note Numbers indicate nominal shear stress in terms of nbullsqrt(fc)
~ Linear Soil Model ampe-e-a-pound~ Bilinear Soil Model -- Trilinear Soil Model
00 ~--~---~---------r-----r--~~-~ 00 01 02 03 04 05 06 07 08 09
Displacement Under Concentrated Load inches
b2) Soil Model Parameter Study B2
10
700 ~------------~-----~---------
-rn Q
600
2 -500 d cd
3 400 d
Q) -+-) e 3oo -+-)
Q)
~ 200 0 u
100
Note Numbers indicate nominal shear stress in terms of nbullsqrt(fc)
-- P = 0 psf (Baseline) ~ P = 300 psf ltgt-ltgt-e-a-lt~ P = 6 0 0 p sf
00 4L~-~-~~--~~~------------------~ 00 01 02 03 04 05 06 07 08 09
Displacement Under Concentrated Load inches
c) Soil Cut-off Pressure Parameter Study C
FIG 22 Soil Nail Facing Parameter Study (continued)
32
10
700 -----------------------~------------------~--~
_soo Ill ~ g
--500 d 10
s 400 d Cl) e 3oo = Ql
g 200 0 u
100
Note Numbers indicate nominal shear stress in terms of nsqrt(fc)
~ Bearing Plate Thickness = 12 in --- Bearing Plate Thickness = 34 in (Baseline) ~ Bearing Plate Thickness = 1 in - Bearing Plate Thickness = 1 14 in
0 0 +-----------+--------------------------------------1 00 01 02 03 04 05 06 07 08 09
Displacement Under Concentrated Load (inches)
dl) Bearing Plate Thickness Parameter Study Dl
10
600 --------------~------------~--
-Ill ~
700
middot~ 600 -d ~ 500
I
g 400 Ill Jlt
~ 300 Cl)
0
sect 200 u
100
I I
~-------~-----~--
G-EHHHgt 4 x 4 in Bearing Plate 8 X 8 in Bearing Plate (Baseline
12 x 12 in Bearing Plate
00 ~~--r-~~--~~~--~~----r-~---r-~-----r~~ 00 01 02 03 04 05 06 07 06 09
Displacement Under Concentrated Load (inches) -~---middotmiddotmiddotmiddotmiddotmiddotmiddot ~~-~-middot-------
d2) Bearing Plate Size Parameter Study D2
FIG 22 Soil Nail Facing Parameter Study (continued)
33
10
600 -----------------------~--------------~--------
--500 A
a -C 400 IS
) 3 -g 300 ~ IS
~ ~ 200 ~
d 0 u
100
Note Numbers indicate nominal shear stress in terms of nbullsqrt(fc)
--- 2 4 middotWaler Bars irho=025~~ (Baseline) lHrlrlirio 2 5 Waler Bars middot rho=035lil ~ 2 6 Waler Bars rho=046~
00 4L-r~-----r---------------------~
-I) A ~ -C IS
s C Q) ~
~ d Q) ~
1= 0 u
00
1000
900
BOO
700
600
500
400
300
200
100
00 00
01 02 o3 04 os 06 07 oa o9 Displacement Under Concentrated Load (inches)
e) Yield Moment Parameter Study E
Note Numbers indicate nominal shear stress in terms of nbullsqrt(fc)
--- Thickness = 4 in (Baseline) ~ Thickness = 6 in Thickness = B in
10
01 02 03 04 05 06 07 OB 09 10 Displacement Under Concentrated Load (inches
f) Slab Thickness Parameter Study F
FIG 22 Soil Nail Facing Parameter Study (continued)
34
--- 500 p
- 400 ca 0
I
-g 300 ca b sect 200 CJ ~ 0 u
100
Note Numbers indicate nominal shear stress in terms of nbullsqrt(fc)
CHHHH) fc = 3000 psi -- fc = 4000 psi (Baseline) ~ fc = 5000 psi
00 ~~--r-~~--~~~--------------------__ 00
600
--- 500 ~
~ - 400 ca 0
I
~ 300 tl1
1-o
sect 200 CJ ~ 0 u
100
01 02 03 04 05 06 07 08 09 Displacement Under Concentrated Load (inches)
g) Concrete Strength Parameter Study G
10
4~ 4
Note Numbers indicate nominal shear stress in terms of nbullsqrt(fc)
~ 4 ft Soil Nail Spacing 5 Ct Soil Nail Spacing (Baseline)
6 ft Soil Nail Spacing
00 ~-----~--~-+--r----r-~----~--~~--~-r--r-~--~ 00 01 02 03 04 05 06 07 08 09
Displacement Under Concentrated Load (inches)
h) Nail Spacing Pressure Parameter Study H
FIG 22 Soil Nail Facing Parameter Study (continued)
35
10
head load-deformation response were investigated to demonstrate the complex interaction between
facing stiffnesscapacity and the Winkler spring simulation of the soil loading
A total of twelve case studies of representative soil nail wall facing designs were investigated
half of them for typical 102 mm temporary shotcrete facings and the other half for 203 mm
permanent shotcrete or cast-in-place wall facings All analyses were based on a 183 m typical nail
head module in both directions with other constant design parameters listed in Table 3
The six temporary shotcrete facing cases had nail head plates of 203 mm square dimensions
with a 19 mm plate thickness effective soil reaction moduli varying between 94 MNm3 and 376
MNm3 and total reinforcement ratios referenced to the 183 m x 102 mm facing cross-section of p = 0222 and 0465 including both uniformly distributed welded wire fabric and waler bars in
the nail head strips
The 203 mm thick permanent shotcrete or cast-in-place wall facing case studies were based in
addition to the constant case parameters in Table 3 on 229 mm square and 25 mm thick nail head
plates Reinforcement for the permanent facings consisted of 3 waler bars along the nail head
strips and uniformly distributed mild reinforcement on a 305 mm spacing in both directions with
overall reinforcement ratios of p = 0313 and 0484
A summary of all twelve case study parameter variations is provided in the case study
pafameter matrix in Table 4 Results from the individual case studies are summarized in the
following in the form of nail head load versus nail head deflection relationships All analyses
were performed for continuous facing panels with the 183 m nail spacings in both directions
TABLE 3 Constant Reference Case Parameters
Concrete Properties f 276 MPa
Facing Materials waler bars fy 455MPa Steel Properties wire fabric fy 517 MPa
Cutoff Pressure P c 287 kNm Soil Properties
Grout Column Diameter DGC 203mm
Headed-Stud Spacing SHs 152mm
Headed-Stud Body Diameter dHs 19mm ij
Nail Head Parameters Headed-Stud Head Diameter dH 32mm
Cover to Headed Stud CHs 51mm
Cover to Plate CPL Omm
Nail Spacing S 152mm
36
TABLE 4 Case Study Parameter Matrix
Case Facing Plate Plate Soil Waler at Reinforce-Thickness Width Thickness Effective Steel Steel ment
hp bPL tPL ks Ratio (mrn) (Iniii) (mrn) (MNm3
) 0 () 1 102 203 19 94 2-4 W20-6x6
2 102 203 19 188 2-4 W20-6x6 0222
3 102 203 19 376 2-4 W20-6x6
4 102 203 19 94 2-5 W40-4x4
5 102 203 19 188 2-5 W40-4x4 0465
6 102 203 19 376 2-5 W40-4x4
7 203 229 25 94 3-4 1 4 reg 12
8 203 229 25 188 3-4 4 12 0313
9 203 229 25 376 3-4 4 12
10 203 229 25 94 3-5 5 12
11 203 229 25 188 3-5 5 12 0484
12 203 229 25 376 3-5 5 12
The load-deflection response for the temporary shotcrete facing panels with 102 mrn thickness
is depicted in Fig 23 for different reinforcing patterns and soil reaction coefficients As can be
seen from the response analyses in Fig 23 the soil reaction coefficient has a significant influence
on the nail headfacing capacity Furthermore the facing panel capacity clearly seems to increase
with increasing reinforcement ratios which is somewhat contradictory to the findings in the initial
analytical parameter study [7] However more than doubling the overall reinforcement ratio from
0222 to 0465 increases the nail load capacity at a nail head displacement of 203 mm by only
20 to 30 for the different soil reaction coefficients which is still significantly less than would
be expected from the simplified assumption that a doubling of the reinforcement amount should
also approximately double the facing capacity
The load-deflection response characteristics obtained from the permanent facing case studies
are depicted in Fig 24 for reinforcement ratios of p = 0313 and 0484 respectively Again
the influence of the soil reaction coefficient was very pronounced particularly at the lower
deformation limit states ie nail head displacements of 102 mrn or less whereas subsequent to
the onset of reinforcement yielding and first concrete crushing this influence of the soil reaction
coefficient seemed to diminish
37
Increases in the reinforcement ratio by a factor of 04840313 = 155 resulted in nail head
capacity increases at the 203 rnrn nail head displacement limit state of only 75 to 15 with the
larger increases for the lower soil reaction coefficients Again this capacity was less than expected
based on the increase in overall reinforcement ratio
To investigate the reasons for this observed behavior further additional parametric studies
were performed where the parameter variations consisted of the reinforcement ratio and the
reinforcement distribution as will be explained in the following
The first set of parameter studies into the influence of the facing reinforcing patterns addressed
a baseline case of a temporary 102 rnrn shotcrete facing with a W 20 - 6 x 6 mesh and a soil
reaction coefficient of 376 MNm3 all other variables are as defined in Tables 3 and 4 The
parameter variations consisted of 2 waler bars in each direction in the form of 2 3 2 4 2 5 and
2 6 grade 60 bars resulting in overall reinforcement ratios between 016 and 039
The resulting load-deflection response at the nail head is depicted in Fig 25a for all four cases
and shows that reinforcement amount changes in the form of waler bars or strip reinforcement have
very little effect on the load-deformation characteristics of the facing panels At the 20 rnrn nail
head displacement limit state only a 10 increase in nail head capacity can be observed over the
depicted reinforcement ratio range
Using instead of concentrated reinforcement along the nail head lines in the form of waler
bars only distributed reinforcement amount variations as depicted in Fig 25b a wider range of
load-deflection response curves is obtained with an increase of around 20 in load capacity at the
20 rnrn nail head displacement limit state over the same reinforcement ratio range of 015 to
04 Thus the influence of the reinforcement distribution had a greater effect on the facing
capacity than the reinforcement amount The same findings were obtained for similar case studies
in 8 in (203 rnrn) permanent facing panels
Explanations for the observed behavior can be found in the facing panel deformation profiles
and the interaction between the facing panels and the soil reaction springs The soil spring
stiffnesses and the reinforcement distribution together with the resulting deformation profile
changes have a significantly larger influence on the nail head facing capacities than the overall
reinforcement amounts
38
~
m p
700
2 600 -d Ill 500 0 ~
] 400 Ill
- 300 Q) 0 ~ 0 200 u
100
00 00
~
m p
BOO
700
2 600 -d laquo 500 0 ~
] 400 ~
~ 300 Ql
0
sect 200 u
100
a)
00 00
Soil Stiffness
middot---- k= GO kef -- k= 120 kef - - - k= 240 kef
shy
Case 3
- ----
Facing Thickness = 40 inches Plate Width = 80 Inches
Plate Thickness = 075 inches Waler Steel = 2 4 MeshMat Steel = W20-6x6
01 02 03 04 05 06 07 08 09 Displacement Under Concentrated Load (inches)
Nail Head Load-Deflection Behavior Cases 1 to 3
Soil Stiffness
middotmiddot--- k= GO kef -- k= 120 kef - - - k= 240 kef --- Case 5
bullbullbullbullbullbullbull -middotmiddotmiddotmiddotmiddotmiddot Case 4
-middot -middot middot middotmiddot
-middot -middot --
middot Facing Thickness = 40 inches Plate Width = 60 inches Plate Thickness = 075 inches Waler Steel = 2 5 MeshMat Steel = W40-4x4
01 02 03 04 05 06 07 08 09 Displacement Under Concentrated Load (inches)
--middot----middotmiddotmiddotmiddotmiddot-----
10
b) Nail Head Load-Deflection Behavior Cases 4 to 6
FIG 23 Temporary Facing Panel Case Studies
39
2000
1800 -- ~ 1600
1400 C1
~ 1200 I
C1 1000 Q) cd 800 a Q)
600 ()
Q 0 u 400
200
00
1800 -- amp 1600
-1400 C1
~ 1200 I
~ 1000 cd ~ 000 Q Q)
() 600 1 0 u 400
200
00
a)
Soil Stiffness
middot---- k= 00 kcC -- k= 120 kef bull - - k= 240 kef
middotmiddot ---middot _ -
I
Case 9 ~-
~--~Case 8
Case 1
Facing Thickness = 60 inches Plate Width = 90 inches Plate Thickness = 100 inches Waler Steel = 3 14
middot MeshMot Steel = 4- at 12 inches
01 02 03 04 05 06 07 08 09 10 Displacement Under Concentrated Load (inches)
Nail Head Load-Deflection Behavior Cases 7 to 9
Soil SlifncS9 Case 12
middot---- k= 00 kef -- k= 120 kef bull - - k= 24 0 kef
_ -middotmiddotmiddotmiddotmiddotmiddotmiddotmiddotmiddotmiddotmiddotmiddot
~-~
____ _
bullbullbullbull -middot Case 10
F11cing Thickness = 00 incl1e11 Plate Width = 90 Inches Plate Thickness = 100 inches Walcr Steel = 3 84 MeshMol Sleel = It at 12 Inches
00 4-~~-----~----------------------~ 00 01 02 03 04 05 06 07 00 09
Displacement Under Concentrated Load (inches)
b) Nail Head Load-Deflection Behavior Cases 10 to 12
FIG 24 Permanent Facing Panel Case Studies
40
10
1000
900 -[] 800 0 a - 700 d Ill
600 0 l
0 500 QJ _ Ill
400 _ ~ QJ omiddot 300 a 0 u
[]
0
~
d Ill 0
l
d QJ _ Ill
_ ~ QJ (J
~ 0 u
200
100
00 00
1000
900
800
700
600
500
400
300
200
100
00 00
Baseline Properlies
Facing Thickness = 40 inches Plale Widlh = 110 inches Plale Thickness = 075 Inches K = 240 kd
Case A - 2~3 Wnler Bars irho = 016111 Case B - 2 4 Wnler Bars rho = 02211 Case C - 2 5 Wnler Bars rho = 030Z Case D - 2 6 Walcr Bars rho = 03~
W20x20 - 6x6 Mesh Cut-off Pressure = 06 Ksr
01 02 03 04 05 06 07 08 09 10 Displacementmiddot Under Concentrated Load (inches)
a) Strip Reinforcement
I I Distributed Reinforcement p = p~
Focing Thickness = 40 inches Plate Width = llO inches Plate Thickness = 075 Inches K = 240 kef
Cul-off Pressure = 00 Ksf 04l1
01 02 03 04 05 06 07 06 09 10 Displacement Under Concentrated Load inches)
b) Distributed Reinforcement
FIG 25 Reinforcement Ratio Effect on Nail Head Load-Deflection Behavior
41
4 SUMMARY AND CONCLUSIONS
In direct support of the FHW A demonstration project DP-1 03 and the development of I
cmhprehensive and rational limit state design models for soil nail walls the influence of parameter ~
variations on the response behavior of soil nail wall facing panels was investigated
i
i The parameter studies were performed with a specially developed nonlinear finite element
model which can capture material nonlinearities in the shotcrete or cast-in-place soil nail wall facing I
as ~ell as in the supporting soil reactions thus modeling the complex nonlinear soil structure
interaction
The analytical model was calibrated with test results from six full-scale single nail tests
conducted in a specially designed and constructed soil box and verified by means of a full-scalemiddot
nine nail facing panel test The model validation was achieved with direct measurements of the soil I
pressure under the facing panel and a one-on-one comparison with pressure or soil reaction
stiifness values used in the analytical model Results from both the analytical model and the full- scale experiments showed that for typical temporary shotcrete facing panels very ductile failure
modes can be expected due to membrane action in the reinforcement and direct soil support under J
potential punching shear cones Thus failure mechanisms with significant warning through large
deformations prior to capacity loss are likely Only in overlayed permanent walls this large
deformation warning is lost since punching and delamination of the temporary facing panel can
occur behind the permanent wall facing without any visible signs of distress The analytical
parameter studies furthermore showed that the nail load or facing capacity was most influenced by
the facing panel thickness the bearing plate size and the soil stiffness assumptions whereas
rei~forcement ratios and nail spacings primarily affected the deformation states to the highly
cm1pled soil structure interaction effect
j Case studies with common design details encountered in soil nail wall projects reconfirmed
th~se findings and can now be used as the basis for detailed design model developments in direct
SU]Jport ofFHW A demonstration project DP-103
42
-middotmiddotmiddotmiddot---
[1]( I~
[3]li i
[4] ~
[51]
REFERENCES
FHW A Soil Nail Wall Demonstration Project DP-103 Design Manual Goldermiddot
Associates Inc Redmond Washington Dec 1995
Ktirkchtibasche AG and Seible F PCYCO - Program for Cyclic Analysis of
Concrete Structures User Reference Guide Structural Systems Research Project
University of California San Diego Report No TR-9407 January 1994
Predictive and Diagnostic Analysis Model for Soil Nail Wall Facings - Single Nail Facing
Calibration SEQAD Consulting Engineers Report No 9410 to CH2M Hill Denver
October 1994
Seible F Ellery M and Latham CT Single Nail Facing Calibration Test Structural
Systems Research Project University of California San Diego Test Report No TR-
9403 October 1994
Seible F Ellery M and Kugler A Soil Nail Walls- The Single Nail Facing Panel
Test Program Structural Systems Research Project University of California San Diego
Test Report No TR-9502 August 1995
[6]1 Seible F Ellery M and Kugler A Soil Nail Walls - The Nine Nail Facing Test i
Program Structural Systems Research Project University of California San Diego Test
Report No TR-9503 May 1995
Analytical Parameter Study of Soil Nail Wall Facing Response SEQAD Consulting
Engineers Report No 95111 to CH2M Hill Denver August 1995
Analytical Case Study of Soil Nail Wall Facing Response SEQAD Consulting Engineers
Report No 9513 to CH2M Hill Denver November 1995
43
ACKNOWLEDGMENTS
The described research was made possible with funding from the Federal Highway
Administration (FHW A) under Demonstration Project DP-1 03 and the superb and relentless
leadership guidance and prodding by Ron Chassie FHW A Portland Oregon and Jim Keeley
FHW A Denver Colorado
The steering committee for the project which contributed invaluably with their discussions and
questions to the experimental and analytical program consisted of John Byrne Golder Associates
Redmond Washington Ron Chassie FHW A Portland Oregon Jim Keeley FHW A Denver
Colorado Bob Mast ABAM Federal Way Washington Jim Moese Caltrans Sacramento
California Larry Reasch CH2M Hill Denver Colorado and Chris W olschlag Golder
Associates Redmond Washington
44
--

700
_600 rn 0
2 -500 t1 ttl
I 0 J 400 CC QJ
J e 3oo
J
= ~
~ 200 0 u
100
Note Numbers indicate nominal shear stress in terms of nbullsqrt(fc)
middot~Dia = 0 in IHgt-ampampltl Di a = 4 in -- Dia = 8 in (Baseline) _ Dia = 12 in ~Dia = 16 in
00 ~------r------------r---~-~
700
600 -rn 0
2 -500 d ttl
s 400 CC
QJ J
~ 300 J
= Q)
g 200 0 u
100
00
00 00
01 02 03 04 05 06 07 08 09 Displacement Under Concentrated Load (inches)
a) Grout Column Parameter Study (Multi Nail) A
Note Numbers indicate nominal shear middotstress in terms of nbullsqrt(fc)
= 100 kef = 170 kef (Baseline) = 240 kef
01 02 03 04 05 06 07 08 09 Displacement Under Concentrated Load (inches)
bl) Soil Stiffness Parameter Study Bl
FIG 22 Soil Nail Facing Parameter Study
31
10
10
__ _ - ---~--- --- middotmiddotmiddot---~~--~~~- ----- --middot-middotmiddot ---
700 ---------------------~------------------------~
-rn Q
600
2 -500 d cd
3 400 d
Q) -+-) e 3oo -+-)
Q)
~ 200 0 u
100
Note Numbers indicate nominal shear stress in terms of nbullsqrt(fc)
~ Linear Soil Model ampe-e-a-pound~ Bilinear Soil Model -- Trilinear Soil Model
00 ~--~---~---------r-----r--~~-~ 00 01 02 03 04 05 06 07 08 09
Displacement Under Concentrated Load inches
b2) Soil Model Parameter Study B2
10
700 ~------------~-----~---------
-rn Q
600
2 -500 d cd
3 400 d
Q) -+-) e 3oo -+-)
Q)
~ 200 0 u
100
Note Numbers indicate nominal shear stress in terms of nbullsqrt(fc)
-- P = 0 psf (Baseline) ~ P = 300 psf ltgt-ltgt-e-a-lt~ P = 6 0 0 p sf
00 4L~-~-~~--~~~------------------~ 00 01 02 03 04 05 06 07 08 09
Displacement Under Concentrated Load inches
c) Soil Cut-off Pressure Parameter Study C
FIG 22 Soil Nail Facing Parameter Study (continued)
32
10
700 -----------------------~------------------~--~
_soo Ill ~ g
--500 d 10
s 400 d Cl) e 3oo = Ql
g 200 0 u
100
Note Numbers indicate nominal shear stress in terms of nsqrt(fc)
~ Bearing Plate Thickness = 12 in --- Bearing Plate Thickness = 34 in (Baseline) ~ Bearing Plate Thickness = 1 in - Bearing Plate Thickness = 1 14 in
0 0 +-----------+--------------------------------------1 00 01 02 03 04 05 06 07 08 09
Displacement Under Concentrated Load (inches)
dl) Bearing Plate Thickness Parameter Study Dl
10
600 --------------~------------~--
-Ill ~
700
middot~ 600 -d ~ 500
I
g 400 Ill Jlt
~ 300 Cl)
0
sect 200 u
100
I I
~-------~-----~--
G-EHHHgt 4 x 4 in Bearing Plate 8 X 8 in Bearing Plate (Baseline
12 x 12 in Bearing Plate
00 ~~--r-~~--~~~--~~----r-~---r-~-----r~~ 00 01 02 03 04 05 06 07 06 09
Displacement Under Concentrated Load (inches) -~---middotmiddotmiddotmiddotmiddotmiddotmiddot ~~-~-middot-------
d2) Bearing Plate Size Parameter Study D2
FIG 22 Soil Nail Facing Parameter Study (continued)
33
10
600 -----------------------~--------------~--------
--500 A
a -C 400 IS
) 3 -g 300 ~ IS
~ ~ 200 ~
d 0 u
100
Note Numbers indicate nominal shear stress in terms of nbullsqrt(fc)
--- 2 4 middotWaler Bars irho=025~~ (Baseline) lHrlrlirio 2 5 Waler Bars middot rho=035lil ~ 2 6 Waler Bars rho=046~
00 4L-r~-----r---------------------~
-I) A ~ -C IS
s C Q) ~
~ d Q) ~
1= 0 u
00
1000
900
BOO
700
600
500
400
300
200
100
00 00
01 02 o3 04 os 06 07 oa o9 Displacement Under Concentrated Load (inches)
e) Yield Moment Parameter Study E
Note Numbers indicate nominal shear stress in terms of nbullsqrt(fc)
--- Thickness = 4 in (Baseline) ~ Thickness = 6 in Thickness = B in
10
01 02 03 04 05 06 07 OB 09 10 Displacement Under Concentrated Load (inches
f) Slab Thickness Parameter Study F
FIG 22 Soil Nail Facing Parameter Study (continued)
34
--- 500 p
- 400 ca 0
I
-g 300 ca b sect 200 CJ ~ 0 u
100
Note Numbers indicate nominal shear stress in terms of nbullsqrt(fc)
CHHHH) fc = 3000 psi -- fc = 4000 psi (Baseline) ~ fc = 5000 psi
00 ~~--r-~~--~~~--------------------__ 00
600
--- 500 ~
~ - 400 ca 0
I
~ 300 tl1
1-o
sect 200 CJ ~ 0 u
100
01 02 03 04 05 06 07 08 09 Displacement Under Concentrated Load (inches)
g) Concrete Strength Parameter Study G
10
4~ 4
Note Numbers indicate nominal shear stress in terms of nbullsqrt(fc)
~ 4 ft Soil Nail Spacing 5 Ct Soil Nail Spacing (Baseline)
6 ft Soil Nail Spacing
00 ~-----~--~-+--r----r-~----~--~~--~-r--r-~--~ 00 01 02 03 04 05 06 07 08 09
Displacement Under Concentrated Load (inches)
h) Nail Spacing Pressure Parameter Study H
FIG 22 Soil Nail Facing Parameter Study (continued)
35
10
head load-deformation response were investigated to demonstrate the complex interaction between
facing stiffnesscapacity and the Winkler spring simulation of the soil loading
A total of twelve case studies of representative soil nail wall facing designs were investigated
half of them for typical 102 mm temporary shotcrete facings and the other half for 203 mm
permanent shotcrete or cast-in-place wall facings All analyses were based on a 183 m typical nail
head module in both directions with other constant design parameters listed in Table 3
The six temporary shotcrete facing cases had nail head plates of 203 mm square dimensions
with a 19 mm plate thickness effective soil reaction moduli varying between 94 MNm3 and 376
MNm3 and total reinforcement ratios referenced to the 183 m x 102 mm facing cross-section of p = 0222 and 0465 including both uniformly distributed welded wire fabric and waler bars in
the nail head strips
The 203 mm thick permanent shotcrete or cast-in-place wall facing case studies were based in
addition to the constant case parameters in Table 3 on 229 mm square and 25 mm thick nail head
plates Reinforcement for the permanent facings consisted of 3 waler bars along the nail head
strips and uniformly distributed mild reinforcement on a 305 mm spacing in both directions with
overall reinforcement ratios of p = 0313 and 0484
A summary of all twelve case study parameter variations is provided in the case study
pafameter matrix in Table 4 Results from the individual case studies are summarized in the
following in the form of nail head load versus nail head deflection relationships All analyses
were performed for continuous facing panels with the 183 m nail spacings in both directions
TABLE 3 Constant Reference Case Parameters
Concrete Properties f 276 MPa
Facing Materials waler bars fy 455MPa Steel Properties wire fabric fy 517 MPa
Cutoff Pressure P c 287 kNm Soil Properties
Grout Column Diameter DGC 203mm
Headed-Stud Spacing SHs 152mm
Headed-Stud Body Diameter dHs 19mm ij
Nail Head Parameters Headed-Stud Head Diameter dH 32mm
Cover to Headed Stud CHs 51mm
Cover to Plate CPL Omm
Nail Spacing S 152mm
36
TABLE 4 Case Study Parameter Matrix
Case Facing Plate Plate Soil Waler at Reinforce-Thickness Width Thickness Effective Steel Steel ment
hp bPL tPL ks Ratio (mrn) (Iniii) (mrn) (MNm3
) 0 () 1 102 203 19 94 2-4 W20-6x6
2 102 203 19 188 2-4 W20-6x6 0222
3 102 203 19 376 2-4 W20-6x6
4 102 203 19 94 2-5 W40-4x4
5 102 203 19 188 2-5 W40-4x4 0465
6 102 203 19 376 2-5 W40-4x4
7 203 229 25 94 3-4 1 4 reg 12
8 203 229 25 188 3-4 4 12 0313
9 203 229 25 376 3-4 4 12
10 203 229 25 94 3-5 5 12
11 203 229 25 188 3-5 5 12 0484
12 203 229 25 376 3-5 5 12
The load-deflection response for the temporary shotcrete facing panels with 102 mrn thickness
is depicted in Fig 23 for different reinforcing patterns and soil reaction coefficients As can be
seen from the response analyses in Fig 23 the soil reaction coefficient has a significant influence
on the nail headfacing capacity Furthermore the facing panel capacity clearly seems to increase
with increasing reinforcement ratios which is somewhat contradictory to the findings in the initial
analytical parameter study [7] However more than doubling the overall reinforcement ratio from
0222 to 0465 increases the nail load capacity at a nail head displacement of 203 mm by only
20 to 30 for the different soil reaction coefficients which is still significantly less than would
be expected from the simplified assumption that a doubling of the reinforcement amount should
also approximately double the facing capacity
The load-deflection response characteristics obtained from the permanent facing case studies
are depicted in Fig 24 for reinforcement ratios of p = 0313 and 0484 respectively Again
the influence of the soil reaction coefficient was very pronounced particularly at the lower
deformation limit states ie nail head displacements of 102 mrn or less whereas subsequent to
the onset of reinforcement yielding and first concrete crushing this influence of the soil reaction
coefficient seemed to diminish
37
Increases in the reinforcement ratio by a factor of 04840313 = 155 resulted in nail head
capacity increases at the 203 rnrn nail head displacement limit state of only 75 to 15 with the
larger increases for the lower soil reaction coefficients Again this capacity was less than expected
based on the increase in overall reinforcement ratio
To investigate the reasons for this observed behavior further additional parametric studies
were performed where the parameter variations consisted of the reinforcement ratio and the
reinforcement distribution as will be explained in the following
The first set of parameter studies into the influence of the facing reinforcing patterns addressed
a baseline case of a temporary 102 rnrn shotcrete facing with a W 20 - 6 x 6 mesh and a soil
reaction coefficient of 376 MNm3 all other variables are as defined in Tables 3 and 4 The
parameter variations consisted of 2 waler bars in each direction in the form of 2 3 2 4 2 5 and
2 6 grade 60 bars resulting in overall reinforcement ratios between 016 and 039
The resulting load-deflection response at the nail head is depicted in Fig 25a for all four cases
and shows that reinforcement amount changes in the form of waler bars or strip reinforcement have
very little effect on the load-deformation characteristics of the facing panels At the 20 rnrn nail
head displacement limit state only a 10 increase in nail head capacity can be observed over the
depicted reinforcement ratio range
Using instead of concentrated reinforcement along the nail head lines in the form of waler
bars only distributed reinforcement amount variations as depicted in Fig 25b a wider range of
load-deflection response curves is obtained with an increase of around 20 in load capacity at the
20 rnrn nail head displacement limit state over the same reinforcement ratio range of 015 to
04 Thus the influence of the reinforcement distribution had a greater effect on the facing
capacity than the reinforcement amount The same findings were obtained for similar case studies
in 8 in (203 rnrn) permanent facing panels
Explanations for the observed behavior can be found in the facing panel deformation profiles
and the interaction between the facing panels and the soil reaction springs The soil spring
stiffnesses and the reinforcement distribution together with the resulting deformation profile
changes have a significantly larger influence on the nail head facing capacities than the overall
reinforcement amounts
38
~
m p
700
2 600 -d Ill 500 0 ~
] 400 Ill
- 300 Q) 0 ~ 0 200 u
100
00 00
~
m p
BOO
700
2 600 -d laquo 500 0 ~
] 400 ~
~ 300 Ql
0
sect 200 u
100
a)
00 00
Soil Stiffness
middot---- k= GO kef -- k= 120 kef - - - k= 240 kef
shy
Case 3
- ----
Facing Thickness = 40 inches Plate Width = 80 Inches
Plate Thickness = 075 inches Waler Steel = 2 4 MeshMat Steel = W20-6x6
01 02 03 04 05 06 07 08 09 Displacement Under Concentrated Load (inches)
Nail Head Load-Deflection Behavior Cases 1 to 3
Soil Stiffness
middotmiddot--- k= GO kef -- k= 120 kef - - - k= 240 kef --- Case 5
bullbullbullbullbullbullbull -middotmiddotmiddotmiddotmiddotmiddot Case 4
-middot -middot middot middotmiddot
-middot -middot --
middot Facing Thickness = 40 inches Plate Width = 60 inches Plate Thickness = 075 inches Waler Steel = 2 5 MeshMat Steel = W40-4x4
01 02 03 04 05 06 07 08 09 Displacement Under Concentrated Load (inches)
--middot----middotmiddotmiddotmiddotmiddot-----
10
b) Nail Head Load-Deflection Behavior Cases 4 to 6
FIG 23 Temporary Facing Panel Case Studies
39
2000
1800 -- ~ 1600
1400 C1
~ 1200 I
C1 1000 Q) cd 800 a Q)
600 ()
Q 0 u 400
200
00
1800 -- amp 1600
-1400 C1
~ 1200 I
~ 1000 cd ~ 000 Q Q)
() 600 1 0 u 400
200
00
a)
Soil Stiffness
middot---- k= 00 kcC -- k= 120 kef bull - - k= 240 kef
middotmiddot ---middot _ -
I
Case 9 ~-
~--~Case 8
Case 1
Facing Thickness = 60 inches Plate Width = 90 inches Plate Thickness = 100 inches Waler Steel = 3 14
middot MeshMot Steel = 4- at 12 inches
01 02 03 04 05 06 07 08 09 10 Displacement Under Concentrated Load (inches)
Nail Head Load-Deflection Behavior Cases 7 to 9
Soil SlifncS9 Case 12
middot---- k= 00 kef -- k= 120 kef bull - - k= 24 0 kef
_ -middotmiddotmiddotmiddotmiddotmiddotmiddotmiddotmiddotmiddotmiddotmiddot
~-~
____ _
bullbullbullbull -middot Case 10
F11cing Thickness = 00 incl1e11 Plate Width = 90 Inches Plate Thickness = 100 inches Walcr Steel = 3 84 MeshMol Sleel = It at 12 Inches
00 4-~~-----~----------------------~ 00 01 02 03 04 05 06 07 00 09
Displacement Under Concentrated Load (inches)
b) Nail Head Load-Deflection Behavior Cases 10 to 12
FIG 24 Permanent Facing Panel Case Studies
40
10
1000
900 -[] 800 0 a - 700 d Ill
600 0 l
0 500 QJ _ Ill
400 _ ~ QJ omiddot 300 a 0 u
[]
0
~
d Ill 0
l
d QJ _ Ill
_ ~ QJ (J
~ 0 u
200
100
00 00
1000
900
800
700
600
500
400
300
200
100
00 00
Baseline Properlies
Facing Thickness = 40 inches Plale Widlh = 110 inches Plale Thickness = 075 Inches K = 240 kd
Case A - 2~3 Wnler Bars irho = 016111 Case B - 2 4 Wnler Bars rho = 02211 Case C - 2 5 Wnler Bars rho = 030Z Case D - 2 6 Walcr Bars rho = 03~
W20x20 - 6x6 Mesh Cut-off Pressure = 06 Ksr
01 02 03 04 05 06 07 08 09 10 Displacementmiddot Under Concentrated Load (inches)
a) Strip Reinforcement
I I Distributed Reinforcement p = p~
Focing Thickness = 40 inches Plate Width = llO inches Plate Thickness = 075 Inches K = 240 kef
Cul-off Pressure = 00 Ksf 04l1
01 02 03 04 05 06 07 06 09 10 Displacement Under Concentrated Load inches)
b) Distributed Reinforcement
FIG 25 Reinforcement Ratio Effect on Nail Head Load-Deflection Behavior
41
4 SUMMARY AND CONCLUSIONS
In direct support of the FHW A demonstration project DP-1 03 and the development of I
cmhprehensive and rational limit state design models for soil nail walls the influence of parameter ~
variations on the response behavior of soil nail wall facing panels was investigated
i
i The parameter studies were performed with a specially developed nonlinear finite element
model which can capture material nonlinearities in the shotcrete or cast-in-place soil nail wall facing I
as ~ell as in the supporting soil reactions thus modeling the complex nonlinear soil structure
interaction
The analytical model was calibrated with test results from six full-scale single nail tests
conducted in a specially designed and constructed soil box and verified by means of a full-scalemiddot
nine nail facing panel test The model validation was achieved with direct measurements of the soil I
pressure under the facing panel and a one-on-one comparison with pressure or soil reaction
stiifness values used in the analytical model Results from both the analytical model and the full- scale experiments showed that for typical temporary shotcrete facing panels very ductile failure
modes can be expected due to membrane action in the reinforcement and direct soil support under J
potential punching shear cones Thus failure mechanisms with significant warning through large
deformations prior to capacity loss are likely Only in overlayed permanent walls this large
deformation warning is lost since punching and delamination of the temporary facing panel can
occur behind the permanent wall facing without any visible signs of distress The analytical
parameter studies furthermore showed that the nail load or facing capacity was most influenced by
the facing panel thickness the bearing plate size and the soil stiffness assumptions whereas
rei~forcement ratios and nail spacings primarily affected the deformation states to the highly
cm1pled soil structure interaction effect
j Case studies with common design details encountered in soil nail wall projects reconfirmed
th~se findings and can now be used as the basis for detailed design model developments in direct
SU]Jport ofFHW A demonstration project DP-103
42
-middotmiddotmiddotmiddot---
[1]( I~
[3]li i
[4] ~
[51]
REFERENCES
FHW A Soil Nail Wall Demonstration Project DP-103 Design Manual Goldermiddot
Associates Inc Redmond Washington Dec 1995
Ktirkchtibasche AG and Seible F PCYCO - Program for Cyclic Analysis of
Concrete Structures User Reference Guide Structural Systems Research Project
University of California San Diego Report No TR-9407 January 1994
Predictive and Diagnostic Analysis Model for Soil Nail Wall Facings - Single Nail Facing
Calibration SEQAD Consulting Engineers Report No 9410 to CH2M Hill Denver
October 1994
Seible F Ellery M and Latham CT Single Nail Facing Calibration Test Structural
Systems Research Project University of California San Diego Test Report No TR-
9403 October 1994
Seible F Ellery M and Kugler A Soil Nail Walls- The Single Nail Facing Panel
Test Program Structural Systems Research Project University of California San Diego
Test Report No TR-9502 August 1995
[6]1 Seible F Ellery M and Kugler A Soil Nail Walls - The Nine Nail Facing Test i
Program Structural Systems Research Project University of California San Diego Test
Report No TR-9503 May 1995
Analytical Parameter Study of Soil Nail Wall Facing Response SEQAD Consulting
Engineers Report No 95111 to CH2M Hill Denver August 1995
Analytical Case Study of Soil Nail Wall Facing Response SEQAD Consulting Engineers
Report No 9513 to CH2M Hill Denver November 1995
43
ACKNOWLEDGMENTS
The described research was made possible with funding from the Federal Highway
Administration (FHW A) under Demonstration Project DP-1 03 and the superb and relentless
leadership guidance and prodding by Ron Chassie FHW A Portland Oregon and Jim Keeley
FHW A Denver Colorado
The steering committee for the project which contributed invaluably with their discussions and
questions to the experimental and analytical program consisted of John Byrne Golder Associates
Redmond Washington Ron Chassie FHW A Portland Oregon Jim Keeley FHW A Denver
Colorado Bob Mast ABAM Federal Way Washington Jim Moese Caltrans Sacramento
California Larry Reasch CH2M Hill Denver Colorado and Chris W olschlag Golder
Associates Redmond Washington
44
--

~
m p
700
2 600 -d Ill 500 0 ~
] 400 Ill
- 300 Q) 0 ~ 0 200 u
100
00 00
~
m p
BOO
700
2 600 -d laquo 500 0 ~
] 400 ~
~ 300 Ql
0
sect 200 u
100
a)
00 00
Soil Stiffness
middot---- k= GO kef -- k= 120 kef - - - k= 240 kef
shy
Case 3
- ----
Facing Thickness = 40 inches Plate Width = 80 Inches
Plate Thickness = 075 inches Waler Steel = 2 4 MeshMat Steel = W20-6x6
01 02 03 04 05 06 07 08 09 Displacement Under Concentrated Load (inches)
Nail Head Load-Deflection Behavior Cases 1 to 3
Soil Stiffness
middotmiddot--- k= GO kef -- k= 120 kef - - - k= 240 kef --- Case 5
bullbullbullbullbullbullbull -middotmiddotmiddotmiddotmiddotmiddot Case 4
-middot -middot middot middotmiddot
-middot -middot --
middot Facing Thickness = 40 inches Plate Width = 60 inches Plate Thickness = 075 inches Waler Steel = 2 5 MeshMat Steel = W40-4x4
01 02 03 04 05 06 07 08 09 Displacement Under Concentrated Load (inches)
--middot----middotmiddotmiddotmiddotmiddot-----
10
b) Nail Head Load-Deflection Behavior Cases 4 to 6
FIG 23 Temporary Facing Panel Case Studies
39
2000
1800 -- ~ 1600
1400 C1
~ 1200 I
C1 1000 Q) cd 800 a Q)
600 ()
Q 0 u 400
200
00
1800 -- amp 1600
-1400 C1
~ 1200 I
~ 1000 cd ~ 000 Q Q)
() 600 1 0 u 400
200
00
a)
Soil Stiffness
middot---- k= 00 kcC -- k= 120 kef bull - - k= 240 kef
middotmiddot ---middot _ -
I
Case 9 ~-
~--~Case 8
Case 1
Facing Thickness = 60 inches Plate Width = 90 inches Plate Thickness = 100 inches Waler Steel = 3 14
middot MeshMot Steel = 4- at 12 inches
01 02 03 04 05 06 07 08 09 10 Displacement Under Concentrated Load (inches)
Nail Head Load-Deflection Behavior Cases 7 to 9
Soil SlifncS9 Case 12
middot---- k= 00 kef -- k= 120 kef bull - - k= 24 0 kef
_ -middotmiddotmiddotmiddotmiddotmiddotmiddotmiddotmiddotmiddotmiddotmiddot
~-~
____ _
bullbullbullbull -middot Case 10
F11cing Thickness = 00 incl1e11 Plate Width = 90 Inches Plate Thickness = 100 inches Walcr Steel = 3 84 MeshMol Sleel = It at 12 Inches
00 4-~~-----~----------------------~ 00 01 02 03 04 05 06 07 00 09
Displacement Under Concentrated Load (inches)
b) Nail Head Load-Deflection Behavior Cases 10 to 12
FIG 24 Permanent Facing Panel Case Studies
40
10
1000
900 -[] 800 0 a - 700 d Ill
600 0 l
0 500 QJ _ Ill
400 _ ~ QJ omiddot 300 a 0 u
[]
0
~
d Ill 0
l
d QJ _ Ill
_ ~ QJ (J
~ 0 u
200
100
00 00
1000
900
800
700
600
500
400
300
200
100
00 00
Baseline Properlies
Facing Thickness = 40 inches Plale Widlh = 110 inches Plale Thickness = 075 Inches K = 240 kd
Case A - 2~3 Wnler Bars irho = 016111 Case B - 2 4 Wnler Bars rho = 02211 Case C - 2 5 Wnler Bars rho = 030Z Case D - 2 6 Walcr Bars rho = 03~
W20x20 - 6x6 Mesh Cut-off Pressure = 06 Ksr
01 02 03 04 05 06 07 08 09 10 Displacementmiddot Under Concentrated Load (inches)
a) Strip Reinforcement
I I Distributed Reinforcement p = p~
Focing Thickness = 40 inches Plate Width = llO inches Plate Thickness = 075 Inches K = 240 kef
Cul-off Pressure = 00 Ksf 04l1
01 02 03 04 05 06 07 06 09 10 Displacement Under Concentrated Load inches)
b) Distributed Reinforcement
FIG 25 Reinforcement Ratio Effect on Nail Head Load-Deflection Behavior
41
4 SUMMARY AND CONCLUSIONS
In direct support of the FHW A demonstration project DP-1 03 and the development of I
cmhprehensive and rational limit state design models for soil nail walls the influence of parameter ~
variations on the response behavior of soil nail wall facing panels was investigated
i
i The parameter studies were performed with a specially developed nonlinear finite element
model which can capture material nonlinearities in the shotcrete or cast-in-place soil nail wall facing I
as ~ell as in the supporting soil reactions thus modeling the complex nonlinear soil structure
interaction
The analytical model was calibrated with test results from six full-scale single nail tests
conducted in a specially designed and constructed soil box and verified by means of a full-scalemiddot
nine nail facing panel test The model validation was achieved with direct measurements of the soil I
pressure under the facing panel and a one-on-one comparison with pressure or soil reaction
stiifness values used in the analytical model Results from both the analytical model and the full- scale experiments showed that for typical temporary shotcrete facing panels very ductile failure
modes can be expected due to membrane action in the reinforcement and direct soil support under J
potential punching shear cones Thus failure mechanisms with significant warning through large
deformations prior to capacity loss are likely Only in overlayed permanent walls this large
deformation warning is lost since punching and delamination of the temporary facing panel can
occur behind the permanent wall facing without any visible signs of distress The analytical
parameter studies furthermore showed that the nail load or facing capacity was most influenced by
the facing panel thickness the bearing plate size and the soil stiffness assumptions whereas
rei~forcement ratios and nail spacings primarily affected the deformation states to the highly
cm1pled soil structure interaction effect
j Case studies with common design details encountered in soil nail wall projects reconfirmed
th~se findings and can now be used as the basis for detailed design model developments in direct
SU]Jport ofFHW A demonstration project DP-103
42
-middotmiddotmiddotmiddot---
[1]( I~
[3]li i
[4] ~
[51]
REFERENCES
FHW A Soil Nail Wall Demonstration Project DP-103 Design Manual Goldermiddot
Associates Inc Redmond Washington Dec 1995
Ktirkchtibasche AG and Seible F PCYCO - Program for Cyclic Analysis of
Concrete Structures User Reference Guide Structural Systems Research Project
University of California San Diego Report No TR-9407 January 1994
Predictive and Diagnostic Analysis Model for Soil Nail Wall Facings - Single Nail Facing
Calibration SEQAD Consulting Engineers Report No 9410 to CH2M Hill Denver
October 1994
Seible F Ellery M and Latham CT Single Nail Facing Calibration Test Structural
Systems Research Project University of California San Diego Test Report No TR-
9403 October 1994
Seible F Ellery M and Kugler A Soil Nail Walls- The Single Nail Facing Panel
Test Program Structural Systems Research Project University of California San Diego
Test Report No TR-9502 August 1995
[6]1 Seible F Ellery M and Kugler A Soil Nail Walls - The Nine Nail Facing Test i
Program Structural Systems Research Project University of California San Diego Test
Report No TR-9503 May 1995
Analytical Parameter Study of Soil Nail Wall Facing Response SEQAD Consulting
Engineers Report No 95111 to CH2M Hill Denver August 1995
Analytical Case Study of Soil Nail Wall Facing Response SEQAD Consulting Engineers
Report No 9513 to CH2M Hill Denver November 1995
43
ACKNOWLEDGMENTS
The described research was made possible with funding from the Federal Highway
Administration (FHW A) under Demonstration Project DP-1 03 and the superb and relentless
leadership guidance and prodding by Ron Chassie FHW A Portland Oregon and Jim Keeley
FHW A Denver Colorado
The steering committee for the project which contributed invaluably with their discussions and
questions to the experimental and analytical program consisted of John Byrne Golder Associates
Redmond Washington Ron Chassie FHW A Portland Oregon Jim Keeley FHW A Denver
Colorado Bob Mast ABAM Federal Way Washington Jim Moese Caltrans Sacramento
California Larry Reasch CH2M Hill Denver Colorado and Chris W olschlag Golder
Associates Redmond Washington
44
--

1000
900 -[] 800 0 a - 700 d Ill
600 0 l
0 500 QJ _ Ill
400 _ ~ QJ omiddot 300 a 0 u
[]
0
~
d Ill 0
l
d QJ _ Ill
_ ~ QJ (J
~ 0 u
200
100
00 00
1000
900
800
700
600
500
400
300
200
100
00 00
Baseline Properlies
Facing Thickness = 40 inches Plale Widlh = 110 inches Plale Thickness = 075 Inches K = 240 kd
Case A - 2~3 Wnler Bars irho = 016111 Case B - 2 4 Wnler Bars rho = 02211 Case C - 2 5 Wnler Bars rho = 030Z Case D - 2 6 Walcr Bars rho = 03~
W20x20 - 6x6 Mesh Cut-off Pressure = 06 Ksr
01 02 03 04 05 06 07 08 09 10 Displacementmiddot Under Concentrated Load (inches)
a) Strip Reinforcement
I I Distributed Reinforcement p = p~
Focing Thickness = 40 inches Plate Width = llO inches Plate Thickness = 075 Inches K = 240 kef
Cul-off Pressure = 00 Ksf 04l1
01 02 03 04 05 06 07 06 09 10 Displacement Under Concentrated Load inches)
b) Distributed Reinforcement
FIG 25 Reinforcement Ratio Effect on Nail Head Load-Deflection Behavior
41
4 SUMMARY AND CONCLUSIONS
In direct support of the FHW A demonstration project DP-1 03 and the development of I
cmhprehensive and rational limit state design models for soil nail walls the influence of parameter ~
variations on the response behavior of soil nail wall facing panels was investigated
i
i The parameter studies were performed with a specially developed nonlinear finite element
model which can capture material nonlinearities in the shotcrete or cast-in-place soil nail wall facing I
as ~ell as in the supporting soil reactions thus modeling the complex nonlinear soil structure
interaction
The analytical model was calibrated with test results from six full-scale single nail tests
conducted in a specially designed and constructed soil box and verified by means of a full-scalemiddot
nine nail facing panel test The model validation was achieved with direct measurements of the soil I
pressure under the facing panel and a one-on-one comparison with pressure or soil reaction
stiifness values used in the analytical model Results from both the analytical model and the full- scale experiments showed that for typical temporary shotcrete facing panels very ductile failure
modes can be expected due to membrane action in the reinforcement and direct soil support under J
potential punching shear cones Thus failure mechanisms with significant warning through large
deformations prior to capacity loss are likely Only in overlayed permanent walls this large
deformation warning is lost since punching and delamination of the temporary facing panel can
occur behind the permanent wall facing without any visible signs of distress The analytical
parameter studies furthermore showed that the nail load or facing capacity was most influenced by
the facing panel thickness the bearing plate size and the soil stiffness assumptions whereas
rei~forcement ratios and nail spacings primarily affected the deformation states to the highly
cm1pled soil structure interaction effect
j Case studies with common design details encountered in soil nail wall projects reconfirmed
th~se findings and can now be used as the basis for detailed design model developments in direct
SU]Jport ofFHW A demonstration project DP-103
42
-middotmiddotmiddotmiddot---
[1]( I~
[3]li i
[4] ~
[51]
REFERENCES
FHW A Soil Nail Wall Demonstration Project DP-103 Design Manual Goldermiddot
Associates Inc Redmond Washington Dec 1995
Ktirkchtibasche AG and Seible F PCYCO - Program for Cyclic Analysis of
Concrete Structures User Reference Guide Structural Systems Research Project
University of California San Diego Report No TR-9407 January 1994
Predictive and Diagnostic Analysis Model for Soil Nail Wall Facings - Single Nail Facing
Calibration SEQAD Consulting Engineers Report No 9410 to CH2M Hill Denver
October 1994
Seible F Ellery M and Latham CT Single Nail Facing Calibration Test Structural
Systems Research Project University of California San Diego Test Report No TR-
9403 October 1994
Seible F Ellery M and Kugler A Soil Nail Walls- The Single Nail Facing Panel
Test Program Structural Systems Research Project University of California San Diego
Test Report No TR-9502 August 1995
[6]1 Seible F Ellery M and Kugler A Soil Nail Walls - The Nine Nail Facing Test i
Program Structural Systems Research Project University of California San Diego Test
Report No TR-9503 May 1995
Analytical Parameter Study of Soil Nail Wall Facing Response SEQAD Consulting
Engineers Report No 95111 to CH2M Hill Denver August 1995
Analytical Case Study of Soil Nail Wall Facing Response SEQAD Consulting Engineers
Report No 9513 to CH2M Hill Denver November 1995
43
ACKNOWLEDGMENTS
The described research was made possible with funding from the Federal Highway
Administration (FHW A) under Demonstration Project DP-1 03 and the superb and relentless
leadership guidance and prodding by Ron Chassie FHW A Portland Oregon and Jim Keeley
FHW A Denver Colorado
The steering committee for the project which contributed invaluably with their discussions and
questions to the experimental and analytical program consisted of John Byrne Golder Associates
Redmond Washington Ron Chassie FHW A Portland Oregon Jim Keeley FHW A Denver
Colorado Bob Mast ABAM Federal Way Washington Jim Moese Caltrans Sacramento
California Larry Reasch CH2M Hill Denver Colorado and Chris W olschlag Golder
Associates Redmond Washington
44
--

--