of California California Counts Policy Institute of California California Counts ... Th e highest...
28
Public Policy Institute of California California Counts POPULATION TRENDS AND PROFILES Poverty in California Moving Beyond the Federal Measure By Deborah Reed Volume 7 Number 4 • May 2006 By official measures, poverty in recent years has been somewhat higher in California than in the rest of the nation: 13.3 percent versus 12.7 percent in 2004. California’s poverty ranks 15th highest among all states and the District of Columbia. However, the official measure does not take into account California’s higher cost of living. Using a conservative adjustment for costs, based on housing rents, we find that California has substantially higher poverty than the rest of the nation: 16.1 percent versus 12 percent. Once this cost adjustment is made, only Washington, D.C., and New York have higher poverty than California. Furthermore, Los Angeles, Monterey, and San Francisco Counties have poverty rates of about 20 percent—in the range of the ten highest poverty counties in the nation. Poverty varies substantially within California, not only by region but also by other demo- graphic characteristics. Young children have higher poverty rates (21%) than any other age group, and women have higher poverty rates than men (16% versus 14%). Poverty among Latinos and African Americans is roughly twice that of U.S.-born whites (about 20% versus 9%). e highest poverty rates are found among families where adults lack a high school diploma (41%), single-mother families (37%), and foreign-born Latinos (27%). Poverty rates grew substantially in California during the 1980s and then fell during the 1990s. However, by the end of the 1990s, poverty in California was still higher than it was in the late 1960s and 1970s. In contrast, in the rest of the nation, poverty rates today are similar to those of the late 1960s (and may even be lower, depending on the adjustment for price inflation). Several economic and demographic trends affect California’s poverty rate. On the one hand, growth in income inequality, immigration, and the share of people in single-mother families has put upward pressure on poverty rates. On the other hand, the increasing labor ummary Hans P. Johnson, editor
Transcript of of California California Counts Policy Institute of California California Counts ... Th e highest...

Public Policy Institute of California
California CountsPOPULATION TRENDS AND PROFILES
Poverty in CaliforniaMoving Beyond the Federal Measure
By Deborah Reed
Volume 7 Number 4 • May 2006
By offi cial measures, poverty in recent years has been somewhat
higher in California than in the rest of the nation: 13.3 percent
versus 12.7 percent in 2004. California’s poverty ranks 15th highest
among all states and the District of Columbia. However, the offi cial
measure does not take into account California’s higher cost of living.
Using a conservative adjustment for costs, based on housing rents, we fi nd that California has
substantially higher poverty than the rest of the nation: 16.1 percent versus 12 percent. Once
this cost adjustment is made, only Washington, D.C., and New York have higher poverty than
California. Furthermore, Los Angeles, Monterey, and San Francisco Counties have poverty
rates of about 20 percent—in the range of the ten highest poverty counties in the nation.
Poverty varies substantially within California, not only by region but also by other demo-
graphic characteristics. Young children have higher poverty rates (21%) than any other age
group, and women have higher poverty rates than men (16% versus 14%). Poverty among
Latinos and African Americans is roughly twice that of U.S.-born whites (about 20% versus
9%). Th e highest poverty rates are found among families where adults lack a high school
diploma (41%), single-mother families (37%), and foreign-born Latinos (27%).
Poverty rates grew substantially in California during the 1980s and then fell during the
1990s. However, by the end of the 1990s, poverty in California was still higher than it was in
the late 1960s and 1970s. In contrast, in the rest of the nation, poverty rates today are similar
to those of the late 1960s (and may even be lower, depending on the adjustment for price
infl ation). Several economic and demographic trends aff ect California’s poverty rate. On the
one hand, growth in income inequality, immigration, and the share of people in single-mother
families has put upward pressure on poverty rates. On the other hand, the increasing labor
�ummary
Hans P. Johnson, editor

California Counts Poverty in California
Public Policy Institute of California
2
force participation of single mothers and married women has led to family
income growth that reduces poverty rates. Although these factors have
played similar roles in national poverty trends, the relationship between
work and poverty is markedly diff erent in California. Between 1976 and
2004, the share of poor families with a full-time worker increased from
12 percent to 31 percent in California while holding steady at about 20 per-
cent in the rest of the nation.
Th is study points to several problems with the current federal measure
of poverty but it does not attempt to prescribe the “right” measure of pov-
erty for California. Measurement issues have important implications for
policy and improving measures is important for implementation, targeting,
and planning. Furthermore, when poverty programs do not adjust income
eligibility criteria and benefi ts to refl ect the cost of living, the programs
provide very diff erent levels of service for poor families facing diff erent
costs. Addressing these concerns will require moving beyond the federal
measure of poverty.
Deborah Reed is a research fellow and director of the population program at PPIC. Amanda
Bailey and Weiyi Shi provided research assistance on this project. Th e author acknowledges the
helpful comments and thoughtful reviews of Gregory Acs, Amanda Bailey, Arturo Gonzalez,
Hans P. Johnson, Jean Ross, and Lynette Ubois. Views expressed are those of the author and do
not necessarily refl ect the views of PPIC.
Poverty varies substantially within California, not only by region but also by other demographic characteristics.

California Counts Poverty in California
Public Policy Institute of California
3
Introduction
Nearly nine in ten Californians say that poverty is a prob-
lem in our society (Baldassare, 2006).1 Yet it is diffi cult to track the extent of the poverty problem in California because the offi cial poverty measure does not take into account California’s higher cost of living. Th e federal poverty threshold, at only $19,157 for a family of four in 2004, seems too low for California, where the cost of rent alone is often more than half this threshold. In this issue of California Counts, we begin with an exami-nation of the poverty rate in Cali-fornia, making comparisons to the rest of the nation and adjust-ments for regional costs of living. We then explore diff erences in poverty across California’s regions and demographic groups. We also discuss trends in poverty since the late 1960s and the relation-ship between poverty, the busi-ness cycle, and income inequality. Finally, we examine major demo-graphic trends that infl uence pov-erty and the changing relationship between poverty and work. We measure poverty and income trends for the years 1969 to 2004, using household survey data collected annually by the U.S. Census Bureau: Current Population Survey (CPS), Annual Social and Economic Supplement, 1970–2005. Th e CPS measures pretax money income in the year
before the survey and is the offi -cial Census Bureau source for poverty measurement. Th e CPS includes over 60,000 families nationally and roughly 5,000 families in California.2 Our analy-sis begins with poverty in 1969, as measured in the 1970 CPS. Consistent poverty measures are available in the CPS for 1967 and 1968, but we begin with 1969 to facilitate comparisons across business cycle peaks (1969, 1979, 1989, and 2000). For further details on data and measurement issues, please see the text box.
Measuring Poverty in California
In 2004, the most recent year for which poverty data are avail-
able, 4.8 million Californians, or 13.3 percent of the state popula-tion, had income below federal poverty thresholds (Figure 1).3 In the rest of the nation, the poverty rate was 12.7 percent. Compared to other states, California’s poverty rate was relatively high, but it was not among the very highest rates. California’s poverty rate in recent years has averaged 13.2 percent and was the 15th highest among the 50 states and Washington, D.C. Th e highest poverty rates, above 17 percent, were in Mississippi, Arkansas, and New Mexico.4 Offi cial poverty measures, such as those reported above, are calcu-
lated by comparing cash income to a federal poverty threshold that varies by family structure (mainly by the number of adults and chil-dren). Th e federal poverty thresh-olds were developed in the mid-1960s and were based on estimates of the cost of adequate food. Th e food budgets were multiplied by three because estimates showed that families spent about one-third of their budget on food. Th ese poverty thresholds are adjusted annually for price infl ation.5 Th e federal poverty thresholds have been the source of much crit-icism over the decades. In 1995, a National Academy of Sciences study (Citro and Michael, 1995) suggested that the poverty thresh-olds be adjusted to refl ect the cost of food, clothing, shelter, utilities, and medical expenses. Th e study
In 2004 . . . 4.8 million Californians, or 13.3 percent of the state population, had income below federal poverty thresholds.

California Counts Poverty in California
Public Policy Institute of California
4
also suggested changes to the measure of income to include the value of noncash benefi ts (e.g., food stamps) and to exclude taxes and work-related expenses (e.g., child care and transportation). Th e Census Bureau reports that applying these changes in 2003, when the offi cial national pov-erty rate was 12.5 percent, would lead to a poverty rate of as high as 13.2 percent (Dalaker, 2005).9 Estimates were not provided for specifi c states, but for the western region the offi cial poverty rate was 12.8 percent and the adjusted poverty rate was 13.4 percent. Th ese results suggest that although the poverty rate would be higher if adjusted to account for the above concerns, the adjustments would not substantially change poverty rates in the western states relative to national poverty (i.e., in the western region, poverty rates would remain slightly higher than national rates). However, for comparisons of poverty rates between California and the rest of the nation, one serious concern is that the federal thresholds do not refl ect regional diff erences in the cost of living. For example, the U.S. Depart-ment of Housing and Urban Development (HUD) estimated that the fair market rent for a two-bedroom apartment in San Francisco was $1,775 in 2004.10 On a 12-month basis, this rent amounts to $21,300—which is higher than the federal poverty
Poverty. We use two measures of poverty. First, we compare income to offi cial federal poverty thresholds. Second, to adjust for the higher cost of living in California, we follow the method recommended in a National Academy of Sciences study (Citro and Michael, 1995). To adjust the federal threshold, we use the ratio of the local fair market rent to the national average fair market rent (see the text for further discussion). Th e ratio is applied to 44 percent of the federal poverty threshold, using a national estimate that poor families spend an average of 44 percent of their budget on housing (Citro and Michael, 1995).6 Family income. Family income is defi ned as the sum of all income from all sources for all related persons living in the same residence. Unmarried adults who do not live with relatives are included in the data as a “family” of one. Because larger families require more resources than smaller families to maintain the same level of indi-vidual consumption, we adjust for family income using the num-ber and age of family members. We report income levels adjusted to represent a family with two adults and two children. We evalu-ate the distribution of family income across people, rather than across family units, by assigning to each person the adjusted income of his or her family.7
Infl ation adjustment. All income statistics are adjusted to 2004 dollars using consumer price indices for urban consumers calcu-lated by the Bureau of Labor Statistics (BLS).8 For income trends, we follow the Census Bureau and use the newer infl ation series (the CPI-U-RS or research series) because it is based on consistent meth-ods over the decades and because it matches more closely another measure of cost of living—the Personal Consumption Expenditure Defl ator. For poverty trends, we follow the Census Bureau and use the older infl ation series (CPI-U-X1) for most of the analysis, but we also consider poverty trends under the newer series.
Measuring Poverty: Technical Notes

California Counts Poverty in California
Public Policy Institute of California
5
threshold of $19,157 for a family of four in 2004. Following the method suggested by a National Academy of Sciences study (Citro and Michael, 1995), we adjust the federal poverty threshold for local rental costs based on HUD fair market rents (see the text box for further details). We calculate rental-cost-adjusted poverty for California and the rest of the nation from 1995 through 2004.11 Perhaps not surprisingly, pov-erty in California is substantially higher by the cost-adjusted mea-sure. In 2004, California’s pov-erty rate was 16.1 percent by the adjusted measure and 13.3 percent by the offi cial measure (Figure 1). In the rest of the nation, the rental-cost adjustment reduces poverty slightly, from 12.7 percent to 12.0
percent. Th is reduction occurs in part because, on average, rents are lower in the rest of the nation and because, in general, poor families are more likely to live in places with lower rental costs. Th us, by the adjusted measure, California poverty was substantially higher than that of the rest of the nation in 2004. A three-year average of the adjusted measure (2002–2004) shows that only Washing-ton, D.C. (21.0%) and New York (16.3%) had higher poverty rates than California (15.7%). Th e rental-cost adjustments provide a fairly conservative mea-sure of poverty. Th ese adjustments do not address the concern that the federal poverty thresholds are too low nationally. Instead, they assume that the federal thresholds
. . . for comparisons of poverty rates between California and the rest of the nation, one serious concern is that the federal thresholds do not refl ect regional differences in the cost of living.
are appropriate for the national average and simply make adjust-ments using the ratio of local rental costs to national rental costs. Rental-cost adjustments also ignore regional price diff er-ences for items other than housing costs (utility costs, however, are included in the fair market rents), but regional variation in the prices of other major items appears not to be as large as it is for housing costs (Citro and Michael, 1995). Most important, the rental-cost adjustment does not assume that poor families pay the full fair market rent for their region. Poor families may spend less than the fair market rent on housing for a number of reasons; for example, they may receive public housing subsidies, live with other families,
0
4
8
Perc
enta
ge
12
16
20
Rest ofUnited States
California
Figure 1. Percentage of the Population in Poverty,California and the Rest of the United States, 2004
Source: Author’s calculations from the CPS, 2005.
Note: See the text box for details on measurement.
12.012.7
16.1
13.3
OfficialCost-adjusted

California Counts Poverty in California
Public Policy Institute of California
6
crowd into small units, have a long- term lease, live in substandard housing, or own their home.12 For example, in Los Angeles in 2003, the annual fair market rent for a one-bedroom apartment was $9,168. Th e adjusted poverty threshold for a family of two adults implicitly included only $6,939 for housing costs.13 According to calculations by the Census Bureau, poor fami-lies in Los Angeles actually spent less than the fair market rent for a one-bedroom apartment but more than the housing costs in the adjusted poverty threshold—the median was $7,632 (the median household size for poor house-holds was two people).14 In the Inland Empire, a region with relatively low housing costs, the
median poor household had three people, the fair market rent for a two-bedroom apartment was $7,872, the implicit housing cost in the adjusted poverty threshold was $5,862, and the median spent on housing was $6,804. Th us, the rental-cost adjustments are conser-vative even when compared to the amount spent by poor families on housing.15 Th e cost-adjusted poverty thresholds calculated in this study are not intended to cover all of the costs for “self-suffi ciency” (Pearce, 2003) or “basic family budgets” (California Budget Project, 2005). Th ese budgets measure a much higher level of income than that typically considered as the poverty level. For example, in Los Angeles the rental-cost adjustment increases the 2004 poverty threshold for a married couple with two chil-dren from the offi cial threshold of $19,157 to $21,833. Th e California Budget Project (2005) estimates that such a family would need a basic budget of $63,079 if both parents work and $42,995 if only one parent works (the cost diff er-ence is for child care). For San Francisco, the cost-adjusted pov-erty threshold for the same family confi guration is $30,033, and the California Budget Project estimates a basic budget of $70,708 if both parents work and $46,919 if only one parent works. In sum, our cost-adjusted poverty thresholds for California are conservative in that they rep-
resent fairly low levels of income. Th e cost-adjusted measures are not meant to prescribe the “right” measure of poverty for California but rather to provide a more real-istic comparison of poverty rates across geographic areas. In the next section, we apply cost-adjusted thresholds to examine poverty dif-ferences between regions of Cali-fornia.
Poverty in California’s Regions
Poverty has varied substantially across the regions of California
in recent years. Using the federal threshold, the San Francisco Bay Area had particularly low poverty rates of only 7 percent (Figure 2).16 Poverty was also relatively low in the Sacramento region, Orange County, and San Diego County. Poverty was much higher in the San Joaquin Valley, the Central Coast, the Inland Empire, and Los Ange-les County. Th e San Francisco Bay Area, Orange County, and San Diego County rank in the mid-range of regional poverty rates, after the adjustment is made for rental costs, whereas the Sacramento region remains a relatively low poverty region. Poverty in Los Angeles County increases substantially with the rental-cost adjustment: from 15 percent to 18 percent. To some extent, poverty dif-ferences across regions refl ect the
Using the federal threshold, the San Francisco Bay Area had particularly low poverty rates of only 7 percent. Poverty was also relatively low in the Sacramento region, Orange County, and San Diego County. Poverty was much higher in the San Joaquin Valley, the Central Coast, the Inland Empire, and Los Angeles County.

California Counts Poverty in California
Public Policy Institute of California
7
demographic makeup of the regions. For example, regions with higher poverty rates tend to have higher proportions of foreign-born Lati-nos—a demographic group with one of the highest poverty rates in California. In 2001–2003, foreign-born Latinos made up 25 percent of the San Joaquin Valley population, a higher-poverty region. Th ey made up only about 12 per-cent of the San Francisco Bay Area population, a lower-poverty region. However, regional diff erences are substantial even within racial and ethnic groups. Among foreign-born Latinos, the cost-adjusted poverty rate was 33 percent in the San Joaquin Valley and 22 percent in the Bay Area. Among U.S.-born non-Hispanic whites, the poverty
rate was 6 percent in the San Joa-quin Valley and 10 percent in the Bay Area. Further analysis of the racial and ethnic dimensions of poverty is provided in the follow-ing section. For 24 of California’s 58 coun-ties, the American Community Survey (ACS) provides county-level poverty information for 2004.17 Figure 3 shows these counties, starting with those with the high-est poverty rates (Tulare and Kern) according to the federal thresh-old and ending with those with the lowest poverty rates (Placer and San Mateo). Th e green bars show the cost-adjusted poverty rates. For the state as a whole, the poverty rate was 13 percent (as measured by the federal threshold
using the ACS data), but with cost adjustments it was 17 percent. Th e adjustment has a particularly strong eff ect on the poverty rate in the San Francisco Bay Area because of the high rental costs in that region. For San Francisco County, the poverty rate using the federal threshold was 10 percent—but the adjusted poverty rate was 19 percent. Th us, San Francisco is a relatively low poverty county according to the federal thresh-old but a relatively high poverty county after adjusting for rental costs. Th e adjustment also sug-gests substantially higher poverty rates for San Mateo and Santa Clara Counties. For some counties, all of them in inland areas, the adjusted pov-
0
5
10
Perc
enta
ge
15
20
25
InlandEmpire
LosAngelesCounty
SanDiego
County
OrangeCounty
SacramentoArea
BayArea
CentralCoast
SanJoaquinValley
Figure 2. Percentage of the Population in Poverty,Regions of California, 2001–2003
Sources: Author’s calculations from the CPS, 2002–2004.
Notes: Owing to small sample sizes, we combine data covering 2001–2003. See the text box for details on measurement.
1816
1516
18
15
13
10
15
109
8
13
7
1719
OfficialCost-adjusted
To some extent, poverty differences across regions refl ect the demographic makeup of the regions.

California Counts Poverty in California
Public Policy Institute of California
8
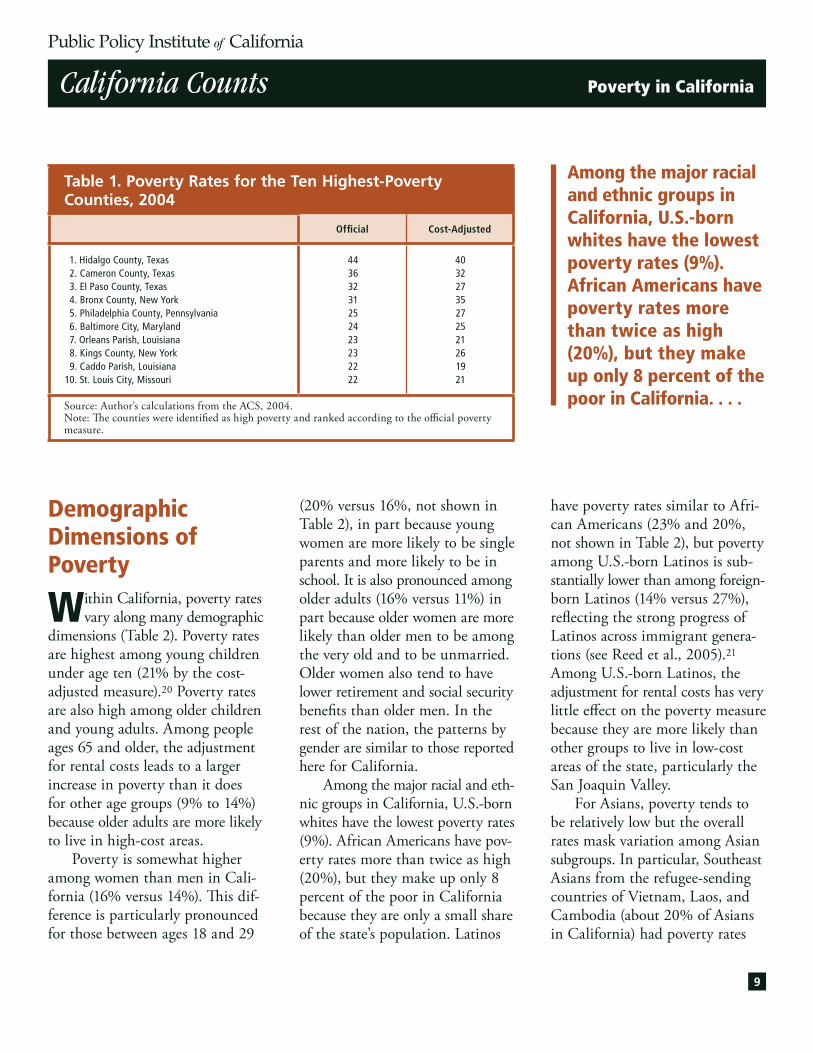
erty rate is lower than the offi cial rate. Th is occurs in places where the HUD rental rates are lower than the national average of $775 per month. Th e adjustment sug-gests substantially lower poverty rates in the three highest-poverty counties where rents tend to be particularly low. Once the adjustment is made for rental costs, most of the 24 California counties studied have higher poverty than in the rest of the nation, where poverty is about 12 percent when adjusted for rental costs. Table 1 shows the ten highest poverty counties or simi-lar jurisdictions in the nation.18 According to the federal poverty thresholds, none of the 24 Cali-fornia counties ranks in the top ten—Tulare County at 20 percent has lower poverty than the city of St. Louis at 22 percent. How-ever, once the adjustment is made for rental costs, Los Angeles (20%), Monterey (20%), and San Francisco (19%) Counties all have poverty rates that fall within the range of the highest-poverty coun-ties in the nation (albeit, at the lower end of the range). Other high-cost places outside Califor-nia also have adjusted poverty rates in this high range, including Manhattan (with poverty rates of 19.3% by the offi cial measure and 22.5% by the adjusted measure) and Washington, D.C. (with pov-erty rates of 18.9% by the offi cial measure and 23.2% by the adjusted measure).19
San Bernardino
San Joaquin
Stanislaus
Riverside
Santa Barbara
California
Sacramento
San Luis Obispo
San Diego
Alameda
Santa Cruz
San Francisco
Contra Costa
Orange
Santa Clara
Sonoma
Ventura
Solano
San Mateo
Placer
Monterey
Los Angeles
Fresno
Kern
Tulare
252015
Percentage
1050
Figure 3. Percentage of the Population in Poverty,by County, 2004
Source: Author’s calculations from the ACS, 2004.
2017
19
19
1618
16
OfficialCost-adjusted
1620
1620
1514
1514
15
1317
1317
12
1312
1712
1711
15
141414
10
10
1510
139
10
10
8
8
68
5
85
12
159
14
California Counts Poverty in California
Public Policy Institute of California
9
Demographic Dimensions of Poverty
Within California, poverty rates vary along many demographic
dimensions (Table 2). Poverty rates are highest among young children under age ten (21% by the cost-adjusted measure).20 Poverty rates are also high among older children and young adults. Among people ages 65 and older, the adjustment for rental costs leads to a larger increase in poverty than it does for other age groups (9% to 14%) because older adults are more likely to live in high-cost areas. Poverty is somewhat higher among women than men in Cali-fornia (16% versus 14%). Th is dif-ference is particularly pronounced for those between ages 18 and 29
(20% versus 16%, not shown in Table 2), in part because young women are more likely to be single parents and more likely to be in school. It is also pronounced among older adults (16% versus 11%) in part because older women are more likely than older men to be among the very old and to be unmarried. Older women also tend to have lower retirement and social security benefi ts than older men. In the rest of the nation, the patterns by gender are similar to those reported here for California. Among the major racial and eth-nic groups in California, U.S.-born whites have the lowest poverty rates (9%). African Americans have pov-erty rates more than twice as high (20%), but they make up only 8 percent of the poor in California because they are only a small share of the state’s population. Latinos
Among the major racial and ethnic groups in California, U.S.-born whites have the lowest poverty rates (9%). African Americans have poverty rates more than twice as high (20%), but they make up only 8 percent of the poor in California. . . .
have poverty rates similar to Afri-can Americans (23% and 20%, not shown in Table 2), but poverty among U.S.-born Latinos is sub-stantially lower than among foreign-born Latinos (14% versus 27%), refl ecting the strong progress of Latinos across immigrant genera-tions (see Reed et al., 2005).21 Among U.S.-born Latinos, the adjustment for rental costs has very little eff ect on the poverty measure because they are more likely than other groups to live in low-cost areas of the state, particularly the San Joaquin Valley. For Asians, poverty tends to be relatively low but the overall rates mask variation among Asian subgroups. In particular, Southeast Asians from the refugee-sending countries of Vietnam, Laos, and Cambodia (about 20% of Asians in California) had poverty rates
Table 1. Poverty Rates for the Ten Highest-Poverty Counties, 2004
Offi cial Cost-Adjusted
1. Hidalgo County, Texas 2. Cameron County, Texas 3. El Paso County, Texas 4. Bronx County, New York 5. Philadelphia County, Pennsylvania 6. Baltimore City, Maryland 7. Orleans Parish, Louisiana 8. Kings County, New York 9. Caddo Parish, Louisiana 10. St. Louis City, Missouri
44363231252423232222
40322735272521261921
Source: Author’s calculations from the ACS, 2004.Note: Th e counties were identifi ed as high poverty and ranked according to the offi cial poverty measure.

California Counts Poverty in California
Public Policy Institute of California
10
Table 2. Poverty Rates by Demographic Group, 2001–2003
Demographic Group
California Rest of the United States
Offi cial Poverty(%)
Cost-Adjusted Poverty (%)
Share of Poor(%)
Offi cial Poverty(%)
Cost-Adjusted Poverty (%)
Share of Poor(%)
All
Younger than age 10Ages 10 to 17Ages 18 to 29Ages 30 to 64Ages 65 and older
FemaleMale
White U.S.-born Foreign-bornLatino U.S.-born Foreign-bornAsian U.S.-born Foreign-bornAfrican American
Less than high school diplomaHigh school diplomaSome collegeBachelor’s degreeGraduate degree
Single, not living with relativesMarried No children With childrenSingle mother, with children
13
191716109
1312
711
1324
91117
36171053
19
41033
15
2119181214
1614
914
1427
121520
41201274
23
51237
100
20162034
9
5347
235
1040
298
342527103
25
73522
12
1815159
10
1311
810
2025
81224
3817942
20
47
38
11
18141489
1310
711
1826
91323
3616942
19
36
37
100
2114203410
5743
433
714
13
26
293723
73
28
72230
Source: Author’s calculations from the CPS, 2002–2004 (combined).Notes: Th e “share of poor” is based on the cost-adjusted poverty measure. All rows are based on a minimum of 200 families. Racial and ethnic groups do not include multiracial respondents (less than 2% of Californians) and persons not part of the four main groups (less than 2%). Th e Asian group includes Pacifi c Islanders. Foreign-born status is determined by that of the family head. Level of education is that of the adult with the highest education.
California Counts Poverty in California
Public Policy Institute of California
11
averaging about 19 percent between 1997 and 2004—roughly equiv-alent to the average for African Americans over the same period (using the federal threshold).22
Poverty rates are also high among Native Americans. Although the CPS data sample is not large enough to measure poverty among Native Americans in California (who make up less than 1 percent of the state population), other Census Bureau data show poverty rates of 16 per-cent in 2004 (using the federal threshold).23 By offi cial poverty rates (i.e., the federal threshold), none of the racial/ethnic groups noted in Table 2 has a substantially higher poverty rate in California than in the rest of the United States. In fact, U.S.-born Latinos and Afri-can Americans in California have lower poverty than their counter-parts in the rest of the United States.24 Th e estimates suggest that the higher offi cial poverty rate for California than for the rest of the nation (13% versus 12%) is mainly due to California’s greater proportion of Latinos, particularly foreign-born Latinos. Cost-adjusted poverty shows sub-stantially higher poverty rates in California than in the rest of the nation (15% versus 11%), however, because California’s low-income families tend to face much higher housing costs than do low-income families in other states. Other demographic character-istics show that poverty is particu-
larly high among people in families where the adult with the highest level of education has not fi nished high school (41%) or has fi nished high school but not gone on to college (20%). One reason that poverty is high among Latinos, especially foreign-born Latinos, is their low level of educational attainment: Over half of foreign-born Latino adults have not fi n-ished high school. Poverty is also very high among people living in single-mother families (37%).25 Using the offi cial measure, poverty among people in single-mother families is lower in California than in the rest of the nation in part because African Americans, a high-poverty group, make up only 14 percent of single-mother families in the state, whereas in the rest of the nation they make up 35 percent.26 After adjusting for rental costs, the poverty rate in these families is similar to that of the rest of the nation. However, for other family types, adjusted poverty rates tend to be higher in California than in the rest of the United States. In the rest of the nation, single-mother families make up 30 per-cent of the poor—more than any other family type. In contrast, California’s single-mother families make up a lesser share, 22 percent of the poor, and married-couple families with children make up 35 percent. Th ese diff erences occur in part because married-couple families with children in Califor-
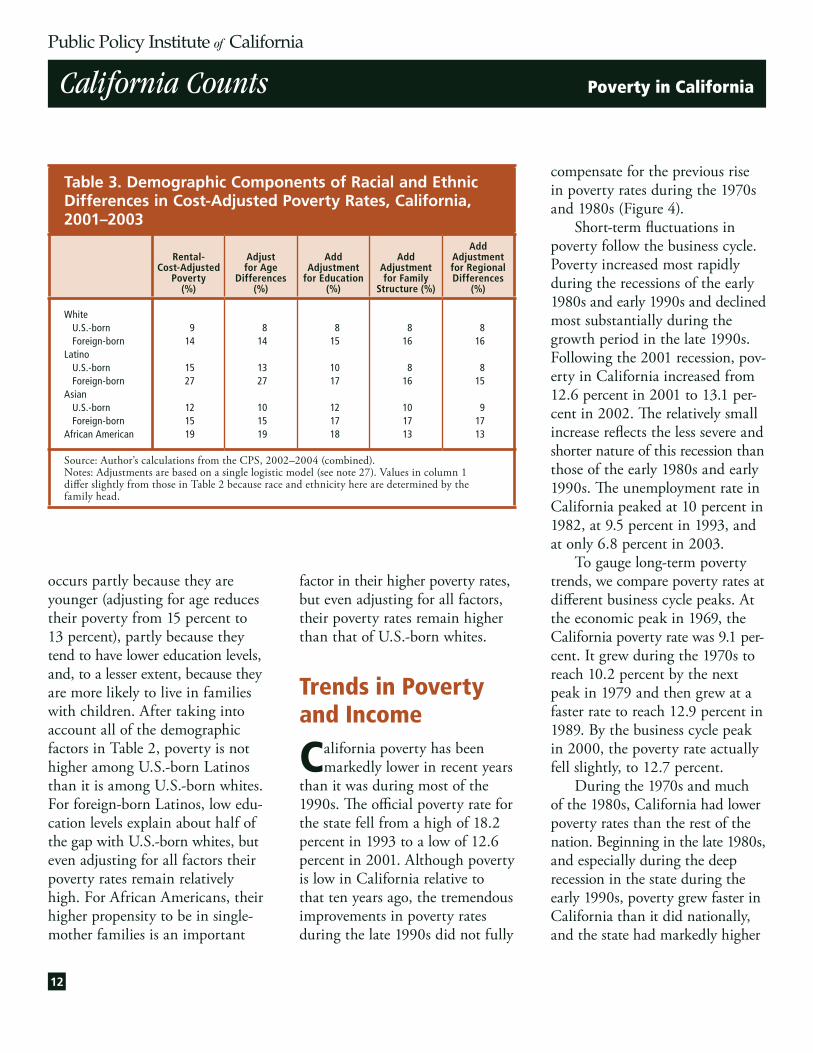
nia have higher poverty rates than they do in the rest of the coun-try (12% versus 6%) and in part because, regardless of poverty sta-tus, Californians are more likely than other Americans to live in such families (44% versus 39%). Th e discussion in this section has highlighted the interrelation-ships of demographic factors. For example, Latinos have higher poverty than other groups in part because they have lower levels of education. Using a statistical model of poverty in California, we can investigate the relationship between poverty and demographic factors, accounting for multiple related factors (Table 3).27 For example, among U.S.-born Latinos, their relatively high poverty rate compared to U.S.-born whites
Other demographic characteristics show that poverty is par-ticularly high among people in families where the adult with the highest level of education has not fi nished high school (41%) or has fi nished high school but not gone on to college (20%).
California Counts Poverty in California
Public Policy Institute of California
12
occurs partly because they are younger (adjusting for age reduces their poverty from 15 percent to 13 percent), partly because they tend to have lower education levels, and, to a lesser extent, because they are more likely to live in families with children. After taking into account all of the demographic factors in Table 2, poverty is not higher among U.S.-born Latinos than it is among U.S.-born whites. For foreign-born Latinos, low edu-cation levels explain about half of the gap with U.S.-born whites, but even adjusting for all factors their poverty rates remain relatively high. For African Americans, their higher propensity to be in single-mother families is an important
factor in their higher poverty rates, but even adjusting for all factors, their poverty rates remain higher than that of U.S.-born whites.
Trends in Poverty and Income
California poverty has been markedly lower in recent years
than it was during most of the 1990s. Th e offi cial poverty rate for the state fell from a high of 18.2 percent in 1993 to a low of 12.6 percent in 2001. Although poverty is low in California relative to that ten years ago, the tremendous improvements in poverty rates during the late 1990s did not fully
compensate for the previous rise in poverty rates during the 1970s and 1980s (Figure 4). Short-term fl uctuations in poverty follow the business cycle. Poverty increased most rapidly during the recessions of the early 1980s and early 1990s and declined most substantially during the growth period in the late 1990s. Following the 2001 recession, pov-erty in California increased from 12.6 percent in 2001 to 13.1 per-cent in 2002. Th e relatively small increase refl ects the less severe and shorter nature of this recession than those of the early 1980s and early 1990s. Th e unemployment rate in California peaked at 10 percent in 1982, at 9.5 percent in 1993, and at only 6.8 percent in 2003. To gauge long-term poverty trends, we compare poverty rates at diff erent business cycle peaks. At the economic peak in 1969, the California poverty rate was 9.1 per-cent. It grew during the 1970s to reach 10.2 percent by the next peak in 1979 and then grew at a faster rate to reach 12.9 percent in 1989. By the business cycle peak in 2000, the poverty rate actually fell slightly, to 12.7 percent. During the 1970s and much of the 1980s, California had lower poverty rates than the rest of the nation. Beginning in the late 1980s, and especially during the deep recession in the state during the early 1990s, poverty grew faster in California than it did nationally, and the state had markedly higher
Table 3. Demographic Components of Racial and Ethnic Differences in Cost-Adjusted Poverty Rates, California, 2001–2003
Rental-Cost-Adjusted
Poverty (%)
Adjust for Age
Differences (%)
Add Adjustment
for Education (%)
Add Adjustment for Family
Structure (%)
Add Adjustment for Regional Differences
(%)
White U.S.-born Foreign-bornLatino U.S.-born Foreign-bornAsian U.S.-born Foreign-bornAfrican American
914
1527
121519
814
1327
101519
815
1017
121718
816
816
101713
816
815
91713
Source: Author’s calculations from the CPS, 2002–2004 (combined).Notes: Adjustments are based on a single logistic model (see note 27). Values in column 1 diff er slightly from those in Table 2 because race and ethnicity here are determined by the family head.

California Counts Poverty in California
Public Policy Institute of California
13
Concerns with the offi cial poverty measure are important for interpreting the trends shown in Figure 4. Since the late 1960s, there have been important changes in taxes and tax credits (e.g., the Earned Income Tax Credit). Th ere have been changes in noncash subsidies such as food stamps and housing; changes in the provision of health insurance by employers and by public programs, with resulting changes in the cost of medical care for low-income fami-lies; and changes in the share of low-income families who work and thus need to pay for child care and transportation. Th ere may also have been changes in the regional cost of living (e.g., rental costs). A
poverty than the rest of the nation. Although California’s poverty rate has been relatively high since 2000, poverty has grown faster in the rest of the United States. In 2004, poverty in the rest of the nation, at 12.7 percent, was closer to that of California (13.3%) than any time since 1990. Th e cost-adjusted poverty rate, available only for the recent period, also shows a substantial decline in California during the late 1990s.28 However, the cost-adjusted rate shows more rapid growth in California poverty since 2000, so much so that by this measure poverty in California has grown faster since 2001 than it has in the rest of the nation.
0
10Perc
enta
ge
20
5
15
25
199919941989198419791974 20041969
Figure 4. Percentage of the Population in Poverty,California and the Rest of the United States, 1969–2004
Sources: Authors’ calculations from the CPS, 1970–2005.
CaliforniaCalifornia, cost-adjustedRest of United StatesRest of United States, cost-adjusted
Although California’s poverty rate has been relatively high since 2000, poverty has grown faster in the rest of the United States. In 2004, poverty in the rest of the nation, at 12.7 percent, was closer to that of California (13.3%) than any time since 1990.
full measure of trends in family economic well-being would take into account these changes. How-ever, given the nature of the avail-able data, it is diffi cult to create such a measure that goes back to the late 1960s.29 Price infl ation is particularly important to take into account in analyzing poverty trends. Th e fed-eral poverty thresholds have been adjusted each year to account for infl ation, but the method under-lying the adjustment has changed. During the late 1990s, the BLS developed a new method of infl a-tion adjustment using improved measures of quality adjustments (e.g., adjusting for the quality of electronic items), consumer fl ex-
California Counts Poverty in California
Public Policy Institute of California
14
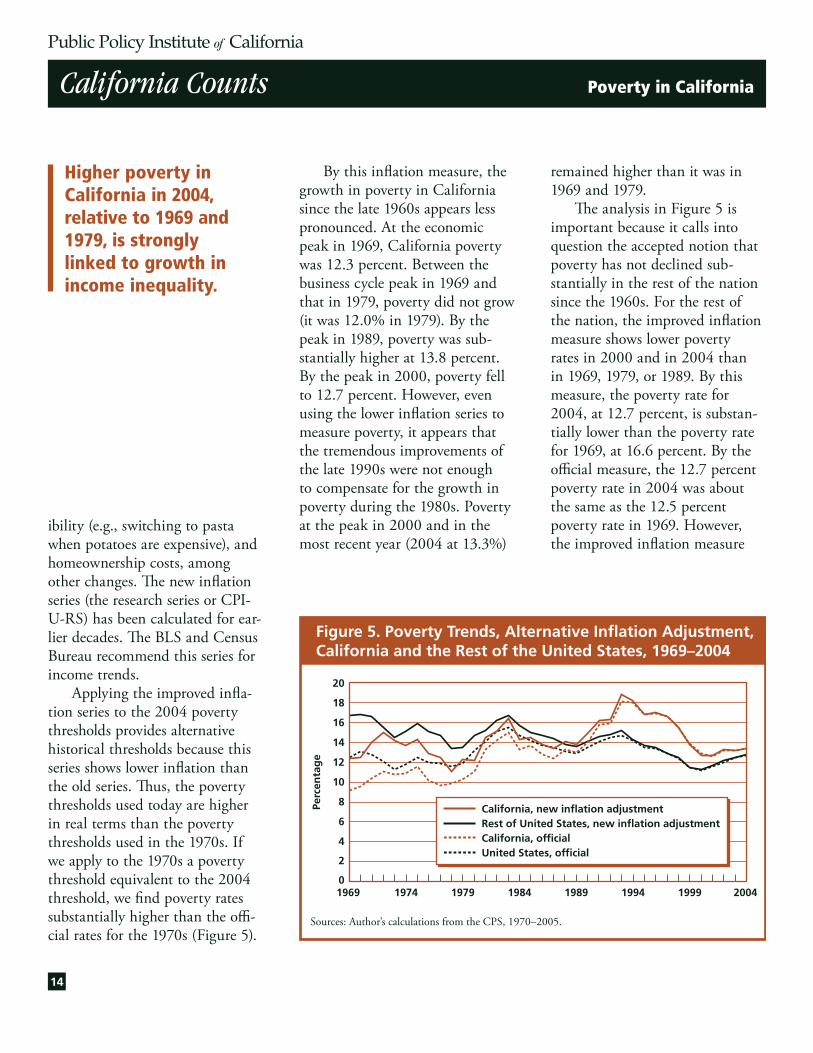
remained higher than it was in 1969 and 1979. Th e analysis in Figure 5 is important because it calls into question the accepted notion that poverty has not declined sub-stantially in the rest of the nation since the 1960s. For the rest of the nation, the improved infl ation measure shows lower poverty rates in 2000 and in 2004 than in 1969, 1979, or 1989. By this measure, the poverty rate for 2004, at 12.7 percent, is substan-tially lower than the poverty rate for 1969, at 16.6 percent. By the offi cial measure, the 12.7 percent poverty rate in 2004 was about the same as the 12.5 percent poverty rate in 1969. However, the improved infl ation measure
ibility (e.g., switching to pasta when potatoes are expensive), and homeownership costs, among other changes. Th e new infl ation series (the research series or CPI-U-RS) has been calculated for ear-lier decades. Th e BLS and Census Bureau recommend this series for income trends. Applying the improved infl a-tion series to the 2004 poverty thresholds provides alternative historical thresholds because this series shows lower infl ation than the old series. Th us, the poverty thresholds used today are higher in real terms than the poverty thresholds used in the 1970s. If we apply to the 1970s a poverty threshold equivalent to the 2004 threshold, we fi nd poverty rates substantially higher than the offi -cial rates for the 1970s (Figure 5).
By this infl ation measure, the growth in poverty in California since the late 1960s appears less pronounced. At the economic peak in 1969, California poverty was 12.3 percent. Between the business cycle peak in 1969 and that in 1979, poverty did not grow (it was 12.0% in 1979). By the peak in 1989, poverty was sub-stantially higher at 13.8 percent. By the peak in 2000, poverty fell to 12.7 percent. However, even using the lower infl ation series to measure poverty, it appears that the tremendous improvements of the late 1990s were not enough to compensate for the growth in poverty during the 1980s. Poverty at the peak in 2000 and in the most recent year (2004 at 13.3%)
0
4
Perc
enta
ge
8
16
12
2
6
14
18
10
20
199919941989198419791974 20041969
Figure 5. Poverty Trends, Alternative Inflation Adjustment,California and the Rest of the United States, 1969–2004
Sources: Author’s calculations from the CPS, 1970–2005.
California, new inflation adjustmentRest of United States, new inflation adjustmentCalifornia, officialUnited States, official
Higher poverty in California in 2004, relative to 1969 and 1979, is strongly linked to growth in income inequality.

California Counts Poverty in California
Public Policy Institute of California
15
may be problematic for measur-ing poverty trends because it may not refl ect the spending patterns of poor families. For example, poor families tend to spend a much higher proportion of their income on housing, and housing prices have increased faster than other prices (this concern is not addressed in either the older or newer infl ation series).30 For this reason, and to be comparable with the approach used by the Census Bureau, in the remaining analysis of long-term trends, we use the offi cial poverty measure. Higher poverty in California in 2004, relative to 1969 and 1979, is strongly linked to growth in income inequality. We measure income trends for the poorest fami-lies by analyzing the 10th percen-tile—the level of income at which 10 percent of people live in families with lower income and 90 percent of people live in families with higher income. We include single people living alone as families of one person and adjust income to refl ect family size (see the text box). In 2004, income for the 10th percentile in California was about $15,600. Th is represents a 12 percent decline relative to 1969, when families at the 10th percentile earned about $17,750 (infl ation-adjusted to 2004 dollars using the new method, CPI-U-RS; see Fig-ure 6, upper panel). It is important to note that the income statistics reported here are based on a dif-ferent sample of families in each
year, and so the fi gure does not show that the same families who were poor in 1969 experienced a 12 per-cent decline in income by 2004. Instead, Figure 6 shows that fami-lies at the 10th percentile in 2004 earned 12 percent less than families at the 10th percentile in 1969. Comparing California incomes in 2004 with those of 1969 shows a pattern of decline for low-income
–40
–20
Perc
enta
ge
chan
ge
sin
ce 1
969
0
60
40
20
80
199919941989198419791974 20041969
Figure 6. Percentage Change in Family Income Relativeto 1969, by Income Percentile, 1969–2004
Sources: Author’s calculations from the CPS, 1970–2005.
Note: Income-adjusted for family size and for inflation (using CPI-U-RS).
90th75thMedian25th10th
–40
–20
Perc
enta
ge
chan
ge
sin
ce 1
969
0
60
40
20
80
1999199419891984
California
Rest of United States
19791974 20041969
90th75thMedian25th10th
Comparing California incomes in 2004 with those of 1969 shows a pattern of decline for low-income families, growth for middle-income families, and stronger growth for high-income families.
California Counts Poverty in California
Public Policy Institute of California
16
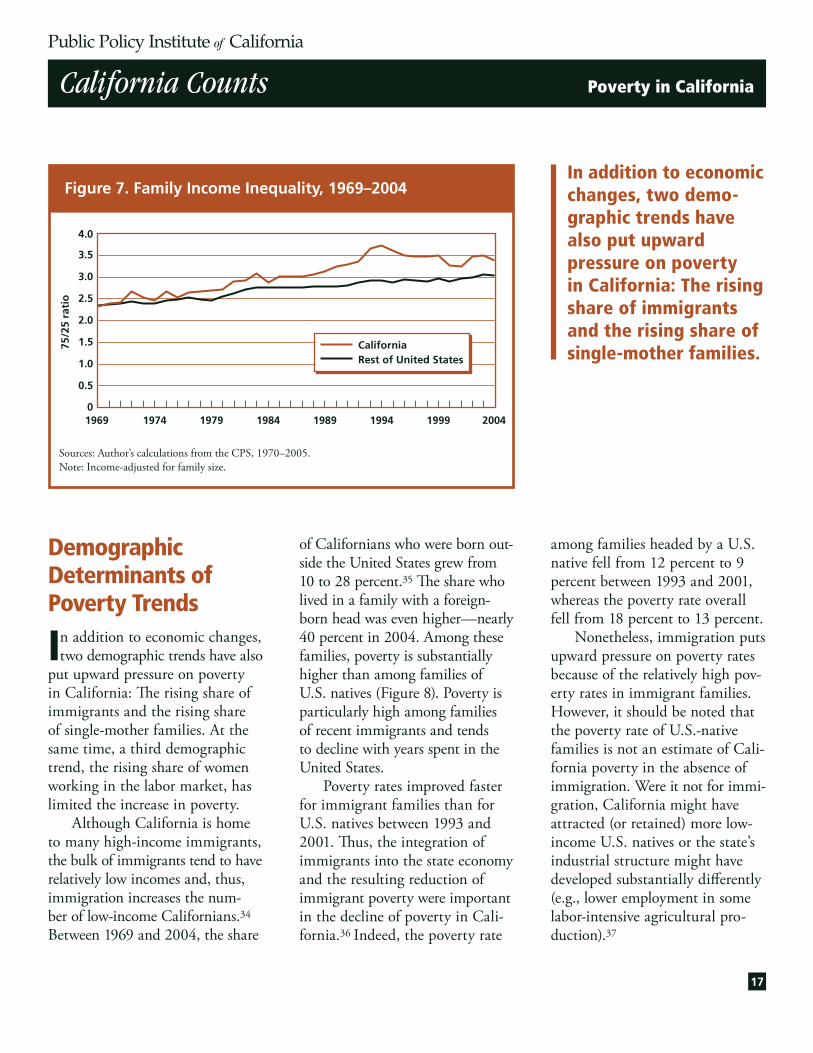
since that time, inequality has grown more rapidly in the state, so that by 2004, the 75/25 ratio in California was substantially higher than it was in the rest of the nation (3.3 versus 3.0). To analyze the relationship between rising income inequality and poverty, we consider what would have happened if family income in the bottom of the dis-tribution experienced the same growth as average family income—that is, if family income growth had been evenly distributed.32 In 1969, average income was $11,650 (not infl ation-adjusted) and in 2004, average income was $71,900. If income throughout the distribu-tion had increased by the same percentage, the poverty rate would have fallen to 7 percent in 2004. In this sense, the unequal growth in income has contributed to the rise in poverty. Th e income trends in Figure 7 refl ect major changes in the econ-omy. In particular, forces such as technological change and inter-national trade, as well as institu-tional changes such as the decline in the real value of the minimum wage and shrinking unionization rates, have resulted in declining average earnings among workers with a high school diploma or less and growth in average earnings among workers with a bachelor’s degree or more. Reed (1999) dis-cusses the importance of the grow-ing labor market value of education for income trends.
families in the rest of the nation: Family income at the 10th per-centile was 14 percent higher in 2004 than in 1969. At the 20th percentile, family income grew 28 percent between 1969 and 2004. Growth was so much faster in the rest of the nation that income levels at the 10th and 25th per-centiles went from being about 20 percent lower than in Cali-fornia to being a few percentage points higher (these numbers are not adjusted for California’s higher cost of living). At the median, income was about 15 percent lower in the rest of the nation than it was in California in 1969 and about 6 percent higher in 2004. Among higher-income families, income in California currently remains higher than in the rest of the nation by only a few percent-age points, but in 1969 it was 15 to 20 percent higher than in the rest of the nation. Over the last three decades, the gap between rich and poor has grown in California faster than in the rest of the nation. A simple way to characterize the gap is to compare the incomes of high- and low-income families. In California in 1969, families at the 75th percentile earned 2.3 times the income earned by families at the 25th percentile (Figure 7). By 2004, this inequality measure, known as the 75/25 ratio, grew to 3.3. In the rest of the nation, the 75/25 ratio was similar to that of California in 1969 (2.3). However,
families, growth for middle-income families, and stronger growth for high-income families. Low-income families at the 25th percentile earned $29,750 in 2004—a 4 per-cent decline compared to 1969. Middle-income families (those at the median) earned $56,000 in 2004, which was a 16 percent gain over 1969 income. For high-income families at the 75th percentile, income in 2004 was $99,550—41 percent higher than in 1969. At the 90th percentile, income in 2004 had grown by 59 percent since 1969, to $150,100.31 In the rest of the nation, income growth was greater than it was in California throughout the income distribution. Notably, family income grew for low-income
Over the last three decades, the gap between rich and poor has grown in California faster than in the rest of the nation.
California Counts Poverty in California
Public Policy Institute of California
17
Demographic Determinants of Poverty Trends
In addition to economic changes, two demographic trends have also
put upward pressure on poverty in California: Th e rising share of immigrants and the rising share of single-mother families. At the same time, a third demographic trend, the rising share of women working in the labor market, has limited the increase in poverty. Although California is home to many high-income immigrants, the bulk of immigrants tend to have relatively low incomes and, thus, immigration increases the num-ber of low-income Californians.34 Between 1969 and 2004, the share
of Californians who were born out-side the United States grew from 10 to 28 percent.35 Th e share who lived in a family with a foreign-born head was even higher—nearly 40 percent in 2004. Among these families, poverty is substantially higher than among families of U.S. natives (Figure 8). Poverty is particularly high among families of recent immigrants and tends to decline with years spent in the United States. Poverty rates improved faster for immigrant families than for U.S. natives between 1993 and 2001. Th us, the integration of immigrants into the state economy and the resulting reduction of immigrant poverty were important in the decline of poverty in Cali-fornia.36 Indeed, the poverty rate
0
0.5
1.0
1.575/2
5 ra
tio
2.0
3.5
3.0
2.5
4.0
199919941989198419791974 20041969
Figure 7. Family Income Inequality, 1969–2004
Sources: Author’s calculations from the CPS, 1970–2005.
Note: Income-adjusted for family size.
CaliforniaRest of United States
among families headed by a U.S. native fell from 12 percent to 9 percent between 1993 and 2001, whereas the poverty rate overall fell from 18 percent to 13 percent. Nonetheless, immigration puts upward pressure on poverty rates because of the relatively high pov-erty rates in immigrant families. However, it should be noted that the poverty rate of U.S.-native families is not an estimate of Cali-fornia poverty in the absence of immigration. Were it not for immi-gration, California might have attracted (or retained) more low-income U.S. natives or the state’s industrial structure might have developed substantially diff erently (e.g., lower employment in some labor-intensive agricultural pro-duction).37
In addition to economic changes, two demo-graphic trends have also put upward pressure on poverty in California: The rising share of immigrants and the rising share of single-mother families.

California Counts Poverty in California
Public Policy Institute of California
18
Growth in the share of single-mother families is another demo-graphic factor that has contributed to the rise in poverty in Califor-nia, especially during the 1970s. Children in families headed by a single mother have much higher poverty rates than do children in other families: 41 percent versus 13 percent in 2004. Owing to the high poverty rates in these families, the growing share of single-mother families has pushed poverty upward in California and in the rest of the United States. During the 1970s,
the share of children in single-mother families increased from about 11 percent to about 20 per-cent (Figure 9). Since 1980, the share has fl uctuated around 20 per-cent (21% in 2004).38 Th e more dominant recent trend in California has been the decline in poverty among children in single-mother families, from about 53 percent in 1997 to about 33 percent in 2001—although this decline was followed by poverty growth to 41 percent in 2004.39 With the Personal Responsibility and Work Opportunity Reconcili-ation Act of 1996, federal welfare policy led the way to state pro-grams that facilitate and promote work (CalWORKs). Th is policy, in conjunction with expansions of federal tax credits for workers in low-income families (the Earned Income Tax Credit) and a rapidly growing economy, brought about increased labor force participation and labor market earnings, espe-cially for single mothers.40 Between the mid-1990s (1994–1996) and the early 2000s (2000–2002), the share of single mothers working in the labor market increased from 69 percent, roughly the same as in the early 1970s, to 80 percent. Aver-age annual earnings among single mothers increased from $17,100 to $22,500.41 Th e increase in earnings helps explain the decline in poverty among children in female-headed families in California (as shown in Figure 9). Analysis for the rest of the United States leads to similar
0
20Perc
enta
ge
40
10
30
50
2002200120001999 200319981997199619951994 20041993
Figure 8. Percentage of the Population in Poverty,by Immigrant Status, California, 1993–2004
Sources: Author’s calculations from the CPS, 1994–2005.
Arrived in 1992 or laterArrived in 1986–1991Arrived before 1986U.S. native
Children in families headed by a single mother have much higher poverty rates than do children in other families: 41 percent versus 13 percent in 2004.

California Counts Poverty in California
Public Policy Institute of California
19
Figure 9. Poverty Trends for Children, by Family Structure,California, 1969–2004
0
20
Perc
enta
ge
40
50
10
30
60
199919941989198419791974 20041969
Sources: Author’s calculations from the CPS, 1970–2005.
Poverty rate of children in families headed by a single motherShare of children in families headed by a single motherPoverty rate of all other children
fi ndings: Th e share of working sin-gle mothers increased substantially during the 1990s, and this contrib-uted to a decline in poverty among children living in single-mother families. Growth in work participa-tion and the earnings of married women also helped to reduce poverty. Among married women, work participation increased sub-stantially, especially during the 1970s and 1980s. Th e share of married women working in the labor market increased from just over half in 1969 to about 65 per-cent in recent years. Average earn-ings grew over the same period from $8,500 to $20,800. If we
assess poverty among married-couple families, accounting for all income sources less the earnings of women, the poverty rate would have grown from 9 percent in 1969 to 17 percent in 2004. How-ever, when we include women’s earnings, the actual growth in poverty for these families went from 5 percent to only 9 percent. Although simply removing wom-en’s earnings from family income does not provide an accurate pic-ture of family income had women’s earnings not increased,42 these cal-culations do suggest that growth in women’s earnings have been an important factor in limiting pov-erty growth. Similar analysis for
the rest of the nation leads to the same conclusion: Th e rising earn-ings of married women helped to limit poverty growth.
Poverty and Work
Although women’s labor market earnings move many families
above the poverty threshold, poverty has increasingly become a reality for working families. In 1969, the poverty rate was only 6 percent among California families with a working member. In 2004, the poverty rate among these families was substantially higher, at almost 10 percent (Figure 10). In the
The share of working single mothers increased substantially during the 1990s, and this contributed to a decline in poverty among children living in single-mother families.

California Counts Poverty in California
Public Policy Institute of California
20
rest of the nation, poverty among working families did not increase over this period (about 8% in both 1969 and 2004). An impor-tant factor explaining the diff er-ence between California and the rest of the nation is the decline in earnings of low-earning men in California. For example, the annual earnings of low-earning men (at the 25th percentile of annual earnings among working men) fell by 20 percent in Cali-fornia, from $22,200 in 1969 to $17,850 in 2004, whereas earnings over the same period remained fairly stagnant in the rest of the nation (about $19,000 in both 1969 and 2004). Th e relationship between work and poverty is often measured as
0
2
4
6Pe
rcen
tag
e8
12
10
14
199919941989198419791974 20041969
Figure 10. Poverty Trends Among Working Families,California and the Rest of the United States, 1969–2004
Sources: Author’s calculations from the CPS, 1970–2005.
Note: The figure includes families where at least one member had labor earnings during the year. Poverty measurement is based on the official measure.
CaliforniaRest of United States
the share of the poor who work. Over the past three decades, roughly 60 percent of poor fami-lies in California and in the rest of the nation included a worker. However, in California the share of poor families with a full-time worker increased substantially.43 In 1969, only 12 percent of poor families had a member who worked full-time. In 2004, over 30 percent of poor families had such a worker. Th e trends in Cali-fornia stand in stark contrast to trends in the rest of the nation, in which the share of the poor who were working full-time changed very little (Figure 11). Th e growing share of poor families who are working high-lights an additional concern with
poverty measurement. Th e offi cial poverty measure does not take into account costs for working, such as child care and transpor-tation. However, with the rising share of mothers who are work-ing in the labor market, family budgets have needed to expand to cover these costs, especially child care costs. In California, the average annual cost for full-time, center-based child care for one child age two to fi ve was $7,485.44 Th is cost represents almost 40 percent of the federal poverty threshold for a family of four and more than half of the income of a full-time worker earning Cali-fornia’s minimum wage of $6.75 per hour.45
Over the past three decades, roughly 60 percent of poor families in California and in the rest of the nation included a worker. However, in California the share of poor families with a full-time worker increased substantially.

California Counts Poverty in California
Public Policy Institute of California
21
0
10
20
30
Perc
enta
ge
40
200019961992198819841980 20041976
Figure 11. Percentage of Poor with a Full-Time WorkingFamily Member, California and the Rest of theUnited States, 1976–2004
Sources: Author’s calculations from the CPS, 1977–2005.
Note: The figure shows the share of poor people who live in a family where at least one member works at least 1,900 hours during the year. Because of changes in the wording of the CPS questions on work hours, data on trends before 1976 are not available.
CaliforniaRest of United States
Conclusions
Despite substantial improve-ments during the late 1990s,
California continues to have a high poverty rate. Poverty is high in California relative to the state’s poverty rates in the 1960s and 1970s and relative to the rest of the nation. When adjustments are made for the high cost of housing, only New York and Washington, D.C., have higher poverty rates than California. Furthermore, by the cost-adjusted measure, pov-erty in California is growing even faster than it is in the rest of the nation. Th e fi ndings of this study raise at least two important questions. First, how should we measure
poverty in the state? Th is study has pointed to several problems with the current federal measure and provided some perspective on the importance of cost-of-living adjustments for comparing poverty in California to that of the rest of the nation. However, the pov-erty measures here are not meant to prescribe the “right” measure of poverty. As suggested by the National Academy of Sciences study (Citro and Michael, 1995), the federal poverty threshold should take into account the bud-get for food, clothing, and shelter and should be adjusted to refl ect geographic diff erences in housing costs. Family income resources should be calculated to include adjustments for child-support
payments, medical costs, work-related costs, taxes, and noncash benefi ts such as food stamps. Second, what can public policy do to address high poverty in Cali-fornia? Th ere are three broad classes of policy approaches. Th e fi rst class of policies seeks to improve the liv-ing conditions of the poor through programs such as food stamps, health clinics, and housing subsi-dies. Th e second class of policies seeks to reduce poverty by raising family income levels. Examples include promoting work through programs such as job training, transportation, and child care; pro-moting earnings through minimum wages and other work standards; and promoting marriage through programs such as couples counsel-
Despite substantial improvements during the late 1990s, California continues to have a high poverty rate. Poverty is high in California relative to the state’s poverty rates in the 1960s and 1970s and relative to the rest of the nation.
California Counts Poverty in California
Public Policy Institute of California
22
ing and family planning. Th e third class of policies seeks to reduce future poverty by expanding oppor-tunity, for example, by investing in quality public education, especially for children from low-resource families and neighborhoods. Th e measurement issues des-cribed in this study have impor-tant implications for these policy approaches. First, improving the measure of poverty will provide a better sense of the number of poor and the degree of need—measure-ment issues important to policy implementation, targeting, and planning. Second, poverty pro-grams often use income thresh-olds to determine eligibility and, in some cases, benefi t levels. For example, poverty guidelines, cal-culated by the U.S. Department of Health and Human Services and based on the federal poverty thresh-olds, are used to determine eligi-bility for several federal programs including the Food Stamp Pro-gram, the State Children’s Health Insurance Program, and Head Start.46 When poverty programs do not adjust income thresholds for local cost of living or for costs related to work and medical care, the programs inadvertently pro-vide very diff erent levels of service for families facing diff erent costs. Addressing these concerns will require moving beyond the current federal measure of poverty. ◆
costs, the calculation results in more than 44 percent of the poverty threshold implic-itly allocated to housing costs (e.g., 64% in San Francisco in 2004). Th e cost-adjusted measure is developed for each metropolitan area. For nonmetropolitan areas, we use a population-weighted average of county rental costs for each state.
7 We divide family income by the offi cial 2004 U.S. poverty threshold for a family of the same size and age structure. We then multiply by the poverty threshold for a family of four ($19,157). Th is evaluation of family income at the person level is equiva-lent to the offi cial procedure used to measure poverty.
8 For California income trends, we begin with the state CPI-U-X1 calculated by the California Department of Finance (DoF) as the weighted average of infl ation in the San Francisco and Los Angeles metropolitan areas (and, in some years, San Diego). For the years before 1983, when the DoF reports a state CPI-U, we convert to a state CPI-U-X1 by applying the ratio of the CPI-U-X1 to the CPI-U at the national level. We then use the same ratio-based method to calcu-late a CPI-U-RS series for California from the national CPI-U-RS series. Th e Census Bureau uses this ratio-based method to calculate a national CPI-U-RS for the years before 1978 (from the CPI-U-X1 series). See Daly, Reed, and Royer (2001) for a further discussion.
9 Adjusted poverty would be lower if the imputed value of the return on home equity were included (Dalaker, 2005). For further analysis of alternative poverty measures, see U.S. Census Bureau (2006).
10 HUD fair market rents determine the eligibility of housing units for the Section 8 Housing Assistance Payments program. Th ese rents include the costs of shelter and utilities. Th ey are based on the 40th percen-tile of available housing in most areas and the 50th percentile in a few metropolitan areas (with a minimum standard by state for nonmetropolitan counties).
11 Before 1995, the metropolitan areas defi ned by HUD are not consistent with those in the CPS. Th e defi nition of metro-politan areas in the CPS changed in 2004, resulting in a less precise match between
Notes1 Fifty-seven percent said that poverty is a “big problem” and 30 percent said it is “somewhat of a problem” in January 2006. An October 2005 survey reported similar fi ndings nationwide (Kaiser Family Founda-tion, 2005).
2 Th e CPS includes the civilian popula-tion not living in institutions. Th e size of the sample varies over the years. Income measurement in 1988 is not comparable to other years because the sample in that year was reduced, particularly in Los Angeles. CPS coverage was expanded substantially in 2002. Th e Census Bureau made changes to the CPS that aff ected poverty measurements in 1987, 1993, and 2000.
3 Th e number of people in poverty is based on California Department of Finance popu-lation estimate of almost 36.4 million. Th e Census Bureau population estimate of 35.1 million implies 4.7 million poor.
4 State rankings are based on three-year averages for 2002–2004. For the period 1999–2001, California had the 12th high-est poverty rate (Reed and Van Swearingen, 2001). State rankings are subject to mis-measurement because of survey sampling errors.
5 Several minor changes were made to the poverty thresholds in 1981, including the removal of distinctions between farm or nonfarm households and male-headed or female-headed households. Th e maximum threshold was changed from “7 or more” to “9 or more” family members (Fisher, 1997). Th ese changes appear to have little eff ect on poverty measurement in California, perhaps lowering poverty by 0.2 percentage points.
6 Th e adjustment multiplies 44 percent of the federal poverty threshold by a ratio that is calculated as the local fair market rent divided by the national average fair market rent and then adds 56 percent of the federal poverty threshold. We use rents for a two-bedroom apartment to calculate this ratio but, because this calculation is applied to families with federal poverty thresholds that vary by family size, we are not implicitly assuming that all families need a two-bedroom apartment. In places with high housing

California Counts Poverty in California
Public Policy Institute of California
23
24 Th e ACS for 2003 and 2004 also fi nds lower poverty in California than in the United States as a whole for African Ameri-cans (21% versus 26% in 2004) and for Latinos (20% versus 22% in 2004).
25 Th e family categories in Table 2 do not include some family confi gurations, such as single-father families, unmarried adults liv-ing with unmarried adult relatives, and fami-lies headed by an unmarried adult who is not the parent of children in the household. Th ese families make up about 11 percent of the poor. Cohabitating domestic partners are treated as unmarried.
26 Th e diff erence between California and the rest of the nation in the share of people in African American female-headed families is mainly due to the higher share of African Americans in the rest of the nation (13% versus 6%) and, to a lesser extent, to the higher rate of female headship among Afri-can Americans in the rest of the nation (25% versus 20%).
27 Table 3 results are based on a logistic regression of the sample of family heads (weighted to refl ect family size). Th e model includes a quadratic in age and indicator variables for the racial/ethnic, education, and family structure categories in Table 2. Th e model also includes indicator variables for the regions in Figure 2 plus the northern region and “balance of state.” Adjustments are made by assigning to each family the mean value of the characteristic (e.g., the mean value of the head’s age) and calculating the predicted probability of poverty.
28 Cost adjustments before 1996 are more diffi cult to make because of inconsistencies in the defi nition of metropolitan area in the fair market rent data and the CPS.
29 See Dalaker (2005) for assessments of national poverty trends from 1987 to 2003 under alternative poverty measures.
30 Between 1995 and 2004, the average fair market rent increased 35 percent nationally. Th e CPI-U-RS shows 23 percent infl ation over this period. See Gavin (1999) for a des-cription of the relationship between housing price infl ation and consumer price indices.
17 Tabulated data from the Census Bureau provide the share of the population in each of several income categories, for example: 0.75 to 0.99 times the federal poverty line (FPL), 1.00-1.24 times FPL, 1.25-1.49 times FPL, and so forth. We use HUD rents to calculate the ratio of the adjusted poverty line to the FPL for each county. We use the ACS tables and linear interpolation to calcu-late the share of the population with income below that ratio. Th e calculation is subject to error if rental costs vary substantially across counties within the same metropolitan area.
18 Th e ACS does not tabulate data for all counties. Th e poverty ranking tables for counties include 236 counties, or similar places, and is intended to represent most counties with over 250,000 in population. Th e Census Bureau includes some cities in the county rankings because they are independent jurisdictions considered to be “county equivalents.”
19 We did not calculate the cost-adjusted poverty rate for all 236 counties in the ACS poverty ranking table. Th erefore, we did not determine the ten highest poverty counties using the adjusted poverty measure.
20 Unless otherwise noted, the discussion in the rest of this section focuses on the cost-adjusted measure of poverty.
21 “Foreign-born” is defi ned here as any per-son born outside the 50 states, except those born abroad of American parents.
22 Southeast Asians are defi ned as people born in Vietnam, Laos, or Cambodia, plus anyone whose mother or father was born in one of those three countries. Between 1994 and 1997, poverty rates for Southeast Asians fell from over 50 percent to 31 percent. Since 1997, annual poverty rates as measured in the CPS have fl uctuated between 10 and 27 percent, suggesting the appropriateness of a longer-term average when using CPS data to compare Southeast Asians with other groups.
23 Poverty rates for Native Americans are based on Census Bureau tabulations from the ACS for 2004 (for those reporting only one race). For Latinos, the ACS poverty rate was 20 percent and for African Americans it was 21 percent.
CPS and HUD data for 2004. However, the 2004 cost-adjusted poverty rates appear credible because they are quite similar to those for 2003 (see Figure 4).
12 See California Budget Project (2004) for a discussion of crowded and substandard living conditions as well as the availability of aff ordable housing. Johnson and Bailey (2005) fi nd that over 10 percent of recently purchased homes and almost 20 percent of homes owned at least ten years are owned by Californians with incomes under $25,000. Because poverty status is based on current income, a retired family, for example, might fully own a valuable home but be considered poor because of low income.
13 Th e housing costs implicit in the adjusted poverty threshold is the ratio of Los Angeles fair market rent to the national average (1.28) times 44 percent of the poverty threshold (0.44 × $12,321 for two adults).
14 Housing cost statistics for Los Angeles (in 2003) and the Inland Empire (in 2002) are from the American Housing Survey (U.S. Census Bureau, 2003 and 2004).
15 It is appropriate to adjust the poverty thresholds for the rental cost rather than the amount actually spent on housing so that the thresholds refl ect similar circumstances across locations. For example, if poor fami-lies in high-cost regions live in more crowded conditions to save money, then an adjust-ment based on spending would not refl ect the same housing conditions (i.e., degree of crowding) in every location.
16 Data for 2004 were not used because of inconsistencies in the defi nition of metro-politan areas between the CPS and HUD fair market rent data. Regions are made up of counties identifi ed in the CPS, including those identifi ed as parts of metropolitan areas. Th e Sacramento region includes El Dorado, Placer, Sacramento, and Yolo Counties. Th e Bay Area includes Alameda, Contra Costa, Marin, Napa, San Francisco, San Mateo, Santa Clara, and Solano Counties. Th e Central Coast includes Monterey, San Luis Obispo, and Santa Barbara Counties. Th e San Joaquin Valley includes Fresno, Kern, Madera, Merced, San Joaquin, Stanislaus, and Tulare Counties. Th e Inland Empire is Riverside and San Bernardino Counties.
24
California Counts Poverty in California
Public Policy Institute of California
by a U.S. native declined from 66 percent to 61 percent.
37 See Reed (1999) for further discussion of the eff ect of immigration on the California labor market.
38 In the rest of the nation, the patterns are similar to those described here for Califor-nia. However, in the rest of the nation, the share of children in single-mother families continued to grow from about 19 percent in 1980 to 24 percent in 2004.
39 In the rest of the nation, child poverty in single-mother families peaked in 1991 at 56 percent, fell to 40 percent in 2001, and then increased to 42 percent in 2004.
40 See Looney (2005) and studies cited therein for examinations of the causes of employment changes among single mothers.
41 For single mothers and married women, the work statistics include only adults ages 18 to 64. Average annual earnings include those who did not work (i.e., earnings of zero). Growth in earnings is due to working more and to higher earnings per hour worked. See Reed (2004) for analysis of trends in women’s earnings and work participation in California.
42 For example, if married women had not increased their labor force participation, their husbands might have chosen to work more or to seek higher-paid positions. See Cancian and Reed (2002) for further analysis of female-headed families, women’s earnings, and poverty.
43 Full-time work is measured as 1,900 hours or more, which is equivalent to 47.5 weeks at 40 hours per week or 52 weeks at about 37 hours per week.
44 Child care cost statistics are from the California Child Care Resource and Referral Network (2006). Th ese statistics are based on a 2002 survey, adjusted upward 11 per-cent for infl ation.
45 Not all working families pay for child care. Almost half of California children up to age fi ve who regularly receive some non-parental care are cared for by a relative at least part of the time, sometimes with pay and sometimes without pay. Care by a rela-
tive is slightly more common in the rest of the nation (O’Brien-Strain, Moyé, and Sonenstein, 2003). See Acs and Loprest (2005) for a description of low-income work-ing families in the United States and Acs and Nichols (2005) for a description of budgets for these families.
46 See http://aspe.hhs.gov/poverty/ for a com-plete list of federal programs using poverty guidelines for eligibility criteria.
31 To ensure the confi dentiality of respon-dents, the Census Bureau did not report individual wages and salaries above $150,000 for 2004. Th e dollar amount of the topcode has varied over the years. To reduce the eff ect of changes in topcodes, we apply a consistent topcode of the highest 4 percent of earnings and the highest 4 percent of individual income in each year. Because of topcodes, the CPS data cannot be used to explore extremely high incomes. See Piketty and Saez (2001) for an analysis of income inequality in tax return data, including extremely high incomes.
32 Danziger and Gottschalk (1995) developed this approach. Th e calculation is performed with the microdata from the 1970 CPS. Family income is multiplied by the ratio of average income in 2004 to the average income in 1969 (not infl ation-adjusted); this income level is compared with 2004 poverty thresholds. Income statistics are adjusted for family size.
33 Between 1994 and 2000, income grew faster among low-income families than among higher-income families and income inequality declined. Th is was also a period of poverty decline in California (shown in Figure 4).
34 Additionally, immigration has increased the supply of workers with low education and thus is another factor that contributes to the growing value of education in the labor market. A study by the National Academy of Sciences (Smith, 1997) concluded that esti-mates of the eff ect of immigration on native wages “cluster around zero” (p. 221). In more recent research, Borjas (2003) fi nds a small negative eff ect of immigration on the wages of low-skilled natives. See Reed (1999) for a discussion in the California context.
35 Data for 1969 come from the 1970 Census.
36 Poverty declines with years spent in the United States as immigrants become more integrated into the economy and their economic status improves. Furthermore, immigrants who are doing poorly may leave the United States—causing the measured trend over time to improve. In addition, the poverty trend for immigrants arriving after 1992 refl ects the conditions of new cohorts arriving each year. Over the period 1993 to 2004, the share of people in families headed

25
California Counts Poverty in California
Public Policy Institute of California
Danziger, Sheldon, and Peter Gottschalk, America Unequal, Russell Sage Foundation and Harvard University Press, Cambridge, Massachusetts, 1995.
Fisher, Gordon, “Th e Development and His-tory of the U.S. Poverty Th resholds—A Brief Overview,” Newsletter of the Government Statistics Section and the Social Statistics Section of the American Statistical Associa-tion, Washington, D.C., Winter 1997.
Gavin, William T., “Consumer Price Infl a-tion and Housing Prices,” National Economic Trends, Th e Federal Reserve Bank of St. Louis, St. Louis, Missouri, April 1999.
Johnson, Hans P., and Amanda Bailey, “California’s Newest Homeowners: Aff ord-ing the Unaff ordable,” California Counts, Vol. 7, No. 1, August 2005.
Kaiser Family Foundation, National Survey of Poverty in America, Menlo Park, Califor-nia, October 2005.
Looney, Adam, “Th e Eff ects of Welfare Reform and Related Policies on Single Moth-ers’ Welfare Use and Employment,” Federal Reserve Working Paper No. 2005-45, Wash-ington, D.C., 2005.
O’Brien-Strain, Margaret, Laura Moyé, and Freya Lund Sonenstein, Arranging and Pay-ing for Child Care, Public Policy Institute of California, San Francisco, California, 2003.
Pearce, Diana, with Jennifer Brooks, Th e Self-Suffi ciency Standard for California 2003, Wider Opportunities for Women, Washing-ton, D.C., available at www.sixstrategies.com.
Piketty, Th omas, and Emmanual Saez, “Income Inequality in the United States, 1913–1998,” NBER Working Paper 8467, Cambridge, Massachusetts, 2001.
Reed, Deborah, California’s Rising Income Inequality: Causes and Concerns, Public Policy Institute of California, San Francisco, California, 1999.
Reed, Deborah, “Women, Work, and Family in California,” California Counts, Vol. 6, No. 2, November 2004.
Reed, Deborah, and Richard Van Swearin-gen, “Poverty in California: Levels, Trends, and Demographic Dimensions,” California Counts, Vol. 3, No. 3, November 2001.
Reed, Deborah, Laura E. Hill, Christopher Jepsen, and Hans P. Johnson, Educational Progress Across Immigrant Generations in Cali-fornia, Public Policy Institute of California, San Francisco, California, 2005.
Smith, James P. (ed.), Th e New Americans, National Academy Press, Washington, D.C., 1997.
U.S. Census Bureau, American Housing Survey for the Riverside–San Bernardino–Ontario Metropolitan Area: 2002, Current Housing Reports, Tables 2.9 and 2.13, Washington, D.C., July 2003.
U.S. Census Bureau, American Housing Survey for the Los Angeles–Long Beach Metro-politan Area: 2003, Current Housing Reports, Tables 2.9 and 2.13, Washington, D.C., December 2004.
U.S. Census Bureau, Th e Eff ects of Govern-ment Taxes and Transfers on Income and Poverty: 2004, Washington, D.C., February 2006.
ReferencesAcs, Gregory, and Pamela J. Loprest, Who Are Low-Income Working Families? Th e Urban Institute, Washington, D.C., 2005.
Acs, Gregory, and Austin Nichols, Working to Make Ends Meet: Understanding the Income and Expenses of Low-Income Families, Th e Urban Institute, Washington, D.C., 2005.
Baldassare, Mark, PPIC Statewide Survey: Special Survey on the California State Budget, Public Policy Institute of California, San Francisco, California, January 2006. Borjas, George, “Th e Labor Demand Curve Is Downward Sloping: Reexamining the Impact of Immigration on the Labor Mar-ket,” Quarterly Journal of Economics, Vol. 118, No. 4, 2003.
California Budget Project, Locked Out 2004: California’s Aff ordable Housing Crisis, Cali-fornia Budget Project, Sacramento, Califor-nia, 2004.
California Budget Project, Making Ends Meet: How Much Does It Cost to Raise a Fam-ily in California? California Budget Project, Sacramento, California, 2005.
California Child Care Resource and Referral Network, Th e 2005 California Child Care Portfolio, San Francisco, California, 2006.
Cancian, Maria, and Deborah Reed, “Changes in Family Structure: Implications for Poverty and Related Policy,” in Sheldon H. Danziger and Robert H. Haveman (eds.), Understanding Poverty, Harvard University Press, Cambridge, Massachusetts, 2002, pp. 69–96.
Citro, Constance F., and Robert T. Michael (eds.), Measuring Poverty: A New Approach, National Academy Press, Washington, D.C., 1995.
Dalaker, Joe, Alternative Poverty Estimates in the United States: 2003, U.S. Census Bureau, Washington, D.C., 2005.
Daly, Mary C., Deborah Reed, and Heather N. Royer, “Population Mobility and Income Inequality in California,” California Counts, Vol. 2, No. 4, May 2001.


California Counts Poverty in California
Public Policy Institute of California
27
Th e Public Policy Institute of California is a private, nonprofi t research organization established in 1994 with an endowment from William R. Hewlett. Th e Institute conducts independent, objective, nonpartisan research on the economic, social, and political issues aff ecting Californians. Th e Institute’s goal is to raise public awareness of these issues and give elected representatives and other public offi cials in California a more informed basis for developing policies and programs. PPIC does not take or support positions on any ballot measure or on any local, state, or federal legislation, nor does it endorse, support, or oppose any political parties or candidates for public offi ce.
PUBLIC POLICY INSTITUTE OF CALIFORNIA
500 Washington Street, Suite 800 • San Francisco, California 94111Telephone: (415) 291-4400 • Fax: (415) 291-4401 • www.ppic.org
ISSN #1554-401X
Board of Directors
Th omas C. Sutton, ChairChairman and Chief Executive Offi cerPacifi c Life Insurance Company
Linda GriegoPresident and Chief Executive Offi cerGriego Enterprises, Inc.
Edward K. HamiltonChairmanHamilton, Rabinovitz & Alschuler, Inc.
Gary K. HartFounderInstitute for Education ReformCalifornia State University, Sacramento
Walter B. HewlettDirectorCenter for Computer Assisted Research in the Humanities
David W. LyonPresident and Chief Executive Offi cerPublic Policy Institute of California
Cheryl White MasonVice-President Litigation Legal Department Hospital Corporation of America
Ki Suh ParkDesign and Managing PartnerGruen Associates
Constance L. RiceCo-DirectorTh e Advancement Project
Raymond L. WatsonVice Chairman of the Board EmeritusTh e Irvine Company
Carol WhitesidePresidentGreat Valley Center
California Counts Poverty in California
Public Policy Institute of California
NON-PROFIT ORG.U.S. POSTAGE
PAIDBRISBANE, CAPERMIT #83
PUBLIC POLICY INSTITUTE OF CALIFORNIA
500 Washington Street, Suite 800
San Francisco, California 94111
Alternative Measures of Poverty in California
In This Issue
Recent issues of
California CountsPOPULATION TRENDS AND PROFILES
Time to Work: Commuting Times and Modes of Transportation of California Workers
California’s Inland Empire: The Leading Edge of Southern California Growth
California’s Newest Homeowners: Affording the Unaffordable
Second-Generation Immigrants in California
Educational Resources and Outcomes in California, by Race and Ethnicity
Women, Work, and Family in California
California’s Multiracial Population
are available free of charge on PPIC’s websitewww.ppic.org