of 8 Wall Assemblies Measurement of Airborne and Impact...
168
The results in this report only apply to the specimen that was tested Page 1 of 168 CONSTRUCTION Measurement of Airborne Sound Insulation of 8 Wall Assemblies Measurement of Airborne and Impact Sound Insulation of 29 Floor Assemblies Nordic Engineered Wood Report No. A1-006070.10 July 23, 2015
-
Upload
vuongkhanh -
Category
Documents
-
view
215 -
download
0
Transcript of of 8 Wall Assemblies Measurement of Airborne and Impact...

The results in this report only apply to the specimen that was tested Page 1 of 168
CONSTRUCTION
Measurement of Airborne Sound Insulation of 8 Wall Assemblies Measurement of Airborne and Impact Sound Insulation of 29 Floor Assemblies
Nordic Engineered Wood Report No. A1-006070.10 July 23, 2015

This page was
intentionally
left blank


This page was
intentionally
left blank

Client Report A1-006070.10 | Construction | Acoustics Laboratory
Page 5 of 168
Summary
The following report contains the Transmission Loss (TL) results measured in accordance with ASTM E90-09 of 8 cross-laminated timber (CLT) wall assemblies and the TL results and normalized impact sound pressure level results measured in accordance with ASTM E492-09 of 26 CLT floor assemblies and 3 glulam floor assemblies.
Reference tables containing the specimen number, sketch, short description, rating(s) as well as the page number of all the assemblies tested are found starting on page 16.
The wall assemblies were built and tested between November and December 2014. The specimen descriptions and the reported mass per area of the 8 wall assemblies that were previously published under report numbers A1-006070.1 to A1-006070.8 have been revised in this report.
The floor assemblies were built and tested between December 2014 and June 2015. The specimen description and the reported mass per area of floor specimen A1-006070-11F that were previously published under report number A1-006070.9 have been revised in this report.
The following discussion section contains analyses and graphical comparisons of the tested wall and floor assemblies used to highlight key findings:
1. In-situ TL vs. Laboratory TL Results 2. TL Results of Current Bare Assemblies vs. Previous Assemblies 3. TL Results of Walls vs. Floors 4. TL Results of CLT Walls 5. TL Results of CLT Floors 6. TL Improvement of Toppings and Resilient Membranes 7. TL Difference of Poured vs. Precast Concrete Topping 8. TL Interpolation for Floor Toppings 9. TL Improvement of Floor Coverings 10. TL Improvement of Hung Ceilings 11. TL Results of Glulam Floors
The last three pages of this report contain additional test setup information for each facility.
APPENDIX: ASTM E90-09 – Airborne Sound Transmission – Wall Facility
APPENDIX: ASTM E90-09 – Airborne Sound Transmission – Floor Facility
APPENDIX: ASTM E492-09 – Light Impact Sound Transmission – Floor Facility

Client Report A1-006070.10 | Construction | Acoustics Laboratory
Page 6 of 168
1. In-situ TL vs. Laboratory TL Results
The laboratory sound insulation results measured according to ASTM E90 and ASTM E492 represent an upper limit to the direct sound insulation in the field. A variety of other factors influence the in-situ performance, for example flanking sound transmission, specimen size, specimen coupling, and construction workmanship.
2. TL Results of Current Bare Assemblies vs. Previous Assemblies
The CLT 5 ply 175 mm thick wall and floor have been measured twice in the NRC acoustic laboratories, once in 2012 and once in 2015. Rebuild repeatability may be defined as the closeness of agreement between results obtained with the same test method in the same laboratory on nominally identical test specimens constructed with nominally identical materials. The results of the bare floor assembly measured in 2012 and 2015 are shown in Figure 1. Although the CLT panels were nominally of the same area density (91 kg/m2), the panels were different and were joined differently for the two separate tests. The floor assemblies achieved STC ratings of 41 and 42, with TL variations of up to 3 dB.
Figure 1 – Bare Cross-Laminated Timber Floors
20
25
30
35
40
45
50
55
60
63 125 250 500 1k 2k 4kAirb
orne
Sou
nd T
rans
mis
sion
Los
s (dB
)
Frequency (Hz)
STC 41 - 175 mm CLT Floor (2012) STC 42 - 175 mm CLT Floor (2015)

Client Report A1-006070.10 | Construction | Acoustics Laboratory
Page 7 of 168
The results of the bare wall assembly measured in 2012 and 2015 are shown in Figure 2. The CLT wall panels were different and were joined differently for the two separate tests. The wall assemblies achieved STC ratings of 39 and 37, with TL variations of up to 4 dB, mainly below 400 Hz.
Figure 2 – Bare Cross-Laminated Timber Walls
Based on the floor and wall results, it would be reasonable to expect a variation in STC of ±2 points for the bare CLT assemblies. The rebuild repeatability of CLT assemblies with linings (decoupled wall boards, toppings and ceilings) has not been established.
20
25
30
35
40
45
50
55
60
63 125 250 500 1k 2k 4kAirb
orne
Sou
nd T
rans
mis
sion
Los
s (dB
)
Frequency (Hz)
STC 39 - 175 mm CLT Wall (2012) STC 37 - 175 mm CLT Wall (2015)

Client Report A1-006070.10 | Construction | Acoustics Laboratory
Page 8 of 168
3. TL Results of Walls and Floors
The comparison between the TL values of the bare CLT assembly (CLT 5 ply 175mm thick) measured in the Wall Sound Transmission Facility and the Floor Sound Transmission Facility reveals that they are not exactly the same (Figure 3). The difference between the bare wall and bare floor assemblies may be attributed to edge mounting/conditions and loading (gravity). Similar differences were also observed during the test series in 2012 as seen in Figure 4.
Figure 3 – Bare Cross-Laminated Timber Wall and Floor (2015)
Figure 4 – Bare Cross-Laminated Timber Wall and Floor (2012)
20
25
30
35
40
45
50
55
60
63 125 250 500 1k 2k 4kAirb
orne
Sou
nd T
rans
mis
sion
Los
s (dB
)
Frequency (Hz)
STC 42 - 175 mm CLT Floor (2015) STC 37 - 175 mm CLT Wall (2015)
20.0
25.0
30.0
35.0
40.0
45.0
50.0
55.0
63 125 250 500 1k 2k 4kAirb
orne
Sou
nd T
rans
mis
sion
Los
s (dB
)
Frequency (Hz)
STC 41 - 175 mm CLT Floor (2012) STC 39 - 175 mm CLT Wall (2012)

Client Report A1-006070.10 | Construction | Acoustics Laboratory
Page 9 of 168
4. TL Results of CLT Walls
There were 8 CLT wall assemblies with a base 5-ply CLT (175 mm thick) tested in the NRC Construction Wall Sound Transmission Facility as part of this series. The base CLT wall assembly had linings added to it such as a gypsum board on Z-channels or various decoupled steel stud walls. The sound insulation performance of the walls tested varied between STC 37 for the bare CLT 5-ply (175 mm thick) and STC 71 for a wall with Z channels and a decoupled steel stud wall. In order to achieve an STC rating of at least 50, the CLT wall must have a lining on at least one side composed of gypsum board separated by at least 38 mm from the CLT surface. All of the walls tested with this type of lining (08W to 14W) achieved an STC rating of 53 or higher. Adding layers of directly attached gypsum board on the other side of the wall did not further improve the STC ratings.
5. TL Results of CLT Floors
In total, 16 CLT floor assemblies with a base 5-ply CLT (175 mm thick) and 10 CLT floor assemblies with a base 5-ply CLT (131 mm thick) were tested in the NRC Construction Floor Sound Transmission Facility for this project. Various toppings, coverings and dropped ceilings were tested in combination with the two bare floors to examine their effect on the sound insulation performance.
6. TL Improvement of Toppings and Resilient Membranes As shown in Figure 1, the bare CLT 5-ply (175 mm thick) floor achieves a STC rating of 42. The bare CLT 5-ply (131 mm thick) floor achieves a STC rating of 39. The addition of a concrete or heavy topping (100+ kg/m2) on a resilient membrane (e.g. INSONOMAT or Owens Corning QuietZone mat) to either of these bare floor assemblies yields an STC rating of at least 50. Improving impact isolation is more difficult. With a covering such as an engineered floating floor or laminate with a good underlay or tiled carpet, IIC values in the low 50s can be reached.

Client Report A1-006070.10 | Construction | Acoustics Laboratory
Page 10 of 168
The addition of a precast concrete topping on the 5-ply CLT (175 mm thick) floor increases the STC by 12 to 14 points depending on the resilient material placed underneath (Figure 5). The best performing material is the rubber membrane (INSONOMAT) followed by the closed cell foam (Owens Corning QuietZone mat) and the tar boards.
Figure 5 – Improvement due to 38mm precast concrete topping on resilient membranes on 175 mm CLT
0
5
10
15
20
25
30
35
40
45
50
63 125 250 500 1k 2k 4k
∆TL
(dB)
Frequency (Hz)
dSTC 14 - 38 mm Precast Concrete Slab on 13 mm INSONOMAT on 175 mm CLT
dSTC 12 - 38 mm Precast Concrete Slab on 10 mm Tar Board on 175 mm CLT
dSTC 12 - 38 mm Precast Concrete Slab on 9 mm Owens Corning QuietZone on 175 mm CLT
Client Report A1-006070.10 | Construction | Acoustics Laboratory
Page 11 of 168
The same topping and resilient membranes were also installed on the 5-ply CLT (131 mm thick) floor. The improvements due to the toppings are slightly better than on the 175 mm thick CLT floor (Figure 6).
Figure 6 - Improvement due to 38 mm precast concrete topping on resilient membranes on 131 mm CLT
0
5
10
15
20
25
30
35
40
45
63 125 250 500 1k 2k 4k
∆TL
(dB)
Frequency (Hz)
dSTC 14 - 38 mm Precast Concrete Slab on 13 mm INSONOMAT on 131 mm CLTdSTC 13 - 38 mm Precast Concrete Slab on 9 mm Owens Corning QuietZone on 131 mm CLTdSTC 13 - 38 mm Precast Concrete Slab on 10 mm Tar Board on 131 mm CLT

Client Report A1-006070.10 | Construction | Acoustics Laboratory
Page 12 of 168
Comparing the improvement of INSONOMAT under two different precast slabs thicknesses (see Figure 7), it can be observed that the relative improvement is very similar (an increase of 14 points) for the 38 mm precast concrete slab on both 131 mm and 175 mm thick CLT floors and with the 70 mm precast mortar topping on 131 mm thick CLT. The 70 mm precast mortar topping on the 89 mm glulam assembly performs much better (an increase of 18 points) than other base CLT assemblies due to the fact that the bare glulam only gets an STC 33.
Figure 7 - Improvement for rubber membrane (INSONOMAT) installed under various topping slabs
0
10
20
30
40
50
60
63 125 250 500 1k 2k 4k
∆TL
(dB)
Frequency (Hz)
dSTC 14 - 38 mm Precast Concrete Slab on 13 mm INSONOMAT on 175 mm CLTdSTC 14 - 38 mm Precast Concrete Slab on 13 mm INSONOMAT on 131 mm CLTdSTC 14 - 70 mm Precast Mortar Slab on 13 mm INSONOMAT on 175 mm CLTdSTC 18 - 70 mm Precast Mortar Slab on 13 mm INSONOMAT on 89 mm Glulam

Client Report A1-006070.10 | Construction | Acoustics Laboratory
Page 13 of 168
7. TL Difference of Poured vs. Precast Concrete Topping
Most of the floor assemblies were tested using a precast concrete slab of nominal thickness of 38 mm (103 kg/m2) to simulate a poured topping as installed in the field. One assembly was also tested with a poured concrete topping. The poured concrete topping on tar board obtained an STC 47 compared to an STC 52 for the 38 mm precast concrete topping (see Figure 8). The STC rating in both cases is limited at 400 Hz. In the past, floor assemblies with a poured gypsum concrete topping on a closed cell foam (see Figure 9) obtained better results when compared with the precast slab (STC 53 vs STC 57). The field performance of a poured topping on tar boards could be up to 5 STC points worse than laboratory results. It is expected that the field performance of a poured topping on either Owens Corning QuietZone or INSONOMAT would be within ±2 STC points of the laboratory results.
Figure 8 – Precast concrete slab vs. poured in place concrete slab
Figure 9 – Poured gypsum concrete vs. precast concrete topping (2012 tests)
20
30
40
50
60
70
80
90
63 125 250 500 1k 2k 4kAirb
orne
Sou
nd T
rans
mis
sion
Los
s (dB
)
Frequency (Hz)
STC 52 - 38 mm Precast Concrete Slab on 10 mm Tar Board on 131 mm CLTSTC 47 - 50 mm Poured Concrete on 10 mm Tar Board on 131 mm CLT
20
30
40
50
60
70
80
90
63 125 250 500 1k 2k 4kAirb
orne
Sou
nd T
rans
mis
sion
Los
s (dB
)
Frequency (Hz) STC 53 - 38 mm Precast Concrete Slab on 9 mm Owens Corning QuietZone on 175 mm CLTSTC 57 - 38 mm Gypsum Concrete on 9 mm Owens Corning QuietZone on 175 mm CLT (2012)

Client Report A1-006070.10 | Construction | Acoustics Laboratory
Page 14 of 168
8. TL Interpolation for Floor Toppings
There is no exact method or simple calculation to interpolate between various toppings, because there are several important parameters that must be taken into account, such as the dynamic stiffness of the resilient interlayer, the mass of the topping, and the bending stiffness of the topping in both directions for different base floors. If these parameters were well characterized, a model could probably be developed. In general, adding more mass on the floor without a resilient layer is always good. Adding more mass on a resilient layer usually improves the sound insulation performance if the mass-spring-mass resonance frequency is moved out of the range of interest or else it may worsen the acoustic performance. As observed in Figure 7, increasing the topping mass from 103 kg/m2 to 162 kg/m2 did not improve the STC rating (increase of 14 points - STC 56 for both assemblies). As a conservative estimate, it may be assumed that a topping of more than 38 mm thickness on a resilient membrane will have the same or better sound insulation performance as a topping of 38 mm thickness. Less conservative estimates can be based on additional comparisons and additional tests.
9. TL Improvement of Floor Coverings
In most cases, floor coverings have a beneficial effect on the sound insulation performance of a floor assembly. However, they can also have a degrading effect in some cases. The addition of a floating engineered wood floor on CLT 175 mm assemblies leads to a decrease in STC by -1 to -2 points (Figure 10). The worsening is due to the introduction of a mass-spring-mass resonance at 400 Hz which directly affects the STC rating. For the poured concrete assembly on tar board, the addition of a covering decreases the STC rating from STC 47 to STC 42 for the same reason.
Figure 10 – Floating Engineered Wood Flooring Installed on 175 mm CLT
-6-4-202468
101214
63 125 250 500 1k 2k 4k
∆TL
(dB)
Frequency (Hz) dSTC -1 - Floating Engineered Wood Floor - INSONOMAT - CLT 175dSTC -1 - Floating Engineered Wood Floor - Wood Fibre Board - CLT 175dSTC -2 - Floating Engineered Wood Floor - Owens Corning QuietZone Mat - CLT 175

Client Report A1-006070.10 | Construction | Acoustics Laboratory
Page 15 of 168
10. TL Improvement of Hung Ceilings
Hung ceilings are by far the most effective method to improve airborne and impact noise insulation for the floors in this study. The assemblies with a hung ceiling and a topping tested in this study achieved STC ratings between 62 and 75, and IIC ratings between 48 and 67. In areas where superior airborne or impact noise insulation is required, a hung ceiling should be used. The installation of a ventilation box and flexible vent in the hung ceiling cavity was found to have no significant effect on the airborne or impact sound insulation, as long as the ventilation box was not touching the CLT floor.
11. TL Results of Glulam Floors
Three glulam decking floors were tested. Installing a precast concrete topping (120 kg/m2) on the glulam assembly is sufficient to achieve the minimum STC rating of 50 in the laboratory. Adding carpet tiles on top of the heavy topping improved the IIC rating to 51. It is to note that the glulam floor decking assemblies will be installed on purlins in the field and may have slightly better or worse results based on the supporting assembly.

Client Report A1-006070.10 | Construction | Acoustics Laboratory
Page 16 of 168
List of Wall Assemblies
Specimen ID Sketch and Short Description STC Rating
Page Number
A1-006070-01W
Bare CLT 5 ply (175 mm)
37 12
A1-006070-08W
CLT 5 ply (175 mm) with two layers of 16 mm Type X gypsum board attached to 35 mm Z-channels on one side.
53 14
A1-006070-09W
CLT 5 ply (175 mm) with two layers of 16 mm Type X gypsum board attached to 35 mm Z-channels on one side and two layers of 16 mm Type X gypsum board
attached to a decoupled 92 mm steel stud wall on the other side.
71 16
A1-006070-10W
CLT 5 ply (175 mm) with two layers of 16 mm Type X gypsum board attached to 35 mm Z-channels on one side and two layers of 16 mm Type X gypsum board
attached to resilient channels on plywood strips on the other side.
53 19
A1-006070-11W
CLT 5 ply (175 mm) with two layers of 16 mm Type X gypsum board attached to 35 mm Z-channels on one side and two layers of 16 mm Type X gypsum board
directly attached on the other side.
53 22
A1-006070-12W
CLT 5 ply (175 mm) with two layers of 16 mm Type X gypsum board attached to 35 mm Z-channels on one side and two layers of 16 mm Type X gypsum board
directly attached on the other side of the CLT plus a decoupled steel stud wall with 13 mm Type C gypsum board.
65 25

Client Report A1-006070.10 | Construction | Acoustics Laboratory
Page 17 of 168
Specimen ID Sketch and Short Description STC Rating
Page Number
A1-006070-13W
CLT 5 ply (175 mm) with two layers of 16 mm Type X gypsum board directly
attached with a decoupled steel stud wall with 13 mm Type C gypsum board on one side.
62 28
A1-006070-14W
CLT 5 ply (175 mm) with two layers of 16 mm Type X gypsum board directly
attached to both sides with a decoupled steel stud wall with 13 mm Type C gypsum board on one side.
61 31

Client Report A1-006070.10 | Construction | Acoustics Laboratory
Page 18 of 168
List of Floor Assemblies
Specimen ID Sketch and Short Description STC Rating
IIC Rating
Page Number
A1-006070-01F
Bare CLT 5 ply (175 mm)
42 26 40
A1-006070-02F
38 mm (1-1/2”) precast concrete slab on 13 mm (1/2”) rubber membrane placed on top of a CLT 5 ply (175 mm).
56 48 44
A1-006070-03F
10 mm floating engineered wood floor placed on a 2 mm closed cell foam on 38 mm (1-1/2”) precast concrete slab on 13 mm (1/2”) rubber membrane placed on
top of a CLT 5 ply (175 mm).
55 51 48
A1-006070-04F
38 mm (1-1/2”) precast concrete slab on 10 mm tar boards placed on top of a CLT 5 ply (175 mm).
54 36 52
A1-006070-05F
10 mm floating engineered wood floor placed on a 2 mm closed cell foam on 38 mm (1-1/2”) precast concrete slab on 10 mm tar boards placed on top of a CLT
5 ply (175 mm).
53 47 56
A1-006070-06F
38 mm (1-1/2”) precast concrete slab on 9 mm closed cell foam placed on top of a CLT 5 ply (175 mm).
54 39 60
A1-006070-07F
10 mm floating engineered wood floor placed on a 2 mm closed cell foam on 38 mm (1-1/2”) precast concrete slab on 9 mm closed cell foam placed on top of a
CLT 5 ply (175 mm).
52 48 64
A1-006070-08F
38 mm (1-1/2”) precast concrete slab on 9 mm closed cell foam placed on top of a CLT 5 ply (175 mm) with one layer of 16 mm Type X gypsum board installed on Z
channels.
70 56 68
Client Report A1-006070.10 | Construction | Acoustics Laboratory
Page 19 of 168
Specimen ID Sketch and Short Description STC Rating
IIC Rating
Page Number
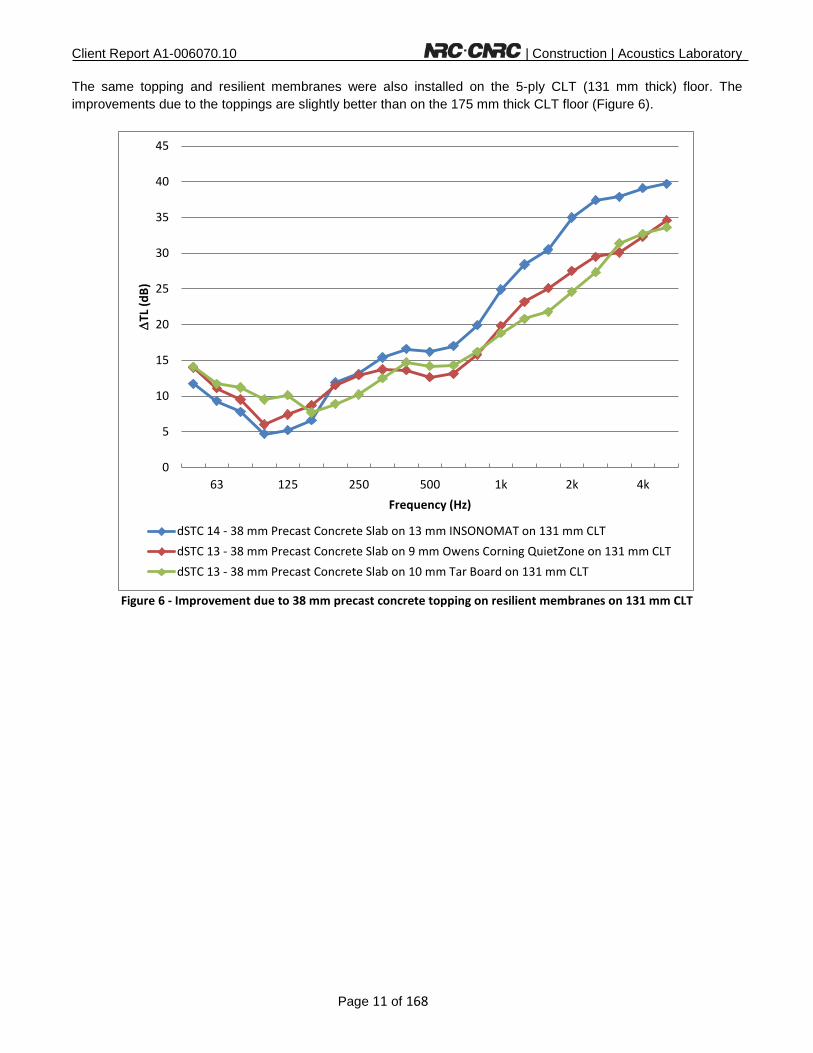
A1-006070-09F
CLT 5 ply (175 mm) with one layer of 16 mm Type X gypsum board installed on Z
channels
62 48 72
A1-006070-10F
38 mm (1-1/2”) precast concrete slab on 10 mm tar boards placed on top of a CLT
5 ply (175 mm) with one layer of 16 mm Type X gypsum board installed on Z channels.
69 54 76
A1-006070-11F
10 mm floating engineered wood floor placed on a 2 mm closed cell foam on 38 mm (1-1/2”) precast concrete slab on 10 mm tar boards placed on top of a CLT
5 ply (175 mm) with one layer of 16 mm Type X gypsum board installed on Z channels.
69 58 80
A1-006070-12F
38 mm (1-1/2”) precast concrete slab on 9 mm closed cell foam placed on top of a CLT 5 ply (175 mm) with two layers of 13 mm Type C gypsum board installed on a
hung ceiling grid.
72 65 84
A1-006070-13F
38 mm (1-1/2”) precast concrete slab on 9 mm closed cell foam placed on top of a CLT 5 ply (175 mm) with two layers of 13 mm Type C gypsum board installed on a
hung ceiling grid with resilient channels.
73 66 88
A1-006070-14F
38 mm (1-1/2”) precast concrete slab on 9 mm closed cell foam placed on top of a CLT 5 ply (175 mm) with one layer of 13 mm Type C gypsum board installed on a
hung ceiling grid with resilient channels
72 62 92

Client Report A1-006070.10 | Construction | Acoustics Laboratory
Page 20 of 168
Specimen ID Sketch and Short Description STC Rating
IIC Rating
Page Number
A1-006070-20F
Bare CLT 5 ply (131 mm)
39 22 96
A1-006070-21F
38 mm (1-1/2”) precast concrete slab on 13 mm (1/2”) rubber membrane placed on top of a CLT 5 ply (131 mm).
53 47 100
A1-006070-22F
38 mm (1-1/2”) precast concrete slab on 9 mm closed cell foam placed on top of a CLT 5 ply (131 mm).
52 40 104
A1-006070-23F
38 mm (1-1/2”) precast concrete slab on 10 mm tar board placed on top of a CLT 5 ply (131 mm).
52 41 108
A1-006070-24F
Laminate floating floor placed on a 2 mm closed cell foam on 38 mm (1-1/2”) precast concrete slab on 10 mm tar boards placed on top of a CLT 5 ply (131 mm).
50 46 112
A1-006070-25F
Laminate floating floor on 3 mm premium felt on 38 mm (1-1/2”) precast concrete slab on 9 mm closed cell foam placed on top of a CLT 5 ply (131 mm) with two
layers of 13 mm Type C gypsum board installed on a hung ceiling grid.
75 66 116
A1-006070-26F
Laminate floating floor on 3 mm premium felt on 38 mm (1-1/2”) precast concrete slab on 9 mm closed cell foam placed on top of a CLT 5 ply (131 mm) with two layers of 13 mm Type C gypsum board installed on a hung ceiling grid with a
ventilation box and flexible vent installed in the ceiling cavity.
75 65 120
Client Report A1-006070.10 | Construction | Acoustics Laboratory
Page 21 of 168
Specimen ID Sketch and Short Description STC Rating
IIC Rating
Page Number
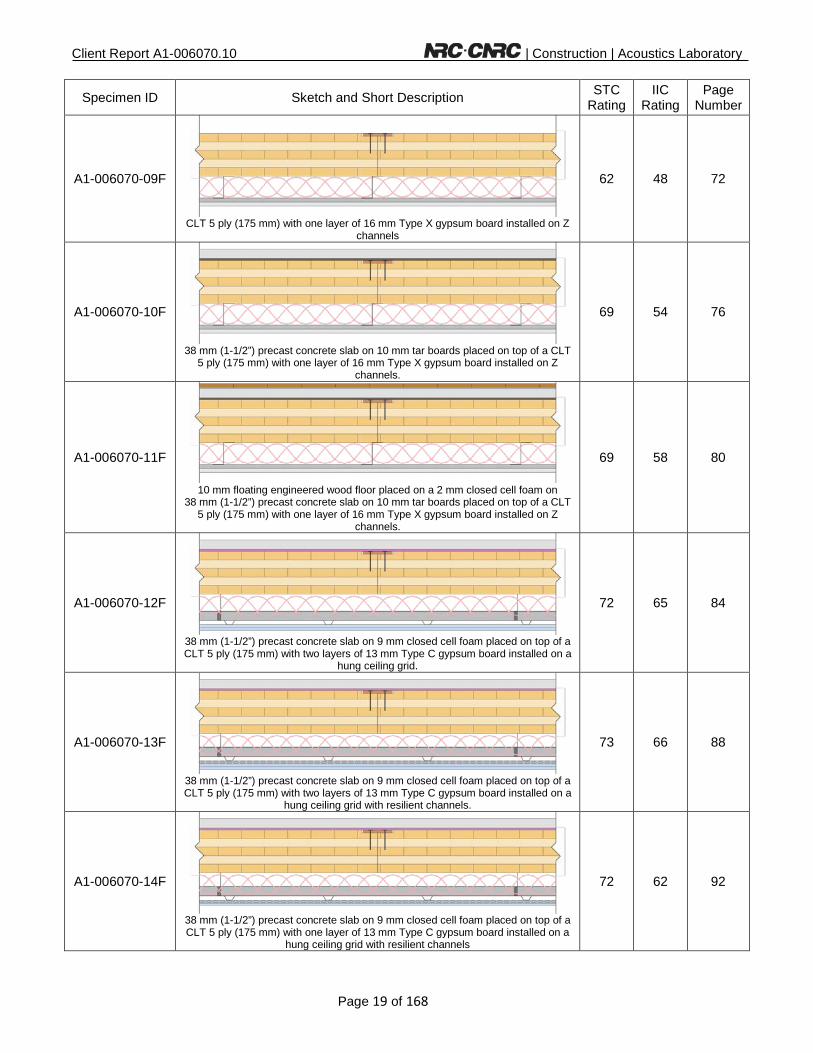
A1-006070-27F
Laminate floating floor on 3 mm rubber membrane on 38 mm (1-1/2”) precast
concrete slab on 9 mm closed cell foam placed on top of a CLT 5 ply (131 mm) with two layers of 13 mm Type C gypsum board installed on a hung ceiling grid
with a ventilation box and flexible vent installed in the ceiling cavity.
75 67 124
A1-006070-28F
50 mm (2”) normal strength concrete poured on 10 mm tar boards placed on top of a CLT 5 ply (131 mm).
47 35 128
A1-006070-29F Laminate floating floor on 3 mm premium felt placed on 50 mm (2”) normal strength concrete poured on 10 mm tar boards placed on top of a CLT 5 ply
(131 mm).
42 45 126
A1-006070-30F
70 mm cement mortar precast slab on 13 mm (1/2”) rubber membrane on 10 mm tar boards placed on top of a CLT 5 ply (175 mm).
58 47 130
A1-006070-31F
70 mm cement mortar precast slab on 13 mm (1/2”) rubber membrane placed on top of a CLT 5 ply (175 mm).
56 45 134
A1-006070-32F
Bare 89 mm (3-1/2”) glulam decking floor
33 22 138
A1-006070-33F
70 mm cement mortar precast slab on 13 mm (1/2”) rubber membrane placed on top of a 89 mm (3-1/2”) glulam decking floor
51 42 142
A1-006070-34F
Carpet tiles on 70 mm cement mortar precast slab on 13 mm (1/2”) rubber membrane placed on top of a 89 mm (3-1/2”) glulam decking floor
52 51 146
Client Report A1-006070.10 | Construction | Acoustics Laboratory
Page 22 of 168
Client Nordic Engineered Wood
1100 Ave des Canadiens-de-Montreal Montreal QC H3B 2S2
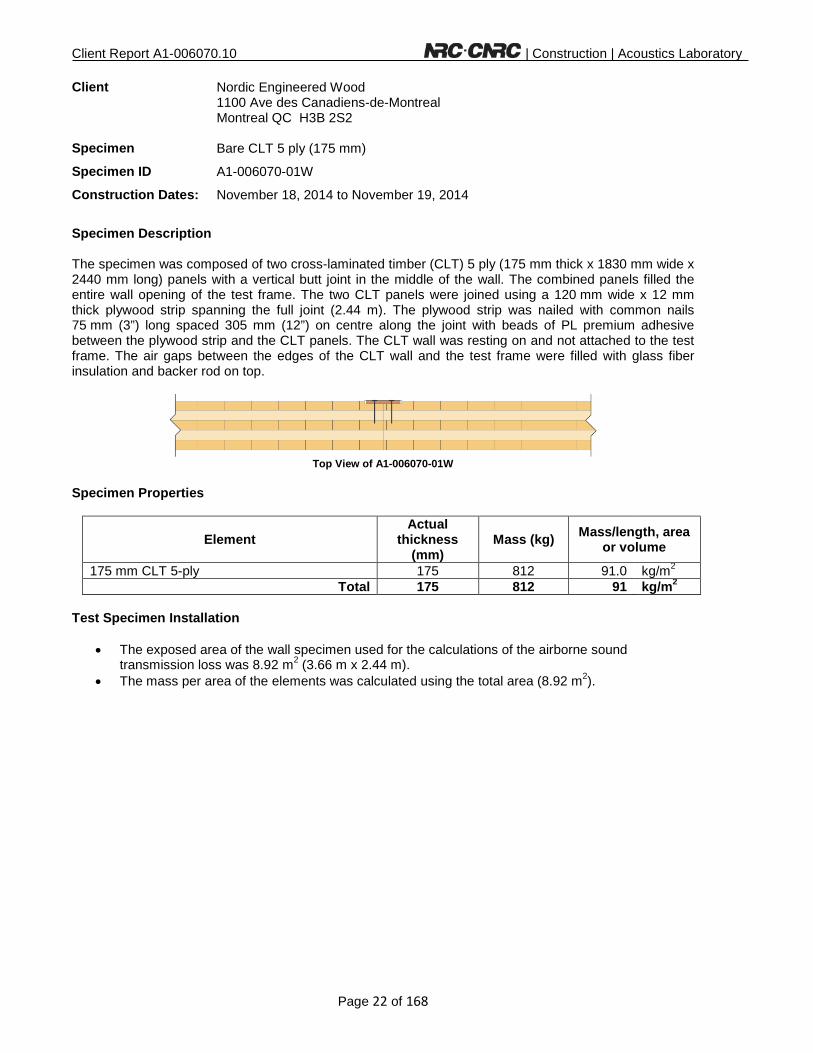
Specimen Bare CLT 5 ply (175 mm)
Specimen ID A1-006070-01W
Construction Dates: November 18, 2014 to November 19, 2014
Specimen Description The specimen was composed of two cross-laminated timber (CLT) 5 ply (175 mm thick x 1830 mm wide x 2440 mm long) panels with a vertical butt joint in the middle of the wall. The combined panels filled the entire wall opening of the test frame. The two CLT panels were joined using a 120 mm wide x 12 mm thick plywood strip spanning the full joint (2.44 m). The plywood strip was nailed with common nails 75 mm (3”) long spaced 305 mm (12”) on centre along the joint with beads of PL premium adhesive between the plywood strip and the CLT panels. The CLT wall was resting on and not attached to the test frame. The air gaps between the edges of the CLT wall and the test frame were filled with glass fiber insulation and backer rod on top.
Top View of A1-006070-01W
Specimen Properties
Element Actual
thickness (mm)
Mass (kg) Mass/length, area or volume
175 mm CLT 5-ply 175 812 91.0 kg/m2 Total 175 812 91 kg/m2 Test Specimen Installation
• The exposed area of the wall specimen used for the calculations of the airborne sound transmission loss was 8.92 m2 (3.66 m x 2.44 m).
• The mass per area of the elements was calculated using the total area (8.92 m2).
Client Report A1-006070.10 | Construction | Acoustics Laboratory
Page 23 of 168
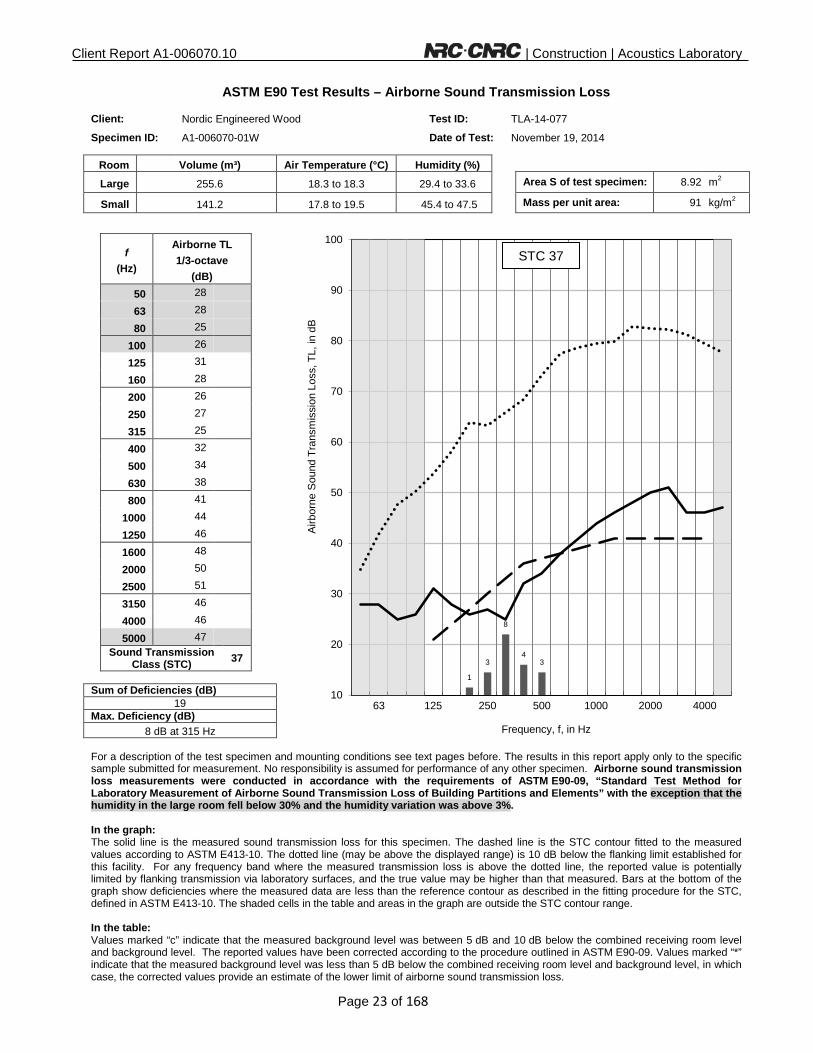
ASTM E90 Test Results – Airborne Sound Transmission Loss
Client: Nordic Engineered Wood Test ID: TLA-14-077
Specimen ID: A1-006070-01W Date of Test: November 19, 2014
Room Volume (m³) Air Temperature (°C) Humidity (%)
Large 255.6 18.3 to 18.3 29.4 to 33.6 Area S of test specimen: 8.92 m2
Small 141.2 17.8 to 19.5 45.4 to 47.5 Mass per unit area: 91 kg/m2
f (Hz)
Airborne TL 1/3-octave
(dB)
50 28
63 28
80 25
100 26
125 31
160 28
200 26
250 27
315 25
400 32
500 34
630 38
800 41
1000 44
1250 46
1600 48
2000 50
2500 51
3150 46
4000 46
5000 47
Sound Transmission
Class (STC) 37
Sum of Deficiencies (dB)
19 Max. Deficiency (dB)
8 dB at 315 Hz
For a description of the test specimen and mounting conditions see text pages before. The results in this report apply only to the specific sample submitted for measurement. No responsibility is assumed for performance of any other specimen. Airborne sound transmission loss measurements were conducted in accordance with the requirements of ASTM E90-09, “Standard Test Method for Laboratory Measurement of Airborne Sound Transmission Loss of Building Partitions and Elements” with the exception that the humidity in the large room fell below 30% and the humidity variation was above 3%. In the graph: The solid line is the measured sound transmission loss for this specimen. The dashed line is the STC contour fitted to the measured values according to ASTM E413-10. The dotted line (may be above the displayed range) is 10 dB below the flanking limit established for this facility. For any frequency band where the measured transmission loss is above the dotted line, the reported value is potentially limited by flanking transmission via laboratory surfaces, and the true value may be higher than that measured. Bars at the bottom of the graph show deficiencies where the measured data are less than the reference contour as described in the fitting procedure for the STC, defined in ASTM E413-10. The shaded cells in the table and areas in the graph are outside the STC contour range. In the table: Values marked “c” indicate that the measured background level was between 5 dB and 10 dB below the combined receiving room level and background level. The reported values have been corrected according to the procedure outlined in ASTM E90-09. Values marked “*” indicate that the measured background level was less than 5 dB below the combined receiving room level and background level, in which case, the corrected values provide an estimate of the lower limit of airborne sound transmission loss.
1
3
8
4 3
10
20
30
40
50
60
70
80
90
100
63 125 250 500 1000 2000 4000
Airb
orne
Sou
nd T
rans
mis
sion
Los
s, T
L, in
dB
Frequency, f, in Hz
STC 37
Client Report A1-006070.10 | Construction | Acoustics Laboratory
Page 24 of 168
Client Nordic Engineered Wood
1100 Ave des Canadiens-de-Montreal Montreal QC H3B 2S2
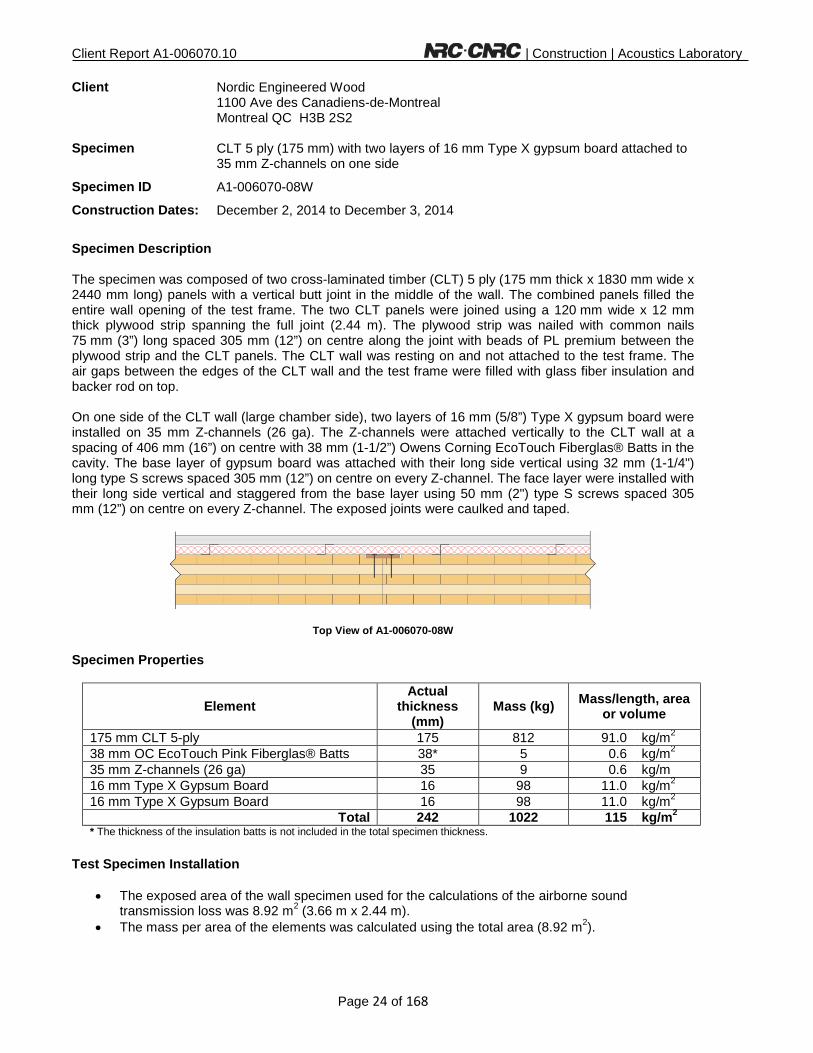
Specimen CLT 5 ply (175 mm) with two layers of 16 mm Type X gypsum board attached to 35 mm Z-channels on one side
Specimen ID A1-006070-08W
Construction Dates: December 2, 2014 to December 3, 2014
Specimen Description The specimen was composed of two cross-laminated timber (CLT) 5 ply (175 mm thick x 1830 mm wide x 2440 mm long) panels with a vertical butt joint in the middle of the wall. The combined panels filled the entire wall opening of the test frame. The two CLT panels were joined using a 120 mm wide x 12 mm thick plywood strip spanning the full joint (2.44 m). The plywood strip was nailed with common nails 75 mm (3”) long spaced 305 mm (12”) on centre along the joint with beads of PL premium between the plywood strip and the CLT panels. The CLT wall was resting on and not attached to the test frame. The air gaps between the edges of the CLT wall and the test frame were filled with glass fiber insulation and backer rod on top. On one side of the CLT wall (large chamber side), two layers of 16 mm (5/8”) Type X gypsum board were installed on 35 mm Z-channels (26 ga). The Z-channels were attached vertically to the CLT wall at a spacing of 406 mm (16”) on centre with 38 mm (1-1/2”) Owens Corning EcoTouch Fiberglas® Batts in the cavity. The base layer of gypsum board was attached with their long side vertical using 32 mm (1-1/4") long type S screws spaced 305 mm (12”) on centre on every Z-channel. The face layer were installed with their long side vertical and staggered from the base layer using 50 mm (2") type S screws spaced 305 mm (12”) on centre on every Z-channel. The exposed joints were caulked and taped.
Top View of A1-006070-08W Specimen Properties
Element Actual
thickness (mm)
Mass (kg) Mass/length, area or volume
175 mm CLT 5-ply 175 812 91.0 kg/m2 38 mm OC EcoTouch Pink Fiberglas® Batts 38* 5 0.6 kg/m2 35 mm Z-channels (26 ga) 35 9 0.6 kg/m 16 mm Type X Gypsum Board 16 98 11.0 kg/m2 16 mm Type X Gypsum Board 16 98 11.0 kg/m2 Total 242 1022 115 kg/m2 * The thickness of the insulation batts is not included in the total specimen thickness. Test Specimen Installation
• The exposed area of the wall specimen used for the calculations of the airborne sound transmission loss was 8.92 m2 (3.66 m x 2.44 m).
• The mass per area of the elements was calculated using the total area (8.92 m2).

Client Report A1-006070.10 | Construction | Acoustics Laboratory
Page 25 of 168
ASTM E90 Test Results – Airborne Sound Transmission Loss
Client: Nordic Engineered Wood Test ID: TLA-14-086
Specimen ID: A1-006070-08W Date of Test: December 4, 2014
Room Volume (m³) Air Temperature (°C) Humidity (%)
Large 255.0 18.7 to 18.8 26.4 to 31.5 Area S of test specimen: 8.92 m2
Small 141.2 17.1 to 17.2 43.0 to 43.7 Mass per unit area: 115 kg/m2
f (Hz)
Airborne TL 1/3-octave
(dB)
50 29
63 24
80 20
100 24
125 29
160 35
200 36
250 42
315 43
400 51
500 54
630 59
800 62
1000 65
1250 67
1600 68
2000 66
2500 61
3150 60
4000 63
5000 67
Sound Transmission
Class (STC) 53
Sum of Deficiencies (dB)
31 Max. Deficiency (dB)
8 dB at 125 Hz
For a description of the test specimen and mounting conditions see text pages before. The results in this report apply only to the specific sample submitted for measurement. No responsibility is assumed for performance of any other specimen. Airborne sound transmission loss measurements were conducted in accordance with the requirements of ASTM E90-09, “Standard Test Method for Laboratory Measurement of Airborne Sound Transmission Loss of Building Partitions and Elements” with the exception that the humidity in the large room fell below 30% and the humidity variation was above 3%. In the graph: The solid line is the measured sound transmission loss for this specimen. The dashed line is the STC contour fitted to the measured values according to ASTM E413-10. The dotted line (may be above the displayed range) is 10 dB below the flanking limit established for this facility. For any frequency band where the measured transmission loss is above the dotted line, the reported value is potentially limited by flanking transmission via laboratory surfaces, and the true value may be higher than that measured. Bars at the bottom of the graph show deficiencies where the measured data are less than the reference contour as described in the fitting procedure for the STC, defined in ASTM E413-10. The shaded cells in the table and areas in the graph are outside the STC contour range. In the table: Values marked “c” indicate that the measured background level was between 5 dB and 10 dB below the combined receiving room level and background level. The reported values have been corrected according to the procedure outlined in ASTM E90-09. Values marked “*” indicate that the measured background level was less than 5 dB below the combined receiving room level and background level, in which case, the corrected values provide an estimate of the lower limit of airborne sound transmission loss.
8
5
7
4
6
1
10
20
30
40
50
60
70
80
90
100
63 125 250 500 1000 2000 4000
Airb
orne
Sou
nd T
rans
mis
sion
Los
s, T
L, in
dB
Frequency, f, in Hz
STC 53

Client Report A1-006070.10 | Construction | Acoustics Laboratory
Page 26 of 168
Client Nordic Engineered Wood
1100 Ave des Canadiens-de-Montreal Montreal QC H3B 2S2
Specimen PAL détail 8
CLT 5 ply (175 mm) with two layers of 16 mm Type X gypsum board attached to 35 mm Z-channels on one side and two layers of 16 mm Type X gypsum board attached to a decoupled 92 mm steel stud wall on the other side.
Specimen ID A1-006070-09W
Construction Dates: December 4, 2014 to December 5, 2014
Specimen Description The specimen was composed of two cross-laminated timber (CLT) 5 ply (175 mm thick x 1830 mm wide x 2440 mm long) panels with a vertical butt joint in the middle of the wall. The combined panels filled the entire wall opening of the test frame. The two CLT panels were joined using a 120 mm wide x 12 mm thick plywood strip spanning the full joint (2.44 m). The plywood strip was nailed with common nails 75 mm (3”) long spaced 305 mm (12”) on centre along the joint with beads of PL premium adhesive between the plywood strip and the CLT panels. The CLT wall was resting on and not attached to the test frame. The air gaps between the edges of the CLT wall and the test frame were filled with glass fiber insulation and backer rod on top. On one side of the CLT wall (large chamber side), two layers of 16 mm (5/8”) Type X gypsum board were installed on 35 mm Z-channels (26 Ga). The Z-channels were attached vertically to the CLT wall at a spacing of 406 mm (16”) on centre with 38 mm (1-1/2”) Owens Corning EcoTouch Fiberglas® Batts in the cavity. The base layer of gypsum board was attached with their long side vertical using 32 mm (1-1/4") long type S screws spaced 305 mm (12”) on centre on every Z-channel. The face layer were installed with their long side vertical and staggered from the base layer using 50 mm (2") type S screws spaced 305 mm (12”) on centre on every Z-channel. The exposed joints were caulked and taped. On the other side of the CLT wall (small chamber side), two layers of 16 mm (5/8”) Type X gypsum board were installed on decoupled 92 mm (3-5/8”) lightweight steel studs. The steel studs were installed 19 mm (3/4”) in front of the CLT wall with a spacing of 406 mm (16”) on centre with 92 mm (3-5/8”) Owens Corning EcoTouch Fiberglas® Batts in the cavity. The base layer of gypsum board was attached with their long side vertical using 32 mm (1-1/4") long type S screws spaced 305 mm (12”) on centre on every stud. The face layer were installed with their long side vertical and staggered from the base layer using 50 mm (2") type S screws spaced 305 mm (12”) on centre on every stud. The exposed joints were caulked and taped.
Top View of A1-006070-09W

Client Report A1-006070.10 | Construction | Acoustics Laboratory
Page 27 of 168
Specimen Properties
Element Actual
thickness (mm)
Mass (kg) Mass/length, area or volume
16 mm Type X Gypsum Board 16 98 11.0 kg/m2 16 mm Type X Gypsum Board 16 98 11.0 kg/m2 92 mm OC EcoTouch Pink Fiberglas® Batts 92* 13 1.5 kg/m2 92 mm Steel Studs (26 ga) 92 13 0.5 kg/m 19 mm Air Gap 19 - - - 175 mm CLT 5-ply 175 812 91.0 kg/m2 38 mm OC EcoTouch Pink Fiberglas® Batts 38* 5 0.6 kg/m2 35 mm Z-channels (26 ga) 35 9 0.4 kg/m 16 mm Type X Gypsum Board 16 98 11.0 kg/m2 16 mm Type X Gypsum Board 16 98 11.0 kg/m2 Total 385 1244 140 kg/m2 * The thicknesses of the insulation batts are not included in the total specimen thickness. Test Specimen Installation
• The exposed area of the wall specimen used for the calculations of the airborne sound transmission loss was 8.92 m2 (3.66 m x 2.44 m).
• The mass per area of the elements was calculated using the total area (8.92 m2).

Client Report A1-006070.10 | Construction | Acoustics Laboratory
Page 28 of 168
This page was
intentionally
left blank

Client Report A1-006070.10 | Construction | Acoustics Laboratory
Page 29 of 168
ASTM E90 Test Results – Airborne Sound Transmission Loss
Client: Nordic Engineered Wood Test ID: TLA-14-087
Specimen ID: A1-006070-09W Date of Test: December 5, 2014
Room Volume (m³) Air Temperature (°C) Humidity (%)
Large 255.0 19.2 to 19.2 34.2 to 37.7 Area S of test specimen: 8.92 m2
Small 139.8 18.4 to 18.7 38.6 to 40.9 Mass per unit area: 140 kg/m2
f (Hz)
Airborne TL 1/3-octave
(dB)
50 29 c
63 30
80 31
100 38
125 47
160 56
200 60
250 66
315 69
400 74 c
500 76
630 76
800 78
1000 84 c
1250 88 *
1600 92 *
2000 88 *
2500 85 c
3150 90 *
4000 88 *
5000 83 *
Sound Transmission
Class (STC) 71
Sum of Deficiencies (dB)
11 Max. Deficiency (dB)
8 dB at 125 Hz
For a description of the test specimen and mounting conditions see text pages before. The results in this report apply only to the specific sample submitted for measurement. No responsibility is assumed for performance of any other specimen. Airborne sound transmission loss measurements were conducted in accordance with the requirements of ASTM E90-09, “Standard Test Method for Laboratory Measurement of Airborne Sound Transmission Loss of Building Partitions and Elements” with the exception that the humidity variation in the large room was above 3%. In the graph: The solid line is the measured sound transmission loss for this specimen. The dashed line is the STC contour fitted to the measured values according to ASTM E413-10. The dotted line (may be above the displayed range) is 10 dB below the flanking limit established for this facility. For any frequency band where the measured transmission loss is above the dotted line, the reported value is potentially limited by flanking transmission via laboratory surfaces, and the true value may be higher than that measured. Bars at the bottom of the graph show deficiencies where the measured data are less than the reference contour as described in the fitting procedure for the STC, defined in ASTM E413-10. The shaded cells in the table and areas in the graph are outside the STC contour range. In the table: Values marked “c” indicate that the measured background level was between 5 dB and 10 dB below the combined receiving room level and background level. The reported values have been corrected according to the procedure outlined in ASTM E90-09. Values marked “*” indicate that the measured background level was less than 5 dB below the combined receiving room level and background level, in which case, the corrected values provide an estimate of the lower limit of airborne sound transmission loss.
8
2 1
10
20
30
40
50
60
70
80
90
100
63 125 250 500 1000 2000 4000
Airb
orne
Sou
nd T
rans
mis
sion
Los
s, T
L, in
dB
Frequency, f, in Hz
STC 71

Client Report A1-006070.10 | Construction | Acoustics Laboratory
Page 30 of 168
Client Nordic Engineered Wood
1100 Ave des Canadiens-de-Montreal Montreal QC H3B 2S2
Specimen PAL détail 10
CLT 5 ply (175 mm) with two layers of 16 mm Type X gypsum board attached to 35 mm Z-channels on one side and two layers of 16 mm Type X gypsum board attached to resilient channels on plywood strips on the other side.
Specimen ID A1-006070-10W
Construction Date: December 8, 2014
Specimen Description The specimen was composed of two cross-laminated timber (CLT) 5 ply (175 mm thick x 1830 mm wide x 2440 mm long) panels with a vertical butt joint in the middle of the wall. The combined panels filled the entire wall opening of the test frame. The two CLT panels were joined using a 120 mm wide x 12 mm thick plywood strip spanning the full joint (2.44 m). The plywood strip was nailed with common nails 75 mm (3”) long spaced 305 mm (12”) on centre along the joint with beads of PL premium adhesive between the plywood strip and the CLT panels. The CLT wall was resting on and not attached to the test frame. The air gaps between the edges of the CLT wall and the test frame were filled with glass fiber insulation and backer rod on top. On one side of the CLT wall (large chamber side), two layers of 16 mm (5/8”) Type X gypsum board were installed on 35 mm Z-channels (26 Ga). The Z-channels were attached vertically to the CLT wall at a spacing of 406 mm (16”) on centre with 38 mm (1-1/2”) Owens Corning EcoTouch Fiberglas® Batts in the cavity. The base layer of gypsum board was attached with their long side vertical using 32 mm (1-1/4") long type S screws spaced 305 mm (12”) on centre on every Z-channel. The face layer were installed with their long side vertical and staggered from the base layer using 50 mm (2") type S screws spaced 305 mm (12”) on centre on every Z-channel. The exposed joints were caulked and taped. On the other side of the CLT wall (small chamber side), two layers of 16 mm (5/8”) Type X gypsum board were installed on resilient channels. The resilient channels were installed with a spacing of 406 mm (16”) on centre on 12 mm thick plywood strips creating an air gap of 25 mm (1”) between the CLT and the base gypsum board layer. The base layer of gypsum board was attached with their long side vertical using 32 mm (1-1/4") long type S screws spaced 305 mm (12”) on centre on every resilient channel. The face layer were installed with their long side vertical and staggered from the base layer using 50 mm (2") type S screws spaced 305 mm (12”) on centre on every resilient channel. The exposed joints were caulked and taped.
Top View of A1-006070-10W

Client Report A1-006070.10 | Construction | Acoustics Laboratory
Page 31 of 168
Specimen Properties
Element Actual
thickness (mm)
Mass (kg) Mass/length, area or volume
16 mm Type X Gypsum Board 16 98 11.0 kg/m2 16 mm Type X Gypsum Board 16 98 11.0 kg/m2 13 mm Resilient Channels 13 6 0.3 kg/m 12 mm Plywood Strips 12 7 0.3 kg/m 175 mm CLT 5-ply 175 812 91.0 kg/m2 38 mm OC EcoTouch Pink Fiberglas® Batts 38* 5 0.6 kg/m2 35 mm Z-channels (26 ga) 35 9 0.4 kg/m 16 mm Type X Gypsum Board 16 98 11.0 kg/m2 16 mm Type X Gypsum Board 16 98 11.0 kg/m2 Total 299 1231 138 kg/m2 * The thickness of the insulation batts is not included in the total specimen thickness. Test Specimen Installation
• The exposed area of the wall specimen used for the calculations of the airborne sound transmission loss was 8.92 m2 (3.66 m x 2.44 m).
• The mass per area of the elements was calculated using the total area (8.92 m2).

Client Report A1-006070.10 | Construction | Acoustics Laboratory
Page 32 of 168
This page was
intentionally
left blank

Client Report A1-006070.10 | Construction | Acoustics Laboratory
Page 33 of 168
ASTM E90 Test Results – Airborne Sound Transmission Loss
Client: Nordic Engineered Wood Test ID: TLA-14-088
Specimen ID: A1-006070-10W Date of Test: December 8, 2014
Room Volume (m³) Air Temperature (°C) Humidity (%)
Large 255.0 20.3 to 20.4 32.0 to 35.1 Area S of test specimen: 8.92 m2
Small 139.8 18.5 to 19.0 38.3 to 43.0 Mass per unit area: 138 kg/m2
f (Hz)
Airborne TL 1/3-octave
(dB)
50 27 c
63 21
80 19
100 25
125 30
160 32
200 39
250 44
315 50
400 59
500 65
630 69
800 72
1000 78
1250 83 c
1600 82 c
2000 73
2500 69
3150 71
4000 76
5000 79 c
Sound Transmission
Class (STC) 53
Sum of Deficiencies (dB)
21 Max. Deficiency (dB)
8 dB at 160 Hz
For a description of the test specimen and mounting conditions see text pages before. The results in this report apply only to the specific sample submitted for measurement. No responsibility is assumed for performance of any other specimen. Airborne sound transmission loss measurements were conducted in accordance with the requirements of ASTM E90-09, “Standard Test Method for Laboratory Measurement of Airborne Sound Transmission Loss of Building Partitions and Elements” with the exception that the humidity variation in the large room was above 3% and the humidity variation in the small room was above 3%. In the graph: The solid line is the measured sound transmission loss for this specimen. The dashed line is the STC contour fitted to the measured values according to ASTM E413-10. The dotted line (may be above the displayed range) is 10 dB below the flanking limit established for this facility. For any frequency band where the measured transmission loss is above the dotted line, the reported value is potentially limited by flanking transmission via laboratory surfaces, and the true value may be higher than that measured. Bars at the bottom of the graph show deficiencies where the measured data are less than the reference contour as described in the fitting procedure for the STC, defined in ASTM E413-10. The shaded cells in the table and areas in the graph are outside the STC contour range. In the table: Values marked “c” indicate that the measured background level was between 5 dB and 10 dB below the combined receiving room level and background level. The reported values have been corrected according to the procedure outlined in ASTM E90-09. Values marked “*” indicate that the measured background level was less than 5 dB below the combined receiving room level and background level, in which case, the corrected values provide an estimate of the lower limit of airborne sound transmission loss.
7 8
4
2
10
20
30
40
50
60
70
80
90
100
63 125 250 500 1000 2000 4000
Airb
orne
Sou
nd T
rans
mis
sion
Los
s, T
L, in
dB
Frequency, f, in Hz
STC 53
Client Report A1-006070.10 | Construction | Acoustics Laboratory
Page 34 of 168
Client Nordic Engineered Wood
1100 Ave des Canadiens-de-Montreal Montreal QC H3B 2S2
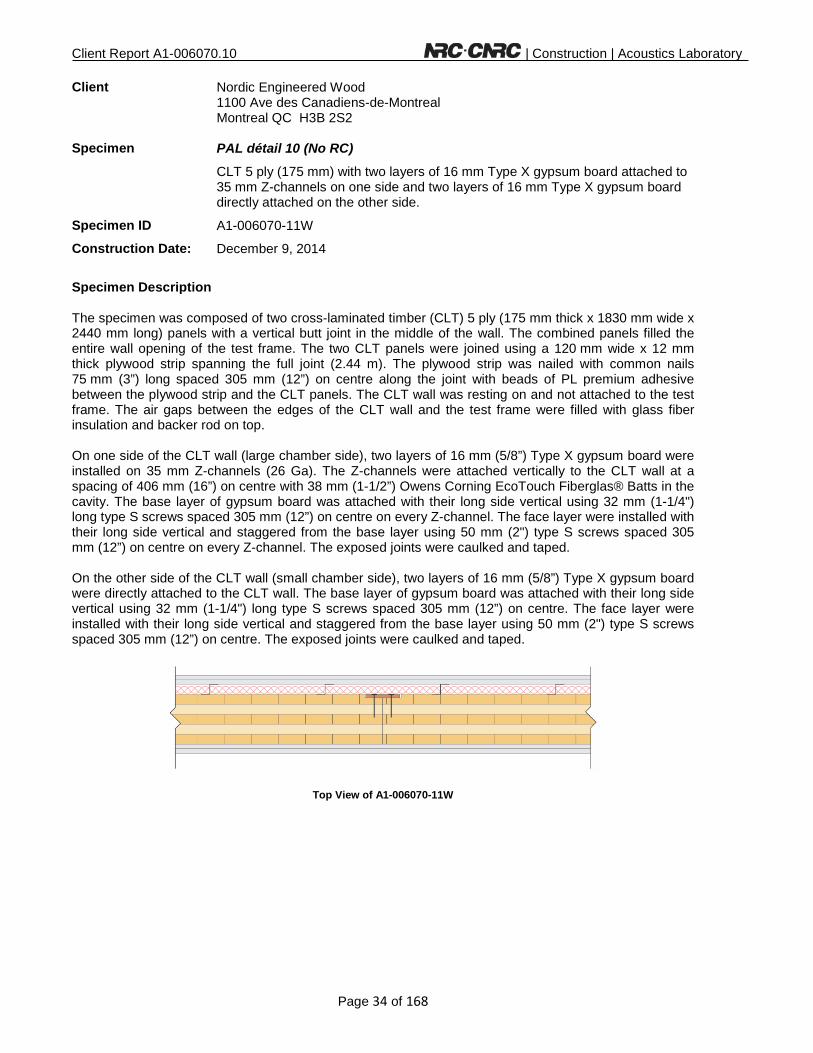
Specimen PAL détail 10 (No RC)
CLT 5 ply (175 mm) with two layers of 16 mm Type X gypsum board attached to 35 mm Z-channels on one side and two layers of 16 mm Type X gypsum board directly attached on the other side.
Specimen ID A1-006070-11W
Construction Date: December 9, 2014
Specimen Description The specimen was composed of two cross-laminated timber (CLT) 5 ply (175 mm thick x 1830 mm wide x 2440 mm long) panels with a vertical butt joint in the middle of the wall. The combined panels filled the entire wall opening of the test frame. The two CLT panels were joined using a 120 mm wide x 12 mm thick plywood strip spanning the full joint (2.44 m). The plywood strip was nailed with common nails 75 mm (3”) long spaced 305 mm (12”) on centre along the joint with beads of PL premium adhesive between the plywood strip and the CLT panels. The CLT wall was resting on and not attached to the test frame. The air gaps between the edges of the CLT wall and the test frame were filled with glass fiber insulation and backer rod on top. On one side of the CLT wall (large chamber side), two layers of 16 mm (5/8”) Type X gypsum board were installed on 35 mm Z-channels (26 Ga). The Z-channels were attached vertically to the CLT wall at a spacing of 406 mm (16”) on centre with 38 mm (1-1/2”) Owens Corning EcoTouch Fiberglas® Batts in the cavity. The base layer of gypsum board was attached with their long side vertical using 32 mm (1-1/4") long type S screws spaced 305 mm (12”) on centre on every Z-channel. The face layer were installed with their long side vertical and staggered from the base layer using 50 mm (2") type S screws spaced 305 mm (12”) on centre on every Z-channel. The exposed joints were caulked and taped. On the other side of the CLT wall (small chamber side), two layers of 16 mm (5/8”) Type X gypsum board were directly attached to the CLT wall. The base layer of gypsum board was attached with their long side vertical using 32 mm (1-1/4") long type S screws spaced 305 mm (12”) on centre. The face layer were installed with their long side vertical and staggered from the base layer using 50 mm (2") type S screws spaced 305 mm (12”) on centre. The exposed joints were caulked and taped.
Top View of A1-006070-11W

Client Report A1-006070.10 | Construction | Acoustics Laboratory
Page 35 of 168
Specimen Properties
Element Actual
thickness (mm)
Mass (kg) Mass/length, area or volume
16 mm Type X Gypsum Board 16 98 11.0 kg/m2 16 mm Type X Gypsum Board 16 98 11.0 kg/m2 175 mm CLT 5-ply 175 812 91 kg/m2 38 mm OC EcoTouch Pink Glass Fibre Batts 38* 5 0.6 kg/m2 35 mm Z-channels (26 ga) 35 9 0.4 kg/m 16 mm Type X Gypsum Board 16 98 11.0 kg/m2 16 mm Type X Gypsum Board 16 98 11.0 kg/m2 Total 274 1218 137 kg/m2 * The thickness of the insulation batts is not included in the total specimen thickness. Test Specimen Installation
• The exposed area of the floor specimen used for the calculations of the airborne sound transmission loss was 8.92 m2 (3.66 m x 2.44 m).
• The mass per area of the elements was calculated using the total area (8.92 m2).

Client Report A1-006070.10 | Construction | Acoustics Laboratory
Page 36 of 168
This page was
intentionally
left blank

Client Report A1-006070.10 | Construction | Acoustics Laboratory
Page 37 of 168
ASTM E90 Test Results – Airborne Sound Transmission Loss
Client: Nordic Engineered Wood Test ID: TLA-14-089
Specimen ID: A1-006070-11W Date of Test: December 12, 2014
Room Volume (m³) Air Temperature (°C) Humidity (%)
Large 255.0 20.3 to 20.3 34.6 to 37.0 Area S of test specimen: 8.92 m2
Small 140.8 19.0 to 19.6 38.1 to 40.5 Mass per unit area: 137 kg/m2
f (Hz)
Airborne TL 1/3-octave
(dB)
50 30 c
63 25
80 22
100 26
125 33
160 37
200 37
250 41
315 43
400 49
500 54
630 58
800 62
1000 66
1250 67
1600 67
2000 64
2500 60
3150 63
4000 68
5000 73
Sound Transmission
Class (STC) 53
Sum of Deficiencies (dB)
27 Max. Deficiency (dB)
6 dB at 200 and 315 Hz
For a description of the test specimen and mounting conditions see text pages before. The results in this report apply only to the specific sample submitted for measurement. No responsibility is assumed for performance of any other specimen. Airborne sound transmission loss measurements were conducted in accordance with the requirements of ASTM E90-09, “Standard Test Method for Laboratory Measurement of Airborne Sound Transmission Loss of Building Partitions and Elements”. In the graph: The solid line is the measured sound transmission loss for this specimen. The dashed line is the STC contour fitted to the measured values according to ASTM E413-10. The dotted line (may be above the displayed range) is 10 dB below the flanking limit established for this facility. For any frequency band where the measured transmission loss is above the dotted line, the reported value is potentially limited by flanking transmission via laboratory surfaces, and the true value may be higher than that measured. Bars at the bottom of the graph show deficiencies where the measured data are less than the reference contour as described in the fitting procedure for the STC, defined in ASTM E413-10. The shaded cells in the table and areas in the graph are outside the STC contour range. In the table: Values marked “c” indicate that the measured background level was between 5 dB and 10 dB below the combined receiving room level and background level. The reported values have been corrected according to the procedure outlined in ASTM E90-09. Values marked “*” indicate that the measured background level was less than 5 dB below the combined receiving room level and background level, in which case, the corrected values provide an estimate of the lower limit of airborne sound transmission loss.
4 3
6 5
6
3
10
20
30
40
50
60
70
80
90
100
63 125 250 500 1000 2000 4000
Airb
orne
Sou
nd T
rans
mis
sion
Los
s, T
L, in
dB
Frequency, f, in Hz
STC 53

Client Report A1-006070.10 | Construction | Acoustics Laboratory
Page 38 of 168
Client Nordic Engineered Wood
1100 Ave des Canadiens-de-Montreal Montreal QC H3B 2S2
Specimen CLT 5 ply (175 mm) with two layers of 16 mm Type X gypsum board attached to 35 mm Z-channels on one side and two layers of 16 mm Type X gypsum board directly attached on the other side of the CLT plus a decoupled steel stud wall with 13 mm Type C gypsum board.
Specimen ID A1-006070-12W
Construction Dates: December 9, 2014 to December 10, 2014
Specimen Description The specimen was composed of two cross-laminated timber (CLT) 5 ply (175 mm thick x 1830 mm wide x 2440 mm long) panels with a vertical butt joint in the middle of the wall. The combined panels filled the entire wall opening of the test frame. The two CLT panels were joined using a 120 mm wide x 12 mm thick plywood strip spanning the full joint (2.44 m). The plywood strip was nailed with common nails 75 mm (3”) long spaced 305 mm (12”) on centre along the joint with beads of PL premium adhesive between the plywood strip and the CLT panels. The CLT wall was resting on and not attached to the test frame. The air gaps between the edges of the CLT wall and the test frame were filled with glass fiber insulation and backer rod on top. On one side of the CLT wall (large chamber side), two layers of 16 mm (5/8”) Type X gypsum board were installed on 35 mm Z-channels (26 Ga). The Z-channels were attached vertically to the CLT wall at a spacing of 406 mm (16”) on centre with 38 mm (1-1/2”) Owens Corning EcoTouch Fiberglas® Batts in the cavity. The base layer of gypsum board was attached with their long side vertical using 32 mm (1-1/4") long type S screws spaced 305 mm (12”) on centre on every Z-channel. The face layer were installed with their long side vertical and staggered from the base layer using 50 mm (2") type S screws spaced 305 mm (12”) on centre on every Z-channel. The exposed joints were caulked and taped. On the other side of the CLT wall (small chamber side), two layers of 16 mm (5/8”) Type X gypsum board were directly attached. The base layer of gypsum board was attached with their long side vertical using 32 mm (1-1/4") long type S screws spaced 305 mm (12”) on centre on every. The face layer were installed with their long side vertical and staggered from the base layer using 50 mm (2") type S screws spaced 305 mm (12”) on centre. Steel studs were installed 19 mm (3/4”) in front of the CLT wall with a spacing of 406 mm (16”) on centre. One layer of 13 mm (1/2”) Type C gypsum board was installed on the decoupled 65 mm (2-1/2”) lightweight steel studs with 65 mm (2-1/2”) Roxul AFB batts in the cavity. The gypsum board was attached using 32 mm (1-1/4") long type S screws spaced 305 mm (12”) on centre. The exposed joints were caulked and taped.
Top View of A1-006070-12W

Client Report A1-006070.10 | Construction | Acoustics Laboratory
Page 39 of 168
Specimen Properties
Element Actual
thickness (mm)
Mass (kg) Mass/length, area or volume
13 mm Type C Gypsum Board 13 89 10.0 kg/m2 65 mm Steel Studs (26 ga) 65 14 0.6 kg/m 65 mm Roxul AFB ® Batts 65* 27 3.0 kg/m2 19 mm Air Gap 19 - - - 16 mm Type X Gypsum Board 16 98 11.0 kg/m2 16 mm Type X Gypsum Board 16 98 11.0 kg/m2 175 mm CLT 5-ply 175 812 91.0 kg/m2 38 mm OC EcoTouch Pink Glass Fibre Batts 38* 5 0.6 kg/m2 35 mm Z-channels (26 ga) 35 9 0.4 kg/m 16 mm Type X Gypsum Board 16 98 11.0 kg/m2 16 mm Type X Gypsum Board 16 98 11.0 kg/m2 Total 371 1348 151 kg/m2 * The thicknesses of the insulation batts are not included in the total specimen thickness. Test Specimen Installation
• The exposed area of the wall specimen used for the calculations of the airborne sound transmission loss was 8.92 m2 (3.66 m x 2.44 m).
• The mass per area of the elements was calculated using the total area (8.92 m2).

Client Report A1-006070.10 | Construction | Acoustics Laboratory
Page 40 of 168
This page was
intentionally
left blank

Client Report A1-006070.10 | Construction | Acoustics Laboratory
Page 41 of 168
ASTM E90 Test Results – Airborne Sound Transmission Loss
Client: Nordic Engineered Wood Test ID: TLA-14-090
Specimen ID: A1-006070-12W Date of Test: December 10, 2014
Room Volume (m³) Air Temperature (°C) Humidity (%)
Large 255.0 20.4 to 20.5 34.4 to 36.6 Area S of test specimen: 8.92 m2
Small 140.0 19.1 to 19.8 38.0 to 40.8 Mass per unit area: 151 kg/m2
f (Hz)
Airborne TL 1/3-octave
(dB)
50 27 c
63 21
80 19
100 25
125 30
160 32
200 39
250 44
315 50
400 59
500 65
630 69
800 72
1000 78 c
1250 83 c
1600 82 *
2000 73 *
2500 69 *
3150 71 *
4000 76 *
5000 79 *
Sound Transmission
Class (STC) 65
Sum of Deficiencies (dB)
9 Max. Deficiency (dB)
8 dB at 125 Hz
For a description of the test specimen and mounting conditions see text pages before. The results in this report apply only to the specific sample submitted for measurement. No responsibility is assumed for performance of any other specimen. Airborne sound transmission loss measurements were conducted in accordance with the requirements of ASTM E90-09, “Standard Test Method for Laboratory Measurement of Airborne Sound Transmission Loss of Building Partitions and Elements”. In the graph: The solid line is the measured sound transmission loss for this specimen. The dashed line is the STC contour fitted to the measured values according to ASTM E413-10. The dotted line (may be above the displayed range) is 10 dB below the flanking limit established for this facility. For any frequency band where the measured transmission loss is above the dotted line, the reported value is potentially limited by flanking transmission via laboratory surfaces, and the true value may be higher than that measured. Bars at the bottom of the graph show deficiencies where the measured data are less than the reference contour as described in the fitting procedure for the STC, defined in ASTM E413-10. The shaded cells in the table and areas in the graph are outside the STC contour range. In the table: Values marked “c” indicate that the measured background level was between 5 dB and 10 dB below the combined receiving room level and background level. The reported values have been corrected according to the procedure outlined in ASTM E90-09. Values marked “*” indicate that the measured background level was less than 5 dB below the combined receiving room level and background level, in which case, the corrected values provide an estimate of the lower limit of airborne sound transmission loss.
8
1
10
20
30
40
50
60
70
80
90
100
63 125 250 500 1000 2000 4000
Airb
orne
Sou
nd T
rans
mis
sion
Los
s, T
L, in
dB
Frequency, f, in Hz
STC 65

Client Report A1-006070.10 | Construction | Acoustics Laboratory
Page 42 of 168
Client Nordic Engineered Wood
1100 Ave des Canadiens-de-Montreal Montreal QC H3B 2S2
Specimen CLT 5 ply (175 mm) with two layers of 16 mm Type X gypsum board directly attached with a decoupled steel stud wall with 13 mm Type C gypsum board on one side.
Specimen ID A1-006070-13W
Construction Date: December 10, 2014
Specimen Description The specimen was composed of two cross-laminated timber (CLT) 5 ply (175 mm thick x 1830 mm wide x 2440 mm long) panels with a vertical butt joint in the middle of the wall. The combined panels filled the entire wall opening of the test frame. The two CLT panels were joined using a 120 mm wide x 12 mm thick plywood strip spanning the full joint (2.44 m). The plywood strip was nailed with common nails 75 mm (3”) long spaced 305 mm (12”) on centre along the joint with beads of PL premium adhesive between the plywood strip and the CLT panels. The CLT wall was resting on and not attached to the test frame. The air gaps between the edges of the CLT wall and the test frame were filled with glass fiber insulation and backer rod on top. On one side of the CLT wall (small chamber side), two layers of 16 mm (5/8”) Type X gypsum board were directly attached. The base layer of gypsum board was attached with their long side vertical using 32 mm (1-1/4") long type S screws spaced 305 mm (12”) on centre. The face layer were installed with their long side vertical and staggered from the base layer using 50 mm (2") type S screws spaced 305 mm (12”) on centre. One layer of 13 mm (1/2”) Type C gypsum board was installed on decoupled 65 mm (2-1/2”) lightweight steel studs with 65 mm (2-1/2”) Roxul AFB batts in the cavity. The steel studs were installed 19 mm (3/4”) in front of the CLT wall with a spacing of 406 mm (16”) on centre. The 13 mm (1/2”) Type C gypsum board was attached using 32 mm (1-1/4") long type S screws to every studs. The exposed joints were caulked and taped.
Top View of A1-006070-13W Specimen Properties
Element Actual
thickness (mm)
Mass (kg) Mass/length, area or volume
13 mm Type C Gypsum Board 13 89 10.0 kg/m2 65 mm Steel Studs (26 ga) 65 14 0.6 kg/m 65 mm Roxul AFB ® Batts 65* 27 3.0 kg/m2 19 mm Air Gap 19 - - - 16 mm Type X Gypsum Board 16 98 11.0 kg/m2 16 mm Type X Gypsum Board 16 98 11.0 kg/m2 175 mm CLT 5-ply 175 812 91.0 kg/m2 Total 304 1138 128 kg/m2 * The thickness of the insulation batts is not included in the total specimen thickness.

Client Report A1-006070.10 | Construction | Acoustics Laboratory
Page 43 of 168
Test Specimen Installation
• The exposed area of the wall specimen used for the calculations of the airborne sound transmission loss was 8.92 m2 (3.66 m x 2.44 m).
• The mass per area of the elements was calculated using the total area (8.92 m2).

Client Report A1-006070.10 | Construction | Acoustics Laboratory
Page 44 of 168
This page was
intentionally
left blank

Client Report A1-006070.10 | Construction | Acoustics Laboratory
Page 45 of 168
ASTM E90 Test Results – Airborne Sound Transmission Loss
Client: Nordic Engineered Wood Test ID: TLA-14-091
Specimen ID: A1-006070-13W Date of Test: December 10, 2014
Room Volume (m³) Air Temperature (°C) Humidity (%)
Large 255.6 20.4 to 20.6 31.5 to 36.7 Area S of test specimen: 8.92 m2
Small 140.0 19.0 to 19.1 37.2 to 37.6 Mass per unit area: 128 kg/m2
f (Hz)
Airborne TL 1/3-octave
(dB)
50 26 c
63 30
80 28
100 32
125 42
160 45
200 47
250 50
315 51
400 58
500 63
630 66
800 69
1000 74
1250 78
1600 82 c
2000 86 c
2500 85 c
3150 87 *
4000 86 *
5000 83 *
Sound Transmission
Class (STC) 62
Sum of Deficiencies (dB)
28 Max. Deficiency (dB)
7 dB at 315 Hz
For a description of the test specimen and mounting conditions see text pages before. The results in this report apply only to the specific sample submitted for measurement. No responsibility is assumed for performance of any other specimen. Airborne sound transmission loss measurements were conducted in accordance with the requirements of ASTM E90-09, “Standard Test Method for Laboratory Measurement of Airborne Sound Transmission Loss of Building Partitions and Elements” with the exception that the humidity variation in the large room was above 3%. In the graph: The solid line is the measured sound transmission loss for this specimen. The dashed line is the STC contour fitted to the measured values according to ASTM E413-10. The dotted line (may be above the displayed range) is 10 dB below the flanking limit established for this facility. For any frequency band where the measured transmission loss is above the dotted line, the reported value is potentially limited by flanking transmission via laboratory surfaces, and the true value may be higher than that measured. Bars at the bottom of the graph show deficiencies where the measured data are less than the reference contour as described in the fitting procedure for the STC, defined in ASTM E413-10. The shaded cells in the table and areas in the graph are outside the STC contour range. In the table: Values marked “c” indicate that the measured background level was between 5 dB and 10 dB below the combined receiving room level and background level. The reported values have been corrected according to the procedure outlined in ASTM E90-09. Values marked “*” indicate that the measured background level was less than 5 dB below the combined receiving room level and background level, in which case, the corrected values provide an estimate of the lower limit of airborne sound transmission loss.
4 4 5 5
7
3
10
20
30
40
50
60
70
80
90
100
63 125 250 500 1000 2000 4000
Airb
orne
Sou
nd T
rans
mis
sion
Los
s, T
L, in
dB
Frequency, f, in Hz
STC 62

Client Report A1-006070.10 | Construction | Acoustics Laboratory
Page 46 of 168
Client Nordic Engineered Wood
1100 Ave des Canadiens-de-Montreal Montreal QC H3B 2S2
Specimen PAL détail 9
CLT 5 ply (175 mm) with two layers of 16 mm Type X gypsum board directly attached to both sides with a decoupled steel stud wall with 13 mm Type C gypsum board on one side.
Specimen ID A1-006070-14W
Construction Date: December 11, 2014
Specimen Description The specimen was composed of two cross-laminated timber (CLT) 5 ply (175 mm thick x 1830 mm wide x 2440 mm long) panels with a vertical butt joint in the middle of the wall. The combined panels filled the entire wall opening of the test frame. The two CLT panels were joined using a 120 mm wide x 12 mm thick plywood strip spanning the full joint (2.44 m). The plywood strip was nailed with common nails 75 mm (3”) long spaced 305 mm (12”) on centre along the joint with beads of PL premium adhesive between the plywood strip and the CLT panels. The CLT wall was resting on and not attached to the test frame. The air gaps between the edges of the CLT wall and the test frame were filled with glass fiber insulation and backer rod on top. On one side of the CLT wall (large chamber side), two layers of 16 mm (5/8”) Type X gypsum board were directly attached to the CLT wall. The base layer of gypsum board was attached with their long side vertical using 32 mm (1-1/4") long type S screws spaced 305 mm (12”) on centre. The face layer were installed with their long side vertical and staggered from the base layer using 50 mm (2") type S screws spaced 305 mm (12”) on centre. The exposed joints were caulked and taped. On one side of the CLT wall (small chamber side), two layers of 16 mm (5/8”) Type X gypsum board were directly attached. The base layer of gypsum board was attached with their long side vertical using 32 mm (1-1/4") long type S screws spaced 305 mm (12”) on centre. The face layer were installed with their long side vertical and staggered from the base layer using 50 mm (2") type S screws spaced 305 mm (12”) on centre. One layer of 13 mm (1/2”) Type C gypsum board was installed on decoupled 65 mm (2-1/2”) lightweight steel studs with 65 mm (2-1/2”) Roxul AFB batts in the cavity. The steel studs were installed 19 mm (3/4”) in front of the CLT wall with a spacing of 406 mm (16”) on centre. The 13 mm (1/2”) Type C gypsum board was attached using 32 mm (1-1/4") long type S screws to every studs. The exposed joints were caulked and taped.
Top View of A1-006070-14W

Client Report A1-006070.10 | Construction | Acoustics Laboratory
Page 47 of 168
Specimen Properties
Element Actual
thickness (mm)
Mass (kg) Mass/length, area or volume
13 mm Type C Gypsum Board 13 89 10.0 kg/m2 65 mm Steel Studs (26 Ga) 65 14 0.6 kg/m 65 mm Roxul AFB ® Batts 65* 27 3.0 kg/m2 19 mm Air Gap 19 - - - 16 mm Type X Gypsum Board 16 98 11.0 kg/m2 16 mm Type X Gypsum Board 16 98 11.0 kg/m2 175 mm CLT 5-ply 175 812 91.0 kg/m2 16 mm Type X Gypsum Board 16 98 11.0 kg/m2 16 mm Type X Gypsum Board 16 98 11.0 kg/m2 Total 336 1334 150 kg/m2 * The thickness of the insulation batts is not included in the total specimen thickness.
Test Specimen Installation
• The exposed area of the wall specimen used for the calculations of the airborne sound transmission loss was 8.92 m2 (3.66 m x 2.44 m).
• The mass per area of the elements was calculated using the total area (8.92 m2).

Client Report A1-006070.10 | Construction | Acoustics Laboratory
Page 48 of 168
This page was
intentionally
left blank

Client Report A1-006070.10 | Construction | Acoustics Laboratory
Page 49 of 168
ASTM E90 Test Results – Airborne Sound Transmission Loss
Client: Nordic Engineered Wood Test ID: TLA-14-092
Specimen ID: A1-006070-14W Date of Test: December 11, 2014
Room Volume (m³) Air Temperature (°C) Humidity (%)
Large 255.3 20.3 to 20.7 34.2 to 38.6 Area S of test specimen: 8.92 m2
Small 140.0 18.9 to 19.0 38.3 to 38.5 Mass per unit area: 150 kg/m2
f (Hz)
Airborne TL 1/3-octave
(dB)
50 28
63 31
80 29
100 34
125 43
160 45
200 48
250 48
315 51
400 55
500 59
630 61
800 66
1000 72
1250 78
1600 83 c
2000 85 c
2500 85 c
3150 89 *
4000 88 *
5000 83 *
Sound Transmission
Class (STC) 61
Sum of Deficiencies (dB)
28 Max. Deficiency (dB)
6 dB at 250 and 315 Hz
For a description of the test specimen and mounting conditions see text pages before. The results in this report apply only to the specific sample submitted for measurement. No responsibility is assumed for performance of any other specimen. Airborne sound transmission loss measurements were conducted in accordance with the requirements of ASTM E90-09, “Standard Test Method for Laboratory Measurement of Airborne Sound Transmission Loss of Building Partitions and Elements” with the exception that the humidity variation in the large room was above 3%. In the graph: The solid line is the measured sound transmission loss for this specimen. The dashed line is the STC contour fitted to the measured values according to ASTM E413-10. The dotted line (may be above the displayed range) is 10 dB below the flanking limit established for this facility. For any frequency band where the measured transmission loss is above the dotted line, the reported value is potentially limited by flanking transmission via laboratory surfaces, and the true value may be higher than that measured. Bars at the bottom of the graph show deficiencies where the measured data are less than the reference contour as described in the fitting procedure for the STC, defined in ASTM E413-10. The shaded cells in the table and areas in the graph are outside the STC contour range. In the table: Values marked “c” indicate that the measured background level was between 5 dB and 10 dB below the combined receiving room level and background level. The reported values have been corrected according to the procedure outlined in ASTM E90-09. Values marked “*” indicate that the measured background level was less than 5 dB below the combined receiving room level and background level, in which case, the corrected values provide an estimate of the lower limit of airborne sound transmission loss.
2 3 3
6 6 5
2 1
10
20
30
40
50
60
70
80
90
100
63 125 250 500 1000 2000 4000
Airb
orne
Sou
nd T
rans
mis
sion
Los
s, T
L, in
dB
Frequency, f, in Hz
STC 61
Client Report A1-006070.10 | Construction | Acoustics Laboratory
Page 50 of 168
Client Nordic Engineered Wood
1100 Ave des Canadiens-de-Montreal Montreal QC H3B 2S2
Specimen Bare CLT 5 ply (175 mm)
Specimen ID A1-006070-01F
Construction Date: December 10, 2014
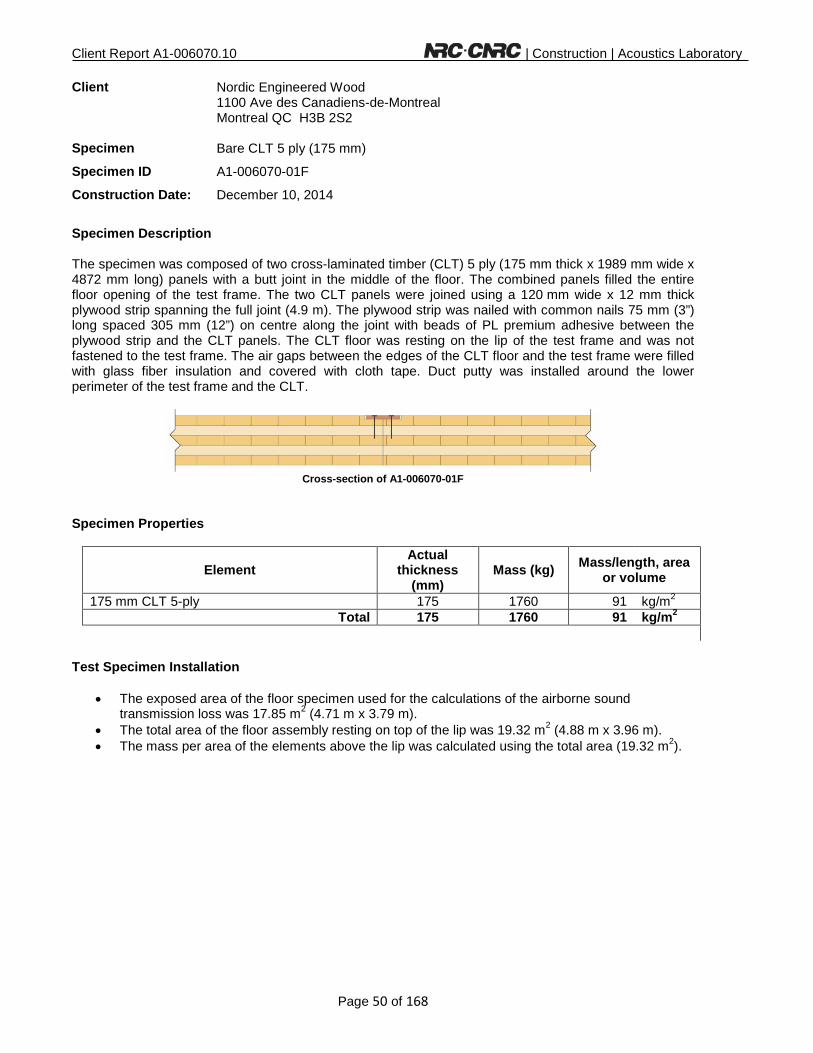
Specimen Description The specimen was composed of two cross-laminated timber (CLT) 5 ply (175 mm thick x 1989 mm wide x 4872 mm long) panels with a butt joint in the middle of the floor. The combined panels filled the entire floor opening of the test frame. The two CLT panels were joined using a 120 mm wide x 12 mm thick plywood strip spanning the full joint (4.9 m). The plywood strip was nailed with common nails 75 mm (3”) long spaced 305 mm (12”) on centre along the joint with beads of PL premium adhesive between the plywood strip and the CLT panels. The CLT floor was resting on the lip of the test frame and was not fastened to the test frame. The air gaps between the edges of the CLT floor and the test frame were filled with glass fiber insulation and covered with cloth tape. Duct putty was installed around the lower perimeter of the test frame and the CLT.
Cross-section of A1-006070-01F
Specimen Properties
Element Actual
thickness (mm)
Mass (kg) Mass/length, area or volume
175 mm CLT 5-ply 175 1760 91 kg/m2 Total 175 1760 91 kg/m2
Test Specimen Installation
• The exposed area of the floor specimen used for the calculations of the airborne sound transmission loss was 17.85 m2 (4.71 m x 3.79 m).
• The total area of the floor assembly resting on top of the lip was 19.32 m2 (4.88 m x 3.96 m). • The mass per area of the elements above the lip was calculated using the total area (19.32 m2).

Client Report A1-006070.10 | Construction | Acoustics Laboratory
Page 51 of 168
This page was
intentionally
left blank
Client Report A1-006070.10 | Construction | Acoustics Laboratory
Page 52 of 168
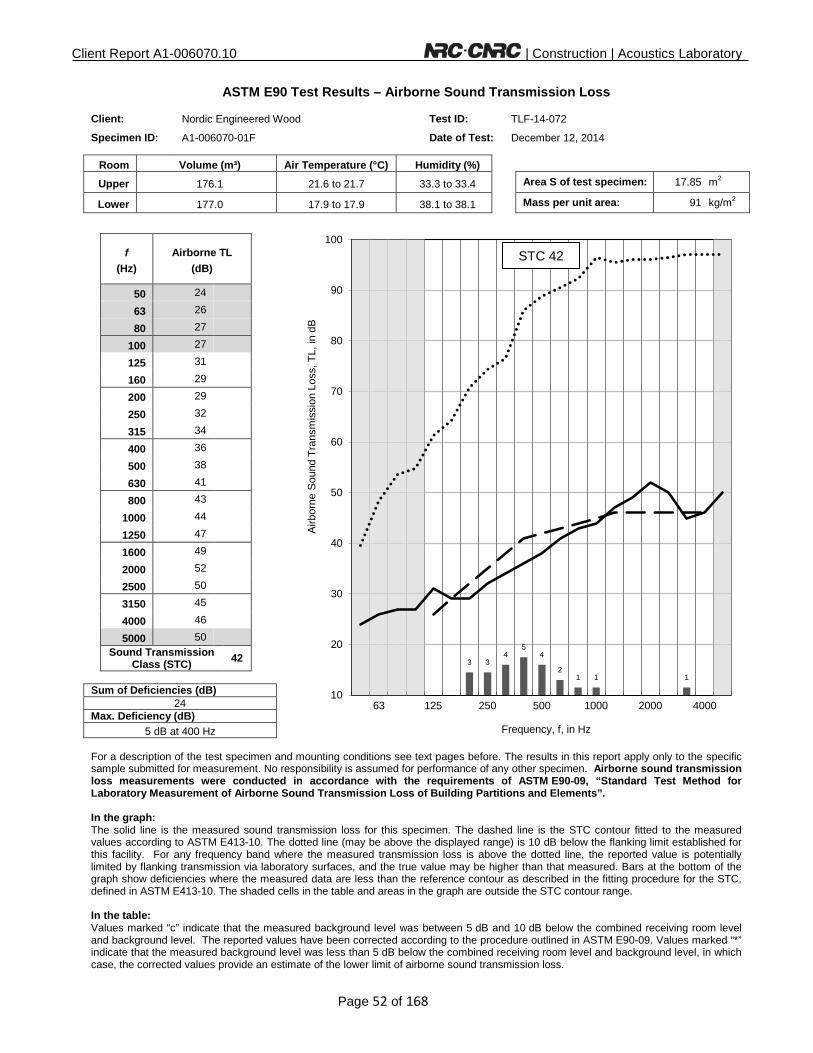
ASTM E90 Test Results – Airborne Sound Transmission Loss
Client: Nordic Engineered Wood Test ID: TLF-14-072
Specimen ID: A1-006070-01F Date of Test: December 12, 2014
Room Volume (m³) Air Temperature (°C) Humidity (%)
Upper 176.1 21.6 to 21.7 33.3 to 33.4 Area S of test specimen: 17.85 m2
Lower 177.0 17.9 to 17.9 38.1 to 38.1 Mass per unit area: 91 kg/m2
f (Hz)
Airborne TL (dB)
50 24
63 26
80 27
100 27
125 31
160 29
200 29
250 32
315 34
400 36
500 38
630 41
800 43
1000 44
1250 47
1600 49
2000 52
2500 50
3150 45
4000 46
5000 50
Sound Transmission
Class (STC) 42
Sum of Deficiencies (dB)
24 Max. Deficiency (dB)
5 dB at 400 Hz
For a description of the test specimen and mounting conditions see text pages before. The results in this report apply only to the specific sample submitted for measurement. No responsibility is assumed for performance of any other specimen. Airborne sound transmission loss measurements were conducted in accordance with the requirements of ASTM E90-09, “Standard Test Method for Laboratory Measurement of Airborne Sound Transmission Loss of Building Partitions and Elements”. In the graph: The solid line is the measured sound transmission loss for this specimen. The dashed line is the STC contour fitted to the measured values according to ASTM E413-10. The dotted line (may be above the displayed range) is 10 dB below the flanking limit established for this facility. For any frequency band where the measured transmission loss is above the dotted line, the reported value is potentially limited by flanking transmission via laboratory surfaces, and the true value may be higher than that measured. Bars at the bottom of the graph show deficiencies where the measured data are less than the reference contour as described in the fitting procedure for the STC, defined in ASTM E413-10. The shaded cells in the table and areas in the graph are outside the STC contour range. In the table: Values marked “c” indicate that the measured background level was between 5 dB and 10 dB below the combined receiving room level and background level. The reported values have been corrected according to the procedure outlined in ASTM E90-09. Values marked “*” indicate that the measured background level was less than 5 dB below the combined receiving room level and background level, in which case, the corrected values provide an estimate of the lower limit of airborne sound transmission loss.
3 3 4
5 4
2 1 1 1
10
20
30
40
50
60
70
80
90
100
63 125 250 500 1000 2000 4000
Airb
orne
Sou
nd T
rans
mis
sion
Los
s, T
L, in
dB
Frequency, f, in Hz
STC 42

Client Report A1-006070.10 | Construction | Acoustics Laboratory
Page 53 of 168
ASTM E492 Test Results – Normalized Impact Sound Pressure Levels
Client: Nordic Engineered Wood Test ID: IIF-14-038
Specimen ID: A1-006070-01F Date of Test: December 12, 2014
Room Volume (m³) Air Temperature (°C) Humidity (%)
Upper 176.1 21.7 to 21.8 32.8 to 33.1 Area S of test specimen: 17.85 m2
Lower 177.0 17.9 to 18.0 37.9 to 38.0 Mass per unit area: 91 kg/m2
f (Hz)
NISPL (dB)
50 77
63 73
80 70
100 74
125 77
160 80
200 80
250 82
315 82
400 82
500 83
630 84
800 85
1000 85
1250 84
1600 81
2000 76
2500 70
3150 68
4000 65
5000 58
Impact Insulation
Class (IIC)
26
Sum of Positive Differences (dB)
27 Max. Positive Difference (dB)
6 dB at 1250 and 1600 Hz
For a description of the test specimen and mounting conditions see text pages before. The results in this report apply only to the specific sample submitted for measurement. No responsibility is assumed for performance of any other specimen. Measurements of normalized impact sound pressure level (NISPL) were conducted in accordance with the requirements of ASTM E492-09, “Standard Laboratory Measurement of Impact Sound Transmission through Floor-Ceiling Assemblies Using the Tapping Machine”. In the graph: The solid line is the measured normalized impact sound pressure level (NISPL) for this specimen. The dashed line is the IIC contour fitted to the measured values according to ASTM E989-06. The dotted line is the background sound level measured in the receiving room during this test (may be below the displayed range). For any frequency where measured NISPL is less than 10 dB above the dotted line, the reported values were adjusted as noted below. Bars at bottom of graph show positive differences; where the measured data are greater than the reference contour as defined in ASTM E989-06. Shaded cells in the table and areas in the graph are outside the IIC contour range. In the table: Values marked “c” indicate that the measured background level was between 5 dB and 10 dB below the combined receiving room level and background level. Values marked “*” indicate that the measured background level was less than 5 dB below the combined receiving room level and background level and the reported values of NISPL provide an estimate of the upper limit of normalized impact sound pressure level, according to the procedure outlined in ASTM E492-09. The reported values of NISPL have been corrected according to the procedure outlined in ASTM E492-09.
1
3 4
6 6
4
1 2
10
20
30
40
50
60
70
80
90
100
63 125 250 500 1000 2000 4000
Nor
mal
ized
Impa
ct S
ound
Pre
ssur
e Le
vel,
NIS
PL,
in d
B
Frequency, f, in Hz
IIC 26
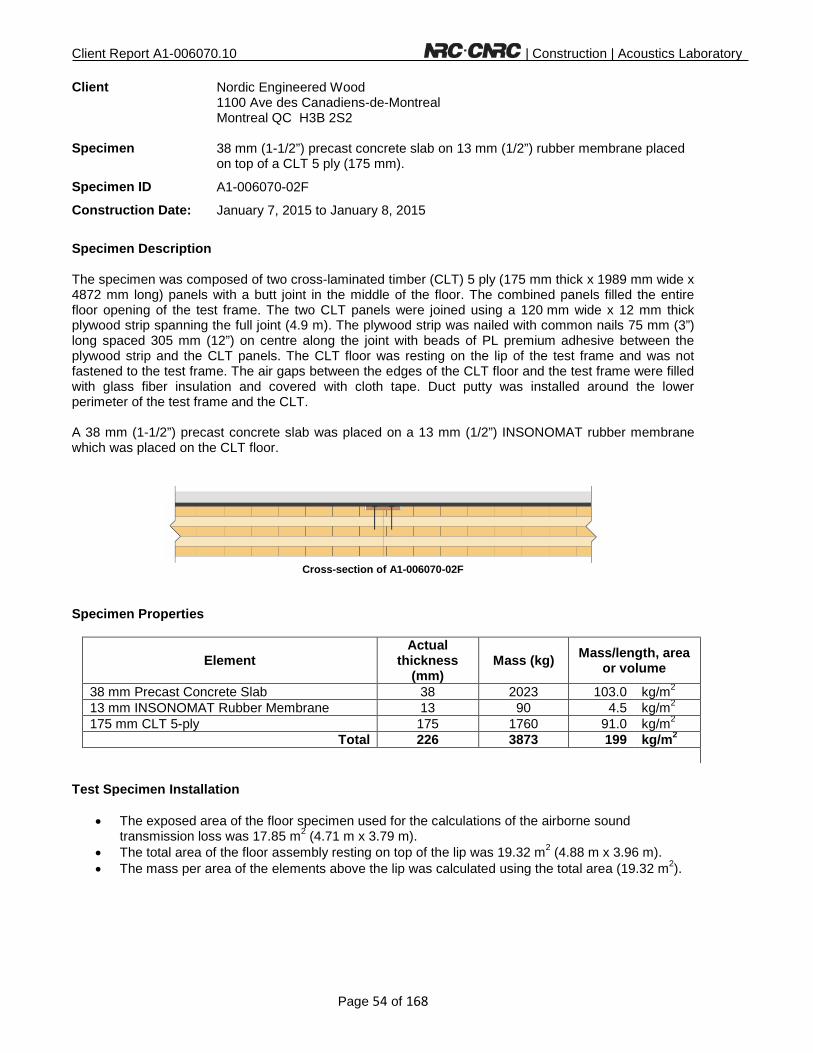
Client Report A1-006070.10 | Construction | Acoustics Laboratory
Page 54 of 168
Client Nordic Engineered Wood
1100 Ave des Canadiens-de-Montreal Montreal QC H3B 2S2
Specimen 38 mm (1-1/2”) precast concrete slab on 13 mm (1/2”) rubber membrane placed on top of a CLT 5 ply (175 mm).
Specimen ID A1-006070-02F
Construction Date: January 7, 2015 to January 8, 2015
Specimen Description The specimen was composed of two cross-laminated timber (CLT) 5 ply (175 mm thick x 1989 mm wide x 4872 mm long) panels with a butt joint in the middle of the floor. The combined panels filled the entire floor opening of the test frame. The two CLT panels were joined using a 120 mm wide x 12 mm thick plywood strip spanning the full joint (4.9 m). The plywood strip was nailed with common nails 75 mm (3”) long spaced 305 mm (12”) on centre along the joint with beads of PL premium adhesive between the plywood strip and the CLT panels. The CLT floor was resting on the lip of the test frame and was not fastened to the test frame. The air gaps between the edges of the CLT floor and the test frame were filled with glass fiber insulation and covered with cloth tape. Duct putty was installed around the lower perimeter of the test frame and the CLT. A 38 mm (1-1/2”) precast concrete slab was placed on a 13 mm (1/2”) INSONOMAT rubber membrane which was placed on the CLT floor.
Cross-section of A1-006070-02F
Specimen Properties
Element Actual
thickness (mm)
Mass (kg) Mass/length, area or volume
38 mm Precast Concrete Slab 38 2023 103.0 kg/m2 13 mm INSONOMAT Rubber Membrane 13 90 4.5 kg/m2 175 mm CLT 5-ply 175 1760 91.0 kg/m2 Total 226 3873 199 kg/m2
Test Specimen Installation
• The exposed area of the floor specimen used for the calculations of the airborne sound transmission loss was 17.85 m2 (4.71 m x 3.79 m).
• The total area of the floor assembly resting on top of the lip was 19.32 m2 (4.88 m x 3.96 m). • The mass per area of the elements above the lip was calculated using the total area (19.32 m2).

Client Report A1-006070.10 | Construction | Acoustics Laboratory
Page 55 of 168
This page was
intentionally
left blank

Client Report A1-006070.10 | Construction | Acoustics Laboratory
Page 56 of 168
ASTM E90 Test Results – Airborne Sound Transmission Loss
Client: Nordic Engineered Wood Test ID: TLF-15-002
Specimen ID: A1-006070-02F Date of Test: January 9, 2015
Room Volume (m³) Air Temperature (°C) Humidity (%)
Upper 175.1 21.6 to 21.6 34.5 to 34.7 Area S of test specimen: 17.85 m2
Lower 177.0 15.7 to 15.9 42.4 to 43.1 Mass per unit area: 199 kg/m2
f (Hz)
Airborne TL (dB)
50 33
63 35
80 35
100 33
125 36
160 38
200 41
250 45
315 49
400 51
500 52
630 56
800 63
1000 69
1250 75
1600 78
2000 85
2500 89 c
3150 90 c
4000 90 c
5000 88
Sound Transmission
Class (STC) 56
Sum of Deficiencies (dB)
30 Max. Deficiency (dB)
5 dB at 160 and 200 Hz
For a description of the test specimen and mounting conditions see text pages before. The results in this report apply only to the specific sample submitted for measurement. No responsibility is assumed for performance of any other specimen. Airborne sound transmission loss measurements were conducted in accordance with the requirements of ASTM E90-09, “Standard Test Method for Laboratory Measurement of Airborne Sound Transmission Loss of Building Partitions and Elements” with the exception that the temperature in the lower room was lower than 17ºC. In the graph: The solid line is the measured sound transmission loss for this specimen. The dashed line is the STC contour fitted to the measured values according to ASTM E413-10. The dotted line (may be above the displayed range) is 10 dB below the flanking limit established for this facility. For any frequency band where the measured transmission loss is above the dotted line, the reported value is potentially limited by flanking transmission via laboratory surfaces, and the true value may be higher than that measured. Bars at the bottom of the graph show deficiencies where the measured data are less than the reference contour as described in the fitting procedure for the STC, defined in ASTM E413-10. The shaded cells in the table and areas in the graph are outside the STC contour range. In the table: Values marked “c” indicate that the measured background level was between 5 dB and 10 dB below the combined receiving room level and background level. The reported values have been corrected according to the procedure outlined in ASTM E90-09. Values marked “*” indicate that the measured background level was less than 5 dB below the combined receiving room level and background level, in which case, the corrected values provide an estimate of the lower limit of airborne sound transmission loss.
4 5 5
4 3
4 4
1
10
20
30
40
50
60
70
80
90
100
63 125 250 500 1000 2000 4000
Airb
orne
Sou
nd T
rans
mis
sion
Los
s, T
L, in
dB
Frequency, f, in Hz
STC 56

Client Report A1-006070.10 | Construction | Acoustics Laboratory
Page 57 of 168
ASTM E492 Test Results – Normalized Impact Sound Pressure Levels
Client: Nordic Engineered Wood Test ID: IIF-15-001
Specimen ID: A1-006070-02F Date of Test: January 8, 2015
Room Volume (m³) Air Temperature (°C) Humidity (%)
Upper 175.1 20.2 to 20.4 18.4 to 19.5 Area S of test specimen: 17.85 m2
Lower 177.0 16.0 to 17.0 40.6 to 42.3 Mass per unit area: 199 kg/m2
f (Hz)
NISPL (dB)
50 54
63 59
80 63
100 67
125 67
160 69
200 68
250 68
315 67
400 66
500 64
630 63
800 61
1000 57
1250 54
1600 51
2000 48
2500 46
3150 46
4000 43
5000 37
Impact Insulation
Class (IIC)
48
Sum of Positive Differences (dB)
32 Max. Positive Difference (dB)
5 dB at 160 Hz
For a description of the test specimen and mounting conditions see text pages before. The results in this report apply only to the specific sample submitted for measurement. No responsibility is assumed for performance of any other specimen. Measurements of normalized impact sound pressure level (NISPL) were conducted in accordance with the requirements of ASTM E492-09, “Standard Laboratory Measurement of Impact Sound Transmission through Floor-Ceiling Assemblies Using the Tapping Machine” with the exception that the temperature in the lower room was lower than 17ºC. In the graph: The solid line is the measured normalized impact sound pressure level (NISPL) for this specimen. The dashed line is the IIC contour fitted to the measured values according to ASTM E989-06. The dotted line is the background sound level measured in the receiving room during this test (may be below the displayed range). For any frequency where measured NISPL is less than 10 dB above the dotted line, the reported values were adjusted as noted below. Bars at bottom of graph show positive differences; where the measured data are greater than the reference contour as defined in ASTM E989-06. Shaded cells in the table and areas in the graph are outside the IIC contour range. In the table: Values marked “c” indicate that the measured background level was between 5 dB and 10 dB below the combined receiving room level and background level. Values marked “*” indicate that the measured background level was less than 5 dB below the combined receiving room level and background level and the reported values of NISPL provide an estimate of the upper limit of normalized impact sound pressure level, according to the procedure outlined in ASTM E492-09. The reported values of NISPL have been corrected according to the procedure outlined in ASTM E492-09.
3 3
5 4 4
3 3 2 2
1 2
10
20
30
40
50
60
70
80
90
100
63 125 250 500 1000 2000 4000
Nor
mal
ized
Impa
ct S
ound
Pre
ssur
e Le
vel,
NIS
PL,
in d
B
Frequency, f, in Hz
IIC 48

Client Report A1-006070.10 | Construction | Acoustics Laboratory
Page 58 of 168
Client Nordic Engineered Wood
1100 Ave des Canadiens-de-Montreal Montreal QC H3B 2S2
Specimen 10 mm floating engineered wood floor placed on a 2 mm closed cell foam on 38 mm (1-1/2”) precast concrete slab on 13 mm (1/2”) rubber membrane placed on top of a CLT 5 ply (175 mm).
Specimen ID A1-006070-03F
Construction Date: January 28, 2015 to January 30, 2015
Specimen Description The specimen was composed of two cross-laminated timber (CLT) 5 ply (175 mm thick x 1989 mm wide x 4872 mm long) panels with a butt joint in the middle of the floor. The combined panels filled the entire floor opening of the test frame. The two CLT panels were joined using a 120 mm wide x 12 mm thick plywood strip spanning the full joint (4.9 m). The plywood strip was nailed with common nails 75 mm (3”) long spaced 305 mm (12”) on centre along the joint with beads of PL premium adhesive between the plywood strip and the CLT panels. The CLT floor was resting on the lip of the test frame and was not fastened to the test frame. The air gaps between the edges of the CLT floor and the test frame were filled with glass fiber insulation and covered with cloth tape. Duct putty was installed around the lower perimeter of the test frame and the CLT. Engineered floating floor (TORLYS Everest Premier Hardwood – 10 mm thick) with attached cork underlay was installed on top of a 2 mm Roberts® Soft Stride closed cell foam which was placed on top of a 38 mm (1-1/2”) precast concrete slab. The 38 mm precast concrete slab was placed on top of 13 mm INSONOMAT rubber membrane which was placed on the CLT floor.
Cross-section of A1-006070-03F
Specimen Properties
Element Actual
thickness (mm)
Mass (kg) Mass/length, area or volume
10 mm TORLYS Everest Premier Hardwood 10 146 7.3 kg/m2 2 mm Roberts® Soft Stride Closed Cell Foam 2 2.5 0.1 kg/m2 38 mm Precast Concrete Slab 38 2023 103.0 kg/m2 13 mm INSONOMAT Rubber Membrane 13 90 4.5 kg/m2 175 mm CLT 5-ply 175 1760 91.0 kg/m2 Total 238 4022 206 kg/m2
Test Specimen Installation
• The exposed area of the floor specimen used for the calculations of the airborne sound transmission loss was 17.85 m2 (4.71 m x 3.79 m).
• The total area of the floor assembly resting on top of the lip was 19.32 m2 (4.88 m x 3.96 m). • The mass per area of the elements above the lip was calculated using the total area (19.32 m2).

Client Report A1-006070.10 | Construction | Acoustics Laboratory
Page 59 of 168
This page was
intentionally
left blank

Client Report A1-006070.10 | Construction | Acoustics Laboratory
Page 60 of 168
ASTM E90 Test Results – Airborne Sound Transmission Loss
Client: Nordic Engineered Wood Test ID: TLF-15-003
Specimen ID: A1-006070-03F Date of Test: January 30, 2015
Room Volume (m³) Air Temperature (°C) Humidity (%)
Upper 175.0 22.2 to 22.4 35.6 to 36.6 Area S of test specimen: 17.85 m2
Lower 177.0 17.3 to 18.3 36.9 to 38.2 Mass per unit area: 206 kg/m2
f (Hz)
Airborne TL (dB)
50 19
63 27
80 20
100 24
125 26
160 26
200 27
250 29
315 30
400 32
500 33
630 34
800 35
1000 37
1250 39
1600 43
2000 44 c
2500 46 c
3150 46 c
4000 46 c
5000 47 c
Sound Transmission
Class (STC) 55
Sum of Deficiencies (dB)
29 Max. Deficiency (dB)
5 dB at 400 and 500 Hz
For a description of the test specimen and mounting conditions see text pages before. The results in this report apply only to the specific sample submitted for measurement. No responsibility is assumed for performance of any other specimen. Airborne sound transmission loss measurements were conducted in accordance with the requirements of ASTM E90-09, “Standard Test Method for Laboratory Measurement of Airborne Sound Transmission Loss of Building Partitions and Elements”. In the graph: The solid line is the measured sound transmission loss for this specimen. The dashed line is the STC contour fitted to the measured values according to ASTM E413-10. The dotted line (may be above the displayed range) is 10 dB below the flanking limit established for this facility. For any frequency band where the measured transmission loss is above the dotted line, the reported value is potentially limited by flanking transmission via laboratory surfaces, and the true value may be higher than that measured. Bars at the bottom of the graph show deficiencies where the measured data are less than the reference contour as described in the fitting procedure for the STC, defined in ASTM E413-10. The shaded cells in the table and areas in the graph are outside the STC contour range. In the table: Values marked “c” indicate that the measured background level was between 5 dB and 10 dB below the combined receiving room level and background level. The reported values have been corrected according to the procedure outlined in ASTM E90-09. Values marked “*” indicate that the measured background level was less than 5 dB below the combined receiving room level and background level, in which case, the corrected values provide an estimate of the lower limit of airborne sound transmission loss.
3 4 4 4
3
5 5
1
10
20
30
40
50
60
70
80
90
100
63 125 250 500 1000 2000 4000
Airb
orne
Sou
nd T
rans
mis
sion
Los
s, T
L, in
dB
Frequency, f, in Hz
STC 55

Client Report A1-006070.10 | Construction | Acoustics Laboratory
Page 61 of 168
ASTM E492 Test Results – Normalized Impact Sound Pressure Levels
Client: Nordic Engineered Wood Test ID: IIF-15-002
Specimen ID: A1-006070-03F Date of Test: February 2, 2015
Room Volume (m³) Air Temperature (°C) Humidity (%)
Upper 175.0 21.0 to 21.0 34.5 to 36.3 Area S of test specimen: 17.85 m2
Lower 177.0 17.0 to 17.6 37.0 to 38.5 Mass per unit area: 206 kg/m2
f (Hz)
NISPL (dB)
50 52
63 57
80 62
100 66
125 67
160 67
200 67
250 66
315 64
400 60
500 54
630 45
800 40
1000 34
1250 26
1600 18 c
2000 12 *
2500 12 *
3150 14 *
4000 15 *
5000 17 *
Impact Insulation
Class (IIC)
51
Sum of Positive Differences (dB)
31 Max. Positive Difference (dB)
6 dB at 125, 160 and 200 Hz
For a description of the test specimen and mounting conditions see text pages before. The results in this report apply only to the specific sample submitted for measurement. No responsibility is assumed for performance of any other specimen. Measurements of normalized impact sound pressure level (NISPL) were conducted in accordance with the requirements of ASTM E492-09, “Standard Laboratory Measurement of Impact Sound Transmission through Floor-Ceiling Assemblies Using the Tapping Machine”. In the graph: The solid line is the measured normalized impact sound pressure level (NISPL) for this specimen. The dashed line is the IIC contour fitted to the measured values according to ASTM E989-06. The dotted line is the background sound level measured in the receiving room during this test (may be below the displayed range). For any frequency where measured NISPL is less than 10 dB above the dotted line, the reported values were adjusted as noted below. Bars at bottom of graph show positive differences; where the measured data are greater than the reference contour as defined in ASTM E989-06. Shaded cells in the table and areas in the graph are outside the IIC contour range. In the table: Values marked “c” indicate that the measured background level was between 5 dB and 10 dB below the combined receiving room level and background level. Values marked “*” indicate that the measured background level was less than 5 dB below the combined receiving room level and background level and the reported values of NISPL provide an estimate of the upper limit of normalized impact sound pressure level, according to the procedure outlined in ASTM E492-09. The reported values of NISPL have been corrected according to the procedure outlined in ASTM E492-09.
5 6 6 6
5
3
10
20
30
40
50
60
70
80
90
100
63 125 250 500 1000 2000 4000
Nor
mal
ized
Impa
ct S
ound
Pre
ssur
e Le
vel,
NIS
PL,
in d
B
Frequency, f, in Hz
IIC 51

Client Report A1-006070.10 | Construction | Acoustics Laboratory
Page 62 of 168
Client Nordic Engineered Wood
1100 Ave des Canadiens-de-Montreal Montreal QC H3B 2S2
Specimen 38 mm (1-1/2”) precast concrete slab on 10 mm tar boards placed on top of a CLT 5 ply (175 mm).
Specimen ID A1-006070-04F
Construction Date: February 3, 2015 to February 4, 2015
Specimen Description The specimen was composed of two cross-laminated timber (CLT) 5 ply (175 mm thick x 1989 mm wide x 4872 mm long) panels with a butt joint in the middle of the floor. The combined panels filled the entire floor opening of the test frame. The two CLT panels were joined using a 120 mm wide x 12 mm thick plywood strip spanning the full joint (4.9 m). The plywood strip was nailed with common nails 75 mm (3”) long spaced 305 mm (12”) on centre along the joint with beads of PL premium adhesive between the plywood strip and the CLT panels. The CLT floor was resting on the lip of the test frame and was not fastened to the test frame. The air gaps between the edges of the CLT floor and the test frame were filled with glass fiber insulation and covered with cloth tape. Duct putty was installed around the lower perimeter of the test frame and the CLT. A 38 mm (1-1/2”) precast concrete slab was placed on 10 mm tar boards which were placed on the CLT floor.
Cross-section of A1-006070-04F
Specimen Properties
Element Actual
thickness (mm)
Mass (kg) Mass/length, area or volume
38 mm Precast Concrete Slab 38 2023 103.0 kg/m2 10 mm Tar Board (Building Products) 10 56 2.8 kg/m2 175 mm CLT 5-ply 175 1760 91.0 kg/m2 Total 223 3839 197 kg/m2
Test Specimen Installation
• The exposed area of the floor specimen used for the calculations of the airborne sound transmission loss was 17.85 m2 (4.71 m x 3.79 m).
• The total area of the floor assembly resting on top of the lip was 19.32 m2 (4.88 m x 3.96 m). • The mass per area of the elements above the lip was calculated using the total area (19.32 m2).

Client Report A1-006070.10 | Construction | Acoustics Laboratory
Page 63 of 168
This page was
intentionally
left blank
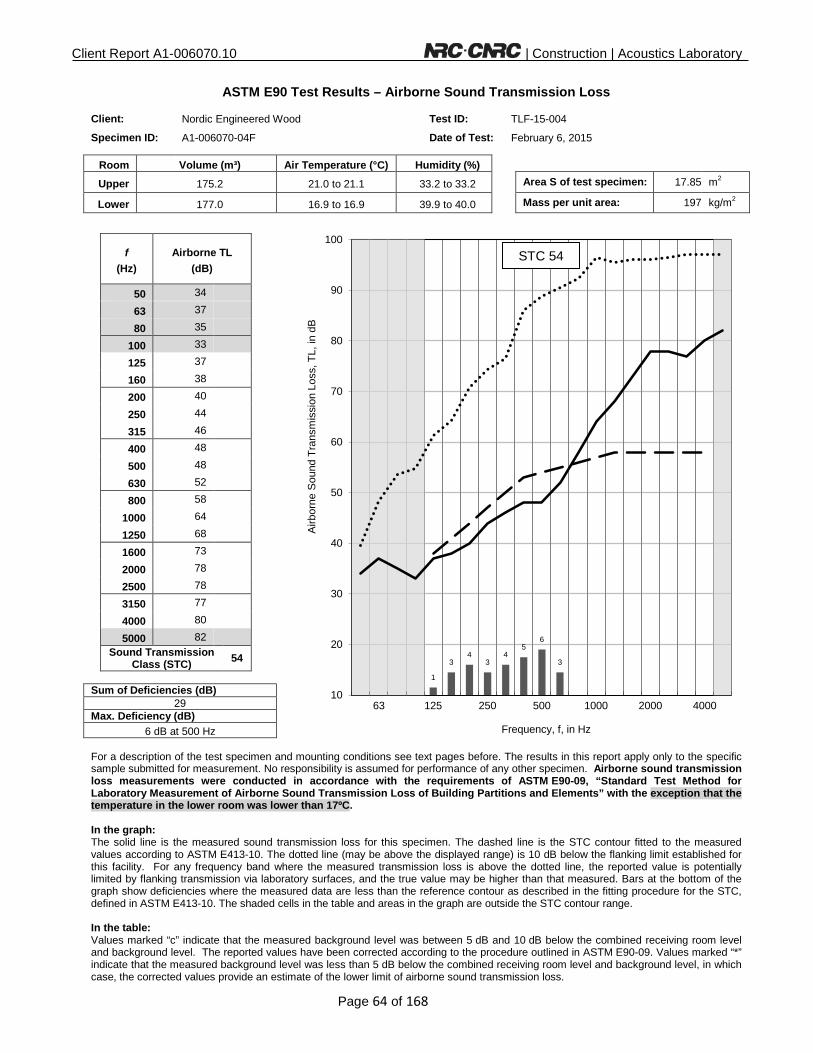
Client Report A1-006070.10 | Construction | Acoustics Laboratory
Page 64 of 168
ASTM E90 Test Results – Airborne Sound Transmission Loss
Client: Nordic Engineered Wood Test ID: TLF-15-004
Specimen ID: A1-006070-04F Date of Test: February 6, 2015
Room Volume (m³) Air Temperature (°C) Humidity (%)
Upper 175.2 21.0 to 21.1 33.2 to 33.2 Area S of test specimen: 17.85 m2
Lower 177.0 16.9 to 16.9 39.9 to 40.0 Mass per unit area: 197 kg/m2
f (Hz)
Airborne TL (dB)
50 34
63 37
80 35
100 33
125 37
160 38
200 40
250 44
315 46
400 48
500 48
630 52
800 58
1000 64
1250 68
1600 73
2000 78
2500 78
3150 77
4000 80
5000 82
Sound Transmission
Class (STC) 54
Sum of Deficiencies (dB)
29 Max. Deficiency (dB)
6 dB at 500 Hz
For a description of the test specimen and mounting conditions see text pages before. The results in this report apply only to the specific sample submitted for measurement. No responsibility is assumed for performance of any other specimen. Airborne sound transmission loss measurements were conducted in accordance with the requirements of ASTM E90-09, “Standard Test Method for Laboratory Measurement of Airborne Sound Transmission Loss of Building Partitions and Elements” with the exception that the temperature in the lower room was lower than 17ºC. In the graph: The solid line is the measured sound transmission loss for this specimen. The dashed line is the STC contour fitted to the measured values according to ASTM E413-10. The dotted line (may be above the displayed range) is 10 dB below the flanking limit established for this facility. For any frequency band where the measured transmission loss is above the dotted line, the reported value is potentially limited by flanking transmission via laboratory surfaces, and the true value may be higher than that measured. Bars at the bottom of the graph show deficiencies where the measured data are less than the reference contour as described in the fitting procedure for the STC, defined in ASTM E413-10. The shaded cells in the table and areas in the graph are outside the STC contour range. In the table: Values marked “c” indicate that the measured background level was between 5 dB and 10 dB below the combined receiving room level and background level. The reported values have been corrected according to the procedure outlined in ASTM E90-09. Values marked “*” indicate that the measured background level was less than 5 dB below the combined receiving room level and background level, in which case, the corrected values provide an estimate of the lower limit of airborne sound transmission loss.
1
3 4
3 4
5 6
3
10
20
30
40
50
60
70
80
90
100
63 125 250 500 1000 2000 4000
Airb
orne
Sou
nd T
rans
mis
sion
Los
s, T
L, in
dB
Frequency, f, in Hz
STC 54

Client Report A1-006070.10 | Construction | Acoustics Laboratory
Page 65 of 168
ASTM E492 Test Results – Normalized Impact Sound Pressure Levels
Client: Nordic Engineered Wood Test ID: IIF-15-003
Specimen ID: A1-006070-04F Date of Test: February 6, 2015
Room Volume (m³) Air Temperature (°C) Humidity (%)
Upper 175.2 21.4 to 21.4 33.0 to 33.9 Area S of test specimen: 17.85 m2
Lower 177.0 17.0 to 17.1 39.6 to 39.8 Mass per unit area: 197 kg/m2
f (Hz)
NISPL (dB)
50 61
63 59
80 63
100 66
125 69
160 73
200 73
250 73
315 72
400 71
500 70
630 68
800 66
1000 63
1250 61
1600 61
2000 58
2500 60
3150 64
4000 62
5000 57
Impact Insulation
Class (IIC)
36
Sum of Positive Differences (dB)
9 Max. Positive Difference (dB)
8 dB at 3150 Hz
For a description of the test specimen and mounting conditions see text pages before. The results in this report apply only to the specific sample submitted for measurement. No responsibility is assumed for performance of any other specimen. Measurements of normalized impact sound pressure level (NISPL) were conducted in accordance with the requirements of ASTM E492-09, “Standard Laboratory Measurement of Impact Sound Transmission through Floor-Ceiling Assemblies Using the Tapping Machine”. In the graph: The solid line is the measured normalized impact sound pressure level (NISPL) for this specimen. The dashed line is the IIC contour fitted to the measured values according to ASTM E989-06. The dotted line is the background sound level measured in the receiving room during this test (may be below the displayed range). For any frequency where measured NISPL is less than 10 dB above the dotted line, the reported values were adjusted as noted below. Bars at bottom of graph show positive differences; where the measured data are greater than the reference contour as defined in ASTM E989-06. Shaded cells in the table and areas in the graph are outside the IIC contour range. In the table: Values marked “c” indicate that the measured background level was between 5 dB and 10 dB below the combined receiving room level and background level. Values marked “*” indicate that the measured background level was less than 5 dB below the combined receiving room level and background level and the reported values of NISPL provide an estimate of the upper limit of normalized impact sound pressure level, according to the procedure outlined in ASTM E492-09. The reported values of NISPL have been corrected according to the procedure outlined in ASTM E492-09.
1
8
10
20
30
40
50
60
70
80
90
100
63 125 250 500 1000 2000 4000
Nor
mal
ized
Impa
ct S
ound
Pre
ssur
e Le
vel,
NIS
PL,
in d
B
Frequency, f, in Hz
IIC 36

Client Report A1-006070.10 | Construction | Acoustics Laboratory
Page 66 of 168
Client Nordic Engineered Wood
1100 Ave des Canadiens-de-Montreal Montreal QC H3B 2S2
Specimen 10 mm floating engineered wood floor placed on a 2 mm closed cell foam on 38 mm (1-1/2”) precast concrete slab on 10 mm tar boards placed on top of a CLT 5 ply (175 mm).
Specimen ID A1-006070-05F
Construction Date: February 9, 2015 to February 10, 2015
Specimen Description The specimen was composed of two cross-laminated timber (CLT) 5 ply (175 mm thick x 1989 mm wide x 4872 mm long) panels with a butt joint in the middle of the floor. The combined panels filled the entire floor opening of the test frame. The two CLT panels were joined using a 120 mm wide x 12 mm thick plywood strip spanning the full joint (4.9 m). The plywood strip was nailed with common nails 75 mm (3”) long spaced 305 mm (12”) on centre along the joint with beads of PL premium adhesive between the plywood strip and the CLT panels. The CLT floor was resting on the lip of the test frame and was not fastened to the test frame. The air gaps between the edges of the CLT floor and the test frame were filled with glass fiber insulation and covered with cloth tape. Duct putty was installed around the lower perimeter of the test frame and the CLT. Engineered floating floor (TORLYS Everest Premier Hardwood – 10 mm thick) with attached cork underlay was installed on top of a 2 mm Roberts® Soft Stride closed cell foam which was placed on top of a 38 mm (1-1/2”) precast concrete slab. The 38 mm precast concrete slab was placed on top of 10 mm tar boards which was placed on the CLT floor.
Cross-section of A1-006070-05F
Specimen Properties
Element Actual
thickness (mm)
Mass (kg) Mass/length, area or volume
10 mm TORLYS Everest Premier Hardwood 10 146 7.3 kg/m2 2 mm Roberts® Soft Stride Closed Cell Foam 2 2.5 0.1 kg/m2 38 mm Precast Concrete Slab 38 2023 103.0 kg/m2 10 mm Tar Board (Building Products) 10 56 2.8 kg/m2 175 mm CLT 5-ply 175 1760 91.0 kg/m2 Total 235 3988 204 kg/m2
Test Specimen Installation
• The exposed area of the floor specimen used for the calculations of the airborne sound transmission loss was 17.85 m2 (4.71 m x 3.79 m).
• The total area of the floor assembly resting on top of the lip was 19.32 m2 (4.88 m x 3.96 m). • The mass per area of the elements above the lip was calculated using the total area (19.32 m2).

Client Report A1-006070.10 | Construction | Acoustics Laboratory
Page 67 of 168
This page was
intentionally
left blank

Client Report A1-006070.10 | Construction | Acoustics Laboratory
Page 68 of 168
ASTM E90 Test Results – Airborne Sound Transmission Loss
Client: Nordic Engineered Wood Test ID: TLF-15-005
Specimen ID: A1-006070-05F Date of Test: February 10, 2015
Room Volume (m³) Air Temperature (°C) Humidity (%)
Upper 175.0 21.8 to 21.9 33.3 to 33.6 Area S of test specimen: 17.85 m2
Lower 177.0 16.9 to 17.0 41.1 to 41.3 Mass per unit area: 204 kg/m2
f (Hz)
Airborne TL (dB)
50 34
63 38
80 36
100 33
125 37
160 38
200 40
250 43
315 44
400 44
500 47
630 52
800 60
1000 69
1250 75
1600 79
2000 88
2500 90 c
3150 88
4000 88
5000 87
Sound Transmission
Class (STC) 53
Sum of Deficiencies (dB)
29 Max. Deficiency (dB)
8 dB at 400 Hz
For a description of the test specimen and mounting conditions see text pages before. The results in this report apply only to the specific sample submitted for measurement. No responsibility is assumed for performance of any other specimen. Airborne sound transmission loss measurements were conducted in accordance with the requirements of ASTM E90-09, “Standard Test Method for Laboratory Measurement of Airborne Sound Transmission Loss of Building Partitions and Elements” with the exception that the temperature in the lower room was lower than 17ºC. In the graph: The solid line is the measured sound transmission loss for this specimen. The dashed line is the STC contour fitted to the measured values according to ASTM E413-10. The dotted line (may be above the displayed range) is 10 dB below the flanking limit established for this facility. For any frequency band where the measured transmission loss is above the dotted line, the reported value is potentially limited by flanking transmission via laboratory surfaces, and the true value may be higher than that measured. Bars at the bottom of the graph show deficiencies where the measured data are less than the reference contour as described in the fitting procedure for the STC, defined in ASTM E413-10. The shaded cells in the table and areas in the graph are outside the STC contour range. In the table: Values marked “c” indicate that the measured background level was between 5 dB and 10 dB below the combined receiving room level and background level. The reported values have been corrected according to the procedure outlined in ASTM E90-09. Values marked “*” indicate that the measured background level was less than 5 dB below the combined receiving room level and background level, in which case, the corrected values provide an estimate of the lower limit of airborne sound transmission loss.
2 3 3
5
8
6
2
10
20
30
40
50
60
70
80
90
100
63 125 250 500 1000 2000 4000
Airb
orne
Sou
nd T
rans
mis
sion
Los
s, T
L, in
dB
Frequency, f, in Hz
STC 53
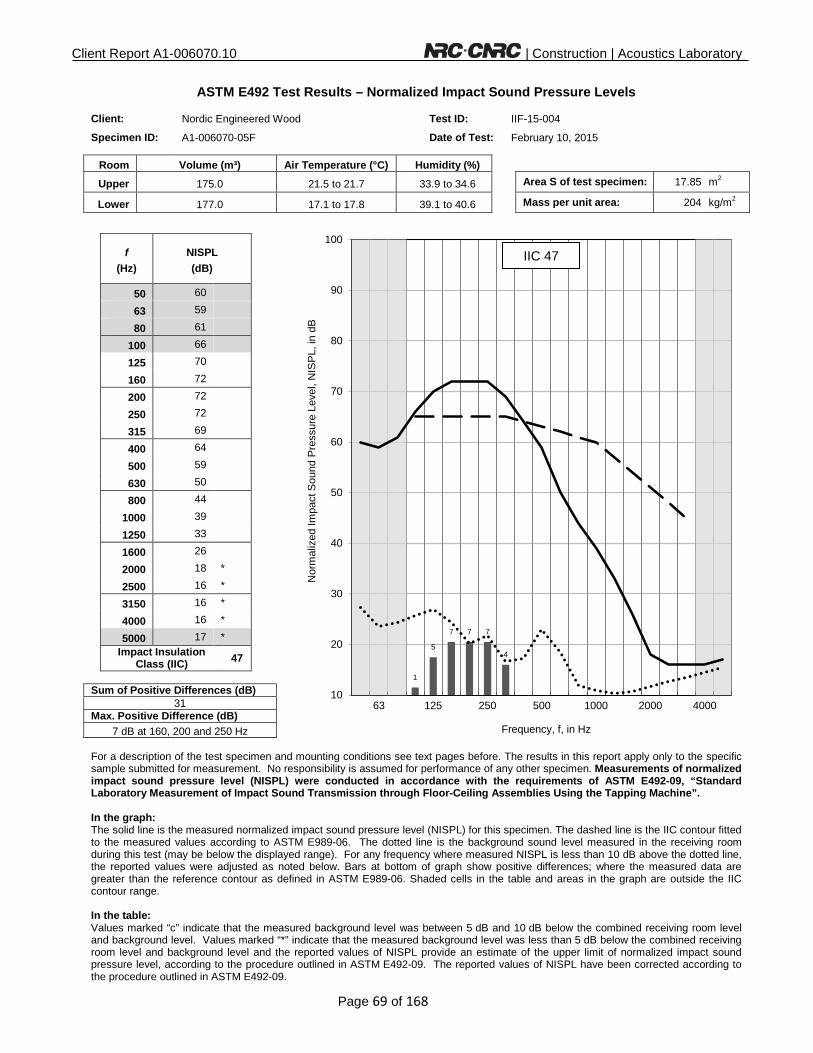
Client Report A1-006070.10 | Construction | Acoustics Laboratory
Page 69 of 168
ASTM E492 Test Results – Normalized Impact Sound Pressure Levels
Client: Nordic Engineered Wood Test ID: IIF-15-004
Specimen ID: A1-006070-05F Date of Test: February 10, 2015
Room Volume (m³) Air Temperature (°C) Humidity (%)
Upper 175.0 21.5 to 21.7 33.9 to 34.6 Area S of test specimen: 17.85 m2
Lower 177.0 17.1 to 17.8 39.1 to 40.6 Mass per unit area: 204 kg/m2
f (Hz)
NISPL (dB)
50 60
63 59
80 61
100 66
125 70
160 72
200 72
250 72
315 69
400 64
500 59
630 50
800 44
1000 39
1250 33
1600 26
2000 18 *
2500 16 *
3150 16 *
4000 16 *
5000 17 *
Impact Insulation
Class (IIC)
47
Sum of Positive Differences (dB)
31 Max. Positive Difference (dB)
7 dB at 160, 200 and 250 Hz
For a description of the test specimen and mounting conditions see text pages before. The results in this report apply only to the specific sample submitted for measurement. No responsibility is assumed for performance of any other specimen. Measurements of normalized impact sound pressure level (NISPL) were conducted in accordance with the requirements of ASTM E492-09, “Standard Laboratory Measurement of Impact Sound Transmission through Floor-Ceiling Assemblies Using the Tapping Machine”. In the graph: The solid line is the measured normalized impact sound pressure level (NISPL) for this specimen. The dashed line is the IIC contour fitted to the measured values according to ASTM E989-06. The dotted line is the background sound level measured in the receiving room during this test (may be below the displayed range). For any frequency where measured NISPL is less than 10 dB above the dotted line, the reported values were adjusted as noted below. Bars at bottom of graph show positive differences; where the measured data are greater than the reference contour as defined in ASTM E989-06. Shaded cells in the table and areas in the graph are outside the IIC contour range. In the table: Values marked “c” indicate that the measured background level was between 5 dB and 10 dB below the combined receiving room level and background level. Values marked “*” indicate that the measured background level was less than 5 dB below the combined receiving room level and background level and the reported values of NISPL provide an estimate of the upper limit of normalized impact sound pressure level, according to the procedure outlined in ASTM E492-09. The reported values of NISPL have been corrected according to the procedure outlined in ASTM E492-09.
1
5
7 7 7
4
10
20
30
40
50
60
70
80
90
100
63 125 250 500 1000 2000 4000
Nor
mal
ized
Impa
ct S
ound
Pre
ssur
e Le
vel,
NIS
PL,
in d
B
Frequency, f, in Hz
IIC 47

Client Report A1-006070.10 | Construction | Acoustics Laboratory
Page 70 of 168
Client Nordic Engineered Wood
1100 Ave des Canadiens-de-Montreal Montreal QC H3B 2S2
Specimen 38 mm (1-1/2”) precast concrete slab on 9 mm closed cell foam placed on top of a CLT 5 ply (175 mm).
Specimen ID A1-006070-06F
Construction Date: February 11, 2015
Specimen Description The specimen was composed of two cross-laminated timber (CLT) 5 ply (175 mm thick x 1989 mm wide x 4872 mm long) panels with a butt joint in the middle of the floor. The combined panels filled the entire floor opening of the test frame. The two CLT panels were joined using a 120 mm wide x 12 mm thick plywood strip spanning the full joint (4.9 m). The plywood strip was nailed with common nails 75 mm (3”) long spaced 305 mm (12”) on centre along the joint with beads of PL premium adhesive between the plywood strip and the CLT panels. The CLT floor was resting on the lip of the test frame and was not fastened to the test frame. The air gaps between the edges of the CLT floor and the test frame were filled with glass fiber insulation and covered with cloth tape. Duct putty was installed around the lower perimeter of the test frame and the CLT. A 38 mm (1-1/2”) precast concrete slab was placed on 9 mm Owens Corning QuietZone® closed cell foam which was placed on the CLT floor.
Cross-section of A1-006070-06F
Specimen Properties
Element Actual
thickness (mm)
Mass (kg) Mass/length, area or volume
38 mm Precast Concrete Slab 38 2023 103.0 kg/m2 9 mm Owens Corning QuietZone® Closed Cell
Foam 9 7.5 0.4 kg/m2
175 mm CLT 5-ply 175 1760 91.0 kg/m2 Total 222 3791 194 kg/m2
Test Specimen Installation
• The exposed area of the floor specimen used for the calculations of the airborne sound transmission loss was 17.85 m2 (4.71 m x 3.79 m).
• The total area of the floor assembly resting on top of the lip was 19.32 m2 (4.88 m x 3.96 m). • The mass per area of the elements above the lip was calculated using the total area (19.32 m2).

Client Report A1-006070.10 | Construction | Acoustics Laboratory
Page 71 of 168
This page was
intentionally
left blank

Client Report A1-006070.10 | Construction | Acoustics Laboratory
Page 72 of 168
ASTM E90 Test Results – Airborne Sound Transmission Loss
Client: Nordic Engineered Wood Test ID: TLF-15-006
Specimen ID: A1-006070-06F Date of Test: February 12, 2015
Room Volume (m³) Air Temperature (°C) Humidity (%)
Upper 175.3 23.9 to 24.1 36.6 to 37.3 Area S of test specimen: 17.85 m2
Lower 177.0 18.2 to 18.3 42.6 to 42.7 Mass per unit area: 194 kg/m2
f (Hz)
Airborne TL (dB)
50 33
63 36
80 36
100 36
125 38
160 37
200 38
250 41
315 46
400 49
500 50
630 54
800 58
1000 63
1250 67
1600 71
2000 76
2500 80
3150 79
4000 79
5000 81
Sound Transmission
Class (STC) 54
Sum of Deficiencies (dB)
29 Max. Deficiency (dB)
6 dB at 200 Hz and 250 Hz
For a description of the test specimen and mounting conditions see text pages before. The results in this report apply only to the specific sample submitted for measurement. No responsibility is assumed for performance of any other specimen. Airborne sound transmission loss measurements were conducted in accordance with the requirements of ASTM E90-09, “Standard Test Method for Laboratory Measurement of Airborne Sound Transmission Loss of Building Partitions and Elements”. In the graph: The solid line is the measured sound transmission loss for this specimen. The dashed line is the STC contour fitted to the measured values according to ASTM E413-10. The dotted line (may be above the displayed range) is 10 dB below the flanking limit established for this facility. For any frequency band where the measured transmission loss is above the dotted line, the reported value is potentially limited by flanking transmission via laboratory surfaces, and the true value may be higher than that measured. Bars at the bottom of the graph show deficiencies where the measured data are less than the reference contour as described in the fitting procedure for the STC, defined in ASTM E413-10. The shaded cells in the table and areas in the graph are outside the STC contour range. In the table: Values marked “c” indicate that the measured background level was between 5 dB and 10 dB below the combined receiving room level and background level. The reported values have been corrected according to the procedure outlined in ASTM E90-09. Values marked “*” indicate that the measured background level was less than 5 dB below the combined receiving room level and background level, in which case, the corrected values provide an estimate of the lower limit of airborne sound transmission loss.
4
6 6
4 4 4
1
10
20
30
40
50
60
70
80
90
100
63 125 250 500 1000 2000 4000
Airb
orne
Sou
nd T
rans
mis
sion
Los
s, T
L, in
dB
Frequency, f, in Hz
STC 54
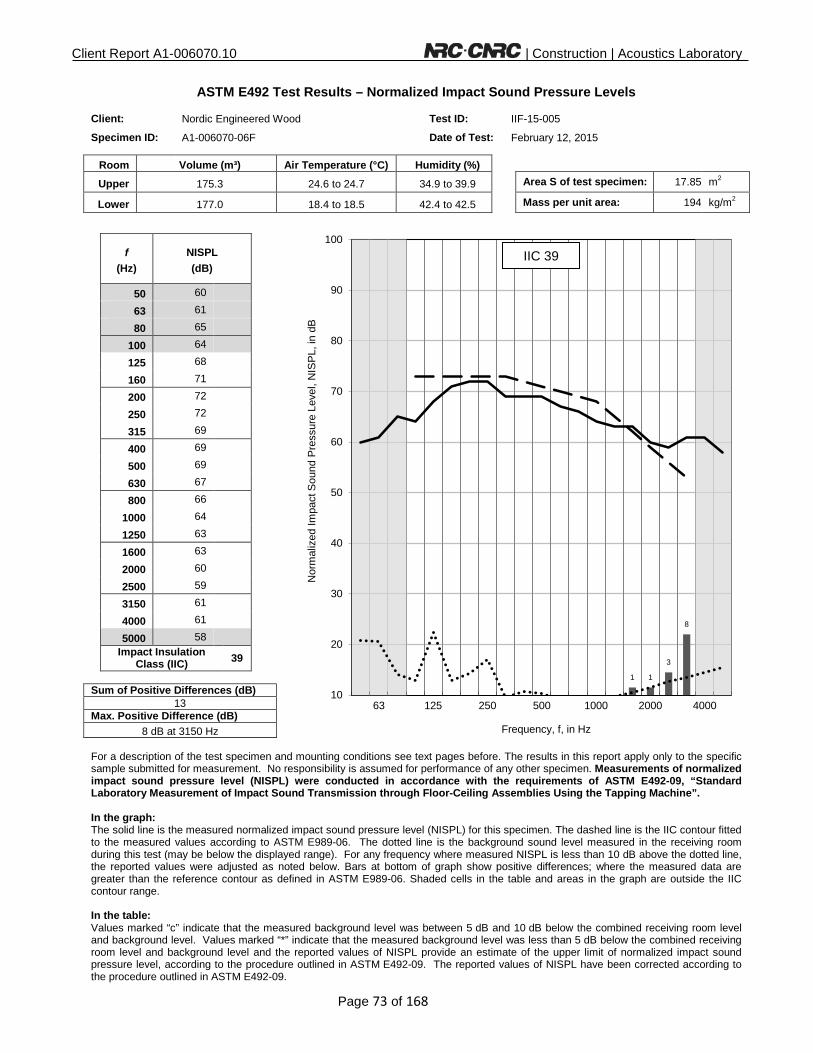
Client Report A1-006070.10 | Construction | Acoustics Laboratory
Page 73 of 168
ASTM E492 Test Results – Normalized Impact Sound Pressure Levels
Client: Nordic Engineered Wood Test ID: IIF-15-005
Specimen ID: A1-006070-06F Date of Test: February 12, 2015
Room Volume (m³) Air Temperature (°C) Humidity (%)
Upper 175.3 24.6 to 24.7 34.9 to 39.9 Area S of test specimen: 17.85 m2
Lower 177.0 18.4 to 18.5 42.4 to 42.5 Mass per unit area: 194 kg/m2
f (Hz)
NISPL (dB)
50 60
63 61
80 65
100 64
125 68
160 71
200 72
250 72
315 69
400 69
500 69
630 67
800 66
1000 64
1250 63
1600 63
2000 60
2500 59
3150 61
4000 61
5000 58
Impact Insulation
Class (IIC)
39
Sum of Positive Differences (dB)
13 Max. Positive Difference (dB)
8 dB at 3150 Hz
For a description of the test specimen and mounting conditions see text pages before. The results in this report apply only to the specific sample submitted for measurement. No responsibility is assumed for performance of any other specimen. Measurements of normalized impact sound pressure level (NISPL) were conducted in accordance with the requirements of ASTM E492-09, “Standard Laboratory Measurement of Impact Sound Transmission through Floor-Ceiling Assemblies Using the Tapping Machine”. In the graph: The solid line is the measured normalized impact sound pressure level (NISPL) for this specimen. The dashed line is the IIC contour fitted to the measured values according to ASTM E989-06. The dotted line is the background sound level measured in the receiving room during this test (may be below the displayed range). For any frequency where measured NISPL is less than 10 dB above the dotted line, the reported values were adjusted as noted below. Bars at bottom of graph show positive differences; where the measured data are greater than the reference contour as defined in ASTM E989-06. Shaded cells in the table and areas in the graph are outside the IIC contour range. In the table: Values marked “c” indicate that the measured background level was between 5 dB and 10 dB below the combined receiving room level and background level. Values marked “*” indicate that the measured background level was less than 5 dB below the combined receiving room level and background level and the reported values of NISPL provide an estimate of the upper limit of normalized impact sound pressure level, according to the procedure outlined in ASTM E492-09. The reported values of NISPL have been corrected according to the procedure outlined in ASTM E492-09.
1 1
3
8
10
20
30
40
50
60
70
80
90
100
63 125 250 500 1000 2000 4000
Nor
mal
ized
Impa
ct S
ound
Pre
ssur
e Le
vel,
NIS
PL,
in d
B
Frequency, f, in Hz
IIC 39

Client Report A1-006070.10 | Construction | Acoustics Laboratory
Page 74 of 168
Client Nordic Engineered Wood
1100 Ave des Canadiens-de-Montreal Montreal QC H3B 2S2
Specimen 10 mm floating engineered wood floor placed on a 2 mm closed cell foam on 38 mm (1-1/2”) precast concrete slab on 9 mm closed cell foam placed on top of a CLT 5 ply (175 mm).
Specimen ID A1-006070-07F
Construction Date: February 13, 2015
Specimen Description The specimen was composed of two cross-laminated timber (CLT) 5 ply (175 mm thick x 1989 mm wide x 4872 mm long) panels with a butt joint in the middle of the floor. The combined panels filled the entire floor opening of the test frame. The two CLT panels were joined using a 120 mm wide x 12 mm thick plywood strip spanning the full joint (4.9 m). The plywood strip was nailed with common nails 75 mm (3”) long spaced 305 mm (12”) on centre along the joint with beads of PL premium adhesive between the plywood strip and the CLT panels. The CLT floor was resting on the lip of the test frame and was not fastened to the test frame. The air gaps between the edges of the CLT floor and the test frame were filled with glass fiber insulation and covered with cloth tape. Duct putty was installed around the lower perimeter of the test frame and the CLT. Engineered floating floor (TORLYS Everest Premier Hardwood – 10 mm thick) with attached cork underlay was installed on top of a 2 mm Roberts® Soft Stride closed cell foam which was placed on top of a 38 mm (1-1/2”) precast concrete slab. The 38 mm precast concrete slab was placed on top of 9 mm Owens Corning QuietZone® closed cell foam which was placed on the CLT floor.
Cross-section of A1-006070-07F
Specimen Properties
Element Actual
thickness (mm)
Mass (kg) Mass/length, area or volume
10 mm TORLYS Everest Premier Hardwood 10 146 7.3 kg/m2 2 mm Roberts® Soft Stride Closed Cell Foam 2 2.5 0.1 kg/m2 38 mm Precast Concrete Slab 38 2023 103.0 kg/m2 9 mm Owens Corning QuietZone® Closed Cell
Foam 9 7.5 0.4 kg/m2
175 mm CLT 5-ply 175 1760 91.0 kg/m2 Total 234 3942 202 kg/m2
Test Specimen Installation
• The exposed area of the floor specimen used for the calculations of the airborne sound transmission loss was 17.85 m2 (4.71 m x 3.79 m).
• The total area of the floor assembly resting on top of the lip was 19.32 m2 (4.88 m x 3.96 m). • The mass per area of the elements above the lip was calculated using the total area (19.32 m2).

Client Report A1-006070.10 | Construction | Acoustics Laboratory
Page 75 of 168
This page was
intentionally
left blank

Client Report A1-006070.10 | Construction | Acoustics Laboratory
Page 76 of 168
ASTM E90 Test Results – Airborne Sound Transmission Loss
Client: Nordic Engineered Wood Test ID: TLF-15-007
Specimen ID: A1-006070-07F Date of Test: February 13, 2015
Room Volume (m³) Air Temperature (°C) Humidity (%)
Upper 175.0 22.9 to 23.5 34.8 to 35.5 Area S of test specimen: 17.85 m2
Lower 177.0 18.3 to 18.4 40.8 to 41.1 Mass per unit area: 202 kg/m2
f (Hz)
Airborne TL (dB)
50 33
63 37
80 36
100 37
125 39
160 36
200 37
250 40
315 43
400 45
500 48
630 54
800 61
1000 69
1250 74
1600 78
2000 88
2500 90 c
3150 89 c
4000 87
5000 85
Sound Transmission
Class (STC) 52
Sum of Deficiencies (dB)
28 Max. Deficiency (dB)
6 dB at 400 Hz
For a description of the test specimen and mounting conditions see text pages before. The results in this report apply only to the specific sample submitted for measurement. No responsibility is assumed for performance of any other specimen. Airborne sound transmission loss measurements were conducted in accordance with the requirements of ASTM E90-09, “Standard Test Method for Laboratory Measurement of Airborne Sound Transmission Loss of Building Partitions and Elements”. In the graph: The solid line is the measured sound transmission loss for this specimen. The dashed line is the STC contour fitted to the measured values according to ASTM E413-10. The dotted line (may be above the displayed range) is 10 dB below the flanking limit established for this facility. For any frequency band where the measured transmission loss is above the dotted line, the reported value is potentially limited by flanking transmission via laboratory surfaces, and the true value may be higher than that measured. Bars at the bottom of the graph show deficiencies where the measured data are less than the reference contour as described in the fitting procedure for the STC, defined in ASTM E413-10. The shaded cells in the table and areas in the graph are outside the STC contour range. In the table: Values marked “c” indicate that the measured background level was between 5 dB and 10 dB below the combined receiving room level and background level. The reported values have been corrected according to the procedure outlined in ASTM E90-09. Values marked “*” indicate that the measured background level was less than 5 dB below the combined receiving room level and background level, in which case, the corrected values provide an estimate of the lower limit of airborne sound transmission loss.
3
5 5 5 6
4
10
20
30
40
50
60
70
80
90
100
63 125 250 500 1000 2000 4000
Airb
orne
Sou
nd T
rans
mis
sion
Los
s, T
L, in
dB
Frequency, f, in Hz
STC 52

Client Report A1-006070.10 | Construction | Acoustics Laboratory
Page 77 of 168
ASTM E492 Test Results – Normalized Impact Sound Pressure Levels
Client: Nordic Engineered Wood Test ID: IIF-15-006
Specimen ID: A1-006070-07F Date of Test: February 16, 2015
Room Volume (m³) Air Temperature (°C) Humidity (%)
Upper 175.0 21.2 to 21.6 30.9 to 32.0 Area S of test specimen: 17.85 m2
Lower 177.0 17.9 to 18.7 39.4 to 41.1 Mass per unit area: 202 kg/m2
f (Hz)
NISPL (dB)
50 60
63 61
80 64
100 64
125 67
160 70
200 72
250 70
315 66
400 62
500 56
630 48
800 44
1000 39
1250 33
1600 27
2000 20 *
2500 15 *
3150 15 *
4000 16 *
5000 17 *
Impact Insulation
Class (IIC)
48
Sum of Positive Differences (dB)
25 Max. Positive Difference (dB)
8 dB at 200 Hz
For a description of the test specimen and mounting conditions see text pages before. The results in this report apply only to the specific sample submitted for measurement. No responsibility is assumed for performance of any other specimen. Measurements of normalized impact sound pressure level (NISPL) were conducted in accordance with the requirements of ASTM E492-09, “Standard Laboratory Measurement of Impact Sound Transmission through Floor-Ceiling Assemblies Using the Tapping Machine”. In the graph: The solid line is the measured normalized impact sound pressure level (NISPL) for this specimen. The dashed line is the IIC contour fitted to the measured values according to ASTM E989-06. The dotted line is the background sound level measured in the receiving room during this test (may be below the displayed range). For any frequency where measured NISPL is less than 10 dB above the dotted line, the reported values were adjusted as noted below. Bars at bottom of graph show positive differences; where the measured data are greater than the reference contour as defined in ASTM E989-06. Shaded cells in the table and areas in the graph are outside the IIC contour range. In the table: Values marked “c” indicate that the measured background level was between 5 dB and 10 dB below the combined receiving room level and background level. Values marked “*” indicate that the measured background level was less than 5 dB below the combined receiving room level and background level and the reported values of NISPL provide an estimate of the upper limit of normalized impact sound pressure level, according to the procedure outlined in ASTM E492-09. The reported values of NISPL have been corrected according to the procedure outlined in ASTM E492-09.
3
6
8
6
2
10
20
30
40
50
60
70
80
90
100
63 125 250 500 1000 2000 4000
Nor
mal
ized
Impa
ct S
ound
Pre
ssur
e Le
vel,
NIS
PL,
in d
B
Frequency, f, in Hz
IIC 48

Client Report A1-006070.10 | Construction | Acoustics Laboratory
Page 78 of 168
Client Nordic Engineered Wood
1100 Ave des Canadiens-de-Montreal Montreal QC H3B 2S2
Specimen 38 mm (1-1/2”) precast concrete slab on 9 mm closed cell foam placed on top of a CLT 5 ply (175 mm) with one layer of 16 mm Type X gypsum board installed on Z channels.
Specimen ID A1-006070-08F
Construction Date: February 23, 2015 to February 24, 2015
Specimen Description The specimen was composed of two cross-laminated timber (CLT) 5 ply (175 mm thick x 1989 mm wide x 4872 mm long) panels with a butt joint in the middle of the floor. The combined panels filled the entire floor opening of the test frame. The two CLT panels were joined using a 120 mm wide x 12 mm thick plywood strip spanning the full joint (4.9 m). The plywood strip was nailed with common nails 75 mm (3”) long spaced 305 mm (12”) on centre along the joint with beads of PL premium adhesive between the plywood strip and the CLT panels. The CLT floor was resting on the lip of the test frame and was not fastened to the test frame. The air gaps between the edges of the CLT floor and the test frame were filled with glass fiber insulation and covered with cloth tape. Duct putty was installed around the lower perimeter of the test frame and the CLT. A 38 mm (1-1/2”) precast concrete slab was placed on 9 mm Owens Corning QuietZone® closed cell foam which was placed on the CLT floor. For the ceiling sub-assembly, one layer of 16 mm (5/8”) Type X gypsum board was installed on 16 mm (5/8”) furring channels. The layer of gypsum board was attached using 41 mm (1-5/8") long type S screws spaced 305 mm (12”) on centre on every furring channel. Exposed joints were caulked and taped. The furring channels were attached perpendicularly to 90 mm (3-1/2”) Z-channels (26 ga) at a spacing of 406 mm (16”) on centre with two self-tapping screws. The Z-channels were attached to the CLT wall at a spacing of 610 mm (24”) on centre with 92 mm (3-5/8”) Owens Corning EcoTouch Fiberglas® Batts in the cavity.
Cross-section of A1-006070-08F

Client Report A1-006070.10 | Construction | Acoustics Laboratory
Page 79 of 168
Specimen Properties
Element Actual
thickness (mm)
Mass (kg) Mass/length, area or volume
38 mm Precast Concrete Slab 38 2023 103.0 kg/m2 9 mm Owens Corning QuietZone® Closed Cell
Foam 9 7.5 0.4 kg/m2
175 mm CLT 5-ply 175 1760 91.0 kg/m2 90 mm Z-channels (26 ga) 90 25 0.8 kg/m 92 mm OC EcoTouch Pink Fiberglas® Batts 92* 29 1.5 kg/m2 16 mm Furring Channels 16 18 0.4 kg/m 16 mm Type X Gypsum Board 16 196 11.0 kg/m2 Total 344 4060 209 kg/m2 * The thickness of the insulation batts is not included in the total specimen thickness.
Test Specimen Installation
• The exposed area of the floor specimen used for the calculations of the airborne sound transmission loss was 17.85 m2 (4.71 m x 3.79 m).
• The total area of the floor assembly resting on top of the lip was 19.32 m2 (4.88 m x 3.96 m). • The mass per area of the elements above the lip was calculated using the total area (19.32 m2)
and the mass per area of the elements below the lip was calculated using the exposed area (17.85 m2).

Client Report A1-006070.10 | Construction | Acoustics Laboratory
Page 80 of 168
ASTM E90 Test Results – Airborne Sound Transmission Loss
Client: Nordic Engineered Wood Test ID: TLF-15-009
Specimen ID: A1-006070-08F Date of Test: February 24, 2015
Room Volume (m³) Air Temperature (°C) Humidity (%)
Upper 175.3 19.0 to 19.0 34.1 to 34.1 Area S of test specimen: 17.85 m2
Lower 174.8 15.7 to 15.8 33.9 to 34.2 Mass per unit area: 209 kg/m2
f (Hz)
Airborne TL (dB)
50 25
63 29
80 36
100 41
125 46
160 50
200 53
250 59
315 65
400 71
500 75 c
630 80 c
800 81
1000 85
1250 86
1600 87
2000 89 c
2500 90 c
3150 94 c
4000 96 *
5000 97 *
Sound Transmission
Class (STC) 70
Sum of Deficiencies (dB)
27 Max. Deficiency (dB)
8 dB at 125 Hz
For a description of the test specimen and mounting conditions see text pages before. The results in this report apply only to the specific sample submitted for measurement. No responsibility is assumed for performance of any other specimen. Airborne sound transmission loss measurements were conducted in accordance with the requirements of ASTM E90-09, “Standard Test Method for Laboratory Measurement of Airborne Sound Transmission Loss of Building Partitions and Elements” with the exception that the temperature in the lower room was lower than 17ºC. In the graph: The solid line is the measured sound transmission loss for this specimen. The dashed line is the STC contour fitted to the measured values according to ASTM E413-10. The dotted line (may be above the displayed range) is 10 dB below the flanking limit established for this facility. For any frequency band where the measured transmission loss is above the dotted line, the reported value is potentially limited by flanking transmission via laboratory surfaces, and the true value may be higher than that measured. Bars at the bottom of the graph show deficiencies where the measured data are less than the reference contour as described in the fitting procedure for the STC, defined in ASTM E413-10. The shaded cells in the table and areas in the graph are outside the STC contour range. In the table: Values marked “c” indicate that the measured background level was between 5 dB and 10 dB below the combined receiving room level and background level. The reported values have been corrected according to the procedure outlined in ASTM E90-09. Values marked “*” indicate that the measured background level was less than 5 dB below the combined receiving room level and background level, in which case, the corrected values provide an estimate of the lower limit of airborne sound transmission loss.
8 7 7
4
1
10
20
30
40
50
60
70
80
90
100
63 125 250 500 1000 2000 4000
Airb
orne
Sou
nd T
rans
mis
sion
Los
s, T
L, in
dB
Frequency, f, in Hz
STC 70

Client Report A1-006070.10 | Construction | Acoustics Laboratory
Page 81 of 168
ASTM E492 Test Results – Normalized Impact Sound Pressure Levels
Client: Nordic Engineered Wood Test ID: IIF-15-007
Specimen ID: A1-006070-08F Date of Test: February 24, 2015
Room Volume (m³) Air Temperature (°C) Humidity (%)
Upper 175.3 19.0 to 19.2 33.8 to 35.0 Area S of test specimen: 17.85 m2
Lower 174.8 15.9 to 16.4 33.9 to 33.9 Mass per unit area: 209 kg/m2
f (Hz)
NISPL (dB)
50 75
63 69
80 65
100 61
125 59
160 56
200 54
250 52
315 47
400 45
500 43
630 39
800 39
1000 37
1250 36
1600 41
2000 45
2500 47
3150 43
4000 40
5000 34
Impact Insulation
Class (IIC)
56
Sum of Positive Differences (dB)
26 Max. Positive Difference (dB)
8 dB at 2500 Hz
For a description of the test specimen and mounting conditions see text pages before. The results in this report apply only to the specific sample submitted for measurement. No responsibility is assumed for performance of any other specimen. Measurements of normalized impact sound pressure level (NISPL) were conducted in accordance with the requirements of ASTM E492-09, “Standard Laboratory Measurement of Impact Sound Transmission through Floor-Ceiling Assemblies Using the Tapping Machine” with the exception that the temperature in the lower room was lower than 17ºC. In the graph: The solid line is the measured normalized impact sound pressure level (NISPL) for this specimen. The dashed line is the IIC contour fitted to the measured values according to ASTM E989-06. The dotted line is the background sound level measured in the receiving room during this test (may be below the displayed range). For any frequency where measured NISPL is less than 10 dB above the dotted line, the reported values were adjusted as noted below. Bars at bottom of graph show positive differences; where the measured data are greater than the reference contour as defined in ASTM E989-06. Shaded cells in the table and areas in the graph are outside the IIC contour range. In the table: Values marked “c” indicate that the measured background level was between 5 dB and 10 dB below the combined receiving room level and background level. Values marked “*” indicate that the measured background level was less than 5 dB below the combined receiving room level and background level and the reported values of NISPL provide an estimate of the upper limit of normalized impact sound pressure level, according to the procedure outlined in ASTM E492-09. The reported values of NISPL have been corrected according to the procedure outlined in ASTM E492-09.
5
3 3
8 7
10
20
30
40
50
60
70
80
90
100
63 125 250 500 1000 2000 4000
Nor
mal
ized
Impa
ct S
ound
Pre
ssur
e Le
vel,
NIS
PL
in d
B
Frequency, f, in Hz
IIC 56

Client Report A1-006070.10 | Construction | Acoustics Laboratory
Page 82 of 168
Client Nordic Engineered Wood
1100 Ave des Canadiens-de-Montreal Montreal QC H3B 2S2
Specimen CLT 5 ply (175 mm) with one layer of 16 mm Type X gypsum board installed on Z channels
Specimen ID A1-006070-09F
Construction Date: February 25, 2015
Specimen Description The specimen was composed of two cross-laminated timber (CLT) 5 ply (175 mm thick x 1989 mm wide x 4872 mm long) panels with a butt joint in the middle of the floor. The combined panels filled the entire floor opening of the test frame. The two CLT panels were joined using a 120 mm wide x 12 mm thick plywood strip spanning the full joint (4.9 m). The plywood strip was nailed with common nails 75 mm (3”) long spaced 305 mm (12”) on centre along the joint with beads of PL premium adhesive between the plywood strip and the CLT panels. The CLT floor was resting on the lip of the test frame and was not fastened to the test frame. The air gaps between the edges of the CLT floor and the test frame were filled with glass fiber insulation and covered with cloth tape. Duct putty was installed around the lower perimeter of the test frame and the CLT. For the ceiling sub-assembly, one layer of 16 mm (5/8”) Type X gypsum board was installed on 16 mm (5/8”) furring channels. The layer of gypsum board was attached using 41 mm (1-5/8") long type S screws spaced 305 mm (12”) on centre on every furring channel. Exposed joints were caulked and taped. The furring channels were attached perpendicularly to 90 mm (3-1/2”) Z-channels (26 ga) at a spacing of 406 mm (16”) on centre with two self-tapping screws. The Z-channels were attached to the CLT wall at a spacing of 610 mm (24”) on centre with 92 mm (3-5/8”) Owens Corning EcoTouch Fiberglas® Batts in the cavity.
Cross-section of A1-006070-09F
Specimen Properties
Element Actual
thickness (mm)
Mass (kg) Mass/length, area or volume
175 mm CLT 5-ply 175 1760 91.0 kg/m2 90 mm Z-channels (26 ga) 90 25 0.8 kg/m 92 mm OC EcoTouch Pink Fiberglas® Batts 92* 29 1.5 kg/m2 16 mm Furring Channels 16 18 0.4 kg/m 16 mm Type X Gypsum Board 16 196 11.0 kg/m2 Total 297 2028 106 kg/m2 * The thickness of the insulation batts is not included in the total specimen thickness.

Client Report A1-006070.10 | Construction | Acoustics Laboratory
Page 83 of 168
Test Specimen Installation
• The exposed area of the floor specimen used for the calculations of the airborne sound transmission loss was 17.85 m2 (4.71 m x 3.79 m).
• The total area of the floor assembly resting on top of the lip was 19.32 m2 (4.88 m x 3.96 m). • The mass per area of the elements above the lip was calculated using the total area (19.32 m2)
and the mass per area of the elements below the lip was calculated using the exposed area (17.85 m2).

Client Report A1-006070.10 | Construction | Acoustics Laboratory
Page 84 of 168
ASTM E90 Test Results – Airborne Sound Transmission Loss
Client: Nordic Engineered Wood Test ID: TLF-15-010
Specimen ID: A1-006070-09F Date of Test: February 25, 2015
Room Volume (m³) Air Temperature (°C) Humidity (%)
Upper 176.2 19.9 to 20.0 34.5 to 34.7 Area S of test specimen: 17.85 m2
Lower 174.8 15.7 to 15.8 38.7 to 39.2 Mass per unit area: 106 kg/m2
f (Hz)
Airborne TL (dB)
50 21
63 21
80 28
100 33
125 40
160 42
200 45
250 51
315 54
400 60
500 65
630 69
800 70
1000 73
1250 75
1600 74
2000 68
2500 65
3150 65
4000 68
5000 75
Sound Transmission
Class (STC) 62
Sum of Deficiencies (dB)
31 Max. Deficiency (dB)
7 dB at 160 and 200 Hz
For a description of the test specimen and mounting conditions see text pages before. The results in this report apply only to the specific sample submitted for measurement. No responsibility is assumed for performance of any other specimen. Airborne sound transmission loss measurements were conducted in accordance with the requirements of ASTM E90-09, “Standard Test Method for Laboratory Measurement of Airborne Sound Transmission Loss of Building Partitions and Elements” with the exception that the temperature in the lower room was lower than 17ºC. In the graph: The solid line is the measured sound transmission loss for this specimen. The dashed line is the STC contour fitted to the measured values according to ASTM E413-10. The dotted line (may be above the displayed range) is 10 dB below the flanking limit established for this facility. For any frequency band where the measured transmission loss is above the dotted line, the reported value is potentially limited by flanking transmission via laboratory surfaces, and the true value may be higher than that measured. Bars at the bottom of the graph show deficiencies where the measured data are less than the reference contour as described in the fitting procedure for the STC, defined in ASTM E413-10. The shaded cells in the table and areas in the graph are outside the STC contour range. In the table: Values marked “c” indicate that the measured background level was between 5 dB and 10 dB below the combined receiving room level and background level. The reported values have been corrected according to the procedure outlined in ASTM E90-09. Values marked “*” indicate that the measured background level was less than 5 dB below the combined receiving room level and background level, in which case, the corrected values provide an estimate of the lower limit of airborne sound transmission loss.
6 7 7
4 4
1 1 1
10
20
30
40
50
60
70
80
90
100
63 125 250 500 1000 2000 4000
Airb
orne
Sou
nd T
rans
mis
sion
Los
s, T
L, in
dB
Frequency, f, in Hz
STC 62

Client Report A1-006070.10 | Construction | Acoustics Laboratory
Page 85 of 168
ASTM E492 Test Results – Normalized Impact Sound Pressure Levels
Client: Nordic Engineered Wood Test ID: IIF-15-008
Specimen ID: A1-006070-09F Date of Test: February 25, 2015
Room Volume (m³) Air Temperature (°C) Humidity (%)
Upper 176.2 20.4 to 20.6 32.9 to 34.4 Area S of test specimen: 17.85 m2
Lower 174.8 16.2 to 17.7 39.0 to 40.0 Mass per unit area: 106 kg/m2
f (Hz)
NISPL (dB)
50 82
63 78
80 70
100 68
125 67
160 67
200 65
250 63
315 60
400 57
500 55
630 55
800 55
1000 53
1250 52
1600 54
2000 57
2500 54
3150 46
4000 43
5000 31 c
Impact Insulation
Class (IIC)
48
Sum of Positive Differences (dB)
28 Max. Positive Difference (dB)
7 dB at 2000 and 2500 Hz
For a description of the test specimen and mounting conditions see text pages before. The results in this report apply only to the specific sample submitted for measurement. No responsibility is assumed for performance of any other specimen. Measurements of normalized impact sound pressure level (NISPL) were conducted in accordance with the requirements of ASTM E492-09, “Standard Laboratory Measurement of Impact Sound Transmission through Floor-Ceiling Assemblies Using the Tapping Machine” with the exception that the temperature in the lower room was lower than 17ºC. In the graph: The solid line is the measured normalized impact sound pressure level (NISPL) for this specimen. The dashed line is the IIC contour fitted to the measured values according to ASTM E989-06. The dotted line is the background sound level measured in the receiving room during this test (may be below the displayed range). For any frequency where measured NISPL is less than 10 dB above the dotted line, the reported values were adjusted as noted below. Bars at bottom of graph show positive differences; where the measured data are greater than the reference contour as defined in ASTM E989-06. Shaded cells in the table and areas in the graph are outside the IIC contour range. In the table: Values marked “c” indicate that the measured background level was between 5 dB and 10 dB below the combined receiving room level and background level. Values marked “*” indicate that the measured background level was less than 5 dB below the combined receiving room level and background level and the reported values of NISPL provide an estimate of the upper limit of normalized impact sound pressure level, according to the procedure outlined in ASTM E492-09. The reported values of NISPL have been corrected according to the procedure outlined in ASTM E492-09.
4 3 3
1 1
7 7
2
10
20
30
40
50
60
70
80
90
100
63 125 250 500 1000 2000 4000
Nor
mal
ized
Impa
ct S
ound
Pre
ssur
e Le
vel,
NIS
PL
in d
B
Frequency, f, in Hz
IIC 48

Client Report A1-006070.10 | Construction | Acoustics Laboratory
Page 86 of 168
Client Nordic Engineered Wood
1100 Ave des Canadiens-de-Montreal Montreal QC H3B 2S2
Specimen 38 mm (1-1/2”) precast concrete slab on 10 mm tar boards placed on top of a CLT 5 ply (175 mm) with one layer of 16 mm Type X gypsum board installed on Z channels.
Specimen ID A1-006070-10F
Construction Date: February 25, 2015
Specimen Description The specimen was composed of two cross-laminated timber (CLT) 5 ply (175 mm thick x 1989 mm wide x 4872 mm long) panels with a butt joint in the middle of the floor. The combined panels filled the entire floor opening of the test frame. The two CLT panels were joined using a 120 mm wide x 12 mm thick plywood strip spanning the full joint (4.9 m). The plywood strip was nailed with common nails 75 mm (3”) long spaced 305 mm (12”) on centre along the joint with beads of PL premium adhesive between the plywood strip and the CLT panels. The CLT floor was resting on the lip of the test frame and was not fastened to the test frame. The air gaps between the edges of the CLT floor and the test frame were filled with glass fiber insulation and covered with cloth tape. Duct putty was installed around the lower perimeter of the test frame and the CLT. A 38 mm (1-1/2”) precast concrete slab was placed on 10 mm tar boards which was placed on the CLT floor. For the ceiling sub-assembly, one layer of 16 mm (5/8”) Type X gypsum board was installed on 16 mm (5/8”) furring channels. The layer of gypsum board was attached using 41 mm (1-5/8") long type S screws spaced 305 mm (12”) on centre on every furring channel. Exposed joints were caulked and taped. The furring channels were attached perpendicularly to 90 mm (3-1/2”) Z-channels (26 ga) at a spacing of 406 mm (16”) on centre with two self-tapping screws. The Z-channels were attached to the CLT wall at a spacing of 610 mm (24”) on centre with 92 mm (3-5/8”) Owens Corning EcoTouch Fiberglas® Batts in the cavity.
Cross-section of A1-006070-10F

Client Report A1-006070.10 | Construction | Acoustics Laboratory
Page 87 of 168
Specimen Properties
Element Actual
thickness (mm)
Mass (kg) Mass/length, area or volume
38 mm Precast Concrete Slab 38 2023 103.0 kg/m2 10 mm Tar Board (Building Products) 10 56 2.8 kg/m2 175 mm CLT 5-ply 175 1760 91.0 kg/m2 90 mm Z-channels (26 ga) 90 25 0.8 kg/m 92 mm OC EcoTouch Pink Fiberglas® Batts 92* 29 1.5 kg/m2 16 mm Furring Channels 16 18 0.4 kg/m 16 mm Type X Gypsum Board 16 196 11.0 kg/m2 Total 345 4107 213 kg/m2 * The thickness of the insulation batts is not included in the total specimen thickness.
Test Specimen Installation
• The exposed area of the floor specimen used for the calculations of the airborne sound transmission loss was 17.85 m2 (4.71 m x 3.79 m).
• The total area of the floor assembly resting on top of the lip was 19.32 m2 (4.88 m x 3.96 m). • The mass per area of the elements above the lip was calculated using the total area (19.32 m2)
and the mass per area of the elements below the lip was calculated using the exposed area (17.85 m2).

Client Report A1-006070.10 | Construction | Acoustics Laboratory
Page 88 of 168
ASTM E90 Test Results – Airborne Sound Transmission Loss
Client: Nordic Engineered Wood Test ID: TLF-15-013
Specimen ID: A1-006070-10F Date of Test: February 26, 2015
Room Volume (m³) Air Temperature (°C) Humidity (%)
Upper 175.3 22.4 to 23.4 35.3 to 36.5 Area S of test specimen: 17.85 m2
Lower 174.8 17.0 to 18.2 34.0 to 36.7 Mass per unit area: 213 kg/m2
f (Hz)
Airborne TL (dB)
50 25
63 28
80 36
100 39
125 45
160 49
200 52
250 59
315 64
400 70
500 72
630 77
800 79
1000 84
1250 85
1600 87
2000 87
2500 86
3150 91
4000 94
5000 96
Sound Transmission
Class (STC) 69
Sum of Deficiencies (dB)
26 Max. Deficiency (dB)
8 dB at 125 Hz
For a description of the test specimen and mounting conditions see text pages before. The results in this report apply only to the specific sample submitted for measurement. No responsibility is assumed for performance of any other specimen. Airborne sound transmission loss measurements were conducted in accordance with the requirements of ASTM E90-09, “Standard Test Method for Laboratory Measurement of Airborne Sound Transmission Loss of Building Partitions and Elements”. In the graph: The solid line is the measured sound transmission loss for this specimen. The dashed line is the STC contour fitted to the measured values according to ASTM E413-10. The dotted line (may be above the displayed range) is 10 dB below the flanking limit established for this facility. For any frequency band where the measured transmission loss is above the dotted line, the reported value is potentially limited by flanking transmission via laboratory surfaces, and the true value may be higher than that measured. Bars at the bottom of the graph show deficiencies where the measured data are less than the reference contour as described in the fitting procedure for the STC, defined in ASTM E413-10. The shaded cells in the table and areas in the graph are outside the STC contour range. In the table: Values marked “c” indicate that the measured background level was between 5 dB and 10 dB below the combined receiving room level and background level. The reported values have been corrected according to the procedure outlined in ASTM E90-09. Values marked “*” indicate that the measured background level was less than 5 dB below the combined receiving room level and background level, in which case, the corrected values provide an estimate of the lower limit of airborne sound transmission loss.
8 7 7
3
1
10
20
30
40
50
60
70
80
90
100
63 125 250 500 1000 2000 4000
Airb
orne
Sou
nd T
rans
mis
sion
Los
s, T
L, in
dB
Frequency, f, in Hz
STC 69

Client Report A1-006070.10 | Construction | Acoustics Laboratory
Page 89 of 168
ASTM E492 Test Results – Normalized Impact Sound Pressure Levels
Client: Nordic Engineered Wood Test ID: IIF-15-009
Specimen ID: A1-006070-10F Date of Test: February 25, 2015
Room Volume (m³) Air Temperature (°C) Humidity (%)
Upper 175.3 21.2 to 21.3 29.2 to 29.7 Area S of test specimen: 17.85 m2
Lower 174.8 16.6 to 16.7 37.1 to 37.2 Mass per unit area: 213 kg/m2
f (Hz)
NISPL (dB)
50 74
63 69
80 62
100 61
125 61
160 58
200 56
250 53
315 51
400 48
500 45
630 42
800 40
1000 37
1250 37
1600 40
2000 46
2500 49
3150 46
4000 41
5000 33
Impact Insulation
Class (IIC)
54
Sum of Positive Differences (dB)
24 Max. Positive Difference (dB)
8 dB at 2500 and 3150 Hz
For a description of the test specimen and mounting conditions see text pages before. The results in this report apply only to the specific sample submitted for measurement. No responsibility is assumed for performance of any other specimen. Measurements of normalized impact sound pressure level (NISPL) were conducted in accordance with the requirements of ASTM E492-09, “Standard Laboratory Measurement of Impact Sound Transmission through Floor-Ceiling Assemblies Using the Tapping Machine” with the exception that the temperature in the lower room was lower than 17ºC. In the graph: The solid line is the measured normalized impact sound pressure level (NISPL) for this specimen. The dashed line is the IIC contour fitted to the measured values according to ASTM E989-06. The dotted line is the background sound level measured in the receiving room during this test (may be below the displayed range). For any frequency where measured NISPL is less than 10 dB above the dotted line, the reported values were adjusted as noted below. Bars at bottom of graph show positive differences; where the measured data are greater than the reference contour as defined in ASTM E989-06. Shaded cells in the table and areas in the graph are outside the IIC contour range. In the table: Values marked “c” indicate that the measured background level was between 5 dB and 10 dB below the combined receiving room level and background level. Values marked “*” indicate that the measured background level was less than 5 dB below the combined receiving room level and background level and the reported values of NISPL provide an estimate of the upper limit of normalized impact sound pressure level, according to the procedure outlined in ASTM E492-09. The reported values of NISPL have been corrected according to the procedure outlined in ASTM E492-09.
3 3 2
8 8
10
20
30
40
50
60
70
80
90
100
63 125 250 500 1000 2000 4000
Nor
mal
ized
Impa
ct S
ound
Pre
ssur
e Le
vel,
NIS
PL
in d
B
Frequency, f, in Hz
IIC 54
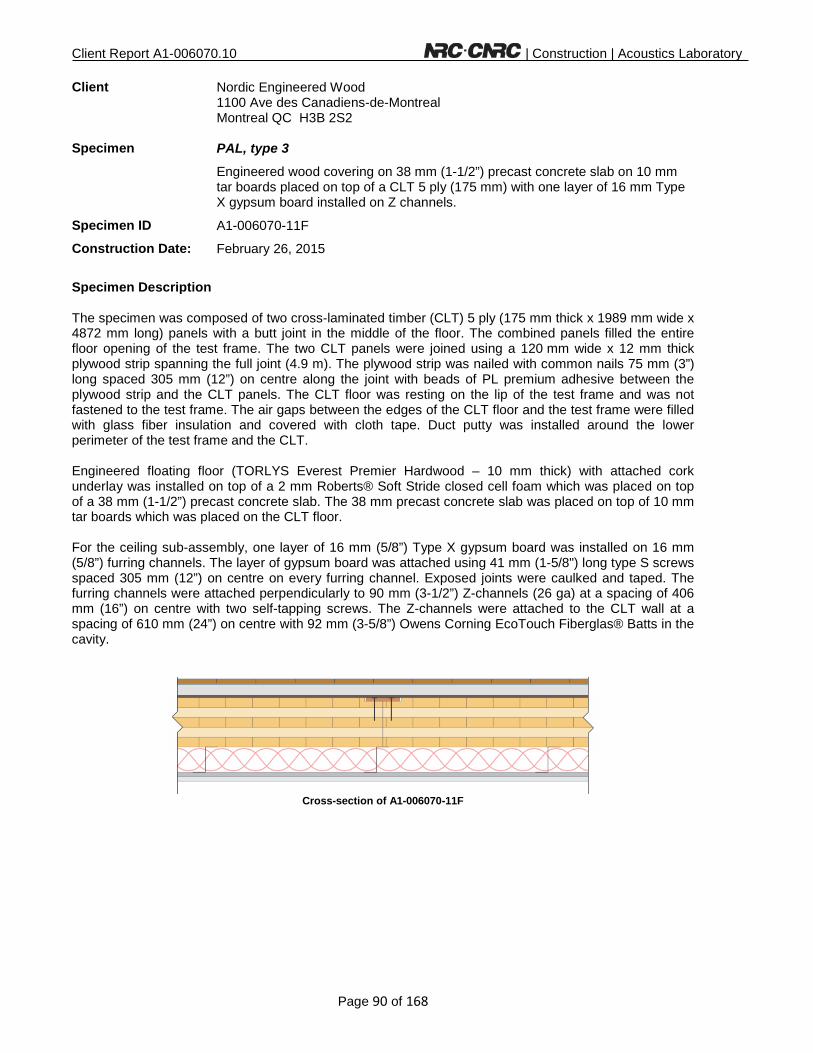
Client Report A1-006070.10 | Construction | Acoustics Laboratory
Page 90 of 168
Client Nordic Engineered Wood
1100 Ave des Canadiens-de-Montreal Montreal QC H3B 2S2
Specimen PAL, type 3
Engineered wood covering on 38 mm (1-1/2”) precast concrete slab on 10 mm tar boards placed on top of a CLT 5 ply (175 mm) with one layer of 16 mm Type X gypsum board installed on Z channels.
Specimen ID A1-006070-11F
Construction Date: February 26, 2015
Specimen Description The specimen was composed of two cross-laminated timber (CLT) 5 ply (175 mm thick x 1989 mm wide x 4872 mm long) panels with a butt joint in the middle of the floor. The combined panels filled the entire floor opening of the test frame. The two CLT panels were joined using a 120 mm wide x 12 mm thick plywood strip spanning the full joint (4.9 m). The plywood strip was nailed with common nails 75 mm (3”) long spaced 305 mm (12”) on centre along the joint with beads of PL premium adhesive between the plywood strip and the CLT panels. The CLT floor was resting on the lip of the test frame and was not fastened to the test frame. The air gaps between the edges of the CLT floor and the test frame were filled with glass fiber insulation and covered with cloth tape. Duct putty was installed around the lower perimeter of the test frame and the CLT. Engineered floating floor (TORLYS Everest Premier Hardwood – 10 mm thick) with attached cork underlay was installed on top of a 2 mm Roberts® Soft Stride closed cell foam which was placed on top of a 38 mm (1-1/2”) precast concrete slab. The 38 mm precast concrete slab was placed on top of 10 mm tar boards which was placed on the CLT floor. For the ceiling sub-assembly, one layer of 16 mm (5/8”) Type X gypsum board was installed on 16 mm (5/8”) furring channels. The layer of gypsum board was attached using 41 mm (1-5/8") long type S screws spaced 305 mm (12”) on centre on every furring channel. Exposed joints were caulked and taped. The furring channels were attached perpendicularly to 90 mm (3-1/2”) Z-channels (26 ga) at a spacing of 406 mm (16”) on centre with two self-tapping screws. The Z-channels were attached to the CLT wall at a spacing of 610 mm (24”) on centre with 92 mm (3-5/8”) Owens Corning EcoTouch Fiberglas® Batts in the cavity.
Cross-section of A1-006070-11F
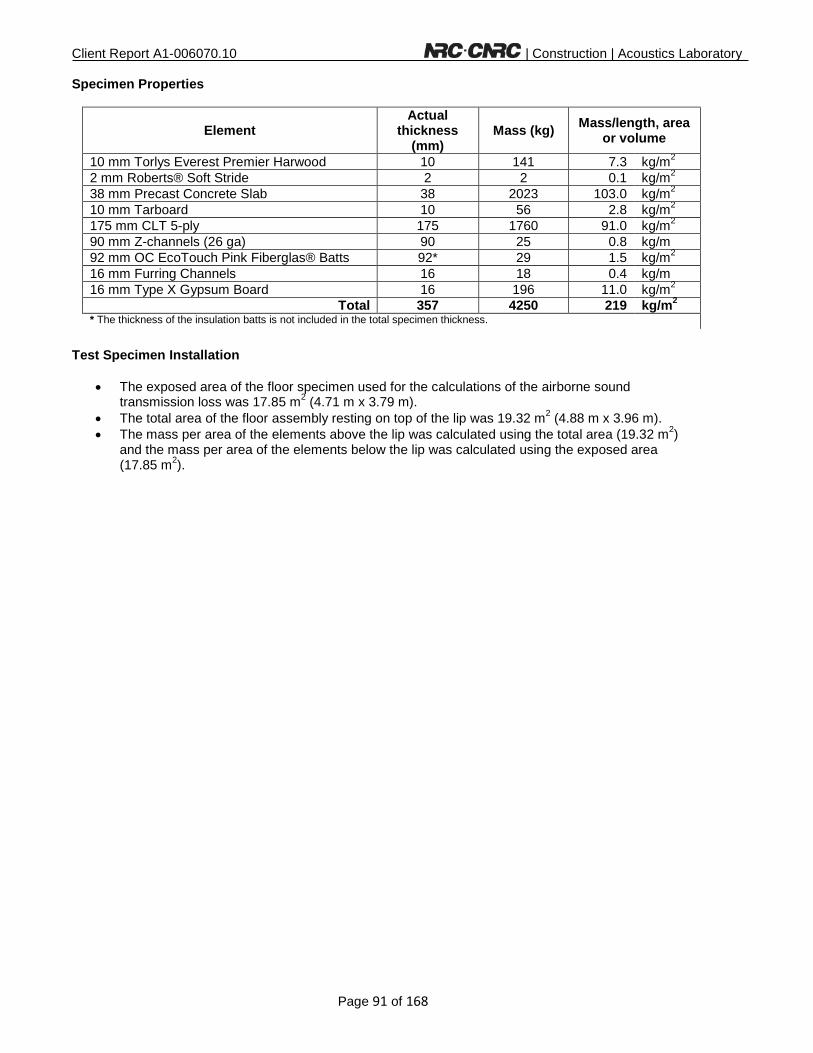
Client Report A1-006070.10 | Construction | Acoustics Laboratory
Page 91 of 168
Specimen Properties
Element Actual
thickness (mm)
Mass (kg) Mass/length, area or volume
10 mm Torlys Everest Premier Harwood 10 141 7.3 kg/m2 2 mm Roberts® Soft Stride 2 2 0.1 kg/m2 38 mm Precast Concrete Slab 38 2023 103.0 kg/m2 10 mm Tarboard 10 56 2.8 kg/m2 175 mm CLT 5-ply 175 1760 91.0 kg/m2 90 mm Z-channels (26 ga) 90 25 0.8 kg/m 92 mm OC EcoTouch Pink Fiberglas® Batts 92* 29 1.5 kg/m2 16 mm Furring Channels 16 18 0.4 kg/m 16 mm Type X Gypsum Board 16 196 11.0 kg/m2 Total 357 4250 219 kg/m2 * The thickness of the insulation batts is not included in the total specimen thickness.
Test Specimen Installation
• The exposed area of the floor specimen used for the calculations of the airborne sound transmission loss was 17.85 m2 (4.71 m x 3.79 m).
• The total area of the floor assembly resting on top of the lip was 19.32 m2 (4.88 m x 3.96 m). • The mass per area of the elements above the lip was calculated using the total area (19.32 m2)
and the mass per area of the elements below the lip was calculated using the exposed area (17.85 m2).

Client Report A1-006070.10 | Construction | Acoustics Laboratory
Page 92 of 168
ASTM E90 Test Results – Airborne Sound Transmission Loss
Client: Nordic Engineered Wood Test ID: TLF-15-012
Specimen ID: A1-006070-11F Date of Test: February 26, 2015
Room Volume (m³) Air Temperature (°C) Humidity (%)
Upper 175.0 22.8 to 22.9 34.2 to 34.6 Area S of test specimen: 17.85 m2
Lower 174.8 16.9 to 16.9 36.9 to 37.1 Mass per unit area: 219 kg/m2
f (Hz)
Airborne TL (dB)
50 25
63 29
80 37
100 39
125 45
160 50
200 53
250 60
315 64
400 68
500 71 c
630 78 c
800 81
1000 85
1250 86
1600 88
2000 93 c
2500 93 c
3150 96 *
4000 96 *
5000 97 *
Sound Transmission
Class (STC) 69
Sum of Deficiencies (dB)
23 Max. Deficiency (dB)
8 dB at 125 Hz
For a description of the test specimen and mounting conditions see text pages before. The results in this report apply only to the specific sample submitted for measurement. No responsibility is assumed for performance of any other specimen. Airborne sound transmission loss measurements were conducted in accordance with the requirements of ASTM E90-09, “Standard Test Method for Laboratory Measurement of Airborne Sound Transmission Loss of Building Partitions and Elements” with the exception that the temperature in the lower room was lower than 17ºC. In the graph: The solid line is the measured sound transmission loss for this specimen. The dashed line is the STC contour fitted to the measured values according to ASTM E413-10. The dotted line (may be above the displayed range) is 10 dB below the flanking limit established for this facility. For any frequency band where the measured transmission loss is above the dotted line, the reported value is potentially limited by flanking transmission via laboratory surfaces, and the true value may be higher than that measured. Bars at the bottom of the graph show deficiencies where the measured data are less than the reference contour as described in the fitting procedure for the STC, defined in ASTM E413-10. The shaded cells in the table and areas in the graph are outside the STC contour range. In the table: Values marked “c” indicate that the measured background level was between 5 dB and 10 dB below the combined receiving room level and background level. The reported values have been corrected according to the procedure outlined in ASTM E90-09. Values marked “*” indicate that the measured background level was less than 5 dB below the combined receiving room level and background level, in which case, the corrected values provide an estimate of the lower limit of airborne sound transmission loss.
8
6 6
2 1
10
20
30
40
50
60
70
80
90
100
63 125 250 500 1000 2000 4000
Airb
orne
Sou
nd T
rans
mis
sion
Los
s, T
L, in
dB
Frequency, f, in Hz
STC 69

Client Report A1-006070.10 | Construction | Acoustics Laboratory
Page 93 of 168
ASTM E492 Test Results – Normalized Impact Sound Pressure Levels
Client: Nordic Engineered Wood Test ID: IIF-15-010
Specimen ID: A1-006070-11F Date of Test: February 26, 2015
Room Volume (m³) Air Temperature (°C) Humidity (%)
Upper 175.0 22.5 to 22.6 34.8 to 36.7 Area S of test specimen: 17.85 m2
Lower 174.8 17.0 to 17.1 36.1 to 36.6 Mass per unit area: 219 kg/m2
f (Hz)
NISPL (dB)
50 72
63 67
80 60
100 61
125 62
160 58
200 55
250 51
315 47
400 41
500 33 c
630 22 *
800 19 c
1000 14 *
1250 11 *
1600 11 *
2000 12 *
2500 13 *
3150 14 *
4000 15 *
5000 17 *
Impact Insulation
Class (IIC)
58
Sum of Positive Differences (dB)
20 Max. Positive Difference (dB)
8 dB at 125 Hz
For a description of the test specimen and mounting conditions see text pages before. The results in this report apply only to the specific sample submitted for measurement. No responsibility is assumed for performance of any other specimen. Measurements of normalized impact sound pressure level (NISPL) were conducted in accordance with the requirements of ASTM E492-09, “Standard Laboratory Measurement of Impact Sound Transmission through Floor-Ceiling Assemblies Using the Tapping Machine”. In the graph: The solid line is the measured normalized impact sound pressure level (NISPL) for this specimen. The dashed line is the IIC contour fitted to the measured values according to ASTM E989-06. The dotted line is the background sound level measured in the receiving room during this test (may be below the displayed range). For any frequency where measured NISPL is less than 10 dB above the dotted line, the reported values were adjusted as noted below. Bars at bottom of graph show positive differences; where the measured data are greater than the reference contour as defined in ASTM E989-06. Shaded cells in the table and areas in the graph are outside the IIC contour range. In the table: Values marked “c” indicate that the measured background level was between 5 dB and 10 dB below the combined receiving room level and background level. Values marked “*” indicate that the measured background level was less than 5 dB below the combined receiving room level and background level and the reported values of NISPL provide an estimate of the upper limit of normalized impact sound pressure level, according to the procedure outlined in ASTM E492-09. The reported values of NISPL have been corrected according to the procedure outlined in ASTM E492-09.
7 8
4
1
10
20
30
40
50
60
70
80
90
100
63 125 250 500 1000 2000 4000
Nor
mal
ized
Impa
ct S
ound
Pre
ssur
e Le
vel,
NIS
PL
in d
B
Frequency, f, in Hz
IIC 58

Client Report A1-006070.10 | Construction | Acoustics Laboratory
Page 94 of 168
Client Nordic Engineered Wood
1100 Ave des Canadiens-de-Montreal Montreal QC H3B 2S2
Specimen 38 mm (1-1/2”) precast concrete slab on 9 mm closed cell foam placed on top of a CLT 5 ply (175 mm) with two layers of 13 mm Type C gypsum board installed on a hung ceiling grid.
Specimen ID A1-006070-12F
Construction Date: February 27, 2015
Specimen Description The specimen was composed of two cross-laminated timber (CLT) 5 ply (175 mm thick x 1989 mm wide x 4872 mm long) panels with a butt joint in the middle of the floor. The combined panels filled the entire floor opening of the test frame. The two CLT panels were joined using a 120 mm wide x 12 mm thick plywood strip spanning the full joint (4.9 m). The plywood strip was nailed with common nails 75 mm (3”) long spaced 305 mm (12”) on centre along the joint with beads of PL premium adhesive between the plywood strip and the CLT panels. The CLT floor was resting on the lip of the test frame and was not fastened to the test frame. The air gaps between the edges of the CLT floor and the test frame were filled with glass fiber insulation and covered with cloth tape. Duct putty was installed around the lower perimeter of the test frame and the CLT. A 38 mm (1-1/2”) precast concrete slab was placed on 9 mm Owens Corning QuietZone® closed cell foam which was placed on the CLT floor. For the hung ceiling, two layers of 13 mm (5/8”) Type C gypsum board were installed on 22 mm (7/8”) furring channels. The base layer of gypsum board was attached using 41 mm (1-5/8") long type S screws spaced 305 mm (12”) on centre on every furring channel. The face layer was staggered from the base later and attached using 50 mm (2") long type S screws spaced 305 mm (12”) on centre on every furring channel. The exposed gypsum board joints were caulked and taped. The furring channels were attached perpendicularly to the 38 mm (1-1/2”) C-channels at a spacing of 406 mm (16”) on centre with wire. The C-channels were attached to the CLT using standard ceiling wire and angles which were screwed into the CLT. The C-channels were spaced 1220 mm (4’) on centre and hung with a space of 65 mm (2-1/2”) from the top of the C-channels to the underside the CLT with 92 mm (3-5/8”) Owens Corning EcoTouch Fiberglas® Batts in the cavity. The total hung ceiling depth was 150 mm (6”).
Cross-section of A1-006070-12F

Client Report A1-006070.10 | Construction | Acoustics Laboratory
Page 95 of 168
Specimen Properties
Element Actual
thickness (mm)
Mass (kg) Mass/length, area or volume
38 mm Precast Concrete Slab 38 2023 103.0 kg/m2 9 mm Owens Corning QuietZone® Closed Cell
Foam 9 8 0.4 kg/m2
175 mm CLT 5-ply 175 1760 91.0 kg/m2 Standard Ceiling Wire + Angles 65 - - - 92 mm OC EcoTouch Pink Fiberglas® Batts 92* 29 1.5 kg/m2 38 mm (1-1/2") C-Channels 38 9 0.5 kg/m 22 mm (7/8”) Furring Channels 22 9 0.2 kg/m 13 mm (1/2”) CertainTeed Type C Gypsum
Board 13 137 7.7 kg/m2
13 mm (1/2”) CertainTeed Type C Gypsum Board 13 137 7.7 kg/m2
Total 373 4112 212 kg/m2 * The thickness of the insulation batts is not included in the total specimen thickness.
Test Specimen Installation
• The exposed area of the floor specimen used for the calculations of the airborne sound transmission loss was 17.85 m2 (4.71 m x 3.79 m).
• The total area of the floor assembly resting on top of the lip was 19.32 m2 (4.88 m x 3.96 m). • The mass per area of the elements above the lip was calculated using the total area (19.32 m2)
and the mass per area of the elements below the lip was calculated using the exposed area (17.85 m2).

Client Report A1-006070.10 | Construction | Acoustics Laboratory
Page 96 of 168
ASTM E90 Test Results – Airborne Sound Transmission Loss
Client: Nordic Engineered Wood Test ID: TLF-15-014
Specimen ID: A1-006070-12F Date of Test: March 2, 2015
Room Volume (m³) Air Temperature (°C) Humidity (%)
Upper 175.3 21.6 to 21.7 34.6 to 34.8 Area S of test specimen: 17.85 m2
Lower 174.3 19.2 to 19.4 40.3 to 40.6 Mass per unit area: 212 kg/m2
f (Hz)
Airborne TL (dB)
50 33
63 38
80 42
100 46
125 50
160 53
200 54
250 62
315 68
400 75
500 80 c
630 83 c
800 82
1000 86
1250 87 c
1600 90 c
2000 95 c
2500 95 c
3150 98 *
4000 97 *
5000 97 *
Sound Transmission
Class (STC) 72
Sum of Deficiencies (dB)
23 Max. Deficiency (dB)
8 dB at 200 Hz
For a description of the test specimen and mounting conditions see text pages before. The results in this report apply only to the specific sample submitted for measurement. No responsibility is assumed for performance of any other specimen. Airborne sound transmission loss measurements were conducted in accordance with the requirements of ASTM E90-09, “Standard Test Method for Laboratory Measurement of Airborne Sound Transmission Loss of Building Partitions and Elements”. In the graph: The solid line is the measured sound transmission loss for this specimen. The dashed line is the STC contour fitted to the measured values according to ASTM E413-10. The dotted line (may be above the displayed range) is 10 dB below the flanking limit established for this facility. For any frequency band where the measured transmission loss is above the dotted line, the reported value is potentially limited by flanking transmission via laboratory surfaces, and the true value may be higher than that measured. Bars at the bottom of the graph show deficiencies where the measured data are less than the reference contour as described in the fitting procedure for the STC, defined in ASTM E413-10. The shaded cells in the table and areas in the graph are outside the STC contour range. In the table: Values marked “c” indicate that the measured background level was between 5 dB and 10 dB below the combined receiving room level and background level. The reported values have been corrected according to the procedure outlined in ASTM E90-09. Values marked “*” indicate that the measured background level was less than 5 dB below the combined receiving room level and background level, in which case, the corrected values provide an estimate of the lower limit of airborne sound transmission loss.
6 6
8
3
10
20
30
40
50
60
70
80
90
100
63 125 250 500 1000 2000 4000
Airb
orne
Sou
nd T
rans
mis
sion
Los
s, T
L, in
dB
Frequency, f, in Hz
STC 72

Client Report A1-006070.10 | Construction | Acoustics Laboratory
Page 97 of 168
ASTM E492 Test Results – Normalized Impact Sound Pressure Levels
Client: Nordic Engineered Wood Test ID: IIF-15-011
Specimen ID: A1-006070-12F Date of Test: March 2, 2015
Room Volume (m³) Air Temperature (°C) Humidity (%)
Upper 175.3 22.2 to 22.2 33.7 to 34.7 Area S of test specimen: 17.85 m2
Lower 174.3 19.6 to 19.9 39.5 to 39.8 Mass per unit area: 212 kg/m2
f (Hz)
NISPL (dB)
50 60
63 59
80 59
100 55
125 52
160 50
200 51
250 48
315 44
400 40
500 36
630 34
800 35
1000 32
1250 28
1600 26
2000 28
2500 30
3150 30
4000 28 c
5000 23 *
Impact Insulation
Class (IIC)
65
Sum of Positive Differences (dB)
24 Max. Positive Difference (dB)
8 dB at 100 Hz
For a description of the test specimen and mounting conditions see text pages before. The results in this report apply only to the specific sample submitted for measurement. No responsibility is assumed for performance of any other specimen. Measurements of normalized impact sound pressure level (NISPL) were conducted in accordance with the requirements of ASTM E492-09, “Standard Laboratory Measurement of Impact Sound Transmission through Floor-Ceiling Assemblies Using the Tapping Machine”. In the graph: The solid line is the measured normalized impact sound pressure level (NISPL) for this specimen. The dashed line is the IIC contour fitted to the measured values according to ASTM E989-06. The dotted line is the background sound level measured in the receiving room during this test (may be below the displayed range). For any frequency where measured NISPL is less than 10 dB above the dotted line, the reported values were adjusted as noted below. Bars at bottom of graph show positive differences; where the measured data are greater than the reference contour as defined in ASTM E989-06. Shaded cells in the table and areas in the graph are outside the IIC contour range. In the table: Values marked “c” indicate that the measured background level was between 5 dB and 10 dB below the combined receiving room level and background level. Values marked “*” indicate that the measured background level was less than 5 dB below the combined receiving room level and background level and the reported values of NISPL provide an estimate of the upper limit of normalized impact sound pressure level, according to the procedure outlined in ASTM E492-09. The reported values of NISPL have been corrected according to the procedure outlined in ASTM E492-09.
8
5
3 4
1
3
10
20
30
40
50
60
70
80
90
100
63 125 250 500 1000 2000 4000
Nor
mal
ized
Impa
ct S
ound
Pre
ssur
e Le
vel,
NIS
PL
in d
B
Frequency, f, in Hz
IIC 65
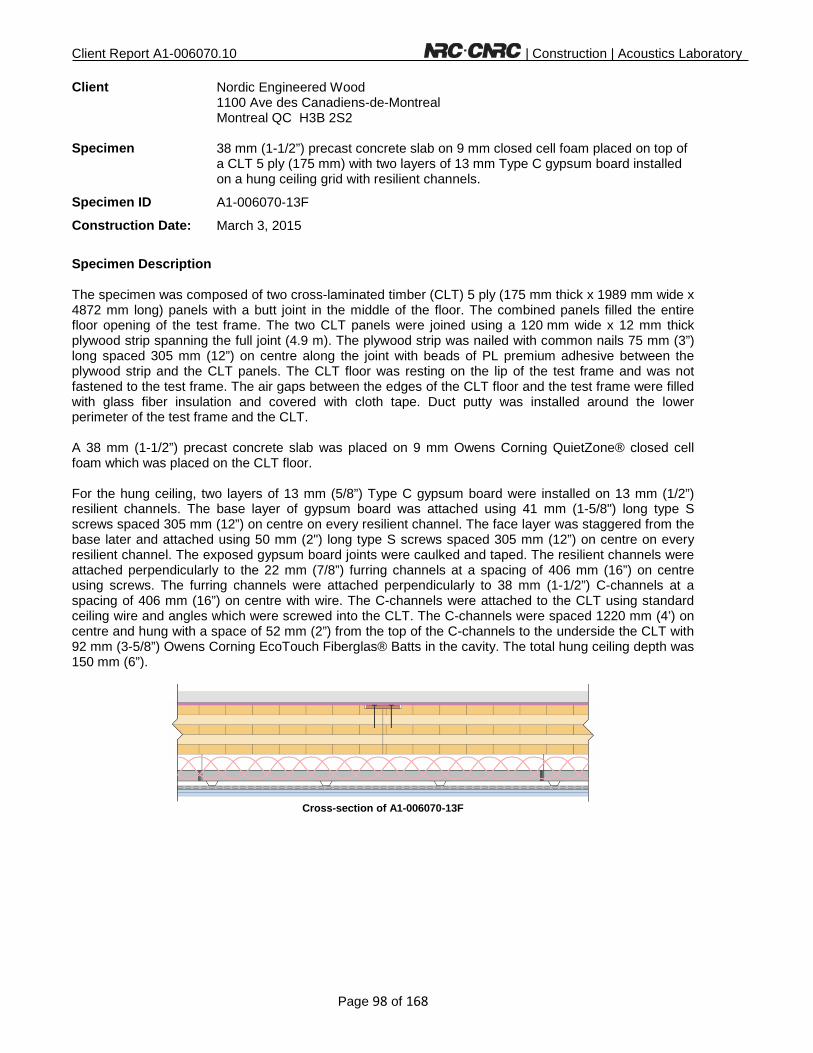
Client Report A1-006070.10 | Construction | Acoustics Laboratory
Page 98 of 168
Client Nordic Engineered Wood
1100 Ave des Canadiens-de-Montreal Montreal QC H3B 2S2
Specimen 38 mm (1-1/2”) precast concrete slab on 9 mm closed cell foam placed on top of a CLT 5 ply (175 mm) with two layers of 13 mm Type C gypsum board installed on a hung ceiling grid with resilient channels.
Specimen ID A1-006070-13F
Construction Date: March 3, 2015
Specimen Description The specimen was composed of two cross-laminated timber (CLT) 5 ply (175 mm thick x 1989 mm wide x 4872 mm long) panels with a butt joint in the middle of the floor. The combined panels filled the entire floor opening of the test frame. The two CLT panels were joined using a 120 mm wide x 12 mm thick plywood strip spanning the full joint (4.9 m). The plywood strip was nailed with common nails 75 mm (3”) long spaced 305 mm (12”) on centre along the joint with beads of PL premium adhesive between the plywood strip and the CLT panels. The CLT floor was resting on the lip of the test frame and was not fastened to the test frame. The air gaps between the edges of the CLT floor and the test frame were filled with glass fiber insulation and covered with cloth tape. Duct putty was installed around the lower perimeter of the test frame and the CLT. A 38 mm (1-1/2”) precast concrete slab was placed on 9 mm Owens Corning QuietZone® closed cell foam which was placed on the CLT floor. For the hung ceiling, two layers of 13 mm (5/8”) Type C gypsum board were installed on 13 mm (1/2”) resilient channels. The base layer of gypsum board was attached using 41 mm (1-5/8") long type S screws spaced 305 mm (12”) on centre on every resilient channel. The face layer was staggered from the base later and attached using 50 mm (2") long type S screws spaced 305 mm (12”) on centre on every resilient channel. The exposed gypsum board joints were caulked and taped. The resilient channels were attached perpendicularly to the 22 mm (7/8”) furring channels at a spacing of 406 mm (16”) on centre using screws. The furring channels were attached perpendicularly to 38 mm (1-1/2”) C-channels at a spacing of 406 mm (16”) on centre with wire. The C-channels were attached to the CLT using standard ceiling wire and angles which were screwed into the CLT. The C-channels were spaced 1220 mm (4’) on centre and hung with a space of 52 mm (2”) from the top of the C-channels to the underside the CLT with 92 mm (3-5/8”) Owens Corning EcoTouch Fiberglas® Batts in the cavity. The total hung ceiling depth was 150 mm (6”).
Cross-section of A1-006070-13F
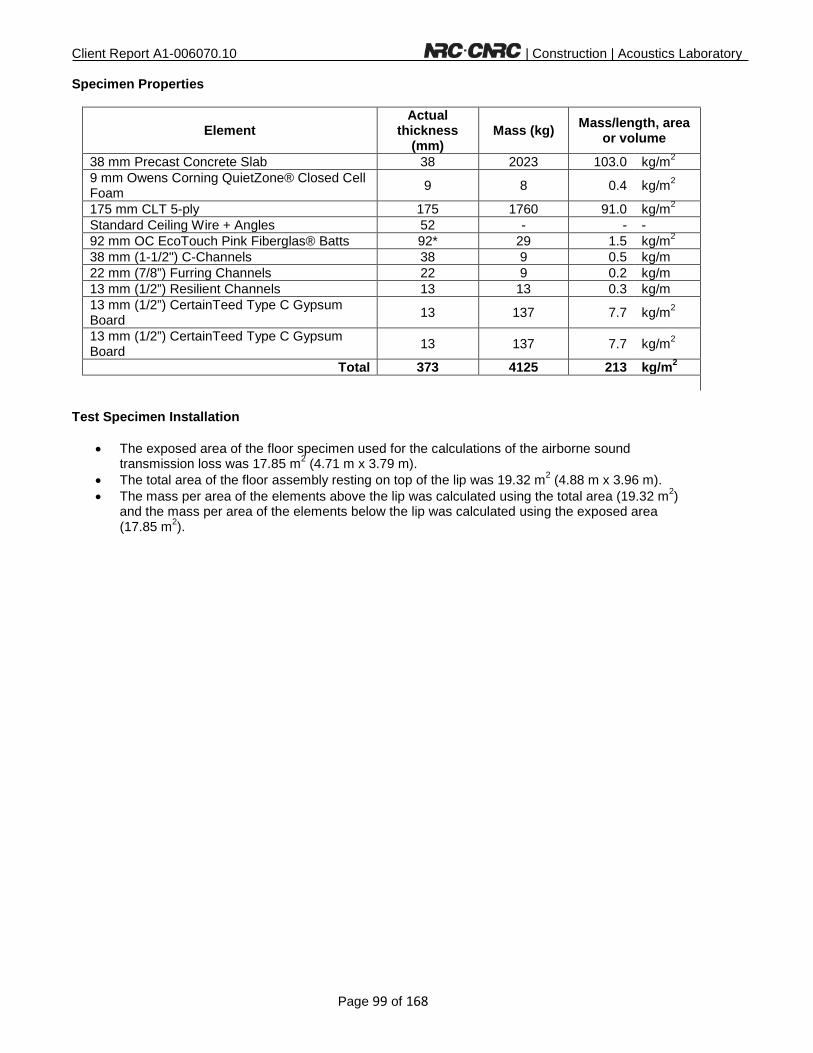
Client Report A1-006070.10 | Construction | Acoustics Laboratory
Page 99 of 168
Specimen Properties
Element Actual
thickness (mm)
Mass (kg) Mass/length, area or volume
38 mm Precast Concrete Slab 38 2023 103.0 kg/m2 9 mm Owens Corning QuietZone® Closed Cell
Foam 9 8 0.4 kg/m2
175 mm CLT 5-ply 175 1760 91.0 kg/m2 Standard Ceiling Wire + Angles 52 - - - 92 mm OC EcoTouch Pink Fiberglas® Batts 92* 29 1.5 kg/m2 38 mm (1-1/2") C-Channels 38 9 0.5 kg/m 22 mm (7/8”) Furring Channels 22 9 0.2 kg/m 13 mm (1/2”) Resilient Channels 13 13 0.3 kg/m 13 mm (1/2”) CertainTeed Type C Gypsum
Board 13 137 7.7 kg/m2
13 mm (1/2”) CertainTeed Type C Gypsum Board 13 137 7.7 kg/m2
Total 373 4125 213 kg/m2
Test Specimen Installation
• The exposed area of the floor specimen used for the calculations of the airborne sound transmission loss was 17.85 m2 (4.71 m x 3.79 m).
• The total area of the floor assembly resting on top of the lip was 19.32 m2 (4.88 m x 3.96 m). • The mass per area of the elements above the lip was calculated using the total area (19.32 m2)
and the mass per area of the elements below the lip was calculated using the exposed area (17.85 m2).

Client Report A1-006070.10 | Construction | Acoustics Laboratory
Page 100 of 168
ASTM E90 Test Results – Airborne Sound Transmission Loss
Client: Nordic Engineered Wood Test ID: TLF-15-015
Specimen ID: A1-006070-13F Date of Test: March 3 , 2015
Room Volume (m³) Air Temperature (°C) Humidity (%)
Upper 175.3 22.6 to 22.6 31.2 to 31.7 Area S of test specimen: 17.85 m2
Lower 174.3 19.9 to 19.9 42.8 to 45.7 Mass per unit area: 213 kg/m2
f (Hz)
Airborne TL (dB)
50 33
63 39
80 42
100 47
125 52
160 54
200 55
250 63
315 69
400 77
500 81 *
630 84 c
800 83
1000 87
1250 87 c
1600 90 c
2000 95 c
2500 95 *
3150 98 *
4000 97 *
5000 97 *
Sound Transmission
Class (STC) 73
Sum of Deficiencies (dB)
22 Max. Deficiency (dB)
8 dB at 200 Hz
For a description of the test specimen and mounting conditions see text pages before. The results in this report apply only to the specific sample submitted for measurement. No responsibility is assumed for performance of any other specimen. Airborne sound transmission loss measurements were conducted in accordance with the requirements of ASTM E90-09, “Standard Test Method for Laboratory Measurement of Airborne Sound Transmission Loss of Building Partitions and Elements”. In the graph: The solid line is the measured sound transmission loss for this specimen. The dashed line is the STC contour fitted to the measured values according to ASTM E413-10. The dotted line (may be above the displayed range) is 10 dB below the flanking limit established for this facility. For any frequency band where the measured transmission loss is above the dotted line, the reported value is potentially limited by flanking transmission via laboratory surfaces, and the true value may be higher than that measured. Bars at the bottom of the graph show deficiencies where the measured data are less than the reference contour as described in the fitting procedure for the STC, defined in ASTM E413-10. The shaded cells in the table and areas in the graph are outside the STC contour range. In the table: Values marked “c” indicate that the measured background level was between 5 dB and 10 dB below the combined receiving room level and background level. The reported values have been corrected according to the procedure outlined in ASTM E90-09. Values marked “*” indicate that the measured background level was less than 5 dB below the combined receiving room level and background level, in which case, the corrected values provide an estimate of the lower limit of airborne sound transmission loss.
5 6
8
3
10
20
30
40
50
60
70
80
90
100
63 125 250 500 1000 2000 4000
Airb
orne
Sou
nd T
rans
mis
sion
Los
s, T
L, in
dB
Frequency, f, in Hz
STC 73

Client Report A1-006070.10 | Construction | Acoustics Laboratory
Page 101 of 168
ASTM E492 Test Results – Normalized Impact Sound Pressure Levels
Client: Nordic Engineered Wood Test ID: IIF-15-012
Specimen ID: A1-006070-13F Date of Test: March 4, 2015
Room Volume (m³) Air Temperature (°C) Humidity (%)
Upper 175.3 23.8 to 23.9 29.4 to 29.8 Area S of test specimen: 17.85 m2
Lower 174.3 18.0 to 18.1 39.2 to 39.6 Mass per unit area: 213 kg/m2
f (Hz)
NISPL (dB)
50 60
63 57
80 59
100 54
125 52
160 48
200 50
250 47
315 43
400 39
500 35
630 33
800 35
1000 32
1250 28
1600 26
2000 24
2500 28
3150 26 c
4000 22 *
5000 20 *
Impact Insulation
Class (IIC)
66
Sum of Positive Differences (dB)
21 Max. Positive Difference (dB)
6 dB at 100 Hz
For a description of the test specimen and mounting conditions see text pages before. The results in this report apply only to the specific sample submitted for measurement. No responsibility is assumed for performance of any other specimen. Measurements of normalized impact sound pressure level (NISPL) were conducted in accordance with the requirements of ASTM E492-09, “Standard Laboratory Measurement of Impact Sound Transmission through Floor-Ceiling Assemblies Using the Tapping Machine”. In the graph: The solid line is the measured normalized impact sound pressure level (NISPL) for this specimen. The dashed line is the IIC contour fitted to the measured values according to ASTM E989-06. The dotted line is the background sound level measured in the receiving room during this test (may be below the displayed range). For any frequency where measured NISPL is less than 10 dB above the dotted line, the reported values were adjusted as noted below. Bars at bottom of graph show positive differences; where the measured data are greater than the reference contour as defined in ASTM E989-06. Shaded cells in the table and areas in the graph are outside the IIC contour range. In the table: Values marked “c” indicate that the measured background level was between 5 dB and 10 dB below the combined receiving room level and background level. Values marked “*” indicate that the measured background level was less than 5 dB below the combined receiving room level and background level and the reported values of NISPL provide an estimate of the upper limit of normalized impact sound pressure level, according to the procedure outlined in ASTM E492-09. The reported values of NISPL have been corrected according to the procedure outlined in ASTM E492-09.
8
6
2
4
1
10
20
30
40
50
60
70
80
90
100
63 125 250 500 1000 2000 4000
Nor
mal
ized
Impa
ct S
ound
Pre
ssur
e Le
vel,
NIS
PL
in d
B
Frequency, f, in Hz
IIC 66

Client Report A1-006070.10 | Construction | Acoustics Laboratory
Page 102 of 168
Client Nordic Engineered Wood
1100 Ave des Canadiens-de-Montreal Montreal QC H3B 2S2
Specimen 38 mm (1-1/2”) precast concrete slab on 9 mm closed cell foam placed on top of a CLT 5 ply (175 mm) with one layer of 13 mm Type C gypsum board installed on a hung ceiling grid with resilient channels
Specimen ID A1-006070-14F
Construction Date: March 5, 2015
Specimen Description The specimen was composed of two cross-laminated timber (CLT) 5 ply (175 mm thick x 1989 mm wide x 4872 mm long) panels with a butt joint in the middle of the floor. The combined panels filled the entire floor opening of the test frame. The two CLT panels were joined using a 120 mm wide x 12 mm thick plywood strip spanning the full joint (4.9 m). The plywood strip was nailed with common nails 75 mm (3”) long spaced 305 mm (12”) on centre along the joint with beads of PL premium adhesive between the plywood strip and the CLT panels. The CLT floor was resting on the lip of the test frame and was not fastened to the test frame. The air gaps between the edges of the CLT floor and the test frame were filled with glass fiber insulation and covered with cloth tape. Duct putty was installed around the lower perimeter of the test frame and the CLT. A 38 mm (1-1/2”) precast concrete slab was placed on 9 mm Owens Corning QuietZone® closed cell foam which was placed on the CLT floor. For the hung ceiling, one layers of 13 mm (5/8”) Type C gypsum board was installed on 13 mm (1/2”) resilient channels. The layer of gypsum board was attached using 41 mm (1-5/8") long type S screws spaced 305 mm (12”) on centre on every resilient channel. The exposed gypsum board joints were caulked and taped. The resilient channels were attached perpendicularly to the 22 mm (7/8”) furring channels at a spacing of 406 mm (16”) on centre using screws. The furring channels were attached perpendicularly to 38 mm (1-1/2”) C-channels at a spacing of 406 mm (16”) on centre with wire. The C-channels were attached to the CLT using standard ceiling wire and angles which were screwed into the CLT. The C-channels were spaced 1220 mm (4’) on centre and hung with a space of 52 mm (2”) from the top of the C-channels to the underside the CLT with 92 mm (3-5/8”) Owens Corning EcoTouch Fiberglas® Batts in the cavity. The total hung ceiling depth was 140 mm (5-1/2”).
Cross-section of A1-006070-14F

Client Report A1-006070.10 | Construction | Acoustics Laboratory
Page 103 of 168
Specimen Properties
Element Actual
thickness (mm)
Mass (kg) Mass/length, area or volume
38 mm Precast Concrete Slab 38 2023 103.0 kg/m2 9 mm Owens Corning QuietZone® Closed Cell
Foam 9 8 0.4 kg/m2
175 mm CLT 5-ply 175 1760 91.0 kg/m2 Standard Ceiling Wire + Angles 52 - - - 92 mm OC EcoTouch Pink Fiberglas® Batts 92* 29 1.5 kg/m2 38 mm (1-1/2") C-Channels 38 9 0.5 kg/m 22 mm (7/8”) Furring Channels 22 9 0.2 kg/m 13 mm (1/2”) Resilient Channels 13 13 0.3 kg/m 13 mm (1/2”) CertainTeed Type C Gypsum
Board 13 137 7.7 kg/m2
Total 360 3988 206 kg/m2 Test Specimen Installation
• The exposed area of the floor specimen used for the calculations of the airborne sound transmission loss was 17.85 m2 (4.71 m x 3.79 m).
• The total area of the floor assembly resting on top of the lip was 19.32 m2 (4.88 m x 3.96 m). • The mass per area of the elements above the lip was calculated using the total area (19.32 m2)
and the mass per area of the elements below the lip was calculated using the exposed area (17.85 m2).

Client Report A1-006070.10 | Construction | Acoustics Laboratory
Page 104 of 168
ASTM E90 Test Results – Airborne Sound Transmission Loss
Client: Nordic Engineered Wood Test ID: TLF-15-016
Specimen ID: A1-006070-14F Date of Test: March 6, 2015
Room Volume (m³) Air Temperature (°C) Humidity (%)
Upper 175.3 26.1 to 26.1 33.6 to 34.3 Area S of test specimen: 17.85 m2
Lower 174.6 17.4 to 17.4 43.5 to 43.9 Mass per unit area: 206 kg/m2
f (Hz)
Airborne TL (dB)
50 28
63 32
80 36
100 42
125 48
160 51
200 54
250 60
315 67
400 74 *
500 79 *
630 83 c
800 82 c
1000 86 c
1250 86 c
1600 88 c
2000 94 *
2500 94 *
3150 97 *
4000 97 *
5000 97 *
Sound Transmission
Class (STC) 72
Sum of Deficiencies (dB)
30 Max. Deficiency (dB)
8 dB at 125, 160 and 200 Hz
For a description of the test specimen and mounting conditions see text pages before. The results in this report apply only to the specific sample submitted for measurement. No responsibility is assumed for performance of any other specimen. Airborne sound transmission loss measurements were conducted in accordance with the requirements of ASTM E90-09, “Standard Test Method for Laboratory Measurement of Airborne Sound Transmission Loss of Building Partitions and Elements”. In the graph: The solid line is the measured sound transmission loss for this specimen. The dashed line is the STC contour fitted to the measured values according to ASTM E413-10. The dotted line (may be above the displayed range) is 10 dB below the flanking limit established for this facility. For any frequency band where the measured transmission loss is above the dotted line, the reported value is potentially limited by flanking transmission via laboratory surfaces, and the true value may be higher than that measured. Bars at the bottom of the graph show deficiencies where the measured data are less than the reference contour as described in the fitting procedure for the STC, defined in ASTM E413-10. The shaded cells in the table and areas in the graph are outside the STC contour range. In the table: Values marked “c” indicate that the measured background level was between 5 dB and 10 dB below the combined receiving room level and background level. The reported values have been corrected according to the procedure outlined in ASTM E90-09. Values marked “*” indicate that the measured background level was less than 5 dB below the combined receiving room level and background level, in which case, the corrected values provide an estimate of the lower limit of airborne sound transmission loss.
8 8 8
5
1
10
20
30
40
50
60
70
80
90
100
63 125 250 500 1000 2000 4000
Airb
orne
Sou
nd T
rans
mis
sion
Los
s, T
L, in
dB
Frequency, f, in Hz
STC 72

Client Report A1-006070.10 | Construction | Acoustics Laboratory
Page 105 of 168
ASTM E492 Test Results – Normalized Impact Sound Pressure Levels
Client: Nordic Engineered Wood Test ID: IIF-15-013
Specimen ID: A1-006070-14F Date of Test: March 5, 2015
Room Volume (m³) Air Temperature (°C) Humidity (%)
Upper 175.3 25.2 to 25.2 32.5 to 32.7 Area S of test specimen: 17.85 m2
Lower 174.6 19.9 to 19.9 39.6 to 40.3 Mass per unit area: 206 kg/m2
f (Hz)
NISPL (dB)
50 71
63 66
80 65
100 58
125 56
160 54
200 53
250 49
315 45
400 41
500 38
630 34
800 36
1000 33
1250 29
1600 27
2000 27
2500 32
3150 30
4000 27 c
5000 22 *
Impact Insulation
Class (IIC)
62
Sum of Positive Differences (dB)
21 Max. Positive Difference (dB)
8 dB at 100 Hz
For a description of the test specimen and mounting conditions see text pages before. The results in this report apply only to the specific sample submitted for measurement. No responsibility is assumed for performance of any other specimen. Measurements of normalized impact sound pressure level (NISPL) were conducted in accordance with the requirements of ASTM E492-09, “Standard Laboratory Measurement of Impact Sound Transmission through Floor-Ceiling Assemblies Using the Tapping Machine”. In the graph: The solid line is the measured normalized impact sound pressure level (NISPL) for this specimen. The dashed line is the IIC contour fitted to the measured values according to ASTM E989-06. The dotted line is the background sound level measured in the receiving room during this test (may be below the displayed range). For any frequency where measured NISPL is less than 10 dB above the dotted line, the reported values were adjusted as noted below. Bars at bottom of graph show positive differences; where the measured data are greater than the reference contour as defined in ASTM E989-06. Shaded cells in the table and areas in the graph are outside the IIC contour range. In the table: Values marked “c” indicate that the measured background level was between 5 dB and 10 dB below the combined receiving room level and background level. Values marked “*” indicate that the measured background level was less than 5 dB below the combined receiving room level and background level and the reported values of NISPL provide an estimate of the upper limit of normalized impact sound pressure level, according to the procedure outlined in ASTM E492-09. The reported values of NISPL have been corrected according to the procedure outlined in ASTM E492-09.
8
6
4 3
10
20
30
40
50
60
70
80
90
100
63 125 250 500 1000 2000 4000
Nor
mal
ized
Impa
ct S
ound
Pre
ssur
e Le
vel,
NIS
PL
in d
B
Frequency, f, in Hz
IIC 62

Client Report A1-006070.10 | Construction | Acoustics Laboratory
Page 106 of 168
Client Nordic Engineered Wood
1100 Ave des Canadiens-de-Montreal Montreal QC H3B 2S2
Specimen Bare CLT 5 ply (131 mm)
Specimen ID A1-006070-20F
Construction Date: March 6, 2015 to March 9, 2015
Specimen Description The specimen was composed of two cross-laminated timber (CLT) 5 ply (131 mm thick x 1989 mm wide x 4872 mm long) panels with a butt joint in the middle of the floor. The combined panels filled the entire floor opening of the test frame. The two CLT panels were joined using a 120 mm wide x 12 mm thick plywood strip spanning the full joint (4.9 m). The plywood strip was nailed with common nails 75 mm (3”) long spaced 305 mm (12”) on centre along the joint with beads of PL premium adhesive between the plywood strip and the CLT panels. The CLT floor was resting on the lip of the test frame and was not fastened to the test frame. The air gaps between the edges of the CLT floor and the test frame were filled with glass fiber insulation and covered with cloth tape. Duct putty was installed around the lower perimeter of the test frame and the CLT.
Cross-section of A1-006070-20F
Specimen Properties
Element Actual
thickness (mm)
Mass (kg) Mass/length, area or volume
131 mm CLT 5-ply 131 1338 67.0 kg/m2 Total 131 1338 67 kg/m2
Test Specimen Installation
• The exposed area of the floor specimen used for the calculations of the airborne sound transmission loss was 17.85 m2 (4.71 m x 3.79 m).
• The total area of the floor assembly resting on top of the lip was 19.32 m2 (4.88 m x 3.96 m). • The mass per area of the elements above the lip was calculated using the total area (19.32 m2).

Client Report A1-006070.10 | Construction | Acoustics Laboratory
Page 107 of 168
This page was
intentionally
left blank

Client Report A1-006070.10 | Construction | Acoustics Laboratory
Page 108 of 168
ASTM E90 Test Results – Airborne Sound Transmission Loss
Client: Nordic Engineered Wood Test ID: TLF-15-017
Specimen ID: A1-006070-20F Date of Test: March 9, 2015
Room Volume (m³) Air Temperature (°C) Humidity (%)
Upper 176.7 25.0 to 25.2 32.3 to 32.7 Area S of test specimen: 17.85 m2
Lower 177.2 19.5 to 19.6 41.3 to 41.4 Mass per unit area: 67 kg/m2
f (Hz)
Airborne TL (dB)
50 20
63 25
80 26
100 27
125 28
160 29
200 27
250 30
315 31
400 32
500 33
630 36
800 39
1000 40
1250 42
1600 45
2000 48
2500 50
3150 52
4000 51
5000 49
Sound Transmission
Class (STC) 39
Sum of Deficiencies (dB)
29 Max. Deficiency (dB)
6 dB at 400 and 500 Hz
For a description of the test specimen and mounting conditions see text pages before. The results in this report apply only to the specific sample submitted for measurement. No responsibility is assumed for performance of any other specimen. Airborne sound transmission loss measurements were conducted in accordance with the requirements of ASTM E90-09, “Standard Test Method for Laboratory Measurement of Airborne Sound Transmission Loss of Building Partitions and Elements”. In the graph: The solid line is the measured sound transmission loss for this specimen. The dashed line is the STC contour fitted to the measured values according to ASTM E413-10. The dotted line (may be above the displayed range) is 10 dB below the flanking limit established for this facility. For any frequency band where the measured transmission loss is above the dotted line, the reported value is potentially limited by flanking transmission via laboratory surfaces, and the true value may be higher than that measured. Bars at the bottom of the graph show deficiencies where the measured data are less than the reference contour as described in the fitting procedure for the STC, defined in ASTM E413-10. The shaded cells in the table and areas in the graph are outside the STC contour range. In the table: Values marked “c” indicate that the measured background level was between 5 dB and 10 dB below the combined receiving room level and background level. The reported values have been corrected according to the procedure outlined in ASTM E90-09. Values marked “*” indicate that the measured background level was less than 5 dB below the combined receiving room level and background level, in which case, the corrected values provide an estimate of the lower limit of airborne sound transmission loss.
2 2
4
6 6
4
2 2 1
10
20
30
40
50
60
70
80
90
100
63 125 250 500 1000 2000 4000
Airb
orne
Sou
nd T
rans
mis
sion
Los
s, T
L, in
dB
Frequency, f, in Hz
STC 39

Client Report A1-006070.10 | Construction | Acoustics Laboratory
Page 109 of 168
ASTM E492 Test Results – Normalized Impact Sound Pressure Levels
Client: Nordic Engineered Wood Test ID: IIF-15-014
Specimen ID: A1-006070-20F Date of Test: March 9, 2015
Room Volume (m³) Air Temperature (°C) Humidity (%)
Upper 176.7 25.1 to 25.1 32.7 to 32.7 Area S of test specimen: 17.85 m2
Lower 177.2 19.5 to 19.6 41.3 to 41.4 Mass per unit area: 67 kg/m2
f (Hz)
NISPL (dB)
50 75 c
63 72
80 72
100 75
125 80
160 81
200 83
250 84
315 85
400 86
500 87
630 88
800 88
1000 88
1250 87
1600 85
2000 82
2500 76
3150 68
4000 62
5000 62
Impact Insulation
Class (IIC)
22
Sum of Positive Differences (dB)
26 Max. Positive Difference (dB)
6 dB at 1600 and 2000 Hz
For a description of the test specimen and mounting conditions see text pages before. The results in this report apply only to the specific sample submitted for measurement. No responsibility is assumed for performance of any other specimen. Measurements of normalized impact sound pressure level (NISPL) were conducted in accordance with the requirements of ASTM E492-09, “Standard Laboratory Measurement of Impact Sound Transmission through Floor-Ceiling Assemblies Using the Tapping Machine”. In the graph: The solid line is the measured normalized impact sound pressure level (NISPL) for this specimen. The dashed line is the IIC contour fitted to the measured values according to ASTM E989-06. The dotted line is the background sound level measured in the receiving room during this test (may be below the displayed range). For any frequency where measured NISPL is less than 10 dB above the dotted line, the reported values were adjusted as noted below. Bars at bottom of graph show positive differences; where the measured data are greater than the reference contour as defined in ASTM E989-06. Shaded cells in the table and areas in the graph are outside the IIC contour range. In the table: Values marked “c” indicate that the measured background level was between 5 dB and 10 dB below the combined receiving room level and background level. Values marked “*” indicate that the measured background level was less than 5 dB below the combined receiving room level and background level and the reported values of NISPL provide an estimate of the upper limit of normalized impact sound pressure level, according to the procedure outlined in ASTM E492-09. The reported values of NISPL have been corrected according to the procedure outlined in ASTM E492-09.
1 2
3
5 6 6
3
10
20
30
40
50
60
70
80
90
100
63 125 250 500 1000 2000 4000
Nor
mal
ized
Impa
ct S
ound
Pre
ssur
e Le
vel,
NIS
PL
in d
B
Frequency, f, in Hz
IIC 22

Client Report A1-006070.10 | Construction | Acoustics Laboratory
Page 110 of 168
Client Nordic Engineered Wood
1100 Ave des Canadiens-de-Montreal Montreal QC H3B 2S2
Specimen 38 mm (1-1/2”) precast concrete slab on 13 mm (1/2”) rubber membrane placed on top of a CLT 5 ply (131 mm).
Specimen ID A1-006070-21F
Construction Date: March 13, 2015
Specimen Description The specimen was composed of two cross-laminated timber (CLT) 5 ply (131 mm thick x 1989 mm wide x 4872 mm long) panels with a butt joint in the middle of the floor. The combined panels filled the entire floor opening of the test frame. The two CLT panels were joined using a 120 mm wide x 12 mm thick plywood strip spanning the full joint (4.9 m). The plywood strip was nailed with common nails 75 mm (3”) long spaced 305 mm (12”) on centre along the joint with beads of PL premium adhesive between the plywood strip and the CLT panels. The CLT floor was resting on the lip of the test frame and was not fastened to the test frame. The air gaps between the edges of the CLT floor and the test frame were filled with glass fiber insulation and covered with cloth tape. Duct putty was installed around the lower perimeter of the test frame and the CLT. A 38 mm (1-1/2”) precast concrete slab was placed on a 13 mm (1/2”) INSONOMAT rubber membrane which was placed on the CLT floor.
Cross-section of A1-006070-21F
Specimen Properties
Element Actual
thickness (mm)
Mass (kg) Mass/length, area or volume
38 mm Precast Concrete Slab 38 2023 103.0 kg/m2 13 mm INSONOMAT Rubber Membrane 13 90 4.5 kg/m2 131 mm CLT 5-ply 131 1338 67.0 kg/m2 Total 182 3451 175 kg/m2
Test Specimen Installation
• The exposed area of the floor specimen used for the calculations of the airborne sound
transmission loss was 17.85 m2 (4.71 m x 3.79 m). • The total area of the floor assembly resting on top of the lip was 19.32 m2 (4.88 m x 3.96 m). • The mass per area of the elements above the lip was calculated using the total area (19.32 m2).

Client Report A1-006070.10 | Construction | Acoustics Laboratory
Page 111 of 168
This page was
intentionally
left blank

Client Report A1-006070.10 | Construction | Acoustics Laboratory
Page 112 of 168
ASTM E90 Test Results – Airborne Sound Transmission Loss
Client: Nordic Engineered Wood Test ID: TLF-15-018
Specimen ID: A1-006070-21F Date of Test: March 13, 2015
Room Volume (m³) Air Temperature (°C) Humidity (%)
Upper 175.8 23.8 to 23.8 32.6 to 33.2 Area S of test specimen: 17.85 m2
Lower 177.1 18.9 to 19.2 39.9 to 40.3 Mass per unit area: 175 kg/m2
f (Hz)
Airborne TL (dB)
50 32
63 34
80 33
100 32
125 33
160 36
200 39
250 43
315 47
400 48
500 49
630 53
800 59
1000 65
1250 71
1600 76
2000 83
2500 88
3150 90
4000 90
5000 88
Sound Transmission
Class (STC) 53
Sum of Deficiencies (dB)
26 Max. Deficiency (dB) 4dB at 125, 160, 200, 400 and 500Hz
For a description of the test specimen and mounting conditions see text pages before. The results in this report apply only to the specific sample submitted for measurement. No responsibility is assumed for performance of any other specimen. Airborne sound transmission loss measurements were conducted in accordance with the requirements of ASTM E90-09, “Standard Test Method for Laboratory Measurement of Airborne Sound Transmission Loss of Building Partitions and Elements”. In the graph: The solid line is the measured sound transmission loss for this specimen. The dashed line is the STC contour fitted to the measured values according to ASTM E413-10. The dotted line (may be above the displayed range) is 10 dB below the flanking limit established for this facility. For any frequency band where the measured transmission loss is above the dotted line, the reported value is potentially limited by flanking transmission via laboratory surfaces, and the true value may be higher than that measured. Bars at the bottom of the graph show deficiencies where the measured data are less than the reference contour as described in the fitting procedure for the STC, defined in ASTM E413-10. The shaded cells in the table and areas in the graph are outside the STC contour range. In the table: Values marked “c” indicate that the measured background level was between 5 dB and 10 dB below the combined receiving room level and background level. The reported values have been corrected according to the procedure outlined in ASTM E90-09. Values marked “*” indicate that the measured background level was less than 5 dB below the combined receiving room level and background level, in which case, the corrected values provide an estimate of the lower limit of airborne sound transmission loss.
4 4 4 3
2
4 4
1
10
20
30
40
50
60
70
80
90
100
63 125 250 500 1000 2000 4000
Airb
orne
Sou
nd T
rans
mis
sion
Los
s, T
L, in
dB
Frequency, f, in Hz
STC 53
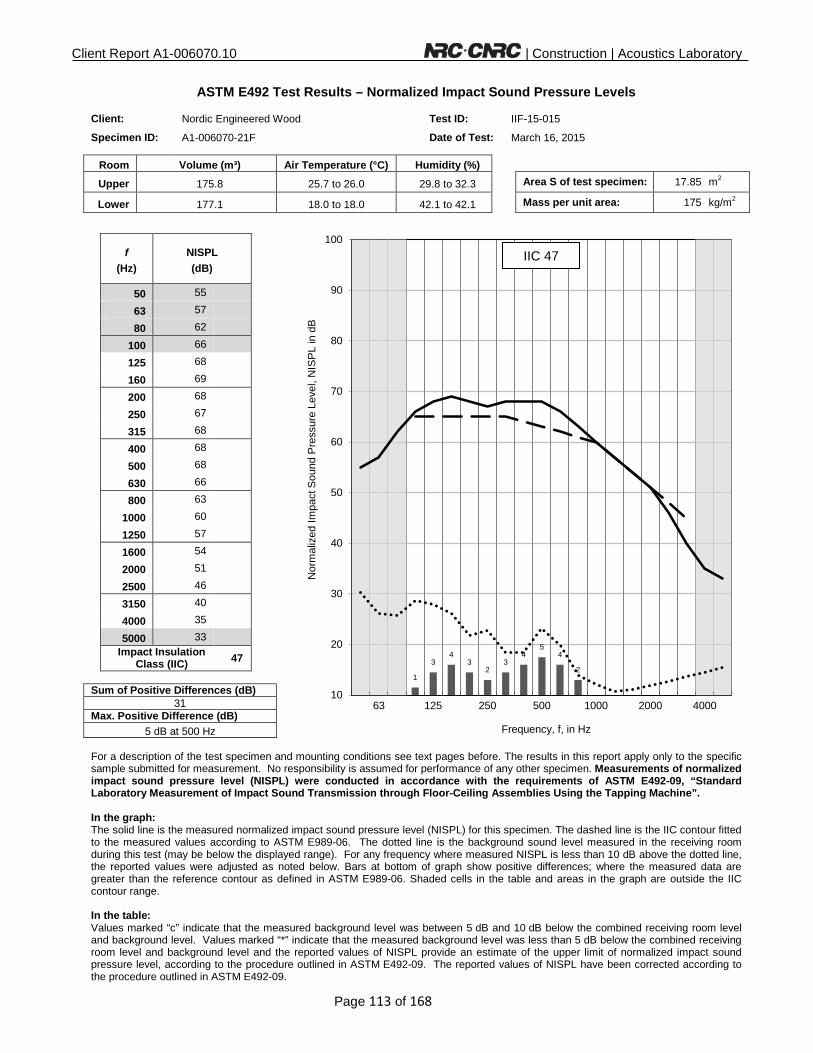
Client Report A1-006070.10 | Construction | Acoustics Laboratory
Page 113 of 168
ASTM E492 Test Results – Normalized Impact Sound Pressure Levels
Client: Nordic Engineered Wood Test ID: IIF-15-015
Specimen ID: A1-006070-21F Date of Test: March 16, 2015
Room Volume (m³) Air Temperature (°C) Humidity (%)
Upper 175.8 25.7 to 26.0 29.8 to 32.3 Area S of test specimen: 17.85 m2
Lower 177.1 18.0 to 18.0 42.1 to 42.1 Mass per unit area: 175 kg/m2
f (Hz)
NISPL (dB)
50 55
63 57
80 62
100 66
125 68
160 69
200 68
250 67
315 68
400 68
500 68
630 66
800 63
1000 60
1250 57
1600 54
2000 51
2500 46
3150 40
4000 35
5000 33
Impact Insulation
Class (IIC)
47
Sum of Positive Differences (dB)
31 Max. Positive Difference (dB)
5 dB at 500 Hz
For a description of the test specimen and mounting conditions see text pages before. The results in this report apply only to the specific sample submitted for measurement. No responsibility is assumed for performance of any other specimen. Measurements of normalized impact sound pressure level (NISPL) were conducted in accordance with the requirements of ASTM E492-09, “Standard Laboratory Measurement of Impact Sound Transmission through Floor-Ceiling Assemblies Using the Tapping Machine”. In the graph: The solid line is the measured normalized impact sound pressure level (NISPL) for this specimen. The dashed line is the IIC contour fitted to the measured values according to ASTM E989-06. The dotted line is the background sound level measured in the receiving room during this test (may be below the displayed range). For any frequency where measured NISPL is less than 10 dB above the dotted line, the reported values were adjusted as noted below. Bars at bottom of graph show positive differences; where the measured data are greater than the reference contour as defined in ASTM E989-06. Shaded cells in the table and areas in the graph are outside the IIC contour range. In the table: Values marked “c” indicate that the measured background level was between 5 dB and 10 dB below the combined receiving room level and background level. Values marked “*” indicate that the measured background level was less than 5 dB below the combined receiving room level and background level and the reported values of NISPL provide an estimate of the upper limit of normalized impact sound pressure level, according to the procedure outlined in ASTM E492-09. The reported values of NISPL have been corrected according to the procedure outlined in ASTM E492-09.
1
3 4
3 2
3 4
5 4
2
10
20
30
40
50
60
70
80
90
100
63 125 250 500 1000 2000 4000
Nor
mal
ized
Impa
ct S
ound
Pre
ssur
e Le
vel,
NIS
PL
in d
B
Frequency, f, in Hz
IIC 47

Client Report A1-006070.10 | Construction | Acoustics Laboratory
Page 114 of 168
Client Nordic Engineered Wood
1100 Ave des Canadiens-de-Montreal Montreal QC H3B 2S2
Specimen 38 mm (1-1/2”) precast concrete slab on 9 mm closed cell foam placed on top of a CLT 5 ply (131 mm).
Specimen ID A1-006070-22F
Construction Date: March 17, 2015
Specimen Description The specimen was composed of two cross-laminated timber (CLT) 5 ply (131 mm thick x 1989 mm wide x 4872 mm long) panels with a butt joint in the middle of the floor. The combined panels filled the entire floor opening of the test frame. The two CLT panels were joined using a 120 mm wide x 12 mm thick plywood strip spanning the full joint (4.9 m). The plywood strip was nailed with common nails 75 mm (3”) long spaced 305 mm (12”) on centre along the joint with beads of PL premium adhesive between the plywood strip and the CLT panels. The CLT floor was resting on the lip of the test frame and was not fastened to the test frame. The air gaps between the edges of the CLT floor and the test frame were filled with glass fiber insulation and covered with cloth tape. Duct putty was installed around the lower perimeter of the test frame and the CLT. A 38 mm (1-1/2”) precast concrete slab was placed on 9 mm Owens Corning QuietZone® closed cell foam which was placed on the CLT floor.
Cross-section of A1-006070-22F
Specimen Properties
Element Actual
thickness (mm)
Mass (kg) Mass/length, area or volume
38 mm Precast Concrete Slab 38 2023 103.0 kg/m2 9 mm Owens Corning QuietZone® Closed Cell
Foam 9 7.5 0.4 kg/m2
131 mm CLT 5-ply 131 1338 67.0 kg/m2 Total 178 3369 170 kg/m2
Test Specimen Installation
• The exposed area of the floor specimen used for the calculations of the airborne sound transmission loss was 17.85 m2 (4.71 m x 3.79 m).
• The total area of the floor assembly resting on top of the lip was 19.32 m2 (4.88 m x 3.96 m). • The mass per area of the elements above the lip was calculated using the total area (19.32 m2).

Client Report A1-006070.10 | Construction | Acoustics Laboratory
Page 115 of 168
This page was
intentionally
left blank

Client Report A1-006070.10 | Construction | Acoustics Laboratory
Page 116 of 168
ASTM E90 Test Results – Airborne Sound Transmission Loss
Client: Nordic Engineered Wood Test ID: TLF-15-019
Specimen ID: A1-006070-22F Date of Test: March 19, 2015
Room Volume (m³) Air Temperature (°C) Humidity (%)
Upper 175.9 27.0 to 27.4 36.9 to 37.8 Area S of test specimen: 17.85 m2
Lower 177.1 17.9 to 17.9 42.4 to 42.6 Mass per unit area: 170 kg/m2
f (Hz)
Airborne TL (dB)
50 34
63 37
80 37
100 36
125 38
160 37
200 36
250 40
315 44
400 46
500 47
630 51
800 55
1000 59
1250 63
1600 67
2000 72
2500 78
3150 84
4000 84
5000 82
Sound Transmission
Class (STC) 52
Sum of Deficiencies (dB)
29 Max. Deficiency (dB)
6 dB at 200 Hz
For a description of the test specimen and mounting conditions see text pages before. The results in this report apply only to the specific sample submitted for measurement. No responsibility is assumed for performance of any other specimen. Airborne sound transmission loss measurements were conducted in accordance with the requirements of ASTM E90-09, “Standard Test Method for Laboratory Measurement of Airborne Sound Transmission Loss of Building Partitions and Elements” with the exception that the temperature in the upper room was higher than 27ºC. In the graph: The solid line is the measured sound transmission loss for this specimen. The dashed line is the STC contour fitted to the measured values according to ASTM E413-10. The dotted line (may be above the displayed range) is 10 dB below the flanking limit established for this facility. For any frequency band where the measured transmission loss is above the dotted line, the reported value is potentially limited by flanking transmission via laboratory surfaces, and the true value may be higher than that measured. Bars at the bottom of the graph show deficiencies where the measured data are less than the reference contour as described in the fitting procedure for the STC, defined in ASTM E413-10. The shaded cells in the table and areas in the graph are outside the STC contour range. In the table: Values marked “c” indicate that the measured background level was between 5 dB and 10 dB below the combined receiving room level and background level. The reported values have been corrected according to the procedure outlined in ASTM E90-09. Values marked “*” indicate that the measured background level was less than 5 dB below the combined receiving room level and background level, in which case, the corrected values provide an estimate of the lower limit of airborne sound transmission loss.
2
6 5
4 5 5
2
10
20
30
40
50
60
70
80
90
100
63 125 250 500 1000 2000 4000
Airb
orne
Sou
nd T
rans
mis
sion
Los
s, T
L, in
dB
Frequency, f, in Hz
STC 52

Client Report A1-006070.10 | Construction | Acoustics Laboratory
Page 117 of 168
ASTM E492 Test Results – Normalized Impact Sound Pressure Levels
Client: Nordic Engineered Wood Test ID: IIF-15-017
Specimen ID: A1-006070-22F Date of Test: March 19, 2015
Room Volume (m³) Air Temperature (°C) Humidity (%)
Upper 175.9 26.9 to 26.9 32.2 to 34.2 Area S of test specimen: 17.85 m2
Lower 177.1 17.8 to 17.8 42.2 to 42.6 Mass per unit area: 170 kg/m2
f (Hz)
NISPL (dB)
50 64
63 61
80 62
100 63
125 68
160 72
200 74
250 72
315 72
400 72
500 71
630 70
800 68
1000 67
1250 66
1600 66
2000 63
2500 61
3150 55
4000 57
5000 58
Impact Insulation
Class (IIC)
40
Sum of Positive Differences (dB)
26 Max. Positive Difference (dB)
6 dB at 2500 Hz
For a description of the test specimen and mounting conditions see text pages before. The results in this report apply only to the specific sample submitted for measurement. No responsibility is assumed for performance of any other specimen. Measurements of normalized impact sound pressure level (NISPL) were conducted in accordance with the requirements of ASTM E492-09, “Standard Laboratory Measurement of Impact Sound Transmission through Floor-Ceiling Assemblies Using the Tapping Machine”. In the graph: The solid line is the measured normalized impact sound pressure level (NISPL) for this specimen. The dashed line is the IIC contour fitted to the measured values according to ASTM E989-06. The dotted line is the background sound level measured in the receiving room during this test (may be below the displayed range). For any frequency where measured NISPL is less than 10 dB above the dotted line, the reported values were adjusted as noted below. Bars at bottom of graph show positive differences; where the measured data are greater than the reference contour as defined in ASTM E989-06. Shaded cells in the table and areas in the graph are outside the IIC contour range. In the table: Values marked “c” indicate that the measured background level was between 5 dB and 10 dB below the combined receiving room level and background level. Values marked “*” indicate that the measured background level was less than 5 dB below the combined receiving room level and background level and the reported values of NISPL provide an estimate of the upper limit of normalized impact sound pressure level, according to the procedure outlined in ASTM E492-09. The reported values of NISPL have been corrected according to the procedure outlined in ASTM E492-09.
2 1 1 1
2
5 5 6
3
10
20
30
40
50
60
70
80
90
100
63 125 250 500 1000 2000 4000
Nor
mal
ized
Impa
ct S
ound
Pre
ssur
e Le
vel,
NIS
PL
in d
B
Frequency, f, in Hz
IIC 40

Client Report A1-006070.10 | Construction | Acoustics Laboratory
Page 118 of 168
Client Nordic Engineered Wood
1100 Ave des Canadiens-de-Montreal Montreal QC H3B 2S2
Specimen 38 mm (1-1/2”) precast concrete slab on 10 mm tar board placed on top of a CLT 5 ply (131 mm).
Specimen ID A1-006070-23F
Construction Date: March 25, 2015
Specimen Description The specimen was composed of two cross-laminated timber (CLT) 5 ply (131 mm thick x 1989 mm wide x 4872 mm long) panels with a butt joint in the middle of the floor. The combined panels filled the entire floor opening of the test frame. The two CLT panels were joined using a 120 mm wide x 12 mm thick plywood strip spanning the full joint (4.9 m). The plywood strip was nailed with common nails 75 mm (3”) long spaced 305 mm (12”) on centre along the joint with beads of PL premium adhesive between the plywood strip and the CLT panels. The CLT floor was resting on the lip of the test frame and was not fastened to the test frame. The air gaps between the edges of the CLT floor and the test frame were filled with glass fiber insulation and covered with cloth tape. Duct putty was installed around the lower perimeter of the test frame and the CLT. A 38 mm (1-1/2”) precast concrete slab was placed on 10 mm tar boards which were placed on the CLT floor.
Cross-section of A1-006070-23F
Specimen Properties
Element Actual
thickness (mm)
Mass (kg) Mass/length, area or volume
38 mm Precast Concrete Slab 38 2023 103.0 kg/m2 10 mm Tar Board (Building Products) 10 56 2.8 kg/m2 131 mm CLT 5-ply 131 1338 67.0 kg/m2 Total 179 3417 173 kg/m2
Test Specimen Installation
• The exposed area of the floor specimen used for the calculations of the airborne sound transmission loss was 17.85 m2 (4.71 m x 3.79 m).
• The total area of the floor assembly resting on top of the lip was 19.32 m2 (4.88 m x 3.96 m). • The mass per area of the elements above the lip was calculated using the total area (19.32 m2).

Client Report A1-006070.10 | Construction | Acoustics Laboratory
Page 119 of 168
This page was
intentionally
left blank

Client Report A1-006070.10 | Construction | Acoustics Laboratory
Page 120 of 168
ASTM E90 Test Results – Airborne Sound Transmission Loss
Client: Nordic Engineered Wood Test ID: TLF-15-021
Specimen ID: A1-006070-23F Date of Test: March 26, 2015
Room Volume (m³) Air Temperature (°C) Humidity (%)
Upper 175.9 26.5 to 27.5 38.4 to 38.7 Area S of test specimen: 17.85 m2
Lower 177.1 17.9 to 17.9 40.2 to 40.3 Mass per unit area: 173 kg/m2
f (Hz)
Airborne TL (dB)
50 34
63 36
80 35
100 33
125 35
160 38
200 39
250 43
315 45
400 45
500 46
630 50
800 54
1000 60
1250 66
1600 70
2000 75
2500 80
3150 82
4000 83
5000 83
Sound Transmission
Class (STC) 52
Sum of Deficiencies (dB)
25 Max. Deficiency (dB)
6 dB at 400 and 500 Hz
For a description of the test specimen and mounting conditions see text pages before. The results in this report apply only to the specific sample submitted for measurement. No responsibility is assumed for performance of any other specimen. Airborne sound transmission loss measurements were conducted in accordance with the requirements of ASTM E90-09, “Standard Test Method for Laboratory Measurement of Airborne Sound Transmission Loss of Building Partitions and Elements” with the exception that the temperature in the upper room was higher than 27ºC. In the graph: The solid line is the measured sound transmission loss for this specimen. The dashed line is the STC contour fitted to the measured values according to ASTM E413-10. The dotted line (may be above the displayed range) is 10 dB below the flanking limit established for this facility. For any frequency band where the measured transmission loss is above the dotted line, the reported value is potentially limited by flanking transmission via laboratory surfaces, and the true value may be higher than that measured. Bars at the bottom of the graph show deficiencies where the measured data are less than the reference contour as described in the fitting procedure for the STC, defined in ASTM E413-10. The shaded cells in the table and areas in the graph are outside the STC contour range. In the table: Values marked “c” indicate that the measured background level was between 5 dB and 10 dB below the combined receiving room level and background level. The reported values have been corrected according to the procedure outlined in ASTM E90-09. Values marked “*” indicate that the measured background level was less than 5 dB below the combined receiving room level and background level, in which case, the corrected values provide an estimate of the lower limit of airborne sound transmission loss.
1 1
3 2
3
6 6
3
10
20
30
40
50
60
70
80
90
100
63 125 250 500 1000 2000 4000
Airb
orne
Sou
nd T
rans
mis
sion
Los
s, T
L, in
dB
Frequency, f, in Hz
STC 52

Client Report A1-006070.10 | Construction | Acoustics Laboratory
Page 121 of 168
ASTM E492 Test Results – Normalized Impact Sound Pressure Levels
Client: Nordic Engineered Wood Test ID: IIF-15-018
Specimen ID: A1-006070-23F Date of Test: March 25, 2015
Room Volume (m³) Air Temperature (°C) Humidity (%)
Upper 175.9 26.7 to 26.8 30.0 to 31.9 Area S of test specimen: 17.85 m2
Lower 177.1 17.7 to 17.8 36.6 to 37.3 Mass per unit area: 173 kg/m2
f (Hz)
NISPL (dB)
50 63
63 59
80 63
100 69
125 72
160 73
200 72
250 72
315 73
400 74
500 72
630 70
800 68
1000 65
1250 63
1600 62
2000 59
2500 56
3150 54
4000 55
5000 54
Impact Insulation
Class (IIC)
41
Sum of Positive Differences (dB)
26 Max. Positive Difference (dB)
4 dB at 400 Hz
For a description of the test specimen and mounting conditions see text pages before. The results in this report apply only to the specific sample submitted for measurement. No responsibility is assumed for performance of any other specimen. Measurements of normalized impact sound pressure level (NISPL) were conducted in accordance with the requirements of ASTM E492-09, “Standard Laboratory Measurement of Impact Sound Transmission through Floor-Ceiling Assemblies Using the Tapping Machine”. In the graph: The solid line is the measured normalized impact sound pressure level (NISPL) for this specimen. The dashed line is the IIC contour fitted to the measured values according to ASTM E989-06. The dotted line is the background sound level measured in the receiving room during this test (may be below the displayed range). For any frequency where measured NISPL is less than 10 dB above the dotted line, the reported values were adjusted as noted below. Bars at bottom of graph show positive differences; where the measured data are greater than the reference contour as defined in ASTM E989-06. Shaded cells in the table and areas in the graph are outside the IIC contour range. In the table: Values marked “c” indicate that the measured background level was between 5 dB and 10 dB below the combined receiving room level and background level. Values marked “*” indicate that the measured background level was less than 5 dB below the combined receiving room level and background level and the reported values of NISPL provide an estimate of the upper limit of normalized impact sound pressure level, according to the procedure outlined in ASTM E492-09. The reported values of NISPL have been corrected according to the procedure outlined in ASTM E492-09.
1 2
1 1 2
4 3
2 1
2 2 2 3
10
20
30
40
50
60
70
80
90
100
63 125 250 500 1000 2000 4000
Nor
mal
ized
Impa
ct S
ound
Pre
ssur
e Le
vel,
NIS
PL
in d
B
Frequency, f, in Hz
IIC 41

Client Report A1-006070.10 | Construction | Acoustics Laboratory
Page 122 of 168
Client Nordic Engineered Wood
1100 Ave des Canadiens-de-Montreal Montreal QC H3B 2S2
Specimen Laminate floating floor on a 2 mm closed cell foam on 38 mm (1-1/2”) precast concrete slab on 10 mm tar boards placed on top of a CLT 5 ply (175 mm).
Specimen ID A1-006070-24F
Construction Date: March 26, 2015
Specimen Description The specimen was composed of two cross-laminated timber (CLT) 5 ply (131 mm thick x 1989 mm wide x 4872 mm long) panels with a butt joint in the middle of the floor. The combined panels filled the entire floor opening of the test frame. The two CLT panels were joined using a 120 mm wide x 12 mm thick plywood strip spanning the full joint (4.9 m). The plywood strip was nailed with common nails 75 mm (3”) long spaced 305 mm (12”) on centre along the joint with beads of PL premium adhesive between the plywood strip and the CLT panels. The CLT floor was resting on the lip of the test frame and was not fastened to the test frame. The air gaps between the edges of the CLT floor and the test frame were filled with glass fiber insulation and covered with cloth tape. Duct putty was installed around the lower perimeter of the test frame and the CLT. Laminate floating floor (9 mm thick) was installed on top of a 2 mm Roberts® Soft Stride closed cell foam which was placed on top of a 38 mm (1-1/2”) precast concrete slab. The 38 mm precast concrete slab was placed on top of 10 mm tar boards which were placed on the CLT floor.
Cross-section of A1-006070-24F
Specimen Properties
Element Actual
thickness (mm)
Mass (kg) Mass/length, area or volume
9 mm Generic Engineered Floating Floor 9 172 8.6 kg/m2 2 mm Roberts® Soft Stride Closed Cell Foam 2 2.5 0.1 kg/m2 38 mm Precast Concrete Slab 38 2023 103.0 kg/m2 10 mm Tar Board (Building Products) 10 56 2.8 kg/m2 131 mm CLT 5-ply 131 1338 67.0 kg/m2 Total 190 3592 182 kg/m2
Test Specimen Installation
• The exposed area of the floor specimen used for the calculations of the airborne sound transmission loss was 17.85 m2 (4.71 m x 3.79 m).
• The total area of the floor assembly resting on top of the lip was 19.32 m2 (4.88 m x 3.96 m). • The mass per area of the elements above the lip was calculated using the total area (19.32 m2).

Client Report A1-006070.10 | Construction | Acoustics Laboratory
Page 123 of 168
This page was
intentionally
left blank
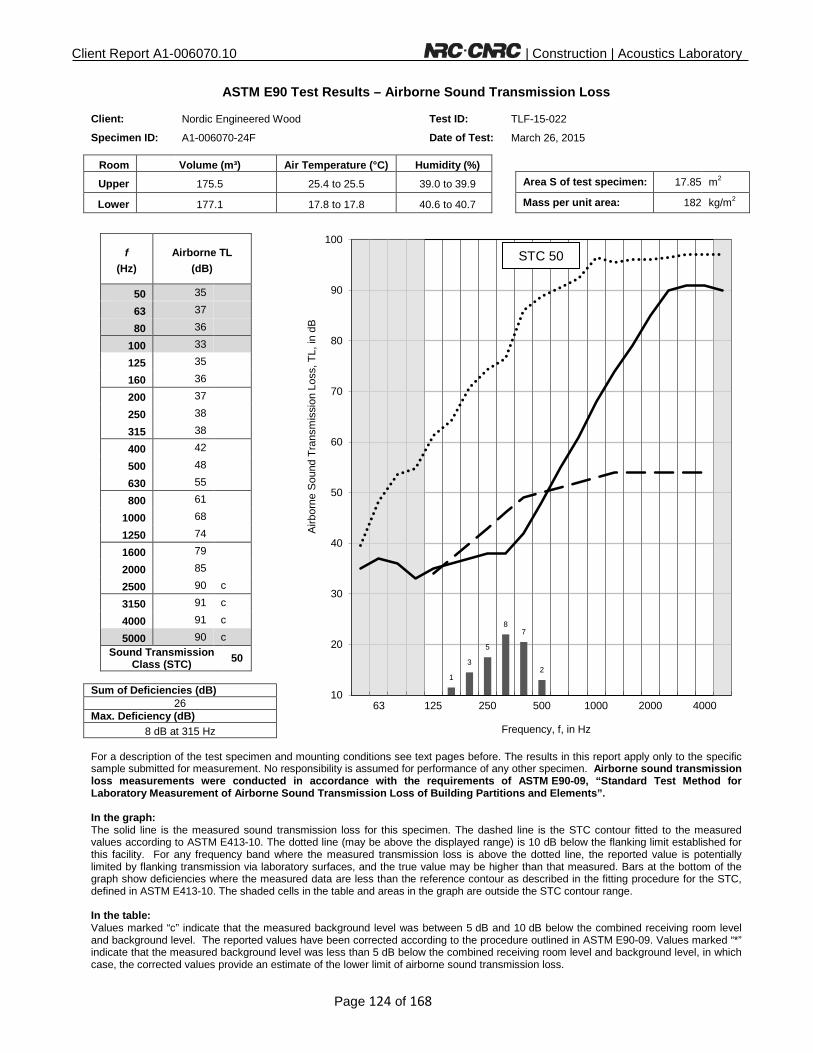
Client Report A1-006070.10 | Construction | Acoustics Laboratory
Page 124 of 168
ASTM E90 Test Results – Airborne Sound Transmission Loss
Client: Nordic Engineered Wood Test ID: TLF-15-022
Specimen ID: A1-006070-24F Date of Test: March 26, 2015
Room Volume (m³) Air Temperature (°C) Humidity (%)
Upper 175.5 25.4 to 25.5 39.0 to 39.9 Area S of test specimen: 17.85 m2
Lower 177.1 17.8 to 17.8 40.6 to 40.7 Mass per unit area: 182 kg/m2
f (Hz)
Airborne TL (dB)
50 35
63 37
80 36
100 33
125 35
160 36
200 37
250 38
315 38
400 42
500 48
630 55
800 61
1000 68
1250 74
1600 79
2000 85
2500 90 c
3150 91 c
4000 91 c
5000 90 c
Sound Transmission
Class (STC) 50
Sum of Deficiencies (dB)
26 Max. Deficiency (dB)
8 dB at 315 Hz
For a description of the test specimen and mounting conditions see text pages before. The results in this report apply only to the specific sample submitted for measurement. No responsibility is assumed for performance of any other specimen. Airborne sound transmission loss measurements were conducted in accordance with the requirements of ASTM E90-09, “Standard Test Method for Laboratory Measurement of Airborne Sound Transmission Loss of Building Partitions and Elements”. In the graph: The solid line is the measured sound transmission loss for this specimen. The dashed line is the STC contour fitted to the measured values according to ASTM E413-10. The dotted line (may be above the displayed range) is 10 dB below the flanking limit established for this facility. For any frequency band where the measured transmission loss is above the dotted line, the reported value is potentially limited by flanking transmission via laboratory surfaces, and the true value may be higher than that measured. Bars at the bottom of the graph show deficiencies where the measured data are less than the reference contour as described in the fitting procedure for the STC, defined in ASTM E413-10. The shaded cells in the table and areas in the graph are outside the STC contour range. In the table: Values marked “c” indicate that the measured background level was between 5 dB and 10 dB below the combined receiving room level and background level. The reported values have been corrected according to the procedure outlined in ASTM E90-09. Values marked “*” indicate that the measured background level was less than 5 dB below the combined receiving room level and background level, in which case, the corrected values provide an estimate of the lower limit of airborne sound transmission loss.
1
3
5
8 7
2
10
20
30
40
50
60
70
80
90
100
63 125 250 500 1000 2000 4000
Airb
orne
Sou
nd T
rans
mis
sion
Los
s, T
L, in
dB
Frequency, f, in Hz
STC 50

Client Report A1-006070.10 | Construction | Acoustics Laboratory
Page 125 of 168
ASTM E492 Test Results – Normalized Impact Sound Pressure Levels
Client: Nordic Engineered Wood Test ID: IIF-15-019
Specimen ID: A1-006070-24F Date of Test: March 26, 2015
Room Volume (m³) Air Temperature (°C) Humidity (%)
Upper 175.5 25.9 to 26.3 40.9 to 45.5 Area S of test specimen: 17.85 m2
Lower 177.1 17.8 to 17.9 40.4 to 40.5 Mass per unit area: 182 kg/m2
f (Hz)
NISPL (dB)
50 62
63 59
80 62
100 69
125 72
160 73
200 72
250 71
315 69
400 66
500 59
630 52
800 46
1000 38
1250 31
1600 25 c
2000 17 *
2500 13 *
3150 14 *
4000 15 *
5000 17 *
Impact Insulation
Class (IIC)
46
Sum of Positive Differences (dB)
31 Max. Positive Difference (dB)
7 dB at 160 Hz
For a description of the test specimen and mounting conditions see text pages before. The results in this report apply only to the specific sample submitted for measurement. No responsibility is assumed for performance of any other specimen. Measurements of normalized impact sound pressure level (NISPL) were conducted in accordance with the requirements of ASTM E492-09, “Standard Laboratory Measurement of Impact Sound Transmission through Floor-Ceiling Assemblies Using the Tapping Machine”. In the graph: The solid line is the measured normalized impact sound pressure level (NISPL) for this specimen. The dashed line is the IIC contour fitted to the measured values according to ASTM E989-06. The dotted line is the background sound level measured in the receiving room during this test (may be below the displayed range). For any frequency where measured NISPL is less than 10 dB above the dotted line, the reported values were adjusted as noted below. Bars at bottom of graph show positive differences; where the measured data are greater than the reference contour as defined in ASTM E989-06. Shaded cells in the table and areas in the graph are outside the IIC contour range. In the table: Values marked “c” indicate that the measured background level was between 5 dB and 10 dB below the combined receiving room level and background level. Values marked “*” indicate that the measured background level was less than 5 dB below the combined receiving room level and background level and the reported values of NISPL provide an estimate of the upper limit of normalized impact sound pressure level, according to the procedure outlined in ASTM E492-09. The reported values of NISPL have been corrected according to the procedure outlined in ASTM E492-09.
3
6 7
6 5
3
1
10
20
30
40
50
60
70
80
90
100
63 125 250 500 1000 2000 4000
Nor
mal
ized
Impa
ct S
ound
Pre
ssur
e Le
vel,
NIS
PL
in d
B
Frequency, f, in Hz
IIC 46

Client Report A1-006070.10 | Construction | Acoustics Laboratory
Page 126 of 168
Client Nordic Engineered Wood
1100 Ave des Canadiens-de-Montreal Montreal QC H3B 2S2
Specimen Laminate floating floor on 3 mm premium felt on 38 mm (1-1/2”) precast concrete slab on 9 mm closed cell foam placed on top of a CLT 5 ply (131 mm) with two layers of 13 mm Type C gypsum board installed on a hung ceiling grid.
Specimen ID A1-006070-25F
Construction Date: March 31, 2015 to April 2, 2015
Specimen Description The specimen was composed of two cross-laminated timber (CLT) 5 ply (131 mm thick x 1989 mm wide x 4872 mm long) panels with a butt joint in the middle of the floor. The combined panels filled the entire floor opening of the test frame. The two CLT panels were joined using a 120 mm wide x 12 mm thick plywood strip spanning the full joint (4.9 m). The plywood strip was nailed with common nails 75 mm (3”) long spaced 305 mm (12”) on centre along the joint with beads of PL premium adhesive between the plywood strip and the CLT panels. The CLT floor was resting on the lip of the test frame and was not fastened to the test frame. The air gaps between the edges of the CLT floor and the test frame were filled with glass fiber insulation and covered with cloth tape. Duct putty was installed around the lower perimeter of the test frame and the CLT. Laminate floating floor (9 mm thick) was installed on top of a 3 mm Acoustic-TechTM Premium Felt Membrane which was placed on top of a 38 mm (1-1/2”) precast concrete slab. The 38 mm precast concrete slab was placed on top of 10 mm tar boards which was placed on the CLT floor. For the hung ceiling, two layers of 13 mm (5/8”) Type C gypsum board were installed on 22 mm (7/8”) furring channels. The base layer of gypsum board was attached using 41 mm (1-5/8") long type S screws spaced 305 mm (12”) on centre on every furring channel. The face layer was staggered from the base later and attached using 50 mm (2") long type S screws spaced 305 mm (12”) on centre on every furring channel. The exposed gypsum board joints were caulked and taped. The furring channels were attached perpendicularly to the 38 mm (1-1/2”) C-channels at a spacing of 406 mm (16”) on centre with wire. The C-channels were attached to the CLT using standard ceiling wire and angles which were screwed into the CLT. The C-channels were spaced 1220 mm (4’) on centre and hung with a space of 145 mm (6”) from the top of the C-channels to the underside the CLT with 92 mm (3-5/8”) Owens Corning EcoTouch Fiberglas® Batts in the cavity. The total hung ceiling depth was 230 mm (9”).
Cross-section of A1-006070-25F
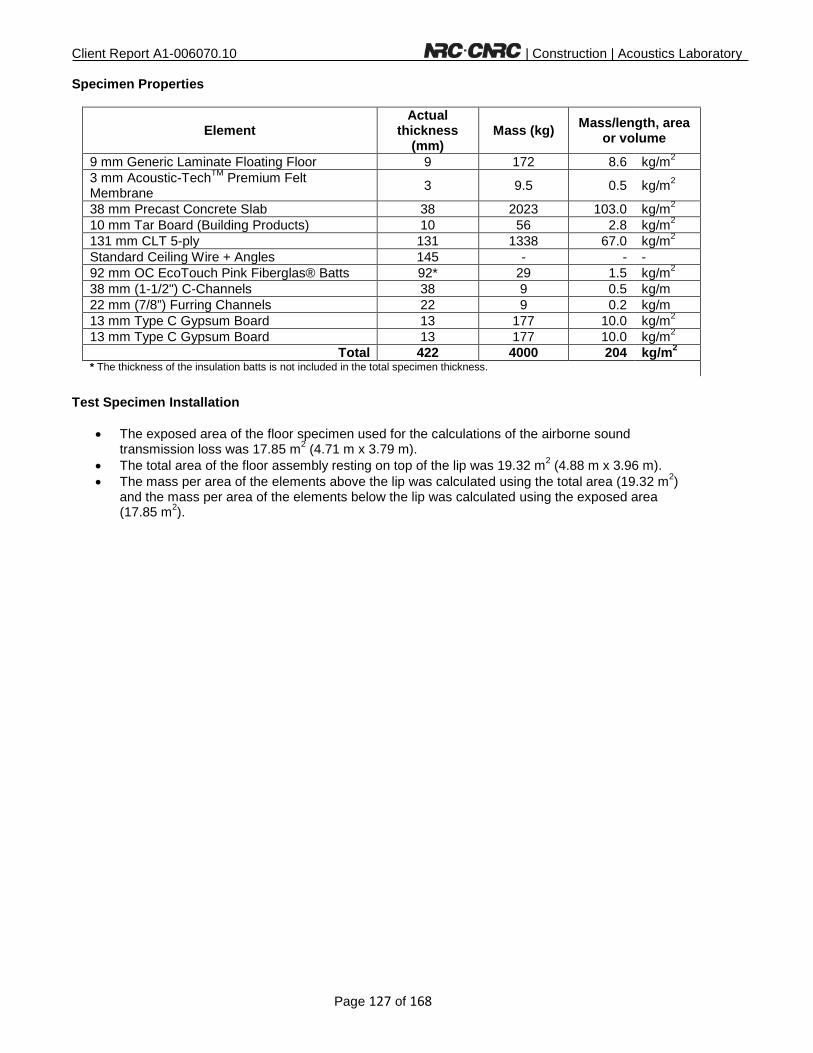
Client Report A1-006070.10 | Construction | Acoustics Laboratory
Page 127 of 168
Specimen Properties
Element Actual
thickness (mm)
Mass (kg) Mass/length, area or volume
9 mm Generic Laminate Floating Floor 9 172 8.6 kg/m2 3 mm Acoustic-TechTM Premium Felt
Membrane 3 9.5 0.5 kg/m2
38 mm Precast Concrete Slab 38 2023 103.0 kg/m2 10 mm Tar Board (Building Products) 10 56 2.8 kg/m2 131 mm CLT 5-ply 131 1338 67.0 kg/m2 Standard Ceiling Wire + Angles 145 - - - 92 mm OC EcoTouch Pink Fiberglas® Batts 92* 29 1.5 kg/m2 38 mm (1-1/2") C-Channels 38 9 0.5 kg/m 22 mm (7/8”) Furring Channels 22 9 0.2 kg/m 13 mm Type C Gypsum Board 13 177 10.0 kg/m2 13 mm Type C Gypsum Board 13 177 10.0 kg/m2 Total 422 4000 204 kg/m2 * The thickness of the insulation batts is not included in the total specimen thickness.
Test Specimen Installation
• The exposed area of the floor specimen used for the calculations of the airborne sound transmission loss was 17.85 m2 (4.71 m x 3.79 m).
• The total area of the floor assembly resting on top of the lip was 19.32 m2 (4.88 m x 3.96 m). • The mass per area of the elements above the lip was calculated using the total area (19.32 m2)
and the mass per area of the elements below the lip was calculated using the exposed area (17.85 m2).

Client Report A1-006070.10 | Construction | Acoustics Laboratory
Page 128 of 168
ASTM E90 Test Results – Airborne Sound Transmission Loss
Client: Nordic Engineered Wood Test ID: TLF-15-024
Specimen ID: A1-006070-25F Date of Test: April 7, 2015
Room Volume (m³) Air Temperature (°C) Humidity (%)
Upper 175.5 20.6 to 20.7 35.0 to 35.1 Area S of test specimen: 17.85 m2
Lower 173.0 17.6 to 17.6 40.3 to 40.4 Mass per unit area: 204 kg/m2
f (Hz)
Airborne TL (dB)
50 36
63 44
80 47
100 48
125 53
160 57
200 61
250 64
315 66
400 71
500 76 c
630 82
800 89 c
1000 93 *
1250 92 *
1600 96 *
2000 96 *
2500 95 *
3150 97 *
4000 95 *
5000 91 c
Sound Transmission
Class (STC) 75
Sum of Deficiencies (dB)
27 Max. Deficiency (dB)
6 dB at 125 Hz
For a description of the test specimen and mounting conditions see text pages before. The results in this report apply only to the specific sample submitted for measurement. No responsibility is assumed for performance of any other specimen. Airborne sound transmission loss measurements were conducted in accordance with the requirements of ASTM E90-09, “Standard Test Method for Laboratory Measurement of Airborne Sound Transmission Loss of Building Partitions and Elements”. In the graph: The solid line is the measured sound transmission loss for this specimen. The dashed line is the STC contour fitted to the measured values according to ASTM E413-10. The dotted line (may be above the displayed range) is 10 dB below the flanking limit established for this facility. For any frequency band where the measured transmission loss is above the dotted line, the reported value is potentially limited by flanking transmission via laboratory surfaces, and the true value may be higher than that measured. Bars at the bottom of the graph show deficiencies where the measured data are less than the reference contour as described in the fitting procedure for the STC, defined in ASTM E413-10. The shaded cells in the table and areas in the graph are outside the STC contour range. In the table: Values marked “c” indicate that the measured background level was between 5 dB and 10 dB below the combined receiving room level and background level. The reported values have been corrected according to the procedure outlined in ASTM E90-09. Values marked “*” indicate that the measured background level was less than 5 dB below the combined receiving room level and background level, in which case, the corrected values provide an estimate of the lower limit of airborne sound transmission loss.
6 5
4 4 5
3
10
20
30
40
50
60
70
80
90
100
63 125 250 500 1000 2000 4000
Airb
orne
Sou
nd T
rans
mis
sion
Los
s, T
L, in
dB
Frequency, f, in Hz
STC 75

Client Report A1-006070.10 | Construction | Acoustics Laboratory
Page 129 of 168
ASTM E492 Test Results – Normalized Impact Sound Pressure Levels
Client: Nordic Engineered Wood Test ID: IIF-15-020
Specimen ID: A1-006070-25F Date of Test: April 7, 2015
Room Volume (m³) Air Temperature (°C) Humidity (%)
Upper 175.5 20.7 to 21.0 33.5 to 34.6 Area S of test specimen: 17.85 m2
Lower 173.0 17.6 to 17.7 40.3 to 40.4 Mass per unit area: 204 kg/m2
f (Hz)
NISPL (dB)
50 54
63 51
80 51
100 53
125 54
160 52
200 48
250 47
315 45
400 38
500 30
630 23
800 19 c
1000 9 *
1250 8 *
1600 9 *
2000 11 *
2500 12 *
3150 13 *
4000 15 *
5000 17 *
Impact Insulation
Class (IIC)
66
Sum of Positive Differences (dB)
24 Max. Positive Difference (dB)
8 dB at 125 Hz
For a description of the test specimen and mounting conditions see text pages before. The results in this report apply only to the specific sample submitted for measurement. No responsibility is assumed for performance of any other specimen. Measurements of normalized impact sound pressure level (NISPL) were conducted in accordance with the requirements of ASTM E492-09, “Standard Laboratory Measurement of Impact Sound Transmission through Floor-Ceiling Assemblies Using the Tapping Machine”. In the graph: The solid line is the measured normalized impact sound pressure level (NISPL) for this specimen. The dashed line is the IIC contour fitted to the measured values according to ASTM E989-06. The dotted line is the background sound level measured in the receiving room during this test (may be below the displayed range). For any frequency where measured NISPL is less than 10 dB above the dotted line, the reported values were adjusted as noted below. Bars at bottom of graph show positive differences; where the measured data are greater than the reference contour as defined in ASTM E989-06. Shaded cells in the table and areas in the graph are outside the IIC contour range. In the table: Values marked “c” indicate that the measured background level was between 5 dB and 10 dB below the combined receiving room level and background level. Values marked “*” indicate that the measured background level was less than 5 dB below the combined receiving room level and background level and the reported values of NISPL provide an estimate of the upper limit of normalized impact sound pressure level, according to the procedure outlined in ASTM E492-09. The reported values of NISPL have been corrected according to the procedure outlined in ASTM E492-09.
7 8
6
2 1
0
10
20
30
40
50
60
70
80
90
63 125 250 500 1000 2000 4000
Nor
mal
ized
Impa
ct S
ound
Pre
ssur
e Le
vel,
NIS
PL
in d
B
Frequency, f, in Hz
IIC 66
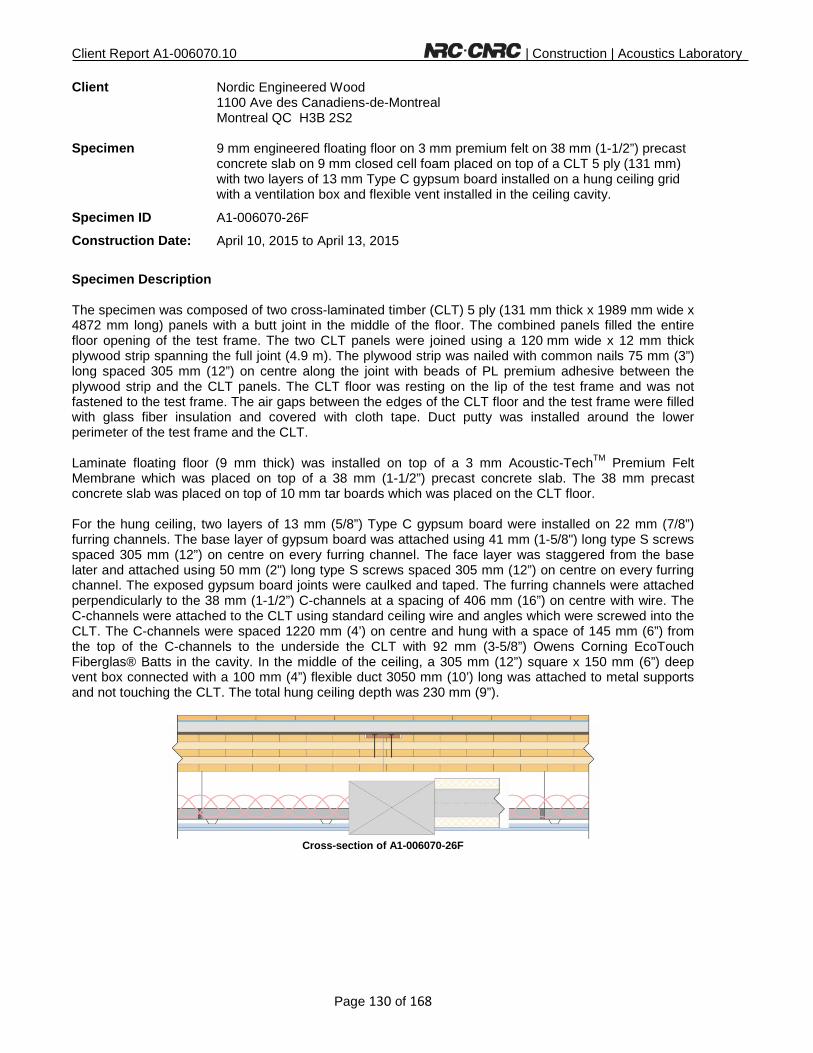
Client Report A1-006070.10 | Construction | Acoustics Laboratory
Page 130 of 168
Client Nordic Engineered Wood
1100 Ave des Canadiens-de-Montreal Montreal QC H3B 2S2
Specimen 9 mm engineered floating floor on 3 mm premium felt on 38 mm (1-1/2”) precast concrete slab on 9 mm closed cell foam placed on top of a CLT 5 ply (131 mm) with two layers of 13 mm Type C gypsum board installed on a hung ceiling grid with a ventilation box and flexible vent installed in the ceiling cavity.
Specimen ID A1-006070-26F
Construction Date: April 10, 2015 to April 13, 2015
Specimen Description The specimen was composed of two cross-laminated timber (CLT) 5 ply (131 mm thick x 1989 mm wide x 4872 mm long) panels with a butt joint in the middle of the floor. The combined panels filled the entire floor opening of the test frame. The two CLT panels were joined using a 120 mm wide x 12 mm thick plywood strip spanning the full joint (4.9 m). The plywood strip was nailed with common nails 75 mm (3”) long spaced 305 mm (12”) on centre along the joint with beads of PL premium adhesive between the plywood strip and the CLT panels. The CLT floor was resting on the lip of the test frame and was not fastened to the test frame. The air gaps between the edges of the CLT floor and the test frame were filled with glass fiber insulation and covered with cloth tape. Duct putty was installed around the lower perimeter of the test frame and the CLT. Laminate floating floor (9 mm thick) was installed on top of a 3 mm Acoustic-TechTM Premium Felt Membrane which was placed on top of a 38 mm (1-1/2”) precast concrete slab. The 38 mm precast concrete slab was placed on top of 10 mm tar boards which was placed on the CLT floor. For the hung ceiling, two layers of 13 mm (5/8”) Type C gypsum board were installed on 22 mm (7/8”) furring channels. The base layer of gypsum board was attached using 41 mm (1-5/8") long type S screws spaced 305 mm (12”) on centre on every furring channel. The face layer was staggered from the base later and attached using 50 mm (2") long type S screws spaced 305 mm (12”) on centre on every furring channel. The exposed gypsum board joints were caulked and taped. The furring channels were attached perpendicularly to the 38 mm (1-1/2”) C-channels at a spacing of 406 mm (16”) on centre with wire. The C-channels were attached to the CLT using standard ceiling wire and angles which were screwed into the CLT. The C-channels were spaced 1220 mm (4’) on centre and hung with a space of 145 mm (6”) from the top of the C-channels to the underside the CLT with 92 mm (3-5/8”) Owens Corning EcoTouch Fiberglas® Batts in the cavity. In the middle of the ceiling, a 305 mm (12”) square x 150 mm (6”) deep vent box connected with a 100 mm (4”) flexible duct 3050 mm (10’) long was attached to metal supports and not touching the CLT. The total hung ceiling depth was 230 mm (9”).
Cross-section of A1-006070-26F

Client Report A1-006070.10 | Construction | Acoustics Laboratory
Page 131 of 168
Specimen Properties
Element Actual
thickness (mm)
Mass (kg) Mass/length, area or volume
9 mm Generic Laminate Floating Floor 9 172 8.6 kg/m2 3 mm Acoustic-TechTM Premium Felt
Membrane 3 9.5 0.5 kg/m2
38 mm Precast Concrete Slab 38 2023 103.0 kg/m2 10 mm Tar Board (Building Products) 10 56 2.8 kg/m2 131 mm CLT 5-ply 131 1338 67.0 kg/m2 Standard Ceiling Wire + Angles 145 - - - 92 mm OC EcoTouch Pink Fiberglas® Batts 92* 29 1.5 kg/m2 38 mm (1-1/2") C-Channels 38 9 0.5 kg/m 22 mm (7/8”) Furring Channels 22 9 0.2 kg/m 305 mm Square x 150 mm Deep Vent Box 150* 2 2.0 kg/ea 100 mm Interior Diameter Flexible Insulated
Duct 150* 1 0.3 kg/m
13 mm Type C Gypsum Board 13 177 10.0 kg/m2 13 mm Type C Gypsum Board 13 177 10.0 kg/m2 Total 422 4003 204 kg/m2 * The thickness of the insulation batts, vent box and flexible vent are not included in the total specimen thickness.
Test Specimen Installation
• The exposed area of the floor specimen used for the calculations of the airborne sound transmission loss was 17.85 m2 (4.71 m x 3.79 m).
• The total area of the floor assembly resting on top of the lip was 19.32 m2 (4.88 m x 3.96 m). • The mass per area of the elements above the lip was calculated using the total area (19.32 m2)
and the mass per area of the elements below the lip was calculated using the exposed area (17.85 m2).

Client Report A1-006070.10 | Construction | Acoustics Laboratory
Page 132 of 168
ASTM E90 Test Results – Airborne Sound Transmission Loss
Client: Nordic Engineered Wood Test ID: TLF-15-025
Specimen ID: A1-006070-26F Date of Test: April 13, 2015
Room Volume (m³) Air Temperature (°C) Humidity (%)
Upper 175.5 20.8 to 21.0 33.3 to 33.6 Area S of test specimen: 17.85 m2
Lower 173.0 17.8 to 17.9 35.4 to 35.5 Mass per unit area: 204 kg/m2
f (Hz)
Airborne TL (dB)
50 37
63 45
80 47
100 49
125 53
160 56
200 60
250 63
315 65
400 71
500 76
630 82
800 88 c
1000 93 c
1250 92 c
1600 96 *
2000 96 *
2500 96 *
3150 97 *
4000 95 *
5000 91 c
Sound Transmission
Class (STC) 75
Sum of Deficiencies (dB)
31 Max. Deficiency (dB)
6 dB at 125, 160 and 315 Hz
For a description of the test specimen and mounting conditions see text pages before. The results in this report apply only to the specific sample submitted for measurement. No responsibility is assumed for performance of any other specimen. Airborne sound transmission loss measurements were conducted in accordance with the requirements of ASTM E90-09, “Standard Test Method for Laboratory Measurement of Airborne Sound Transmission Loss of Building Partitions and Elements”. In the graph: The solid line is the measured sound transmission loss for this specimen. The dashed line is the STC contour fitted to the measured values according to ASTM E413-10. The dotted line (may be above the displayed range) is 10 dB below the flanking limit established for this facility. For any frequency band where the measured transmission loss is above the dotted line, the reported value is potentially limited by flanking transmission via laboratory surfaces, and the true value may be higher than that measured. Bars at the bottom of the graph show deficiencies where the measured data are less than the reference contour as described in the fitting procedure for the STC, defined in ASTM E413-10. The shaded cells in the table and areas in the graph are outside the STC contour range. In the table: Values marked “c” indicate that the measured background level was between 5 dB and 10 dB below the combined receiving room level and background level. The reported values have been corrected according to the procedure outlined in ASTM E90-09. Values marked “*” indicate that the measured background level was less than 5 dB below the combined receiving room level and background level, in which case, the corrected values provide an estimate of the lower limit of airborne sound transmission loss.
6 6 5 5
6
3
10
20
30
40
50
60
70
80
90
100
63 125 250 500 1000 2000 4000
Airb
orne
Sou
nd T
rans
mis
sion
Los
s, T
L, in
dB
Frequency, f, in Hz
STC 75

Client Report A1-006070.10 | Construction | Acoustics Laboratory
Page 133 of 168
ASTM E492 Test Results – Normalized Impact Sound Pressure Levels
Client: Nordic Engineered Wood Test ID: IIF-15-022
Specimen ID: A1-006070-26F Date of Test: April 15, 2015
Room Volume (m³) Air Temperature (°C) Humidity (%)
Upper 175.5 24.6 to 24.9 21.3 to 26.9 Area S of test specimen: 17.85 m2
Lower 173.0 18.8 to 18.8 37.3 to 37.4 Mass per unit area: 204 kg/m2
f (Hz)
NISPL (dB)
50 54
63 52
80 51
100 53
125 55
160 53
200 49
250 49
315 46
400 38
500 30
630 24
800 19 c
1000 9 *
1250 8 *
1600 10 *
2000 11 *
2500 12 *
3150 14 *
4000 15 *
5000 17 *
Impact Insulation
Class (IIC)
65
Sum of Positive Differences (dB)
24 Max. Positive Difference (dB)
8 dB at 125 Hz
For a description of the test specimen and mounting conditions see text pages before. The results in this report apply only to the specific sample submitted for measurement. No responsibility is assumed for performance of any other specimen. Measurements of normalized impact sound pressure level (NISPL) were conducted in accordance with the requirements of ASTM E492-09, “Standard Laboratory Measurement of Impact Sound Transmission through Floor-Ceiling Assemblies Using the Tapping Machine”. In the graph: The solid line is the measured normalized impact sound pressure level (NISPL) for this specimen. The dashed line is the IIC contour fitted to the measured values according to ASTM E989-06. The dotted line is the background sound level measured in the receiving room during this test (may be below the displayed range). For any frequency where measured NISPL is less than 10 dB above the dotted line, the reported values were adjusted as noted below. Bars at bottom of graph show positive differences; where the measured data are greater than the reference contour as defined in ASTM E989-06. Shaded cells in the table and areas in the graph are outside the IIC contour range. In the table: Values marked “c” indicate that the measured background level was between 5 dB and 10 dB below the combined receiving room level and background level. Values marked “*” indicate that the measured background level was less than 5 dB below the combined receiving room level and background level and the reported values of NISPL provide an estimate of the upper limit of normalized impact sound pressure level, according to the procedure outlined in ASTM E492-09. The reported values of NISPL have been corrected according to the procedure outlined in ASTM E492-09.
6
8
6
2 2
0
10
20
30
40
50
60
70
80
90
63 125 250 500 1000 2000 4000
Nor
mal
ized
Impa
ct S
ound
Pre
ssur
e Le
vel,
NIS
PL
in d
B
Frequency, f, in Hz
IIC 65

Client Report A1-006070.10 | Construction | Acoustics Laboratory
Page 134 of 168
Client Nordic Engineered Wood
1100 Ave des Canadiens-de-Montreal Montreal QC H3B 2S2
Specimen Laminate floating floor on 3 mm rubber membrane on 38 mm (1-1/2”) precast concrete slab on 9 mm closed cell foam placed on top of a CLT 5 ply (131 mm) with two layers of 13 mm Type C gypsum board installed on a hung ceiling grid with a ventilation box and flexible vent installed in the ceiling cavity.
Specimen ID A1-006070-27F
Construction Date: April 15, 2015
Specimen Description The specimen was composed of two cross-laminated timber (CLT) 5 ply (131 mm thick x 1989 mm wide x 4872 mm long) panels with a butt joint in the middle of the floor. The combined panels filled the entire floor opening of the test frame. The two CLT panels were joined using a 120 mm wide x 12 mm thick plywood strip spanning the full joint (4.9 m). The plywood strip was nailed with common nails 75 mm (3”) long spaced 305 mm (12”) on centre along the joint with beads of PL premium adhesive between the plywood strip and the CLT panels. The CLT floor was resting on the lip of the test frame and was not fastened to the test frame. The air gaps between the edges of the CLT floor and the test frame were filled with glass fiber insulation and covered with cloth tape. Duct putty was installed around the lower perimeter of the test frame and the CLT. Laminate floating floor (9 mm thick) was installed installed on top of a 3 mm Insonobois rubber membrane which was placed on top of a 38 mm (1-1/2”) precast concrete slab. The 38 mm precast concrete slab was placed on top of 10 mm tar boards which was placed on the CLT floor. For the hung ceiling, two layers of 13 mm (5/8”) Type C gypsum board were installed on 22 mm (7/8”) furring channels. The base layer of gypsum board was attached using 41 mm (1-5/8") long type S screws spaced 305 mm (12”) on centre on every furring channel. The face layer was staggered from the base later and attached using 50 mm (2") long type S screws spaced 305 mm (12”) on centre on every furring channel. The exposed gypsum board joints were caulked and taped. The furring channels were attached perpendicularly to the 38 mm (1-1/2”) C-channels at a spacing of 406 mm (16”) on centre with wire. The C-channels were attached to the CLT using standard ceiling wire and angles which were screwed into the CLT. The C-channels were spaced 1220 mm (4’) on centre and hung with a space of 145 mm (6”) from the top of the C-channels to the underside the CLT with 92 mm (3-5/8”) Owens Corning EcoTouch Fiberglas® Batts in the cavity. In the middle of the ceiling, a 305 mm (12”) square x 150 mm (6”) deep vent box connected with a 100 mm (4”) flexible duct 3050 mm (10’) long was attached to metal supports and not touching the CLT. The total hung ceiling depth was 230 mm (9”).
Cross-section of A1-006070-27F

Client Report A1-006070.10 | Construction | Acoustics Laboratory
Page 135 of 168
Specimen Properties
Element Actual
thickness (mm)
Mass (kg) Mass/length, area or volume
9 mm Generic Laminate Floating Floor 9 172 8.6 kg/m2 3 mm Insonobois Rubber Membrane 3 36 1.8 kg/m2 38 mm Precast Concrete Slab 38 2023 103.0 kg/m2 10 mm Tar Board (Building Products) 10 56 2.8 kg/m2 131 mm CLT 5-ply 131 1338 67.0 kg/m2 Standard Ceiling Wire + Angles 145 - - - 92 mm OC EcoTouch Pink Fiberglas® Batts 92* 29 1.5 kg/m2 38 mm (1-1/2") C-Channels 38 9 0.5 kg/m 22 mm (7/8”) Furring Channels 22 9 0.2 kg/m 305 mm Square x 150 mm Deep Vent Box 150* 2 2.0 kg/ea 100 mm Interior Diameter Flexible Insulated
Duct 150* 1 0.3 kg/m
13 mm Type C Gypsum Board 13 177 10.0 kg/m2 13 mm Type C Gypsum Board 13 177 10.0 kg/m2 Total 422 4029 206 kg/m2
Test Specimen Installation
• The exposed area of the floor specimen used for the calculations of the airborne sound transmission loss was 17.85 m2 (4.71 m x 3.79 m).
• The total area of the floor assembly resting on top of the lip was 19.32 m2 (4.88 m x 3.96 m). • The mass per area of the elements above the lip was calculated using the total area (19.32 m2)
and the mass per area of the elements below the lip was calculated using the exposed area (17.85 m2).
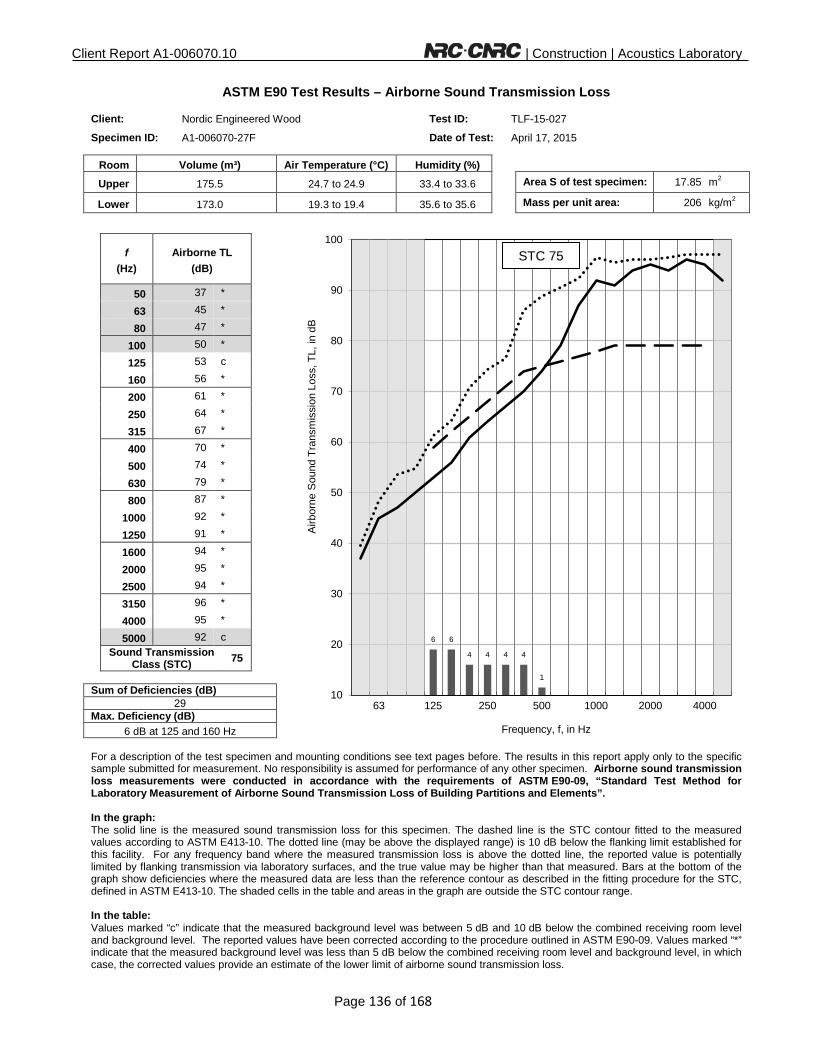
Client Report A1-006070.10 | Construction | Acoustics Laboratory
Page 136 of 168
ASTM E90 Test Results – Airborne Sound Transmission Loss
Client: Nordic Engineered Wood Test ID: TLF-15-027
Specimen ID: A1-006070-27F Date of Test: April 17, 2015
Room Volume (m³) Air Temperature (°C) Humidity (%)
Upper 175.5 24.7 to 24.9 33.4 to 33.6 Area S of test specimen: 17.85 m2
Lower 173.0 19.3 to 19.4 35.6 to 35.6 Mass per unit area: 206 kg/m2
f (Hz)
Airborne TL (dB)
50 37 *
63 45 *
80 47 *
100 50 *
125 53 c
160 56 *
200 61 *
250 64 *
315 67 *
400 70 *
500 74 *
630 79 *
800 87 *
1000 92 *
1250 91 *
1600 94 *
2000 95 *
2500 94 *
3150 96 *
4000 95 *
5000 92 c
Sound Transmission
Class (STC) 75
Sum of Deficiencies (dB)
29 Max. Deficiency (dB)
6 dB at 125 and 160 Hz
For a description of the test specimen and mounting conditions see text pages before. The results in this report apply only to the specific sample submitted for measurement. No responsibility is assumed for performance of any other specimen. Airborne sound transmission loss measurements were conducted in accordance with the requirements of ASTM E90-09, “Standard Test Method for Laboratory Measurement of Airborne Sound Transmission Loss of Building Partitions and Elements”. In the graph: The solid line is the measured sound transmission loss for this specimen. The dashed line is the STC contour fitted to the measured values according to ASTM E413-10. The dotted line (may be above the displayed range) is 10 dB below the flanking limit established for this facility. For any frequency band where the measured transmission loss is above the dotted line, the reported value is potentially limited by flanking transmission via laboratory surfaces, and the true value may be higher than that measured. Bars at the bottom of the graph show deficiencies where the measured data are less than the reference contour as described in the fitting procedure for the STC, defined in ASTM E413-10. The shaded cells in the table and areas in the graph are outside the STC contour range. In the table: Values marked “c” indicate that the measured background level was between 5 dB and 10 dB below the combined receiving room level and background level. The reported values have been corrected according to the procedure outlined in ASTM E90-09. Values marked “*” indicate that the measured background level was less than 5 dB below the combined receiving room level and background level, in which case, the corrected values provide an estimate of the lower limit of airborne sound transmission loss.
6 6
4 4 4 4
1
10
20
30
40
50
60
70
80
90
100
63 125 250 500 1000 2000 4000
Airb
orne
Sou
nd T
rans
mis
sion
Los
s, T
L, in
dB
Frequency, f, in Hz
STC 75

Client Report A1-006070.10 | Construction | Acoustics Laboratory
Page 137 of 168
ASTM E492 Test Results – Normalized Impact Sound Pressure Levels
Client: Nordic Engineered Wood Test ID: IIF-15-023
Specimen ID: A1-006070-27F Date of Test: April 16, 2015
Room Volume (m³) Air Temperature (°C) Humidity (%)
Upper 175.5 23.6 to 23.7 30.3 to 31.6 Area S of test specimen: 17.85 m2
Lower 173.0 19.2 to 19.4 32.5 to 33.7 Mass per unit area: 206 kg/m2
f (Hz)
NISPL (dB)
50 51
63 50
80 48
100 51
125 53
160 51
200 47
250 45
315 43
400 37
500 31
630 24
800 17 c
1000 9 *
1250 8 *
1600 9 *
2000 11 *
2500 12 *
3150 14 *
4000 15 *
5000 17 *
Impact Insulation
Class (IIC)
67
Sum of Positive Differences (dB)
22 Max. Positive Difference (dB)
8 dB at 125 Hz
For a description of the test specimen and mounting conditions see text pages before. The results in this report apply only to the specific sample submitted for measurement. No responsibility is assumed for performance of any other specimen. Measurements of normalized impact sound pressure level (NISPL) were conducted in accordance with the requirements of ASTM E492-09, “Standard Laboratory Measurement of Impact Sound Transmission through Floor-Ceiling Assemblies Using the Tapping Machine”. In the graph: The solid line is the measured normalized impact sound pressure level (NISPL) for this specimen. The dashed line is the IIC contour fitted to the measured values according to ASTM E989-06. The dotted line is the background sound level measured in the receiving room during this test (may be below the displayed range). For any frequency where measured NISPL is less than 10 dB above the dotted line, the reported values were adjusted as noted below. Bars at bottom of graph show positive differences; where the measured data are greater than the reference contour as defined in ASTM E989-06. Shaded cells in the table and areas in the graph are outside the IIC contour range. In the table: Values marked “c” indicate that the measured background level was between 5 dB and 10 dB below the combined receiving room level and background level. Values marked “*” indicate that the measured background level was less than 5 dB below the combined receiving room level and background level and the reported values of NISPL provide an estimate of the upper limit of normalized impact sound pressure level, according to the procedure outlined in ASTM E492-09. The reported values of NISPL have been corrected according to the procedure outlined in ASTM E492-09.
6
8
6
2
0
10
20
30
40
50
60
70
80
90
63 125 250 500 1000 2000 4000
Nor
mal
ized
Impa
ct S
ound
Pre
ssur
e Le
vel,
NIS
PL
in d
B
Frequency, f, in Hz
IIC 67

Client Report A1-006070.10 | Construction | Acoustics Laboratory
Page 138 of 168
Client Nordic Engineered Wood
1100 Ave des Canadiens-de-Montreal Montreal QC H3B 2S2
Specimen 50 mm (2”) normal strength concrete poured on 10 mm tar boards placed on top of a CLT 5 ply (131 mm).
Specimen ID A1-006070-28F
Construction Date: April 28, 2015 to May 26, 2015
Specimen Description The specimen was composed of two cross-laminated timber (CLT) 5 ply (131 mm thick x 1989 mm wide x 4872 mm long) panels with a butt joint in the middle of the floor. The combined panels filled the entire floor opening of the test frame. The two CLT panels were joined using a 120 mm wide x 12 mm thick plywood strip spanning the full joint (4.9 m). The plywood strip was nailed with common nails 75 mm (3”) long spaced 305 mm (12”) on centre along the joint with beads of PL premium adhesive between the plywood strip and the CLT panels. The CLT floor was resting on the lip of the test frame and was not fastened to the test frame. The air gaps between the edges of the CLT floor and the test frame were filled with glass fiber insulation and covered with cloth tape. Duct putty was installed around the lower perimeter of the test frame and the CLT. 50 mm (2”) normal strength concrete was poured on a 0.1 mm (4 mils) polyethylene sheeting on top of 10 mm tar boards which were placed on the CLT floor.
Cross-section of A1-006070-28F
Specimen Properties
Element Actual
thickness (mm)
Mass (kg) Mass/length, area or volume
50 mm Poured Concrete 50 2376 119.0 kg/m2 10 mm Tar Board (Building Products) 10 56 2.8 kg/m2 131 mm CLT 5-ply 131 1338 67.0 kg/m2 Total 191 3770 189 kg/m2
Test Specimen Installation
• The exposed area of the floor specimen used for the calculations of the airborne sound transmission loss was 17.85 m2 (4.71 m x 3.79 m).
• The total area of the floor assembly resting on top of the lip was 19.32 m2 (4.88 m x 3.96 m). • The mass per area of the elements above the lip was calculated using the total area (19.32 m2).

Client Report A1-006070.10 | Construction | Acoustics Laboratory
Page 139 of 168
This page was
intentionally
left blank

Client Report A1-006070.10 | Construction | Acoustics Laboratory
Page 140 of 168
ASTM E90 Test Results – Airborne Sound Transmission Loss
Client: Nordic Engineered Wood Test ID: TLF-15-039
Specimen ID: A1-006070-28F Date of Test: May 27, 2015
Room Volume (m³) Air Temperature (°C) Humidity (%)
Upper 175.8 23.5 to 23.7 55.1 to 56.0 Area S of test specimen: 17.85 m2
Lower 177.1 19.5 to 19.6 53.3 to 54.0 Mass per unit area: 189 kg/m2
f (Hz)
Airborne TL (dB)
50 33
63 37
80 37
100 35
125 36
160 37
200 37
250 38
315 39
400 38
500 42
630 47
800 51
1000 56
1250 61
1600 67
2000 74
2500 82
3150 85
4000 86
5000 84
Sound Transmission
Class (STC) 47
Sum of Deficiencies (dB)
20 Max. Deficiency (dB)
8 dB at 400 Hz
For a description of the test specimen and mounting conditions see text pages before. The results in this report apply only to the specific sample submitted for measurement. No responsibility is assumed for performance of any other specimen. Airborne sound transmission loss measurements were conducted in accordance with the requirements of ASTM E90-09, “Standard Test Method for Laboratory Measurement of Airborne Sound Transmission Loss of Building Partitions and Elements”. In the graph: The solid line is the measured sound transmission loss for this specimen. The dashed line is the STC contour fitted to the measured values according to ASTM E413-10. The dotted line (may be above the displayed range) is 10 dB below the flanking limit established for this facility. For any frequency band where the measured transmission loss is above the dotted line, the reported value is potentially limited by flanking transmission via laboratory surfaces, and the true value may be higher than that measured. Bars at the bottom of the graph show deficiencies where the measured data are less than the reference contour as described in the fitting procedure for the STC, defined in ASTM E413-10. The shaded cells in the table and areas in the graph are outside the STC contour range. In the table: Values marked “c” indicate that the measured background level was between 5 dB and 10 dB below the combined receiving room level and background level. The reported values have been corrected according to the procedure outlined in ASTM E90-09. Values marked “*” indicate that the measured background level was less than 5 dB below the combined receiving room level and background level, in which case, the corrected values provide an estimate of the lower limit of airborne sound transmission loss.
2
4
8
5
1
10
20
30
40
50
60
70
80
90
100
63 125 250 500 1000 2000 4000
Airb
orne
Sou
nd T
rans
mis
sion
Los
s, T
L, in
dB
Frequency, f, in Hz
STC 47
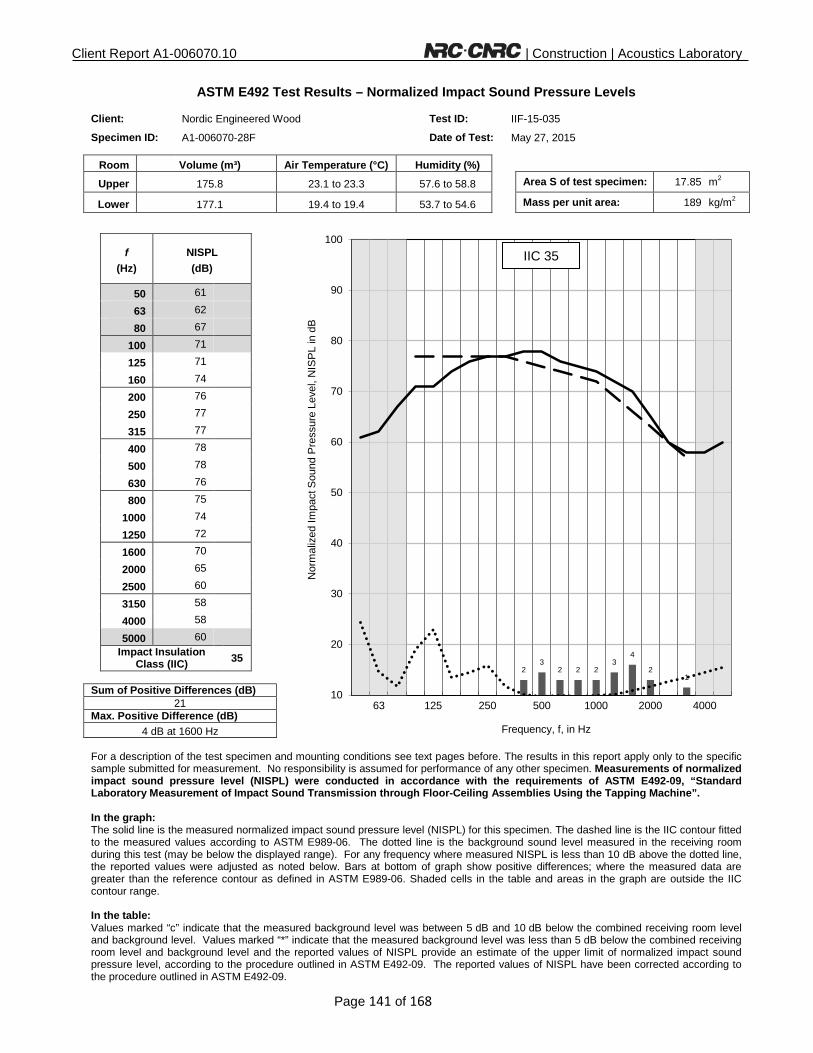
Client Report A1-006070.10 | Construction | Acoustics Laboratory
Page 141 of 168
ASTM E492 Test Results – Normalized Impact Sound Pressure Levels
Client: Nordic Engineered Wood Test ID: IIF-15-035
Specimen ID: A1-006070-28F Date of Test: May 27, 2015
Room Volume (m³) Air Temperature (°C) Humidity (%)
Upper 175.8 23.1 to 23.3 57.6 to 58.8 Area S of test specimen: 17.85 m2
Lower 177.1 19.4 to 19.4 53.7 to 54.6 Mass per unit area: 189 kg/m2
f (Hz)
NISPL (dB)
50 61
63 62
80 67
100 71
125 71
160 74
200 76
250 77
315 77
400 78
500 78
630 76
800 75
1000 74
1250 72
1600 70
2000 65
2500 60
3150 58
4000 58
5000 60
Impact Insulation
Class (IIC)
35
Sum of Positive Differences (dB)
21 Max. Positive Difference (dB)
4 dB at 1600 Hz
For a description of the test specimen and mounting conditions see text pages before. The results in this report apply only to the specific sample submitted for measurement. No responsibility is assumed for performance of any other specimen. Measurements of normalized impact sound pressure level (NISPL) were conducted in accordance with the requirements of ASTM E492-09, “Standard Laboratory Measurement of Impact Sound Transmission through Floor-Ceiling Assemblies Using the Tapping Machine”. In the graph: The solid line is the measured normalized impact sound pressure level (NISPL) for this specimen. The dashed line is the IIC contour fitted to the measured values according to ASTM E989-06. The dotted line is the background sound level measured in the receiving room during this test (may be below the displayed range). For any frequency where measured NISPL is less than 10 dB above the dotted line, the reported values were adjusted as noted below. Bars at bottom of graph show positive differences; where the measured data are greater than the reference contour as defined in ASTM E989-06. Shaded cells in the table and areas in the graph are outside the IIC contour range. In the table: Values marked “c” indicate that the measured background level was between 5 dB and 10 dB below the combined receiving room level and background level. Values marked “*” indicate that the measured background level was less than 5 dB below the combined receiving room level and background level and the reported values of NISPL provide an estimate of the upper limit of normalized impact sound pressure level, according to the procedure outlined in ASTM E492-09. The reported values of NISPL have been corrected according to the procedure outlined in ASTM E492-09.
2 3
2 2 2 3
4
2 1
10
20
30
40
50
60
70
80
90
100
63 125 250 500 1000 2000 4000
Nor
mal
ized
Impa
ct S
ound
Pre
ssur
e Le
vel,
NIS
PL
in d
B
Frequency, f, in Hz
IIC 35

Client Report A1-006070.10 | Construction | Acoustics Laboratory
Page 142 of 168
Client Nordic Engineered Wood
1100 Ave des Canadiens-de-Montreal Montreal QC H3B 2S2
Specimen 7 mm laminate floating floor on 3 mm premium felt placed on 50 mm (2”) normal strength concrete poured on 10 mm tar boards placed on top of a CLT 5 ply (131 mm).
Specimen ID A1-006070-29F
Construction Date: May 28, 2015 to May 29, 2015
Specimen Description The specimen was composed of two cross-laminated timber (CLT) 5 ply (131 mm thick x 1989 mm wide x 4872 mm long) panels with a butt joint in the middle of the floor. The combined panels filled the entire floor opening of the test frame. The two CLT panels were joined using a 120 mm wide x 12 mm thick plywood strip spanning the full joint (4.9 m). The plywood strip was nailed with common nails 75 mm (3”) long spaced 305 mm (12”) on centre along the joint with beads of PL premium adhesive between the plywood strip and the CLT panels. The CLT floor was resting on the lip of the test frame and was not fastened to the test frame. The air gaps between the edges of the CLT floor and the test frame were filled with glass fiber insulation and covered with cloth tape. Duct putty was installed around the lower perimeter of the test frame and the CLT. Laminate floating floor (7 mm thick) was installed on top of a 3 mm Acoustic-TechTM Premium Felt Membrane which was placed on top of a 50 mm (2”) normal strength concrete which was poured on a 0.1 mm (4 mils) polyethylene sheeting top of 10 mm tar boards which were placed on the CLT floor.
Cross-section of A1-006070-29F
Specimen Properties
Element Actual
thickness (mm)
Mass (kg) Mass/length, area or volume
7 mm Generic Laminate Floating Floor 7 115 5.8 kg/m2 3 mm Acoustic-TechTM Premium Felt
Membrane 3 9.5 0.5 kg/m2
50 mm Poured Concrete 50 2376 119.0 kg/m2 10 mm Tar Board (Building Products) 10 56 2.8 kg/m2 131 mm CLT 5-ply 131 1338 67.0 kg/m2 Total 201 3895 195 kg/m2
Test Specimen Installation
• The exposed area of the floor specimen used for the calculations of the airborne sound transmission loss was 17.85 m2 (4.71 m x 3.79 m).
• The total area of the floor assembly resting on top of the lip was 19.32 m2 (4.88 m x 3.96 m). • The mass per area of the elements above the lip was calculated using the total area (19.32 m2).

Client Report A1-006070.10 | Construction | Acoustics Laboratory
Page 143 of 168
This page was
intentionally
left blank

Client Report A1-006070.10 | Construction | Acoustics Laboratory
Page 144 of 168
ASTM E90 Test Results – Airborne Sound Transmission Loss
Client: Nordic Engineered Wood Test ID: TLF-15-041
Specimen ID: A1-006070-29F Date of Test: June 1, 2015
Room Volume (m³) Air Temperature (°C) Humidity (%)
Upper 175.5 23.1 to 23.1 39.1 to 39.1 Area S of test specimen: 17.85 m2
Lower 177.1 19.8 to 19.9 48.8 to 48.9 Mass per unit area: 195 kg/m2
f (Hz)
Airborne TL (dB)
50 32
63 37
80 37
100 36
125 35
160 35
200 34
250 34
315 32
400 33
500 40
630 49
800 56
1000 63
1250 70
1600 77 c
2000 86 c
2500 90 *
3150 91 *
4000 89 c
5000 88 c
Sound Transmission
Class (STC) 42
Sum of Deficiencies (dB)
17 Max. Deficiency (dB)
8 dB at 400 Hz
For a description of the test specimen and mounting conditions see text pages before. The results in this report apply only to the specific sample submitted for measurement. No responsibility is assumed for performance of any other specimen. Airborne sound transmission loss measurements were conducted in accordance with the requirements of ASTM E90-09, “Standard Test Method for Laboratory Measurement of Airborne Sound Transmission Loss of Building Partitions and Elements”. In the graph: The solid line is the measured sound transmission loss for this specimen. The dashed line is the STC contour fitted to the measured values according to ASTM E413-10. The dotted line (may be above the displayed range) is 10 dB below the flanking limit established for this facility. For any frequency band where the measured transmission loss is above the dotted line, the reported value is potentially limited by flanking transmission via laboratory surfaces, and the true value may be higher than that measured. Bars at the bottom of the graph show deficiencies where the measured data are less than the reference contour as described in the fitting procedure for the STC, defined in ASTM E413-10. The shaded cells in the table and areas in the graph are outside the STC contour range. In the table: Values marked “c” indicate that the measured background level was between 5 dB and 10 dB below the combined receiving room level and background level. The reported values have been corrected according to the procedure outlined in ASTM E90-09. Values marked “*” indicate that the measured background level was less than 5 dB below the combined receiving room level and background level, in which case, the corrected values provide an estimate of the lower limit of airborne sound transmission loss.
1
6
8
2
10
20
30
40
50
60
70
80
90
100
63 125 250 500 1000 2000 4000
Airb
orne
Sou
nd T
rans
mis
sion
Los
s, T
L, in
dB
Frequency, f, in Hz
STC 42

Client Report A1-006070.10 | Construction | Acoustics Laboratory
Page 145 of 168
ASTM E492 Test Results – Normalized Impact Sound Pressure Levels
Client: Nordic Engineered Wood Test ID: IIF-15-036
Specimen ID: A1-006070-29F Date of Test: May 9, 2015
Room Volume (m³) Air Temperature (°C) Humidity (%)
Upper 175.5 23.8 to 23.9 42.8 to 43.1 Area S of test specimen: 17.85 m2
Lower 177.1 19.9 to 19.9 49.8 to 49.9 Mass per unit area: 195 kg/m2
f (Hz)
NISPL (dB)
50 60
63 61
80 66
100 71
125 72
160 72
200 73
250 74
315 71
400 66
500 61
630 56
800 49
1000 42
1250 34
1600 28
2000 18 *
2500 14 *
3150 14 *
4000 15 *
5000 17 *
Impact Insulation
Class (IIC)
45
Sum of Positive Differences (dB)
31 Max. Positive Difference (dB)
7 dB at 250 Hz
For a description of the test specimen and mounting conditions see text pages before. The results in this report apply only to the specific sample submitted for measurement. No responsibility is assumed for performance of any other specimen. Measurements of normalized impact sound pressure level (NISPL) were conducted in accordance with the requirements of ASTM E492-09, “Standard Laboratory Measurement of Impact Sound Transmission through Floor-Ceiling Assemblies Using the Tapping Machine”. In the graph: The solid line is the measured normalized impact sound pressure level (NISPL) for this specimen. The dashed line is the IIC contour fitted to the measured values according to ASTM E989-06. The dotted line is the background sound level measured in the receiving room during this test (may be below the displayed range). For any frequency where measured NISPL is less than 10 dB above the dotted line, the reported values were adjusted as noted below. Bars at bottom of graph show positive differences; where the measured data are greater than the reference contour as defined in ASTM E989-06. Shaded cells in the table and areas in the graph are outside the IIC contour range. In the table: Values marked “c” indicate that the measured background level was between 5 dB and 10 dB below the combined receiving room level and background level. Values marked “*” indicate that the measured background level was less than 5 dB below the combined receiving room level and background level and the reported values of NISPL provide an estimate of the upper limit of normalized impact sound pressure level, according to the procedure outlined in ASTM E492-09. The reported values of NISPL have been corrected according to the procedure outlined in ASTM E492-09.
4 5 5
6 7
4
10
20
30
40
50
60
70
80
90
100
63 125 250 500 1000 2000 4000
Nor
mal
ized
Impa
ct S
ound
Pre
ssur
e Le
vel,
NIS
PL
in d
B
Frequency, f, in Hz
IIC 45
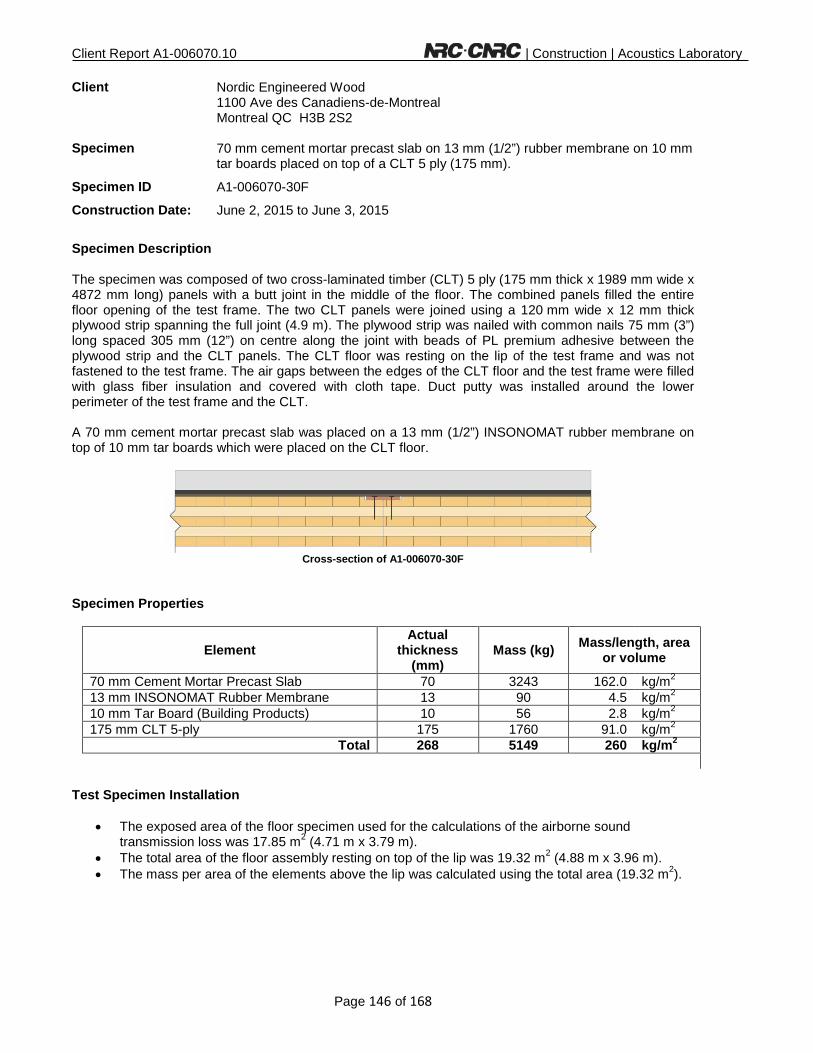
Client Report A1-006070.10 | Construction | Acoustics Laboratory
Page 146 of 168
Client Nordic Engineered Wood
1100 Ave des Canadiens-de-Montreal Montreal QC H3B 2S2
Specimen 70 mm cement mortar precast slab on 13 mm (1/2”) rubber membrane on 10 mm tar boards placed on top of a CLT 5 ply (175 mm).
Specimen ID A1-006070-30F
Construction Date: June 2, 2015 to June 3, 2015
Specimen Description The specimen was composed of two cross-laminated timber (CLT) 5 ply (175 mm thick x 1989 mm wide x 4872 mm long) panels with a butt joint in the middle of the floor. The combined panels filled the entire floor opening of the test frame. The two CLT panels were joined using a 120 mm wide x 12 mm thick plywood strip spanning the full joint (4.9 m). The plywood strip was nailed with common nails 75 mm (3”) long spaced 305 mm (12”) on centre along the joint with beads of PL premium adhesive between the plywood strip and the CLT panels. The CLT floor was resting on the lip of the test frame and was not fastened to the test frame. The air gaps between the edges of the CLT floor and the test frame were filled with glass fiber insulation and covered with cloth tape. Duct putty was installed around the lower perimeter of the test frame and the CLT. A 70 mm cement mortar precast slab was placed on a 13 mm (1/2”) INSONOMAT rubber membrane on top of 10 mm tar boards which were placed on the CLT floor.
Cross-section of A1-006070-30F
Specimen Properties
Element Actual
thickness (mm)
Mass (kg) Mass/length, area or volume
70 mm Cement Mortar Precast Slab 70 3243 162.0 kg/m2 13 mm INSONOMAT Rubber Membrane 13 90 4.5 kg/m2 10 mm Tar Board (Building Products) 10 56 2.8 kg/m2 175 mm CLT 5-ply 175 1760 91.0 kg/m2 Total 268 5149 260 kg/m2
Test Specimen Installation
• The exposed area of the floor specimen used for the calculations of the airborne sound transmission loss was 17.85 m2 (4.71 m x 3.79 m).
• The total area of the floor assembly resting on top of the lip was 19.32 m2 (4.88 m x 3.96 m). • The mass per area of the elements above the lip was calculated using the total area (19.32 m2).

Client Report A1-006070.10 | Construction | Acoustics Laboratory
Page 147 of 168
This page was
intentionally
left blank

Client Report A1-006070.10 | Construction | Acoustics Laboratory
Page 148 of 168
ASTM E90 Test Results – Airborne Sound Transmission Loss
Client: Nordic Engineered Wood Test ID: TLF-15-042
Specimen ID: A1-006070-30F Date of Test: June 3, 2015
Room Volume (m³) Air Temperature (°C) Humidity (%)
Upper 174.4 22.0 to 22.1 37.8 to 37.9 Area S of test specimen: 17.85 m2
Lower 176.8 18.4 to 18.4 47.1 to 47.2 Mass per unit area: 260 kg/m2
f (Hz)
Airborne TL (dB)
50 35
63 37
80 36
100 36
125 40
160 40
200 43
250 49
315 50
400 51
500 56
630 59
800 65
1000 72 c
1250 78 *
1600 84 *
2000 91 *
2500 92 *
3150 91 c
4000 90 c
5000 88 c
Sound Transmission
Class (STC) 58
Sum of Deficiencies (dB)
26 Max. Deficiency (dB)
6 dB at 400 Hz
For a description of the test specimen and mounting conditions see text pages before. The results in this report apply only to the specific sample submitted for measurement. No responsibility is assumed for performance of any other specimen. Airborne sound transmission loss measurements were conducted in accordance with the requirements of ASTM E90-09, “Standard Test Method for Laboratory Measurement of Airborne Sound Transmission Loss of Building Partitions and Elements”. In the graph: The solid line is the measured sound transmission loss for this specimen. The dashed line is the STC contour fitted to the measured values according to ASTM E413-10. The dotted line (may be above the displayed range) is 10 dB below the flanking limit established for this facility. For any frequency band where the measured transmission loss is above the dotted line, the reported value is potentially limited by flanking transmission via laboratory surfaces, and the true value may be higher than that measured. Bars at the bottom of the graph show deficiencies where the measured data are less than the reference contour as described in the fitting procedure for the STC, defined in ASTM E413-10. The shaded cells in the table and areas in the graph are outside the STC contour range. In the table: Values marked “c” indicate that the measured background level was between 5 dB and 10 dB below the combined receiving room level and background level. The reported values have been corrected according to the procedure outlined in ASTM E90-09. Values marked “*” indicate that the measured background level was less than 5 dB below the combined receiving room level and background level, in which case, the corrected values provide an estimate of the lower limit of airborne sound transmission loss.
2
5 5
2
4
6
2
10
20
30
40
50
60
70
80
90
100
63 125 250 500 1000 2000 4000
Airb
orne
Sou
nd T
rans
mis
sion
Los
s, T
L, in
dB
Frequency, f, in Hz
STC 58

Client Report A1-006070.10 | Construction | Acoustics Laboratory
Page 149 of 168
ASTM E492 Test Results – Normalized Impact Sound Pressure Levels
Client: Nordic Engineered Wood Test ID: IIF-15-037
Specimen ID: A1-006070-30F Date of Test: June 3, 2015
Room Volume (m³) Air Temperature (°C) Humidity (%)
Upper 174.4 21.7 to 21.9 38.1 to 38.5 Area S of test specimen: 17.85 m2
Lower 176.8 18.5 to 18.5 46.4 to 46.8 Mass per unit area: 260 kg/m2
f (Hz)
NISPL (dB)
50 55
63 59
80 64
100 64
125 67
160 70
200 70
250 67
315 66
400 67
500 65
630 65
800 62
1000 57
1250 51
1600 45
2000 39
2500 37
3150 35
4000 30 c
5000 22 *
Impact Insulation
Class (IIC)
47
Sum of Positive Differences (dB)
24 Max. Positive Difference (dB)
5 dB at 160 and 200 Hz
For a description of the test specimen and mounting conditions see text pages before. The results in this report apply only to the specific sample submitted for measurement. No responsibility is assumed for performance of any other specimen. Measurements of normalized impact sound pressure level (NISPL) were conducted in accordance with the requirements of ASTM E492-09, “Standard Laboratory Measurement of Impact Sound Transmission through Floor-Ceiling Assemblies Using the Tapping Machine”. In the graph: The solid line is the measured normalized impact sound pressure level (NISPL) for this specimen. The dashed line is the IIC contour fitted to the measured values according to ASTM E989-06. The dotted line is the background sound level measured in the receiving room during this test (may be below the displayed range). For any frequency where measured NISPL is less than 10 dB above the dotted line, the reported values were adjusted as noted below. Bars at bottom of graph show positive differences; where the measured data are greater than the reference contour as defined in ASTM E989-06. Shaded cells in the table and areas in the graph are outside the IIC contour range. In the table: Values marked “c” indicate that the measured background level was between 5 dB and 10 dB below the combined receiving room level and background level. Values marked “*” indicate that the measured background level was less than 5 dB below the combined receiving room level and background level and the reported values of NISPL provide an estimate of the upper limit of normalized impact sound pressure level, according to the procedure outlined in ASTM E492-09. The reported values of NISPL have been corrected according to the procedure outlined in ASTM E492-09.
2
5 5
2 1
3 2
3
1
10
20
30
40
50
60
70
80
90
100
63 125 250 500 1000 2000 4000
Nor
mal
ized
Impa
ct S
ound
Pre
ssur
e Le
vel,
NIS
PL
in d
B
Frequency, f, in Hz
IIC 47

Client Report A1-006070.10 | Construction | Acoustics Laboratory
Page 150 of 168
Client Nordic Engineered Wood
1100 Ave des Canadiens-de-Montreal Montreal QC H3B 2S2
Specimen 70 mm cement mortar precast slab on 13 mm (1/2”) rubber membrane placed on top of a CLT 5 ply (175 mm).
Specimen ID A1-006070-31F
Construction Date: June 4, 2015
Specimen Description The specimen was composed of two cross-laminated timber (CLT) 5 ply (175 mm thick x 1989 mm wide x 4872 mm long) panels with a butt joint in the middle of the floor. The combined panels filled the entire floor opening of the test frame. The two CLT panels were joined using a 120 mm wide x 12 mm thick plywood strip spanning the full joint (4.9 m). The plywood strip was nailed with common nails 75 mm (3”) long spaced 305 mm (12”) on centre along the joint with beads of PL premium adhesive between the plywood strip and the CLT panels. The CLT floor was resting on the lip of the test frame and was not fastened to the test frame. The air gaps between the edges of the CLT floor and the test frame were filled with glass fiber insulation and covered with cloth tape. Duct putty was installed around the lower perimeter of the test frame and the CLT. A 70 mm cement mortar precast slab was placed on a 13 mm (1/2”) INSONOMAT rubber membrane which were placed on the CLT floor.
Cross-section of A1-006070-31F
Specimen Properties
Element Actual
thickness (mm)
Mass (kg) Mass/length, area or volume
70 mm Cement Mortar Precast Slab 70 3243 162.0 kg/m2 13 mm INSONOMAT Rubber Membrane 13 90 4.5 kg/m2 175 mm CLT 5-ply 175 1760 91.0 kg/m2 Total 258 5093 258 kg/m2
Test Specimen Installation
• The exposed area of the floor specimen used for the calculations of the airborne sound transmission loss was 17.85 m2 (4.71 m x 3.79 m).
• The total area of the floor assembly resting on top of the lip was 19.32 m2 (4.88 m x 3.96 m). • The mass per area of the elements above the lip was calculated using the total area (19.32 m2).

Client Report A1-006070.10 | Construction | Acoustics Laboratory
Page 151 of 168
This page was
intentionally
left blank

Client Report A1-006070.10 | Construction | Acoustics Laboratory
Page 152 of 168
ASTM E90 Test Results – Airborne Sound Transmission Loss
Client: Nordic Engineered Wood Test ID: TLF-15-044
Specimen ID: A1-006070-31F Date of Test: June 5, 2015
Room Volume (m³) Air Temperature (°C) Humidity (%)
Upper 174.1 23.9 to 24.2 38.5 to 38.9 Area S of test specimen: 17.85 m2
Lower 176.9 19.6 to 19.6 48.7 to 48.8 Mass per unit area: 258 kg/m2
f (Hz)
Airborne TL (dB)
50 36
63 37
80 36
100 34
125 37
160 38
200 41
250 45
315 47
400 48
500 53
630 57
800 63
1000 70
1250 76
1600 83
2000 90 c
2500 92 *
3150 90 c
4000 89 c
5000 87
Sound Transmission
Class (STC) 56
Sum of Deficiencies (dB)
32 Max. Deficiency (dB)
7 dB at 400 Hz
For a description of the test specimen and mounting conditions see text pages before. The results in this report apply only to the specific sample submitted for measurement. No responsibility is assumed for performance of any other specimen. Airborne sound transmission loss measurements were conducted in accordance with the requirements of ASTM E90-09, “Standard Test Method for Laboratory Measurement of Airborne Sound Transmission Loss of Building Partitions and Elements”. In the graph: The solid line is the measured sound transmission loss for this specimen. The dashed line is the STC contour fitted to the measured values according to ASTM E413-10. The dotted line (may be above the displayed range) is 10 dB below the flanking limit established for this facility. For any frequency band where the measured transmission loss is above the dotted line, the reported value is potentially limited by flanking transmission via laboratory surfaces, and the true value may be higher than that measured. Bars at the bottom of the graph show deficiencies where the measured data are less than the reference contour as described in the fitting procedure for the STC, defined in ASTM E413-10. The shaded cells in the table and areas in the graph are outside the STC contour range. In the table: Values marked “c” indicate that the measured background level was between 5 dB and 10 dB below the combined receiving room level and background level. The reported values have been corrected according to the procedure outlined in ASTM E90-09. Values marked “*” indicate that the measured background level was less than 5 dB below the combined receiving room level and background level, in which case, the corrected values provide an estimate of the lower limit of airborne sound transmission loss.
3
5 5 4
5
7
3
10
20
30
40
50
60
70
80
90
100
63 125 250 500 1000 2000 4000
Airb
orne
Sou
nd T
rans
mis
sion
Los
s, T
L, in
dB
Frequency, f, in Hz
STC 56
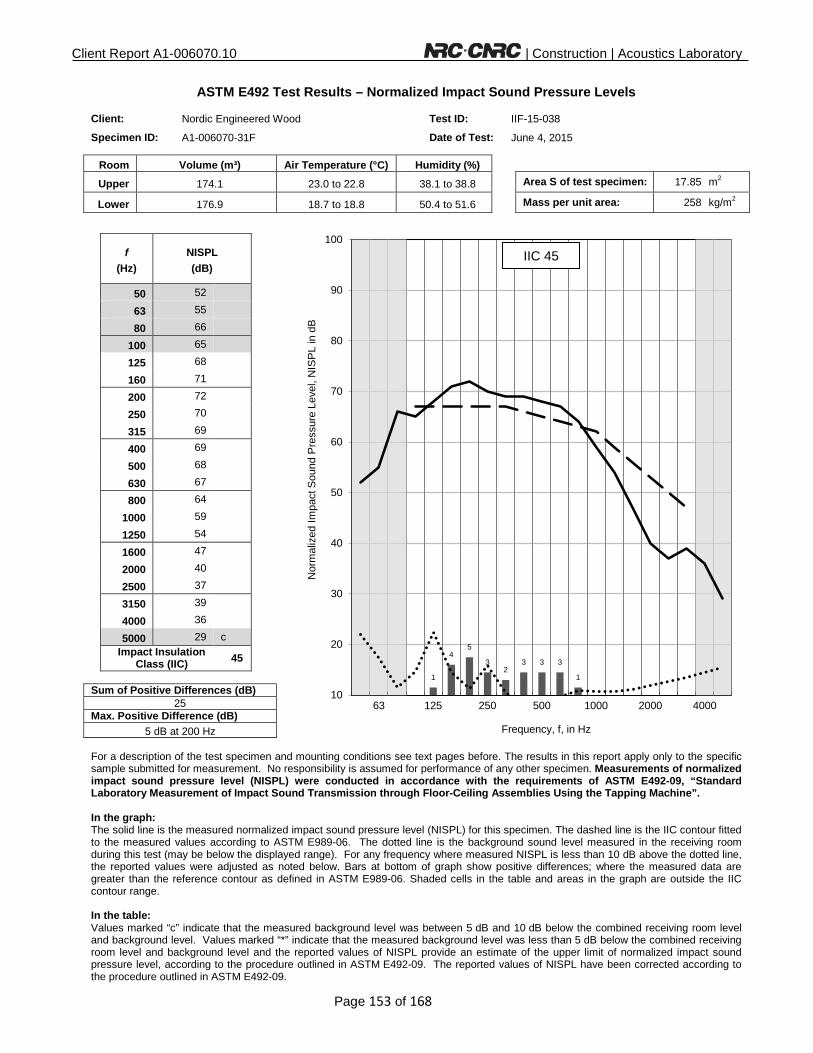
Client Report A1-006070.10 | Construction | Acoustics Laboratory
Page 153 of 168
ASTM E492 Test Results – Normalized Impact Sound Pressure Levels
Client: Nordic Engineered Wood Test ID: IIF-15-038
Specimen ID: A1-006070-31F Date of Test: June 4, 2015
Room Volume (m³) Air Temperature (°C) Humidity (%)
Upper 174.1 23.0 to 22.8 38.1 to 38.8 Area S of test specimen: 17.85 m2
Lower 176.9 18.7 to 18.8 50.4 to 51.6 Mass per unit area: 258 kg/m2
f (Hz)
NISPL (dB)
50 52
63 55
80 66
100 65
125 68
160 71
200 72
250 70
315 69
400 69
500 68
630 67
800 64
1000 59
1250 54
1600 47
2000 40
2500 37
3150 39
4000 36
5000 29 c
Impact Insulation
Class (IIC)
45
Sum of Positive Differences (dB)
25 Max. Positive Difference (dB)
5 dB at 200 Hz
For a description of the test specimen and mounting conditions see text pages before. The results in this report apply only to the specific sample submitted for measurement. No responsibility is assumed for performance of any other specimen. Measurements of normalized impact sound pressure level (NISPL) were conducted in accordance with the requirements of ASTM E492-09, “Standard Laboratory Measurement of Impact Sound Transmission through Floor-Ceiling Assemblies Using the Tapping Machine”. In the graph: The solid line is the measured normalized impact sound pressure level (NISPL) for this specimen. The dashed line is the IIC contour fitted to the measured values according to ASTM E989-06. The dotted line is the background sound level measured in the receiving room during this test (may be below the displayed range). For any frequency where measured NISPL is less than 10 dB above the dotted line, the reported values were adjusted as noted below. Bars at bottom of graph show positive differences; where the measured data are greater than the reference contour as defined in ASTM E989-06. Shaded cells in the table and areas in the graph are outside the IIC contour range. In the table: Values marked “c” indicate that the measured background level was between 5 dB and 10 dB below the combined receiving room level and background level. Values marked “*” indicate that the measured background level was less than 5 dB below the combined receiving room level and background level and the reported values of NISPL provide an estimate of the upper limit of normalized impact sound pressure level, according to the procedure outlined in ASTM E492-09. The reported values of NISPL have been corrected according to the procedure outlined in ASTM E492-09.
1
4 5
3 2
3 3 3
1
10
20
30
40
50
60
70
80
90
100
63 125 250 500 1000 2000 4000
Nor
mal
ized
Impa
ct S
ound
Pre
ssur
e Le
vel,
NIS
PL
in d
B
Frequency, f, in Hz
IIC 45

Client Report A1-006070.10 | Construction | Acoustics Laboratory
Page 154 of 168
Client Nordic Engineered Wood
1100 Ave des Canadiens-de-Montreal Montreal QC H3B 2S2
Specimen Bare 89 mm (3-1/2”) glulam decking floor
Specimen ID A1-006070-32F
Construction Date: June 15, 2015 to June 17, 2015
Specimen Description The specimen was composed of glued-laminated timber (glulam) decking panels ranging from 270 mm to 384 mm wide x 89 mm thick x 3890 mm long. The combined panels filled the entire floor opening of the test frame. The glulam decking were joined using 90 mm (3-1/2”) long common nails spaced 300 mm (12”) on centre along the joints. The glulam decking floor was resting on the lip of the test frame and was not fastened to the test frame. The air gaps between the edges of the glulam decking floor and the test frame were filled with glass fiber insulation and covered with cloth tape. Duct putty was installed around the lower perimeter of the test frame and the glulam.
Cross-section of A1-006070-32F
Fastening details of glulam decking
Specimen Properties
Element Actual
thickness (mm)
Mass (kg) Mass/length, area or volume
89 mm Glulam Decking 89 912 45.6 kg/m2 Total 89 912 46 kg/m2
Test Specimen Installation
• The exposed area of the floor specimen used for the calculations of the airborne sound transmission loss was 17.85 m2 (4.71 m x 3.79 m).
• The total area of the floor assembly resting on top of the lip was 19.32 m2 (4.88 m x 3.96 m). • The mass per area of the elements above the lip was calculated using the total area (19.32 m2).

Client Report A1-006070.10 | Construction | Acoustics Laboratory
Page 155 of 168
This page was
intentionally
left blank

Client Report A1-006070.10 | Construction | Acoustics Laboratory
Page 156 of 168
ASTM E90 Test Results – Airborne Sound Transmission Loss
Client: Nordic Engineered Wood Test ID: TLF-15-046
Specimen ID: A1-006070-32F Date of Test: June 17, 2015
Room Volume (m³) Air Temperature (°C) Humidity (%)
Upper 177.7 24.3 to 24.4 50.0 to 50.1 Area S of test specimen: 17.85 m2
Lower 176.9 20.5 to 20.5 51.1 to 51.6 Mass per unit area: 46 kg/m2
f (Hz)
Airborne TL (dB)
50 19
63 22
80 25
100 23
125 23
160 25
200 26
250 28
315 30
400 31
500 32
630 34
800 34
1000 34
1250 32
1600 31
2000 33
2500 34
3150 36
4000 38
5000 35
Sound Transmission
Class (STC) 33
Sum of Deficiencies (dB)
24 Max. Deficiency (dB)
6 dB at 1600 Hz
For a description of the test specimen and mounting conditions see text pages before. The results in this report apply only to the specific sample submitted for measurement. No responsibility is assumed for performance of any other specimen. Airborne sound transmission loss measurements were conducted in accordance with the requirements of ASTM E90-09, “Standard Test Method for Laboratory Measurement of Airborne Sound Transmission Loss of Building Partitions and Elements”. In the graph: The solid line is the measured sound transmission loss for this specimen. The dashed line is the STC contour fitted to the measured values according to ASTM E413-10. The dotted line (may be above the displayed range) is 10 dB below the flanking limit established for this facility. For any frequency band where the measured transmission loss is above the dotted line, the reported value is potentially limited by flanking transmission via laboratory surfaces, and the true value may be higher than that measured. Bars at the bottom of the graph show deficiencies where the measured data are less than the reference contour as described in the fitting procedure for the STC, defined in ASTM E413-10. The shaded cells in the table and areas in the graph are outside the STC contour range. In the table: Values marked “c” indicate that the measured background level was between 5 dB and 10 dB below the combined receiving room level and background level. The reported values have been corrected according to the procedure outlined in ASTM E90-09. Values marked “*” indicate that the measured background level was less than 5 dB below the combined receiving room level and background level, in which case, the corrected values provide an estimate of the lower limit of airborne sound transmission loss.
1 1 1 2
5 6
4 3
1
10
20
30
40
50
60
70
80
90
100
63 125 250 500 1000 2000 4000
Airb
orne
Sou
nd T
rans
mis
sion
Los
s, T
L, in
dB
Frequency, f, in Hz
STC 33

Client Report A1-006070.10 | Construction | Acoustics Laboratory
Page 157 of 168
ASTM E492 Test Results – Normalized Impact Sound Pressure Levels
Client: Nordic Engineered Wood Test ID: IIF-15-040
Specimen ID: A1-006070-32F Date of Test: June 17, 2015
Room Volume (m³) Air Temperature (°C) Humidity (%)
Upper 177.7 24.1 to 24.2 50.2 to 50.4 Area S of test specimen: 17.85 m2
Lower 176.9 20.6 to 20.6 48.8 to 50.0 Mass per unit area: 46 kg/m2
f (Hz)
NISPL (dB)
50 73
63 73
80 76
100 80
125 81
160 81
200 82
250 86
315 86
400 87
500 88
630 89
800 90
1000 89
1250 89
1600 86
2000 81
2500 73
3150 67
4000 64
5000 60
Impact Insulation
Class (IIC)
22
Sum of Positive Differences (dB)
29 Max. Positive Difference (dB)
7 dB at 1250 and 1600 Hz
For a description of the test specimen and mounting conditions see text pages before. The results in this report apply only to the specific sample submitted for measurement. No responsibility is assumed for performance of any other specimen. Measurements of normalized impact sound pressure level (NISPL) were conducted in accordance with the requirements of ASTM E492-09, “Standard Laboratory Measurement of Impact Sound Transmission through Floor-Ceiling Assemblies Using the Tapping Machine”. In the graph: The solid line is the measured normalized impact sound pressure level (NISPL) for this specimen. The dashed line is the IIC contour fitted to the measured values according to ASTM E989-06. The dotted line is the background sound level measured in the receiving room during this test (may be below the displayed range). For any frequency where measured NISPL is less than 10 dB above the dotted line, the reported values were adjusted as noted below. Bars at bottom of graph show positive differences; where the measured data are greater than the reference contour as defined in ASTM E989-06. Shaded cells in the table and areas in the graph are outside the IIC contour range. In the table: Values marked “c” indicate that the measured background level was between 5 dB and 10 dB below the combined receiving room level and background level. Values marked “*” indicate that the measured background level was less than 5 dB below the combined receiving room level and background level and the reported values of NISPL provide an estimate of the upper limit of normalized impact sound pressure level, according to the procedure outlined in ASTM E492-09. The reported values of NISPL have been corrected according to the procedure outlined in ASTM E492-09.
2
4 4
7 7
5
10
20
30
40
50
60
70
80
90
100
63 125 250 500 1000 2000 4000
Nor
mal
ized
Impa
ct S
ound
Pre
ssur
e Le
vel,
NIS
PL
in d
B
Frequency, f, in Hz
IIC 22

Client Report A1-006070.10 | Construction | Acoustics Laboratory
Page 158 of 168
Client Nordic Engineered Wood
1100 Ave des Canadiens-de-Montreal Montreal QC H3B 2S2
Specimen 70 mm cement mortar precast slab on 13 mm (1/2”) rubber membrane placed on top of a 89 mm (3-1/2”) glulam decking floor
Specimen ID A1-006070-33F
Construction Date: June 19, 2015
Specimen Description The specimen was composed of glued-laminated timber (glulam) decking panels ranging from 270 mm to 384 mm wide x 89 mm thick x 3890 mm long. The combined panels filled the entire floor opening of the test frame. The glulam decking were joined using 90 mm (3-1/2”) long common nails spaced 300 mm (12”) on centre along the joints. The glulam decking floor was resting on the lip of the test frame and was not fastened to the test frame. The air gaps between the edges of the glulam decking floor and the test frame were filled with glass fiber insulation and covered with cloth tape. Duct putty was installed around the lower perimeter of the test frame and the glulam. A 70 mm cement mortar precast slab was placed on a 13 mm (1/2”) INSONOMAT rubber membrane which was placed on the glulam decking floor.
Cross-section of A1-006070-33F
Fastening details of glulam decking
Specimen Properties
Element Actual
thickness (mm)
Mass (kg) Mass/length, area or volume
70 mm Cement Mortar Precast Slab 70 3243 162.0 kg/m2 13 mm INSONOMAT Rubber Membrane 13 90 4.5 kg/m2 89 mm Glulam Decking 89 912 45.6 kg/m2 Total 172 4245 212 kg/m2

Client Report A1-006070.10 | Construction | Acoustics Laboratory
Page 159 of 168
Test Specimen Installation
• The exposed area of the floor specimen used for the calculations of the airborne sound transmission loss was 17.85 m2 (4.71 m x 3.79 m).
• The total area of the floor assembly resting on top of the lip was 19.32 m2 (4.88 m x 3.96 m). • The mass per area of the elements above the lip was calculated using the total area (19.32 m2).

Client Report A1-006070.10 | Construction | Acoustics Laboratory
Page 160 of 168
ASTM E90 Test Results – Airborne Sound Transmission Loss
Client: Nordic Engineered Wood Test ID: TLF-15-048
Specimen ID: A1-006070-33F Date of Test: June 19, 2015
Room Volume (m³) Air Temperature (°C) Humidity (%)
Upper 176.1 24.0 to 24.1 47.5 to 50.5 Area S of test specimen: 17.85 m2
Lower 176.9 20.6 to 20.8 49.5 to 50.6 Mass per unit area: 212 kg/m2
f (Hz)
Airborne TL (dB)
50 32
63 34
80 33
100 30
125 32
160 33
200 36
250 41
315 42
400 44
500 49
630 55
800 60
1000 63
1250 68
1600 72
2000 78
2500 83
3150 85
4000 87
5000 87
Sound Transmission
Class (STC) 51
Sum of Deficiencies (dB)
29 Max. Deficiency (dB)
6 dB at 400 Hz
For a description of the test specimen and mounting conditions see text pages before. The results in this report apply only to the specific sample submitted for measurement. No responsibility is assumed for performance of any other specimen. Airborne sound transmission loss measurements were conducted in accordance with the requirements of ASTM E90-09, “Standard Test Method for Laboratory Measurement of Airborne Sound Transmission Loss of Building Partitions and Elements”. In the graph: The solid line is the measured sound transmission loss for this specimen. The dashed line is the STC contour fitted to the measured values according to ASTM E413-10. The dotted line (may be above the displayed range) is 10 dB below the flanking limit established for this facility. For any frequency band where the measured transmission loss is above the dotted line, the reported value is potentially limited by flanking transmission via laboratory surfaces, and the true value may be higher than that measured. Bars at the bottom of the graph show deficiencies where the measured data are less than the reference contour as described in the fitting procedure for the STC, defined in ASTM E413-10. The shaded cells in the table and areas in the graph are outside the STC contour range. In the table: Values marked “c” indicate that the measured background level was between 5 dB and 10 dB below the combined receiving room level and background level. The reported values have been corrected according to the procedure outlined in ASTM E90-09. Values marked “*” indicate that the measured background level was less than 5 dB below the combined receiving room level and background level, in which case, the corrected values provide an estimate of the lower limit of airborne sound transmission loss.
3
5 5
3
5 6
2
10
20
30
40
50
60
70
80
90
100
63 125 250 500 1000 2000 4000
Airb
orne
Sou
nd T
rans
mis
sion
Los
s, T
L, in
dB
Frequency, f, in Hz
STC 51

Client Report A1-006070.10 | Construction | Acoustics Laboratory
Page 161 of 168
ASTM E492 Test Results – Normalized Impact Sound Pressure Levels
Client: Nordic Engineered Wood Test ID: IIF-15-041
Specimen ID: A1-006070-33F Date of Test: June 22, 2015
Room Volume (m³) Air Temperature (°C) Humidity (%)
Upper 176.1 27.0 to 27.1 53.9 to 54.4 Area S of test specimen: 17.85 m2
Lower 176.9 20.7 to 20.7 54.9 to 55.1 Mass per unit area: 212 kg/m2
f (Hz)
NISPL (dB)
50 51
63 57
80 61
100 64
125 70
160 74
200 75
250 76
315 76
400 74
500 72
630 68
800 66
1000 62
1250 60
1600 57
2000 52
2500 48
3150 45
4000 40
5000 37
Impact Insulation
Class (IIC)
42
Sum of Positive Differences (dB)
31 Max. Positive Difference (dB)
6 dB at 250 and 315 Hz
For a description of the test specimen and mounting conditions see text pages before. The results in this report apply only to the specific sample submitted for measurement. No responsibility is assumed for performance of any other specimen. Measurements of normalized impact sound pressure level (NISPL) were conducted in accordance with the requirements of ASTM E492-09, “Standard Laboratory Measurement of Impact Sound Transmission through Floor-Ceiling Assemblies Using the Tapping Machine”. In the graph: The solid line is the measured normalized impact sound pressure level (NISPL) for this specimen. The dashed line is the IIC contour fitted to the measured values according to ASTM E989-06. The dotted line is the background sound level measured in the receiving room during this test (may be below the displayed range). For any frequency where measured NISPL is less than 10 dB above the dotted line, the reported values were adjusted as noted below. Bars at bottom of graph show positive differences; where the measured data are greater than the reference contour as defined in ASTM E989-06. Shaded cells in the table and areas in the graph are outside the IIC contour range. In the table: Values marked “c” indicate that the measured background level was between 5 dB and 10 dB below the combined receiving room level and background level. Values marked “*” indicate that the measured background level was less than 5 dB below the combined receiving room level and background level and the reported values of NISPL provide an estimate of the upper limit of normalized impact sound pressure level, according to the procedure outlined in ASTM E492-09. The reported values of NISPL have been corrected according to the procedure outlined in ASTM E492-09.
4 5
6 6 5
4
1
30
40
50
60
70
80
90
63 125 250 500 1000 2000 4000
Nor
mal
ized
Impa
ct S
ound
Pre
ssur
e Le
vel,
NIS
PL
in d
B
Frequency, f, in Hz
IIC 42

Client Report A1-006070.10 | Construction | Acoustics Laboratory
Page 162 of 168
Client Nordic Engineered Wood
1100 Ave des Canadiens-de-Montreal Montreal QC H3B 2S2
Specimen Carpet tiles on 70 mm cement mortar precast slab on 13 mm (1/2”) rubber membrane placed on top of a 89 mm (3-1/2”) glulam decking floor
Specimen ID A1-006070-34F
Construction Date: June 25, 2015 to June 26, 2015
Specimen Description The specimen was composed of glued-laminated timber (glulam) decking panels ranging from 270 mm to 384 mm wide x 89 mm thick x 3890 mm long. The combined panels filled the entire floor opening of the test frame. The glulam decking were joined using 90 mm (3-1/2”) long common nails spaced 300 mm (12”) on centre along the joints. The glulam decking floor was resting on the lip of the test frame and was not fastened to the test frame. The air gaps between the edges of the glulam decking floor and the test frame were filled with glass fiber insulation and covered with cloth tape. Duct putty was installed around the lower perimeter of the test frame and the glulam. Carpet tiles 7 mm thick were adhered to a 70 mm cement mortar precast slab placed on a 13 mm (1/2”) INSONOMAT rubber membrane which was placed on the glulam decking floor.
Cross-section of A1-006070-34F
Fastening details of glulam decking
Specimen Properties
Element Actual
thickness (mm)
Mass (kg) Mass/length, area or volume
7 mm Carpet Tiles 7 50 2.6 kg/m2 70 mm Cement Mortar Precast Slab 70 3243 162.0 kg/m2 13 mm INSONOMAT Rubber Membrane 13 90 4.5 kg/m2 89 mm Glulam Decking 89 912 45.6 kg/m2 Total 179 4295 215 kg/m2

Client Report A1-006070.10 | Construction | Acoustics Laboratory
Page 163 of 168
Test Specimen Installation
• The exposed area of the floor specimen used for the calculations of the airborne sound transmission loss was 17.85 m2 (4.71 m x 3.79 m).
• The total area of the floor assembly resting on top of the lip was 19.32 m2 (4.88 m x 3.96 m). • The mass per area of the elements above the lip was calculated using the total area (19.32 m2).

Client Report A1-006070.10 | Construction | Acoustics Laboratory
Page 164 of 168
ASTM E90 Test Results – Airborne Sound Transmission Loss
Client: Nordic Engineered Wood Test ID: TLF-15-049
Specimen ID: A1-006070-34F Date of Test: June 26, 2015
Room Volume (m³) Air Temperature (°C) Humidity (%)
Upper 176.0 25.9 to 26.0 39.1 to 39.4 Area S of test specimen: 17.85 m2
Lower 176.9 21.6 to 21.6 57.3 to 57.5 Mass per unit area: 215 kg/m2
f (Hz)
Airborne TL (dB)
50 33
63 35
80 34
100 32
125 34
160 34
200 37
250 41
315 42
400 44
500 50
630 56
800 61
1000 65
1250 69
1600 74
2000 81
2500 86 c
3150 88 c
4000 89 c
5000 87 c
Sound Transmission
Class (STC) 52
Sum of Deficiencies (dB)
31 Max. Deficiency (dB)
7 dB at 400 Hz
For a description of the test specimen and mounting conditions see text pages before. The results in this report apply only to the specific sample submitted for measurement. No responsibility is assumed for performance of any other specimen. Airborne sound transmission loss measurements were conducted in accordance with the requirements of ASTM E90-09, “Standard Test Method for Laboratory Measurement of Airborne Sound Transmission Loss of Building Partitions and Elements”. In the graph: The solid line is the measured sound transmission loss for this specimen. The dashed line is the STC contour fitted to the measured values according to ASTM E413-10. The dotted line (may be above the displayed range) is 10 dB below the flanking limit established for this facility. For any frequency band where the measured transmission loss is above the dotted line, the reported value is potentially limited by flanking transmission via laboratory surfaces, and the true value may be higher than that measured. Bars at the bottom of the graph show deficiencies where the measured data are less than the reference contour as described in the fitting procedure for the STC, defined in ASTM E413-10. The shaded cells in the table and areas in the graph are outside the STC contour range. In the table: Values marked “c” indicate that the measured background level was between 5 dB and 10 dB below the combined receiving room level and background level. The reported values have been corrected according to the procedure outlined in ASTM E90-09. Values marked “*” indicate that the measured background level was less than 5 dB below the combined receiving room level and background level, in which case, the corrected values provide an estimate of the lower limit of airborne sound transmission loss.
2
5 5 4
6 7
2
10
20
30
40
50
60
70
80
90
100
63 125 250 500 1000 2000 4000
Airb
orne
Sou
nd T
rans
mis
sion
Los
s, T
L, in
dB
Frequency, f, in Hz
STC 52
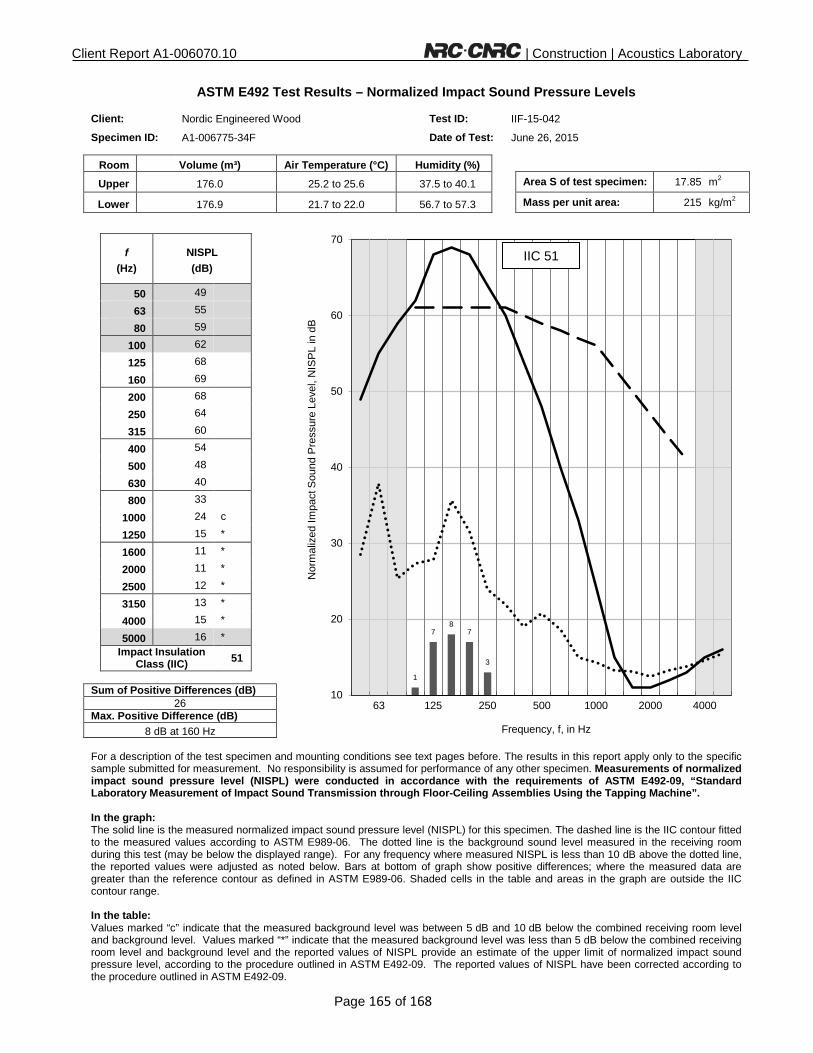
Client Report A1-006070.10 | Construction | Acoustics Laboratory
Page 165 of 168
ASTM E492 Test Results – Normalized Impact Sound Pressure Levels
Client: Nordic Engineered Wood Test ID: IIF-15-042
Specimen ID: A1-006775-34F Date of Test: June 26, 2015
Room Volume (m³) Air Temperature (°C) Humidity (%)
Upper 176.0 25.2 to 25.6 37.5 to 40.1 Area S of test specimen: 17.85 m2
Lower 176.9 21.7 to 22.0 56.7 to 57.3 Mass per unit area: 215 kg/m2
f (Hz)
NISPL (dB)
50 49
63 55
80 59
100 62
125 68
160 69
200 68
250 64
315 60
400 54
500 48
630 40
800 33
1000 24 c
1250 15 *
1600 11 *
2000 11 *
2500 12 *
3150 13 *
4000 15 *
5000 16 *
Impact Insulation
Class (IIC)
51
Sum of Positive Differences (dB)
26 Max. Positive Difference (dB)
8 dB at 160 Hz
For a description of the test specimen and mounting conditions see text pages before. The results in this report apply only to the specific sample submitted for measurement. No responsibility is assumed for performance of any other specimen. Measurements of normalized impact sound pressure level (NISPL) were conducted in accordance with the requirements of ASTM E492-09, “Standard Laboratory Measurement of Impact Sound Transmission through Floor-Ceiling Assemblies Using the Tapping Machine”. In the graph: The solid line is the measured normalized impact sound pressure level (NISPL) for this specimen. The dashed line is the IIC contour fitted to the measured values according to ASTM E989-06. The dotted line is the background sound level measured in the receiving room during this test (may be below the displayed range). For any frequency where measured NISPL is less than 10 dB above the dotted line, the reported values were adjusted as noted below. Bars at bottom of graph show positive differences; where the measured data are greater than the reference contour as defined in ASTM E989-06. Shaded cells in the table and areas in the graph are outside the IIC contour range. In the table: Values marked “c” indicate that the measured background level was between 5 dB and 10 dB below the combined receiving room level and background level. Values marked “*” indicate that the measured background level was less than 5 dB below the combined receiving room level and background level and the reported values of NISPL provide an estimate of the upper limit of normalized impact sound pressure level, according to the procedure outlined in ASTM E492-09. The reported values of NISPL have been corrected according to the procedure outlined in ASTM E492-09.
1
7 8
7
3
10
20
30
40
50
60
70
63 125 250 500 1000 2000 4000
Nor
mal
ized
Impa
ct S
ound
Pre
ssur
e Le
vel,
NIS
PL
in d
B
Frequency, f, in Hz
IIC 51

Client Report A1-006070.10 | Construction | Acoustics Laboratory
Page 166 of 168
APPENDIX: ASTM E90-09 – Airborne Sound Transmission – Wall Facility
Facility and Equipment: The NRC Construction Wall Sound Transmission Facility comprises two reverberation rooms (referred to in this report as the large and small rooms) with a moveable test frame between the two rooms. The large room has an approximate volume of 255 m3 while the small room has an approximate volume of 140 m3. In each room, a calibrated Bruel & Kjaer condenser microphone (type 4166 or 4165) with preamp is moved under computer control to nine positions, and measurements are made in both rooms using an 8-channel National Instrument NI-4472 system installed in a computer. Each room has four bi-amped loudspeakers driven by separate amplifiers and noise sources. To increase randomness of the sound field, there are fixed diffusing panels in each room.
Test Procedure: Airborne sound transmission measurements were conducted in accordance with the requirements of ASTM E90-09, “Standard Method for Laboratory Measurement of Airborne Sound Transmission Loss of Building Partitions”. Airborne sound transmission loss tests were performed in the forward (receiving room is the large room) and reverse (receiving room is the small room) directions. Results presented in this report are the average of the tests in these two directions. In each case, sound transmission loss values were calculated from the average sound pressure levels of both the source and receiving rooms and the average reverberation times of the receiving room. One-third octave band sound pressure levels were measured for 32 seconds at nine microphone positions in each room and then averaged to get the average sound pressure level in each room. Five sound decays were averaged to get the reverberation time at each microphone position in the receiving room; these reverberation times were averaged to get the average reverberation times for each room. Information on the flanking limit of the facility and reference specimen test results are available on request.
Significance of Test Results: ASTM E90-09 requires measurements in 1/3-octave bands in the frequency range 100 Hz to 5000 Hz. Within those ranges, reproducibility has been assessed by inter-laboratory round robin studies. The standards recommend making measurements and reporting results over a larger frequency range, and this report presents such results, which may be useful for expert evaluation of the specimen performance. The precision of results outside the 100 to 5000 Hz range has not been established, but is expected to depend on laboratory-specific factors.
Sound Transmission Class (STC): The Sound Transmission Class (STC) was determined in accordance with ASTM E413-10, “Classification for Rating Sound Insulation”. It is a single-figure rating scheme intended to rate the acoustical performance of a partition element separating offices or dwellings. The higher the value of the rating, the better the performance. The rating is intended to correlate with subjective impressions of the sound insulation provided against the sounds of speech, radio, television, music, and similar sources of noise characteristic of offices and dwellings. The STC is of limited use in applications involving noise spectra that differ markedly from those referred to above (for example, heavy machinery, power transformers, aircraft noise, motor vehicle noise). Generally, in such applications it is preferable to consider the source levels and insulation requirements for each frequency band.
In Situ Performance: Ratings obtained by this standard method tend to represent an upper limit to what might be measured in a field test, due to structure-borne transmission (“flanking”) and construction deficiencies in actual buildings.

Client Report A1-006070.10 | Construction | Acoustics Laboratory
Page 167 of 168
APPENDIX: ASTM E90-09 – Airborne Sound Transmission – Floor Facility
Facility and Equipment: The NRC Construction Floor Sound Transmission Facility comprises two reverberation rooms (referred to in this report as the upper and lower rooms) with a moveable test frame between the rooms. Both rooms have an approximate volume of 175 m3. In each room, a calibrated Bruel & Kjaer condenser microphone (type 4166 or 4165) with preamp is moved under computer control to nine positions, and measurements are made in both rooms using an 8-channel National Instrument NI-4472 system installed in a computer. Each room has four bi-amped loudspeakers driven by separate amplifiers and noise sources. To increase randomness of the sound field, there are fixed diffusing panels in each room.
Test Procedure: Airborne sound transmission measurements were conducted in accordance with the requirements of ASTM E90-09, “Standard Method for Laboratory Measurement of Airborne Sound Transmission Loss of Building Partitions”. Airborne sound transmission loss tests were performed in the forward (receiving room is the lower room) and reverse (receiving room is the upper room) directions. Results presented in this report are the average of the tests in these two directions. In each case, sound transmission loss values were calculated from the average sound pressure levels of both the source and receiving rooms and the average reverberation times of the receiving room. One-third octave band sound pressure levels were measured for 32 seconds at nine microphone positions in each room and then averaged to get the average sound pressure level in each room. Five sound decays were averaged to get the reverberation time at each microphone position in the receiving room; these reverberation times were averaged to get the average reverberation times for each room. Information on the flanking limit of the facility and reference specimen test results are available on request.
Significance of Test Results: ASTM E90-09 requires measurements in 1/3-octave bands in the frequency range 100 Hz to 5000 Hz. Within those ranges, reproducibility has been assessed by inter-laboratory round robin studies. The standards recommend making measurements and reporting results over a larger frequency range, and this report presents such results, which may be useful for expert evaluation of the specimen performance. The precision of results outside the 100 to 5000 Hz range has not been established, but is expected to depend on laboratory-specific factors.
Sound Transmission Class (STC): The Sound Transmission Class (STC) was determined in accordance with ASTM E413-10, “Classification for Rating Sound Insulation”. It is a single number rating scheme intended to rate the acoustical performance of a partition element separating offices or dwellings. The higher the value of the rating, the better the performance. The rating is intended to correlate with subjective impressions of the sound insulation provided against the sounds of speech, radio, television, music, and similar sources of noise characteristic of offices and dwellings. The STC is of limited use in applications involving noise spectra that differ markedly from those referred to above (for example, heavy machinery, power transformers, aircraft noise, motor vehicle noise). Generally, in such applications it is preferable to consider the source levels and insulation requirements for each frequency band.
In Situ Performance: Ratings obtained by this standard method tend to represent an upper limit to what might be measured in a field test, due to structure-borne transmission (“flanking”) and construction deficiencies in actual buildings.

Client Report A1-006070.10 | Construction | Acoustics Laboratory
Page 168 of 168
APPENDIX: ASTM E492-09 – Light Impact Sound Transmission – Floor Facility
Facility and Equipment: The NRC Construction Floor Sound Transmission Facility comprises two reverberation rooms (referred to in this report as the upper and lower rooms) with a moveable test frame between the two rooms. Both rooms have an approximate volume of 175 m3. For impact sound transmission, only the lower room is used. A calibrated Bruel & Kjaer condenser microphone (type 4166 or 4165) with preamp is moved under computer control to nine positions, and measurements are made using an 8-channel National Instrument NI 4472 system installed in a computer. The room has 4 bi-amped loudspeakers driven by separate amplifiers and incoherent noise sources. To increase randomness of the sound field, there are fixed diffusing panels in the room.
Test Procedure: Impact sound transmission measurements were conducted in accordance with ASTM E492-09, “Standard Test Method for Laboratory Measurement of Impact Sound Transmission Through Floor-Ceiling Assemblies Using the Tapping Machine”. This method uses a standard tapping machine placed at four prescribed positions on the floor. One-third octave band sound pressure levels were measured for 32 seconds at each microphone position in the receiving room and then averaged to get the average sound pressure level in the room. Five sound decays were averaged to get the reverberation time at each microphone position in the receiving room; these nine reverberation times were averaged to get the spatial average reverberation times for the room. The spatial-average sound pressure levels and reverberation times of the receiving room were used to calculate the Normalized Impact Sound Pressure Levels.
Significance of Test Results: ASTM E492-09 requires measurements in 1/3-octave bands in the frequency range 100 Hz to 3150 Hz. Within this range, reproducibility has been assessed by inter-laboratory round robin studies. The standard recommends making measurements and reporting results over a larger frequency range, and this report presents such results, which may be useful for expert evaluation of the specimen performance. The precision of results outside the standard ranges has not been established, and is expected to depend on laboratory-specific factors such as room size and specimen dimensions.
Impact Insulation Class (IIC): The Impact Insulation Class (IIC) was determined in accordance with ASTM E989-06, “Standard Classification for Determination of Impact Insulation Class (IIC)”. It is a single number rating scheme intended to rate the effectiveness of floor-ceiling assemblies at preventing the transmission of impact sound from the standard tapping machine. A higher IIC value indicates a better floor performance.
In Situ Performance: Ratings obtained by this standard method tend to represent an upper limit to what might be measured in a field test, due to structure-borne transmission (“flanking”) and construction deficiencies in actual buildings