
OECD/SETH-2 Project PANDA and MISTRA Experiments, Final ... · NEA/CSNI/R(2012)5 5 FOREWORD The...
86
Nuclear Safety NEA/CSNI/R(2012)5 April 2012 www.oecd-nea.org N U C L E A R E N E R G Y A G E N C Y Investigation of Key Issues for the Simulation of Thermal- hydraulic Conditions in Water Reactor Containment OECD/SETH-2 Project PANDA and MISTRA Experiments Final Summary Report
Transcript of OECD/SETH-2 Project PANDA and MISTRA Experiments, Final ... · NEA/CSNI/R(2012)5 5 FOREWORD The...
Nuclear SafetyNEA/CSNI/R(2012)5April 2012
www.oecd-nea.org
N U C L E A R E N E R G Y A G E N C Y
Investigation of Key Issues for the Simulation of Thermal-hydraulic Conditions in Water Reactor Containment
OECD/SETH-2 Project PANDA and MISTRA Experiments Final Summary Report

Unclassified NEA/CSNI/R(2012)5 Organisation de Coopération et de Développement Économiques Organisation for Economic Co-operation and Development 06-Apr-2012
___________________________________________________________________________________________
_____________ English text only NUCLEAR ENERGY AGENCY
COMMITTEE ON THE SAFETY OF NUCLEAR INSTALLATIONS
OECD/SETH-2 PROJECT PANDA AND MISTRA EXPERIMENTS
FINAL SUMMARY REPORT
Investigation of Key Issues for the Simulation of Thermal-Hydraulic Conditions in Water Reactor
Containment
JT03319395
Complete document available on OLIS in its original format
This document and any map included herein are without prejudice to the status of or sovereignty over any territory, to the delimitation of
international frontiers and boundaries and to the name of any territory, city or area.
NE
A/C
SN
I/R(2
01
2)5
Un
classified
En
glish
text o
nly
NEA/CSNI/R(2012)5
2
ORGANISATION FOR ECONOMIC CO-OPERATION AND DEVELOPMENT
The OECD is a unique forum where the governments of 34 democracies work together to address the economic, social
and environmental challenges of globalisation. The OECD is also at the forefront of efforts to understand and to help
governments respond to new developments and concerns, such as corporate governance, the information economy and the
challenges of an ageing population. The Organisation provides a setting where governments can compare policy experiences,
seek answers to common problems, identify good practice and work to co-ordinate domestic and international policies.
The OECD member countries are: Australia, Austria, Belgium, Canada, Chile, the Czech Republic, Denmark, Estonia,
Finland, France, Germany, Greece, Hungary, Iceland, Ireland, Israel, Italy, Japan, Luxembourg, Mexico, the Netherlands, New
Zealand, Norway, Poland, Portugal, the Republic of Korea, the Slovak Republic, Slovenia, Spain, Sweden, Switzerland, Turkey,
the United Kingdom and the United States. The European Commission takes part in the work of the OECD.
OECD Publishing disseminates widely the results of the Organisation‟s statistics gathering and research on economic,
social and environmental issues, as well as the conventions, guidelines and standards agreed by its members.
This work is published on the responsibility of the OECD Secretary-General. The opinions expressed and arguments employed herein do not necessarily reflect the official
views of the Organisation or of the governments of its member countries.
NUCLEAR ENERGY AGENCY
The OECD Nuclear Energy Agency (NEA) was established on 1 February 1958. Current NEA membership consists of
30 OECD member countries: Australia, Austria, Belgium, Canada, the Czech Republic, Denmark, Finland, France,
Germany, Greece, Hungary, Iceland, Ireland, Italy, Japan, Luxembourg, Mexico, the Netherlands, Norway, Poland,
Portugal, the Republic of Korea, the Slovak Republic, Slovenia, Spain, Sweden, Switzerland, Turkey, the United Kingdom
and the United States. The European Commission also takes part in the work of the Agency.
The mission of the NEA is:
– to assist its member countries in maintaining and further developing, through international co-operation, the
scientific, technological and legal bases required for a safe, environmentally friendly and economical use of
nuclear energy for peaceful purposes, as well as
– to provide authoritative assessments and to forge common understandings on key issues, as input to government
decisions on nuclear energy policy and to broader OECD policy analyses in areas such as energy and sustainable
development.
Specific areas of competence of the NEA include the safety and regulation of nuclear activities, radioactive waste
management, radiological protection, nuclear science, economic and technical analyses of the nuclear fuel cycle, nuclear law
and liability, and public information.
The NEA Data Bank provides nuclear data and computer program services for participating countries. In these and
related tasks, the NEA works in close collaboration with the International Atomic Energy Agency in Vienna, with which it
has a Co-operation Agreement, as well as with other international organisations in the nuclear field.
This document and any map included herein are without prejudice to the status of or sovereignty over any territory, to the delimitation of
international frontiers and boundaries and to the name of any territory, city or area.
Corrigenda to OECD publications may be found online at: www.oecd.org/publishing/corrigenda.
© OECD 2012
You can copy, download or print OECD content for your own use, and you can include excerpts from OECD publications, databases and multimedia
products in your own documents, presentations, blogs, websites and teaching materials, provided that suitable acknowledgment of the OECD as source and copyright owner is given. All requests for public or commercial use and translation rights should be submitted to [email protected]. Requests for
permission to photocopy portions of this material for public or commercial use shall be addressed directly to the Copyright Clearance Center (CCC) at
[email protected] or the Centre français d'exploitation du droit de copie (CFC) [email protected].

NEA/CSNI/R(2012)5
3
COMMITTEE ON THE SAFETY OF NUCLEAR INSTALLATIONS
The Committee on the Safety of Nuclear Installations (CSNI) of the OECD Nuclear Energy Agency
(NEA) is an international committee made up of senior scientists and engineers. It was set up in 1973 to
develop, and co-ordinate the activities of the Nuclear Energy Agency concerning the technical aspects of
the design, construction and operation of nuclear installations insofar as they affect the safety of such
installations. The Committee‟s purpose is to foster international co-operation in nuclear safety among the
OECD member countries.
The CSNI constitutes a forum for the exchange of technical information and for collaboration
between organisations, which can contribute, from their respective backgrounds in research, development,
engineering or regulation, to these activities and to the definition of the programme of work. It also reviews
the state of knowledge on selected topics on nuclear safety technology and safety assessment, including
operating experience. It initiates and conducts programmes identified by these reviews and assessments in
order to overcome discrepancies, develop improvements and reach international consensus on technical
issues of common interest. It promotes the co-ordination of work in different member countries including
the establishment of co-operative research projects and assists in the feedback of the results to participating
organisations. Full use is also made of traditional methods of co-operation, such as information exchanges,
establishment of working groups, and organisation of conferences and specialist meetings.
The greater part of the CSNI current programme is concerned with the technology of water reactors.
The principal areas covered are operating experience and the human factor, reactor coolant system
behaviour, various aspects of reactor component integrity, the phenomenology of radioactive releases in
reactor accidents and their confinement, containment performance, risk assessment, and severe accidents.
The Committee also studies the safety of the nuclear fuel cycle, conducts periodic surveys of the reactor
safety research programmes and operates an international mechanism for exchanging reports on safety
related nuclear power plant accidents.
In implementing its programme, the CSNI establishes co-operative mechanisms with NEA Committee
on Nuclear Regulatory Activities (CNRA), responsible for the activities of the Agency concerning the
regulation, licensing and inspection of nuclear installations with regard to safety. It also co-operates with
NEA Committee on Radiation Protection and Public Health and NEA Radioactive Waste Management
Committee on matters of common interest.
* * * * * * * * * * * *
The opinions expressed and the arguments employed in this document are the responsibility of the
authors and do not necessarily represent those of the OECD.
Requests for additional copies of this report should be addressed to:
Nuclear Safety Division
OECD Nuclear Energy Agency
Le Seine St-Germain
12 boulevard des Iles
92130 Issy-les-Moulineaux
France

NEA/CSNI/R(2012)5
4
NEA/CSNI/R(2012)5
5
FOREWORD
The OECD/SETH-2 project was carried out during the period 2007-2010 under the auspices of the Nuclear
Energy Agency (NEA) and with support provided by the Czech Republic, Finland, France, Germany,
Japan, Korea (Republic of), Slovenia, Sweden and Switzerland. PSI (Switzerland) and the CEA (France)
acted as Operating Agents.
The project investigations addressed hydrogen behaviour in the reactor containment during a postulated
severe accident. Hydrogen is of concern because, at some concentrations, deflagration can occur, resulting
in damage to the containment and the release of radioactive material into the environment. It is thus crucial
to know how the hydrogen mixes with air and steam, and if this mixing would lead to a uniform
distribution of the hydrogen or if it would accumulate in specific regions. The complexity in the evolution
of a severe accident is such that a rigorous analysis can be made only using advanced Lumped Parameter
(LP) and 3D computational tools. Nevertheless, the reliability of these computational tools in analysing a
severe accident has to be evaluated through extensive assessment and validation activities carried out by
comparing the codes against experimental data related to phenomena taking place during the accident. One
of the hindrances in the process of assessment and validation of computational tools is the lack of adequate
experimental data, with respect to the representation of the broad range of phenomena and scenarios
occurring in various LWR containments during postulated accident conditions. The data should be
obtained in large-scale multi-compartment facilities which would allow the distortion effect due to scaling
to be minimised. Also the data should be obtained with CFD-grade instrumentation, and this poses a
further challenge in the process of carrying out an experimental programme addressing issues which have a
high relevance to nuclear safety.
The OECD/SETH-2 project is based on experimental investigations performed in the PANDA (PSI) and
MISTRA (CEA) facilities, both of which are equipped with CFD-grade instrumentation. The investigations
increased the knowledge of hydrogen (helium is used to simulate hydrogen) stratification break-up induced
by heat and mass sources, or by the activation of a system such as a containment spray, cooler or heat
source simulating a recombiner. Other investigations allowed the effect of the sudden opening of hatches
on the hydrogen distribution within containment compartments to be addressed at large scale. The
OECD/SETH-2 project has generated a unique experimental database for code validation. The analysis
with various computational tools, carried out by the project participants, allowed an evaluation to be made
of the capabilities of various codes and areas to be identified where additional investigations are needed.
The experimental data and the project deliverables produced during the OECD/SETH-2 project have been
distributed to the project signatories. The Management Board of the OECD/SETH-2 project has agreed that
these data and the final project report could also be released to non-signatories after 31 December 2013.
However, the Management Board has recommended to the Operating Agents that the present summary
report, containing the main outcome of the OECD/SETH-2 project, be prepared for distribution to CSNI.

NEA/CSNI/R(2012)5
6

NEA/CSNI/R(2012)5
7
TABLE OF CONTENTS
Foreword ................................................................................................................................................. 5
Table of Contents .................................................................................................................................... 7
List of Figures ......................................................................................................................................... 8
List of Tables ........................................................................................................................................... 9
Executive Summary................................................................................................................................ 11
1. Introduction ..................................................................................................................................... 19
2. Objectives of the SETH-2 Project .................................................................................................. 23
3. Experimental Facilities ................................................................................................................... 25
3.1 PANDA facility ...................................................................................................................... 25
3.1.1 Facility design and main characteristics ..................................................................... 25
3.1.2 Main instrumentation .................................................................................................. 26
3.2 MISTRA facility ..................................................................................................................... 28
3.2.1 Facility design and main characteristics ..................................................................... 28
3.2.2 Main instrumentation .................................................................................................. 29
4 Experimental Programme .............................................................................................................. 33
4.1 PANDA test series main parameters ....................................................................................... 34
4.2 MISTRA test series main parameters ..................................................................................... 35
4.3 PANDA and MISTRA vertical fluid release series ................................................................ 38
4.3.1 PANDA tests: ST1 series............................................................................................ 38
4.3.2 MISTRA tests: INITIALA-LOWMA and INITIALS-LOWMS ................................ 40
4.3.3 The common MISTRA-PANDA tests ........................................................................ 50
4.4 PANDA horizontal fluid release series: ST2 .......................................................................... 51
4.5 MISTRA vertical fluid jet impinging on horizontal ring plate series: INITIALS-IMPIGS ... 52
4.6 PANDA and MISTRA spray series ........................................................................................ 55
4.6.1 PANDA tests: ST3 series............................................................................................ 55
4.6.2 MISTRA tests: INITIALS-SPRAY ............................................................................ 58
4.7 PANDA containment cooler series: ST4 ................................................................................ 62
4.8 PANDA heat source simulating a recombiner series: ST5 ..................................................... 64
4.9 MISTRA natural convection due to wall heat transfer series: INITIALS-NATHCO ............ 66
4.10 MISTRA classification of different mitigation means ............................................................ 68
4.11 PANDA opening-hatches series: ST6 ..................................................................................... 70
5 Conclusions ...................................................................................................................................... 73
6 References ........................................................................................................................................ 75
PSI Project Deliverables .................................................................................................................... 76
CEA Project Deliverables ................................................................................................................. 78
Common Test References – SETH-2 Publications Status ................................................................ 80
Appendix 1. Summary and Conclusions of SETH2 Project Project Seminar .......................................... 83

NEA/CSNI/R(2012)5
8
List of figures
Figure 1. PANDA Facility ................................................................................................................. 25
Figure 2. PANDA facility schematic (a) and facility configuration for ST6 series (b) ..................... 26
Figure 3. Velocity development near the stratification region for a PANDA SETH-2 test ............... 27
Figure 4. Side view of MISTRA facility ............................................................................................ 28
Figure 5. MISTRA main geometrical characteristics ......................................................................... 28
Figure 6. Internal view of MISTRA, from the top, with its compartment,
instrumentation and the location of some gas and steam injection points .......................... 29
Figure 7. MISTRA steam and gas injection locations ........................................................................ 29
Figure 8. Example of the air fountain impinging on the helium layer
with the velocity field and iso-velocity curves here for Fr=1.09. ....................................... 30
Figure 9. Example of temperature measurement, with temperature profile in time and
the associated thermal flow pattern map ― here in the upper region of MISTRA ............ 30
Figure 10. Temperature contour maps recorded during experiment ST1_4 ......................................... 38
Figure 11. Velocity field development of the erosion front for experiment ST1_4 ............................. 39
Figure 12. Experimentally (left) and numerically (right) determined instantaneous velocity
field of the erosion front for experiment ST1_7_2 ............................................................. 39
Figure 13. Normalized eroded volume as a function of normalized erosion time ............................... 40
Figure 14. Helium stratification characteristics at the end of helium injection .................................... 42
Figure 15. Diffusion effect, comparison of experiment and theory for the vertical evolution
of helium stratification at different times after the end of helium injection, t1. ................. 42
Figure 16. Vertical evolution of helium stratification during the air injection phase,
at different times ................................................................................................................. 44
Figure 17. Time evolution of helium concentration at the height of 5.9m ........................................... 44
Figure 18. INITIALS stratification characteristics ............................................................................... 45
Figure 19. INITIALS helium concentration evolution inside the stratification region ........................ 46
Figure 20. INITIALS gas temperature evolution inside the stratification –
angle 345°; radius~1m ........................................................................................................ 46
Figure 21. INITIALS transient behaviour of the temperature field ..................................................... 47
Figure 22. LOWMS short-term helium concentration evolution inside the stratification .................... 48
Figure 23. LOWMS short-term gas temperature evolution inside the stratification ............................ 48
Figure 24. LOWMS transient behaviour of the temperature field ....................................................... 49
Figure 25. LOWMS long-term helium concentration evolution inside the vessel ............................... 49
Figure 26. View of MISTRA and PANDA facilities showing sensor locations .................................. 50
Figure 27. Evolution of the helium concentration at several measurement locations
along the axis of Vessel 1 for tests ST2_3 (a) and ST2_4 (b) ............................................. 52
Figure 28. PIV measurements of gas velocity at the exit of the IP in Vessel 1 (a).
Measurement by thermal anemometers of the gas velocity in the IP close
to the exit to Vessel 1 (b). ................................................................................................... 52
Figure 29. IMPIGS short-term helium concentration evolution inside the stratification region .......... 53
Figure 30. IMPIGS short-term gas temperature evolution inside the stratification – angle 345°;
radius~1m ........................................................................................................................... 54
Figure 31. IMPIGS transient behaviour of the temperature field ......................................................... 54
Figure 32. IMPIGS long-term helium concentration evolution inside the vessel ................................ 55
Figure 33. Schematic of PANDA for the spray series tests ................................................................. 56
Figure 34. Temperature contour maps for test ST3_2 .......................................................................... 57
Figure 35. Helium content in Vessel 1, the IP and Vessel 2 in PANDA test ST3_2 ........................... 58
Figure 36. SPRAY short-term helium concentration evolution inside the stratification region .......... 59
Figure 37. SPRAY short-term gas temperature evolution inside the stratification .............................. 60
Figure 38. SPRAY transient behaviour of the temperature field ......................................................... 61
Figure 39. SPRAY long-term helium concentration evolution inside the vessel ................................. 61

NEA/CSNI/R(2012)5
9
Figure 40. Temperature contour map for the test with the cooler at the middle position .................... 63
Figure 41. Temperature contour map for the test with the cooler at the top position .......................... 63
Figure 42. Example of velocity field obtained for test ST4_2, showing gas release from the cooler .. 64
Figure 43. Helium concentration evolution for tests ST5_1 and ST5_2 .............................................. 65
Figure 44. NATHCO short-term helium concentration evolution inside the stratification .................. 66
Figure 45. NATHCO short-term gas temperature evolution inside the stratification –
angle 345°; radius~0.85m ................................................................................................... 67
Figure 46. NATHCO transient behaviour of the temperature field ...................................................... 67
Figure 47. NATHCO long-term helium concentration evolution inside the vessel ............................. 68
Figure 48. Classification of the different mitigation means – Helium/Air mixing efficiency ............. 69
Figure 49. Schematic of PANDA for the opening-hatches test ST6_2 ................................................ 70
Figure 50. Temperature contour maps for Vessel 1 and Vessel 2 at selected times: ST6_2 ................ 71
List of tables
Table 1. Organization signatories of the OECD/SETH-2 project ..................................................... 20
Table 2. PANDA main characteristics .............................................................................................. 26
Table 3. Number of thermocouples and capillaries installed in Vessel 1, Vessel 2, IP and cooler. . 27
Table 4. Test series description and nomenclature ........................................................................... 33
Table 5. Test parameters for ST1 test series: Helium stratification break-up
with vertical release ............................................................................................................ 34
Table 6. Test parameters for ST2 test series: Helium stratification break-up
with horizontal release ........................................................................................................ 34
Table 7. Test parameters for ST3 test series. Spray .......................................................................... 34
Table 8. Test parameters for ST4 test series: Containment cooler ................................................... 34
Table 9. Test parameters for ST5 test series: Heat source (representing operating recombiner) ...... 34
Table 10. Test parameters for ST6 test series: Sudden hatch opening ................................................ 35
Table 11. Test parameters of INITIALA_3 test series: Helium stratification build-up in air ............. 35
Table 12. Test parameters of LOWMA test series: Helium stratification break-up ........................... 35
Table 13. Test parameters of INITIALS test series: Helium stratification break-up
in air-steam mixture ............................................................................................................ 35
Table 14. Test parameters of INITIALS_1+LOWMS test series: Effects of a vertical steam jet
on helium stratification ....................................................................................................... 36
Table 15. Test parameters of INITIALS_1+IMPIGS test series: Effects of a vertical impinging
steam jet on helium stratification ........................................................................................ 36
Table 16. Test parameters of INITIALS_1+SPRAY test series: Effects of spray on stratification .... 37
Table 17. Test parameters of INITIALS_1+NATHCO test series: Effects of wall heat-up
on helium stratification ....................................................................................................... 37

NEA/CSNI/R(2012)5
10

NEA/CSNI/R(2012)5
11
EXECUTIVE SUMMARY
Background
The experimental investigations carried out for the OECD/SETH-2 project (2007-2010) in the PANDA
(PSI, Switzerland) and MISTRA (CEA, France) facilities addressed the effect of heat and mass sources, as
well as of heat sinks or the activation of a safety system, on the hydrogen transport in a nuclear
containment, thus developing a data base of these phenomena for code validation purposes.
The analysis of thermal-hydraulic processes that might occur in a nuclear water reactor containment
building under severe accident conditions is very complex. This complexity arises from the large number
of dependent variables which must be considered for the analysis. For instance, Boiling Water Reactor
(BWR) and Pressurized Water Reactor (PWR) designs have some particular differences which must be
properly accounted for. Additionally, the performance of active (e.g. spray, cooler) or passive safety
systems (e.g. recombiner, rupture disks, Passive Cooling Condenser (PCC) depends on the thermal-
hydraulic conditions in the containment at the moment they are activated, and, consequently, their
effectiveness most probably varies during the evolution of a postulated accident sequence. The variety of
physical phenomena occurring during the evolution of a transient, e.g. the generation of jets and plumes
with positive or negative buoyancy, the diffusion of gas species, the turbulent mixing of gas streams and a
possibly build-up of stratifications, the gas transport caused by density or pressure differences, the
condensation induced by cold structure materials or the activation of safety systems and the re-evaporation
of water all introduce additional levels of complexity to this analysis.
Apart from experiments, advanced Lumped Parameter (LP) and Computational Fluid Dynamic (CFD)
codes are the only tools available for analyzing water reactor behaviour during postulated design and
beyond-design-basis accidents. For the application of numerical tools to nuclear safety issues, reliability is
a key priority. At present, the validation of these codes is a limiting factor in their application. The
assessment and validation of computational tools requires adequate experimental data recorded in facilities
with instrumentation dedicated especially for the measurement of gas mixture compositions, temperatures
and velocities, with the necessary temporal and spatial resolutions needed to validate both advanced LP
and CFD codes.
An area in which there still exists significant gaps, both in the understanding of the physical phenomena and
in CFD-grade experimental data, is the hydrogen risk in a water reactor containment during the evolution of a
postulated severe accident. Through the accumulation of hydrogen gas, the concentration of hydrogen can
rise to a level at which detonation might occur and could cause potential damage to the containment, which
could, in turn, lead to the release of radioactive material into the environment. It is thus crucial to know (i)
how the hydrogen mixes with air and steam and (ii) if this mixing would lead to a uniform distribution of the
hydrogen, or (iii) if the hydrogen would accumulate in specific regions. These aspects of the hydrogen risk in
a water reactor have been deeply investigated in the OECD/SETH-2 project.
The OECD-SETH-2 project was carried out under the auspices of the Nuclear Energy Agency and with
support provided by the Czech Republic, Finland, France, Germany, Japan, Korea (Republic of), Slovenia,
Sweden and Switzerland. PSI (Switzerland) and CEA (France) acted as Operating Agents.

NEA/CSNI/R(2012)5
12
Objective of the work
The objective of the OECD/SETH-2 project was to investigate the break-up of hydrogen stratification in an
Light Water Reactor (LWR) containment caused by heat and mass sources and sinks, as well as by the
effect of the activation of a safety system (e.g. spray, heat source simulating a recombiner, containment
cooler). The experimental investigations were carried out in the multi-compartment, large-scale PANDA
and MISTRA facilities, which are equipped with CFD-grade instrumentation. The effect on the hydrogen
concentration of the sudden opening of hatches separating the two containment compartments was also
investigated in one of the OECD/SETH-2 test series.
The accompanying analytical activities performed with various computational tools during the project (e.g.
for the definition of test conditions, pre and post test analysis) have already proven the relevance of the
SETH-2 experimental database for the assessment of advanced Lumped Parameter and CFD code
capabilities. Areas where further experimental investigations are needed were also identified.
Work performed
PANDA is a large-scale, multi-compartment facility with a total volume of approximately 515 m3 and an
overall height of 25 m. The facility operating range is 0-10 bar and up to 200 °C. The two main vessels,
Vessel 1 and Vessel 2, used in SETH-2 are each 4 m in diameter and 8 m in height, interconnected
horizontally by a large, bent pipe identified as IP (i.e. Interconnecting Pipe). The component spray, heat
source and cooler were installed in Vessel 1.
MISTRA is a large-scale, multi-compartment facility with a free volume of 97.6 m3, an internal diameter
of 4.25 m and a height of 7.38 m. The maximum operating conditions are 6 bar, with a mean gas
temperature of 150°C (200°C at the steam injection nozzle).
Thirty tests are specified in the OECD/SETH-2 Agreement – twenty four tests in PANDA and six tests in
MISTRA. The total number of tests given on the last line of the Table below includes the tests specified in
the OECD/SETH-2 Agreement plus the tests needed to identify optimal test procedures, tests to verify
repeatability, and tests aiming at clarifying further phenomenological aspects.
PANDA MISTRA
Separate Effects/Coupled Effects Test Series: Break-up of
stratification:
Low/high momentum vertical fluid release at various positions ST1 LOWMA-
LOWMS
Low momentum horizontal jet ST2
Vertical steam jet impinging on horizontal ring plate IMPIGS
Heat-up or cool-down of the condenser NATHCO
Component tests:
Containment spray ST3 SPRAY
Containment cooler ST4
Heat source simulating a recombiner ST5
System tests:
Sudden opening of hatches separating two volumes ST6
Total number of tests as specified in the SETH-2 Agreement 24 6
Total number of tests performed in the SETH-2 programme 41 37
Within the “Low/high momentum vertical fluid release at various positions” series, counter-part tests were
defined in the MISTRA and PANDA facilities. The Management Board of the SETH-2 project decided to

NEA/CSNI/R(2012)5
13
also release the experimental data of the counter-part test to organizations not participating in the project.
This was done with the objective of encouraging, and therefore enhancing, the continued assessment and
validation of advanced LP and CFD tools.
The PANDA-MISTRA counter-part tests were analysed by the Operating Agents with various
computational tools, and the results have been submitted/presented at various international conferences.
PANDA series
Six PANDA test series (ST1 to ST6) were conducted, each requiring facility modifications, such as the
implementation of new components, auxiliary systems, data acquisition and control systems. The locations of
sensors were adapted in each series with the aim of obtaining optimal sensor grid spatial resolution. In
addition to the instrumentation already existing in PANDA (e.g. that used in the previous SETH project), a
major effort was made for the SETH-2 project to upgrade the instrumentation; upgrades included increasing
the gas concentration measurement locations in Vessel 1 and Vessel 2 through the purchase of a second mass
spectrometer, as well as increasing the number of temperature sensors, developing a novel thermal
anemometer for the velocity measurements and developing an additional seeding system for the PIV setup.
Also within the SETH-2 programme, new components such as the containment cooler, heat source
simulating a recombiner, and spray were designed, purchased and successfully implemented in PANDA.
MISTRA series
The CEA carried out its part of the SETH-2 experimental programme in two steps, with a common base
between these steps to maintain the same characteristics of the helium stratification for all test series; this
allows the break-up phenomena efficiency to be evaluated for all cases.
The first step of the programme concerns the build-up of air-helium stratification, followed by a transient
phase with the release of a low-momentum air jet at a high off-centre location; these are referred to as the
INITIALA-LOWMA tests. These test conditions provided the flexibility to quantify the gas stratification
break-up resulting from the air jet. Depending on the interaction Froude number, different regimes were
identified, including pure diffusive mixing, global dilution and slow erosion processes.
The second step concerned the introduction of the steam to approximate the conditions of gas mixtures
encountered in the case of a severe accident with a LOCA scenario. The first challenge was to obtain the
same characteristics of helium stratification in the presence of a homogeneous mixture of steam and air as the
initial conditions (referred to as the INITIALS test). The stratification break-up phenomena were then
applied, making use of the efficiency of a mitigation effect with a low-momentum vertical steam jet referred
to as LOWMS (analogous to the first test series with air-helium). The effects of an impinging vertical steam
jet on the annular ring of the compartment (referred to as IMPIGS) was representative of the complex
geometry which may occur in a reactor containment, and the thermal effect of the heat-up of two MISTRA
condensers (called the NATHCO test), as well as a spray injection (referred to as SPRAY), also played
important roles.
Results and their significance
The phenomena investigated in the PANDA and MISTRA facilities within the OECD/SETH-2 project
have a high relevance to the safety of LWRs. In particular, they provided an important contribution
towards the understanding of hydrogen transport stratification build-up and break-up by heat and mass
sources or sinks, or by the activation of safety systems.

NEA/CSNI/R(2012)5
14
PANDA
The main parameters varied in the ST1 series were the plume/jet momentum, the exit location (Vessel 1,
central and near-wall locations) and the initial He concentration. An “ad-hoc” modified Froude number at
the “ideal helium interface” was defined to characterize the relative strength of inertia and buoyancy in the
region of interaction of the jet with the lower density gas layer. More than one test was performed with the
same initial modified Froude number and different test parameters.
The first step of the PANDA experimental series ST1 consisted of creating a helium-rich layer, with a helium
content of either 20 or 40% and a thickness of approximately 2 m, in the upper region of Vessel 1. This
helium layer was eroded by steam jets of different momentum. In order to highlight the contribution of either
turbulence or diffusion to the mixing process, an additional experiment was conducted in which a helium-rich
layer at the top of Vessel 1 diffused into the lower region for several hours. The containment pressure was
constant in each test, and condensation was avoided. The erosion of a layer is a complex process, during
which molecular diffusion, turbulent mixing, direct erosion and dilution take place successively and/or
simultaneously in different parts of the vessel. For large Froude numbers (≥ 2.6), layer break-up occurred
rapidly and the initial momentum of the jet had a clear effect. This resulted in a much smaller amount of
steam needed to homogeneously mix the upper part of the vessel compared with the low momentum jet. For
low Froude numbers (≤ 1.3), the erosion rate appeared constant with time, and layer break-up occurred late in
time. The location of the wall near the injection point led to an inclination of the jet toward the wall, and its
distortion to becoming asymmetrical. Good consistency was shown in the various results. Additionally, the
results demonstrated the numerous physical mechanisms involved in the erosion process and the presence of
very complex phenomena to be modelled for the validation of advanced Lumped Parameter and CFD codes.
In the ST2 series, the effects of the erosion of a helium-rich layer, created in Vessel 1 by initially
horizontal steam injection, were investigated. The choice of test initial and boundary conditions allowed
the effects of geometry (steam injection from either Vessel 1 or Vessel 2), pressure (constant or with
pressurization), and condensation (with or without) to be investigated. Tests with increased complexity
allowed step-by-step code validation to be made, based on the data. It was shown that condensation alone
had a two-fold effect, the most prominent being that condensation resulted in helium accumulation at the
top of the layer caused by redistribution of the helium within the layer, starting from the bottom and rising
to the top of the vessel. Furthermore, it accelerated slightly the erosion/dilution of the bottom of the layer.
In the presence of pressurization, the primary observable effect on the lower part of the layer was
compression of the entire layer. The decay of the helium concentration was determined mainly (except at
the top of the layer) by this effect, the rate of which was determined by the rate of pressurization. This rate
was slower when condensation occurred simultaneously. Pressurization alone was shown to have very little
effect on the helium concentration history at the top of the layer.
In the ST3 series, the effects of containment spray activation on the helium distribution in the containment
were investigated. In each ST3 series test, a helium-rich layer was created in the upper region of Vessel 1
(similar to the ST1 series), and the remaining volume was filled with air (one test), steam (one test), or steam-
air mixtures (two tests). The initial containment pressure was kept the same in each test. The spray injection
flow rate was also the same, and constant, for each test. The spray nozzle exit was oriented vertically, and
was in the region of the helium-rich layer. The phenomena taking place during the tests were gas
mixing/transport, stratification break-up/build-up, condensation, re-evaporation, entrainment, etc. The main
effect of the spray activation was to break up the helium stratification in the upper layer of Vessel 1. The
density difference induced by the steam condensation enhanced the inter-compartment flow transport through
the IP and caused a helium concentration build-up in Vessel 2. The mixing process affected the density of the
helium-rich mixture and consequently determined the locations in Vessel 2 where the helium concentration
would build up. From the study of mixing processes in the ST3 series, cases of helium concentration build-up
in the upper region or in the lower region of Vessel 2 have been observed.

NEA/CSNI/R(2012)5
15
In the ST4 series, the effect of containment cooler operation on the helium distribution in the containment
was investigated. The cooler designed for the tests consisted of eight tubes in a horizontal, staggered
serpentine layout, and enclosed in a casing with a single open face. In addition, a long duct was installed at
the bottom of the cooler to act as an exhaust chimney through which cold gas could leave the cooler. The
cooling water flow was distributed to the eight tubes through a manifold. The parameters investigated in
the ST4 series were the cooler position (Vessel 1, mid-height central region and upper region), the cooler
geometry (with or without duct), and the system pressure (kept constant or with pressurization). For each
test, a three-phase gas injection scenario was conducted (steam, helium-steam, steam). The cooler led to a
strong helium concentration build-up inside the cooler and in the upper region of Vessel 1. In general, the
helium negatively affected the cooler heat removal rate and produced a blockage of the flow through the
cooler duct. These effects were stronger when the cooler was located in the mid-height region of Vessel 1.
The ST5 series investigated the effect of a heat source on the helium distribution in the containment. The
design and dimensions of the heat source were typical of a recombiner. The heat power generated during
the tests was representative of the energy which would be released during the recombination of hydrogen
and oxygen for a mixture 5% rich in hydrogen. In each test, a helium-rich mixture was created in the upper
region of Vessel 1. The main parameter varied was the heat source location; tests with the heat source in
the lower region and tests with the heat source in the medium level region were conducted. In one test,
steam was injected during heat source activation. The experimental data for this series included the gas
mixture composition and temperature in the vessels and inside the heat source. The flow rate through the
heat source was derived from the velocity measurements taken at the entrance of the heat source using a
novel thermal anemometer. The test conditions for this series were based on planning calculations
performed with four computational tools (GOTHIC, FLUENT, CFX, TONUS) and carried out by the
OECD/SETH-2 project participants. The heat source location was found to have a major effect on the
break-up of the helium-rich layer, while the injection of steam had only a minor effect. The break-up of the
helium-rich layer was fast when the heat source was located in the mid-height position. Nevertheless, the
dilution of the helium concentration above the heater entrance was more effective when the heat source
was located in the lower region, as the inter-compartment flow was enhanced. In all cases, mixing below
the bottom of the heater could not be produced by the heat source, or rather, it was always extremely slow.
The effects on the overall helium distribution inside the containment of the sudden opening of hatches
separating two containment compartments (initially at different pressures and with different gas
compositions) were investigated in the ST6 series. In the PANDA tests, these two compartments were
represented by the upper vessels (~180 m3) and the lower vessels (~241 m
3). In one of the tests, the initial
temperature in one compartment was low, and thus condensation could take place during the test. The test
results revealed that two main phases characterized the flow transport. The first phase describes the
pressure transient during which one compartment depressurized and the other pressurized (this phase lasted
for about 100 s). The second phase after the pressure equalization occurs as a result of gas concentration
and temperature gradients (this phase lasted up to 600 s). The gas mixture distribution at the end of the
tests exhibited strong stratification in both vessels of the compartment. A helium-rich mixture was trapped
in the upper region of Vessel 1, and an air-rich mixture was trapped in the lower region of Vessel 2. A
convective flow was established between the lower region of Vessel 1 and the upper region of Vessel 2.
The analysis performed so far using the GOTHIC code revealed that, for the correct prediction of gas
stratification in both vessels, an accurate prediction of the evolution and extension of the trapped regions is
necessary. An inaccurate simulation of the location of the density interface in Vessel 1 would determine an
incorrect prediction of the natural circulation flow between the two vessels, and consequently a false
prediction of the overall helium distribution.

NEA/CSNI/R(2012)5
16
MISTRA
To achieve the initial conditions of the first test series, with stable and sharp helium stratification, several
tests were based on the injection of helium in the upper gaseous volume of the facility at room temperature
and pressure. The initial layer chosen provided a layer with an approximate helium molar fraction of 40% at
the top of the facility. A concentration gradient area located below and up to an elevation of 6100 mm had a
He molar fraction ranging from 38% to 1%, distributed over a 0.7 m depth (20% helium molar averaged
concentration). As a first test, the behaviour of this stratified layer without air injection was followed, and
showed the erosion of the layer by a diffusive process. These results were successfully compared with the
theoretical evolution of the diffusion of a distribution represented initially by a Heaviside function. When air
was injected below the stratified layer, modification of the transient behaviour was observed. Nevertheless, if
the air flow rate was small, namely in tests LOWMA_1 and LOWMA_2, with corresponding interaction
Froude numbers of 0.1 and 0.31, the erosion of the stratified layer was still governed by the diffusion process.
There was no noticeable difference between these two tests and the INITIALA-3 diffusion test. On the other
hand, the larger interaction Froude number of 3.38 (LOWMA_4 test) led to the rapid break-up of the
stratified layer with fast global mixing. For an interaction Froude number equal to 1 (the LOWMA_3 test),
the air flow penetrated the lower part of the helium cloud and the stratification became unstable. For the
resulting fountain flow, buoyancy-dominated mixing was observed: the stratification was pushed upward,
stiffened and eroded by the fountain‟s entrainment. This definition of the interaction Froude number allowed
the ability of the air jet to erode or to dilute the stratified layer to be identified.
The second part of the MISTRA experimental programme was dedicated to “with steam” conditions. The
same procedure was applied here, with the preliminary phase of the stratification build-up in the presence of
steam. The build-up of the stratified layer was more complex here than that of INITIALA. For example,
before the helium injection could take place it was necessary that a steady state with a homogeneous
air/steam mixture was obtained, avoiding wall and bulk condensation. The initial homogeneous mixture of air
and steam was established, corresponding to an air and superheated-steam mixture with an average steam
molar fraction of 56%, at a pressure of 1.09 bar and a mean gas temperature of 99 °C. The stratified layer
built up had the same characteristics as the INITALA layer.
According to the test objectives, the same characteristics of stratified layers with and without steam were
successfully reproduced. The objectives of the “with steam” test series were also the first to characterize
the erosion of a stratified helium layer by means of all of the following:
• Low momentum vertical steam injection – LOWMS test.
• The heat-up of two condensers – NATHCO test.
• A spray – SPRAY test.
• Impinging vertical steam injection on the annular ring of the compartment – IMPIGS test.
Each of the four effects was studied in terms of the short-term and long-term evolution of the helium
concentration and cloud temperature. The results of these effects were analyzed in terms of efficiency, and
this efficiency was subsequently classified according to several criteria proposed by the CEA.
The criterion based on a “global” point of view corresponds to the decrease of the normalized volume of
helium in the helium cloud. From this point of view, steam mixing by a direct jet (LOWMS) and an
impinging jet (IMPIGS) appeared to be the most efficient. In contrast, the thermal effect due to the heat up
of the condenser (NATHCO) wall provided low efficiency close to the “natural” stratification without any
mitigation effect. At the intermediate stage, water spraying (SPRAY) produced two opposite effects,
depending on the spray conditions (water mass flow rate and duration). The resulting efficiency
corresponded to the balance between the mixing of the concentration due to the water jet, increase of the
helium concentration as a result of the steam mass condensation, and decrease of the helium concentration
in the cloud. A second criterion corresponds to the evolution of the molar helium concentration in the
air/helium mixture inside the helium cloud. The effect of the variation of the water steam concentration has

NEA/CSNI/R(2012)5
17
been eliminated, so that only the mixing effects have been assessed. In this case, the more efficient
mechanism appears to be the spray, which produced rapid mixing and induced the contribution of a large
volume of air into the mixing process in the upper area and inside the compartment. In the case of steam
injection, an intermediate efficiency was observed. Direct jet injection (LOWMS) was efficient at the
beginning but, later, the impinging jet (IMPIGS) became more efficient due to the higher volume of air
involved in the mixing process. The thermal effect (NATHCO) remained the least efficient effect on the
mitigation. The last criterion, based on a “long term” point of view, corresponds to the evolution of the
helium concentration inside the entire vessel on a long-term basis (at least two hours after the end of the
active phase of the mitigation means tested).
PANDA-MISTRA common tests
The tests LOWMA3 in MISTRA and ST1-7 in PANDA belong to the “Low/high-momentum vertical fluid
release series”. The boundary and initial conditions were almost the same, except for the distance between the
injection location and the bottom of the stratified layer. The different regimes of pure molecular diffusion
mixing, global dilution and slow erosion were observed and analyzed, based on local and global behaviour,
and dimensionless quantities have been proposed. The interaction Froude number can be used to identify the
ability of the air jet to erode, or to dilute, the stratified layer. A second Froude number has been proposed to
analyse the effect of the layer width. The interaction Froude number has to be considered with care, as it is
calculated for initial conditions only. It evolves with time, leading to changes in the erosion process through
the test, and this is truer for PANDA, due to the important helium reservoir at the top of the facility.
Regarding the time scale, small interaction Froude number leads to mixing process driven by molecular
diffusion. These tests are particular suited to the evaluation of the effect of particular facility design on the
evolution of gas stratification break-up phenomena.
Conclusions and recommendations
The investigations carried out in the PANDA and MISTRA facilities within the OECD/SETH-2 project
have contributed to the advancement of knowledge on issues which have high safety relevance for LWRs.
The experimental programme carried out addressed phenomena such as hydrogen transport, stratification
build-up and break-up, condensation, etc., which would take place in an LWR containment during the
evolution of a postulated severe accident. Some of the SETH-2 series tests investigated basic flow
phenomena, whereas other tests investigated the more specific effects of safety component activation and
the sudden opening of hatches on the hydrogen concentration.
It is recommended to create an experimental database on the interaction of basic flow structures (jet/plume)
with flow obstruction (vertical/horizontal wall) in a future investigation. It is also recommended to continue
with component tests by increasing the complexity of the scenarios (e.g. two recombiners, simultaneous spray
and cooler, etc.). Further opening-hatch tests, addressing more realistic conditions (including the activation of
safety systems, such as spray injection), are also necessary. The analytical activities carried out by the project
participants allowed the assessment of the capabilities of various computational tools, including GOTHIC,
FLUENT, TONUS, CFX, ASTEC and others for predicting the SETH-2 tests.
An OECD/SETH-2 analytical seminar has been held on 12-13 September 2011, attracting 35 participants
and 15 observers from 16 countries. New analyses were presented and key simulation challenges were
identified during the seminar. Analyses of common tests in the two facilities were discussed in detail, and
progress regarding distribution of light gas in the containment and its effective mixing by means of
different safety features was highlighted. The applications of the results and their significance for
containment analyses were also addressed. The following topics and issues, for which further research is
necessary, were identified at the seminar:
• Additional investigations in different experimental configurations (e.g. jets with more diffuse sources).

NEA/CSNI/R(2012)5
18
• Measurements of velocity fields during experiments, which should be used for validation of CFD
codes.
• Improvement of numerical and physical models, especially for representing diffusion processes and
turbulence of buoyant flows.
• Combination of influences of different engineered safety features on non-homogeneous containment
atmosphere.
• Effects of compartment geometry in a containment.
• Scaling up of experimental results from experimental facilities to actual containments.
These additional investigations have been included in the updated version of the OECD/NEA HYMERES
project proposal which was initially presented at the CSNI 49th Meeting in June 2011 and then further
discussed at the HYMERES expert meeting held on 14 September 2011.

NEA/CSNI/R(2012)5
19
INTRODUCTION
The analysis of thermal-hydraulic processes occurring in an LWR containment building under accident
conditions is very complex. This complexity arises from the fact that a large number of inter-related
variables must be taken into consideration for the analysis. For instance, BWRs and PWRs have some
peculiar differences in their design which should be properly accounted for in the analysis. The
performance of active (e.g. spray, cooler, etc.) or passive safety systems (e.g. recombiner, rupture foils,
PCC, etc.) would depend on the thermal-hydraulics conditions in the containment and therefore would vary
during the evolution of a postulated transient. Complexity lies also in the modelling of the physical
phenomena occurring during the evolution of a transient, e.g. jet and plume (with positive or negative
buoyancy), diffuse flow, mixing and stratification, transport induced by density or pressure differences,
condensation induced by a wall or the activation of safety systems, re-evaporation phenomena, etc.
Advanced LP and CFD codes are the only tools available for analyzing LWR behaviour during postulated
design and beyond-design-basis accidents. During the past few years, the number of users of sophisticated
computational tools, such as CFD codes for thermal-hydraulics applications related to nuclear safety, has
spread dramatically within regulatory authorities, national laboratories, vendors, utilities and universities.
The increasing use of computational tools is taking advantage of continuing and rapid increase in
computing capability, accumulated knowledge in understanding thermal-hydraulics phenomena, and
progress in numerical techniques.
In nuclear safety, the reliability of the analysis made with a computational tool is of prime importance. At
present, the validation of codes is one limiting factor in their application. One of the hindrances in the
process of assessment and validation of computational tools is the lack of adequate experimental data, with
instrumentation, especially for the measurements of mixture composition, temperature and velocities, with
the required temporal and spatial resolutions needed to validate both advanced LP and CFD codes.
An area in which significant gaps still exist, both in the understanding of the physical phenomena and in
CFD-grade experimental data, is on the hydrogen behaviour in an LWR containment during the evolution
of a postulated severe accident. Hydrogen could reach concentrations leading to an explosion which would
damage the containment. It is crucial to know how the hydrogen would mix with air and steam, if it would
be uniformly distributed, or if it would stratify and accumulate in specific containment regions. An
important contribution to improving our knowledge on this issue was provided by the OECD/SETH project
(2002-2006), where the conditions leading to hydrogen stratification build-up were investigated for a broad
range of flow structures (plume, jets) and geometrical configurations.
The OECD/SETH-2 project (2007-2010) has addressed the issue of the stability of a stratified hydrogen
atmosphere as a function of the basic flow structure (e.g. negatively buoyant plume or jets) or following the
activation of safety systems (spray, cooler, recombiner, opening hatches). The experimental investigations
carried out in the PANDA and MISTRA facilities within the OECD/SETH-2 project have therefore
addressed the phenomena and conditions which have a high relevance for nuclear safety. The OECD/SETH-2
experimental tests with state-of-the-art instrumentation represents a unique database for the assessment and
validation of the advanced Lumped Parameter codes and CFD codes in correctly predicting the phenomena
taking place during the evolution of severe accidents with the release of hydrogen.
The OECD-SETH-2 project experimental investigations in PANDA and MISTRA were classified into two
groups, addressing basic phenomena and safety components.

NEA/CSNI/R(2012)5
20
The basic phenomena tests were covered in two series, identified as:
• Vertical fluid release.
• Horizontal fluid release.
The component tests were studied in four series, identified as:
• Containment spray
• Containment cooler
• Heat source simulating a recombiner
• Opening hatches
For vertical fluid release, a so-called common test was specified, with similar conditions in PANDA and
MISTRA. For each test series, a number of tests were performed aiming at covering the main parameters
affecting the phenomena. Scoping calculations as an in-kind contribution, using different computational
tools, were carried out all through the project, for identifying the most challenging conditions as far as code
validation was concerned. Most of the test conditions were based on these scoping calculations.
The PSI Operating Agent carried on scoping calculation for each PANDA series using the GOTHIC code
and the CEA Operating Agent carried on scoping calculation for the MISTRA series using the TONUS
code. Project participants performed scoping calculations and post test analysis with a variety of tools
(ASTEC, TONUS, CFX, FLUENT, etc.). The MISTRA-PANDA common test was analyzed by CEA
using the TONUS code and by PSI using the GOTHIC and FLUENT codes.
The OECD-SETH-2 project was endorsed by the CSNI and carried out under the auspices of the OECD
Nuclear Energy Agency, with the support of the Czech Republic (NRI), Finland (STUK and VTT), France
(CEA, IRSN, EdF), Germany (GRS), Japan (JNES), Korea (Republic of) (KAERI), Slovenia (JSI),
Sweden (SSM) and Switzerland (PSI) (see Table 1).
Table 1. Organisation signatories of the OECD/SETH-2 project
The Nuclear Research Institute of the Czech Republic (NRI) Czech Republic
Radiation and Nuclear Safety Authority (STUK) Finland
The Valtion Teknillinen Tutkimuskeskus (VTT) Finland
The Commissariat à l‟Énergie Atomique (CEA) France
The Institut de Radioprotection et de Sûreté Nucléaire (IRSN) France
Electricité de France, France (EdF) France
The Gesellschaft für Anlagen- und Reaktorsicherheit (GRS) Germany
The Japan Nuclear Energy Safety Organisation (JNES) Japan
The Korea Atomic Energy Research Institute (KAERI) Korea
The Jozef Stefan Institute (JSI) Slovenia
Strålsäkerhetsmyndigheten (SSM) Sweden
The Paul Scherrer Institute (PSI) Switzerland
The data obtained in the PANDA and MISTRA tests within the SETH-2 project have been processed,
qualified. Quick-look reports, providing basic information on test initial and boundary conditions, test
procedure, instrumentation, etc., have been distributed to project participants, together with the experimental
data (on CDs). For each series, a detailed series report, with a detailed description of the test and the related
phenomenology, was written and released as a SETH-2 project deliverable (see Appendix A).
Eight Programmer Review Group (PRG) meetings and eight Management Board (MB) meetings were held
during the project. The Management Board decided to also disclose the experimental data and quick-look
reports of two tests (MISTRA and PANDA counterpart tests) related to the so-called „Vertical fluid
release‟ series (see Section 4.3.3 for these tests) to non-signatory organizations, with the intention of
increasing the number of analytical evaluations of computational tools.

NEA/CSNI/R(2012)5
21
The CSNI, in agreement with the Program Review Group (PRG) and the Management Board (MB) of the
OECD-SETH2 Project, decided to hold this seminar for presenting and discussing the major outcomes of
both the SETH and SETH2 projects. The seminar which has been held on 12-13 September 12 offered the
possibility for discussing further their applicability to nuclear power plants, the use of the results and the
exchange of information in complementary research, and the experimental needs for future programmes.

NEA/CSNI/R(2012)5
22

NEA/CSNI/R(2012)5
23
2. OBJECTIVES OF THE SETH-2 PROJECT
The OECD/SETH-2 project was a follow-up of the OECD/SETH project. The investigations which were
carried on in the PANDA part of the OECD/SETH project were aimed at the generation of a database on
basic phenomena (jets/plumes) at large scale and with CFD-grade instrumentation. In the SETH tests, air,
steam and helium (to simulate hydrogen) were used and, for a variety of initial and boundary conditions,
the mechanisms involved in creating a stratified atmosphere in the containment were identified.
The general objectives of the SETH-2 test series were:
• To advance the understanding of the thermal-hydraulic conditions leading to the break-up of gas
stratification, in particular the effect of the interaction of a stratified layer with a negatively buoyant
plume or jet, or from the activation of safety systems.
• To create an experimental database, using large-scale, multi-compartment facilities, suitable for the
assessment and validation of advanced Lumped Parameters and CFD codes in analysing the issue of
hydrogen in an LWR containment.
• On the basis of in-kind contribution analytical activities, to have a first evaluation of the codes and to
identify critical issues requiring further experimental data and analysis.

NEA/CSNI/R(2012)5
24

NEA/CSNI/R(2012)5
25
3. EXPERIMENTAL FACILITIES
The PANDA and MISTRA facilities are two large-scale, multi-compartment facilities used for
investigating thermal-hydraulics phenomena with relevance to nuclear safety
3.1 PANDA facility
3.1.1 Facility design and main characteristics
PANDA is a large-scale, thermal-hydraulic test facility belonging to PSI, designed for investigating: i)
containment system behaviour for different ALWR designs (e.g. SBWR, ESBWR, KERENA); ii)
component tests (e.g. PCC, spray, heat source, cooler, rupture disks); iii) primary circuit (e.g. natural
circulation/instability in RPV, etc.); iv) basic phenomena at large-scale with CFD-grade instrumentation
tests (e.g. plume, jet, condensation, stratification, etc.) [3], [4]. For specific PANDA research programmes,
it was necessary to fulfil Quality Assurance (QA) procedures, and, for those programmes, a QA Audit by
the NRC was successfully passed.
Figure 1 shows the vessel assembly during the construction phase (a), and during a test (b). The components
are all made of stainless steel. Investigations related to ALWR design required the use of all PANDA
compartments. In these investigations (Figure 2(a)), the Drywell (DW) compartment was represented by two
vessels (Vessel 1 and Vessel 2) interconnected by a bent pipe, the Suppression Chamber or Wetwell (WW)
compartment by two vessels (Vessel 3 and Vessel 4) interconnected by two straight pipes, the Gravity Driven
Cooling System (GDCS) by one vessel, the Reactor Pressure Vessel (RPV) by one vessel, and the Passive
Cooling Condensers (PCCs) and the Isolation Condenser (IC) simulated by four condensers immersed in
water pools. Table 1 lists the main characteristics of the facility. The overall height of the PANDA facility is
25 m, the total volume of the vessels is about 515 m3 and the maximum operating conditions are 10 bar at
200°C. The RPV is equipped with an electrical heater bundle, with a maximum power of 1.5 MW. Various
auxiliary systems are available to maintain and control the necessary initial and boundary conditions during
the tests. The facility is controlled by a hierarchical programmable logic control system with a graphical-
display man-machine interface. PANDA instrumentation includes: more than 1 000 sensors, 2 mass
spectrometers and one PIV system.
For the investigations related to the OECD/SETH-2 project, only a part of the PANDA facility was used,
underlined in red in Figure 2(a) and also shown in Figure 2(b).
Figure 1. PANDA Facility
PANDA vessel assembly (construction phase, 1993) PANDA building (whilst performing a test)

NEA/CSNI/R(2012)5
26
Figure 2. PANDA Facility Schematic (a) and Facility Configuration for ST6 Series (b)
( )
Vessel 2
IP
Vessel 1
( )
(a) (b)
Vessel 3Vessel 4
(
(
)
)
Table 2. PANDA Main Characteristics
Operating specification for the pressure vessels Up to 10 bar / 200 °C fluid conditions
Power 1.5 MW electric heating
Total volume 515 m3 (modular structure based on 6 main vessels)
Total height 25 m
Instrumentation ~1000 sensors (temperature, pressure, flow rate, levels, etc.)
PIV (Particle Image Velocimetry (2D velocity fields))
Mass spectrometer (air, steam and helium gas concentration)
Control system Hierarchical programmable logic control system
Graphical-display man-machine interface
with process visualisation and on-line / off-line trending
Auxiliary systems Steam, helium, air injection/venting, water conditioning
3.1.2 Main instrumentation
The PANDA instrumentation covers the measurement of fluid and wall temperatures, absolute and
differential pressures, flow rates, heater power, gas concentrations and flow velocities. The measurement
sensors are installed in all facility components, in the system lines and in the auxiliary systems. With
respect to the OECD/SETH investigations, the measurement grids in Vessel 1 and in Vessel 2 were refined
for those of OECD/SETH-2.
Temperature measurements: Up to 374 K-type thermocouples (TCs) were used for measuring fluid and
inside and outside wall temperatures of Vessel 1, Vessel 2 and the IP (Table 3), with an accuracy assessed
to be around 0.5 oC. Temperature sensors are installed in the vessels at different heights, designated as
Level A (near the top of the vessels) to Level T (near the bottom of the vessel), and at different angles and
radial distances from the vessel axis.

NEA/CSNI/R(2012)5
27
Table 3. Number of Thermocouples and Capillaries Installed in Vessel 1, Vessel 2, IP and Cooler
Thermocouples Capillaries
Fluid Wall inside Wall outside Injection/Venting
Vessel 1 226 23 9 3/3 58
Vessel 2 58 19 9 0/1 34
IP 23 3 - - 15
Cooler 15 - 2 9/0 11
Injection and venting flow rates
Measured with vortex flow meters, with an accuracy of 1.1%.
Concentration measurements
Up to 140 sampling lines are installed in the vessels. A maximum of 118 of these samplings lines can be
connected to two Mass Spectrometers (MS) for gas concentration measurements. The system can measure
any gas concentration and composition. The gas mixtures used in the SETH-2 tests were either: helium/air,
steam/helium or steam/air/helium. The actual number of sampling lines used for measurements varies in
each test and during the test evolution. Different scanning sequences are programmed for the MS to
monitor facility preconditioning, initial test conditions, and the evolution of each test. A thermocouple is
placed a few millimetres from each gas sampling port, such that gas concentration and temperature
measurements are recorded at almost the same spatial location. For steam/air mixtures, the absolute error in
the measured steam/air molar fraction was assessed to be +/- 1.5%.
Measurement of 2D velocity fields
A commercial Particle Image Velocimetry (PIV) set-up was used to measure 2D velocity fields in
Vessel 1, in a vertical plane aligned with the vertical mid plane of the injection pipe.
Figure 3. Velocity Development near the Stratification Region for a PANDA SETH-2 Test
Olive oil, dispersed into small particles by a spray nozzle, was used as seeding particles for the PIV
technique and injected into the steam flow that was directed into Vessel 1. The PIV system provided 2D
instantaneous velocity fields with an acquisition rate up to 10 Hz.

NEA/CSNI/R(2012)5
28
Figure 3 shows examples of PIV measurements for a PANDA SETH-2 vertical fluid release test. The PIV
measurement area was located in the region of the interface between the helium-rich layer and the steam
atmosphere. The PIV provides detailed information on flow velocity and re-circulation patterns during the
process of erosion of the helium-rich layer. The PIV diagrams show how, at the early stage of the test, the
flow streamlines in the field of view are bent, because the jet is impinging on the helium-rich layer there.
Later on, when the helium-rich layer has been eroded, the jet can reach the upper region of the vessel and
the flow streamlines are then almost vertical.
3.2 MISTRA facility
3.2.1 Facility design and main characteristics
MISTRA is a large experimental facility belonging to the CEA, located at its Saclay nuclear research
centre, devoted to containment thermal hydraulics and hydrogen risk. This containment is a stainless steel
cylindrical vessel with an internal volume of 97.6 m3 (Figure 4). It comprises two shells, a flat cap and a
domed bottom, which are fixed together with twin flanges. The height and inner diameter of the vessel are
7.38 m and 4.25 m, respectively (Figure 5).
Figure 4. Side View
of MISTRA Facility Figure 5. MISTRA Main Geometrical Characteristics
This corresponds to a linear length-scale ratio of 0.1 for a typical French Pressurized Water Reactor
containment. The thickness of the vessel walls varies between 25mm at the bottom dome, 15 mm for the
vertical walls, and 120mm for the lid of the vessel. The outside part of the vessel is insulated with 20 cm of
Rockwool. Three so-called condensers – thermally regulated walls – are inserted into the MISTRA vessel
along the vertical walls. Each condenser is an open cylinder, with an inner diameter of 3.82 m, which is
slightly less than the inner vessel diameter of 4.25 m. The condensers share the same vertical axis with the
vessel walls and are located on top of each other, with a little spacing in the vertical direction. Bottom
condenser elevation from the vessel bottom and condenser height are 1 285 mm and 2 185 mm, 3 590 mm
and 1 785 mm, 5 495 mm and 1 785 mm for the lower, middle and upper condenser, respectively – so
condenser areas are respectively 26.2 m2, 21.4 m
2 and 21.4 m
2. For laser measurement, each condenser is
equipped with windows at four 90° equally spaced angles – at 45°, 135°, 225° and 315° in the reference
frame – and at elevations of 1 988 mm, 4 341 mm and 6 559 mm through the lower, middle and upper
condenser, respectively.

NEA/CSNI/R(2012)5
29
Until 2004, the test series were based on a free gaseous volume configuration. The facility was then
modified to accommodate compartments in order to divide the internal volume of the MISTRA vessel into
two distinct volumes, upper and lower. The compartment consists of a vertical cylinder which is closed at
the bottom and is fitted with a ring-plate. The internal cylinder diameter is 1.906 m and its height is
4.219 m (Figures 5 and 6). The bottom of the compartment is at an elevation of 1.245 m from the bottom to
the vessel, while the top of the compartment is at an elevation of 5.464m. The compartment walls are about
3 mm thick. The ring plate is a horizontally positioned steel ring plate at an elevation of 3.658 m, with an
outer radius of 1.728 m. As the condenser inner radius is about 1.910 m, there is a gap between the ring
plate and the middle condenser. Thus gas can flow from the upper to the lower volume, or vice-versa, even
if this flow path is partially obstructed by the presence of the lower part of the middle condenser. This
compartmented configuration allows several possibilities of injection – two vertical in the lower area,
centred and off-centred, one vertical at the level of the ring plate with a chimney, and several radial
injection at different locations (four per level) (Figure 7). The lower central injector device is suspended at
the bottom and the nozzle is integrated into the cylindrical opening. No recirculation is allowed from the
bottom of the MISTRA facility into the compartment.
MISTRA condensers were designed to provide well-controlled boundary conditions. The flow-rate and the
flow path inside the condensers were chosen to provide a uniform temperature at the inner wall. Thus,
condensation can be managed independent of the nature of the wall (steel or concrete).
Figure 6. Internal View of MISTRA from the top, with its compartment,
instrumentation and the location
of some gas and steam injection points
Figure 7. MISTRA Steam and
Gas Injection Locations
The maximum operating conditions of MISTRA are 6 bars and 200 °C. As in PANDA, prototypical fluids
are used (except that hydrogen is simulated by helium, to avoid safety problems). Various auxiliary
systems are available for controlling initial and boundary test conditions.
3.2.2 Main instrumentation
The MISTRA instrumentation is devoted to measuring the main variables in containment thermal-hydraulics:
fluid and structure temperatures, absolute and differential pressures, mass flow rates for gas and steam
injection, mass flow rates for steam condensation, heater power (MISTRA circuits), and gas concentrations.
The measurement of flow velocities is also possible, but the conditions for optical access for laser
diagnostics techniques, such as Laser Doppler Velocimetry (LDV) or Particles Image Velocimetry (PIV),
are currently limited due to the new lateral gas injection lines and the presence of the compartment in the
Lower centredinjection
Upper off-centred injection
Lower off-centred injection
Several radial injections

NEA/CSNI/R(2012)5
30
main volume, which make it difficult to obtain these flow velocity measurements for this configuration of
MISTRA. However, the CEA-LEEF laboratory has different optical diagnostic techniques and the
associated know-how for Laser Doppler Velocimetry (LDV), Particle Image Velocimetry (PIV), Laser
Induced Fluorescence (LIF), Rayleigh Diffusion, and Background Oriented Schlieren (BOS) [11-12].
Figure 8. Example of the Air Fountain Impinging on the Helium Layer
with the Velocity Field and Iso-Velocity Curves here for Fr=1.09
As an example, in the framework of OECD/SETH2 project, a complementary analysis based on PIV
measurements was performed on a smaller CEA facility (GAMELAN) to characterize the upward and
downward flow of the air jet and the propagation of gravity waves through the stable lighter layer (here the
helium/air stratified layer located at the top of the facility) (Figure 8) [13]. The instrumentation has been
continuously improved since the beginning of MISTRA experiments, in order to follow the increasing
demands for code validation with respect to finer spatial and time resolution.
The temperature measurement is performed with Chromel-Alumel Type K thermocouples (more than
300 sensors), used for measuring fluid temperature in the main gaseous volume, at the injection device
location (gas, steam, etc.) and also for solid temperatures on the condensers, the vessel and the compartment
structures. The thermocouple mesh allows fine local measurement to be made of the temperature field of the
main gaseous volume, and subsequent high spatial resolution The example given in Figure 9 shows the
thermal pattern for the LOWMS MISTRA OECD/SETH-2 test, which had the objective of studying the
erosion by a low momentum vertical steam jet of the stratified helium layer.
The main gas concentration measurement technique (helium, air, nitrogen, steam) is based on Quadrupole
Mass Spectrometer (QMS), using 78 sampling lines connected through a sampling system [14]. In some
specific test scenarios without steam, to study, for example, the phenomena of erosion by a low-momentum
air jet on a helium/air stratified layer and to produce fine spatial and temporal resolution, the katharometry
technique (with 10 thermal conductivity gauges) was introduced [15]. The katharometry technique was
applied with success with other facilities, in order to measure helium/air mixtures [16-17]. Complementary to
the concentration measurement devices, a gas concentration calibration system, CALIGA, was built in 2008.
As an example of measurements with CALIGA, and for a gas mixture composition type with 10% helium,
50% air and 40% steam, the relative uncertainties in the concentrations determined are of the order of 1.3%
for helium, 1.3% for air and 1.1% for steam.
For pressure measurement, one pressure gauge is used to monitor the total pressure of the containment. The
gas and steam mass flow rates are controlled and measured with sonic nozzles designed according to the
French norm referred to as NF EN ISO 9300 (July 1995). This ensures a constant flow rate independently of
the downward operating conditions. The regulation of this sonic nozzle is only dependent on the upstream

NEA/CSNI/R(2012)5
31
sonic nozzle pressure and temperature, the sonic nozzle diameter, an isentropic coefficient, the molar
characteristics of the gas and the downstream sonic nozzle pressure.
Figure 9. Example of Temperature Measurement, with Temperature Profile in Time
and the Associated Thermal Flow Pattern Map – here in the upper region of MISTRA
The condensed steam is collected in six circuits: three circuits for the three condensers and three circuits to
control the occurrence of spurious condensation on the containment wall, at the bottom of the containment,
on the condenser‟s insulated external wall and, since 2005, on the compartment walls.
The quality of the experimental data relies on the application of “Good Laboratory Practice”. The practice
followed at MISTRA is based on a quality assurance procedure, and, for these programmes, a QA Audit by
AFNOR to ISO9001-2008 certification grade was successfully passed for both experimental and
simulation activities [18].

NEA/CSNI/R(2012)5
32
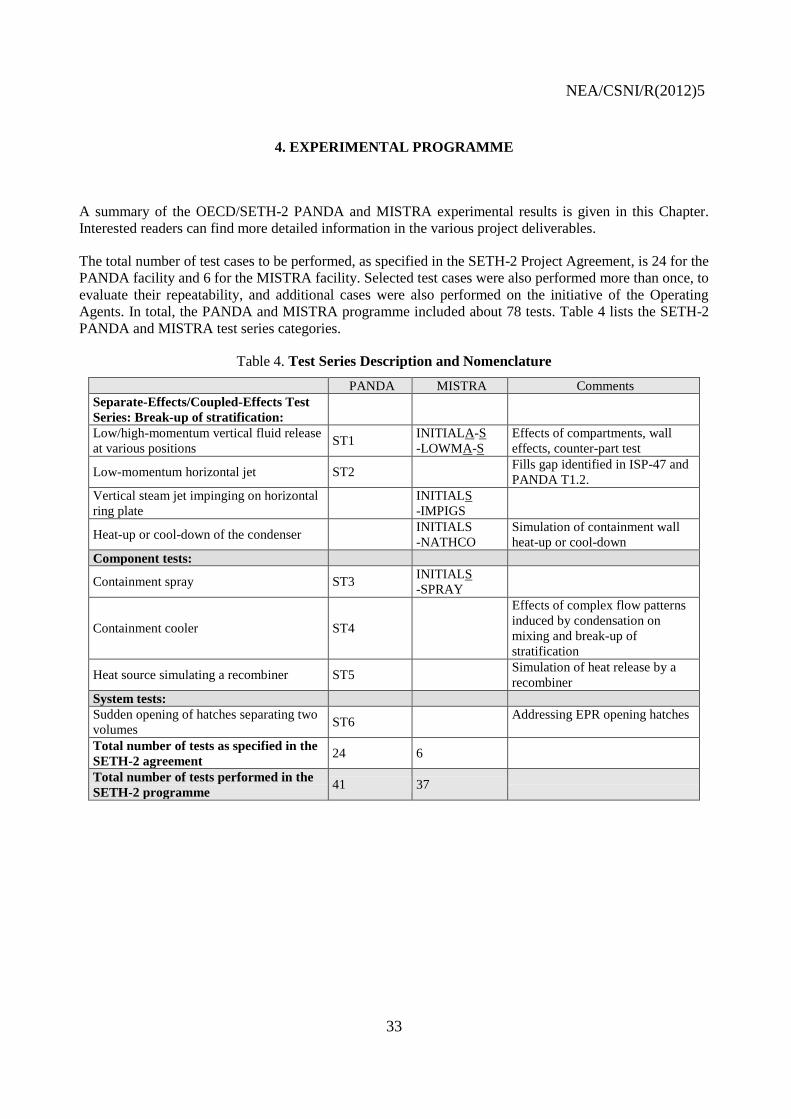
NEA/CSNI/R(2012)5
33
4. EXPERIMENTAL PROGRAMME
A summary of the OECD/SETH-2 PANDA and MISTRA experimental results is given in this Chapter.
Interested readers can find more detailed information in the various project deliverables.
The total number of test cases to be performed, as specified in the SETH-2 Project Agreement, is 24 for the
PANDA facility and 6 for the MISTRA facility. Selected test cases were also performed more than once, to
evaluate their repeatability, and additional cases were also performed on the initiative of the Operating
Agents. In total, the PANDA and MISTRA programme included about 78 tests. Table 4 lists the SETH-2
PANDA and MISTRA test series categories.
Table 4. Test Series Description and Nomenclature
PANDA MISTRA Comments
Separate-Effects/Coupled-Effects Test
Series: Break-up of stratification:
Low/high-momentum vertical fluid release
at various positions ST1
INITIALA-S
-LOWMA-S
Effects of compartments, wall
effects, counter-part test
Low-momentum horizontal jet ST2 Fills gap identified in ISP-47 and
PANDA T1.2.
Vertical steam jet impinging on horizontal
ring plate
INITIALS
-IMPIGS
Heat-up or cool-down of the condenser INITIALS
-NATHCO
Simulation of containment wall
heat-up or cool-down
Component tests:
Containment spray ST3 INITIALS
-SPRAY
Containment cooler ST4
Effects of complex flow patterns
induced by condensation on
mixing and break-up of
stratification
Heat source simulating a recombiner ST5 Simulation of heat release by a
recombiner
System tests:
Sudden opening of hatches separating two
volumes ST6
Addressing EPR opening hatches
Total number of tests as specified in the
SETH-2 agreement 24 6
Total number of tests performed in the
SETH-2 programme 41 37

NEA/CSNI/R(2012)5
34
4.1 PANDA test series main parameters
Table 5. Test Parameters for ST1 Test Series: Helium Stratification Break-Up with Vertical Release
Table 6. Test Parameters for ST2 Test Series:
Helium Stratification Break-Up With Horizontal Release
Table 7. Test Parameters for ST3 Test Series: Spray
Table 8. Test Parameters for ST4 Test Series: Containment Cooler
Table 9. Test Parameters for ST5 Test Series: Heat Source (Representing Operating Recombiner)
Layer
Steam Air Helium
(bar) (°C) % % % (g/s) (°C)
ST1_4 1.3 108 100 0 25 22 140 centre 200 0.9
ST1_4_2 1.3 108 100 0 25 22 140 centre 200 0.9
ST1_1 1.3 108 100 0 25 30 140 centre 200 1.3
ST1_1_2 1.3 108 100 0 25 30 140 centre 200 1.3
ST1_2 1.3 108 100 0 25 60 140 centre 200 2.6
ST1_2_2 1.3 108 100 0 25 60 140 centre 200 2.6
ST1_3 1.3 108 100 0 25 90 140 centre 200 3.8
ST1_3_2 1.3 108 100 0 25 90 140 centre 200 3.8
ST1_5 1.3 108 100 0 40 30 140 centre 200 0.9
ST1_6 1.3 108 100 0 40 84 140 centre 200 2.6
ST1_7 1 20 0 100 40 15 30 wall 75 0.6
ST1_7_2 1 20 0 100 40 15 30 wall 75 0.6
ST1_8 1.3 108 100 0 25 15 140 wall 150 0.9
ST1_9 1.3 108 100 0 25 44 140 wall 150 2.5
ST1_10 1 20 0 100 25 15 30 wall 75 0.8
Mass Flow Rate FrTemperature
Injection
Location Diameter
Initial Conditions
Test ReferenceAmbient Gas Composition
Pressure Temperature
Steam Air Helium Thickness
(bar) (°C) % % % m (g/s) (°C)
ST2_1 1.3 108 100 0 25 2 40 150 Vessel 1 Outside
ST2_2 1.3 120-130 100 0 25 4 85 150 Vessel 2 Outside
ST2_3 1.3 120-130 100 0 25 4 85 150 Vessel 2 to Vessel 3-4
ST2_4 1.3 108 100 0 25 4 85 150 Vessel 2 to Vessel 3-4
Test Reference Pressure Temperature Ambient Gas Composition
Venting
Initial Conditions Injection
LayerMass Flow Rate Temperature Location
Layer
Steam Air Helium
(bar) (°C) % % % (g/s) (°C)
ST3_0 1.3 20 0 100 30 840 25
ST3_1 2.6 129 100 0 30 840 40
ST3_2 2.6 129 60 40 30 840 40
ST3_3 2.6 129 80 10 30 840 40
Test Reference
Initial Conditions Spray Injection
Pressure Temperature Ambient Gas Composition
Mass Flow Rate Temperature
Ambient Water
Air Steam Helium Flow Rate
(bar) (°C) % (g/s) (g/s) (°C) (g/s) °C
ST4_0 1.3 108 100 40 2 140 500 30 Center Yes No
ST4_1 1.3 108 100 40 2 140 500 30 Center Yes No
ST4_2 1.3 108 100 40 2 140 500 30 Center Yes Yes
ST4_2_2 1.3 108 100 40 2 140 500 30 Center Yes Yes
ST4_3 1.3 108 100 40 2 140 500 30 Center No Yes
ST4_4 1.3 108 100 40 2 140 500 30 Top Yes Yes
Location Duct VentingMass Flow Rate
Cooler
Temperature
Injection
TemperatureTest Reference
Initial Conditions
Pressure Temperature
Recombiner
Layer
Steam Air Helium
(bar) (°C) % % % (g/s) (°C) (mm)
ST5_0 2.6 129 0 100 25 - - 4200
ST5_1 2.6 129 60 40 25 - - 1800
ST5_2 2.6 129 60 40 25 - - 4200
ST5_3 2.6 129 60 40 25 40 140 4200
Test Reference Pressure Temperature
Initial Conditions
Ambient Gas CompositionMass Flow Rate
Steam Injection
Temperature Location

NEA/CSNI/R(2012)5
35
Table 10. Test Parameters for ST6 Test Series: Sudden Hatch Opening
4.2 MISTRA test series main parameters
The CEA adopted a pragmatic approach to these test series, and proposed and carried out its SETH2
experimental programme in two steps, with a common base in order to have the same characteristics of
helium stratification for all test series, to be able to evaluate the break-up phenomena efficiency. Tables 11
to 17 give the major test parameters for all the MISTRA test series.
Table 11. Test Parameters of INITIALA_3 Test Series: Helium Stratification Build-Up in Air
Table 12. Test Parameters of LOWMA Test Series: Helium Stratification Break-Up
Table 13. Test Parameters of INITIALS Test Series:
Helium Stratification Break-Up in Air-Steam Mixture
Vessel 1-2 Vessel 3-4 Vessel 1-2 Vessel 3-4 Vessel 1-2
(bar) (bar) (°C) (°C) Air (%) Steam (%) Air (%) Helium (%)
ST6_0 1 2.6 room room 100 60 20 20
ST6_1 1 2.6 room 129 100 60 20 20
ST6_2 1 2.6 129 129 100 60 20 20
Test Reference Vessel 3-4
Pressure Temperature Gas Composition
Initial Conditions
Test Reference Vessel configuration
Pressure (bar)
Temperature (°C)
Mass Flow Rate (g/s)
Duration (s)
Mass injected (kg)
Pressure (bar)
Temperature (°C)
INITIALA_3 Open 1.005 18.6 4.25 215 0.916 1.005 18.6 INITIALA_3 Open 1.005 18.2 4.25 217 0.926 1.005 18.2 INITIALA_3 Open 1.004 18.4 4.26 214 0.902 1.005 18.5 INITIALA_3 Open 1.005 18.1 4.26 214 0.916 1.005 18.1 INITIALA_3 Open 1.005 19.3 4.26 215 0.918 1.005 19.3
Initial conditions Helium injection conditions Final conditions
Test_ReferenceVessel
configuration
pressure
(bar)
temperaure
(°C)
Mass Flow Rate
(g/s)
Duration
(s)
Mas
injected
(kg)
Mass Flow Rate
(g/s)
Duration
(s)
Mas
injected
(kg)
FrPressure
(bar)
Temperature
(°C)
LOWMA_1 Open 1.005 18.3 4.25 214 0.913 1.51 6000 9.081 0.10 1.005 18.4
LOWMA_2 Open 1.005 18.4 4.25 213 0.907 4.53 6000 27.18 0.31 1.005 18.4
LOWMA_3 Open 1.005 18.6 4.26 214 0.916 15.16 6000 91.05 1.01 1.005 18.5
LOWMA_3 Open 1.005 18.3 4.26 213 0.912 15.17 6000 91.05 1.01 1.005 18.4
LOWMA_3 Open 1.005 18.3 4.26 214 0.916 15.17 6000 91.02 1.01 1.005 18.6
LOWMA_3 Open 1.004 19.4 4.26 215 0.920 15.17 6000 90.98 1.00 1.005 19.1
LOWMA_3 Open 1.004 19.2 4.25 213 0.910 15.16 6111 92.64 1.01 1.004 19.3
LOWMA_3 Open 1.004 22.9 4.24 215 0.916 15.12 6000 89.76 1.00 1.004 22.9
LOWMA_4 Open 1.005 19.8 4.24 214 0.912 50.58 5400 273.4 3.38 1.004 17.4
Initial conditions Helium injection conditions Air injection conditions Final conditionsLOWMA test series
Date 23-04-2009 29-04-2009
Test Reference INITIALS-1 INITIALS-1
Vessel configuration Closed Closed
t1 (s) 19740 19888
Pressure (bar) 1.079 1.076 Average gas
temperature (°C) 98.9 99.1
Average X H2O (%) 56.0 56.4
Mass Flow Rate (g/s) 4.20 4.19
Duration (s) 215 215
Temperature range (°C) 100-135 99-139
Mass injected (kg) 0.902 0.900
t2 (s) 19955 20103
Pressure (bar) 1.162 1.159
Average gas temperature (°C) 100.7 100.8
Helium injection conditions
Final conditions (End of helium
injection)
Initial conditions (before helium
injection)

NEA/CSNI/R(2012)5
36
Table 14. Test Parameters of INITIALS_1+LOWMS Test Series:
Effects of a Vertical Steam Jet on Helium Stratification
Table 15. Test Parameters of INITIALS_1+IMPIGS Test Series:
Effects of a Vertical Impinging Steam Jet on Helium Stratification
Date 12-05-2009 30-10-2009 Test Reference LOWMS-1 LOWMS-1
Vessel configuration Closed Closed t1 (s) 20025 20319
Pressure (bar) 1.079 1.085 Temperature (°C) 99.1 98.4 Average X H2O (%) 56.5 56.4
Mass Flow Rate (g/s) 4.17 4.19 Duration (s) 215 215
Temperature range (°C) 99-139 101-140 Mass injected (kg) 0.896 0.902
t2 (s) 20240 20534 Pressure (bar) 1.161 1.166
Temperature (°C) 101 100.1 t3 (s) 20273 20566
Pressure (bar) 1.162 1.166 Temperature (°C) 100.9 100
Mass Flow Rate (g/s) 18.77 18.75 Duration (s) 1799 1799
Temperature range (°C) 104-141 106-148 Fr ~2 ~2
t4 (s) 22072 22365 Pressure (bar) 1.492 1.492
Temperature (°C) 100.5 99.9
Initial conditions (before helium
injection)
Helium injection conditions
End of INITIALS conditions
(End of helium injection)
Beginning of LOWMS conditions
(before UPOF water steam injection)
Steam injection conditions
Final conditions (End of steam
injection)

NEA/CSNI/R(2012)5
37
Table 16. Test Parameters of INITIALS_1+SPRAY Test Series: Effects of Spray on Stratification
Table 17. Test Parameters of INITIALS_1+NATHCO Test Series:
Effects of Wall Heat-Up on Helium Stratification
Date 20-10-2009 06-11-2009 Test Reference SPRAY-1 SPRAY-1
Vessel configuration Closed Closed t1 (s) 19600 20390
Pressure (bar) 1.09 1.086 Temperature (°C) 97.9 98.2 Average X H2O (%) 56.3 56.8
Mass Flow Rate (g/s) 4.17 4.2 Duration (s) 215 215
Temperature range (°C) 97-136 103-138 Mass injected (kg) 0.896 0.902
t2 (s) 19815 20605 Pressure (bar) 1.171 1.168
Temperature (°C) 99.6 99.9 t3 (s) 19845 20635
Pressure (bar) 1.171 1.168 Temperature (°C) 99.6 99.9
Average Mass Flow Rate (kg/s) 0.96 0.98
Duration (s) 120 120
Average temperature (°C) 32.8 30.2
t4 (s) 19965 20755 Pressure (bar) 1.056 1.048
Temperature (°C) 86.8 87.0
Helium injection conditions
Final conditions (End of spraying)
Initial conditions (before helium
injection)
Spraying conditions
End of INITIALS conditions
(End of helium injection)
Beginning of SPRAY conditions
(Before spraying)
Date 27-10-2009 12-02-2010 Test Reference NATHCO-1 NATHCO-1
Vessel configuration Closed Closed t1 (s) 20101 20095
Pressure (bar) 1.103 1.082 Temperature (°C) 98.3 98.2 Average X H2O (%) 56.3 56.3
Mass Flow Rate (g/s) 4.19 4.20 Duration (s) 215 215
Temperature range (°C) 99-138 95-138 Mass injected (kg) 0.900 0.902
t2 (s) 20316 20310 Pressure (bar) 1.184 1.166
Temperature (°C) 99.9 100.0 t3 (s) 20346 20340
Pressure (bar) 1.184 1.163 Temperature (°C) 99.9 99.8
Lower condenser slope (°C/min) 0 0
Lower condenser set point (°C) 100 100
Medium condenser slope (°C/min) 0.55 0.54
Medium condenser set point (°C) 130 130
Upper condenser slope (°C/min) 0.52 0.52
Upper condenser set point (°C) 130 130
Duration (s) 3677 3660
t4 (s) 24023 24000 Pressure (bar) 1.242 1.214
Temperature (°C) 105.2 105.0
Helium injection conditions
Final conditions (End of condenser
temperature change)
Initial conditions (before helium
injection)
Condenser temperature evolution
End of INITIALS conditions
(End of helium injection)
Begining of NATHCO conditions
(Before condenser temperature change)

NEA/CSNI/R(2012)5
38
4.3 PANDA and MISTRA vertical fluid release series
4.3.1 PANDA tests: ST1 series
The purpose of the vertical fluid release series was to study the interaction of a low-momentum air or steam jet
with a helium-rich layer in a large volume. These tests addressed the resistance of a hydrogen-rich layer
located just beneath the containment dome to a low-velocity steam release which becomes negatively buoyant
when reaching the upper layer containing the hydrogen. For safety reasons, helium was used to simulate
hydrogen in these tests. The test parameters chosen allowed different jet-layer interaction mechanisms to be
identified, such as continuous erosion, the generation of locally unstable density stratifications, the build-up of
secondary vortex flows and the entrainment of gas which finally results in jet break-through.
There were four main experimental parameters set for the PANDA ST1 series (see also Table 5):
1. The steam (air) injection mass flow rate
2. The helium-steam composition in the upper region of Vessel 1
3. The location of the injection line, which can be either „centre‟, for the jet injected on the symmetry
axis of the vessel, or „wall‟, for the jet injected at the vessel wall opposite to the IP.
4. The composition of the gas jet injected into Vessel 1. This gas composition was identical to the initial
ambient gas composition in Vessels 1 and 2.
The series consisted of ten experiments, and five additional experiments which were conducted to check on
the repeatability of the phenomena.
Results depicting the mixing, transport and stratification were recorded in terms of concentration and
temperature profiles. Additionally, PIV was used to provide better insight into the flow velocity and into
the interaction zone of the helium layer and the upward directed injection flow. The temperature contour
maps of experiment ST4_2 and a velocity map of ST7_2 serve as examples of the kind of information
obtained from the experiments (Figures 10 and 11).
The temperature maps were calculated from the thermocouples installed in Vessel 1, after interpolating the
temperature linearly between points.
Figure 10. Temperature Contour Maps Recorded during Experiment ST1_4
t=1 s
X [mm]
Y [
mm
]
-2000 0 20000
1000
2000
3000
4000
5000
6000
7000
8000t=249 s
X [mm]
-2000 0 20000
1000
2000
3000
4000
5000
6000
7000
8000t=499 s
X [mm]
-2000 0 20000
1000
2000
3000
4000
5000
6000
7000
8000t=999 s
X [mm]
-2000 0 20000
1000
2000
3000
4000
5000
6000
7000
8000t=1499 s
X [mm]
-2000 0 20000
1000
2000
3000
4000
5000
6000
7000
8000t=1999 s
X [mm]
-2000 0 20000
1000
2000
3000
4000
5000
6000
7000
8000

NEA/CSNI/R(2012)5
39
Thermocouple locations are marked with black crosses. The colour coding denotes the higher temperatures
in red and the lower temperatures in blue. Superheated steam was injected vertically upwards through a
tube at y = 4000 mm. Experiment ST1_4 was characterized by a low-momentum jet interacting with the
helium layer. Consequently, the initial jet penetration depth into the helium-rich layer was weak and the
initial steam-helium-layer mixing accordingly weak. As a consequence, the hotter jet spreads radially at the
interface y ≈ 6000 mm (t =499 s) and the interaction zone moves slowly upwards (t = 1499 s), until the
helium-rich layer is completely eroded (t =1999 s).
Figure 11. Velocity Field Development of the Erosion Front for Experiment ST1_4
The velocity fields for experiment ST1_4 are shown in Figure 11 at two different times. The velocity map in
Figure 11a) depicts the initial state where the jet just impinges onto the lower part of the He layer; the jet
velocity is decelerated to v ≈ 0 m/s and a stagnation point (mark S) becomes visible. Due to the negative
buoyancy, the He layer acted as a „soft‟ barrier and the streamlines were horizontally deflected, initially even
projecting downwards in the outer part of the mixing zone. As a result, the He layer was eroded and the
helium successively entrained and transported into lower regions as the result of the formation of vortices
around the jet. These vortices originated from the shear generated between the upward jet and the reversed
flow. This process continued until almost pure jet flow was visible later in time. The map in Figure 11b)
depicts a situation where the jet had almost completely eroded the mixing layer in the field-of-view.
Figure 12. Experimentally (left) and Numerically (right) Determined Instantaneous Velocity Field
of the Erosion Front for Experiment ST1_7_2
x [mm]
y[m
m]
-200 0
5800
6000
t = 180-200 s
b)x [mm]
y[m
m]
-200 0
5800
6000
t = 20 - 40 s
a)
S
x [mm]
y[m
m]
-1600 -1200
5400
5600
5800
a)
t = 1280 s PIV
S
x [mm]
y[m
m]
-1600 -1200
5400
5600
5800
CFD
b)
S

NEA/CSNI/R(2012)5
40
This general description holds for all experiments, except for the time scale. The higher the initial
Reynolds number and the lower the helium content of the layer, the earlier in time are the corresponding
flow patterns found, indicating a similar degree of mixing of the flow under consideration.
For post-test calculation purposes for experiment ST7_1, a half-volume block-structured mesh consisting
of 220k nodes was used to model the PANDA Vessel 1 when performing CFD calculations with the
standard k-ε model using wall functions. The results of this comparison can be found in Figure 12.
Good agreement between experiments and CFD calculations is found for the mixing zone comprising the
impinging jet and the helium layer.
In addition to this local observation, a comparison of the erosion rate for the steam test was conducted in
terms of eroded volume and dilution time. The resulting plot is presented in Figure 13.
Figure 13. Normalized Eroded Volume as a Function of Normalized Erosion Time
The erosion time was obtained from the temperature signal, which showed a sharp increase as the jet front
reached the location of a sensor. The remaining volume of helium was estimated by considering the
erosion front elevation and then normalizing with the initial helium volume present at the top of the vessel.
The erosion time was also normalized with respect to a dilution time, defined as the ratio of the molar
amount of helium initially present in the vessel with the molar injection steam flow rate. Therefore a
dilution time of 1 represents the time necessary to inject a molar amount of steam equivalent to the molar
amount of helium initially present in the vessel. The results show that, for a test characterized initially by
low interface Froude number (<2.6), the erosion rate was constant from test to test. For higher Froude
number, the erosion rate was higher initially and tended to decrease with increasing distance between the
erosion front and the injection point.
4.3.2 MISTRA tests: INITIALA-LOWMA and INITIALS-LOWMS
The objective of the INITIALA-LOWMA test series was to study the phenomena of erosion by a low-
momentum air jet on the helium/air stratified layer located at the top of the facility. Different mass flow
rates of air were used, inducing different regimes, including pure diffusive mixing, global dilution and
slow erosion, characterized by the interaction Froude number.
0.0
0.2
0.4
0.6
0.8
1.0
1.2
0 2 4 6 8 10 12
Vn
[-]
Fr in0 = 0.9
Fr in0 = 1.3
Fr in0 = 2.6
[-]
Frin0
=3.8:
ST1_3_2
ST1_3
Frin0
=2.6:
ST1_2_2
ST1_2
ST1_9
ST1_6
Frin0
=1.3:
ST1_1_2
ST1_1
Frin0
=0.9:
ST1_5
ST1_4_2
ST1_4
ST1_8
Fr in0 = 3.8

NEA/CSNI/R(2012)5
41
The first step, called the INITIALA phase, consists of helium stratification build-up, performed in the upper
gaseous volume of the facility, at room temperature and pressure (lower vent). The objectives were to create a
high helium concentration cloud above the compartment (the volume of this part is approximately 25 m3), an
average target concentration of the cloud of about 20% molar helium, a stratification gradient which was as
high as possible, and a cloud which was symmetrical. A total of 7 tests were carried out during the INITIALA
phase study (for the determination of the test sequence, with 5 tests dedicated to the reference test, called
INITIALA_3, and including tests to study reproducibility and characterization of the symmetry). The initial
conditions, called INITIAL0, were at atmospheric pressure and room temperature, and with the vessel filled
with 100% air. The INITIALA phase was after the creation of the stratified layer with helium lateral
injection. A complementary phase, called post-INITIALA, was used for a few tests to check the evolution of
the stratified layer behaviour without air injection. The objective was to check if this was a pure diffusion
regime or if some small temperature differences could lead to a convective behaviour that could mix the
gases faster. The second step, called the LOWMA phase, consisted of helium stratification break-up caused
by different rates of low-momentum vertical air injections from below. A total of 9 tests were carried out
during the LOWMA phase, to study the effects of air flow rate on stratification, with special focus on one
particular test series, called LOWMA_3 (6 tests). The main objective during this phase was the stratification
behaviour with upward air jet interaction for different air flow rates. The effects of off-centre injection on the
symmetry of the stratification were also evaluated. The LOWMA transient phase followed the INITIALA
phase with a delay of about 6 minutes, necessary to prepare the air injection after the end of the helium
injection. The air injection was from the upper off-centre nozzle. The air mass flow rates were chosen on the
basis of the interaction Froude number value, at the level of the stratification, that determines the theoretical
behaviour expected on the helium stratification. If the interaction Froude number is lower than 1, buoyancy
of the stratified layer dominates and the air flow erodes the stratification without penetration. If the
interaction Froude number is greater than 1, the momentum of the air flow dominates and the air flow
penetrates inside the stratification.
For the first INITIALA step, three different types of tests were carried out, with three different helium
mass flow rates but the same quantity of helium injected. The criterion used to determine the reference test
was very simple: the sharpest stratification would be selected as the reference case. In the next paragraph,
only the results of the INITIALA_3 test that was selected as the reference pre-conditioning test will be
presented. For the second INITIALA/LOWMA step, the guiding parameter for selecting the air mass flow
rate was the interaction Froude number. In the low-interaction Froude number regime, a reduction factor of
10 was achieved, to be in the buoyancy-dominated regime (Fr=0.1). Conversely, in the high-interaction
Froude number regime, the design of the MISTRA air injection line only allowed an increase by a factor of
3. To characterize the effects of air flow on vertical helium distribution, five test series were considered:
INITIALA_3, with an interaction Froude number of zero; LOWMA_1, with an interaction Froude number
of 0.10; LOWMA_2, with an interaction Froude number of 0.31; LOWMA_3, with a Froude number of
1.01; and LOWMA_4, with an interaction Froude number of 3.38.
4.3.2.1 Helium stratification in air (INITIALA) test
The sharpest stratification was obtained with the higher helium mass flow rate 4.25g/s-1, for INITIALA_3
(see Table 11). In this case, helium injection was short enough so that reduced diffusion occurred during
this period of time, and also, efficient concentration homogenization in the helium cloud took place as the
result of higher levels of turbulence. Figure 14 shows the helium stratification characteristics at the end of
helium injection time t1. The stratification depth is around 10% of the total MISTRA height.

NEA/CSNI/R(2012)5
42
Figure 14. Helium Stratification Characteristics at the End of Helium Injection
After the establishment of stratification, measurements were continued to evaluate the long-term evolution
of the helium molar concentration during this diffusion phase, and to compare it with the theoretical
evolution of the diffusion of an initial Heaviside function.
Figure 15. Diffusion Effect, Comparison of Experiment and Theory for the Vertical Evolution
of Helium Stratification at Different Times after the End of Helium Injection, t1.
At the end of helium injection, t1
At t1+1800s
At t1+7200s
Comparison of the experimental concentration curve and the theoretical diffusion is given at the end of the
helium injection time, t1, at t1+1800s and at t1+7200s. At the end of helium injection, t1, it was assumed
that the initial stratification is a Heaviside function. Figure 15 shows the evolution of the experimental

NEA/CSNI/R(2012)5
43
helium molar concentration compared to theoretical curves. This comparison confirmed that pure diffusion
was present after the end of helium injection, without any convection-driven effect.
To conclude the first INITIALA step, INITIALA_3 results showed that helium stratification could be
established at the quality required for the next step, and that the operating conditions applied ensured a
symmetrical helium cloud and repeatability between each test. The mass balance was well verified and in
accordance with theory during the molecular diffusion phase after the end of helium injection. The
INITALA_3 test was therefore chosen to be the reference test for pure molecular diffusion and would be
compared with the LOWMA tests series at the different interaction Froude numbers of interest.
4.3.2.2 Effect of a vertical air jet on helium stratification (INITIALA_3-LOWMA)
The results focused on here are in the form of a comparison between the helium concentration
measurements performed during INITIALA_3 ([69] to [73] and Table 11) and the four LOWMA tests
([76] to [84] and Table 12), in order to evaluate the effects of low-momentum vertical air injection on the
helium cloud, regarding interaction Froude number value with increasing values between 0 to 3.38. The air
injection duration was t3-t2. Figure 16 shows the evolution of stratification during the air injection phase at
selected times. Three different forms of behaviour can be observed from these four graphs.
At interaction Froude number between 0 and 0.31, the buoyancy of the stratified layer dominates and the air
jet does not penetrate inside the stratification. The stratification is very stable, and the air flow has no effect
on it. An interaction Froude number of 1.01 is an intermediate case, with buoyancy and momentum having
the same order of magnitude. It can be seen that the air flow penetrates the lower layers of the stratification,
up to a height of 5.9m (2.2m above the air injection point). The result of this air flow penetration is the
complete homogenization of the penetrated layer. Above this homogeneous zone, stratification still exists, but
with lower helium concentration. Finally, for a high-interaction Froude number of 3.38, the momentum of the
air flow dominates and the air jet completely penetrates the helium cloud. Stratification is completely
destroyed and the helium concentration has a constant value of around 1.5% of Cmax.
Penetration of the air flow within the stratified layer can also be illustrated by the evolution of the helium
concentration at elevation 5.9m, identified previously as the transition level in the case of Fr=1. Three
different forms of behaviour can also be observed in Figure 17. At an interaction Froude number between 0
and 0.31, the air flow had no effect (or only a small effect) on the concentration evolution with time. At an
interaction Froude number of 1.01, air flow penetrated inside the stratification up to this elevation and the
helium concentration remained constant during air injection. This concentration is an equilibrium value
between the helium feed from the upper layers and the dilution created by the air injection. After the end of
air injection, the helium concentration increases, because of the helium feed from the upper layers (helium
diffusion). Finally, at an interaction Froude number of 3.38, the momentum of the air flow dominated and
the air flow completely penetrated the helium cloud. Initially, rapid growth in the helium concentration
during the first few seconds of air injection can be observed. This rapid growth is due to mixing with the
upper layers of the stratification. Then, once the whole helium cloud has been mixed and is homogeneous,
helium concentration decreases due to dilution caused by the air flow.
As for the INITIALA phase, special focus was given to the symmetry and repeatability of the test. The
LOWMA_3 (Fr = 1.01) test was chosen as it is an intermediate case, with buoyancy and momentum in
essentially equal competition. The main primary conclusion is that, although the air injection was off-
centre, the gas concentration field in the upper part of MISTRA was still symmetrical (inside the
penetrated zone (z = 5.5m) and also inside the stratification zone (z>6m)).

NEA/CSNI/R(2012)5
44
Figure 16. Vertical Evolution of Helium Stratification during the Air Injection Phase,
at Different Times
At the beginning of air injection, t2
At 8% of the duration of air injection
Halfway through the duration of air injection
At the end of air injection, t3
Figure 17. Time Evolution of Helium Concentration at the Height of 5.9m
Secondly, repeatability tests highlighted the sensitivity of the phenomena to the thermal conditions, even if all
the different LOWMA_3 tests were carried out assuming the same boundary conditions (helium and air mass
flow rates, times of injections, etc.). For these reproducibility tests, the behaviour observed in the helium
cloud was different from one test to another. These differences can be attributed to 2 factors. The first is that
the value of the interaction Froude number was close to 1, which is an intermediate value between two
effects, and, secondly, small temperature differences existed between gas and air injection from day to day.
The interaction Froude number is very sensitive to these temperature differences, which have an effect on its
value. The difference between the air injection temperature and the gas temperature caused a change in the
momentum of the air flow (the addition of buoyancy effects): the higher the temperature difference (here

NEA/CSNI/R(2012)5
45
close to 4°), the lower the momentum; and, the lower the interaction Froude number, the lower the
penetration length. This test series is included in the MISTRA-PANDA test series. A global analysis of this
common test series has been carried out by the CEA and is given at the end of this report.
4.3.2.3 Helium stratification in air-steam gas mixture (INITIALS) test
The first step of the 4 test series with steam is called the INITIALS phase [86] (see Table 13) and consists of
helium stratification build-up, performed in the upper gaseous volume of the facility and starting from a
homogeneous gaseous superheated-steam-air mixture (at a temperature of around 99°C, steam molar
concentration equal to 57%, and pressure of 1.09bar). A total of 8 tests were carried out during the INITIALS
phase study (6 for the selection of the best test sequence, and 2 tests dedicated to the reference test study,
called INITIALS-1). The preconditioning phase presented in [86] will not be described here. The helium
stratification establishment of the INITIALS test consisted of the same helium injection as during the
INITIALA_3 test presented previously, with helium mass flow rate equal to 4.2 g/s, applied for 215s, giving
a total injected mass of 900g. Figure 18 presents the comparison between the stratification obtained during
the INITIALA_3 test and the INITIALS test. It can be seen that more measurement locations were available
for the INITIALA_3 test, because of the use of the mini-katharometer rod during this test.
Figure 18. INITIALS Stratification Characteristics
Figure 19 gives the time evolution of the helium concentration inside the stratification. It can be observed
that homogenization occurred naturally inside the stratification region, and develops from the top of the
vessel. In fact, at the top of the stratification region (above a height of 7.1 m), helium concentration
decreased continuously, whereas the evolution at the lower levels was not continuous: at the beginning of
this time evolution, i.e. during the first 3000s after the end of helium injection, the concentration evolution
looks like an enhanced diffusion profile.
After this time, the lower levels joined the top level with sudden helium enrichment, so that, at 7000s after
the end of helium injection, the stratification in completely broken up.
Figure 20 shows the evolution of the temperatures inside the stratification. It can be observed that thermal
homogenization also developed from the top of the vessel. The lower levels of the stratification join the top

NEA/CSNI/R(2012)5
46
level one after each other, with a short period of more rapid sudden cooling. These thermal and concentration
homogenizations occur at the same time, from which it can be inferred that the two phenomena are
correlated.
Figure 19. INITIALS Helium Concentration Evolution Inside the Stratification Region
Figure 20. INITIALS Gas Temperature Evolution Inside the Stratification – Angle 345°; Radius~1m

NEA/CSNI/R(2012)5
47
Mixing down to a height of 6.4m took about 4500s after the end of helium injection. To go down to a
height of 6.1m took about 5500s after the end of helium injection, down to 5.8m about 6500s, and finally
to 5.5m at about 7000s after the end of helium injection, at which time the stratification was naturally
completely destroyed. The primary objective of the INITIALS test was to obtain the most stable
stratification possible, in order to be able to evaluate the mixing effects due to the different individual
mitigation means alone. To do this, the efficiency of the different stratification erosion techniques have to
be assessed during the first 3000s after the end of helium injection.
Figure 21 presents the temperature field at four different times. Thermal homogenization occurs across the
vessel, with the cold front propagating from the top to the bottom. About 7000s after the end of helium
injection, the initial stratification was completely destroyed (the upper region of the facility is thermally
homogeneous and “cold”).
Figure 21. INITIALS Transient Behaviour of the Temperature Field
(a) 3000s after the end
of helium injection
(b) 4500s after the end
of helium injection
(c) 5500s after the end
of helium injection
(d) 7000s after the end
of helium injection
It was concluded that the first step in establishing stratification with steam and without bulk condensation
was successful.
4.3.2.4 Effect of a vertical steam jet on helium stratification (INITIALS-LOWMS)
The main objective of the LOWMS test [87] (see Table 14) was to study the effect of off-centred low-
momentum steam injection on the behaviour of the helium cloud. The LOWMS test started about 30
seconds after the end of the helium injection of the INITIALS test. This delay was necessary as the result
of process management and was the same for the following test series.
The minimum steam mass flow rate achieving in the MISTRA facility was about 19g/s, giving an interaction
Froude number greater than 1.5. In this case, it was not possible to investigate different flow regimes, as had
been done with air injection in the LOWMA test series [85]. It was therefore decided to carry out the
LOWMS test with the minimum steam mass flow rate and an injection duration of half an hour. Because it
was steam that was being injected, condensation was therefore monitored. Condensation starts at the wall
after a delay of 1100s following the beginning of steam injection. Figure 22 shows the evolution of helium
concentration inside the stratification during this upper, off-centred injection of steam. It can be seen that
rapid homogenization of the stratification due to the steam injection occurred, so that total homogenization
occurred between 7 and 13 minutes after the beginning of steam injection. The time cannot be determined
more exactly than this because of the time resolution on the concentration measurements. Another interesting
point to be observed is the fact that this total homogenization occurred before the beginning of the
condensation (blue vertical line in Figure 22). This means that this homogenization was only due to the
mixing and dilution effects of the injection. This rapid homogenization of the stratification confirms the
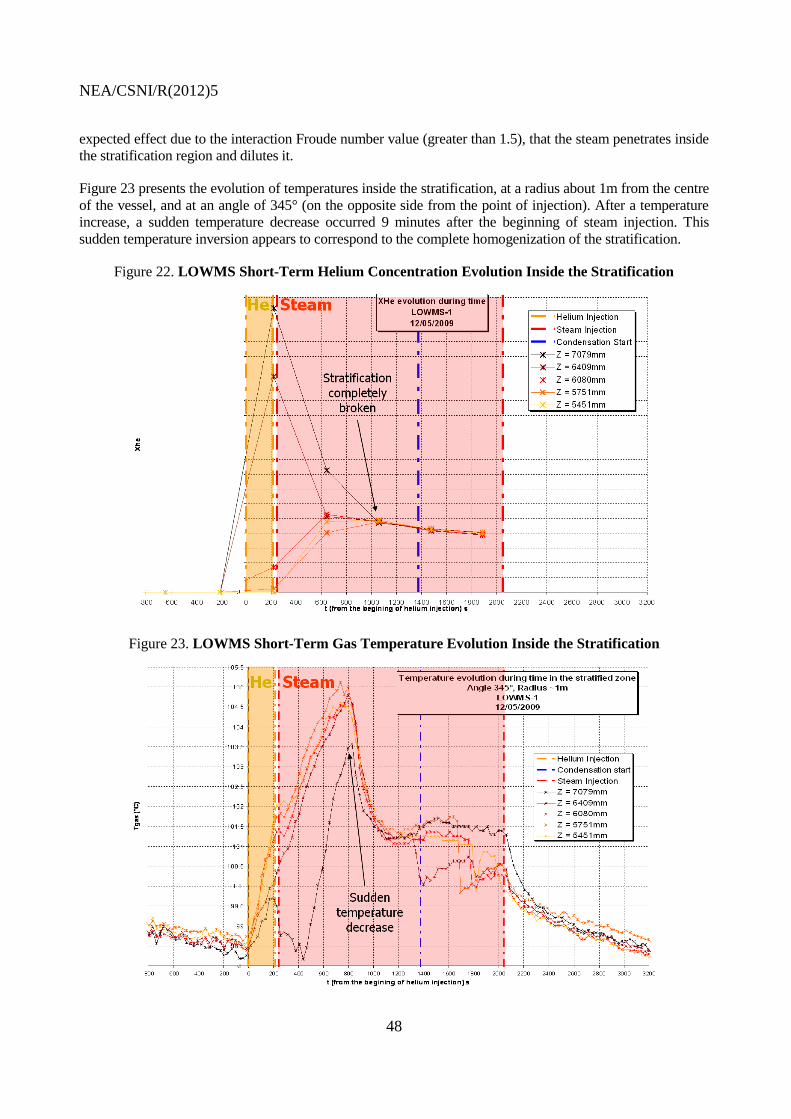
NEA/CSNI/R(2012)5
48
expected effect due to the interaction Froude number value (greater than 1.5), that the steam penetrates inside
the stratification region and dilutes it.
Figure 23 presents the evolution of temperatures inside the stratification, at a radius about 1m from the centre
of the vessel, and at an angle of 345° (on the opposite side from the point of injection). After a temperature
increase, a sudden temperature decrease occurred 9 minutes after the beginning of steam injection. This
sudden temperature inversion appears to correspond to the complete homogenization of the stratification.
Figure 22. LOWMS Short-Term Helium Concentration Evolution Inside the Stratification
Figure 23. LOWMS Short-Term Gas Temperature Evolution Inside the Stratification

NEA/CSNI/R(2012)5
49
Figure 24 presents the temperature field at three different times. At the beginning of steam injection
(Figure 24a), the top part of the facility was colder than the bottom region and the injected steam did not
penetrate to the upper levels. Nine minutes after the beginning of steam injection (Figure 24b), the steam
did penetrate to the upper levels and there was a global temperature increase due to the steam injection.
Fifteen minutes after the beginning of steam injection (Figure 24c), a global temperature decrease can be
observed. These three temperature fields show a thermal asymmetry during this off-centred steam injection
(with a higher temperature on the same side as the injection point).
Figure 24. LOWMS Transient Behaviour of the Temperature Field
(a) 180s after the beginning
of UPOF injection
(b) 540s after the beginning
of UPOF injection
(c) 900s after the beginning
of UPOF injection
After the end of steam injection, concentrations were monitored inside the complete vessel, in order to
measure the evolution of the global distribution with time (Figure 25).
Figure 25. LOWMS Long-Term Helium Concentration Evolution Inside the Vessel

NEA/CSNI/R(2012)5
50
This helium distribution clearly illustrates four different homogeneous zones outside the compartment. A first
zone, rich in helium, is located at the top of the facility, and in the upper part of the annular space between the
condensers and the compart-ment (in red). A second area, with a slightly less helium, is located in the lower
part of this annular space, above the annular ring of the compartment (in yellow). Two other zones are
located below the annular ring of the compartment. At the end of steam injection, a concentration difference
existed between these two zones, but homogenization did finally occur in this region (blue zone).
The internal region of the compartment showed different behaviour, with very low initial helium
concentration and a very large vertical concentration difference, due to the low density of sampling points
inside the compartment cylinder.
4.3.3 The common MISTRA-PANDA tests
The boundary and initial conditions in these common tests were almost the same, with the major difference
being the distance between the injection point and the bottom of the stratified layer (2200mm in MISTRA
tests and 875mm in PANDA tests – Figure 26). Also, slightly heated air was injected in the PANDA
experiments, whereas air at ambient temperature was injected in the MISTRA tests.
Figure 26. View of MISTRA and PANDA Facilities Showing Sensor Locations

NEA/CSNI/R(2012)5
51
Interaction of a fountain-like flow with a stratified layer is a complex phenomenon. The different regimes
which have been observed and analyzed, based on local and global behaviour, include pure molecular
diffusion mixing, global dilution and slow erosion. Dimensionless quantities have been proposed for these
regimes. The interaction Froude number can be used to identify the ability of an air jet to erode or dilute a
stratified layer. A second Froude number has been proposed to characterise the effect of the layer width.
The Froude number has to be determined with care, as it is calculated for initial condition only. It evolves
with time, leading to changes in the erosion process during a test, and this is truer for PANDA, due to the
important helium reservoir at the top of the facility. Regarding time-scale, low-interaction Froude number
leads to mixing process driven by molecular diffusion. When the interaction Froude number is increased to
high values, the dilution process can be described in terms of a global time-scale based on volumetric
mixing (tair), provided that air entrainment by the jet is taken into account. The intermediate case, with two
layers, is more complicated and a single time-scale cannot be derived. Considering the complexity of the
phenomena being addressed, and the non-trivial evolution of the dilution process, these tests results, and
especially those of tests LOWMA3 in MISTRA and ST1-7 in PANDA, can be regarded as a good database
for CFD code verification. Consequently, the experimental results and the phenomenological analysis for
these tests were presented at the recent CFD4NRS Workshop 2010.
4.4 PANDA horizontal fluid release series: ST2
In this test series, the effect of a low-momentum horizontal buoyant jet on the erosion of an initially helium-
rich layer was studied. These experiments provide valuable data for solving the fundamental problem of
evaluating the erosion/build-up of stratification in a volume under the influence of lateral injection. The
safety issue concerned is related to the predictability of the accumulation of hydrogen in certain regions of a
multi-compartment containment building of an LWR. In particular, the simulation of helium accumulation at
the top of the dead-end volume requires great attention with respect to the choice of the mesh needed for
correctly representing gas stratification during the phase of steam injection following the release of helium.
This had already been indentified as a challenging scenario for codes in the frame of earlier investigations at
PANDA.
The initial helium-rich layer has always been created at the top of Vessel 1. The main parameters varied in
the four tests carried out in this series were the location of the injection point, the pressure evolution and
the presence of condensation. These parameter variations are summarized in Table 6. The approach used
when devising the test series was to increase the complexity step by step, always including a new
phenomenon (pressurization, condensation), but still retaining transparency regarding the effect of each
phenomenon on the gas mixing.
The main result of the test series is the characterization of the behaviour of the helium concentration in the
layer and the effect of the phenomena mentioned above on it, as shown in Figure 27 for two tests.
This behaviour shows mostly the different decay rates of the helium concentration, depending on the
position inside the layer. In particular, in the presence of pressurization, the primary observable effect on
the lower part of the layer is related to compression of the whole layer. The decay of the helium
concentration, except at the top of the layer, is determined mainly by this effect, whose rate is determined
by the rate of pressurization (see Slope 2 in Figure 27(a) and (b)). The most important effect of
condensation is that it results in the accumulation of helium at the top of the layer by redistribution of the
helium in the layer, starting from the bottom [see Slope 3 in Figure 27(a) and (b)].
As the result of a continuous effort to upgrade the instrumentation in PANDA, thermal anemometers have
been developed and installed in the IP to measure the gas velocity. These have proven in this test, for the
first time, the existence of counter-current flow in the IP and provided results that are very consistent with
PIV measurement results in Vessel 1 at the exit of the IP, as shown in Figure 28.

NEA/CSNI/R(2012)5
52
Figure 27: Evolution of the helium concentration at several measurement locations
along the axis of Vessel 1 for tests ST2_3 (a) and ST2_4 (b) The sensor notation MCG.D1x.xx denotes concentration measurement in Vessel 1 and the next digit, from
A to T, indicates the elevation: A is at the very top, T is at the bottom, and I is near the top of the IP. The
solid black line in (a) shows the results of a 1D diffusion calculation for level A.
(a)
(b)
Figure 28. PIV measurements of Gas Velocity at the Exit of the IP in Vessel 1 (a).
Measurement by Thermal Anemometers of the Gas Velocity in the IP Close to the Exit to Vessel 1 (b).
The inset in (a) indicates the positions of the two measurements.
4.5 MISTRA vertical fluid jet impinging on horizontal ring plate series: INITIALS-IMPIGS
The main objective of the IMPIGS test [89] (see Table 15) was to study the effect of lower, vertical, off-
centred, low-momentum steam injection, impinging on the annular ring of the compartment, on the behaviour
of the helium cloud. The steam mass flow rate was the same as in the LOWMS test series, (close to 19g/s),
but the duration of injection was longer at 4800seconds, after which there was complete homogenization of
the stratification. The steam injection started immediately after the INITIALS test (with a short delay of
30 seconds). The temperature of the three condensers was kept constant and equal to 100°C. As in the
0 1000 2000 3000 4000 5000 6000 70000
10
20
30
40
50
60
70
80
90
100
time [s]
He
mo
lar
fra
ctio
n [a
rb. u
nit]
MCG.D1A.20
MCG.D1C.20
MCG.D1D.20
MCG.D1G.20
MCG.D1H.20
MCG.D1I.20
MCG.D1T.20
Slope 2
Slope 1 Slope 3
0 2000 4000 6000 8000 10000 12000 140000
20
40
60
80
100
120
140
160
time [s]
He
mo
lar
fra
ctio
n [a
rb. u
nit]
MCG.D1A.20
MCG.D1C.20
MCG.D1D.20
MCG.D1G.20
MCG.D1H.20
MCG.D1I.20
MCG.D1T.20Slope 3
Slope 2
Slope 1
0 500 1000 1500 2000 2500 3000 3500 4000 4500 50000
0.01
0.02
0.03
0.04
0.05
0.06
0.07
time [s]
horizonta
l velo
city [
-]
Anemo1
Anemo2

NEA/CSNI/R(2012)5
53
LOWMS test series, due to steam injection, condensation occurred and was monitored. The evolution of
condensation phenomena is complex and correlated to the thermal and concentration mixing. The short-term
evolution of the concentration of helium in the cloud is given in Figure 29.
Figure 29. IMPIGS Short-Term Helium Concentration Evolution Inside the Stratification Region
It can first of all be noted that rapid homogenization occurred in the lower part of the stratification region
during the first 800s of injection: the injected steam penetrated into the lower part of the stratification, up to a
height of 6m, in the upper part of the facility, and a slow decrease in the helium concentration was observed.
This decrease was due to the erosion of the lower part of the stratification by the injected steam. Finally,
sudden homogenization occurred about 4000s after the beginning of steam injection. The gas temperature
evolution is given in Figure 30, where a temperature increase and homogenization in the lower levels of the
stratification can be seen. It can also be observed that there was a temperature decrease at the upper levels of
the facility, as the steam injection did not penetrate up to this region. The upper part of MISTRA was
therefore “cold” and rich in helium. This flow configuration is instable and, after a certain delay, the final
homogenization occurred. Finally, total homogenization of the stratification region probably occurred about
4100s after the beginning of steam injection.
Figure 31 presents the temperature field at four different times (1000, 4081, 4111 and 4141 seconds after
the beginning of the LOWOF steam injection) and shows that the major part of the initial stratified zone
was almost homogeneous in temperature. However, a temperature difference can be observed at the
highest levels of the facility, where this region remains “cold”. This is confirmation that the steam flow did
not penetrate up to these upper levels of the stratification. About 4100s after the beginning of steam
injection, a sudden thermal homogenization occurred. This phenomenon was due to the appearance of a
thermal loop (Figure 31 (b), (c) and (d)), and it seems that the injected steam then suddenly penetrated up
to the highest levels of the facility, on the side of the injection (at an angle of 345°). The development of a
kind of “hot wave” can be observed from the side of the injection to the opposite side. This thermal
homogenization caused a global temperature decrease (compare Figure 31 (c) and (d)).

NEA/CSNI/R(2012)5
54
Figure 30. IMPIGS Short-Term Gas Temperature Evolution Inside the Stratification –
Angle 345°; Radius~1m
Figure 31. IMPIGS Transient Behaviour of the Temperature Field
a) 1000s after the beginning
of LOWOF steam injection
(b) 4081s after the beginning
of LOWOF steam injection
c) 4111s after the beginning
of LOWOF steam injection
(d) 4141s after the beginning
of LOWOF steam injection
The long-term evolution of helium dispersion inside the vessel volume was also monitored (Figure 32).
This concentration evolution initially clearly points out three different homogeneous zones in the complete
vessel.

NEA/CSNI/R(2012)5
55
Figure 32. IMPIGS Long-Term Helium Concentration Evolution Inside the Vessel
The first homogeneous zone is, in fact, the entire vessel, with the exception of the inner region of the
compartment (in red).The second area is a large region of the lower part of the interior of the compartment.
This zone is poor in helium and insulated from the outside of the compartment. Only molecular diffusion
enables the enrichment of this volume, so that rise in helium concen-tration is very slow (in grey). The
third zone is a buffer region between the outside and the inside of the compartment, located in the upper
region, inside the compartment.
At the end of the experiment, this zone had mixed with the rest of the vessel (in blue).The phenomena were
well repeatable and gave high confidence in the observations made. The helium concentration evolution
inside the stratification was the result of two separate effects. Helium concentration homogenization and
decrease due to the mixing effect of the steam injection, and helium concentration reduction due to dilution
by the injected steam. It is also interesting to evaluate the main differences between this series of tests and the
LOWMS test series, as the steam mass flow rate was exactly the same in both. Concerning the process of
pure mixing, the lower, off-centred steam injection was less efficient than the upper injection of the LOWMS
series. During the lower steam injection tests, total homogenization of the initial stratification occurred more
than 1 hour after the beginning of injection. On the other hand, during the upper water steam injection tests,
total homogenization was faster and happened in less than 10 minutes. The effect of the impingement of the
jet on the compartment ring plate led to a “softening” of the momentum effect and is clearly observed here.
Concerning the global dilution effect, lower injection was more efficient than upper injection.
4.6 PANDA and MISTRA spray series
4.6.1 PANDA tests: ST3 series
Sprays are important for accident mitigation within PWR containments. Besides the effect they have on the
pressure of the system (by condensation of steam), they also enhance mixing due to entrainment and
turbulence. Therefore, sprays are a possibly important mechanism for breaking up a stratified hydrogen
layer, if stratification occurs in a postulated severe accident. Whereas detailed data from spray tests in a
single volume already existed, the new PANDA spray tests produced detailed data on the effect of a spray
on the break-up of gas stratification in a multi-compartment containment.

NEA/CSNI/R(2012)5
56
In these PANDA tests, a spray nozzle was installed in the upper region of Vessel 1, as shown in Figure
33(a). During the preconditioning phase, a helium-rich layer was created in the upper region of Vessel 1
and the remaining volume of Vessel 1, together with the IP and Vessel 2, were preconditioned with a
mixture of steam and air, and pressurized. The spray water flow rate was kept constant during the test.
Figure 34 shows temperature contour maps at selected times for test ST3_2, taken as a typical example of
these spray tests, and Figure 37 the helium concentration variation at selected locations in Vessel 1, the IP
and Vessel 2. From such temperature contour maps, it is possible to infer the flow pattern.
A thermal gradient built up in Vessel 1 during the early stages of spray activation, with a colder region
visible, which corresponds to the spray cone. As spray injection proceeded, the thermal flow pattern
indicates the presence of flow in the lower region of the IP, from Vessel 1 to Vessel 2, and the gas
temperature in Vessel 1, below the spray nozzle, became more uniform. In Vessel 2 stratification formed at
the height of the IP, with the colder part in the lower region of the Vessel.
Gas composition measurements (Figure 35) indicate that the initial, imposed stratification in Vessel 1 (e.g.
sensor B20) was broken down by the spray. Nevertheless, due to condensation and mixing, inter-
compartment (Vessel 1 and Vessel 2) flow takes place, with a helium-steam-air mixture being transported
to Vessel 2. This three-gas mixture was rich in air (the steam content in Vessel 1 was reduced due to
condensation) and heavier, and therefore accumulated in the lower region of Vessel 2.
The uniqueness of these PANDA spray tests lies in the fact that it was observed that hydrogen
concentration peaks could appear in containment regions not directly affected by the spray water and,
depending on the three-gas mixture composition, hydrogen (the lightest gas!) may accumulate in the lower
region of the containment (in the lower region of Vessel 2, in PANDA).
Figure 33. Schematic of PANDA for the Spray Series Tests
(a)
(b)

NEA/CSNI/R(2012)5
57
Figure 34. Temperature Contour Maps for Test ST3_2

NEA/CSNI/R(2012)5
58
Figure 35. Helium Content in Vessel 1, the IP and Vessel 2 in PANDA Test ST3_2
4.6.2 MISTRA tests: INITIALS-SPRAY
The main objective of the SPRAY test [88] (see Table 16) was to study the effect on the behaviour of the
helium cloud of a spray generated at the top and at the centre of the vessel. This SPRAY test started
immediately after the INITIALS test (with a short delay of 30s) and its duration was 120seconds. The
temperature of the three condensers was kept constant and equal to 100°C.
The permanent spray mass flow rate was 0.9kg/s, and the water temperature 30°C. The spray cone angle
was 30°, with a full jet nozzle. The whole spray penetrated inside the compartment. Figure 36 shows the
evolution of the helium concentration inside the stratification during and just after the start of the spray.
Due to the short duration (120s) of the spray phase, no concentration measurement was available during
this phase. It can be noted that very fast homogenization of this stratification took place, so that total
homogenization occurred in less than 7 minutes after the beginning of spraying.
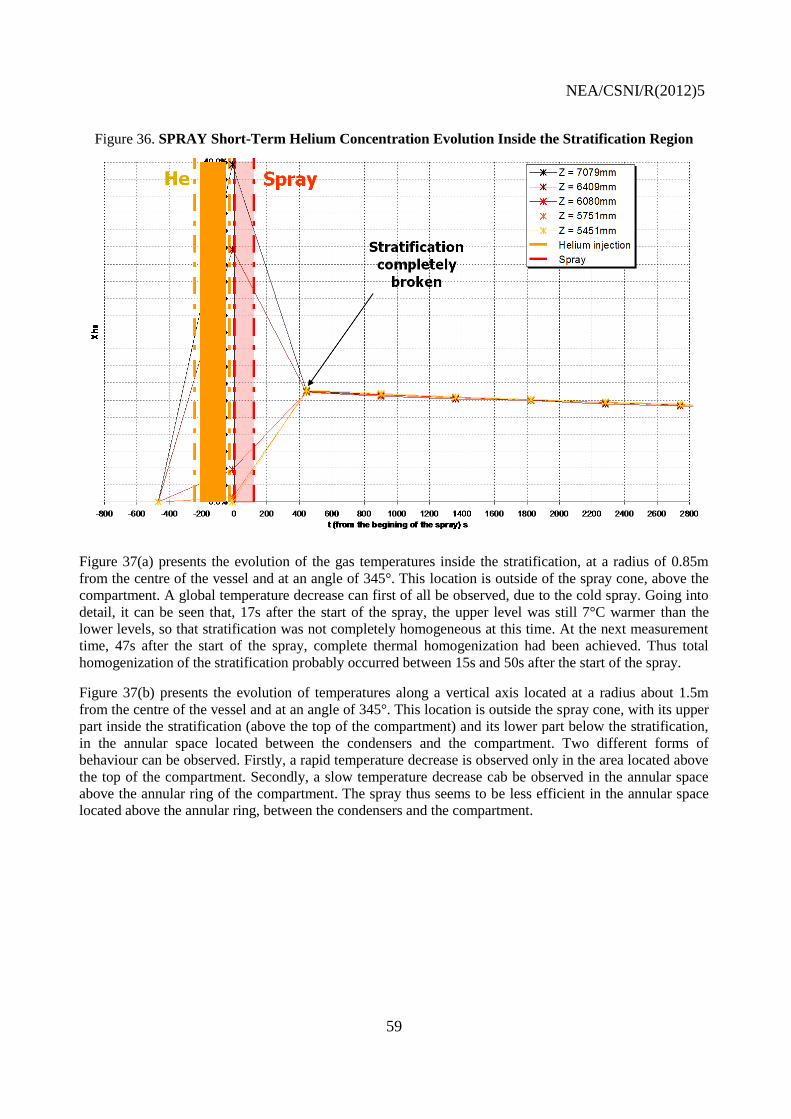
NEA/CSNI/R(2012)5
59
Figure 36. SPRAY Short-Term Helium Concentration Evolution Inside the Stratification Region
Figure 37(a) presents the evolution of the gas temperatures inside the stratification, at a radius of 0.85m
from the centre of the vessel and at an angle of 345°. This location is outside of the spray cone, above the
compartment. A global temperature decrease can first of all be observed, due to the cold spray. Going into
detail, it can be seen that, 17s after the start of the spray, the upper level was still 7°C warmer than the
lower levels, so that stratification was not completely homogeneous at this time. At the next measurement
time, 47s after the start of the spray, complete thermal homogenization had been achieved. Thus total
homogenization of the stratification probably occurred between 15s and 50s after the start of the spray.
Figure 37(b) presents the evolution of temperatures along a vertical axis located at a radius about 1.5m
from the centre of the vessel and at an angle of 345°. This location is outside the spray cone, with its upper
part inside the stratification (above the top of the compartment) and its lower part below the stratification,
in the annular space located between the condensers and the compartment. Two different forms of
behaviour can be observed. Firstly, a rapid temperature decrease is observed only in the area located above
the top of the compartment. Secondly, a slow temperature decrease cab be observed in the annular space
above the annular ring of the compartment. The spray thus seems to be less efficient in the annular space
located above the annular ring, between the condensers and the compartment.

NEA/CSNI/R(2012)5
60
Figure 37. SPRAY Short-Term Gas Temperature Evolution Inside the Stratification
(a) Radius 0.85m
(b) Radius 1.47m
Figure 38 presents the temperature field at four different times (17, 47, 107 and 137 seconds after the
beginning of spraying). The spray initially caused sudden cooling of the upper part of the facility (Figure
38a). A kind of “cold gas pocket” was generated near the spray nozzle and expanded rapidly, so that, 47
seconds after the beginning of spraying, all the initial stratification zone had cooled down (Figure 38b).
Figure 38d shows lower efficiency of the spray in the annular space of the compartment, as the convection
loop generated by the spray had not yet reached this zone, so that it was still hot.

NEA/CSNI/R(2012)5
61
Figure 38. SPRAY Transient Behaviour of the Temperature Field
(a) 17s after the beginning
of spraying
(b) 47s after the beginning
of spraying
(c) 107s after the beginning
of spraying
(d) 137s after the beginning
of spraying (17s after the
end of spraying)
The long-term evolution of helium dispersion inside the vessel volume was also monitored (Figure 39). The
concentration evolution clearly points out three different homogeneous zones in the whole vessel. A first
zone, rich in helium, includes the top region of the facility, the very upper part of the annular space between
the condensers and the compartment, and the interior of the compartment (in red). A second area, with
slightly less helium measured, is located in the lower part of the annular space between the condensers and
the compartment, above the annular ring of the compartment (in yellow).
Figure 39. SPRAY Long-Term Helium Concentration Evolution inside the Vessel
The third homogeneous zone is the bottom part of the facility, below the annular ring of the compartment
(in blue).

NEA/CSNI/R(2012)5
62
These measurements confirm the temperature measurement in the short-term observations: the spray is less
efficient in the annular space. However, the spray is very efficient at the top of the facility and inside the
compartment. Finally, rapid global homogenization of the vessel is observed (3.5 hours after the beginning
of spraying), so that an easy and accurate mass balance can be made.
4.7 PANDA containment cooler series: ST4
The purpose of the containment cooler series was to address the possibility of a change in the performance
of a containment cooler during an accident sequence scenario involving light non-condensable gas. For
safety reasons, helium was used to simulate hydrogen in these tests. The operation of the cooler was
studied during a scenario involving the successive injection of steam (Phase I), a steam-helium mixture
(Phase II) and steam again (Phase III) into hot air.
The success of the tests can be measured by their capability of providing sufficient information to study
precisely the course of events in the entire containment during the evolution of the accident scenario. It
was of particular interest to verify the possibility of the accumulation of light non-condensable gas
(helium) in the system, as well as to verify the possibility of unstable operating conditions occurring, and
the resulting gas concentration patterns inside and outside of the cooler.
Three main experimental parameters were chosen for the containment cooler fluid release series (ST4_x)
in the PANDA test facility (see also Table 8):
1. Cooler position inside Vessel 1.
2. Venting from Vessel 2, to observe the effects of pressurization.
3. The presence or absence of the duct (downward chimney).
The series consisted of four experiments, with two additional experiments conducted to check on the
repeatability of the phenomena.
Results depicting the mixing, transport and stratification were presented in terms of concentration and
temperature maps. In addition, PIV was used to provide a better insight into the flow velocity pattern
around the cooler. The cooling power of the system obtained from the feeding line energy balance, as well
as the condensation rate, is also available. Two temperature contour maps have been selected to underline
the main difference in flow patterns associated with the position of the cooler.
For both configurations, pure steam injection during Phase I passed through a transient process to an
equilibrium condition, in which the heat injected through the jet was balanced by the heat removed by the
cooler. In this phase, t<3600s, gas flows through the duct (shown in blue on the temperature map).
For the middle configuration, Figure 40, strong degradation of cooler performance, by as much as 20%,
was observed during the injection of a helium/steam mixture in Phase II, caused by the accumulation of
helium-rich gas stratified inside the cooler, t=4700s. Helium-rich gas accumulation had already blocked
flow through the exhaust duct by t=4500s. However, cooler performance recovered during Phase II, despite
the fact that the duct flow remained blocked for the rest of the test. This recovery was associated with the
continuous release of a helium-rich gas mixture from the cooler (t= 5100s), that led to the formation of
strong density stratification at the top of the vessel, at t=5700s. In Phase III, neither the injected steam jet
nor the escaping helium gas mixture plume was able to penetrate the stratified layer, which remained stable
for the rest of the test (t=9000s).

NEA/CSNI/R(2012)5
63
Figure 40. Temperature Contour Map for the Test with the Cooler at the Middle Position
Figure 41. Temperature Contour Map for the Test with the Cooler at the Top Position
For the top configuration, Figure 41, the accumulation of helium was also observed in the cooler casing in
Phase II, but to a smaller extent compared with the middle configuration, so that performance degradation
remained limited. Additionally, flow through the duct was enhanced, leading to the formation of helium-
rich gas mixture accumulation at the middle elevation of the vessel (4530s < t < 5730s). The presence of
the cooler in the upper part of the vessel enhanced the mixing such that density stratification, weaker than
for the middle configuration, was observed only in the lower part of the vessel. This stratified layer was
eroded before the end of Phase III.
The flow patterns obtained, deduced from the temperature contour map observations associated with gas
concentration measurements, were supported by extensive PIV measurement sequences obtained
throughout the test. An example of a measured velocity field, underlining the outflow of light, cold gas
from the cooler, is presented in Figure 42 for test ST4_2. The left-hand side presents the velocity field

NEA/CSNI/R(2012)5
64
obtained from raw images, such as the one presented on the right-hand side. Here, the head of the gas
plume is stopped by the presence of a stagnant low-density layer beneath the top of the vessel.
From test ST4_3, it has been observed that the presence of the duct does not affect the performance of the
cooler at the middle position in the presence of a light non-condensable, as the duct flow stops shortly after
the beginning of Phase II for ST4_2.
Behaviour similar to ST4_2 was observed in test ST4_1, with deterioration of cooler performance followed
by a recovery. The main difference appeared later in the test where, as the pressure increased, the
deterioration/recovery sequence appeared to be re-initiated in a cyclic form, even after non-condensable
gas injection had stopped.
Figure 42. Example of Velocity Field Obtained for Test ST4_2, Showing Gas Release from the Cooler
4.8 PANDA heat source simulating a recombiner series: ST5
The purpose of the heat source series was to observe the effect of complex flow patterns induced by a
10kW heat source (representing a recombiner ― an active severe-accident hydrogen mitigation device) on
gas transport and stratification-break-up, in a multi-compartment containment at a large scale, approaching
the dimensions of actual containment compartments. These tests addressed the resistance of a hydrogen-
rich layer, located just beneath the containment dome, to a thermal buoyant plume generated by a heat
source (and also combined with a mass source) which becomes negatively buoyant when reaching the
upper layer containing the hydrogen. For safety reasons, helium was used to simulate hydrogen in these
tests. The test parameters allowed an evaluation to be made of the rate of the erosion and mixing process
resulting from the presence of the heat source.
Three main experimental parameters were chosen for the ST5 series in the PANDA facility (see Table 9):
1. Heat source position inside Vessel 1.
2. The injection, or not, of steam (mass source).
3. Initial ambient gas composition in Vessel 1 and 2.
The series consisted of four experiments, with two additional experiments conducted to check on the
repeatability of the phenomena.
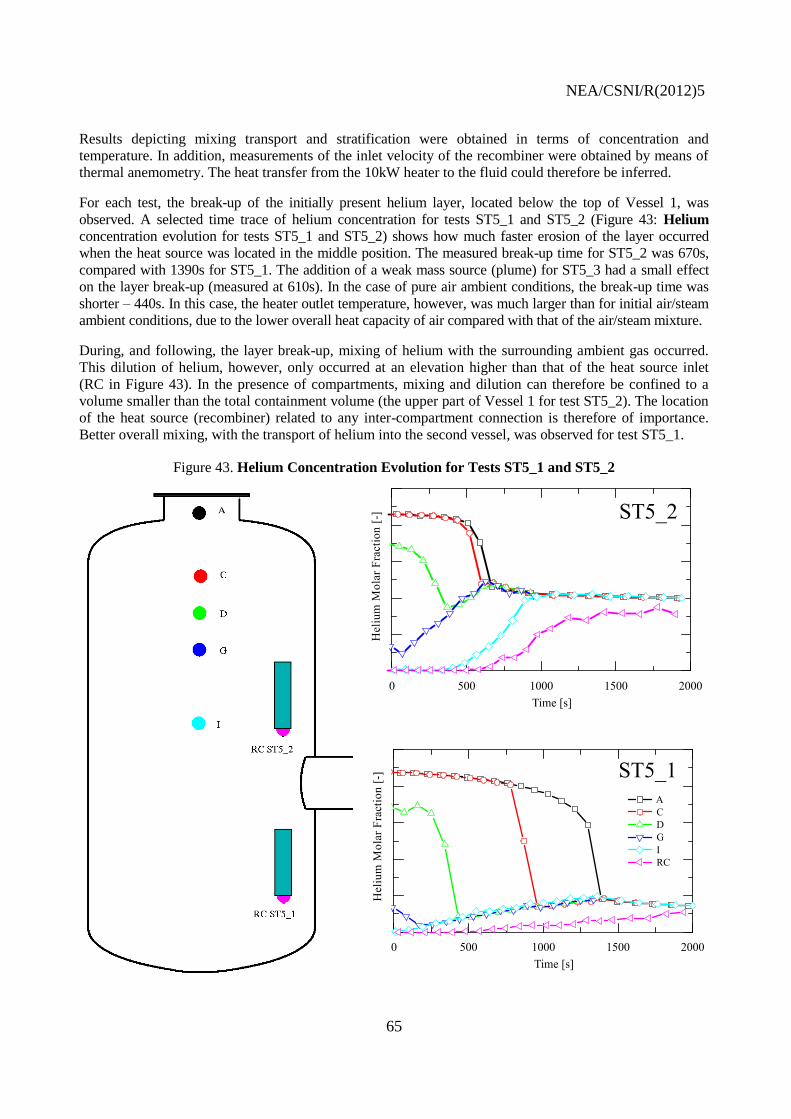
NEA/CSNI/R(2012)5
65
Results depicting mixing transport and stratification were obtained in terms of concentration and
temperature. In addition, measurements of the inlet velocity of the recombiner were obtained by means of
thermal anemometry. The heat transfer from the 10kW heater to the fluid could therefore be inferred.
For each test, the break-up of the initially present helium layer, located below the top of Vessel 1, was
observed. A selected time trace of helium concentration for tests ST5_1 and ST5_2 (Figure 43: Helium
concentration evolution for tests ST5_1 and ST5_2) shows how much faster erosion of the layer occurred
when the heat source was located in the middle position. The measured break-up time for ST5_2 was 670s,
compared with 1390s for ST5_1. The addition of a weak mass source (plume) for ST5_3 had a small effect
on the layer break-up (measured at 610s). In the case of pure air ambient conditions, the break-up time was
shorter – 440s. In this case, the heater outlet temperature, however, was much larger than for initial air/steam
ambient conditions, due to the lower overall heat capacity of air compared with that of the air/steam mixture.
During, and following, the layer break-up, mixing of helium with the surrounding ambient gas occurred.
This dilution of helium, however, only occurred at an elevation higher than that of the heat source inlet
(RC in Figure 43). In the presence of compartments, mixing and dilution can therefore be confined to a
volume smaller than the total containment volume (the upper part of Vessel 1 for test ST5_2). The location
of the heat source (recombiner) related to any inter-compartment connection is therefore of importance.
Better overall mixing, with the transport of helium into the second vessel, was observed for test ST5_1.
Figure 43. Helium Concentration Evolution for Tests ST5_1 and ST5_2

NEA/CSNI/R(2012)5
66
4.9 MISTRA Natural Convection due to Wall Heat Transfer Series: INITIALS-NATHCO
The main objective of the NATHCO test [90] (see Table 17) was to study the effects of natural convection
generated by the heating up of the middle and upper condensers on the behaviour of the helium cloud. A
thermal ramp was applied simultaneously to the middle and upper condensers. The heating temperature range
covered the range from 100 to 130°C, with heating rate of 0.5°C/s. The lower condenser temperature was
kept constant at 100°C. This phase started immediately after the INITIALS test (with a short delay of 30s).
The choice of heating the condensers instead of cooling them was made in order to obtain a single effect on
mixing, instead of the complex mixing which would occur with condensation during a cooling phase. The
short-term evolution of the concentration of helium in the cloud is given in Figure 44. It can be seen that slow
homogenization occurs inside the stratification, similar to that observed in the case of the post-INITIALS
phase, so that full homogenization occurs only at the end of the heat-up of the condensers, i.e. about 1 hour
after the beginning of the phase. This homogenization progressed downwards, from the top of the vessel.
Figure 44. NATHCO Short-Term Helium Concentration Evolution inside the Stratification
At the top levels of the stratification (above a height of 7.1 m), helium concentration decreased continuously,
whereas its evolution at the lower levels was not continuous. At the beginning of this time evolution, i.e.
approximately during the first 1500s after the end of helium injection, the concentration evolution looks like an
enhanced diffusion profile. Then, the lower levels join the top level by a process of rapid helium enrichment,
so that, about 3700s after the end of helium injection, the stratification has been completely broken up. Gas
temperature evolution is given in Figure 45. Global increase of temperature inside the stratification can be
observed, caused by the heating up of the condensers. Thermal homogenization occurred downwards, from the
top of the vessel, and was analogous to the progress observed for helium concentration. The lower levels of
stratification joined the upper level one after the other, by suddenly cooling down, as had been observed during
the INITIALS test. The time-scale of thermal and concentration homogenizations are similar, and thus linked.
The mixing down to a height of 6.4m took about 2100s after the beginning of heating up, then reached 6.1m
after 2700s, and finally reached 5.5m after 3700s, at which time the stratification could be considered to be
completely broken up. These times are exactly half of the corresponding times obtained during the INITIALS
test with only natural homogenization of the stratification.
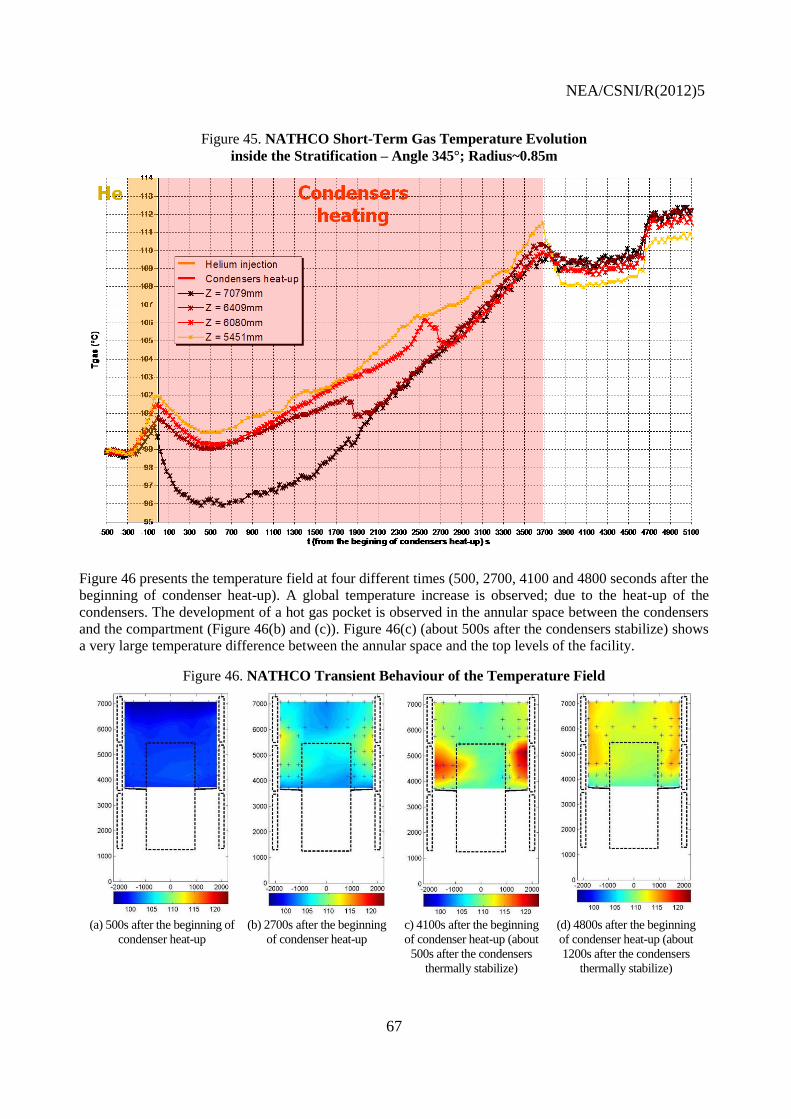
NEA/CSNI/R(2012)5
67
Figure 45. NATHCO Short-Term Gas Temperature Evolution
inside the Stratification – Angle 345°; Radius~0.85m
Figure 46 presents the temperature field at four different times (500, 2700, 4100 and 4800 seconds after the
beginning of condenser heat-up). A global temperature increase is observed; due to the heat-up of the
condensers. The development of a hot gas pocket is observed in the annular space between the condensers
and the compartment (Figure 46(b) and (c)). Figure 46(c) (about 500s after the condensers stabilize) shows
a very large temperature difference between the annular space and the top levels of the facility.
Figure 46. NATHCO Transient Behaviour of the Temperature Field
(a) 500s after the beginning of
condenser heat-up
(b) 2700s after the beginning
of condenser heat-up
c) 4100s after the beginning
of condenser heat-up (about
500s after the condensers
thermally stabilize)
(d) 4800s after the beginning
of condenser heat-up (about
1200s after the condensers
thermally stabilize)
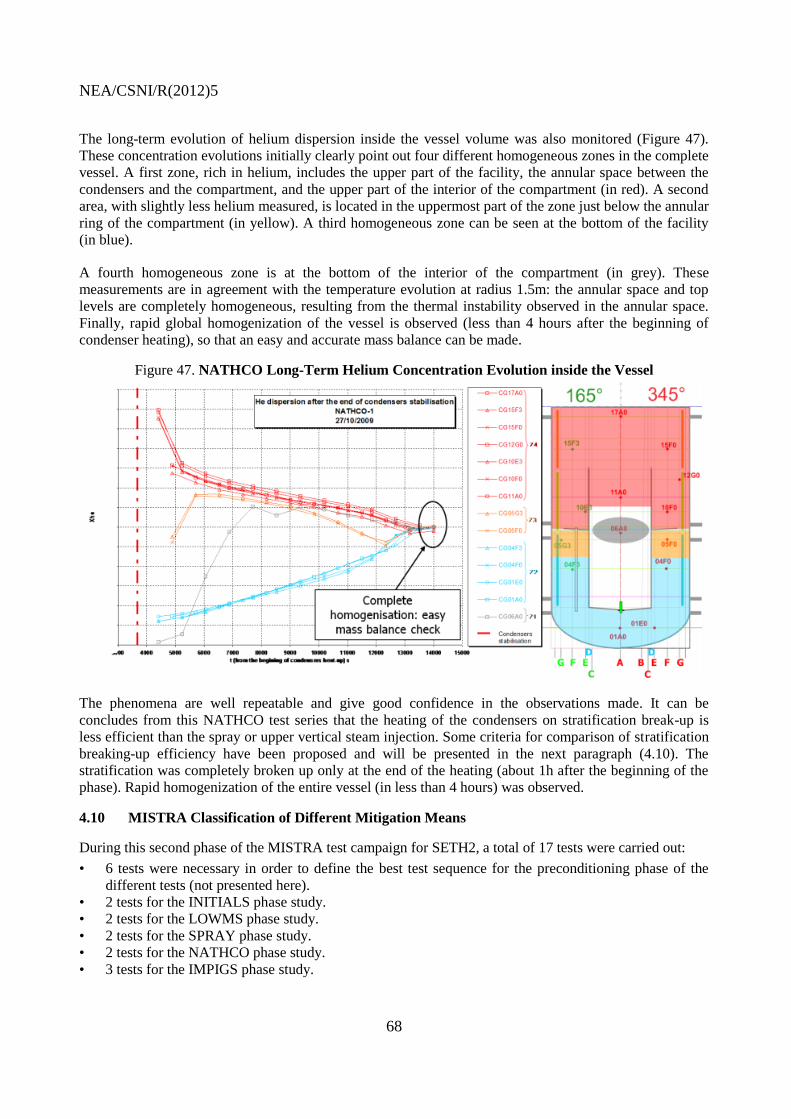
NEA/CSNI/R(2012)5
68
The long-term evolution of helium dispersion inside the vessel volume was also monitored (Figure 47).
These concentration evolutions initially clearly point out four different homogeneous zones in the complete
vessel. A first zone, rich in helium, includes the upper part of the facility, the annular space between the
condensers and the compartment, and the upper part of the interior of the compartment (in red). A second
area, with slightly less helium measured, is located in the uppermost part of the zone just below the annular
ring of the compartment (in yellow). A third homogeneous zone can be seen at the bottom of the facility
(in blue).
A fourth homogeneous zone is at the bottom of the interior of the compartment (in grey). These
measurements are in agreement with the temperature evolution at radius 1.5m: the annular space and top
levels are completely homogeneous, resulting from the thermal instability observed in the annular space.
Finally, rapid global homogenization of the vessel is observed (less than 4 hours after the beginning of
condenser heating), so that an easy and accurate mass balance can be made.
Figure 47. NATHCO Long-Term Helium Concentration Evolution inside the Vessel
The phenomena are well repeatable and give good confidence in the observations made. It can be
concludes from this NATHCO test series that the heating of the condensers on stratification break-up is
less efficient than the spray or upper vertical steam injection. Some criteria for comparison of stratification
breaking-up efficiency have been proposed and will be presented in the next paragraph (4.10). The
stratification was completely broken up only at the end of the heating (about 1h after the beginning of the
phase). Rapid homogenization of the entire vessel (in less than 4 hours) was observed.
4.10 MISTRA Classification of Different Mitigation Means
During this second phase of the MISTRA test campaign for SETH2, a total of 17 tests were carried out:
• 6 tests were necessary in order to define the best test sequence for the preconditioning phase of the
different tests (not presented here).
• 2 tests for the INITIALS phase study.
• 2 tests for the LOWMS phase study.
• 2 tests for the SPRAY phase study.
• 2 tests for the NATHCO phase study.
• 3 tests for the IMPIGS phase study.
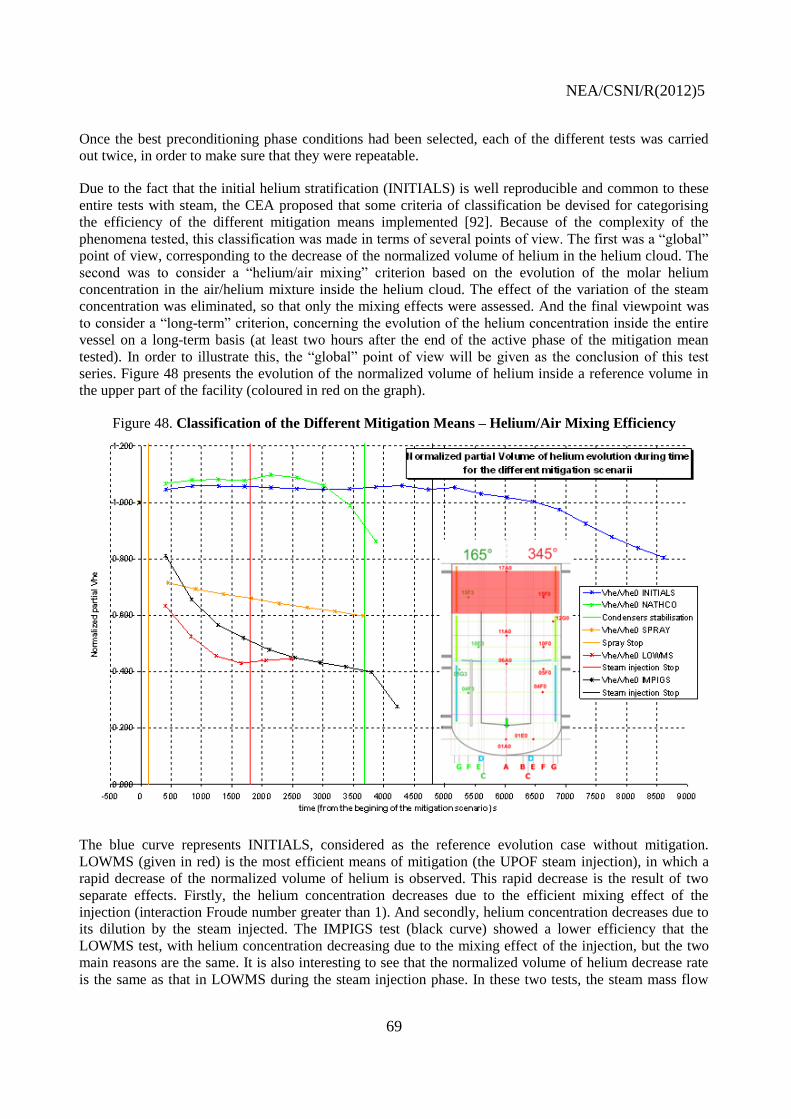
NEA/CSNI/R(2012)5
69
Once the best preconditioning phase conditions had been selected, each of the different tests was carried
out twice, in order to make sure that they were repeatable.
Due to the fact that the initial helium stratification (INITIALS) is well reproducible and common to these
entire tests with steam, the CEA proposed that some criteria of classification be devised for categorising
the efficiency of the different mitigation means implemented [92]. Because of the complexity of the
phenomena tested, this classification was made in terms of several points of view. The first was a “global”
point of view, corresponding to the decrease of the normalized volume of helium in the helium cloud. The
second was to consider a “helium/air mixing” criterion based on the evolution of the molar helium
concentration in the air/helium mixture inside the helium cloud. The effect of the variation of the steam
concentration was eliminated, so that only the mixing effects were assessed. And the final viewpoint was
to consider a “long-term” criterion, concerning the evolution of the helium concentration inside the entire
vessel on a long-term basis (at least two hours after the end of the active phase of the mitigation mean
tested). In order to illustrate this, the “global” point of view will be given as the conclusion of this test
series. Figure 48 presents the evolution of the normalized volume of helium inside a reference volume in
the upper part of the facility (coloured in red on the graph).
Figure 48. Classification of the Different Mitigation Means – Helium/Air Mixing Efficiency
The blue curve represents INITIALS, considered as the reference evolution case without mitigation.
LOWMS (given in red) is the most efficient means of mitigation (the UPOF steam injection), in which a
rapid decrease of the normalized volume of helium is observed. This rapid decrease is the result of two
separate effects. Firstly, the helium concentration decreases due to the efficient mixing effect of the
injection (interaction Froude number greater than 1). And secondly, helium concentration decreases due to
its dilution by the steam injected. The IMPIGS test (black curve) showed a lower efficiency that the
LOWMS test, with helium concentration decreasing due to the mixing effect of the injection, but the two
main reasons are the same. It is also interesting to see that the normalized volume of helium decrease rate
is the same as that in LOWMS during the steam injection phase. In these two tests, the steam mass flow

NEA/CSNI/R(2012)5
70
rate injected was the same. However, the normalized volume of helium had higher values during the lower
of the centred injections because of the less efficient mixing attributed to the steam jet impingement on the
ring plate of the compartment. A sudden decrease of the normalized volume of helium is observed at time
4200s. This decrease is the consequence of the sudden homogenization that happened at this time. In the
case of the thermal effect of NATHCO (green curve), the heating of the walls appears to be the less-
efficient mitigation scenario, as the volume of helium started decreasing after 3000s. And finally, in the
case of spraying, in the SPRAY test (yellow curve), the mechanism appears to be efficient, with a rapid
decrease of the normalized volume of helium. Due to the shorter time-scale of the effect (120s), however,
it is difficult to compare its efficiency during the active phase with the other mitigation means.
During the spray test, the evolution of the normalized volume of helium was the result of two opposite
effects. The mixing effect induced a convection flow and a subsequent decrease in the helium concentration
in the cloud, but the effect of steam condensation was opposite, causing a helium concentration increase.
4.11 PANDA opening-hatches series: ST6
In the PANDA „opening hatches‟ series, the evolution of gas distribution in two large volumes was
investigated, with initially different gas composition and different pressures in the volumes, which were
then suddenly connected. This situation occurs in the case of the sudden opening of a “rupture foil”, e.g. in
the EPR design of reactor. In the PANDA tests (with a similar layout to the EPR design), the presence of
“rupture foils” that could burst under pressure difference would lead to gas (air, steam, hydrogen) mixing
and hydrogen accumulation in some containment regions. Data related to the mixing of fluids with initially
different densities in two adjacent volumes, as the result of the sudden opening of an aperture, are rather
scanty and do not encompass data at large scale. In Figure 49 is shown a schematic of the PANDA facility
for the opening-hatches series, with Vessel 1, an IP and Vessel 2 representing one compartment initially
filled with air and at atmospheric pressure, and Vessel 3, two IPs and Vessel 4 representing the other
compartment, initially filled with a three-gas mixture and at higher pressure. The test was started by the
opening of the valve in the VB line, with the gas mixture then flowing from Vessel 3 to Vessel 1.
Figure 49. Schematic of PANDA for the Opening-Hatches Test ST6_2

NEA/CSNI/R(2012)5
71
In Figure 50 are shown the temperature counter maps at selected times in Vessel 1 (on the left in each
picture), the IP and Vessel 2 (on the right in each picture).
The red point in Vessel 1 at the height of the IP shows the exit of the VB line. Gas transport mixing and
distribution within the containment compartments was driven by the pressure difference between the two
large volumes in the early phase of the test (up to ~100s), and then by the temperature gradient and gas
mixture concentration difference after the pressure between the vessels had equalized (from ~100s up to
~600s). The phenomenology taking place during these PANDA tests includes: pressurization of Vessels 1-
2, the jet in Vessel 1 inducing mixing, counter-current flow between Vessel 1 and Vessel 2, the heat-up of
the gas atmosphere in Vessel 2, and gas stratification in both vessels. Therefore, the PANDA opening-
hatches test series, in addition to the intrinsic value of directly addressing a safety issue for a new reactor
design, also provided high-quality data for code validation.
Figure 50. Temperature Contour Maps for Vessel 1 and Vessel 2 at Selected Times: ST6_2

NEA/CSNI/R(2012)5
72

NEA/CSNI/R(2012)5
73
5. CONCLUSIONS
The OECD/SETH-2 project addressed the issue of hydrogen risk in an LWR containment during the
evolution of a postulated severe accident. Experimental investigations were carried on in the large-scale,
multi-compartment thermal-hydraulic PANDA (PSI, Switzerland) and MISTRA (CEA, France) facilities.
The focus of these investigations was on the break-up of hydrogen stratification by heat and mass
sources/sinks or as the result of the operation of safety systems, such as a spray, cooler, or recombiner
(heat source). Other tests investigated the flow patterns and gas distributions in a multi-compartment
containment after the sudden opening of a valve in a line between the compartments (simulating the
opening of hatches) and the effect of low-momentum steam injection, impinging on the annular ring of the
compartment, on the break-up of helium-stratification. In all of the OECD/SETH-2 tests, helium was used
to simulate hydrogen. The experimental data obtained have been processed, qualified and distributed to the
Project participants. These data represent a unique tool for assessing and validating advanced LP and CFD
code capability for analyzing phenomena of high relevance for nuclear safety.
The analysis of the SETH-2 tests performed so far has allowed the identification of the strengths and
drawbacks of various computational tools and has contributed to the identification of areas in which further
experimental data are needed. The OECD/SETH-2 Analytical seminar held on 12–13 September 2011
allowed further evaluations of the capability of various codes.
These investigational areas identified from the SETH-2 project results, the SETH-2 analytical seminar and
the HYMERES Expert meeting have been included in the final version of the OECD/NEA HYMERES
(Hydrogen Mitigation Experiments for REactor Safety), foreseen to be carried out during the period 2012-
2015. Conclusion of the Seminar are presented in Appendix 1.

NEA/CSNI/R(2012)5
74
NEA/CSNI/R(2012)5
75
6. REFERENCES
[1a] B. Smith, “Identification and prioritization of generic nuclear safety problems requiring CFD
analysis”, In: Proceedings of the 17th International Conference on Nuc. Eng. ICONE17, Brussels,
Belgium, July 12-16, 2009.
[1b] B. Schwinges, C. Journeau, T. Haste, L. Meyer, W. Tromm, K. Trambauer, “Ranking of severe
accident research priorities”, Progress in Nuclear Engineering 52 (2010) 11-18.
[2] Yadigaroglu, G., Dreier, J., “Passive Advanced Light Water Reactor Designs and the ALPHA
program at the Paul Scherrer Institut”, Kerntechnik, 63, 39-46, 1998.
[3] Dreier, J., Aubert, C., Huggenberger, M., Strassberger, H.J., Meseth, J., Yadigaroglu, G., The
PANDA Tests for the SWR1000 Passive Containment Cooling System, 7th International
Conference on Nuclear Engineering (ICONE-7), Tokyo, Japan, April 19-23, 1999.
[4] Auban, O., Zboray, R., Paladino, D., 2007. Investigation of large-scale gas mixing and
stratification phenomena related to LWR containment studies in the PANDA facility”, Nuclear
Engineering and Design, Vol. 237, pp. 409-419
[5] D. Paladino, R. Zboray, P. Benz, M. Andreani, “Three gas-mixture plume inducing mixing and
stratification in a multi-compartment containment”, Nuclear Engineering, Vol. 240, Issue 2, pp.
210-220 (2010a).
[6] D. Paladino, R. Zboray and O. Auban, “The PANDA Tests 9 and 9bis investigating gas mixing
and stratification triggered by low momentum plumes”, Nuclear Engineering and Design, 240,
1262-1270 (2010b)
[7] D. Paladino, M. Andreani, R. Zboray and J. Dreier, “Flow transport and mixing induced by
Horizontal jet impinging on a vertical wall of the multi compartment PANDA facility”, Nuclear
Engineering and Design, Vol. 240, pp. 2054-2065 (2010c).
[8] R. Zboray and D. Paladino, “Experiments on basic thermal-hydraulic phenomena relevant for
LWR containment: Gas mixing and transport induced by buoyant jets in a multi-compartment
geometry”, Nuclear Engineering and Design, Vol. 240, pp. 3158-3169 (2010).
[9] M. Andreani, D. Paladino and T. George, “Simulation of basic gas mixing tests with condensation
in the PANDA facility using the GOTHIC code”, Nuclear Engineering and Design, 240 (2010)
1528-1547.
[10] M. Andreani and D. Paladino, “Simulation of gas mixing and transport in a multi-compartment
geometry using the GOTHIC containment code and relatively coarse mesh”, Nuclear Engineering
and Design, 240 (2010) 1506-1527.
[11] D. Abdo, E. Deri, R. Tomassian, M. Cazanou, I Tkatschenko “Mesures de concentration dans des
jets axisymétriques en milieu libre par diffusion Rayleigh”, Proceedings of “Congrès Francophone
de Techniques Laser”, CFTL 2010, Vandoeuvre-lès-Nancy - France, 14–17 September 2010.
[12] E. Deri, “Etude expérimentale de l‟initiation de l‟écoulement secondaire en forme de voile issu
d‟un jet horizontal de gaz léger”, Thèse de Doctorat de l‟Université Pierre et Marie Curie, 2009.
[13] E. Deri, B. Cariteau, D. Abdo, “Air fountains in the erosion of gaseous stratifications”,
International Journal of Heat and Fluid Flow, Volume 31, Issue 5, October 2010, Pages 935-941.
[14] O. Auban, J. Malet, P. Brun, J. Brinster, JJ. Quillico, E. Studer, “Implementation of gas
concentration measurement systems using mass spectrometry in containment thermal-hydraulics
test facilities: different approaches for calibration and measurement with steam/air/helium
mixtures”, Proceeding of the 10th International Topical Meeting on Nuclear Reactor Thermal
Hydraulics (NURETH-10), Seoul, Korea, October 5-9, 2003.
[15] J. Brinster, E. Studer, I. Tkatschenko, D. Abdo, “Interaction of a helium/air stratified layer with an
air jet coming from below in the MISTRA facility: large scale experiments and scaling analysis”,
proceedings of the 8th International Topical Meeting on Nuclear Thermal-Hydraulics, Operation
and Safety (NUTHOS-8) Shanghai, China, October 10-14, 2010.
NEA/CSNI/R(2012)5
76
[16] B. Cariteau, J. Brinster, I. Tkatschenko “Experiments on the distribution of concentration due to
buoyant gas low flow rate release in an enclosure”, International Journal of Hydrogen Energy,
Volume 36, Issue 3, February 2011, Pages 2505-2512.
[17] B. Cariteau, J. Brinster, E. Studer, I. Tkatschenko, G. Joncquet “Experimental results on the
dispersion of buoyant gas in a full scale garage from a complex source” International Journal of
Hydrogen Energy, Volume 36, Issue 3, February 2011, Pages 2489-2496.
[18] Certificate by AFNOR N°QUAL/2005/25858a, CEA to its DIRECTION DE L‟ENERGIE
NUCLEAIRE (available from 2008-12-31 to 30/12/2011).
[19] T. R. Marrero and E. A. Mason, "Gaseous diffusion coefficients", Journal Of Physical And
Chemical Reference Data, 1(1):3-118(1972).
[20] E. Studer, J. Brinster, I. Tkatschenko, (CEA), G. Mignot, D. Paladino, M. Andreani (PSI),
“Interaction of a light gas stratified layer with an air jet coming from below: large scale
experiments and scaling issues” CFD4NRS Workshop hosted by the United States Nuclear
Regulatory Commission - Washington D.C. 14–16 September 2010.
PSI Project deliverables
[21] D. Paladino, G. Mignot, R. Zboray, M. Fehlmann, H. J. Strassberger, Proposal for scoping
calculations for recombiner tests, PSI/LTH Technical note, November 2008 OECD/SETH-2
PANDA Test Facility Description and Geometrical Specifications, PSI/LTH Report TM- TM-42-
08-07-0, September 2008.
[22] D. Paladino, G. Mignot, R. Zboray, M. Fehlmann, R. Kapulla, H. Strassberger, W. Bissels, M.
Ritterath, M. Andreani, OECD/SETH-2 project: definition of PANDA test matrix for the
horizontal fluid release series, PSI/LTH Report AN-42-08-19, September 2008.
[23] OECD/SETH-2 Project: Definition of PANDA Test matrix for the Low momentum vertical fluid
release at various positions, D. Paladino, S. Gupta, G. Mignot, M. Fehlmann, R. Kapulla, H.
Strassberger, W. Bissels, M. Ritterath, M. Andreani, PSI/LTH Report AN-42-0813, September
2008.
[24] OECD/SETH-2 Project: Definition of PANDA Test matrix for the Low momentum vertical fluid
release at various positions, D. Paladino, S. Gupta, G. Mignot, M. Fehlmann, R. Kapulla, H.
Strassberger, W. Bissels, M. Ritterath, M. Andreani, PSI/LTH Report AN-42-08-13, September
2008.
[25] OECD/SETH-2 Project: Definition of PANDA Test matrix (ST1_1, ST1_2, ST1_3), D. Paladino,
S. Gupta, P. Benz, M. Fehlmann, H. Strassberger, M. Ritterath, M. Andreani, PSI/LTH Report
AN-42-08-01, February 2008.
[26] OECD/SETH-2 project: Proposal for scoping calculations for recombiner tests, M. Andreani, D.
Paladino, PSI/LTH Report AN-42-09-04, January 2009.
[27] OECD/SETH-2 Project: Definition of PANDA Test matrix for the containment spray series, D.
Paladino, G. Mignot, R. Zboray, M. Fehlmann, R. Kapulla, W. Bissels, H. Strassberger, N. Erkan,
K. Kaiser, M. Andreani, PSI/LTH Report AN-42-09-01, January 2009.
[28] OECD/SETH-2 PANDA Test ST1_1_2 Quick- Look Report, G. Mignot, R. Kapulla, D. Paladino,
N. Erkan, R. Zboray, H. Strassberger, W. Bissels and M. Fehlmann, PSI/LTH Report TM-42-09-
03, February 2009.
[29] OECD/SETH-2 Project: Definition of PANDA Test matrix for the containment cooler series, D.
Paladino, G. Mignot, N. Erkan, M. Fehlmann, W. Bissels K. Kaiser, R. Kapulla, R. Zboray, H.
Strassberger, M. Andreani, PSI/LTH Report AN-42-09-10, April 2009.
[30] OECD/SETH-2 PANDA Test ST1_4 Quick- Look Report, N. Erkan, R. Kapulla, D. Paladino, G.
Mignot, R. Zboray, H. Strassberger, W. Bissels and M. Fehlmann, PSI/LTH Report TM-42-09-0
April 2009.
[31] OECD/SETH-2 PANDA Test ST1_3 Quick- Look Report, N. Erkan, G. Mignot, R. Kapulla, D.
Paladino, R. Zboray, H. Strassberger, W. Bissels and M. Fehlmann, PSI/LTH Report TM-42-09-
08, April 2009.

NEA/CSNI/R(2012)5
77
[32] OECD/SETH-2 PANDA Test ST1_2_2 Quick- Look Report, N. Erkan, G. Mignot, R. Kapulla, D.
Paladino, R. Zboray, H. Strassberger, W. Bissels and M. Fehlmann, PSI/LTH Report TM-42-09-
07, April 2009.
[33] OECD/SETH-2 PANDA Test ST1_2 Quick- Look Report, N. Erkan, R. Kapulla, D. Paladino, G.
Mignot, R. Zboray, H. Strassberger, W. Bissels and M. Fehlmann, PSI/LTH Report TM-42-09-06,
April 2009.
[34] OECD/SETH-2 PANDA Test ST1_5 Quick- Look Report, G. Mignot, N. Erkan, R. Kapulla, D.
Paladino, , R. Zboray, H. Strassberger, W. Bissels and M. Fehlmann, PSI/LTH Report TM-42-09-
10, May 2009.
[35] OECD/SETH-2 PANDA Test ST1_6 Quick- Look Report, G. Mignot, N. Erkan, R. Kapulla, D.
Paladino, R. Zboray, H. Strassberger, W. Bissels and M. Fehlmann, PSI/LTH Report TM-42-09-
11, October 2009.
[36] OECD/SETH-2 PANDA Test ST1_7 Quick- Look Report, G. Mignot, N. Erkan, R. Kapulla, D.
Paladino, R. Zboray and M. Fehlmann, PSI/LTH Report TM-42-09-12, October 2009.
[37] OECD/SETH-2 PANDA Test ST1_7_2 Quick- Look Report, G. Mignot, N. Erkan, R. Kapulla, D.
Paladino, R. Zboray and M. Fehlmann, PSI/LTH Report TM-42-09-16, October 2009.
[38] OECD/SETH-2 PANDA Test ST1_9 Quick- Look Report, G. Mignot, N. Erkan, R. Kapulla, D.
Paladino, R. Zboray and M. Fehlmann, PSI/LTH Report TM-42-09-14, October 2009.
[39] OECD/SETH-2 PANDA Test ST1_10 Quick- Look Report, G. Mignot, N. Erkan, R. Kapulla, D.
Paladino, R. Zboray and M. Fehlmann, PSI/LTH Report TM-42-09-15.
[40] OECD/SETH-2 PANDA Test ST2_1 Quick- Look Report, G. Mignot, N. Erkan, R. Kapulla, D.
Paladino, R. Zboray and M. Fehlmann, PSI/LTH Report TM-42-09-17, November 2009
[41] OECD/SETH-2 PANDA Test ST2_2 Quick- Look Report, G. Mignot, N. Erkan, R. Kapulla, D.
Paladino, R. Zboray and M. Fehlmann, PSI/LTH Report TM-42-09-18, November 2009.
[42] OECD/SETH-2 PANDA Test ST2_3 Quick- Look Report, G. Mignot, N. Erkan, R. Kapulla, D.
Paladino, R. Zboray and M. Fehlmann, PSI/LTH Report TM-42-09-19, November 2009.
[43] OECD/SETH-2 PANDA Test ST2_4 Quick- Look Report, G. Mignot, N. Erkan, R. Kapulla, D.
Paladino, R. Zboray and M. Fehlmann, PSI/LTH Report TM-42-09-20, November 2009.
[44] OECD/SETH-2 PANDA Test ST3_1 Quick- Look Report, N. Erkan, G. Mignot, R. Kapulla, D.
Paladino, R. Zboray and M. Fehlmann, PSI/LTH Report TM-42-09-21, November 2009.
[45] OECD/SETH-2 PANDA Test ST3_2 Quick- Look Report, N. Erkan, G. Mignot, R. Kapulla, D.
Paladino, R. Zboray and M. Fehlmann, PSI/LTH Report TM-42-09-22, November 2009.
[46] OECD/SETH-2 project: definition of PANDA test matrix for Test ST3_3 and ST6_1, D. Paladino,
G. Mignot, N. Erkan, R. Zboray, M. Fehlmann, R. Kapulla, C. Wellauer, M. Andreani, PSI/LTH
report AN-42-10-01, March 2010.
[47] OECD/SETH-2 PANDA Test ST1_8, Quick-Look Report, G. Mignot, N. Erkan, R. Kapulla, D.
Paladino, R. Zboray and M. Fehlmann, TM-42-10-23-0, August 2010.
[48] OECD/SETH-2 PANDA Test ST3_0 Quick Look Report, N. Erkan, G. Mignot, R. Kapulla, D.
Paladino, R. Zboray, M. Fehlmann, C. Wellauer, TM-42-10-24-0, August 2010.
[49] OECD/SETH-2 PANDA Test ST3_3 Quick Look Report, N. Erkan, G. Mignot, R. Kapulla, D.
Paladino, R. Zboray, M. Fehlmann, C. Wellauer, TM-42-10-21-0, August 2010.
[50] OECD/SETH-2 PANDA Test ST4_0 Quick-Look Report, G. Mignot, N. Erkan, R. Kapulla, D.
Paladino, R. Zboray, M. Fehlmann, C. Wellauer, TM-42-10-22-0, August 2010.
[51] OECD/SETH-2 PANDA Test ST4_1 Quick-Look Report, G. Mignot, N. Erkan, R. Kapulla, D.
Paladino, R. Zboray, M. Fehlmann, C. Wellauer, TM-42-10-06-0, August 2010.
[52] OECD/SETH-2 PANDA Test ST4_2 Quick-Look Report, G. Mignot, N. Erkan, R. Kapulla, D.
Paladino, R. Zboray, M. Fehlmann, C. Wellauer, TM-42-10-20-0, August 2010.
[53] OECD/SETH-2 PANDA Test ST4_2_2 Quick-Look Report, G. Mignot, N. Erkan, R. Kapulla, D.
Paladino, R. Zboray, M. Fehlmann, C. Wellauer, TM-42-10-16-0, August 2010.
[54] OECD/SETH-2 PANDA Test ST4_3 Quick-Look Report, G. Mignot, N. Erkan, R. Kapulla, D.
Paladino, R. Zboray, M. Fehlmann, C. Wellauer, TM-42-10-17-0, august 2010.
NEA/CSNI/R(2012)5
78
[55] OECD/SETH-2 PANDA Test ST4_4 Quick-Look Report, G. Mignot, N. Erkan, R. Kapulla, D.
Paladino, R. Zboray, M. Fehlmann, C. Wellauer, TM-42-10-18-0, August 2010.
[56] OECD/NEA SETH-2 Horizontal Fluid Release Tests, Test Series Report, R. Zboray, D. Paladino,
G. Mignot, N. Erkan, R. Kapulla, M. Ritterath, M. Fehlmann, C. Wellauer, TM-42-10-05,
September 2010.
[57] OECD/NEA SETH-2 Containment spray test report, R. Zboray, N. Erkan, G. Mignot, R. Kapulla,
M. Fehlmann, C. Wellauer, M. Ritterath, D. Paladino, TM-42-10-33, December 2010.
[58]OECD/NEA SETH-2 PANDA Test 5_1 Quick-Look Report, G. Mignot, N. Erkan, R. Kapulla, D.
Paladino, R. Zboray, M. Fehlmann, C. Wellauer, TM-42-11-1-0, January 2011.
[59] OECD/NEA SETH-2 PANDA Test 5_1_1 Quick-Look Report, G. Mignot, N. Erkan, R. Kapulla,
D. Paladino, R. Zboray, M. Fehlmann, C. Wellauer, TM-42-11-06-0, March 2011.
[60] OECD/NEA SETH-2 PANDA Test 5_2 Quick-Look Report, G. Mignot, N. Erkan, R. Kapulla, D.
Paladino, R. Zboray, M. Fehlmann, C. Wellauer, TM-42-11-06-0, March 2011.
[61] OECD/NEA SETH-2 PANDA Test 5_3 Quick-Look Report, G. Mignot, N. Erkan, R. Kapulla, D.
Paladino, R. Zboray, M. Fehlmann, C. Wellauer, TM-42-11-06-0, April 2011.
[62] OECD/NEA SETH-2 PANDA Test 5_0 Quick-Look Report, G. Mignot, N. Erkan, R. Kapulla, D.
Paladino, R. Zboray, M. Fehlmann, C. Wellauer,
[63] OECD/NEA SETH-2 containment cooler series report.
[64] OECD/NEA SETH-2 Opening hatches series report,
[65] OECD/NEA SETH-2 Opening Heat source series report.
CEA Project deliverables
[66] J. Brinster, M.Cazanou, I. Tkatschenko, J.L. Widloecher, “MISTRA - Description of the facility”,
CEA/DEN/DANS/DM2S/SFME/LEEF/RT/08-012/A - 23/03/2009
[67] D. Abdo, J. Brinster, M.Cazanou, R.Tomassian, I. Tkatschenko, J.L. Widloecher “QLR for
MISTRA INITIALA_1 (20-02-2008) test”, CEA/DEN/DANS/DM2S/SFME/LEEF/RT/08-002/A -
05/06/2008
[68] D. Abdo, J. Brinster, M.Cazanou, R.Tomassian, I. Tkatschenko, J.L. Widloecher “QLRfor
MISTRA INITIALA_2 (21-02-2008) test”, CEA/DEN/DANS/DM2S/SFME/LEEF/RT/08-008/A -
05/06/2008
[69] D. Abdo, J. Brinster, M.Cazanou, R.Tomassian, I. Tkatschenko, J.L. Widloecher “QLR for
MISTRA INITIALA_3 (22-02-2008) test”, CEA/DEN/DANS/DM2S/SFME/LEEF/RT/08-002/A -
05/06/2008
[70] D. Abdo, J. Brinster, M.Cazanou, R.Tomassian, I. Tkatschenko, J.L. Widloecher “QLRfor
MISTRA INITIALA_3 (05-03-2008) test”, CEA/DEN/DANS/DM2S/SFME/LEEF/RT/08-011/A -
19/06/2008
[71] D. Abdo, J. Brinster, M.Cazanou, R.Tomassian, I. Tkatschenko, J.L. Widloecher”QLRfor
MISTRA INITIALA_3 (13-03-2008) test”, CEA/DEN/DANS/DM2S/SFME/LEEF/RT/08-012/A -
19/06/2008
[72] D. Abdo, J. Brinster, M.Cazanou, R.Tomassian, I. Tkatschenko, J.L. Widloecher “QLR for
MISTRA INITIALA_3 (31-03-2008) test”, CEA/DEN/DANS/DM2S/SFME/LEEF/RT/08-013/A -
19/06/2008
[73] D. Abdo, J. Brinster, M.Cazanou, R.Tomassian, I. Tkatschenko, J.L. Widloecher “QLR for
MISTRA INITIALA_3 (24-04-2008) test”, CEA/DEN/DANS/DM2S/SFME/LEEF/RT/08-014/A -
19/06/2008
[74] D. Abdo, J. Brinster, M.Cazanou, R.Tomassian, I. Tkatschenko, J.L. Widloecher “QLR for
MISTRA INITIALA_4 (26-02-2008) test”, CEA/DEN/DANS/DM2S/SFME/LEEF/RT/08-018/A -
04/07/2008
[75]”QLR for MISTRA INITIALA_5 (28-02-2008) test”, CEA/DEN/DANS/DM2S/SFME/ LEEF/RT/08-
019/A - 07/07/2008

NEA/CSNI/R(2012)5
79
[76] D. Abdo, J. Brinster, M.Cazanou, R.Tomassian, I. Tkatschenko, J.L. Widloecher ”QLR for
MISTRA LOWMA_1 (04-03-2008) test”, CEA/DEN/DANS/DM2S/SFME/LEEF/RT/08-004/A -
05/06/2008
[77] D. Abdo, J. Brinster, M.Cazanou, R.Tomassian, I. Tkatschenko, J.L. Widloecher ”QLR for
MISTRA LOWMA_2 (06-03-2008) test”, CEA/DEN/DANS/DM2S/SFME/LEEF/RT/08-005/A -
05/06/2008
[78] D. Abdo, J. Brinster, M.Cazanou, R.Tomassian, I. Tkatschenko, J.L. Widloecher ”QLR for
MISTRA LOWMA_3 (12-03-2008) test”, CEA/DEN/DANS/DM2S/SFME/LEEF/RT/08-006/A -
05/06/2008
[79] D. Abdo, J. Brinster, M.Cazanou, R.Tomassian, I. Tkatschenko, J.L. Widloecher ”QLR for
MISTRA LOWMA_3 (27-03-2008) test”, CEA/DEN/DANS/DM2S/SFME/LEEF/RT/08-015/A -
28/06/2008
[80] D. Abdo, J. Brinster, M.Cazanou, R.Tomassian, I. Tkatschenko, J.L. Widloecher ”QLR for
MISTRA LOWMA_3 (02-04-2008) test”, CEA/DEN/DANS/DM2S/SFME/LEEF/RT/08-016/A -
01/07/2008
[81] D. Abdo, J. Brinster, M.Cazanou, R.Tomassian, I. Tkatschenko, J.L. Widloecher ”QLR for
MISTRA LOWMA_3 (22-04-2008) test”, CEA/DEN/DANS/DM2S/SFME/LEEF/RT/08-020/A -
03/07/2008
[82] D. Abdo, J. Brinster, M.Cazanou, R.Tomassian, I. Tkatschenko, J.L. Widloecher ” QLR for
MISTRA LOWMA_3 (23-04-2008) test”, CEA/DEN/DANS/DM2S/SFME/LEEF/RT/08-021/A -
03/07/2008
[83] D. Abdo, J. Brinster, M.Cazanou, R.Tomassian, I. Tkatschenko, J.L. Widloecher ”QLR for
MISTRA LOWMA_3 (20-05-2008) test”, CEA/DEN/DANS/DM2S/SFME/LEEF/RT/08-017/A -
02/07/2008
[84] D. Abdo, J. Brinster, M.Cazanou, R.Tomassian, I. Tkatschenko, J.L. Widloecher; ”QLR or
MISTRA LOWMA_4 (21-03-2008) test”, CEA/DEN/DANS/DM2S/SFME/LEEF/RT/08-007/A -
05/06/2008
[85] J. Brinster, D. Abdo, E. Studer, I. Tkatschenko, J.L. Widloecher, “Synthesis Report for INITIALA
& LOWMA tests”, CEA/DEN/DANS/DM2S/SFME/LEEF/RT/09-007/A - 6/05/2009
[86] D. Abdo, J. Brinster, M.Cazanou, R.Tomassian, I. Tkatschenko, J.L. Widloecher ”QLR for
MISTRA PRE_INITIALS_5 (25/03/2009) - INITIALS_1 (23/04/2009-29/04/2009) tests”
CEA/DEN/DANS/DM2S/SFME/LEEF/RT/09-008/A - 07/09/2009
[87] D. Abdo, J. Brinster, M.Cazanou, R.Tomassian, I. Tkatschenko, J.L. Widloecher ”Report for
MISTRA LOWMS (15/05/2009-30/10/2009) tests”, EA/DEN/DANS/DM2S/SFME/ LEEF/RT/09-
017/A - 06/11/2009
[88] D. Abdo, J. Brinster, M.Cazanou, R.Tomassian, I. Tkatschenko, J.L. Widloecher “Report for
MISTRA SPRAY (20/10/2009-06/11/2009) tests”, CEA/DEN/DANS/DM2S/SFME/
LEEF/RT/10-005/A - 08/03/2010
[89] D. Abdo, J. Brinster, M.Cazanou, R.Tomassian, I. Tkatschenko, J.L. Widloecher “Report for
MISTRA IMPIGS (03/12/2009-09/02/2010-18/02/2010) tests”, CEA/DEN/DANS/DM2S/SFME/
LEEF/RT/10-007/A - 30/03/2010
[90] D. Abdo, J. Brinster, M.Cazanou, R.Tomassian, I. Tkatschenko, J.L. Widloecher “Report for
MISTRA NATHCO (27/10/2009-12/02/2010) tests”, CEA/DEN/DANS/DM2S/SFME/
LEEF/RT/10-006/A - 30/03/2010
[91] E. Studer, J. Brinster, I. Tkatschenko (CEA) - G. Mignot, D. Paladino, M. Andreani (PSI)
”Common test between PANDA and MISTRA facilities”, CEA/DEN/DANS/DM2S/SFME/
LTMF/RT/10-009A - 02/06/2010
[92] J. Brinster “Synthesis Report for MISTRA water steam tests: INITIALS – LOWMS/NATHCO
/SPRAY/IMPIGS”, CEA/DEN/DANS/DM2S/SFME/LEEF/RT/10-017/A - 15/12/2010
NEA/CSNI/R(2012)5
80
[93] “OECD SETH-2 project PANDA and MISTRA experiments: investigations of key issues for the
simulation of thermal-hydraulic conditions in water reactor containment - final report”, CEA
contribution CEA/DEN/DANS/DM2S/SFME/LEEF/RT/10-023/A - Draft version for May 2011
Common Test References
SETH-2 Publications Status
Common MISTRA-PANDA test:
[94] E. Studer, J. Brinster, I. Tkatschenko, G. Mignot, D. Paladino and M. Andreani, “Interaction of a
light gas stratified layer with an air jet coming from below: large scale experiments and scaling
issues”, CFD4NRS-3: Experimental Validation and Application of CFD and CMFD codes to
Nuclear Reactor Safety Issues, Washington D.C., USA, 14-16 September 2010.
[95] M. Sharabi, and M. Andreani, “Analyses of light gas stratification erosion and break-up under the
effect of a vertical jet: CFD simulations for a common test in the PANDA and MISTRA facilities”
International Topical meeting on Nuclear Reactor Thermal-Hydraulics, (NURETH-14), September
25-29, 2010, Toronto, Ontario, Canada (submitted abs.).
Other publications
[96] D. Paladino, M. Huggenberger, M. Andreani, S. Gupta, S. Guentay, J. Dreier, H. Prasser, “LWR
Containment safety research in PANDA”, International Congress on Advances in Power Plants
(ICAPP 08)-Anaheim, CA USA, June 8-12, 2008.
[97] D. Paladino, “LWR Containment Atmosphere De-Stratification by Steam or Water Mass Sources”,
In: 4th European Review Meeting on Severe Accident Research (ERMSAR-2010), ENEA
Bologna-Italy, 11-12 May 2010.
[98] M. Ritterath, H.–M. Prasser, D. Paladino, G. Mignot, “New sensors for the PANDA facilities for
concentration measurements in containment flow”, In: The 13th International Topical Meeting on
Nuclear Reactor Thermal Hydraulics (NURETH-13), Kanazawa City, Ishikawa Prefecture, Japan,
September 27-October 2, 2009 (selected also for special NED issue).
[99] R. Kapulla, D. Paladino, G. Mignot, R. Zboray and S. Gupta, “Break-up of Gas Stratified in LWR
Containment Induced by Negatively Buoyant Jets and Plumes”, In: Proceeding of the International
Conference in Nuclear Engineering (ICONE17-75708), Brussels, Belgium July 12-16, 2009.
[100] G. Mignot, D. Paladino, R. Kapulla, R. Zboray, “Overview of vertical fluid release series” In: The
13th International Topical Meeting on Nuclear Reactor Thermal Hydraulics (NURETH-13),
Kanazawa City, Ishikawa Prefecture, Japan, September 27-October 2, 2009.
[101] Andreani, M., Kapulla, R., Zboray, R. (2010) “Simulation of Break-up of Gas Stratification by a
Vertical Jet using the GOTHIC Code”, The 8th International Topical Meeting on Nuclear
Thermal-Hydraulics, Operation and Safety (NUTHOS-8) October 10-14, Shanghai, China, Paper
N8P0340, CD-ROM.
[102] R. Zboray, D. Paladino, G. Mignot, R. Kapulla, N. Erkan and M. Andreani, “Mixing of Density
Stratified Containment Atmosphere by Horizontal Jet Release”, In: International Conference
Nuclear Energy for New Europe 2009, Bled, Slovenia, September 14-17, 2009.
[103] R. Zboray, G. Mignot, R. Kapulla, N. Erkan, D. Paladino, “Erosion and break-up of light-gas
layers by horizontal injections in containment relevant atmosphere”, International Conference on
Nuclear Engineering ICONE19, May 16-19, 2011 Makuhari, Japan (submitted abs.).
[104] N. Erkan, G. Mignot, R. Zboray, D. Paladino, “Spray Tests in PANDA to Study Accident
Mitigation in PWR Containment”, In: International Conference Nuclear Energy for New Europe
2009, Bled, Slovenia, September 14-17, 2009.
[105] M. Andreani and N. Erkan (2010) “Analysis of Spray Tests in a Multi-Compartment Geometry
Using the GOTHIC Code”, Proceedings of the 18th International Conference on Nuclear
Engineering (ICONE18), May 17-21, 2010, Xi'an, China, Paper 30162, CD-ROM.
NEA/CSNI/R(2012)5
81
[106] N. Erkan, G. Mignot, R. Kapulla, D. Paladino, R. Zboray, “Effect of a containment spray
application on the gas distribution with/without mass and heat transfer in two interconnected
PANDA vessels”, International Conference on Nuclear Engineering ICONE19, May 16-19, 2011
Makuhari, Japan (submitted abs.)
[107] R. Kapulla, G. Mignot, D. Paladino, N. Erkan, R. Zboray, “Thermal-Hydraulic Phenomena Caused
by the Interaction of Steam and Steam-Helium Mixture Wall Jets with a Containment Cooler”,
International Congress on Advances in Nuclear Power Plants (ICAPP 2011), May 2-5, 2011- Nice,
France.
[108] G. Mignot, R. Kapulla, N. Erkan, R. Zboray and D. Paladino, “Containment cooler performance in
the presence of light non condensable gas with cooler location as a primary parameter”,
International Topical meeting on Nuclear Reactor Thermal-Hydraulics, (NURETH-14), September
25-29, 2010, Toronto, Ontario, Canada (submitted abs.).
[109] M. Andreani and G. Mignot, “Analyses of large scale tests addressing the performance of a
containment cooler and its effect on gas distribution”, International Topical meeting on Nuclear
Reactor Thermal-Hydraulics, (NURETH-14), September 25-29, 2010, Toronto, Ontario, Canada
(submitted abs.).
[110] D. Paladino, G. Mignot, N. Erkan, R. Zboray, R. Kapulla, M. Andreani, ” Three-Gas Mixture
Distribution in two Large Compartments after sudden opening of interconnecting line”,
International Topical meeting on Nuclear Reactor Thermal-Hydraulics, (NURETH-14), September
25-29, 2010, Toronto, Ontario, Canada (submitted abs.).
[111] E. Deri, B. Cariteau, D. Abdo, “Air fountains in the erosion of gaseous stratifications”,
International Journal of Heat and Fluid Flow, Volume 31, Issue 5, October 2010, Pages 935-941
(see ref.13)
[112] J. Brinster, E. Studer, I. Tkatschenko, D. Abdo, “Interaction of a helium/air stratified layer with an
air jet coming from below in the MISTRA facility: large scale experiments and scaling analysis”,
proceedings of the 8th International Topical Meeting on Nuclear Thermal-Hydraulics, Operation
and Safety (NUTHOS-8) Shanghai, China, October 10-14, 2010 (see ref.15)

NEA/CSNI/R(2012)5
82

NEA/CSNI/R(2012)5
83
Appendix 1.
SUMMARY AND CONCLUSIONS OF SETH2 PROJECT SEMINAR
SETH2 PROJECT SEMINAR 2011
OECD Nuclear Energy Agency
Paris, France – 12-13 September 2011
Ivo Kljenak Jozef Stefan Institute
Ljubljana, Slovenia
Michele Andreani Paul Scherrer Institut
Villigen, Switzerland
Etienne Studer Commissariat à l‟Energie Atomique et
aux Energies Alternatives
Saclay, France
Ahmed Bentaib Institut de Radioprotection et de Sûreté Nucléaire
Fontenay-aux-Roses, France
The SETH2 Seminar, concluding the OECD/SETH2 Project run at PSI and CEA from June 2007 to
December 2010, took place at the OECD NEA Headquarters in Issy-les-Moulineaux (France), on
September 12 and 13, 2011. The seminar included 22 presentations distributed in four sessions: general
overview of the project, use of results for code calculation and validation, analyses of the common test in
the PANDA and MISTRA Facilities and applications to reactor. The seminar aroused considerable interest,
as more than 50 participants from 15 countries attended.
OVERVIEW OF THE SEMINAR CONTENT
Session 1: Opening and Overview of SETH2 Project
An introductory lecture was given summarising the previous decades of research supporting the resolution
of containment safety issues. Whereas the previous SETH project addressed stratification build-up in the
containment, the SETH2 project addressed stratification breakup and erosion, with a variety of mass and
heat sources or sinks. The experimental purpose of the SETH2 project was achieved: conditions of
stratification break-up have been extensively studied and a comprehensive experimental data set available
for code validation was established. In particular, test reproducibility was successfully addressed in
SETH2. This is especially important, so that experimental results may be trusted when codes are being
validated. Attempts to derive dimensionless numbers for scaling purposes to reactor cases were also
discussed - further work is necessary on that topic.
Session 2: Experimental Results, Code Calculations and Validations
The SETH2 experimental results have been used for the defined purpose of the project (experimental data
base for code validation). Most tests have been simulated, more or less successfully. In the simulations of
tests on the influence of injection flow rate of plumes or jets on the mixing rate, the effect of the flow rate
was correctly represented by the codes. Simulations of these tests, as well as of spray, cooler, hatch
opening and MISTRA heat source tests need further work. Best practice guidelines for CFD codes were

NEA/CSNI/R(2012)5
84
used only sporadically, which is something that should be remedied. Users reported that unstructured
meshes are unusable for simulating stratification. Also, no direct coupling of Lumped-Parameter (LP) and
Computational Fluid Dynamics (CFD) codes was implemented; however, a valuable example of using
CFD calculation results to improve LP simulations was presented. Finally, it should be noticed that tests
from the previous SETH project are still being used for code improvement.
Session 3: Analyses of the Common Test in the PANDA and MISTRA Facilities
Simulations of the PANDA-MISTRA common test were presented by six organizations. The test proved to
be a useful vehicle for resolving a fundamental issue in CFD codes, namely the numerical modeling of
diffusion phenomena. Although the test is a “pure” fluid-dynamics experiment, it still provided important
elements for code validation. The test aroused considerable interest from partners outside the SETH2
project. Some user effects were noticed in the simulations. Due to the importance of the test, further work
is expected to be carried on.
Session 4: Applications to Reactors
Possible applications of experimental results to reactors were presented. To extrapolate the data to actual
reactors, validated codes are necessary. The experiments confirmed the beneficial effect of mass and
energy sources in mixing the (containment) atmosphere. They also alerted to possible undesired effects
taking place during the activation of safety systems during a postulated severe accident. The efficiency of
different mitigation scenarios was considered, from a “global” and “helium/air mixing” points of view.
Experiments also showed the influence of sprays on hydrogen distribution in a multi-compartment
containment geometry. Finally, the PANDA hatch opening test showed that opening of a rupture disk can
lead to gas stratification in case of significant pressure difference.
COMMENTS ON SOME SPECIFIC ISSUES
Adequacy of Experimental Conditions
Some participants of the seminar formulated the objection, that conditions in some experiments were not
adequate, as similar conditions could not be expected during an actual accident. For instance, a stable,
homogeneous layer of hydrogen-rich mixture in the upper part of the containment was not likely to occur.
However, representatives of CEA and PSI, who were involved in the execution of experiments, pointed out
that the primary purpose of the SETH2 project was not to exactly simulate specific situations likely to
occur during an actual accident. In other words, experimental results obtained on MISTRA and PANDA
facilities are not meant to be directly extrapolated to actual containments. The main purpose of the SETH2
project was to perform experiments that are suitable for validation of computer codes that are used to
simulate accidents in actual nuclear power plants. In this respect, the purpose of the project was achieved.
Lumped-Parameter vs Computational Fluid Dynamics Codes
In the past years, whenever simulations of non-homogeneous atmosphere in actual containments or
containment experimental facilities were considered, discussions arose about the respective advantages and
drawbacks of Lumped-Parameter and Computational Fluid Dynamics codes. Contrary to animated
discussions that occurred on similar occasions, the atmosphere at the seminar was much more conciliatory.
It was acknowledged that:
LP codes require dedicated mesh adjustments to simulate high-momentum jets, which may cause
breaking up of atmosphere stratification. Such conditions are normally addressed by the use of CFD
codes.

NEA/CSNI/R(2012)5
85
Although CFD codes are based on first principles, calculations performed with them still carry
uncertainties and also require users to have adequate knowledge of simulated phenomena. As, in
addition, use of CFD codes necessitates lengthy model developments and calculations, LP codes are
still expected to be used for overall predictions of the behavior of a non-homogeneous containment
atmosphere for the time being.
Remaining Topics of Research
The following topics and issues, for which further research is necessary, were identified at the seminar:
Additional investigations in different experimental configurations (e.g. jets with more diffuse sources)
Measurements of velocity fields during experiments, which should be used for validation of CFD
codes
Improvement of numerical and physical models, especially for representing diffusion processes and
turbulence of buoyant flows
Combination of influences of different engineered safety features on non-homogeneous containment
atmosphere
Effects of compartment geometry in a containment
Scaling up of experimental results from experimental facilities to actual containments