OECD THEMATIC REVIEW OF TERTIARY EDUCATION New Zealand ...
143
OECD THEMATIC REVIEW OF TERTIARY EDUCATION New Zealand Country Background Report This report was prepared by the New Zealand Ministry of Education as an input to the OECD Thematic Review of Tertiary Education. The document was prepared in response to guidelines the OECD provided to all participating countries. The guidelines encouraged the authors to canvass a breath of views and priorities on tertiary education issues. The opinions expressed are not necessarily those of the New Zealand government, the Ministry of Education, the OECD, or its member countries. The New Zealand Ministry of Education January 2006
Transcript of OECD THEMATIC REVIEW OF TERTIARY EDUCATION New Zealand ...
OECD THEMATIC REVIEW OF TERTIARY EDUCATION
New Zealand Country Background Report
This report was prepared by the New Zealand Ministry of Education as an input to the OECD Thematic Review of Tertiary Education. The document was prepared in response to guidelines the OECD provided to all participating countries. The guidelines encouraged the authors to canvass a breath of views and priorities on tertiary education issues. The opinions expressed are not necessarily those of the New Zealand government, the Ministry of Education, the OECD, or its member countries.
The New Zealand Ministry of Education
January 2006

2
Preface This background report for the OECD review of the New Zealand tertiary education system was written by Ministry of Education staff: Roger Smyth, Jason McClelland, Paul Lister, Kyla Steenhart, and independent contractors: Allan Sargison (Tertiary Advice Ltd.), Keith Westwater (Westwater Hobbs Consulting), Nicholas Green and Nyk Huntingdon. The report was edited by Christine Williams (Wordsmiths). The writing of the report was actively supported by the Ministry of Education Advisory Committee comprising key policy staff and the National Advisory Committee comprising representatives of various stakeholders in the New Zealand tertiary education system. These committees were central in providing information and perspectives, and in commenting upon earlier versions of the report. The Ministry of Education Advisory Committee consisted of: Jane von Dadelszen, Caroline Holmes, Peter Mellor, Nick Montague, Frances Kelly, Neil Scotts, Elizabeth Eppel, Paula Rawiri, Paul Lister and Rob Maclean. The National Advisory Committee consisted of: Susan Kosmala, Nilanka Fonseka (Careers Services), Lesley Haines (Department of Labour), Tony Davies, Dillon Burke, Jo Doyle (New Zealand Qualifications Authority), Dr Colin Webb (Tertiary Education Commission), Claire Douglas, Paul O’Connell (The Treasury), Lloyd Woods (Association of Staff in Tertiary Education), Matt Davies (Aotearoa Tertiary Students’ Association), Andrew Kirton (New Zealand University Students’ Association), Rebecca Matthews, Erin Polaczuk (Association of University Staff of New Zealand), Jim Doyle (The Institutes of Technology and Polytechnics of New Zealand) and Lindsay Taiaroa (New Zealand Vice-Chancellors’ Committee). Elizabeth Eppel of the Ministry of Education chaired the meetings. Other stakeholders were also canvassed for comment as required. Namely: Dave Geurin (Independent Tertiary Institutions), Jan Esquilant (Ministry of Research, Science and Technology), Kellie Coombes (Ministry of Social Development) and Turoa Royal (Te Tau Ihu nga Wānanga - association of Wānanga). The Manager of Tertiary Sector Performance Analysis and Reporting, Roger Smyth, was the National Co-ordinator for the review. Wellington, January 2006 The Ministry of Education
3
Content List of figures and tables............................................................................................................4 Glossary of terms .......................................................................................................................6 List of acronyms ......................................................................................................................13 Executive summary..................................................................................................................15 Chapter 1: The national context of tertiary education .......................................................23 Chapter 2: Overall description of the tertiary education system .......................................27 Chapter 3: The tertiary education system and the labour market ......................................39 Chapter 4: The regional role of tertiary education.............................................................48 Chapter 5: The role of tertiary education in research and innovation................................56 Chapter 6: Achieving equity in and through tertiary education.........................................68 Chapter 7a: Resourcing the tertiary education system ........................................................81 Chapter 7b: The tertiary education workforce in New Zealand ........................................101 Chapter 8: Planning and regulating the system ...............................................................107 Chapter 9: Assuring and improving the quality of tertiary education .............................119 Chapter 10: Internationalisation of tertiary education .......................................................127 Chapter 11: Conclusion .....................................................................................................135 References…………………………………………………………………………………...138 Annex 1: The objectives of the Tertiary Education Strategy 2002/07...........................144 Annex 2: Statement of Tertiary Education Priorities: 2005-2007 .................................147 Annex 3: Chronology of key reforms of the New Zealand tertiary education system ..181 Annex 4: The state of play in tertiary education in New Zealand in 2005 - some key
indicators........................................................................................................184 Annex 5: Statistical tables .............................................................................................212 Annex 6: Education Act 1989........................................................................................245

4
List of figures and tables Tables: Table 1.1: Projected Age Distribution of Ethnic Populations 2001(base)–2021 ................25 Table 1.2: Ethnic Share of New Zealand Population 2001(base)–2021 .............................26 Table 3.1: Change in total qualification completions 1998-2003 .......................................42 Table 5.1: Percentage of total PBRF funding allocated to selected TEOs 2005.................60 Table 6.1: Domestic students enrolled by level of study ....................................................69 Table 9.1: Attrition and completion rates for students starting certificate and diploma and
bachelors-level study: 1998-2003 ....................................................................125 Figures: Figure 2.1: Relationships between key actors in tertiary education system .........................32 Figure 2.2: The design of the New Zealand tertiary education system ................................35 Figure 2.3: The levels of the New Zealand education system..............................................36 Figure 3.1: Unemployment rate of the population aged 15 years and over by highest
qualification 1991-2004 .....................................................................................40 Figure 3.2: Median weekly income for population aged 15 years and over from all sources
by highest qualification 1997-2004....................................................................40 Figure 3.3: Income mix in 2000 of former students of universities and ITPs who last studied
in 1999, 1998 and 1997......................................................................................41 Figure 4.1: Population growth 2000 - 2004: ITP regions.....................................................51 Figure 4.2: Distribution of enrolments by field of study: regional ITPs ..............................52 Figure 5.1: PBRF 2003 quality evaluation results – number of FTE staff in each ‘quality
category’ and average ‘quality score’ for each ‘subject panel’..........................60 Figure 5.2: Sources of university research funding ..............................................................62 Figure 5.3: Trends in university research income by category of income 2000–2003.........62 Figure 5.4: University research income in real terms: the government and non-government
proportions 2000–2003 ......................................................................................63 Figure 5.5: PhD enrolments at New Zealand universities 1998-2004..................................66 Figure 5.6: PhD completions at New Zealand universities 1998-2004 ................................67 Figure 6.1: Ratio of average domestic student fee at TEIs to average weekly income 1997-
2003....................................................................................................................76 Figure 7a.1: The relationship between income and qualifications by age, 2005....................81 Figure 7a.2: Average domestic tuition fees per EFTS in TEIs and in universities 1997-2004
............................................................................................................................86 Figure 7a.3: Average domestic tuition fees per EFTS in TEIs and in universities expressed as
a ratio of the average weekly income 1997-2004 ..............................................86 Figure 7a.4: Student allowances recipients by gender 1999-2004 .........................................89 Figure 7a.5: Student support recipients by type of assistance received 2000-2004 ...............90 Figure 7a.6: Government spending on tertiary education 1999/2000-2004/05......................93 Figure 7a.7 Government tertiary education expenditure as a percentage of GDP 1999/2000-
2004/05...............................................................................................................93 Figure 7a.8: Percentage of government tertiary education expenditure by component
1999/2000-2004/05 ............................................................................................94 Figure 7a.9: Government expenditure on tertiary education by component 1999/2000
2004/05...............................................................................................................95 Figure 7a.10: Government-funded EFTS by type of TEI 1991-2004 ......................................95 Figure 7a.11: Total Student Component expenditure by type of TEI 1991-2004....................96 Figure 7a.12: Average Student Component per EFTS by type of TEI 1991-2004 ..................97 Figure 7a.13: Combined revenue per EFTS in TEIs 2000-2004..............................................98 Figure 7a.14: Operating surplus per EFTS in TEIs 1997–2004...............................................99
5
Figure 7a.15: Performance of TEIs against key financial benchmarks 2000 and 2004 ...........99 Figure 7b.1: FTE staff employed in TEIs 1997-2004...........................................................103 Figure 7b.2: PBRF-eligible FTE staff in universities by age 2003 ......................................105 Figure 7b.3: Percentage of PBRF-eligible FTE staff in universities by position and gender
2003..................................................................................................................106 Figure 9.1: Certificate and diploma enrolments and completions: 1994-2003...................124 Figure 9.2: Bachelors degree enrolments and completions: 1994-2003.............................124 Figure 9.3: Graduation rates for selected OECD countries 2002 .......................................126 Figure 10.1: TEI total international student fee income in nominal terms and as a percentage
of total income 1997-2003 ..............................................................................129
6
Glossary of terms Academic Year The academic year is defined in the Education Act 1989 as a calendar year, 1 January to 31 December. Adult and Community Education (ACE) Adult and Community Education (ACE) enables adults to engage in a range of educational activities in a context that is relevant to the learner. Most ACE provision does not lead to a qualification. There are few barriers to participation. Provision is generally focused on personal development and skill enhancement, while there are also social, civic and community benefits. A range of providers deliver ACE, including schools, tertiary education institutions (TEIs), other tertiary education providers (OTEPs), such as Literacy Aotearoa, and community groups. Centre of Research Excellence (CoRE) The seven Centres of Research Excellence (CoREs) support leading-edge, innovative research of international standard that fosters excellence and contributes both to New Zealand’s national goals and to knowledge transfer. The CoREs are primarily inter-institutional research networks, with the researchers working together on a commonly agreed work programme. Each CoRE is hosted by a tertiary education institution. The host institution’s responsibilities include the overall management and co-ordination of the research plan, support for knowledge transfer, and network activities. College of Education (CoE) A college of education (CoE) is a public tertiary education institution that is characterised by teaching and research required for the pre-school, compulsory and post-compulsory sectors of education, and for associated social and educational service roles. These colleges also offer other programmes in addition to teacher education, for instance business and social work qualifications. Following a series of mergers between colleges of education and universities, the number of colleges has reduced, from six in 1990 to two in 2005. Consumer Price Index (CPI) A measure of the average change of prices of goods and services bought by households. Course A course is a component of a qualification and may be known as a paper, module or unit. A course is usually related to an enrolment event. A course has aims and curriculum content and includes assessment that measures the extent to which the learning outcomes sought from that course have been met. A course or collection of courses forms a programme of study which, if completed successfully, results in the award of a qualification. Decile A school’s decile provides an index of the socio-economic communities from which a school draws its students. Decile 1 schools are the 10 percent of schools with the highest proportion of students from low socio-economic communities, whereas decile 10 schools are the 10 percent of schools with the lowest proportion of these students. A school’s decile does not indicate the overall socio-economic mix of the school. Distance education Distance education occurs when students and the instructor are separated by geographic distance or when the majority of the educational delivery is not connected in time to the learning. The student’s learning is usually facilitated using correspondence study, audio conferencing, video conferencing, email or the internet.
7
EFTS (Equivalent Full-time Student) EFTS is a unit for counting tertiary student numbers. The basis of the EFTS system is that a student taking a normal year’s full-time study counts as 1.0 EFTS unit or the equivalent of 120 credits on the National Qualifications Framework. The courses taken by part-time students are proportions of 1 EFTS unit, eg 0.75 EFTS. EFTS-based tuition subsidies The Student Component of the Integrated Funding Framework uses EFTS as a measure in the allocation of funding. Government funding of the Student Component is a subsidy; it is a contribution towards the cost of tertiary education and training that meets part, but not all, of the cost of provision of a course. These subsidies are paid to approved tertiary education providers on behalf of domestic students enrolled in quality-assured courses leading to quality-assured qualifications. e-Learning e-Learning is education, both formal and informal, which uses electronic delivery methods such as internet-based learning delivery packages, CD-ROM, video conferencing, websites or email to manage the relationship between teacher and learners. Fiscal year The government’s accounting year is based on the fiscal year, which is a 12-month period starting on 1 July and finishing on 30 June. Formal student For the purposes of statistical reporting, a tertiary student is considered to be a formal student when enrolled at a tertiary education provider in a formal programme of study of more than one week’s full-time duration (ie an EFTS value greater than 0.03). The programme must lead to a qualification approved by an authorised certifying body or issued by an institution. Full-time Any programme of study of 32 weeks or more and at least 0.8 EFTS is designated full-time/full-year. A programme of study that has a lower EFTS value on a pro rata basis is called part-time. Any programme of study of at least 12 weeks but less than 32 weeks and at least 0.3 EFTS or the equivalent on a pro rata basis (eg 24 weeks and 0.6 EFTS) is designated full-time/part-year. The definition of full-time given here is also used for the purposes of eligibility for student loans and allowances and the definition used in applying the student loan full interest write-off. Goods and Services Tax (GST) Goods and services tax (GST) is a tax on the supply of most goods and services in New Zealand. It is generally charged at a rate of 12.5%. Government Training Establishment (GTE) A government training establishment (GTE) is a government department or a Crown entity, other than a TEI, approved by the Minister of Education and registered by the New Zealand Qualifications Authority (NZQA) as a tertiary education provider. GTEs offer training subject to the approval and accreditation requirements of the Education Act 1989. Growth and Innovation Framework (GIF) GIF is a medium-term policy framework for improving New Zealand’s productivity performance, achieving stronger economic growth and ultimately increasing per capita income. Its key elements are: strengthening New Zealand’s economic and social foundations, improving the innovation framework, developing, attracting and retaining people with exceptional skills and talent, increasing international connections, and focusing on sectors where growth and innovation policies are likely to have maximum impact.
8
Industry Training Organisation (ITO) Industry training organisations (ITOs) facilitate workplace learning for trainees in employment by setting national skill standards for their industry. In addition to providing leadership to industry on skill and training needs, ITOs develop appropriate training arrangements for their industry, organise appropriate training, monitor training quality and arrange for the assessment of trainees. ITOs also provide information and advice to trainees and their employers. Institute of Technology The term ‘institute of technology’ is a synonym for ‘polytechnic’ (qv). Integrated Funding Framework The Integrated Funding Framework is a tertiary funding framework which will, over time, support the alignment of the tertiary system with the Tertiary Education Strategy 2002/07 (TES). The framework, operating in the context of charters, profiles and the assessment of strategic relevance, will ensure that research effort and funding for student enrolments are concentrated in areas of high performance and high strategic relevance. ISCED Level ISCED refers to the International Standard Classification for Education, developed by UNESCO. It is used by countries and international agencies as a means of compiling internationally comparable statistics on education. It identifies the level of that educational provision. For tertiary education, the applicable classifications are:
post-secondary/non-tertiary (ISCED 4) – although these programmes are considered tertiary in the New Zealand tertiary education policy and funding framework, they straddle the boundary between upper secondary (ISCED 3) and tertiary education. In many other countries, ISCED level 4 qualifications are classified as not being part of the tertiary education sector. Examples of such programmes include pre-degree foundation courses and national certificates which lead to higher qualifications
first stage of tertiary education (ISCED 5) – where programmes are largely theoretically-based and are intended to provide qualifications for entry into ISCED 6 or a profession with high skills requirements. Level 5A represents more academically or theoretically-based study, while level 5B represents more vocationally-oriented study. ISCED level 5A programmes include bachelors degrees, honours degrees, masters degrees, and postgraduate diplomas or certificates, while two-year, sub-degree diplomas are normally classified as ISCED level 5B, and
second stage of tertiary education (ISCED 6) – programmes leading to an advanced research qualification. Only PhD qualifications fit into this category.
National Certificate of Educational Achievement (NCEA) The National Certificate of Educational Achievement (NCEA) is New Zealand’s main national qualification for senior school students. It forms part of the National Qualifications Framework. NCEA level 1 replaced School Certificate in 2002, level 2 replaced Sixth Form Certificate in 2003 and level 3 of NCEA replaced University Bursaries in 2004. The NCEA sets national standards that show the separate skills and knowledge the student has to achieve for each subject. Students can gain NCEA credits for all learning in regular school curriculum subjects. NCEA provides the bridge between school, the workplace and lifelong learning. National Qualifications Framework (NQF) The National Qualifications Framework (NQF) is a framework for registering the unit standards-based system of national qualifications developed by NZQA. Unit standards are categorised by field of study, which is further broken down into sub-fields and domains. Standards and national qualifications are also categorised by level of student achievement.

9
Certificates can be awarded up to level 4. Diploma qualifications can be awarded at levels 5, 6 or 7 on the Framework, level 7 being equivalent to the level achieved at the end of a first degree. Levels 8, 9 and 10 are postgraduate study. Nominal Terms Sums quoted in nominal terms use the dollar value with no adjustment for the effects of inflation over time. NZSCED NZSCED refers to the New Zealand Standard Classification for Education, a subject-based classification system for courses in tertiary education. The classification system consists of three levels – broad, narrow and detailed fields. It is used to improve the quality and consistency of statistics collected by the Ministry of Education and other education agencies in relation to tertiary study. Other Tertiary Education Provider (OTEP) Other tertiary education providers (OTEPs) are organisations that deliver programmes of tertiary education or in support of tertiary education of some national significance, and that are recognised by the Minister of Education under section 321 of the Education Act 1989, eg the New Zealand Schools of Dance and Drama. Part-time Part-time is an expression which can apply to either the qualification or the student. A qualification offered part-time has the same EFTS value, but is studied over a longer period of time than its full-time equivalent. A student may elect to study a full-time qualification on a part-time basis, by enrolling in fewer courses than the normal student full-time workload. For the purposes of the student loan full interest write-off, part-time means any programme of study that is not full-time (eg a programme of study of 32 weeks that is less than 0.8 EFTS). Some qualifications are specifically designed for part-time study, eg the Massey University MBA. Pasifika Pasifika peoples comprise a diverse range of peoples from the South Pacific region or people within New Zealand who have strong family and cultural connections to Pacific Island countries. Pasifika peoples include those who have been born in New Zealand or overseas. It is a collective term used to refer to people of Samoan, Cook Island, Tongan, Niuean, Tokelauan, Fijian or other Pasifika ethnic groups. Performance-based Research Fund (PBRF) The Performance-Based Research Fund (PBRF), which is part of the Integrated Funding Framework, is a means of allocating research funding to tertiary education providers. It seeks to reward excellence in research in tertiary education organisations and to improve the average quality of research in the tertiary sector. The PBRF allocates funding on the basis of an evaluation of the quality of research, a provider’s external research income and its postgraduate research degree completions. Performance Measure The Student Component Performance Measure is a mechanism that is in development and that is to be used to allocate a portion of Student Component funding. The Performance Measure funding will be allocated on the basis of providers’ performance against a number of performance indicators.
10
Polytechnic A polytechnic is a public tertiary institution that is characterised by a wide diversity of vocational and professional programmes. Polytechnics are now referred to as institutes of technology and polytechnics (ITPs). Private Training Establishment (PTE) A private training establishment (PTE) is defined in the Education Act 1989 as ‘an establishment, other than [a public tertiary education] institution, that provides post-school education or vocational training’. PTEs include not only privately-owned providers but also those operated by iwi, trusts and other organisations. Programme A programme of study is a collection of courses, classes or work in which a student enrols and which contributes to meeting the requirements for the award of one or more qualifications. Qualification A tertiary education qualification is suite of courses that togther, provide a coherent study path leading to a prescribed set of learning options. Completion of that suite of courses and other prescribed conditions leads to the award of a qualification. Tertiary education qualifications are quality assured and registered on the New Zealand Register of Quality Assured Qualifications. Real terms Sums quoted in real terms have been adjusted for the effects of inflation over time. Register of Quality Assured Qualifications The New Zealand Register of Quality Assured Qualifications is a comprehensive list of all quality assured qualifications in New Zealand. The development of the Register has led to a standardisation of qualifications and a common basis for comparison of qualification ‘size’. As part of the registration process, providers are required to state the learning outcomes expected of those who successfully complete each qualification. One consequence of the Register is to help students and the public to understand qualifications. This will enhance learners’ ability to transfer credit by the establishment of a common system of credit. The public can access information held in the Register through the website KiwiQuals, www.kiwiquals.govt.nz. Skill Enhancement Skill Enhancement is vocational training for young Māori and Pasifika peoples. It is designed to meet the skills required for an identified industry, leading to qualifications recognised by the industry and incorporating workplace learning in the industry. Programmes leading to qualifications at level 3 or above on the National Qualifications Framework (NQF), or the equivalent, are expected to meet the needs of both learners and the labour market and provide support for the learners. Skill Enhancement is delivered in two strands, Rangatahi Māia for young Māori, and Tupulaga Le Lumana’i for young Pasifika peoples. Strategic Development Component The Strategic Development Component is part of the Integrated Funding Framework designed to support the strategic development of the system. It is a combination of a number of funds including institutional base grants, grants to support participation and achievement by Māori and Pasifika students, grants to support students with disabilities and new e-learning and polytechnic regional economic development funds.
11
Student allowances Student allowances are grants designed to provide assistance to those students who are unable to support themselves or do not have access to alternative sources of support while undertaking full-time study. Student Component The Student Component is the largest single element of the Integrated Funding Framework and is used to subsidise the costs of tuition carried out in public tertiary education institutions. The component has replaced the EFTS (equivalent full-time student) funding system. Tertiary education Tertiary education in New Zealand means all post-secondary education; includes learning undertaken in the workplace as well as with providers. Tertiary Education Advisory Committee The Commission was established by the government in April 2000 to provide advice on the future strategic direction of the New Zealand tertiary education system. Recommendations from this Committee led to the establishment of the Tertiary Education Commission and the Tertiary Education Strategy. The Committee’s fourth and final report can be found at: http://www.tec.govt.nz/downloads/teac/4thReport.pdf. Tertiary Education Institution (TEI) Tertiary education institutions (TEIs) are public providers of tertiary education. There are five kinds of institution as defined in section 159 of the Education Act 1989: universities, ITPs, colleges of education, wānanga and ‘specialist colleges’. There were no specialist colleges in New Zealand in 2004. Tertiary Education Organisation (TEO) Tertiary education organisations, as defined in section 159B of the Education Act 1989, are all the institutions and organisations that provide or facilitate tertiary education and training. These include public tertiary education institutions (TEIs), private training establishments (PTEs), other tertiary education providers (OTEPs), government training establishments (GTEs) and industry training organisations (ITOs). Tertiary Education Provider (TEP) Section 159 of the Education Act 1989 defines tertiary education providers as tertiary education institutions, private training establishments and government training establishments. The definition does not include industry training organisations. Tertiary-Type A The Organisation for Economic Cooperation and Development (OECD) classifies qualifications into Tertiary-type A education and Tertiary-type B. Tertiary-type A programmes (ISCED 5A) are largely theory-based and are designed to provide sufficient qualifications for entry to advanced research programmes and professions with high skill requirements. They have a minimum cumulative theoretical duration (at tertiary level) of three years’ or more full-time equivalent study, although they typically last four or more years. Tertiary-Type B Tertiary-type B programmes (ISCED 5B) are typically shorter and focus on practical technical or occupational skills for direct entry into the labour force. They have a minimum duration of two years’ full-time equivalent study at tertiary level.
12
Training Incentive Allowance (TIA) The Training Incentive Allowance is designed to provide financial assistance to people receiving certain Work and Income benefits to assist them to undertake employment-related training. Training Opportunities The Training Opportunities programme is targeted towards job seekers, usually aged 18 years or more, long-term unemployed with low qualifications, people with disabilities, certain Work and Income benefit recipients, refugees, ex-prisoners, or Work and Income priority clients. Training is free for trainees, usually includes work-based learning and is designed to provide trainees with practical pathways to employment or further education. Tuition fees Tuition fees are the fees charged to students for tuition by tertiary education providers. Tuition subsidies Tuition subsidies are the money that is appropriated by the government through Vote Education and used to provide subsidies through the Student Component for valid student enrolments offered by recognised providers. University A university is a public tertiary education institution that is primarily concerned with advanced learning and knowledge, research and teaching to a postgraduate level. Wānanga A wānanga is a public tertiary institution that provides programmes with an emphasis on the application of knowledge regarding ahuatanga Māori (Māori traditions) according to tikanga Māori (Māori custom). Youth Training Youth Training provides a bridge towards employment, further education or training for school leavers with low or no qualifications. It aims to raise the educational and vocational achievement of eligible young people while providing opportunities for them to explore work options. Youth Training is characterised by innovation, providing a diverse range of learning opportunities shaped according to the learning needs and vocational goals of the young person. It develops young people as independent learners preparing for the world of work.
13
List of acronyms AAA Approvals, Accreditation and Audit group (of NZQA) ACE Adult and Community Education ACENZ Association of Colleges of Education in New Zealand AFML Annual Fee Movement Limit ALAF Adult Literacy Achievement Framework ALL Adult Literacy and Life-Skills Survey ALQM Adult Literacy Quality Mark AMPTEE Association of Māori Providers of Tertiary Education and Employment APPEL Association of Private Providers of English Language ATEM Association of Tertiary Education Managers CEAC Colleges of Education Accreditation Committee CLANZ Community Learning Aotearoa New Zealand CoE College of Education CoRE Centre of Research Excellence CPI Consumer Price Index CRI Crown Research Institute CUAP The Committee on University Academic Programmes DDP Doubtful Debt Provision e-CDF e-Learning Collaborative Development Fund EFTS Equivalent full-time student ELSI Economic Living Standard Index ERO The Education Review Office ESOL English for Speakers of Other Languages FCCM Fee and course costs maxima FCR Funding Category Review FRST Foundation for Research, Science and Technology FTE Full-time equivalent GIF Growth and Innovation Framework GTE Government training establishment HLFS Household Labour Force Survey HRC Health Research Council IALS International Adult Literacy Survey ICT Information and communications technologies IDF Innovation and Development Fund IIQABCG Inter-Institutional Quality Assurance Bodies Consultative Group ISCED International Standard Classification for Education ITF Industry Training Federation ITI Independent Tertiary Institutions ITO Industry training organisation ITP Institute of Technology and Polytechnic ITP New Zealand Institutes of Technology and Polytechnics of New Zealand ITP Quality Institutes of Technology and Polytechnics Quality ITPs Institutes of technology and polytechnics MCLaSS Multicultural Centre for Learning and Support Services MoRST Ministry of Research, Science and Technology MSD Ministry of Social Development NCEA National Certificate of Educational Achievement NQF National Qualifications Framework NRCGD National Research Centre for Growth and Development NSI National Student Index NSN National Student Number NZAPEP New Zealand Association of Private Education Providers
14
NZIS New Zealand Income Survey NZQA New Zealand Qualifications Authority NZSCED New Zealand Standard Classification for Education NZUAAU New Zealand Universities Academic Audit Unit NZVCC New Zealand Vice-Chancellors’ Committee OECD Organisation for Economic Cooperation and Development OTEP Other tertiary education provider PBRF Performance-Based Research Fund PFIL Postgraduate Fee Increase Limit PITPONZ Pacific Islands Training Providers of New Zealand PTE Private training establishment REAP Rural Education Activities Programme SLS Student Loan Scheme SNZ Statistics New Zealand SPF Strategic Priorities Fund SSG Special Supplementary Grant STAR Secondary-Tertiary Alignment Resource STEP Statement of Tertiary Education Priorities STM Standard Training Measure TANZ Tertiary Accord of New Zealand TCS The Correspondence School TEC Tertiary Education Commission TEI Tertiary education institution TEO Tertiary education organisation TEP Tertiary education provider TES Tertiary Education Strategy TIA Training Incentive Allowance TOPNZ The Open Polytechnic of New Zealand TPMF Tūāpapa Pūtaiao Māori Fellowships TWoA Te Wānanga o Aotearoa UBSH Unemployment Benefit Student Hardship WBSDF Workbase Basic Skills Development Fund WINHEC World Indigenous Nations Higher Education Consortium WIPCE World Indigenous Peoples Conference on Education
15
EXECUTIVE SUMMARY The New Zealand context 1 Tertiary education in New Zealand can be characterised by its breadth of provision. It encompasses all post-compulsory education and training. It is currently undergoing a substantial programme of reform. 2 Tertiary education in New Zealand is broader than the OECD definition of tertiary education and includes all post-school education: foundation education, (such as adult literacy), certificates and diplomas, bachelors degrees, industry training (including apprenticeships), adult and community education; and postgraduate qualifications. It provides pathways for a wide range of learners, including school leavers, workers, the unemployed, international students, those pursuing interests, and people seeking greater social interaction. 3 The diversity of the tertiary education sector is evident in the mix of tertiary education organisations (TEOs) that make it up: public tertiary education institutions (TEIs), private training establishments (PTEs), industry training organisations, adult and community education providers. In addition, employers provide industry-related training in the workplace. There are 33 TEIs of which there are four kinds - universities, institutes of technology and polytechnics (ITPs), colleges of education (CoEs) and wānanga. Universities are primarily concerned with advanced learning, ITPs are mainly focussed on vocational training at certificate and diploma level, CoEs provide training and research mostly related to teacher training, and wānanga are Māori centres of tertiary learning. PTEs cater for a range of learners in niche education areas. There are 900 PTEs that cater for 14% of all students. 4 The increases in participation and achievement in the tertiary education system indicate the extent to which New Zealanders are developing skills. Participation reached historic levels in 2004. While traditional levels of growth in participation at bachelors degree level and above continues, much of the recent growth in participation has come at certificate level from people who have not previously participated in tertiary education. Significant trends include:
Over the past decade the number of New Zealanders in tertiary education has increased by 82%;
Over the last five years, half of growth has been attributable to the increased enrolments of people over 40 years of age;
Over the last five years, the number of students enrolled in certificate and diploma qualifications increased by 103%, those in bachelors degrees increased by 10% and those in postgraduate qualifications increased by 18%;
Māori have the highest participation rate of all ethnic groups; Over the last five years, the number of students completing certificate and diploma
qualifications increased by 265%, those completing bachelors degrees increased by 7% and those completing postgraduate qualifications increased by 12%;
By 2004, nearly 60% of all New Zealanders aged 25 to 64 had tertiary qualifications. 5 The main piece of legislation providing the legal framework for the tertiary education system is the Education Act 1989. This Act: sets up the government’s tertiary education agencies and defines their roles and responsibilities, gives the authority for the strategic direction of the sector and describes the constitution and functions of different types of TEIs. The main government agencies with a responsibility for tertiary education are the Ministry of Education which is responsible for developing the policy framework for tertiary education, the Tertiary Education Commission (TEC) which is responsible for operating the government’s funding mechanisms and giving effect to government strategy, and the New
16
Zealand Qualifications Authority (NZQA) which provides an overarching quality assurance role for the tertiary sector (see Chapter 1). 6 The New Zealand tertiary education system is currently implementing a significant round of reforms. Implementation of these reforms began in 2002 with the enactment of the Tertiary Education (Reform) Bill and the launch of the first tertiary education strategy (TES). The reforms are aimed at: creating a more coherent and collaborative tertiary education system; ensuring the system is better aligned to the nation’s economic and social development goals; and is actively identifying and meeting the needs of the communities it serves. The reforms are intended to change the culture of both tertiary education agencies and the sector as a whole and to increase the influence and role of key stakeholders over the system. The first TES articulates the required goals and objectives of the New Zealand’s tertiary education system to give effect to the changes being sought by the reforms. 7 The current TES is based around six over-arching sub-strategies:
Strengthen system capability and quality. National goals will not be achieved unless there is enhancement in the strategic capability and robustness of the tertiary education system as a whole.
Te Rautaki Matauranga Māori – Contribute to the achievement of Māori development aspirations. New Zealand needs to recognise the unique position of Māori as Treaty partners, and the huge significance that learning and education has for Māori communities. This strategy addresses issues relating to skill development, research and capability-building for Māori.
Raise foundation skills so that all people can participate in our knowledge society. Improving foundation skills (literacy, numeracy and other basic skills), will ensure that more New Zealanders are able to participate effectively in the economic and social benefits of our vision for national development.
Develop the skills New Zealanders need for our knowledge society. This strategy recognises that New Zealand will need high-level generic skills in much of the populace, and more highly specialist skills in areas of comparative advantage, for the country to accelerate its transformation into a knowledge society.
Educate for Pacific peoples’ development and success. Pasifika peoples represent a significant and rapidly-growing proportion of New Zealand’s population. This strategy addresses issues relating to Pasifika peoples’ capability needs and skill development that will ensure their success and development.
Strengthen research, knowledge creation and uptake for our knowledge society. This strategy recognises that research and innovation are key drivers of modern economies, and also that the broader application of new knowledge will enable the achievement of social, environmental and infrastructural goals.
Each of these sub-strategies includes a number of subordinate and more detailed objectives. 8 The goals of the TES are supported by the Statement of Tertiary Education Priorities (STEP) document, which seeks to balance the short-term priorities of the tertiary education system with the medium-term requirements of the TES. 9 The initial focus in the reforms was on developing new processes and infrastructure, and in particular, the establishment of the TEC whose primary function is to give effect to the STEP. This has been followed by the implementation of new planning and accountability arrangements, which are now in place for all government funded TEOs, and the development and implementation of funding mechanisms to reward quality and excellence in teaching and learning and research. Recently, there has been an increased focus over the last two years on a more coordinated approach by agencies to achieve increased quality in, and relevance of tertiary education.
17
10 The reforms have led to a number of regulatory and resourcing changes and require agencies and the sector to be able to make ongoing adjustments and manage multiple factors within the policy frameworks. The recognition of the complexity of the drivers influencing the education system means that policies that focus on one aspect of the drivers need to be complemented with a focus on other drivers. For example, the tertiary sector has shifted significantly from a system that relied on student choice (demand side) to meet the nation’s needs to one where the policy settings work to ensure that providers (supply side) meet the nation’s needs. There is a recognised need to balance the supply side interventions with more work on the demand side, primarily to continue to improve information to inform student choice, and to provide better means for employers to communicate their needs directly to potential students and TEOs. 11 The amount of change management and adjustment that has been required of the sector and the agencies is significant. Its magnitude, complexity, and the speed in which it is occurring has inevitably meant a significant and continuing change management process. In general its design has been accepted by the sector as the necessary way forward. 12 The strengths and weaknesses of the system in its current state (see Chapter 11) must be seen in the context of the general trends affecting the system (such as the demand in the labour market for skills) and the state of implementation of the current reforms. It is important to note that, given the early stage of the current reforms, some significant features of the current system (such as its high participation) may result as much from previous policy settings as from the reforms. The labour market dimension 13 A growing economy and a strong increase in demand for labour over recent years has seen the New Zealand labour market tightening and levels of unemployment at a 20-year low. Business and employer groups are reporting continuing skill shortages across a wide variety of business and occupational areas. This has affected both the demand for tertiary education and the type of tertiary education required (see Chapter 3). 14 Unemployment rates have significantly decreased regardless of the level of qualification held by a person. The gap between the unemployment rate for those with vocational qualifications and those with degree-level qualifications (which was significant in the early 1990s) had disappeared by 2004. The demand for tertiary education graduates, however, has been maintained in the face of increasing supply. On average, the labour-market rates of return for tertiary graduates have been relatively constant for all levels of qualification over recent years. 15 The Department of Labour provides the government with strategic advice and information on labour market needs but with the creation of the TEC, whose primary function is to implement the STEP, New Zealand now has an agency that can link the needs of the labour market with the provision of education and training. 16 The current TES articulates the requirement for tertiary education organisations (TEOs) to achieve a greater match between their provision of tertiary education programmes and:
The requirements of employers and industries; Current skill needs at the national, regional and local level; and The need to equip all New Zealanders with the foundation skills they require for
employment. This requirement is supported by detailed priorities articulated in the STEP which the TEC gives effect to through annual funding negotiations with TEOs.
18
The regional dimension 17 New Zealand has some four million people distributed through a country 1,600 kilometres in length. The country has a low population density. The consequence for tertiary education of the dispersed population has been the evolution of an extensive national network of provision by TEIs (see Chapter 4). 18 The concept of a ‘network of provision’ has been thought of in the past as referring to the offering of a core set of qualifications throughout the country, with significant provision in provincial areas. More recently, as the tertiary education reforms have sharpened focus on the connections between tertiary education organisations and the communities they serve, the idea of a network of provision has come to have elements of active partnership by institutions in regional development. 19 The establishment of the TEC is intended to increase the level and quality of engagement with stakeholders and hence, regions. In particular, the TEC has the responsibility for managing the key accountability documents that require TEOs to engage with their communities to determine strategic priorities and direction. The intention is to provide opportunities for local stakeholders to be involved in tertiary education issues. All publicly-funded tertiary education organisations are required to report on the consultation process adopted in developing these documents. Practice has varied, however and there have been some difficulties in universities in particular determining their communities. 20 A range of strategic incentive-based funding initiatives have been introduced as part of the reforms and most of these have a regional development slant. Research and innovation 21 TEOs play a key role in furthering research and innovation in New Zealand, and the tertiary education sector is responsible for the largest share of the country’s research output. In addition, the sector is responsible for most of the training in research – developing advanced research skills for those entering work as well as producing graduates with skills, knowledge and attributes that enable them to contribute to research and innovation in New Zealand (see Chapter 5). 22 The great majority of the research completed by TEOs in New Zealand is done in the universities. The universities are also the largest contributor overall to research and innovation in New Zealand – they are responsible for about 63% of the country’s output of research papers. 23 The funding of research in New Zealand TEOs has changed significantly over the last few years. The government views research performance as an underlying driver of overall social and economic performance and so has sought to increase the quality – and quantity – of research output. 24 Prior to 2003, the main allocation of research funding to TEOs was based on student enrolments. This approach reflected the statutory requirement that teaching at degree level and above is primarily taught by those active in research - government consider this a necessary connection and that being taught by those active in research is a means of enhancing the quality of teaching at higher levels. However, funding research on the basis of student enrolments did not necessarily encourage research excellence and so the government separated the allocation of funding for research from the mechanisms for allocating funding for enrolments and tuition and aligned it with the research performance of TEOs, to reward excellence in research.
19
25 The research funding allocations are now primarily a reflection of research quality. They acknowledge that the universities’ role in the research and innovation system is principally one of pure basic research, and that such research contributes to economic outcomes in the longer term. But there is also a strategic dimension to this funding, in that the ‘relevance’ of a TEO’s research is recognised through its ability to earn external research income. 26 In addition to the main research funding mechanism, the government allocates targeted funding where the strategic dimension is more explicit. Examples include: supporting leading edge, innovative research of international standard that fosters excellence; fostering linkages between TEOs and industry; and improving the transfer to industry of knowledge and technology developed in TEOs. Equity in and through tertiary education 27 In New Zealand there is a clear relationship between higher levels of education and increased indicators of social and economic wellbeing. Tertiary policy has therefore focused on developing a sector that is capable of meeting a diverse range of educational needs for all (see Chapter 6). The focus is not simply on building equity in terms of patterns of participation within the tertiary sector, but also on examining how the tertiary sector can contribute to wider social and economic equity goals. 28 New Zealand’s tertiary education system operates according to a general principle of open access. Under this principle, a domestic student who has met the minimum entry requirements for enrolling in a particular course offered by a TEO is entitled to enter that course. The principle of open access in theory gives all prospective students the opportunity to engage in tertiary education. The TES has identified four specific groups where increasing participation in the tertiary sector is of key concern: Māori students (at degree level and higher), Pasifika students, students with a disability and for students from lower socio-economic backgrounds moving from school to tertiary. 29 Broadly speaking, the New Zealand tertiary education funding system itself offers equity benefits in terms of promoting participation in relevant and high quality courses. Specifically, the key equity related policies and initiatives are:
Provision of foundation education so that people can raise their skill levels and participate in society and employment;
Enhancing the network of tertiary education provision by allowing PTEs to access greater levels of public funding in 1999;
Providing pathways for upper secondary school students who are at risk of leaving school with low or no qualifications;
Limiting fee increases at TEOs; Provision of student support through loans and allowances; and Financial support for those targeted groups detailed in the TES;
30 The TES and the STEP both contain equity related goals and as a result each TEO is required to demonstrate in its accountability documents to the TEC the equity measures it has in place or intends to introduce. This ensures that equity issues are accounted for, while giving each TEO significant autonomy and flexibility in deciding how it can best meet these requirements.
20
Resourcing the tertiary education system Staffing 31 In New Zealand, legislation provides the framework for all employment arrangements for TEOs but it is the responsibility of the TEOs themselves to manage their own staffing arrangements (see Chapter 7a). The government plays a relatively minor role in staffing issues. For public institutions, the Education Act 1989 states that one of the characteristics of academic freedom is the right of the institution to appoint its own staff. While each TEI is free to negotiate its own staffing arrangements, most TEIs adopt similar processes. 32 Since the reforms of 2002 the government has undertaken initiatives to foster improvements in this area:
A strategic review of the tertiary education workforce aims over time to improve government and TEO understanding of the strategic issues facing the sector, so enabling better planning of human resources matters;
A recent series of tripartite discussions involving the universities, university staff associations, and government agencies that aims to review issues relating to resourcing issues, recruitment, and retention; and
Improving workforce skills via the new funding mechanisms such as that for research and the recently established National Centre for Teaching Excellence which has been set up to improve the quality and profile of tertiary teaching.
33 Current concerns from staff associations include:
the potential financial benefits to TEOs from the new funding mechanism for research may skew some TEOs’ selection and promotion processes in favour of research and to the detriment of teaching performance.
The level of casual and fixed-term employment agreements in the sector, and at the lack of continuity that casualised agreements encourage. There is concern at the potential for a reduced quality of tertiary education in TEOs that use casual agreements.
Finance 34 Government policy is that the costs of tertiary education will be shared. Part of the overall resourcing is provided by the government – through research and ‘teaching and learning’ funding provided to TEOs, and through support to students for their costs of tuition. The remaining costs of tuition are met by students and their families; and the remaining costs of research are met by the users of research. The rationale for the shared approach to resourcing is that for those who succeed in tertiary education there both private and public benefits (see Chapter 7b). 35 The tertiary education system has an integrated funding framework. This framework is intended to resource and steer the tertiary education system towards the goals of the TES, and to provide TEOs with the flexibility to operate in a responsive and innovative way. Like the new research funding mechanism, the government has also signalled an intention to make further changes, moving towards a more differentiated funding system related to outcomes. 36 The resourcing of the tertiary education system has proved the most controversial area of policy. There has been ongoing arguments about funding levels, particularly from the university sector that argues that their costs rise at a faster rate than inflation, and at the rate of increase in levels of student loans and at possible downstream impacts of loans. Some groups have argued that tertiary education is a basic right and that therefore the government should

21
meet all of the cost. Others were prepared to accept an element of cost-sharing but are concerned at the extent of the increase in the private contribution. 37 The government has sought to address such public concerns and perceptions with a programme of improved information on student support, and with changes to loans and allowances that have increased concessions in the former and broadened access to the latter. The government has also sought to achieve greater control over growth and better value for government expenditure. 38 Over the period 2002 to 2005, it has started to implement a series of restrictions on growth – especially at the certificate and diploma level with some of the savings to be used to help parts of the sector shift further towards provision that is more aligned to the TES. Planning, governing and regulating 39 The New Zealand system is built around recognition and acceptance of a high degree of institutional autonomy and clear statutory requirements for accountability and disclosure for TEIs. The Education Act 1989 decentralised much of the sector’s decision-making powers, in favour of letting TEIs take control of their own resources and future (see Chapter 8). These changes were accompanied by changes in the resourcing system, which shifted to a bulk-funding basis, enabled TEIs to set fees, and gave them control over their own capital expenditure. Following this, in the 1990s, there was major growth in the sector as institutions developed innovative ways of meeting student demand in a relatively deregulated environment. The government did not have powers to intervene directly in at-risk TEIs until amendments to the Education Act in 2001. 40 At the sector-wide level, the 2002 reforms require the system and TEOs to be more focused on their contribution to national economic and social development goals. To achieve the government’s goals for the system, the system is steered by the TEC giving effect to the priorities set out in the TES every five years with more specific guidance set out in the STEP every one to three years. These mechanisms inform planning and decision-making processes throughout the sector. To receive government funding, TEOs are required to demonstrate that their provision and activities align with the TES and STEP. This is done primarily through their annual funding negotiations with the TEC. 41 The TES recognises that the development of a focused, high-quality, relevant, and accessible tertiary education system in a small country with limited resources requires differentiation and specialisation of TEOs, and effective links between them. While the Education Act provides the foundations for differentiation between types of TEOs, the TEC has invited debate on how these different types should focus in the future. The debate is focused on the distinctions that are necessary to provide an appropriate balance and diversity of teaching programmes, research, and capability within a sustainable network of provision across New Zealand. 42 A recent review of inter-agency relationships and the capability of the agencies has been undertaken and it has recommended specific coordination and oversight arrangements be implemented to support overall leadership of the sector. Quality assurance 43 Quality assurance in New Zealand is governed by the Education Act 1989 and is the responsibility of the NZQA, for non-university TEOs, and the New Zealand Vice Chancellors’ Committee for universities (see Chapter 9). TEOs must have in place a quality management system that demonstrates they have the necessary policies, procedures and review mechanisms for maintaining quality standards and for meeting those of their goals and
22
objectives that relate to teaching and learning. The quality of a TEO’s research activities is assured through the research funding mechanism which requires a quality evaluation of its outputs produced by its individual staff. 44 The quality of teaching and learning is monitored indirectly through audit processes and directly by the TEOs themselves. There are also a number of centrally sponsored initiatives and mechanisms that directly and indirectly serve to enhance the quality assurance of teaching – for example, work aimed at building a culture that enhances effective teaching and learning. The recently established National Centre for Tertiary Teaching Excellence has been created to enhance the effectiveness of tertiary teaching and learning practices. Internationalisation and globalisation 45 Export education has grown significantly since the late 1990s and was initially seen primarily as an opportunity to generate revenue. Much of the improvement in the financial performance of the public tertiary education institutions (TEIs) over the last five years was associated with the rapid rise in international student numbers. The non-commercial aspects of the industry began to develop in the 1990s with some TEOs seeking to include an international dimension, beyond the presence of international students, in their services, programmes and culture (see Chapter 10). 46 The rapid development of export education raised a number of issues for the New Zealand government and the lead industry bodies, for example: the capacity of the education system to absorb and cater for international students. On-going consideration has been given to addressing areas of concern in the development of government and sector policy responses on internationalisation of education. 47 Over recent years, the government, in partnership with the sector, has sought to develop a coordinated and strategic approach to export education that is sustainable and that supports the development of a broader spectrum of international activity in TEOs which culminated in 2004 with the International Education Framework. a long-term strategy that has also resulted in significant investment by the government and reflects not only the recognition of the benefits of internationalisation but also the export education industry’s contribution to the national economy.
23
CHAPTER 1: THE CONTEXT FOR TERTIARY EDUCATION IN NEW ZEALAND Introduction 1 New Zealand is a small country in the South Pacific. Its population - four million – is the third lowest in the OECD. The great majority of the population lives in the two main islands – the North Island and the South Island. The population density is low, especially in the South Island. At 15 people per square kilometre, New Zealand’s population density is fifth lowest in the OECD, and considerably less than the United Kingdom, a country of similar land area which has 243 people per square kilometre. One third of the population live in the greater Auckland region. The government of New Zealand 2 New Zealand is a constitutional monarchy, whose head of state is the Governor-General, appointed by the Queen on the recommendation of the government. It is a parliamentary democracy, with a single house of parliament. The parliamentary conventions have their origin in the British parliament while the legal system also traces its origins to the English system. Since 1996, the voting system has been based on proportional representation. The current government is a minority government, with the Labour/Progressive coalition supported in parliament by three other parties. Central government is responsible for policy on and funding of all aspects of education. 3 There is no federal system of government in New Zealand. However, there are local and regional authorities whose responsibilities relate to town and regional planning, environment plus provision of services such as water and local roading. Most local authorities also have assumed an economic development role. The New Zealand economy 4 The New Zealand economy is the fourth-smallest of the 30 OECD countries, larger only than Iceland, Luxembourg and the Slovak Republic (Statistics New Zealand, 2005). New Zealand had the seventh-fastest-growing economy in the OECD from 2003 to 2004, with a growth rate of 4.8%. This compares with the 3.6% overall economic growth in the OECD countries over the same period. New Zealand’s gross domestic product (GDP) per capita in 2003 and was twenty-first of the 30 OECD countries. In 2004, New Zealand’s government spending was 34.1% of GDP, the second-lowest of 27 OECD countries. 5 Because New Zealand is a small, isolated, country with a low population density, it is heavily dependent for its economic progress on exports. The economy is heavily dependent on land-based industries – especially agriculture and tourism – while there is a growing services sector. The three main destinations for exports of goods in 2004 were Australia, the United States and Japan. New Zealand’s main exports of goods and commodities are food and drink, followed by machinery and equipment, forestry articles, aluminium and aluminium articles, wool and crude materials. 6 New Zealand has developed its agriculture and manufacturing industries to suit the needs of niche markets. The farming industry provides a large proportion of food and drink exports in the form of dairy and meat products. 7 New Zealand currently has very low levels of unemployment – the lowest in the OECD. Given the combination of economic growth and low unemployment, concerns have been expressed at skill and labour shortages (Ministry of Economic Development et al, 2003).

24
8 Given the ongoing dependence of the New Zealand economy on commodity markets, governments have long recognised the need for diversification of the economy and for industries aimed at adding greater value to the country’s resources and products. Since the mid 1980s, there have been significant economic restructuring and moves towards a less regulated economy. These moves were designed to improve efficiency and promote enterprise. More recently, the government has developed a growth strategy expressed in its Growth and Innovation Framework. This framework identifies three areas of activity as critical to national economic growth – biotechnology, information and communications technology and design – and creates of a number of strategies aimed at improving economic performance. The Treaty of Waitangi 9 While New Zealand is an English-speaking country and while many of the institutions trace their origins to British roots, the country’s social institutions and culture are strongly influenced by the culture of the indigenous people of New Zealand – the Māori people. 10 Māori had lived in New Zealand for many centuries before the arrival of the first European visitors. In 1840, the Māori people entered a treaty - the Treaty of Waitangi - with the British Crown. That treaty, New Zealand’s founding document, established a partnership between the two peoples. It granted Māori the right to British citizenship and gave them a guarantee of protection of certain traditional rights. The Treaty attempted to regulate land sales. 11 Over subsequent years, there were breaches of the treaty and there have been ongoing debates both about the application of the treaty in particular instances and more generally, about the place of the treaty in New Zealand’s society. In 1975, the government established the Waitangi Tribunal, a judicial body, to hear claims brought by Māori alleging breaches of the treaty. Tribunal decisions have resulted in a number of major settlements, including Crown apologies and compensation for land and resource losses. 12 Over the last 25 years, there has been increasing recognition of the importance to the nation as a whole of its indigenous culture. Te reo Māori (the language of Māori) is now recognised as an official language of New Zealand, public bodies recognise the importance of the treaty in their missions and they accept that, as public bodies, the treaty imposes obligations on them. Māori protocols are increasingly seen as part of the way New Zealanders and New Zealand institutions conduct their business. 13 While there are signs of improvement, social outcomes for Māori have remained poor in relation to the population as a whole. Māori remain overrepresented among the in unemployed, tend to have poorer health and lower educational outcomes and are more likely to be imprisoned. 14 There is a growing Māori education stream - integrated into the country’s education system but semi-independent. At the pre-school level, there are kohanga reo (Māori language immersion early childhood education centres) and there are also kura kaupapa Māori, schools that teach in te reo Māori and that teach with Māori pedagogy as its base. This has led to the creation of wānanga, indigenous higher education institutions. There are three wānanga recognised as public tertiary education institutions, while a number of iwi (tribal) groups have established private tertiary establishments.
25
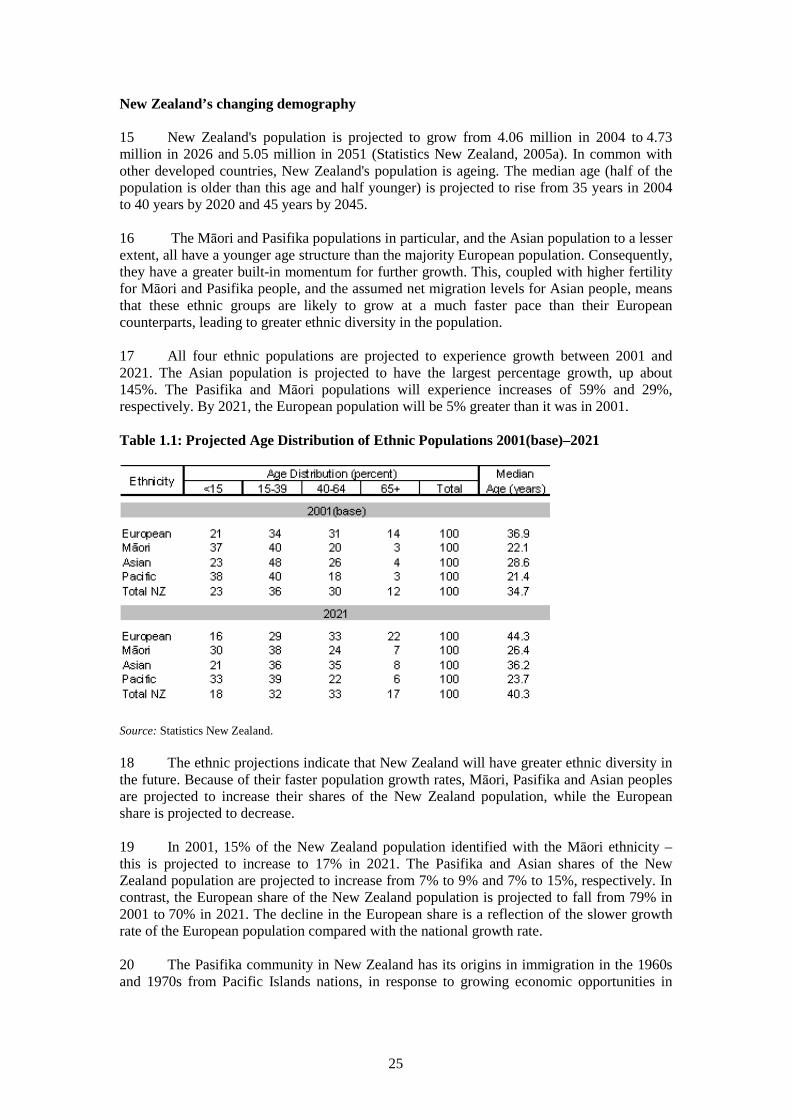
New Zealand’s changing demography 15 New Zealand's population is projected to grow from 4.06 million in 2004 to 4.73 million in 2026 and 5.05 million in 2051 (Statistics New Zealand, 2005a). In common with other developed countries, New Zealand's population is ageing. The median age (half of the population is older than this age and half younger) is projected to rise from 35 years in 2004 to 40 years by 2020 and 45 years by 2045. 16 The Māori and Pasifika populations in particular, and the Asian population to a lesser extent, all have a younger age structure than the majority European population. Consequently, they have a greater built-in momentum for further growth. This, coupled with higher fertility for Māori and Pasifika people, and the assumed net migration levels for Asian people, means that these ethnic groups are likely to grow at a much faster pace than their European counterparts, leading to greater ethnic diversity in the population. 17 All four ethnic populations are projected to experience growth between 2001 and 2021. The Asian population is projected to have the largest percentage growth, up about 145%. The Pasifika and Māori populations will experience increases of 59% and 29%, respectively. By 2021, the European population will be 5% greater than it was in 2001. Table 1.1: Projected Age Distribution of Ethnic Populations 2001(base)–2021
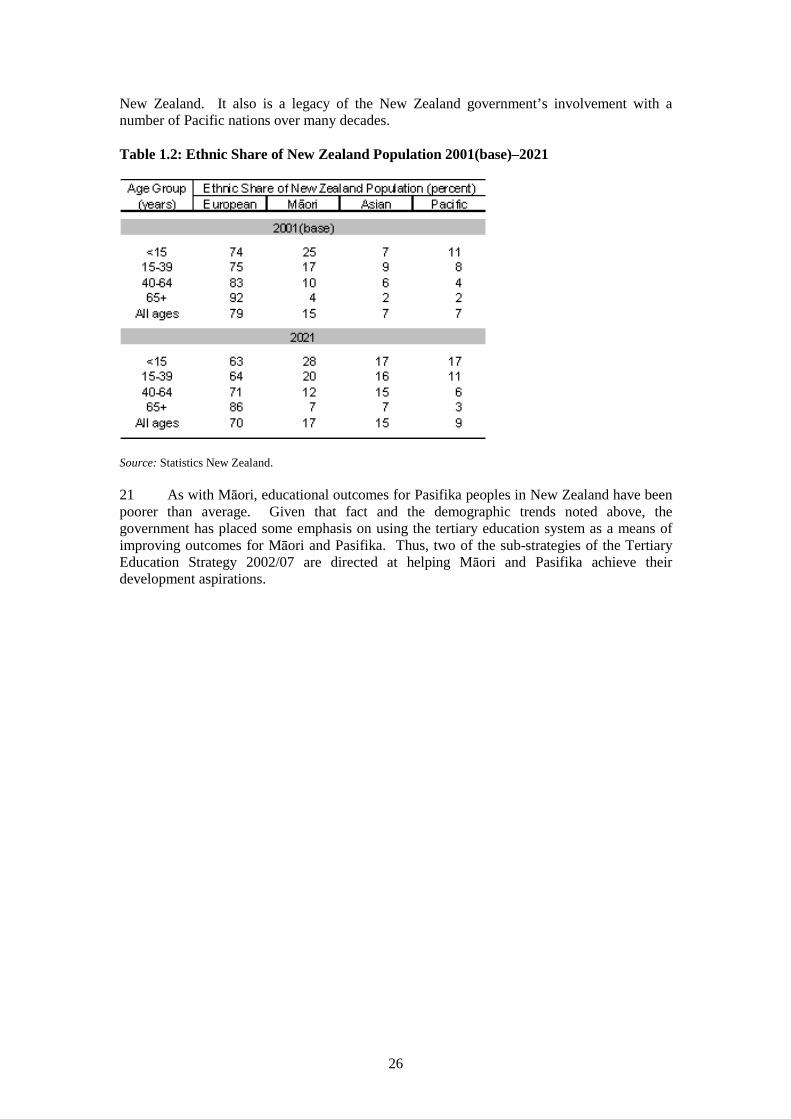
Source: Statistics New Zealand. 18 The ethnic projections indicate that New Zealand will have greater ethnic diversity in the future. Because of their faster population growth rates, Māori, Pasifika and Asian peoples are projected to increase their shares of the New Zealand population, while the European share is projected to decrease. 19 In 2001, 15% of the New Zealand population identified with the Māori ethnicity – this is projected to increase to 17% in 2021. The Pasifika and Asian shares of the New Zealand population are projected to increase from 7% to 9% and 7% to 15%, respectively. In contrast, the European share of the New Zealand population is projected to fall from 79% in 2001 to 70% in 2021. The decline in the European share is a reflection of the slower growth rate of the European population compared with the national growth rate. 20 The Pasifika community in New Zealand has its origins in immigration in the 1960s and 1970s from Pacific Islands nations, in response to growing economic opportunities in
26
New Zealand. It also is a legacy of the New Zealand government’s involvement with a number of Pacific nations over many decades. Table 1.2: Ethnic Share of New Zealand Population 2001(base)–2021
Source: Statistics New Zealand. 21 As with Māori, educational outcomes for Pasifika peoples in New Zealand have been poorer than average. Given that fact and the demographic trends noted above, the government has placed some emphasis on using the tertiary education system as a means of improving outcomes for Māori and Pasifika. Thus, two of the sub-strategies of the Tertiary Education Strategy 2002/07 are directed at helping Māori and Pasifika achieve their development aspirations.
27
CHAPTER 2: OVERALL DESCRIPTION OF THE TERTIARY EDUCATION SYSTEM
Introduction 22 This chapter gives an overview of the tertiary education system in New Zealand. It explains what we mean by the term ‘tertiary education’, outlines the variety of tertiary education organisations (TEOs) in this country, and explains what types of tertiary education there are, who provides tertiary education and how the system is managed. This chapter also looks at the contributions made by national agencies in supporting the provision of tertiary education and training in New Zealand and the policy settings used. It also discusses briefly the past and current environments in which these settings operate as well as future priorities for improvement being sought by the government. The tertiary education system in New Zealand 23 In New Zealand, ‘tertiary education’ is very broadly defined and includes all post-school education. It includes foundation education, such as adult literacy and second chance education for those with low or no qualifications who are looking for employment; certificates and diplomas; bachelors degrees; industry training, including Modern Apprenticeships; Adult and Community Education (ACE); and postgraduate qualifications, many of them requiring students to conduct substantial original research. Tertiary education organisations 24 The diversity of the tertiary education sector is evident in the mix of TEOs that make it up: public tertiary education institutions (TEIs), private training establishments (PTEs), industry training organisations (ITOs), ACE providers and others. In addition, employers provide industry-related education and training in the workplace. 25 There are four kinds of TEIs – universities, institutes of technology and polytechnics (ITPs), colleges of education (CoEs) and wānanga. In 2004, TEIs employed 28,000 full-time equivalent staff, of which 14,000 were academic/tutorial staff, and provided education and training for 88% of all students1.
Universities are primarily concerned with advanced learning, and offer the opportunity to pursue disciplines from the undergraduate level to advanced postgraduate study and research. There are eight universities spread throughout New Zealand. In 2004, the eight universities collectively enrolled 165,000 students, representing 125,000 equivalent full-time students (EFTS).
ITPs are mainly focused on vocational training, although this role has expanded over the past 15 years to meet the increasingly diverse needs of learners and the economy. Many ITPs offer degrees and are involved in research activities, particularly applied research and research in technological areas. There are 20 ITPs spread across the country. The number of students enrolled at ITPs in 2004 was 214,000 or 78,000 EFTS.
CoEs provide training and research mostly related to early childhood and compulsory education. Increasingly, these colleges also offer other programmes in addition to teacher education, for instance business and social work qualifications. The number of colleges has reduced over the past decade, from six in the early 1990s to two in 2005, as they have merged with nearby universities. In 2004, there were 14,500 students at CoEs, or 8,400 EFTS.
1 Students enrolled in more than one sub-sector are counted in each sub-sector. Consequently, the proportion of students in each sub-sector may not add to 100 percent.
28
Wānanga – Māori centres of tertiary learning – were formally recognised as TEIs in the last decade. They offer study at all levels, from foundation education to postgraduate study and research where ahuatanga Māori (Māori tradition) and tikanga Māori (Māori custom) are an integral part of the programme. Wānanga have made a substantial contribution to the advancement of Mātauranga Māori (Maori knowledge). There are three such wānanga. The three had 70,000 students or 32,000 EFTS in 2004.
26 PTEs provide tertiary education in specialised niche areas not always covered by larger public institutions, catering for many different groups, in many different locations, and at most levels. There are nearly 900 registered PTEs comprising 14% of all tertiary enrolments - 63,000 students or 30,000 EFTS - in 2004. Registered PTEs must meet financial, educational, quality and management requirements to provide safeguards for learners. Many PTEs receive public funding on a similar basis as TEIs (refer to chapter 7) while others receive no Crown funding at all - such as English language schools that cater only for full-fee-paying international students or those that provide training for specific employers on a full cost-recovery basis. 27 Another 16 TEOs, known as ‘other’ tertiary education providers (OTEPs), also deliver programmes of national significance and receive government funding. These account for only 1% of all students. 28 There is also considerable formalised training activity in the workplace known as industry training. Some of this is funded through the industry training fund, while the rest is supported by business. Industry training (including Modern Apprenticeships) is facilitated through ITOs. At the end of 2004 there were 41 ITOs around the country, established by particular industries or groups of industries. Learners in tertiary education 29 The total number of students in the tertiary sector has grown significantly (by 52%) over the last five years, in the main, due to the wānanga, ITP and the PTE sub-sectors engaging significant numbers of first-time learners aged over 25 years, many of whom had never attended tertiary education and had achieved low or no secondary school qualifications. Most of those students entered certificate and/or diploma programmes. The expansion at the lower levels of study has not, however, affected the growth at degree level and above. 30 As a result New Zealand is currently experiencing its highest participation rate in history with over 14% of the population aged 15 years and over participating in formal tertiary education in 2004. This has led to the participation rates of traditionally under-represented groups, such as Māori and Pasifika people, increasing and exceeding that of European New Zealanders. 31 In 2004 there were 505,000 students2 enrolled in tertiary study at a government funded TEO and of these:
72% were studying at certificate and/or diploma level, 30% at bachelors degree level and 7% at postgraduate level; 42% attended an ITP compared with 33% for universities, 14% for PTEs and
wānanga, and 3% for CoEs; and 29% of these students are aged 40 years or older.
Also, 140,000 trainees were engaged in industry training in the workplace in 2004.
2 Students enrolled in more than one sub-sector are counted in each sub-sector. Consequently, the proportion of students in each sub-sector may not add to 100%.

29
The government’s goals for tertiary education 32 The New Zealand tertiary education system has undergone major changes over the last few years. In the 1990s, the vision for tertiary education focused almost exclusively on raising participation at least cost, through universal access and a simple common funding formula based on student demand. It was a system where TEOs were directly responsible to community and economic needs, and which would run itself without the need for direct government direction. The government set the policy framework, provided funding and monitored outcomes; the rest was up to the sector. 33 Before the 1990s ended, it was recognised that the New Zealand tertiary education system needed to move towards recognising its capabilities as a key national development asset. The sector and its stakeholders were consulted, and several necessary changes were identified:
Greater alignment with the government’s national goals; Improvement of linkages with business and other external stakeholders; Creation of effective partnerships with Māori communities; Greater responsiveness to the needs of learners; More future-focused strategies; Wider global linkages; Increased collaboration and rationalisation; Higher quality, performance, effectiveness, efficiency and transparency; and A culture of optimism and creativity.
34 The government embarked on a comprehensive programme of tertiary education reforms to effect these key changes over the five-year period 2002 to 2007. The cornerstone of the reforms is the Tertiary Education Strategy (TES) – a high-level strategy that articulates the key goals for New Zealand’s tertiary education system and defines how the system will help give effect to the government’s vision and goals for New Zealand. 35 The TES sets the direction for the sector for the medium- to long-term. It does not set specific, measurable goals and targets. Much of the TES is aimed at shifting the attitudes, culture and focus of the sector. 36 The current TES is based around six main sub-strategies:
Strengthen system capability and quality; Te Rautaki Matauranga Māori – Contribute to the achievement of Māori development
aspirations; Raise foundation skills so that all people can participate in our knowledge society; Develop the skills New Zealanders need for our knowledge society; Educate for Pacific peoples’ development and success; and Strengthen research, knowledge creation and uptake for our knowledge society.
Each of these sub-strategies includes a number of subordinate and more detailed objectives (refer to Annex 1). 37 More detailed guidance about achieving the goals and objectives of the TES comes from the Statement of Tertiary Education Priorities (STEP) which the Minister of Education releases every one to three years. The development of each new STEP incorporates the priorities sought by government from the goals of the TES (see Annex 2). Its development follows extensive consultation with the tertiary education sector, government agencies and other key stakeholders. It applies across the entire tertiary education system, and sets out the government’s immediate priorities for the performance of the system.
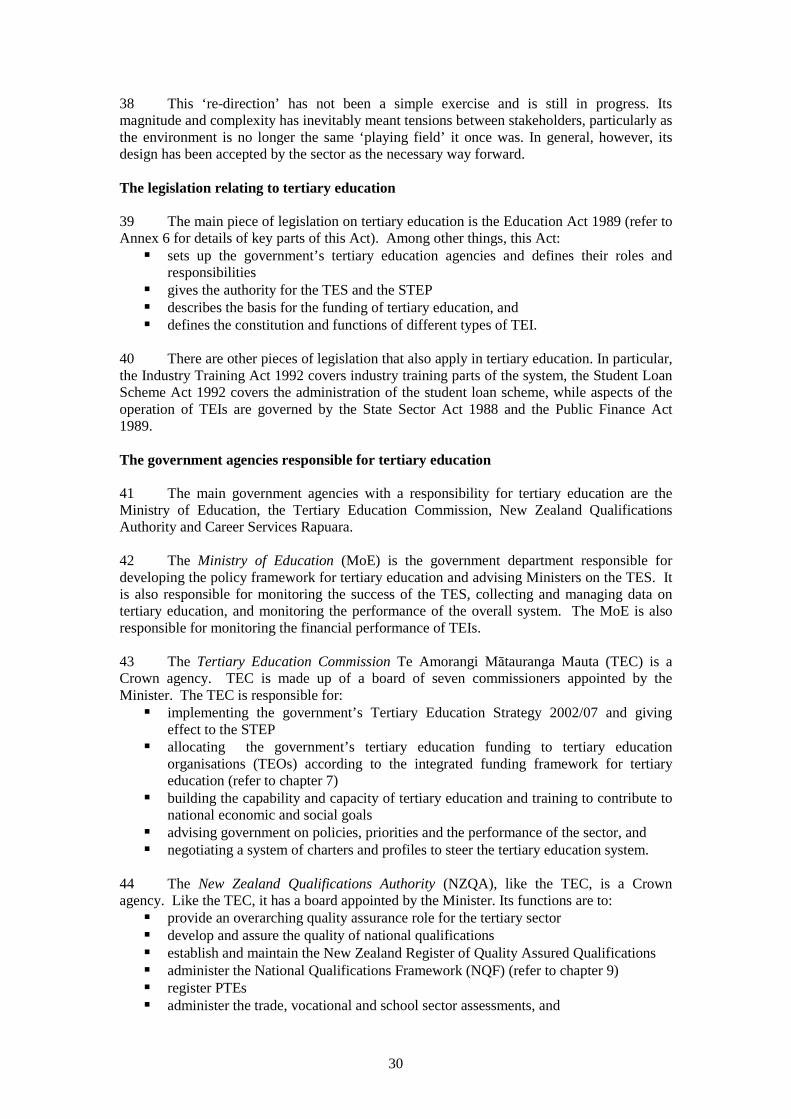
30
38 This ‘re-direction’ has not been a simple exercise and is still in progress. Its magnitude and complexity has inevitably meant tensions between stakeholders, particularly as the environment is no longer the same ‘playing field’ it once was. In general, however, its design has been accepted by the sector as the necessary way forward. The legislation relating to tertiary education 39 The main piece of legislation on tertiary education is the Education Act 1989 (refer to Annex 6 for details of key parts of this Act). Among other things, this Act:
sets up the government’s tertiary education agencies and defines their roles and responsibilities
gives the authority for the TES and the STEP describes the basis for the funding of tertiary education, and defines the constitution and functions of different types of TEI.
40 There are other pieces of legislation that also apply in tertiary education. In particular, the Industry Training Act 1992 covers industry training parts of the system, the Student Loan Scheme Act 1992 covers the administration of the student loan scheme, while aspects of the operation of TEIs are governed by the State Sector Act 1988 and the Public Finance Act 1989. The government agencies responsible for tertiary education 41 The main government agencies with a responsibility for tertiary education are the Ministry of Education, the Tertiary Education Commission, New Zealand Qualifications Authority and Career Services Rapuara. 42 The Ministry of Education (MoE) is the government department responsible for developing the policy framework for tertiary education and advising Ministers on the TES. It is also responsible for monitoring the success of the TES, collecting and managing data on tertiary education, and monitoring the performance of the overall system. The MoE is also responsible for monitoring the financial performance of TEIs. 43 The Tertiary Education Commission Te Amorangi Mātauranga Mauta (TEC) is a Crown agency. TEC is made up of a board of seven commissioners appointed by the Minister. The TEC is responsible for:
implementing the government’s Tertiary Education Strategy 2002/07 and giving effect to the STEP
allocating the government’s tertiary education funding to tertiary education organisations (TEOs) according to the integrated funding framework for tertiary education (refer to chapter 7)
building the capability and capacity of tertiary education and training to contribute to national economic and social goals
advising government on policies, priorities and the performance of the sector, and negotiating a system of charters and profiles to steer the tertiary education system.
44 The New Zealand Qualifications Authority (NZQA), like the TEC, is a Crown agency. Like the TEC, it has a board appointed by the Minister. Its functions are to:
provide an overarching quality assurance role for the tertiary sector develop and assure the quality of national qualifications establish and maintain the New Zealand Register of Quality Assured Qualifications administer the National Qualifications Framework (NQF) (refer to chapter 9) register PTEs administer the trade, vocational and school sector assessments, and
31
evaluate overseas qualifications for immigration and employment purposes. 45 Career Services Rapuara provides information, advice and guidance services that are designed to help people make informed career choices. Effective career information, advice and guidance provide a link between education, the labour market and the skills, interests and abilities of New Zealanders. Career Services’ work includes:
developing and providing career information providing individuals with advice on how to best use career information providing career guidance services, and developing and enhancing the skills of individuals and organisations that facilitate
career information, advice and guidance for others. 46 As well as these bodies, there are a number of other government agencies that have an involvement with tertiary education. 47 The New Zealand Teachers’ Council is a Crown entity responsible for, among other things, providing professional leadership in school teaching and promoting best practice and professional development. These roles mean that the Teachers’ Council is involved in the approval and monitoring of teacher training and teacher education qualifications offered in the tertiary education sector. All programmes leading to registration as a teacher must meet the criteria of the New Zealand Teachers’ Council in addition to meeting the general approval and accreditation criteria. 48 The Ministry of Social Development (MSD) is responsible for providing leadership in the areas of social development and social policy, and the delivery of social services, in particular income support. 49 Financial support is provided to students by StudyLink, a service of MSD. StudyLink is responsible for the administration and delivery of student loans, student allowances and other income support to students while they are studying, and income support for students unable to find employment during vacation breaks. This includes assessing entitlements, making payments, and maintaining partnerships with key stakeholders, including other government agencies, TEOs and student groups. 50 Inland Revenue Te Tari Taake is responsible for the assessment and collection of student loan repayments once loans have been transferred for collection. Inland Revenue also determines entitlement to interest write-offs for full-time, full-year students and low-income students as well as a base interest write-off or reduction for other eligible borrowers. In addition, Inland Revenue is responsible for the Student Loan Scheme Act 1992 and the annual regulations made under that Act which set the interest rates, the full interest write-off threshold for low-income students and the repayment threshold. 51 The Department of Labour is the agency that advises the government on all matters to do with New Zealand’s labour force. As part of that role, the department collects and analyses a great deal of information about the skills needed in the labour market and about how the tertiary education system interacts with the labour market. 52 Developing a strong focus on stakeholder relationships between government agencies, TEOs and stakeholders is one of the key challenges of the implementation of the TES. Figure 2.1 presents a schematic of the key relationships required between stakeholders, agencies and government.
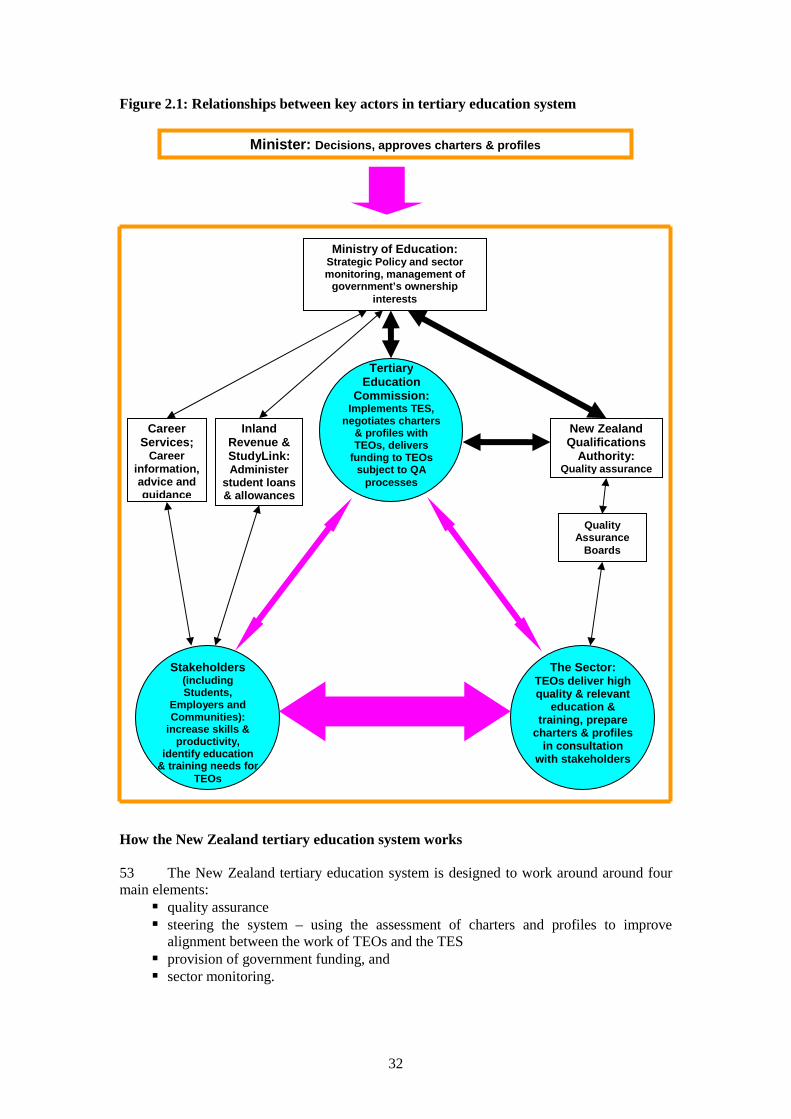
32
New Zealand Qualifications
Authority: Quality assurance
Career Services;
Career information, advice and guidance
Inland Revenue & StudyLink: Administer
student loans & allowances
Quality Assurance
Boards
Ministry of Education: Strategic Policy and sector monitoring, management of
government’s ownership interests
Minister: Decisions, approves charters & profiles
Figure 2.1: Relationships between key actors in tertiary education system
How the New Zealand tertiary education system works 53 The New Zealand tertiary education system is designed to work around around four main elements:
quality assurance steering the system – using the assessment of charters and profiles to improve
alignment between the work of TEOs and the TES provision of government funding, and sector monitoring.
Tertiary Education
Commission: Implements TES,
negotiates charters & profiles with TEOs, delivers
funding to TEOs subject to QA
processes
Stakeholders (including Students,
Employers and Communities):
increase skills & productivity,
identify education & training needs for
TEOs
The Sector: TEOs deliver high quality & relevant
education & training, prepare
charters & profiles in consultation
with stakeholders
33
54 Quality assurance is required before a TEO can be registered to offer qualifications. It is also a prerequisite for access to any government funding. The assessment of charters and profiles is intended to help ensure that each TEO that receives government funding will make a contribution to the achievement of the goals of the Tertiary Education Strategy. Having an approved charter and profile is also a prerequisite for access to funding. Annual monitoring of the sector provides information on progress of the TES and highlights any areas that may require further attention as well as providing a broader context for policy development and sector planning processes. Quality assurance in tertiary education 55 Quality assurance of tertiary education in New Zealand is intended to provide a minimum standard for the quality of the learning outcomes for students. It focuses on the systems and processes that support delivery of learning by TEOs. Only those tertiary education courses, qualifications and TEOs that have been quality assured by a quality assurance agency are able to access government funding and/or access to student loans and allowances. There are two quality assurance agencies:
NZQA, and The New Zealand Vice Chancellors’ Committee.
56 One of the mechanisms for managing quality is the New Zealand Register of Quality Assured Qualifications. The Register imposes certain common standards on qualification development and nomenclature: each qualification has an assigned level (1 to 10); an outcome statement for the whole qualification and each of its components; a credit value (120 credits is equivalent to one year of full-time study); and a title consistent with other qualifications on the Register. The details of assuring and improving the quality of tertiary education in New Zealand are contained in Chapter 9. Steering the tertiary education system 57 The TEC’s role includes implementing the Tertiary Education Strategy. The TEC is also responsible for allocating funding to TEOs. The key instruments that the TEC uses in managing these responsibilities are charters and profiles. 58 Charters are public documents that illustrate an organisation’s contribution to the TES and to the wider tertiary education system and its stakeholders. They are high-level governance documents providing a broad description of the TEO’s mission and role in the tertiary education system. The charter indicates the type of education and other activities that the TEO will position itself to deliver and the organisation’s engagement with other TEOs and/or stakeholders. Charter approval is the first prerequisite for eligibility for public funding for quality-assured TEOs. Charters are approved by the Minister, on the advice of the TEC and, in the case of TEIs, the MoE. 59 The annual profile describes in greater detail the TEO’s strategic direction, activities, policies and performance targets for the next three years. Profiles have to be submitted each year by all publicly-funded TEOs. The TEC is responsible for assessing profiles and, if necessary, suggesting and discussing changes in the profile. When it is satisfied, on the evidence in the profile, that the TEO is making a suitable contribution to the TES, the TEC will approve the profile – thereby providing access to funding. The profile contributes to a more detailed map of the tertiary education sector and establishes more consistent monitoring, reporting, and accountability for publicly-funded organisations. 60 The TEC uses an assessment of the strategic relevance of courses and qualifications to determine which TEOs gain approval for access to public funding or to pursue particular
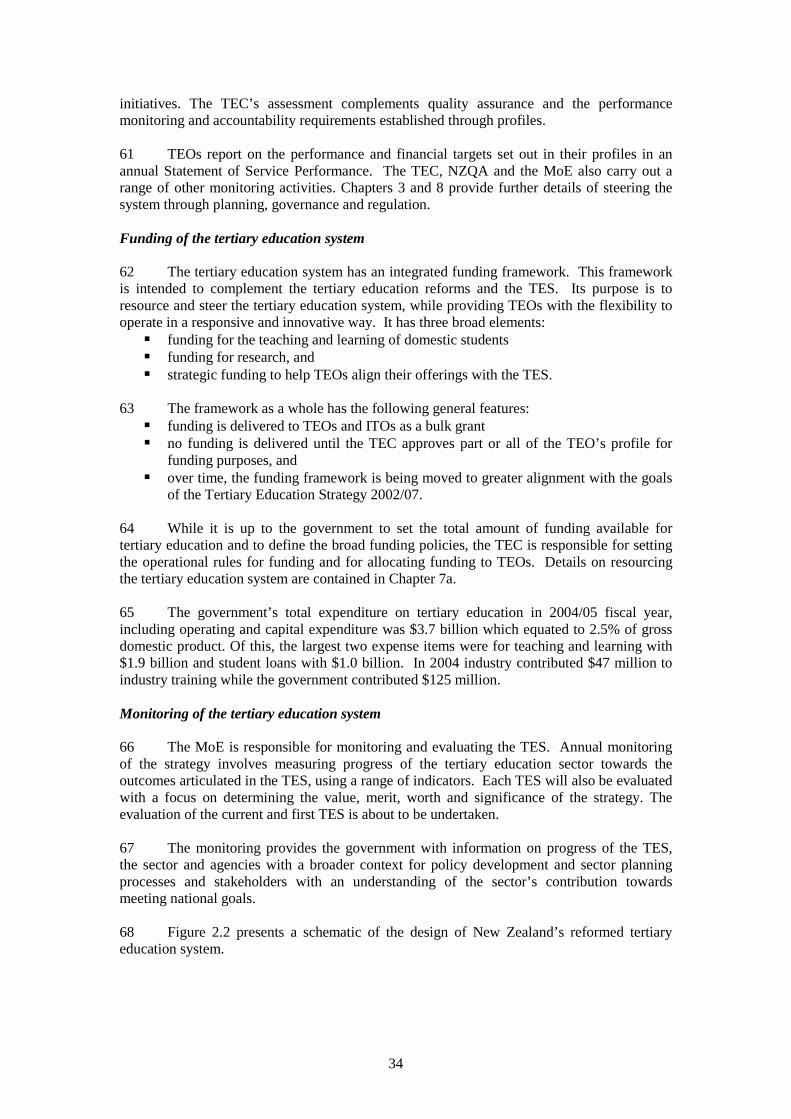
34
initiatives. The TEC’s assessment complements quality assurance and the performance monitoring and accountability requirements established through profiles. 61 TEOs report on the performance and financial targets set out in their profiles in an annual Statement of Service Performance. The TEC, NZQA and the MoE also carry out a range of other monitoring activities. Chapters 3 and 8 provide further details of steering the system through planning, governance and regulation. Funding of the tertiary education system 62 The tertiary education system has an integrated funding framework. This framework is intended to complement the tertiary education reforms and the TES. Its purpose is to resource and steer the tertiary education system, while providing TEOs with the flexibility to operate in a responsive and innovative way. It has three broad elements:
funding for the teaching and learning of domestic students funding for research, and strategic funding to help TEOs align their offerings with the TES.
63 The framework as a whole has the following general features:
funding is delivered to TEOs and ITOs as a bulk grant no funding is delivered until the TEC approves part or all of the TEO’s profile for
funding purposes, and over time, the funding framework is being moved to greater alignment with the goals
of the Tertiary Education Strategy 2002/07. 64 While it is up to the government to set the total amount of funding available for tertiary education and to define the broad funding policies, the TEC is responsible for setting the operational rules for funding and for allocating funding to TEOs. Details on resourcing the tertiary education system are contained in Chapter 7a. 65 The government’s total expenditure on tertiary education in 2004/05 fiscal year, including operating and capital expenditure was $3.7 billion which equated to 2.5% of gross domestic product. Of this, the largest two expense items were for teaching and learning with $1.9 billion and student loans with $1.0 billion. In 2004 industry contributed $47 million to industry training while the government contributed $125 million. Monitoring of the tertiary education system 66 The MoE is responsible for monitoring and evaluating the TES. Annual monitoring of the strategy involves measuring progress of the tertiary education sector towards the outcomes articulated in the TES, using a range of indicators. Each TES will also be evaluated with a focus on determining the value, merit, worth and significance of the strategy. The evaluation of the current and first TES is about to be undertaken. 67 The monitoring provides the government with information on progress of the TES, the sector and agencies with a broader context for policy development and sector planning processes and stakeholders with an understanding of the sector’s contribution towards meeting national goals. 68 Figure 2.2 presents a schematic of the design of New Zealand’s reformed tertiary education system.
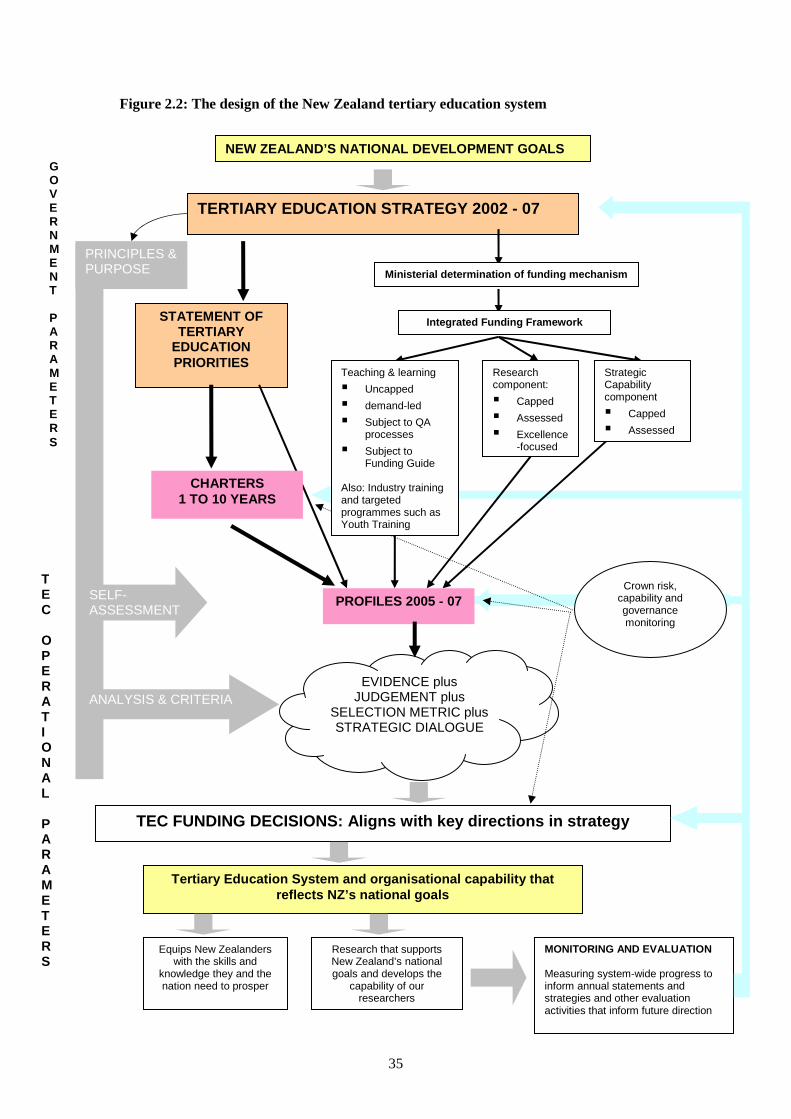
35
SELF-ASSESSMENT
Figure 2.2: The design of the New Zealand tertiary education system
PRINCIPLES & PURPOSE
Research component:
Capped
Assessed
Excellence-focused
TERTIARY EDUCATION STRATEGY 2002 - 07
STATEMENT OF TERTIARY
EDUCATION PRIORITIES
PROFILES 2005 - 07 Crown risk,
capability and governance monitoring
Teaching & learning
Uncapped
demand-led
Subject to QA processes
Subject to Funding Guide
Also: Industry training and targeted programmes such as Youth Training
Strategic Capability component
Capped
Assessed
Integrated Funding Framework
Ministerial determination of funding mechanism
TEC FUNDING DECISIONS: Aligns with key directions in strategy
CHARTERS 1 TO 10 YEARS
ANALYSIS & CRITERIA EVIDENCE plus
JUDGEMENT plus SELECTION METRIC plus STRATEGIC DIALOGUE
GOVERNMENT PARAMETERS
TEC OPERAT IONAL PARAMETERS
Tertiary Education System and organisational capability that reflects NZ’s national goals
Research that supports New Zealand’s national goals and develops the
capability of our researchers
Equips New Zealanders with the skills and
knowledge they and the nation need to prosper
MONITORING AND EVALUATION Measuring system-wide progress to inform annual statements and strategies and other evaluation activities that inform future direction
NEW ZEALAND’S NATIONAL DEVELOPMENT GOALS
36
The New Zealand qualifications system 69 NZQA maintains an overview of qualifications in compulsory and post-compulsory education and training via the New Zealand Register of Quality Assured Qualifications (“the Register”) which provides a comprehensive list of all quality assured qualifications in New Zealand. The key purposes of the Register are:
To identify clearly all quality assured qualifications in New Zealand; To ensure that all qualifications have a purpose and relation to each other that
students and the public can understand; To maintain and enhance learners’ ability to transfer credit by the establishment of a
common system of credit; and To enhance and build on the international recognition of New Zealand qualifications.
70 The Register has ten levels and comprises qualifications that are registered in accordance with its definitions. Level 1 is the least complex and 10 the most. Levels depend on the complexity of learning. They do not equate to ‘years spent learning’ but reflect the content of the qualification. Figure 2.3 shows how the levels of the Register relate to the levels of the New Zealand education system. Figure 2.3: The levels of the New Zealand education system
71 The range of qualifications offered by the tertiary sector has increased significantly over recent years and the diversity of qualifications on the Register reflects those developed for new or growing industries as well as the growth in those designed to develop generic competencies that can be applied in a variety of settings. In 2003 there were 6,800 quality assured qualifications on the Register, of which around two-thrds were at certificate level, 12% at diploma level, 12% at bachelors degree level and 10% at postgraduate level.
37
Major changes in tertiary education over the last ten years 72 The current arrangements in the tertiary education system need to be seen in the context of an evolution that has been taking place over two decades. The last ten years has seen the New Zealand tertiary education system move from a devolved, self-managing, demand-driven and competitive one, with blurred institutional boundaries, towards a more connected and collaborative network of provision aligned to key national development goals, as articulated in the TES. 73 During this time there have been major adjustments to all of the regulatory and resourcing levers. The new paradigm, as depicted in Figure 2.2 above, requires more complicated and sophisticated relationships and interactions between government agencies, within and between education sectors, between tertiary education and other areas of social and economic policy and between government and the sectors. 74 The demand-driven system of the 1990s was responsive to student choice and community demands and it did lead to significant increases in participation, innovation and a better qualified population. But in a period of technological change and economic vulnerability, there was a realisation that the lack of steering and powers of intervention by central government could put New Zealand’s economic development at risk. Also, as the 1990s went on, there was greater recognition of the need for quality of provision and research excellence. At an institutional level, TEOs operated in a business-like manner and competed for enrolments. There was a blurring of the distinctive characteristics of different types of institutions, with colleges and ITPs offering degrees and postgraduate qualifications while some universities expanded their certificate and diploma offerings. Despite the growth in enrolments, some institutions did not build their financial strength. 75 The most significant reforms of the sector in the last ten years resulted from the work of the Tertiary Education Advisory Committee (TEAC), established by the government in 2000 to provide advice on the long term strategic direction for the tertiary sector. The reforms that resulted seek to shift the tertiary education sector into a strategic environment that connects with the government’s national social and economic goals. 76 Some parts of the sector have commented that the amount of change management and adjustment that is required of the sector and the agencies has been underestimated and that implementation of the current reforms has been affected by an “overhang” of previous reforms. In particular, the effects of changes made in 1998/9 to fund PTEs on the same basis as TEIs and to remove the cap on the number of places to be funded changed the dynamics of the system in a fundamental way; it has been difficult to separate the effects of those changes from the current reforms. 77 Annex 3 contains a chronological summary of the major policy reforms that have occurred in the New Zealand tertiary education system since 1989. 78 Notable features of the tertiary education system over the last ten years, which are discussed in the chapters ahead, have included:
The significant growth in participation in the tertiary education system; The growth of the private contribution to the cost of tertiary education; The blurring of institutional boundaries as some TEOs sougtht to extend their
offerings beyond traditional roles; An emphasis on addressing education issues for Māori; Linking tertiary provision to workplace learning through the industry training
strategy;

38
The growth of international education, which has now become a significant export industry;
The development of the New Zealand Register of Quality Assured Qualifications that sets out the outcomes sought in each qualification and that establishes a common way of describing qualifications, hence facilitating pathways and credit transfer;
The introduction of the TES and its impact on the culture and direction of the sector; The establishment of the Tertiary Education Commission; The new demands in the workplace for higher levels of skill, leading to the
development of a new adult student population; Managing the growth of the sector; and The growth of government investment in tertiary education, both in funding for TEOs
and in student support. Priorities for the future 79 The on-going implementation of the TES is the continuing priority for the tertiary education sector. The evidence of the current TES monitoring shows that the TES has had an impact on thinking in the sector but there is still some way to go to achieve the sorts of changes envisaged for the sector and described in paragraph 33 above. 80 In addition, there has been an increased focus over the last two years on ‘value for money’ and a more coordinated approach by agencies to achieve this. Such a focus will see greater attention paid to the following areas:
A more rigorous approach to quality of provision; A more rigorous approach to relevance of provision; Changes to the funding model to improve the balance between quality, relevance and
access, while also ensuring predictability and fiscal susatinability; A more effective overall network of tertiary education provision and research; A more integrated agency approach.

39
CHAPTER 3: THE TERTIARY EDUCATION SYSTEM AND THE LABOUR MARKET
81 A growing economy and a strong increase in demand for labour over recent years has seen the New Zealand labour market tightening and levels of unemployment at a 20-year low. This has affected both the demand for tertiary education and the type of tertiary education required. 82 Until recently, expansion in the availability of jobs has been absorbed by rising labour-market participation rates and higher levels of net migration. With low unemployment and levels of net migration easing, however, the capacity of the labour market to increase production through employing more people is now very limited. Labour shortages are at historically high levels. Relationship between demand for and supply of tertiary graduates Labour-market outcomes 83 Census and survey data from Statistics New Zealand and enrolment data from the Ministry of Education enable monitoring of students’ pathways through the tertiary education system and their labour-market outcomes (such as post-study employment destinations and growth in incomes). Through these data sources, it has been possible to explore the relationships between tertiary education and employment. 84 The New Zealand data exhibit the relationship between people’s education attainment, and their employment and income outcomes. Using formal educational qualifications as a proxy for skills, it is possible to make inferences about the relationship between the demand for skills and the supply of skills in the labour market. 85 In recent years, as a result of increasing participation in tertiary education, New Zealand has experienced significant growth in tertiary graduates during a time of decreasing unemployment. 86 The unemployment rates for all those looking for work have significantly decreased – regardless of their level of qualifications. For example, Figure 3.1 shows that the gap between the unemployment rate for those with vocational qualifications and those with degree-level qualifications (which was significant in the early 1990s) had disappeared by 2004. The unemployment rate for those with degrees or postgraduate qualifications, however, has been more stable than for those with other qualifications and especially for those with no qualifications. 87 Research shows that the demand for tertiary education graduates in New Zealand has been maintained in the face of increasing supply. On average, the labour-market rates of return for tertiary graduates have been relatively constant for all levels of qualification over recent years (Maani, 1999; Penny, 2005). Other research (Dillingham, 2002) notes that real incomes have been growing despite an increasing supply of graduates. This indicates a strong relative demand for higher-skilled workers, and also a greater increase in demand for higher-skilled workers compared with that for the lesser-skilled. Overall, this suggests a great deal of upskilling in New Zealand recently.
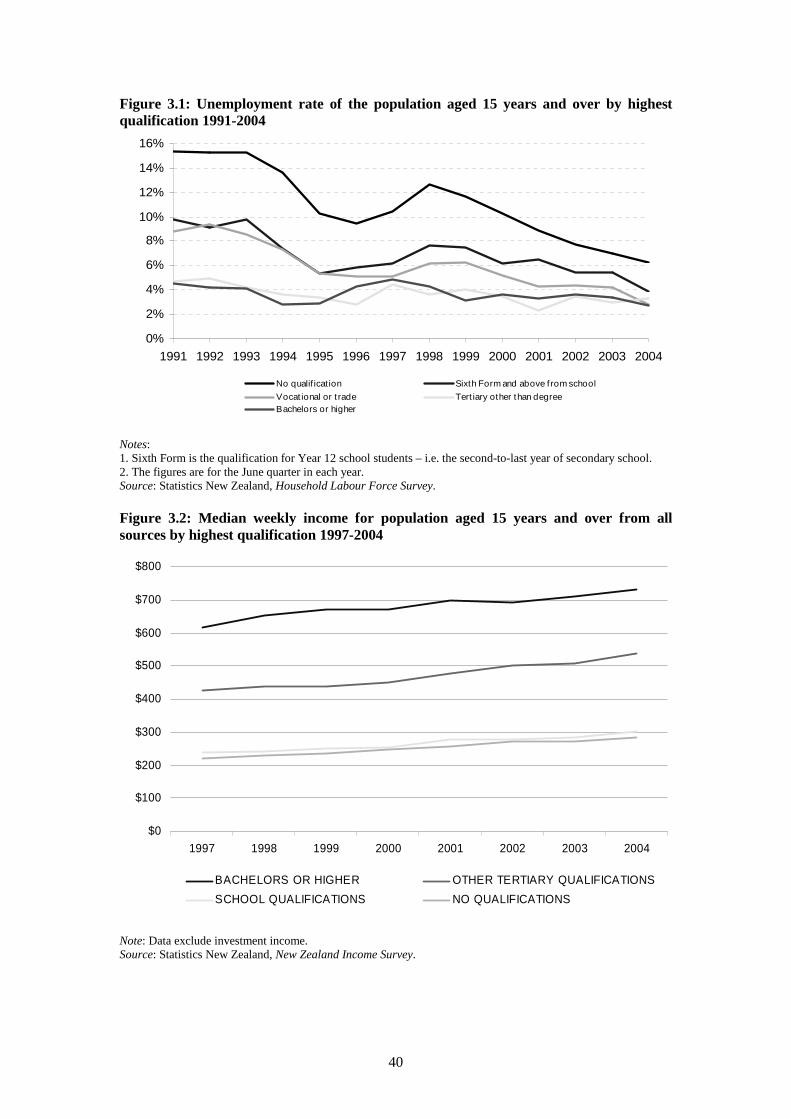
40
Figure 3.1: Unemployment rate of the population aged 15 years and over by highest qualification 1991-2004
0%
2%
4%
6%
8%
10%
12%
14%
16%
1991 1992 1993 1994 1995 1996 1997 1998 1999 2000 2001 2002 2003 2004
No qualif ication Sixth Form and above f rom school
Vocat ional or t rade Tert iary other than degreeBachelors or higher
Notes: 1. Sixth Form is the qualification for Year 12 school students – i.e. the second-to-last year of secondary school. 2. The figures are for the June quarter in each year. Source: Statistics New Zealand, Household Labour Force Survey. Figure 3.2: Median weekly income for population aged 15 years and over from all sources by highest qualification 1997-2004
$0
$100
$200
$300
$400
$500
$600
$700
$800
1997 1998 1999 2000 2001 2002 2003 2004
BACHELORS OR HIGHER OTHER TERTIARY QUALIFICATIONS
SCHOOL QUALIFICATIONS NO QUALIFICATIONS
Note: Data exclude investment income. Source: Statistics New Zealand, New Zealand Income Survey.
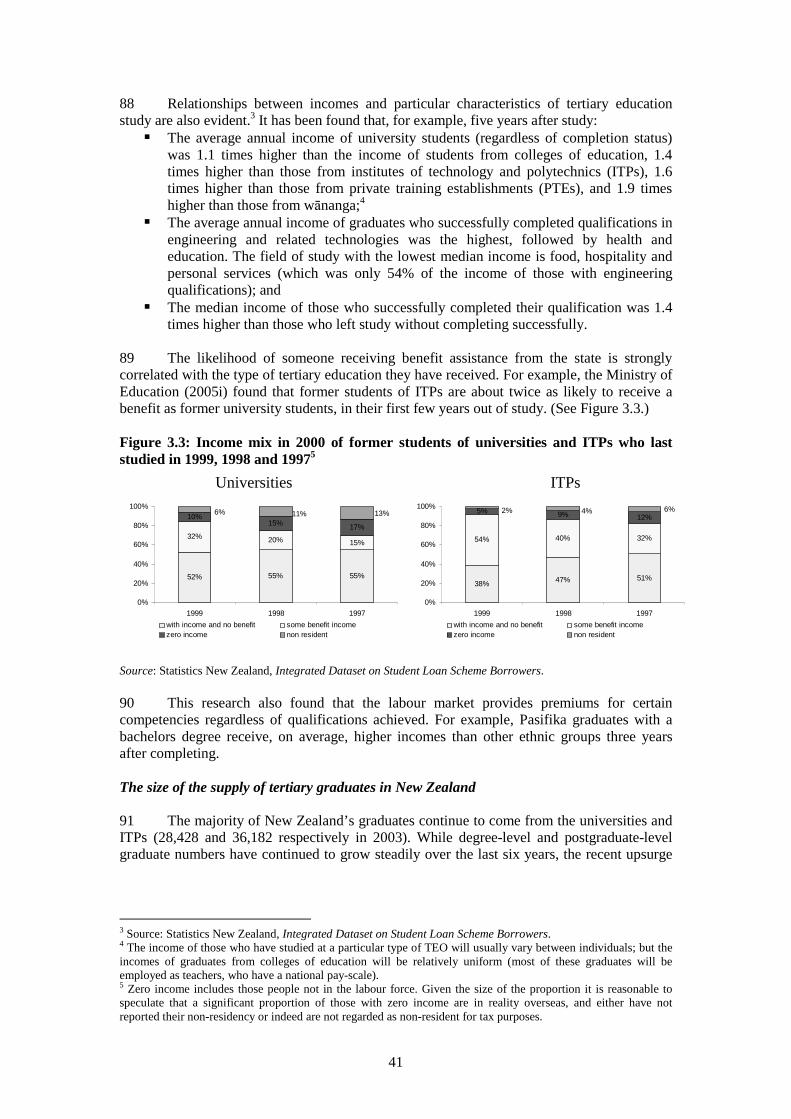
41
88 Relationships between incomes and particular characteristics of tertiary education study are also evident.3 It has been found that, for example, five years after study:
The average annual income of university students (regardless of completion status) was 1.1 times higher than the income of students from colleges of education, 1.4 times higher than those from institutes of technology and polytechnics (ITPs), 1.6 times higher than those from private training establishments (PTEs), and 1.9 times higher than those from wānanga;4
The average annual income of graduates who successfully completed qualifications in engineering and related technologies was the highest, followed by health and education. The field of study with the lowest median income is food, hospitality and personal services (which was only 54% of the income of those with engineering qualifications); and
The median income of those who successfully completed their qualification was 1.4 times higher than those who left study without completing successfully.
89 The likelihood of someone receiving benefit assistance from the state is strongly correlated with the type of tertiary education they have received. For example, the Ministry of Education (2005i) found that former students of ITPs are about twice as likely to receive a benefit as former university students, in their first few years out of study. (See Figure 3.3.) Figure 3.3: Income mix in 2000 of former students of universities and ITPs who last studied in 1999, 1998 and 19975
Universities ITPs
52% 55% 55%
32% 20% 15%
10%15% 17%
13%11%6%
0%
20%
40%
60%
80%
100%
1999 1998 1997
with income and no benefit some benefit incomezero income non resident
38% 47% 51%
54% 40% 32%
5% 9% 12%6%4%2%
0%
20%
40%
60%
80%
100%
1999 1998 1997
with income and no benefit some benefit incomezero income non resident
Source: Statistics New Zealand, Integrated Dataset on Student Loan Scheme Borrowers. 90 This research also found that the labour market provides premiums for certain competencies regardless of qualifications achieved. For example, Pasifika graduates with a bachelors degree receive, on average, higher incomes than other ethnic groups three years after completing. The size of the supply of tertiary graduates in New Zealand 91 The majority of New Zealand’s graduates continue to come from the universities and ITPs (28,428 and 36,182 respectively in 2003). While degree-level and postgraduate-level graduate numbers have continued to grow steadily over the last six years, the recent upsurge
3 Source: Statistics New Zealand, Integrated Dataset on Student Loan Scheme Borrowers. 4 The income of those who have studied at a particular type of TEO will usually vary between individuals; but the incomes of graduates from colleges of education will be relatively uniform (most of these graduates will be employed as teachers, who have a national pay-scale). 5 Zero income includes those people not in the labour force. Given the size of the proportion it is reasonable to speculate that a significant proportion of those with zero income are in reality overseas, and either have not reported their non-residency or indeed are not regarded as non-resident for tax purposes.
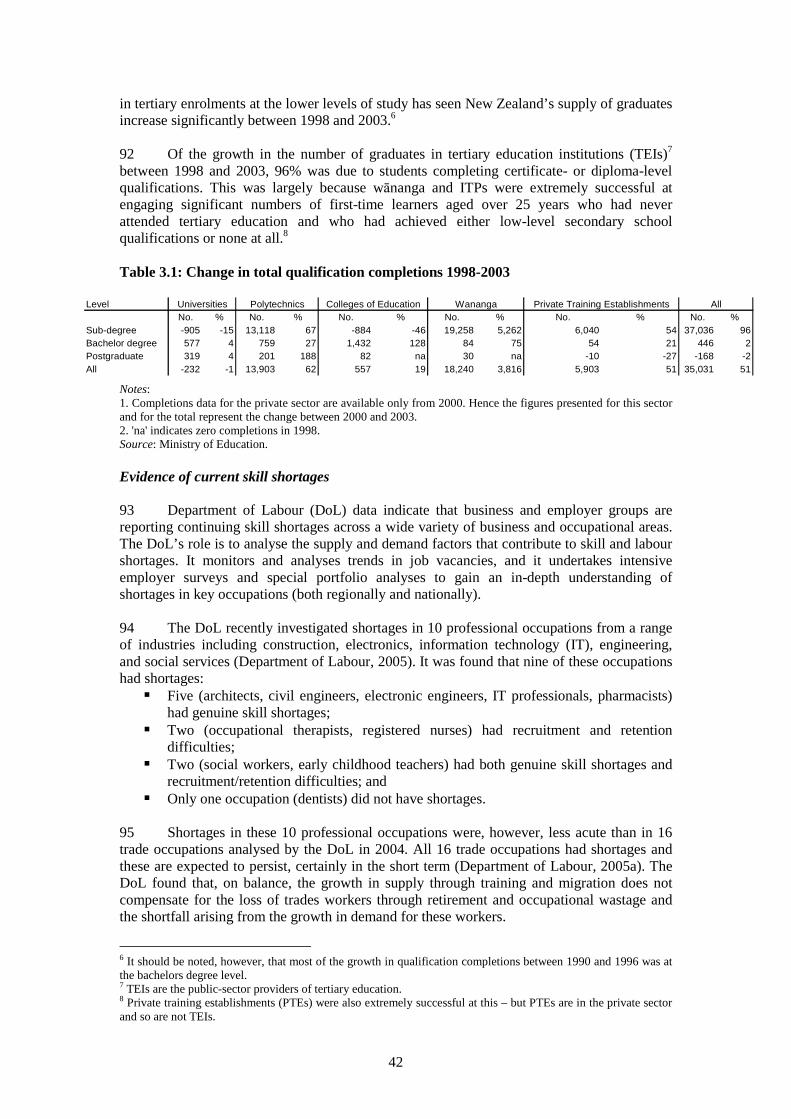
42
in tertiary enrolments at the lower levels of study has seen New Zealand’s supply of graduates increase significantly between 1998 and 2003.6 92 Of the growth in the number of graduates in tertiary education institutions (TEIs)7 between 1998 and 2003, 96% was due to students completing certificate- or diploma-level qualifications. This was largely because wānanga and ITPs were extremely successful at engaging significant numbers of first-time learners aged over 25 years who had never attended tertiary education and who had achieved either low-level secondary school qualifications or none at all.8 Table 3.1: Change in total qualification completions 1998-2003
LevelNo. % No. % No. % No. % No. % No. %
Sub-degree -905 -15 13,118 67 -884 -46 19,258 5,262 6,040 54 37,036 96Bachelor degree 577 4 759 27 1,432 128 84 75 54 21 446 2Postgraduate 319 4 201 188 82 na 30 na -10 -27 -168 -2All -232 -1 13,903 62 557 19 18,240 3,816 5,903 51 35,031 51
Universities Polytechnics Colleges of Education Wananga Private Training Establishments All
Notes: 1. Completions data for the private sector are available only from 2000. Hence the figures presented for this sector and for the total represent the change between 2000 and 2003. 2. 'na' indicates zero completions in 1998. Source: Ministry of Education. Evidence of current skill shortages 93 Department of Labour (DoL) data indicate that business and employer groups are reporting continuing skill shortages across a wide variety of business and occupational areas. The DoL’s role is to analyse the supply and demand factors that contribute to skill and labour shortages. It monitors and analyses trends in job vacancies, and it undertakes intensive employer surveys and special portfolio analyses to gain an in-depth understanding of shortages in key occupations (both regionally and nationally). 94 The DoL recently investigated shortages in 10 professional occupations from a range of industries including construction, electronics, information technology (IT), engineering, and social services (Department of Labour, 2005). It was found that nine of these occupations had shortages:
Five (architects, civil engineers, electronic engineers, IT professionals, pharmacists) had genuine skill shortages;
Two (occupational therapists, registered nurses) had recruitment and retention difficulties;
Two (social workers, early childhood teachers) had both genuine skill shortages and recruitment/retention difficulties; and
Only one occupation (dentists) did not have shortages. 95 Shortages in these 10 professional occupations were, however, less acute than in 16 trade occupations analysed by the DoL in 2004. All 16 trade occupations had shortages and these are expected to persist, certainly in the short term (Department of Labour, 2005a). The DoL found that, on balance, the growth in supply through training and migration does not compensate for the loss of trades workers through retirement and occupational wastage and the shortfall arising from the growth in demand for these workers.
6 It should be noted, however, that most of the growth in qualification completions between 1990 and 1996 was at the bachelors degree level. 7 TEIs are the public-sector providers of tertiary education. 8 Private training establishments (PTEs) were also extremely successful at this – but PTEs are in the private sector and so are not TEIs.
43
Responding to labour-market demands Setting the goals and priorities 96 The DoL provides the government with strategic advice and information on labour market needs – and it provides key input into the design of the Tertiary Education Strategy (TES). 97 The creation of the Tertiary Education Commission (TEC), whose primary function is to implement the TES, has provided an agency that can link the needs of the labour market with the provision of education and training. 98 Combining DoL data with that from other sources, the TEC is building the capability to produce annual ‘portraits’ of tertiary education and training in New Zealand. These portraits are designed to provide not only overviews of tertiary education and training funded by the TEC, but also indicators of possible under- and over-supply in provision (Tertiary Education Commission, 2005a). 99 The current TES articulates the requirement for tertiary education organisations (TEOs)9 to achieve a greater match between their provision of tertiary education programmes and:
The requirements of employers and industries; Current skill needs at the national, regional and local level; and The need to equip all New Zealanders with the foundation skills they require for
employment. 100 These goals are effected through the Statement of Tertiary Education Priorities (STEP), which seeks to balance the immediate short-term priorities of the tertiary education system with the future medium-term requirements of the TES. The ‘skills’ theme of the current STEP is ‘increasing the relevance of skills and knowledge to meet national goals’ – which includes addressing the following priorities:
Current and future workforce needs; Technical and trades skills; Education and health workforce needs; Language, literacy and numeracy across the adult population; and Research relevant to New Zealand’s economic and social priorities.
101 Another priority in the STEP is ‘quality information and analysis’. This seeks better use of sector-wide information by TEOs and stakeholders in decision-making and planning – for example, linking Career Services’ information with labour-market needs to help students, TEOs and employers plan their learning and skills needs. Achieving the goals and priorities 102 Responses to the STEP occur independently of regulation. The TEC gives effect to the STEP’s priorities through profile negotiations with the TEOs. These negotiations are intended to inject regional and national perspectives into funding discussions. 103 At this point in the education reforms, high reliance is placed on the TEOs’ assessment of regional skill needs. Profile negotiations between TEOs and the TEC are not yet systematically informed by sophisticated labour-market information, but this is expected to be developed over time. The TEC has begun undertaking skill-shortage portfolio analyses
9 TEOs comprise both the public-sector TEIs and the private-sector PTEs.
44
that will inform these areas of negotiation – the first of these are in the STEP priority areas of health and teacher education. 104 Readily available evidence is therefore being used by the TEC to steer the sector towards the STEP’s priorities. For example, significant government investment has been made in:
Trades training (to reduce occupational shortages); On-job training and workplace literacy10 (to increase the productivity of those already
in employment); Generic skills, by lifting the general population’s level of education (to ensure
everyone has foundation level learning and is able to move up to higher levels of learning); and
Specialist skills, by identifying postgraduate programmes as areas of national importance (see paragraph 109 below).
Relationships and collaboration 105 A fundamental and all-important principle of New Zealand’s recent tertiary education reforms is that relationships and collaboration between TEOs, the business community and the government are the key to effecting the priorities of the STEP. 106 The TEC’s steering instruments (charters and profiles) are designed to encourage engagement between TEOs and their stakeholders – including the business community. At the local and national level, individual TEOs are required to work closely with their region’s businesses, professional associations, industry training organisations, and local authorities11 to identify skill needs and respond to the future shape of the regional and national workforce. Dialogue between the TEC and TEOs during charter and profile negotiations captures information that informs the development of a regional and network map of provision. 107 A review of profiles for 2005 to 2007 shows that TEOs are building on their relationships with industry and expanding on this activity. For example, universities are focusing primarily on linkages through their professional teaching programmes; and most ITPs are recognising linkages as a core part of their business. However, it is not clear how well all parts of industry are being served, particularly those areas dominated by small business (Ministry of Education 2005a). 108 The TEC also administers specialised funds designed to foster greater engagement between TEOs and business, with the aim of meeting skill needs:
The ITP Business Links Fund provides funding to build the capability of ITPs so that they can establish and maintain effective working relationships with the business sector. Examples of projects using this fund to increase the relevance of provision have included secondments from industry (‘experts in residence’), student work placements, and business involvement in course development.
The Partnerships for Excellence framework aims to increase private-sector investment in tertiary education and thus foster better linkages between TEOs, industry and business. For example, Massey University and Lincoln University, in partnership with key agricultural groups, have undertaken a project to build human
10 The 1996 International Adult Literacy Survey (IALS) found that around 20% of adult New Zealanders had very poor functional literacy skills. 11 The Local Government Act 2002 ensures a link between local authority planning and tertiary education. A good example of this is the Auckland Regional Economic Development Strategy (AREDS). AREDS is based on a widespread partnership across the region's communities and its purpose is define a clear economic direction for the Auckland region's future. All of the major TEOs in the greater Auckland region are partners in AREDS. One of its projects, ‘Development of a skilled responsive labour force’, aims to develop skills strategies for particular industries; TEC funding has been sought for it.
45
capacity and capability in agriculture. The project is a response to the need (identified by the agricultural industry) to provide the next generation of leaders who will take New Zealand’s primary industries into a new phase of productivity improvement and export-led growth.
The Innovation Development Fund includes the aim of helping TEOs align with and deliver on the TES and national goals.
The Quality Reinvestment Programme supports ITPs and wānanga in aligning their certificate and diploma courses with the STEP and in building up a network of high-quality and relevant provision that meets the needs of learners, employers, and their communities.
109 The tertiary education sector also has an important role in particular labour-market policy frameworks:
The TEC’s Growth and Innovation Pilot Initiatives (Growth Pilots) Fund helps build the capability of TEOs to collaborate with business in the design, information and communication sector, the technology sector, and the biotechnology sector. These three sectors have been targeted as part of the government’s Growth and Innovation Framework (GIF) to support the development of these sectors in their own right, and to enhance the growth prospects across New Zealand’s wider economic base. For example, ICT in Canterbury, which involves a consortium of TEOs and enterprises from the Canterbury region, aims to identify the current and future skill demands of the ICT (information, communications and technology) sector in Canterbury and work to better align education provision, promotional efforts and industry aspirations.
The government’s Sector Engagement Framework aims to facilitate growth in key clusters of non-GIF industries. The first initiative under this framework is a taskforce for the food and beverages sector, which is one of the country’s fastest-growing sectors and which needs a more skilled workforce to support the shift towards high-value products.
Programme development 110 Mechanisms exist to influence TEO programme development so that students of vocationally oriented qualifications acquire the skills relevant for the labour market:
Curriculum development is influenced by the objectives and priorities of the TES and the STEP. For example, key work and life competencies are being built into specialist and generalist teaching programmes at all levels in order to increase employers’, professional bodies’ and students’ confidence in the quality and relevance of qualifications (Ministry of Education, 2004c).
Curriculum development is influenced by relevant industrial and professional communities. All courses leading to approved and accredited qualifications must have stated aims, learning outcomes, nomenclature, content, and structure that are acceptable to the relevant industries and professions (New Zealand Qualifications Authority, 2005). Where a course is a recognised or required component of professional registration, the professional body will have specific requirements relating to its content and quality. To assure themselves on these matters, many of these professional bodies stipulate on-site monitoring and periodic review as preconditions for such courses.
Information on labour-market outcomes captured through graduate-destination surveys can also influence course development in TEOs.
46
Provision of effective information and pathways 111 Effective information, advice and guidance on careers provides an important link between education and the requirements of the labour market. The Crown agency Career Services supports tertiary education by providing services designed to help students make informed career choices. It also produces information on trends within the labour market and within education, and works closely with industry, employment and education organisations. A current initiative, Designing Careers, is piloting the concept of individual learning and career plans for all Year 10 students, and for selected ‘at risk’ students in Years 11 to 13.12 112 Larger TEOs also offer specialised career-guidance to students – from the exploration of career ideas and the career implications of subject choices, to details of specific jobs, specialised postgraduate courses, employer profiles and job-searching techniques. Graduate-destination surveys provide a valuable source of information for TEOs on labour-market outcomes. Both the New Zealand Vice Chancellors’ Committee (NZVCC) and Institute of Technology and Polytechnics New Zealand (ITPNZ) undertake periodic surveys of graduate destinations for their member TEOs. 113 In addition, the government funds the National Secondary Tertiary Curriculum Alignment Project to establish processes for curriculum alignment between secondary schools and local ITPs in disciplines commonly taught under the ‘vocational’ umbrella. The intended outcomes include improved student preparedness for tertiary study and more-informed career choices. Better alignment may also help increase the presence of traditionally under-represented groups in tertiary study. Impact of international market for labour upon the tertiary education system 114 New Zealand, along with other developed countries, faces long-term risks to its economy as a result of an ageing population, the increased demand for skills in the global labour market, and specific skills shortages. These trends are resulting in high demands for skilled workers, and an increase in their mobility (Department of Labour, 2002). 115 The interaction of the international labour market with education and training is complex. Many immigrants bring with them high-level education and skills obtained at no cost to New Zealand, while skilled emigrating New Zealanders use their publicly funded training elsewhere. 116 Contrary to popular belief, research indicates that New Zealand experiences more of a ‘brain exchange’ than the often-talked-about ‘brain drain’ (Glass and Choy, 2001). 13Immigrants tend to be more skilled than emigrants, and more skilled than the general population. Because the open trans-Tasman labour market makes it easy for New Zealanders to work in Australia, New Zealand consistently loses citizens to its larger neighbour – but those who move to Australia are representative of New Zealand’s general population; they are not just the highest skilled. 117 To help counter New Zealand’s skill shortages, a new Skilled Migrant Category was introduced in 2003. This is an attempt to ensure the talents and skills of new migrants match New Zealand’s opportunities, and places more control in New Zealand’s hands by allowing the Immigration Service to invite only those migrants who have the most to offer. 118 While monitoring of skills shortages and analyses of skill needs is undertaken by government agencies, there are limited policy levers for encouraging New Zealand citizens to
12 In New Zealand, the first year at secondary school is normally Year 9; the final year is normally Year 13. 13 Student groups dispute the ‘brain exchange’ and claim that a ‘brain drain’ has been occurring.

47
remain within the country or for attracting skilled immigrants – other than making the country a more attractive place to work and live. 119 Several education policy initiatives have been designed to encourage New Zealand graduands and top international students to stay in New Zealand:
Interest-free student loans for borrowers who stay in New Zealand after they’ve finished study;
Bonded scholarships for undergraduate and postgraduate students who stay and work in New Zealand post study (current scholarships are targeted at high achievers, students from low socio-economic backgrounds, and specialised areas such as teaching training);
Post-doctoral fellowships for New Zealanders who have completed a period of research overseas after completing their doctoral degree and who wish to be employed in the New Zealand science, technology or engineering sectors;
Financial incentives for repatriating New Zealand school teachers from overseas to teach in areas of recognised shortage;
Significant increases in the intern grants for doctor trainees; Other collaborative scholarships and fellowships that link TEOs and research
institutes with private companies and that expose students and post-doctoral researchers to industrial and commercial environments (which creates research and development benefits for businesses, and employment opportunities for the participants);
Recent policies that ease the costs of tuition for students by curbing the escalation of tuition fees, increasing the numbers of students who are eligible for student allowances, and amending the Student Loan Scheme to encourage students to stay in New Zealand; and
Changes to New Zealand’s immigration student policy to allow (from July 2005) six-month work permits for international students who have the skills and talent that New Zealand needs.
48
CHAPTER 4: THE REGIONAL ROLE OF TERTIARY EDUCATION Introduction 120 New Zealand has some four million people distributed through a country 1,600 kilometres in length. The country has a low population density. The consequence for tertiary education of the dispersed population has been the evolution of an extensive national network of provision by public tertiary education institutions (TEIs). 121 No new TEI has been created in the last 25 years, although there have been new campuses in some regions. The development by Massey University of a campus at Albany near Auckland is probably the biggest such development. Over the last 15 years, there have been some redefinitions of institutions - rather than the creation of new institutions. For instance, the three public wānanga, which had previously existed but in a different legal form, became TEIs. Lincoln College, one of the country’s oldest institutions, became Lincoln University in 1990. More recently, the Auckland University of Technology was formed from an institute of technology and polytechnic (ITP) of long-standing. There have been some transfers of programme provision between existing TEIs but no total withdrawal of provision from a region. More recently, TEIs in some of the regions have moved away from focusing all of their provision on ‘home’ campuses; there has been a move to distributed access to learning using flexible or e-enabled delivery. This approach to delivery has also enabled some TEIs to deliver outside their previous regions. 122 Private training establishments (PTEs) have developed to complement the provision of the public sector. PTEs have tended to be focussed on a particular locality14, with a relatively narrow qualification range. For a period, some PTEs competed with TEIs – especially with ITPs. The specialised tuition range of PTEs, their use of technology and their capital structure have often led to better cost structures than public providers. Computer graphics and trades training are examples of areas of study where PTEs have succeeded and now complement the pattern of provision offered by public TEIs. There are also some alliances between TEIs and PTEs using sub-contracting arrangements to achieve complementarity; for instance, Aoraki Polytechnic and Agribusiness Ltd have worked together in agricultural training. To some extent, this sort of collaboration has been a response to the low population density and the consequent need to deal with problems of scale of provision. 123 The concept of a ‘network of provision’ has been thought of in the past as referring to the offering of a core set of qualifications throughout the country, with significant provision in provincial areas. More recently, as the tertiary education reforms have sharpened focus on the connections between tertiary education organisations and their communities, the idea of a network of provision has come to have elements of active partnership by institutions in regional development. Meaning of ‘Region’ 124 In New Zealand, the term ‘regional’ means something different than in many countries. 125 In general use, the word ‘region’ has tended to reflect the former provincial government regions (although regional government was abolished in favour of a unitary approach in 1876). Five of New Zealand’s eight universities, however, have their origins in the period of the provincial governments. The South Island universities each received
14 There are some exceptions to this general observation. For instance, the Bible College of New Zealand has campuses in many towns, while some PTEs in fields such as design and tourism operate in several centres.
49
significant land grants from provincial governments and this origin may have helped build relationships between those institutions and their communities. 126 Until around 1990, governance for economic development in New Zealand was relatively decentralised (Killerby et al, 2004). Since then, there has been a mix of bottom-up and top-down initiatives which have increased the variety of meanings of the term ‘regional government’. Nationally, there are some 74 territorial authorities (city or district councils established under the Local Government Act). This total includes 16 regional councils, four of which are unitary authorities – that is they are both city or district councils and regional councils – while the other 12 co-exist alongside city or district councils and have responsibility for such matters as environmental planning and management. Overlaying the network of territorial authorities are 26 economic development regions established by the Ministry of Economic Development over the last five years. 127 In the tertiary education sector, the word ‘regional’ has most often been used to describe ITPs which are outside the main urban areas and are in regions with no universities. That said, all TEIs have a local or regional role and linkages, a connection reinforced by the expectation that TEI profiles will provide evidence of active engagement between the TEI and its regional communities. Most TEIs also have multi-regional or supra-regional roles in some specialisations or some qualifications. Thus, a small ITP such as Tai Poutini Polytechnic, based in Greymouth, has campuses outside its region in Auckland and Christchurch, in addition to having peripatetic courses such as scaffolding or rope-rigging which operate around the country according to demand. 128 Lincoln University is located in a small village outside Christchurch but provides a range of qualifications15 which attract students from around New Zealand. In addition, international students accounted for 51% of Lincoln’s student load in 2004. Similarly, the University of Otago has campuses in Auckland, Christchurch and Wellington, in addition to its base in Dunedin. The University of Otago also makes some of its programmes available in Invercargill. Massey University has the largest university network with significant campuses in Palmerston North, Wellington and Auckland in addition to extensive distance delivery capability. Te Wananga o Aotearoa has 11 campuses in the North Island and a total of 35 delivery sites across the country. 129 In fact, few TEIs have an exclusive focus on their home region. Only Northland Polytechnic is currently focussed exclusively on its region, drawing some 75% of its students from that area. The Regional role of Universities 130 Over the last two decades, universities in New Zealand have worked at improving the breadth and depth of their relationships with their regions. This trend has coincided with increasing interest in regional development, particularly economic development, by the regions. The increased interest in regional development is expressed both by local government and by private regional organisations and industries. A key part of the regional interest has been the development of technology commercialisation, technology transfer and entrepreneurial support activities close to TEIs. For example, in Christchurch there is a technology incubator unit16, the Canterbury Innovation Incubator Ltd, owned by the University of Canterbury, Lincoln University, Christchurch Polytechnic Institute of Technology, Orion Ltd17 and the Canterbury Development Corporation.
15 Particularly in natural resources. 16 Refer to: www.cii.co.nz/home.html 17 An electricity lines company owned by the local authorities in the area.
50
The commercialisation of the work of universities 131 The commercial development of the research of the universities is part of the move to intensify the regional connections of the universities18. Auckland UniServices Ltd, the commercialisation, research and development and consulting arm of the University of Auckland, generates annual revenues of $70 million (Auckland UniServices Ltd, 2005). It employs over 500 staff and is the biggest organisation commercialising university research in Australia or New Zealand. In 2004, UniServices was responsible for 40 patents and three start-up companies. 132 Commercialisation often requires substantial investment. The freedom of TEIs to make investments is prescribed in the Public Finance Act 2004 and the Education Act 1989. Investment in commercial entities by TEIs is limited to educational purposes only. The current legislative provisions allow TEIs to invest in public securities but are silent on investment in private securities, equity (shares of companies) or other instruments such as derivatives as part of intellectual property commercialisation activities. As a result, institutions may seek other approaches to commercialisation - for instance, royalty agreements. 133 TEIs have major controlling interests in some 90 registered companies (subsidiaries) and trusts. Some of these subsidiaries are for educational purposes such as provision of services to students whilst others have an educational as well as a commercial focus. Commercial focus can include consulting work undertaken by staff for industry as well as commercialisation of research and intellectual property. 134 The government’s Growth and Innovation Framework encourages those TEIs with demonstrable levels of financial and commercial capability to engage in activities that are likely to lead to a positive outcome for economic development and innovation. 135 Some universities such as the Universities of Auckland and Otago earn substantial revenue through commercial activity. In 2004, the University of Auckland had research and other income of almost $200 million and the University of Otago $130 million. As a proportion of income the University of Otago and Lincoln University are the highest with 34% and 29% respectively. Regional economic impact 136 The University of Auckland and the University of Otago regularly review the economic impact of their activities on their regions. The University of Otago has its main campus in Dunedin which has a population of some 110,000 people. Its 2004 review reports (University of Otago Planning Support and Funding Office, 2005):
Total enrolments of 17,500 equivalent full-time students (EFTS) including nearly 2,000 international students.
80% of first-year students came from outside the city of Dunedin, with some 68% from beyond the Otago/Southland region. Around 40% of Otago’s students came from the North Island. Some of the students come for specialist courses but many because of the ‘brand’.
The university employed more than 3,000 full-time equivalent staff in 2004. There was a total economic impact of $1.1 billion. The University of Otago generated
a total value added to the economy of $550 million, and a direct value added of $300 million.
18 There is more information on this topic in Chapter 5 of this report.
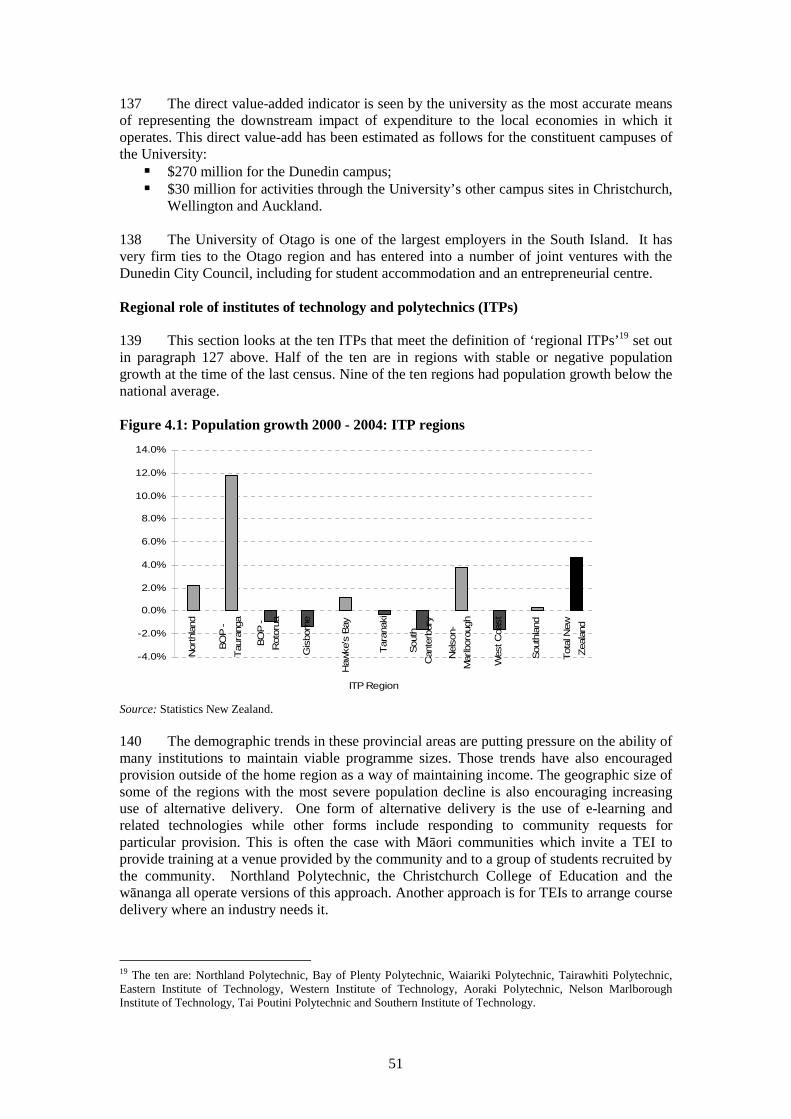
51
137 The direct value-added indicator is seen by the university as the most accurate means of representing the downstream impact of expenditure to the local economies in which it operates. This direct value-add has been estimated as follows for the constituent campuses of the University:
$270 million for the Dunedin campus; $30 million for activities through the University’s other campus sites in Christchurch,
Wellington and Auckland. 138 The University of Otago is one of the largest employers in the South Island. It has very firm ties to the Otago region and has entered into a number of joint ventures with the Dunedin City Council, including for student accommodation and an entrepreneurial centre. Regional role of institutes of technology and polytechnics (ITPs) 139 This section looks at the ten ITPs that meet the definition of ‘regional ITPs’19 set out in paragraph 127 above. Half of the ten are in regions with stable or negative population growth at the time of the last census. Nine of the ten regions had population growth below the national average. Figure 4.1: Population growth 2000 - 2004: ITP regions
-4.0%
-2.0%
0.0%
2.0%
4.0%
6.0%
8.0%
10.0%
12.0%
14.0%
Nor
thla
nd
BO
P -
Tau
rang
a
BO
P -
Rot
orua
Gis
born
e
Haw
ke's
Bay
Tar
anak
i
Sou
th
Can
terb
ury
Nel
son-
Mar
lbor
ough
Wes
t Coa
st
Sou
thla
nd
Tot
al N
ew
Zea
land
ITP Region
Source: Statistics New Zealand. 140 The demographic trends in these provincial areas are putting pressure on the ability of many institutions to maintain viable programme sizes. Those trends have also encouraged provision outside of the home region as a way of maintaining income. The geographic size of some of the regions with the most severe population decline is also encouraging increasing use of alternative delivery. One form of alternative delivery is the use of e-learning and related technologies while other forms include responding to community requests for particular provision. This is often the case with Māori communities which invite a TEI to provide training at a venue provided by the community and to a group of students recruited by the community. Northland Polytechnic, the Christchurch College of Education and the wānanga all operate versions of this approach. Another approach is for TEIs to arrange course delivery where an industry needs it.
19 The ten are: Northland Polytechnic, Bay of Plenty Polytechnic, Waiariki Polytechnic, Tairawhiti Polytechnic, Eastern Institute of Technology, Western Institute of Technology, Aoraki Polytechnic, Nelson Marlborough Institute of Technology, Tai Poutini Polytechnic and Southern Institute of Technology.
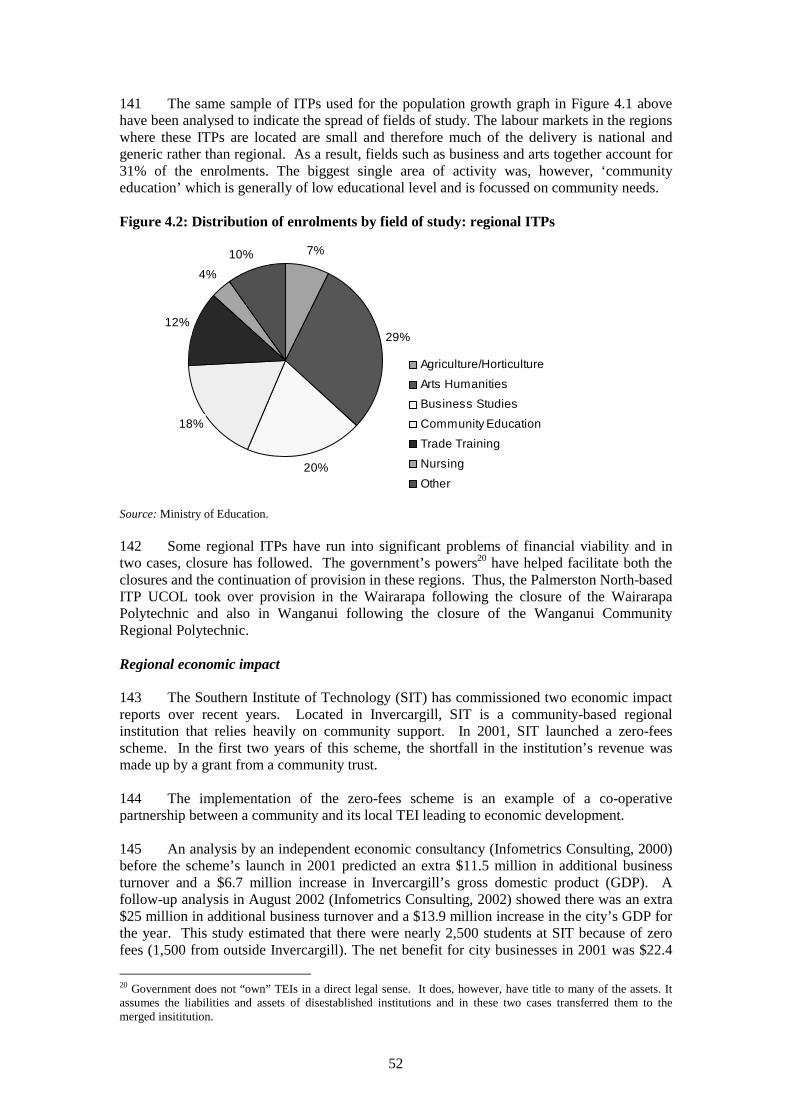
52
141 The same sample of ITPs used for the population growth graph in Figure 4.1 above have been analysed to indicate the spread of fields of study. The labour markets in the regions where these ITPs are located are small and therefore much of the delivery is national and generic rather than regional. As a result, fields such as business and arts together account for 31% of the enrolments. The biggest single area of activity was, however, ‘community education’ which is generally of low educational level and is focussed on community needs. Figure 4.2: Distribution of enrolments by field of study: regional ITPs
7%
29%
20%
18%
12%
4%
10%
Agriculture/Horticulture
Arts Humanities
Business Studies
Community Education
Trade Training
Nursing
Other
Source: Ministry of Education. 142 Some regional ITPs have run into significant problems of financial viability and in two cases, closure has followed. The government’s powers20 have helped facilitate both the closures and the continuation of provision in these regions. Thus, the Palmerston North-based ITP UCOL took over provision in the Wairarapa following the closure of the Wairarapa Polytechnic and also in Wanganui following the closure of the Wanganui Community Regional Polytechnic. Regional economic impact 143 The Southern Institute of Technology (SIT) has commissioned two economic impact reports over recent years. Located in Invercargill, SIT is a community-based regional institution that relies heavily on community support. In 2001, SIT launched a zero-fees scheme. In the first two years of this scheme, the shortfall in the institution’s revenue was made up by a grant from a community trust. 144 The implementation of the zero-fees scheme is an example of a co-operative partnership between a community and its local TEI leading to economic development. 145 An analysis by an independent economic consultancy (Infometrics Consulting, 2000) before the scheme’s launch in 2001 predicted an extra $11.5 million in additional business turnover and a $6.7 million increase in Invercargill’s gross domestic product (GDP). A follow-up analysis in August 2002 (Infometrics Consulting, 2002) showed there was an extra $25 million in additional business turnover and a $13.9 million increase in the city’s GDP for the year. This study estimated that there were nearly 2,500 students at SIT because of zero fees (1,500 from outside Invercargill). The net benefit for city businesses in 2001 was $22.4
20 Government does not “own” TEIs in a direct legal sense. It does, however, have title to many of the assets. It assumes the liabilities and assets of disestablished institutions and in these two cases transferred them to the merged insititution.
53
million. The return on community funding for the scheme was more than $5 for every $1 put into it, compared with the forecast $2 for every $1 estimated for 2001. This was followed by a rise in employment of up 266 full-time equivalent staff positions in 2001. Within Southland, SIT is widely seen as being a key part of the region’s economic renaissance. 146 Economic impact assessment is, inevitably, limited in its scope. The gains in social capital and social wellbeing are harder to ascertain. In addition, the SIT reports do not provide evidence of the quality and mutuality of stakeholder engagement. 147 Using the sample of regional ITPs as in paragraph 139 above, the alignment of individual ITPs with regional development priorities varied. Agriculture/primary industry is the dominant industry cluster in all ten regions, The demand for training is limited, however, so that many ITPs do not deliver agriculture or horticulture qualifications. Fishing is in a similar position. 148 The demographic breakdown of the ten regions varied significantly. All the South Island regions analysed had a high proportion of people with European ethnicity and they had a slightly older population. They all sourced a significant proportion of their students from the North Island. The North Island ITPs, by contrast, sourced a greater proportion of their students from their ‘home’ regions or nearby areas. 149 As with the universities cited, the regional impact of ITPs is becoming more diffuse. Interestingly all but one of the ten ITPs had multiple campuses. In addition, five have campuses (or significant collaborations with PTEs) outside their ‘local’ region. The Reforms - Charters and Profiles, the Tertiary Education Commission and Strategic Development Funding 150 For the last 15 years, all TEIs have been required to have charters. Since the 2002/03 tertiary education reforms, the charter specification has changed, with charters now expressing the broad strategic goals of tertiary education organisations and articulating how those goals are aligned to the tertiary education strategy. Complementing charters are profiles that identify how the organisation is intending to achieve those charter goals over the next three years. These documents invariably make reference to meeting the needs of regions. They often use words like ‘responsiveness’. ITPs in particular, often include reference to plans to work with communities and employers. Profiles must outline how the organisation will engage with its communities of interest. Although the relevant communities of interest will vary between organisations, the government expects that they will include industry, Māori and Pasifika peoples while also reflecting the character and role of different types of TEOs. 151 Charters and profiles have required tertiary institutions to engage with their communities to determine strategic priorities and direction. The intention is to provide some right for stakeholders to be involved in such key issues. All publicly-funded tertiary education organisations are required to report on the consultation process adopted. Practice has varied, however and there have been some difficulties in universities in particular determining their communities. 152 The establishment in 2003 of the Tertiary Education Commission (TEC) was intended to increase the level and quality of engagement with stakeholders and hence, regions. In particular, the TEC has the responsibility for managing the charter and profile approval process and thus, for encouraging more meaningful engagement with stakeholders and regions.
54
153 A range of strategic incentive-based funding initiatives was introduced as part of the reforms. Most of these have a regional development slant. They include the following:
The Innovation and Development Fund (IDF) The IDF provides seed funding for proposals for innovative developments in teaching, learning or other aspects of the education offered by tertiary education organisations (TEOs). It seeks to lift TEOs’ ability to improve the operation of the tertiary education system and to increase their alignment with the tertiary education strategy. The IDF has funded such projects as the alignment of secondary school and ITP curricula and a project to upskill the wood manufacturing workforce. Many of the projects funded have a substantial regional dimansion.21
The Growth and Innovation Pilot Initiatives (Growth Pilots) The Growth Pilots help to build the capability of TEOs to underpin the development of the government’s Growth and Innovation Framework’s focus industry sectors. These focus sectors include biotechnology, design, and information and communication technology. These sectors are seen as offering the potential to improve the growth prospects of New Zealand’s wider economic base. The intention of the Growth Pilots is for TEOs to work with businesses to design an approach that will best suit their specific circumstances and capability requirements. Nineteen Growth Pilots have been funded.22 Examples include:
Building a skilled and responsive ICT workforce for Auckland (led by Auckland University of Technology, in association with the Auckland Regional Economic Development Strategy);
Design-led futures (led by Victoria University of Wellington); Entrepreneurship, leadership and economic growth for the animal health
biotechnology industry (led by Massey University). The e-Learning Collaborative development Fund (eCDF)
This initiative provides seed funding for the development of e-learning partnerships. An example is the establishment of a Centre for Maori Innovation and Development by the University of Auckland, and Auckland University of Technology.
Partnerships for Excellence (P4X) P4X provides funding for major capital projects in TEIs that have active private sector involvement. The expectation is that the government’s contribution will be matched on a dollar for dollar basis by the private sector partners. An example is the University of Auckland’s business cshool development. This framework aims to increase private sector investment in tertiary education and thus foster better linkages between tertiary education institutions, industry and business. An example is the Agriculture and Life Sciences Partnership for Excellence, a collaboration between Massey and Lincoln Universities and key agricultural industry groups. The project will build human capacity and capability in agriculture in a way that integrates the research and educational activities of the universities with the requirements of industry.23
ITP Business Links Fund The ITP Business Links Fund, announced in the 2004 Budget, provides funding for ITPs to support their plans for building relationships with businesses in their regions.24
Quality Reinvestment Fund In July 2005, in response to concerns about the extent of growth in some areas of certificate and diploma provision, the government introduced measures aimed at
21 A list of recent IDF approvals can be found at: www.tec.govt.nz/funding/strategic/idf/successful_applicants.htm 22 For a list of the Growth Pilot projects funded to date, see: http://www.tec.govt.nz/funding/strategic/growthpilot/successful_applicants.htm 23 Other P4X approvals are set out at: www.tec.govt.nz/funding/strategic/p4excellence/successful-applicants.htm 24 For a summary of the characteristics of projects funded, refer to Tertiary Education Commission (2005c) Summary of 2005 Funded Projects: The Institutes of Technology and Polytechnics (ITP) Business Links Fund available at: www.tec.govt.nz/downloads/a2z_publications/summary-of-2005-funded-projects.doc
55
improving the quality, relevance and value for money of certificate and diploma level provision. The purpose of these changes is to reposition the mix of certificate and diploma level provision to improve its alignment with the Statement of Tertiary Education Priorities 2005/07 to reflect the needs of learners. The package of changes reduces expenditure in some areas of certificate and diploma education from 2006 and reinvests money in a number of areas including $200 million over five years through a programme of reinvestment. The fund is largely focused on the wānanga and the ITPs. The details of its operation are still being developed.
154 These funds are too new to provide much empirical evidence of regional partnerships producing specific outcomes. Indeed, this lack of data is a more general issue in documenting regional partnerships (Lincoln University, 2003). 155 An Australian report explored the issue of the need for university engagement with regions for creative development. It defined 'good practice' engagement as:
“ …being a relationship involving mutual learning and knowledge exchange, where roles and expectations coincide, and which addresses objectives that are important both locally and institutionally” (Garlick and Pryor, 2002).
156 As in Australia, New Zealand regions and their TEIs are moving towards that goal at different speeds, largely determined by regional awareness and leadership. The various central funds which have been created recently to assist progress are providing some assistance.
56
CHAPTER 5: THE ROLE OF TERTIARY EDUCATION IN RESEARCH AND INNOVATION
157 The advancement of knowledge through research is a core function of the tertiary education system. Tertiary education organisations (TEOs) play a key role in furthering research and innovation in New Zealand, and the tertiary education sector is responsible for the largest share of the country’s research output.25 It also undertakes significant research focused on adapting, transferring and exploiting domestic and international knowledge and technology. 158 In addition, the sector is responsible for most of the training in research – developing advanced research skills for those entering work as well as producing graduates with skills, knowledge and attributes that enable them to contribute to research and innovation in New Zealand. Tertiary education’s contribution to research and innovation 159 The Education Act 1989, which sets out the statutory framework for all tertiary education in New Zealand, states that teaching at degree level and above is to be shaped and informed by research and that universities are to have a major role as providers of research across a wide range of disciplines. The Act describes degrees as ‘primarily taught by those active in research’.26 It also includes in its characterisation of universities, that ‘…their research and teaching are closely interdependent … their teaching is done by people who are active in advancing knowledge … [and] they meet international standards of research’. 27 160 When the Tertiary Education Advisory Commission (2001) suggested a relaxation of the Act’s requirement that degrees be taught primarily by those active in research, the government declined to act on that recommendation. It essentially reaffirmed its view that there is a necessary connection between research and degree teaching, and that being taught by those active in research is a means of enhancing the quality of teaching at higher levels. 161 The great majority of the research completed by TEOs in New Zealand is done in the universities – most of it in the seven older universities.28 The universities account for around 98% of the research income earned by the tertiary education institutions (TEIs),29 and they produce most of the tertiary education sector’s research outputs. The universities are also the largest contributor overall to research and innovation in New Zealand – they are responsible for about 63% of the country’s output of research papers.30 Because the universities are responsible for the very great majority of the research activities of the sector, much of the data presented in this chapter is focused on them, although information on the research of other types of TEOs is included as appropriate. 162 Institutes of technology and polytechnics (ITPs) and private training establishments (PTEs) support their degree teaching with research activity, and some ITPs and PTEs have
25 This information was drawn from a Ministry of Research, Science and Technology (MoRST) study of New Zealand data in the National Science Indicators published by Thomson Scientific, using data from the Institute for Scientific Information (ISI) database. 26 Education Act 1989, section 254 (3) (a). 27 ibid, section 162(4). 28 The Auckland University of Technology (AUT) – formerly the Auckland Institute of Technology – became a university in 2000 having previously operated as a polytechnic. AUT has lifted its research output substantially since 2000 but, as the results of the 2003 Performance-Based Research Fund (PBRF) assessment reveal, the average level of AUT’s research output still lags somewhat behind that of the other universities. 29 The public-sector providers of tertiary education – universities, institutes of technology and polytechnics (ITPs), colleges of education, and wānanga. 30 The percentage quoted is of research papers produced over the period 2001 to 2004 and indexed in the Thomson ISI index. To put that figure in perspective, the Crown Research Institutes (CRIs) collectively produce about 23%.
57
research programmes (primarily focused in the area of applied research).31 But the collective research activity and output of TEOs other than universities is very small, compared with that of the universities. 163 In 2002, New Zealand ranked 14th out of 27 OECD countries in graduation rates from advanced research programmes (OECD, 2004). The proportion of the New Zealand population holding advanced research degrees at the expected age of graduation is 0.9%. This compares with 1.3% in Australia and the United States, 1.6% in the United Kingdom, 2.7% in Sweden, and a mean (across all 27 OECD countries) of 1.1%. The balance between research and teaching 164 There are wide differences in the proportion of time devoted to teaching and research by academic staff. Those differences are between types of TEOs, between TEOs of the same type, and within an individual TEO. This usually reflects the teaching and research responsibilities held by individual staff members – for example, and particularly in the universities, some staff are expected to play leadership roles in research and hence would be expected to devote a much higher proportion of their time to research than others would be. By contrast, the majority of staff in the non-university TEOs have few or no research responsibilities. 165 One way of characterising trends and shifts over time in the teaching/research split within the universities is to analyse their relative shares of expenditure.32 The biennial statistical stocktakes of research in New Zealand report that the universities’ expenditure on their research activities was $273 million in 1996 and $455 million in 2004 (Ministry of Research, Science and Technology and Statistics New Zealand, 1997 and 2005). Those figures represent 23% of all expenditure by the universities in 1996, and 22% in 2004. While it is not possible to obtain reliable data on actual teaching expenditure, it is possible to develop a rough estimate by analysing the sources of funds in the universities’ annual accounts.33 Such an estimate suggests that, in 2004, something between 60% and 65% of total university expenditure was linked to teaching. 166 Expenditure figures in the universities’ annual accounts from 1996 to 2004 also show that the relative position of teaching and research has varied little over time. 167 Trends and shifts in the teaching/research split within the universities can also be seen in terms of income: around 20% of universities’ income is from research and 67% from teaching. The allocation of research funding 168 The funding of research in New Zealand TEOs has changed significantly over the last ten years. Broadly speaking, TEOs have two types of research income:
31 Two of the largest producers of research among the ITPs are Unitec New Zealand and the Waikato Institute of Technology, which reported 859 and 370 research outputs respectively in 2004. These numbers are very small compared with the number of outputs produced in universities of comparable size. 32 Tracking this figure can give some broad idea of shifts in emphasis over time. However, it needs to be noted that the cost structures of teaching and research are inherently different – and so it is incorrect to use expenditure data to quantify the balance between the two. 33 The analysis subtracted income from ‘other’ sources and expenditure on research from total expenditure and treated the residue as teaching-related expenses. The rationale for this method is that ‘other’ income (representing 15% of the total in 2004) is largely derived from such activities as consulting and trading. Those activities can be assumed to cover their costs, with a small margin only. Given that a significant share of expenditure on corporate activity is driven by the TEO’s teaching activities, and if one assumes that corporate is small in relation to teaching, the residue can be considered a reasonable (if crude) proxy for the scale of teaching expenditure. The actual sum is not what is important in this analysis – it is the order of magnitude, the trend over time, and the relative shift that we are interested in.
58
Income through Vote:Education, to support TEOs’ core research activities; and Income from sources other than Vote:Education – in general, this is intended to
finance particular research projects, and is known as ‘external research income’. 169 External research income can be disaggregated further into:
Funding provided by the government through Vote:RST (Research, Science and Technology) and awarded after contestable bidding rounds;
Funding provided by philanthropists and philanthropic organisations, to foster research activities;
Income earned by TEOs as subcontractors in large research contracts where other organisations such as Crown Research Institutes (CRIs) are the principal contractor; and
Income provided by firms and other organisations who contract TEOs to conduct specific pieces of research on their behalf, in order to meet their business needs – i.e. the purchase of research outputs.
170 These sources of funding are detailed below. 171 It should also be noted that, in addition to funding TEOs directly for research, the government supports their research efforts through scholarships and fellowships directed at providing greater access for research students and helping new researchers get started on their careers. (See Chapter 7a.) A number of private organisations also provide scholarships and fellowships. Vote:Education research funding through the PBRF 172 Between 2000 and 2003, the allocation of the Vote:Education research funding to TEOs was based on student enrolments in degree and postgraduate level courses,34 with the funding for all domestic degree and postgraduate level enrolments being supplemented by a research ‘top-up’. 173 This approach reflected the statutory connection, noted in paragraph 159 of this chapter, between research activity and teaching at degree and postgraduate level. However, allocating research funding on the basis of student enrolments was held to have several negative effects. First, it is inevitably distortionary to fund one kind of activity on the basis of performance in a different activity area; it sends the wrong signals. It provides incentives to improve performance in the activity area that generates the funding, possibly at the expense of improvements in the activity for which the funding is being provided. Second, the fields that were most successful in generating enrolments (and hence research funding) were not necessarily those that were most active in research. The resulting need for extensive internal cross-subsidy could result in distortion and tension. A number of critics argued that funding research on such a basis did not encourage research excellence; nor did it ensure that high-calibre researchers received adequate resources.35 174 In addition, where countries have linked research funding directly to research performance, the effect has been an improvement in the quality of research output. Britain and Hong Kong are obvious examples (Boston et al, 2005). 175 As a result of those considerations, the government has now separated the allocation of funding for research from the mechanisms for allocating funding for enrolments and
34 The only exception to this general statement relates to the Centres for Research Excellence (CoREs) established in 2002. 35 Criticisms of this nature were advanced by a number of leading academics and were also evident in the responses of the tertiary education sector to the government’s green and white papers on tertiary education reform in 1997 and 1998. For a fuller account, see Boston (1999).
59
tuition. It has also aligned research funding with the research performance of TEOs, to reward excellence in research. The mechanism used for this is the Performance-Based Research Fund (PBRF). 176 The PBRF is being phased in over the period 2004 to 2007, with an increasing proportion of the research ‘top-up’ funding being reallocated to the PBRF over that time. By 2007, the research top-up system will have disappeared. 177 In addition, the government has committed additional funding to the PBRF over and above formula-driven increases. The total of the PBRF is expected to be more than $220 million by 2009, compared with total research ‘top up’ funding of $132 million in 2003. 178 The PBRF uses a combination of peer review and performance indicators. The approach differs from the ‘pure’ indicator models used in Australia and Israel and the ‘pure’ peer review models employed in Britain and Hong Kong. And, unlike the British Research Assessment Exercise, where the unit of assessment is a discipline-based department or school, the New Zealand PBRF assessment is based on individual staff members (as in Hong Kong) (Boston, 2002). 179 The PBRF allocates research funding according to three components:
The quality of the research outputs produced in a TEO (assessed through a ‘quality evaluation’);
The number of ‘research degree completions’ the TEO has achieved over the three most recent years; and
The amount of ‘external research income’ generated by the TEO over the two most recent years.
180 The three components are weighted as follows: 60% for the quality evaluation assessment, 25% for research degree completions, and 15% for external research income. Funding is then allocated amongst TEOs according to their relative performance. 181 The PBRF allocations are primarily a reflection of research quality. They acknowledge that the universities’ role in the research and innovation system is principally one of pure basic research, and that such research contributes to economic outcomes in the longer term. But there is also a strategic dimension to this funding, in that the ‘relevance’36 of a TEO’s research is recognised through its ability to earn external research income.37 182 The first PBRF assessment took place in 2003, with the first funding allocations being made from 2004. 183 As expected, the quality evaluation showed a considerable gap between the seven older universities on the one hand and the 15 other participating TEOs on the other. The average ‘quality scores’ per eligible full-time-equivalent staff member in the seven older universities ranged from 2.11 (at Massey University) to 3.96 (at the University of Auckland). The next highest TEO (a PTE) scored 1.16 and the two participating ITPs scored 0.71 and 0.32. 184 Figure 5.1 below shows the results of the PBRF quality evaluation by subject area while Table 5.1 gives the percentage of total PBRF funding allocated to a range of TEOs in its second year of its operation.
36 Relevance to national goals is one of the key themes in the TES. 37 Refer to paragraphs 188 and 190 below for an account of the reasoning underlying this statement.
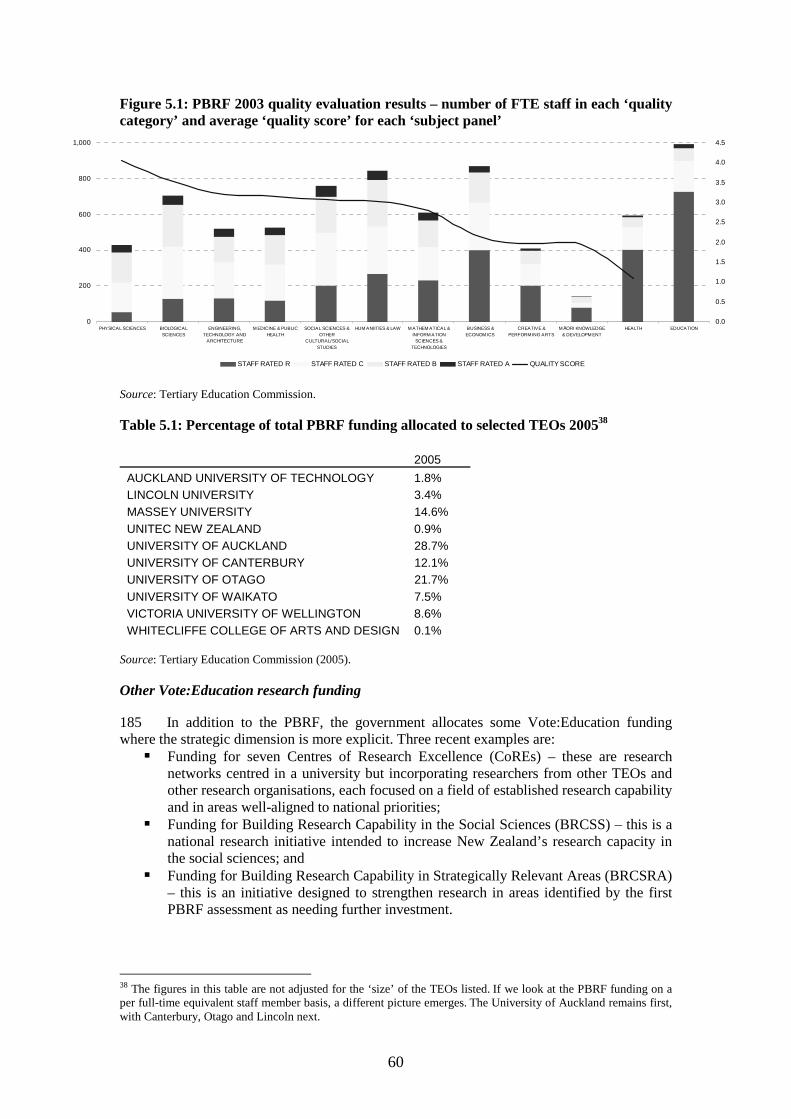
60
Figure 5.1: PBRF 2003 quality evaluation results – number of FTE staff in each ‘quality category’ and average ‘quality score’ for each ‘subject panel’
0
200
400
600
800
1,000
PHYSICAL SCIENCES BIOLOGICALSCIENCES
ENGINEERING,TECHNOLOGY AND
ARCHITECTURE
M EDICINE & PUBLICHEALTH
SOCIAL SCIENCES &OTHER
CULTURAL/SOCIALSTUDIES
HUM ANIITIES & LAW M ATHEM ATICAL &INFORM ATION
SCIENCES &TECHNOLOGIES
BUSINESS &ECONOM ICS
CREATIVE &PERFORM ING ARTS
MĀORI KNOWLEDGE& DEVELOPM ENT
HEALTH EDUCATION0.0
0.5
1.0
1.5
2.0
2.5
3.0
3.5
4.0
4.5
STAFF RATED R STAFF RATED C STAFF RATED B STAFF RATED A QUALITY SCORE
Source: Tertiary Education Commission. Table 5.1: Percentage of total PBRF funding allocated to selected TEOs 200538
2005
AUCKLAND UNIVERSITY OF TECHNOLOGY 1.8% LINCOLN UNIVERSITY 3.4% MASSEY UNIVERSITY 14.6% UNITEC NEW ZEALAND 0.9% UNIVERSITY OF AUCKLAND 28.7% UNIVERSITY OF CANTERBURY 12.1% UNIVERSITY OF OTAGO 21.7% UNIVERSITY OF WAIKATO 7.5% VICTORIA UNIVERSITY OF WELLINGTON 8.6% WHITECLIFFE COLLEGE OF ARTS AND DESIGN 0.1%
Source: Tertiary Education Commission (2005). Other Vote:Education research funding 185 In addition to the PBRF, the government allocates some Vote:Education funding where the strategic dimension is more explicit. Three recent examples are:
Funding for seven Centres of Research Excellence (CoREs) – these are research networks centred in a university but incorporating researchers from other TEOs and other research organisations, each focused on a field of established research capability and in areas well-aligned to national priorities;
Funding for Building Research Capability in the Social Sciences (BRCSS) – this is a national research initiative intended to increase New Zealand’s research capacity in the social sciences; and
Funding for Building Research Capability in Strategically Relevant Areas (BRCSRA) – this is an initiative designed to strengthen research in areas identified by the first PBRF assessment as needing further investment.
38 The figures in this table are not adjusted for the ‘size’ of the TEOs listed. If we look at the PBRF funding on a per full-time equivalent staff member basis, a different picture emerges. The University of Auckland remains first, with Canterbury, Otago and Lincoln next.
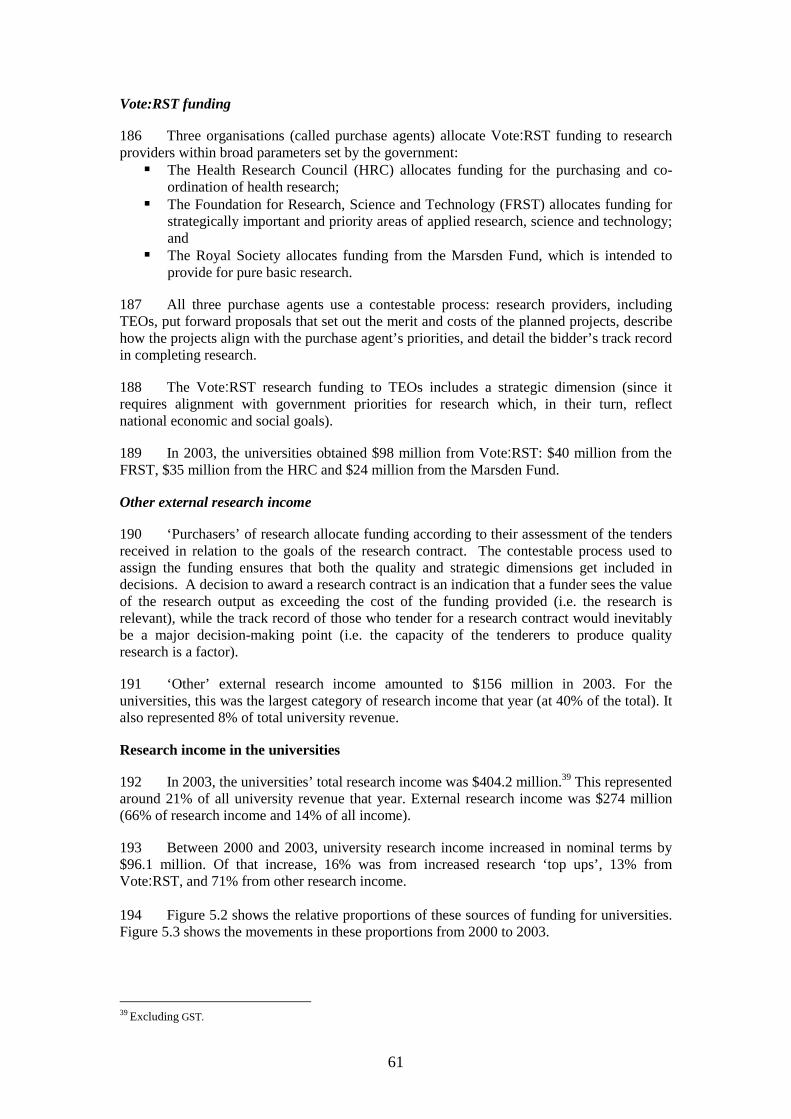
61
Vote:RST funding 186 Three organisations (called purchase agents) allocate Vote:RST funding to research providers within broad parameters set by the government:
The Health Research Council (HRC) allocates funding for the purchasing and co-ordination of health research;
The Foundation for Research, Science and Technology (FRST) allocates funding for strategically important and priority areas of applied research, science and technology; and
The Royal Society allocates funding from the Marsden Fund, which is intended to provide for pure basic research.
187 All three purchase agents use a contestable process: research providers, including TEOs, put forward proposals that set out the merit and costs of the planned projects, describe how the projects align with the purchase agent’s priorities, and detail the bidder’s track record in completing research. 188 The Vote:RST research funding to TEOs includes a strategic dimension (since it requires alignment with government priorities for research which, in their turn, reflect national economic and social goals). 189 In 2003, the universities obtained $98 million from Vote:RST: $40 million from the FRST, $35 million from the HRC and $24 million from the Marsden Fund. Other external research income 190 ‘Purchasers’ of research allocate funding according to their assessment of the tenders received in relation to the goals of the research contract. The contestable process used to assign the funding ensures that both the quality and strategic dimensions get included in decisions. A decision to award a research contract is an indication that a funder sees the value of the research output as exceeding the cost of the funding provided (i.e. the research is relevant), while the track record of those who tender for a research contract would inevitably be a major decision-making point (i.e. the capacity of the tenderers to produce quality research is a factor). 191 ‘Other’ external research income amounted to $156 million in 2003. For the universities, this was the largest category of research income that year (at 40% of the total). It also represented 8% of total university revenue. Research income in the universities 192 In 2003, the universities’ total research income was $404.2 million.39 This represented around 21% of all university revenue that year. External research income was $274 million (66% of research income and 14% of all income). 193 Between 2000 and 2003, university research income increased in nominal terms by $96.1 million. Of that increase, 16% was from increased research ‘top ups’, 13% from Vote:RST, and 71% from other research income. 194 Figure 5.2 shows the relative proportions of these sources of funding for universities. Figure 5.3 shows the movements in these proportions from 2000 to 2003.
39 Excluding GST.
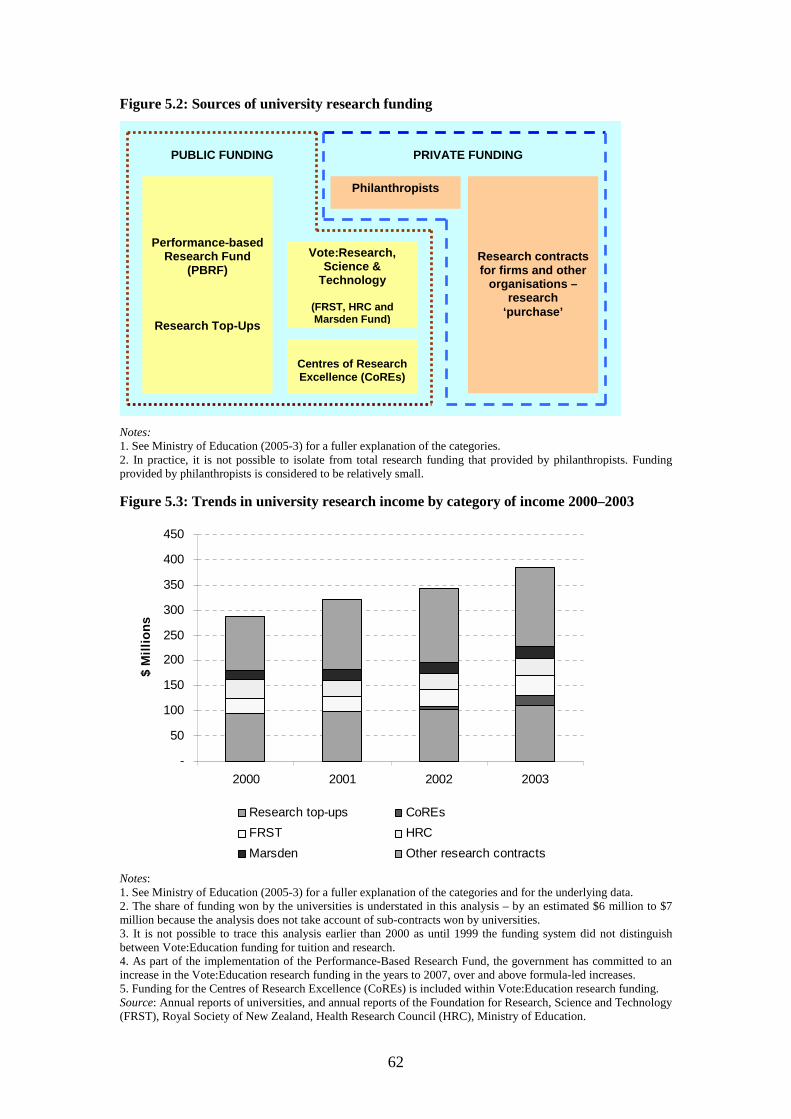
62
Figure 5.2: Sources of university research funding
Notes: 1. See Ministry of Education (2005-3) for a fuller explanation of the categories. 2. In practice, it is not possible to isolate from total research funding that provided by philanthropists. Funding provided by philanthropists is considered to be relatively small.
Figure 5.3: Trends in university research income by category of income 2000–2003
-
50
100
150
200
250
300
350
400
450
2000 2001 2002 2003
$ M
illi
on
s
Research top-ups CoREs
FRST HRC
Marsden Other research contracts
Notes: 1. See Ministry of Education (2005-3) for a fuller explanation of the categories and for the underlying data. 2. The share of funding won by the universities is understated in this analysis – by an estimated $6 million to $7 million because the analysis does not take account of sub-contracts won by universities. 3. It is not possible to trace this analysis earlier than 2000 as until 1999 the funding system did not distinguish between Vote:Education funding for tuition and research. 4. As part of the implementation of the Performance-Based Research Fund, the government has committed to an increase in the Vote:Education research funding in the years to 2007, over and above formula-led increases. 5. Funding for the Centres of Research Excellence (CoREs) is included within Vote:Education research funding. Source: Annual reports of universities, and annual reports of the Foundation for Research, Science and Technology (FRST), Royal Society of New Zealand, Health Research Council (HRC), Ministry of Education.
Performance-based Research Fund
(PBRF)
Research Top-Ups
Philanthropists
Vote:Research, Science &
Technology
(FRST, HRC and Marsden Fund)
Centres of Research Excellence (CoREs)
Research contracts for firms and other
organisations – research
‘purchase’
PUBLIC FUNDING PRIVATE FUNDING
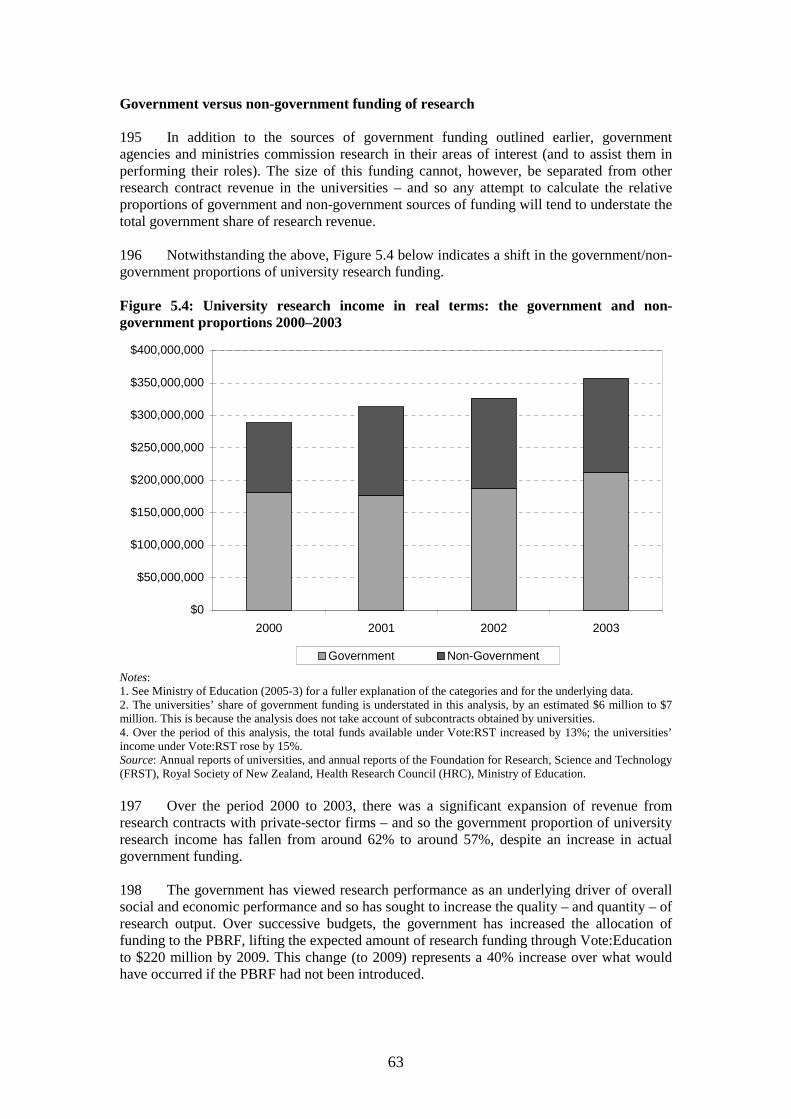
63
Government versus non-government funding of research 195 In addition to the sources of government funding outlined earlier, government agencies and ministries commission research in their areas of interest (and to assist them in performing their roles). The size of this funding cannot, however, be separated from other research contract revenue in the universities – and so any attempt to calculate the relative proportions of government and non-government sources of funding will tend to understate the total government share of research revenue. 196 Notwithstanding the above, Figure 5.4 below indicates a shift in the government/non-government proportions of university research funding. Figure 5.4: University research income in real terms: the government and non-government proportions 2000–2003
$0
$50,000,000
$100,000,000
$150,000,000
$200,000,000
$250,000,000
$300,000,000
$350,000,000
$400,000,000
2000 2001 2002 2003
Government Non-Government
Notes: 1. See Ministry of Education (2005-3) for a fuller explanation of the categories and for the underlying data. 2. The universities’ share of government funding is understated in this analysis, by an estimated $6 million to $7 million. This is because the analysis does not take account of subcontracts obtained by universities. 4. Over the period of this analysis, the total funds available under Vote:RST increased by 13%; the universities’ income under Vote:RST rose by 15%. Source: Annual reports of universities, and annual reports of the Foundation for Research, Science and Technology (FRST), Royal Society of New Zealand, Health Research Council (HRC), Ministry of Education. 197 Over the period 2000 to 2003, there was a significant expansion of revenue from research contracts with private-sector firms – and so the government proportion of university research income has fallen from around 62% to around 57%, despite an increase in actual government funding. 198 The government has viewed research performance as an underlying driver of overall social and economic performance and so has sought to increase the quality – and quantity – of research output. Over successive budgets, the government has increased the allocation of funding to the PBRF, lifting the expected amount of research funding through Vote:Education to $220 million by 2009. This change (to 2009) represents a 40% increase over what would have occurred if the PBRF had not been introduced.
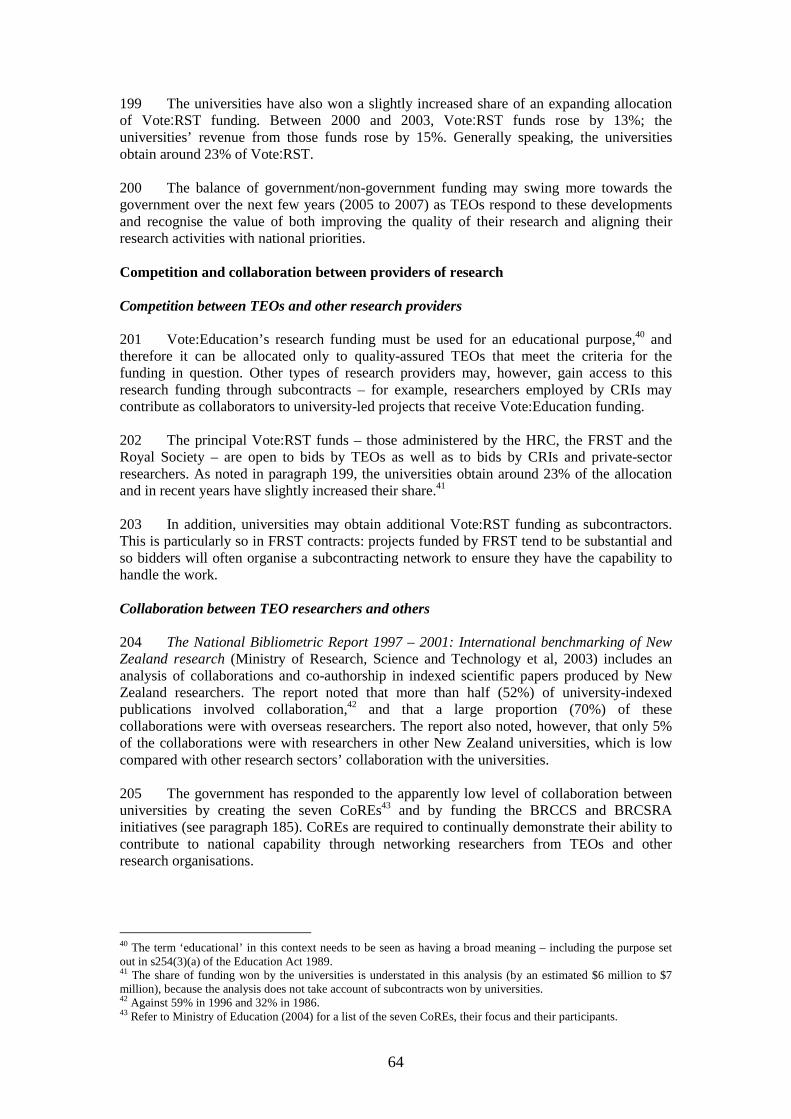
64
199 The universities have also won a slightly increased share of an expanding allocation of Vote:RST funding. Between 2000 and 2003, Vote:RST funds rose by 13%; the universities’ revenue from those funds rose by 15%. Generally speaking, the universities obtain around 23% of Vote:RST. 200 The balance of government/non-government funding may swing more towards the government over the next few years (2005 to 2007) as TEOs respond to these developments and recognise the value of both improving the quality of their research and aligning their research activities with national priorities. Competition and collaboration between providers of research Competition between TEOs and other research providers 201 Vote:Education’s research funding must be used for an educational purpose,40 and therefore it can be allocated only to quality-assured TEOs that meet the criteria for the funding in question. Other types of research providers may, however, gain access to this research funding through subcontracts – for example, researchers employed by CRIs may contribute as collaborators to university-led projects that receive Vote:Education funding. 202 The principal Vote:RST funds – those administered by the HRC, the FRST and the Royal Society – are open to bids by TEOs as well as to bids by CRIs and private-sector researchers. As noted in paragraph 199, the universities obtain around 23% of the allocation and in recent years have slightly increased their share.41 203 In addition, universities may obtain additional Vote:RST funding as subcontractors. This is particularly so in FRST contracts: projects funded by FRST tend to be substantial and so bidders will often organise a subcontracting network to ensure they have the capability to handle the work. Collaboration between TEO researchers and others 204 The National Bibliometric Report 1997 – 2001: International benchmarking of New Zealand research (Ministry of Research, Science and Technology et al, 2003) includes an analysis of collaborations and co-authorship in indexed scientific papers produced by New Zealand researchers. The report noted that more than half (52%) of university-indexed publications involved collaboration,42 and that a large proportion (70%) of these collaborations were with overseas researchers. The report also noted, however, that only 5% of the collaborations were with researchers in other New Zealand universities, which is low compared with other research sectors’ collaboration with the universities. 205 The government has responded to the apparently low level of collaboration between universities by creating the seven CoREs43 and by funding the BRCCS and BRCSRA initiatives (see paragraph 185). CoREs are required to continually demonstrate their ability to contribute to national capability through networking researchers from TEOs and other research organisations. 40 The term ‘educational’ in this context needs to be seen as having a broad meaning – including the purpose set out in s254(3)(a) of the Education Act 1989. 41 The share of funding won by the universities is understated in this analysis (by an estimated $6 million to $7 million), because the analysis does not take account of subcontracts won by universities. 42 Against 59% in 1996 and 32% in 1986. 43 Refer to Ministry of Education (2004) for a list of the seven CoREs, their focus and their participants.
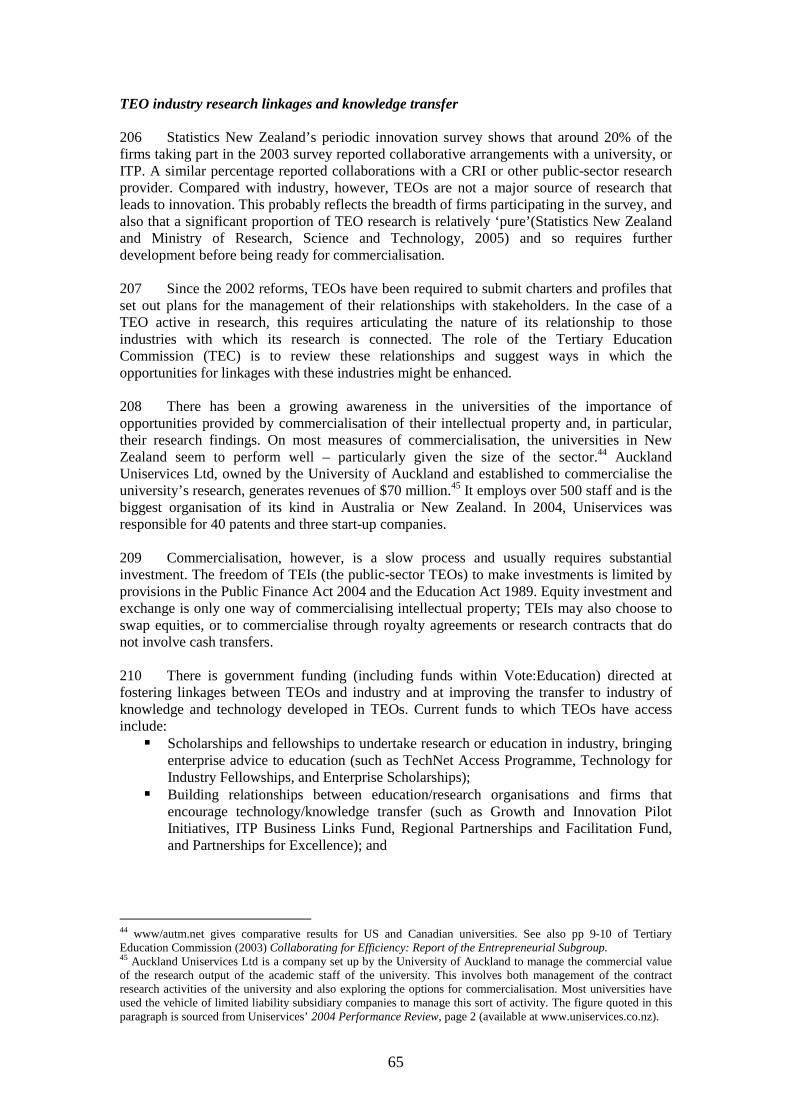
65
TEO industry research linkages and knowledge transfer 206 Statistics New Zealand’s periodic innovation survey shows that around 20% of the firms taking part in the 2003 survey reported collaborative arrangements with a university, or ITP. A similar percentage reported collaborations with a CRI or other public-sector research provider. Compared with industry, however, TEOs are not a major source of research that leads to innovation. This probably reflects the breadth of firms participating in the survey, and also that a significant proportion of TEO research is relatively ‘pure’(Statistics New Zealand and Ministry of Research, Science and Technology, 2005) and so requires further development before being ready for commercialisation. 207 Since the 2002 reforms, TEOs have been required to submit charters and profiles that set out plans for the management of their relationships with stakeholders. In the case of a TEO active in research, this requires articulating the nature of its relationship to those industries with which its research is connected. The role of the Tertiary Education Commission (TEC) is to review these relationships and suggest ways in which the opportunities for linkages with these industries might be enhanced. 208 There has been a growing awareness in the universities of the importance of opportunities provided by commercialisation of their intellectual property and, in particular, their research findings. On most measures of commercialisation, the universities in New Zealand seem to perform well – particularly given the size of the sector.44 Auckland Uniservices Ltd, owned by the University of Auckland and established to commercialise the university’s research, generates revenues of $70 million.45 It employs over 500 staff and is the biggest organisation of its kind in Australia or New Zealand. In 2004, Uniservices was responsible for 40 patents and three start-up companies. 209 Commercialisation, however, is a slow process and usually requires substantial investment. The freedom of TEIs (the public-sector TEOs) to make investments is limited by provisions in the Public Finance Act 2004 and the Education Act 1989. Equity investment and exchange is only one way of commercialising intellectual property; TEIs may also choose to swap equities, or to commercialise through royalty agreements or research contracts that do not involve cash transfers. 210 There is government funding (including funds within Vote:Education) directed at fostering linkages between TEOs and industry and at improving the transfer to industry of knowledge and technology developed in TEOs. Current funds to which TEOs have access include:
Scholarships and fellowships to undertake research or education in industry, bringing enterprise advice to education (such as TechNet Access Programme, Technology for Industry Fellowships, and Enterprise Scholarships);
Building relationships between education/research organisations and firms that encourage technology/knowledge transfer (such as Growth and Innovation Pilot Initiatives, ITP Business Links Fund, Regional Partnerships and Facilitation Fund, and Partnerships for Excellence); and
44 www/autm.net gives comparative results for US and Canadian universities. See also pp 9-10 of Tertiary Education Commission (2003) Collaborating for Efficiency: Report of the Entrepreneurial Subgroup. 45 Auckland Uniservices Ltd is a company set up by the University of Auckland to manage the commercial value of the research output of the academic staff of the university. This involves both management of the contract research activities of the university and also exploring the options for commercialisation. Most universities have used the vehicle of limited liability subsidiary companies to manage this sort of activity. The figure quoted in this paragraph is sourced from Uniservices’ 2004 Performance Review, page 2 (available at www.uniservices.co.nz).
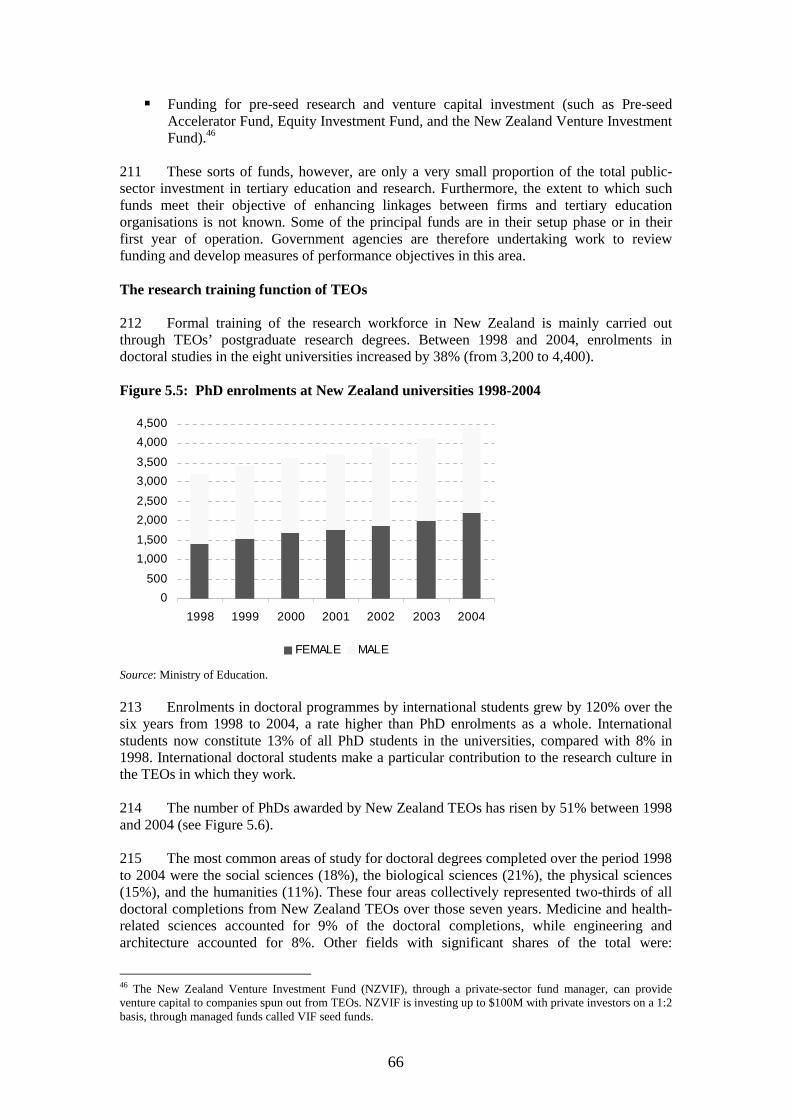
66
Funding for pre-seed research and venture capital investment (such as Pre-seed Accelerator Fund, Equity Investment Fund, and the New Zealand Venture Investment Fund).46
211 These sorts of funds, however, are only a very small proportion of the total public-sector investment in tertiary education and research. Furthermore, the extent to which such funds meet their objective of enhancing linkages between firms and tertiary education organisations is not known. Some of the principal funds are in their setup phase or in their first year of operation. Government agencies are therefore undertaking work to review funding and develop measures of performance objectives in this area. The research training function of TEOs 212 Formal training of the research workforce in New Zealand is mainly carried out through TEOs’ postgraduate research degrees. Between 1998 and 2004, enrolments in doctoral studies in the eight universities increased by 38% (from 3,200 to 4,400). Figure 5.5: PhD enrolments at New Zealand universities 1998-2004
0
500
1,000
1,500
2,000
2,500
3,000
3,500
4,000
4,500
1998 1999 2000 2001 2002 2003 2004
FEMALE MALE
Source: Ministry of Education. 213 Enrolments in doctoral programmes by international students grew by 120% over the six years from 1998 to 2004, a rate higher than PhD enrolments as a whole. International students now constitute 13% of all PhD students in the universities, compared with 8% in 1998. International doctoral students make a particular contribution to the research culture in the TEOs in which they work. 214 The number of PhDs awarded by New Zealand TEOs has risen by 51% between 1998 and 2004 (see Figure 5.6). 215 The most common areas of study for doctoral degrees completed over the period 1998 to 2004 were the social sciences (18%), the biological sciences (21%), the physical sciences (15%), and the humanities (11%). These four areas collectively represented two-thirds of all doctoral completions from New Zealand TEOs over those seven years. Medicine and health-related sciences accounted for 9% of the doctoral completions, while engineering and architecture accounted for 8%. Other fields with significant shares of the total were:
46 The New Zealand Venture Investment Fund (NZVIF), through a private-sector fund manager, can provide venture capital to companies spun out from TEOs. NZVIF is investing up to $100M with private investors on a 1:2 basis, through managed funds called VIF seed funds.
67
agriculture, horticulture, forestry, and environment (4%); mathematics and information/ computer science (6%); and law, business and commerce (7%). 216 An examination of the rate of PhD completion shows that 23% of domestic students who started a doctorate in 1998 had completed successfully by 2003. The long-term completion rate for doctoral students is estimated at between 54% and 57% (Ministry of Education, 2004d) which is similar to estimates of long-term completion rates for doctoral degrees in Australia (Martin, Maclachlan and Karmel). Figure 5.6: PhD completions at New Zealand universities 1998-2004
Source: Ministry of Education.
0
100
200
300
400
500
600
700
1998 1999 2000 2001 2002 2003 2004
FEMALE MALE
68
CHAPTER 6: ACHIEVING EQUITY IN AND THROUGH TERTIARY EDUCATION 217 New Zealand has embraced the notion of the ‘knowledge economy’ and with it, the idea that access to education will increasingly be a major determinant of social and economic development at both the national and the individual level. More equitable participation in tertiary education is now seen as not only a good in itself, but also as a key means of improving social equity and economic performance. New Zealand’s tertiary policy has therefore focused on developing a sector that is capable of meeting a diverse range of educational needs. 218 The focus is not simply on building equity in terms of patterns of participation within the tertiary sector, but also on examining how the tertiary sector can contribute to wider social and economic equity goals. Equity through tertiary education is at least as important as equity in tertiary education. 219 There has been a strong emphasis on courses that develop the fundamental skills necessary for participation in the labour market and movement into higher levels of education. Many courses offered through foundation education are specifically designed to teach foundation competencies such as literacy, numeracy, social skills, and employment skills – especially for those who did not develop these skills at secondary school. Students who do not wish to enter a degree course may be more comfortable initially entering a certificate or diploma course, which further develops skills that might later be used for degree education. 220 New Zealand has strongly emphasised the integration of the various elements of tertiary education into a more unified whole. The aim has been to enhance the esteem and quality of certificate and diploma courses, and facilitate the ability of students to advance through the system. Key in this has been the development of the New Zealand Register of Quality Assured Qualifications, which links together all forms of education, from foundation learning to advanced research degrees, into a single qualification ‘ladder’. 221 This development of a ‘seamless pathway’ of learning has been seen as being particularly important for those populations that are traditionally under-represented in tertiary education. This is because there is a considerable overlap between these populations and those who leave school with low or no qualifications. A primary concern therefore has been not only to build foundation skills but also to move students through to higher levels of study. Recent research has demonstrated that concentrating on improving participation at this level can be more significant in influencing overall social and economic characteristics than concentrating on the highest end of the educational spectrum (Ministry of Education, 2004). 222 The government has recently made moves to strengthen its investment in certificate and diploma level provision to ensure quality, relevance, regional provision, funding cohesion, and value for money. The rationale for this was the need to achieve better fiscal management and better student outcomes at these levels (which the upsurge in recent enrolments had put at risk). Student participation 223 Along with that of other countries, New Zealand’s tertiary sector has grown tremendously over past decades.47 Driven mainly by increases in enrolment, rather than simple population increases, participation in tertiary education has risen to the point where the number and proportion of New Zealanders actively engaged in tertiary education is at the
47 Unless otherwise noted, statistical information in this section is from the Ministry of Education.
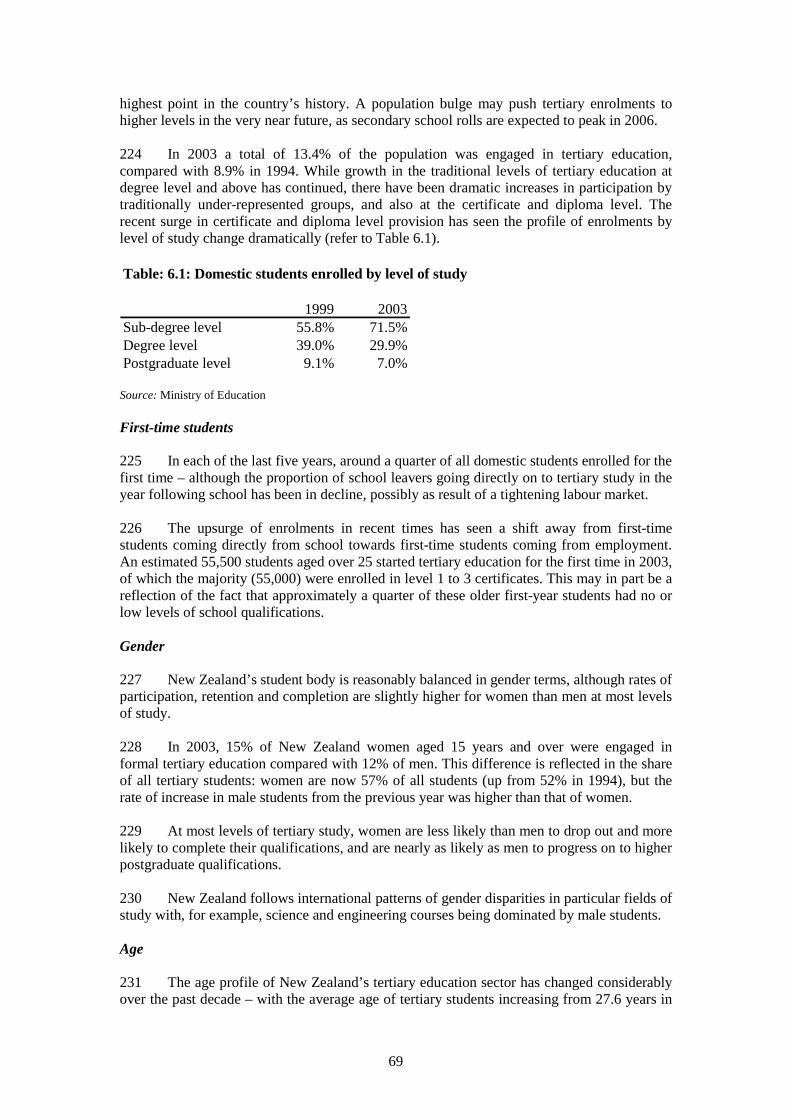
69
highest point in the country’s history. A population bulge may push tertiary enrolments to higher levels in the very near future, as secondary school rolls are expected to peak in 2006. 224 In 2003 a total of 13.4% of the population was engaged in tertiary education, compared with 8.9% in 1994. While growth in the traditional levels of tertiary education at degree level and above has continued, there have been dramatic increases in participation by traditionally under-represented groups, and also at the certificate and diploma level. The recent surge in certificate and diploma level provision has seen the profile of enrolments by level of study change dramatically (refer to Table 6.1).
Source: Ministry of Education First-time students 225 In each of the last five years, around a quarter of all domestic students enrolled for the first time – although the proportion of school leavers going directly on to tertiary study in the year following school has been in decline, possibly as result of a tightening labour market. 226 The upsurge of enrolments in recent times has seen a shift away from first-time students coming directly from school towards first-time students coming from employment. An estimated 55,500 students aged over 25 started tertiary education for the first time in 2003, of which the majority (55,000) were enrolled in level 1 to 3 certificates. This may in part be a reflection of the fact that approximately a quarter of these older first-year students had no or low levels of school qualifications. Gender 227 New Zealand’s student body is reasonably balanced in gender terms, although rates of participation, retention and completion are slightly higher for women than men at most levels of study. 228 In 2003, 15% of New Zealand women aged 15 years and over were engaged in formal tertiary education compared with 12% of men. This difference is reflected in the share of all tertiary students: women are now 57% of all students (up from 52% in 1994), but the rate of increase in male students from the previous year was higher than that of women. 229 At most levels of tertiary study, women are less likely than men to drop out and more likely to complete their qualifications, and are nearly as likely as men to progress on to higher postgraduate qualifications. 230 New Zealand follows international patterns of gender disparities in particular fields of study with, for example, science and engineering courses being dominated by male students. Age 231 The age profile of New Zealand’s tertiary education sector has changed considerably over the past decade – with the average age of tertiary students increasing from 27.6 years in
Table: 6.1: Domestic students enrolled by level of study
1999 2003 Sub-degree level 55.8% 71.5% Degree level 39.0% 29.9% Postgraduate level 9.1% 7.0%
70
1994 to 30.9 years in 2003, and the proportion of students aged less than 25 decreasing from 51% to 38% over the same period. The numbers of students aged 25 to 39 have grown by 82% (despite overall population levels for this age group declining), and the numbers of those over 40 have risen by 180%. These changes mirror the significant increases in participation rates for the older groups in tertiary education. The growth in older Māori students alone has contributed to 30.1% of the growth in older students. 232 In general, younger students have higher rates of both retention and qualification completion than older students, across all levels of study. Students at older ages study at lower levels and are less likely to advance to higher qualifications after completing a lower one. The exception to this is students at wānanga, who move on to a higher qualification at a greater rate than that of the whole sector. This may be because more of the programmes at wānanga are pitched at older students. Ethnicity 233 New Zealand historically has had significant ethnic disparities in tertiary education, with Māori and Pasifika peoples having very low participation rates. However, the past decade has seen significant changes in this – particularly over the past five years. Since 2002 Māori students have had the highest participation rate of any ethnic group in New Zealand Ministry of Education (2005d). Participation by Pasifika peoples has also increased significantly, though not to the same extent as Māori. 234 Despite overall participation by under-represented ethnic groups increasing significantly, for Māori and Pasifika students this has been concentrated at lower levels of the qualifications framework. Both groups remain significantly under-represented at degree and post-degree levels – and they have a higher proportion of students who leave school with low or no qualifications. Given this, it is likely that participation needs to grow at foundation levels as a prerequisite for improving participation at higher levels. Socio-economic status 235 Objective 20 of the TES has the goal of improving the participation and achievement of people from low-income backgrounds. While no reliable measure of change has yet been developed, there are many policy initiatives (described later in this chapter) that will contribute to this goal by improving connections and pathways for all learners between foundation learning and other types of education. This includes from school to further education, training or work. 236 The key determinant, however, for participation in degree-level study does not appear to be socio-economic status per se, but rather, levels of academic achievement at secondary school48. As the Ministry of Education concluded in 2003, ‘a student from a low decile school49 who achieves the highest school qualification (A or B Bursary) is as likely as a student from a higher decile school to go on to study for a degree’. However, a smaller proportion of students from low decile schools go directly to degree study from school than from high decile schools50. So socio-economic and ethnic disparities in tertiary education are
48 Student and staff groups claim this assertion leads the reader to believe that socio-economic status is not at all a barrier to participation in degree-level study, and state that it is a determinant. 49 New Zealand schools are grouped into deciles that broadly reflect the make-up of the communities that participate in those schools. Decile 10 represents schools that are located in areas of highest relative advantage. The decile is an index of the socio-economic status of the community, not of the individuals in the school. Therefore, using school decile as a proxy for socio-economic status should be treated with caution. Those who advance from low decile schools can be people of medium or high socio-economic status. 50 Interestingly, recent research by the Ministry of Education shows that school decile is only marginally significant in determining whether a student succeeds in degree study. Refer Ministry of Education (2005c).

71
likely to be partly the result of disparities manifesting themselves in the secondary education system. As noted above, this is one of the drivers behind New Zealand’s focus on education at the certificate and diploma level; providing the foundation education that people missed out on in the ‘compulsory’ sector will have a flow-on effect that will address inequalities at higher levels. In large measure, the very great growth in enrolments in lower levels of tertiary education that has occurred since 2000 has been a result of this factor – older students, many of them Maori, with low or no school qualifications, enrolling in certificate level qualifications. Students with disabilities 237 There are increasing numbers of students with disabilities participating in the sector. Since information on disability was first collected in 1998, the number of students with disabilities has grown from 7,500 in 1998 to over 21,400 during 2003. In that year students with disabilities represented 5% of all students, up from 3% in 1998. (These figures exclude students at PTEs and OTEPs.) 238 It is estimated that in 2001 only 2.3% of the New Zealand population with disabilities was participating in tertiary education. Students aged 15 to 44 with disabilities participated at about a quarter of the rate of people aged 15 to 44 who did not have disabilities. 239 Given both the rising overall participation rate in tertiary education and the increase in the incidence of disability with age, it is to be expected that students with disabilities were more likely to be older than the general student body. About 40% of all students with disabilities were aged 40 and over, compared with 26% for students with no disability. Correspondingly, students with disabilities were less represented at ages 18 to 24: 3.3% of all students at this age reported a disability, compared with the sector average of 5.0%. 240 Students with disabilities were also more likely to be women. Over 60% were women, compared with a non-disability share for women of 56%. 241 Students with disabilities were more likely to be studying at certificate or diploma level, and noticeably more were enrolled in mixed-field programmes. These included, for example, foundation-related programmes such as literacy and numeracy, employment-related skills training, and social and life skills-related training. Policies for enhancing equity 242 In the 1990s, little emphasis was placed on explicitly linking the performance and monitoring of New Zealand’s tertiary sector with national goals (including that of equity). In recent years, however, there has been an increasing emphasis on the concept of ‘relevance’: ensuring that the courses being offered – and publicly funded – within the tertiary sector are contributing to the social and economic development of New Zealand. 243 The tertiary sector is linked to national social and economic goals through the Tertiary Education Strategy (TES). The current TES sets out six interrelated strategies dealing with specific aspects of the tertiary education sector. The strategies with the strongest equity elements are:
Raise foundation skills so that all people can participate in our knowledge society; Develop the skills New Zealanders need for our knowledge society; Te rautaki mātauranga Māori – contribute to the achievement of Māori development
aspirations; and Educate for Pacific peoples’ development and success.
72
244 The TES is supported by the Statement of Tertiary Education Priorities (STEP), which sets out the government’s immediate priorities for the performance of the sector. Its priorities align with the main strategies and objectives in the TES. The current STEP for the 2005 to 2007 period groups the priorities for the sector into four separate key themes:
1 Investing in excellence in teaching, learning and research; 2 Increasing the relevance of skills and knowledge to meet national goals; 3 Enabling students and learners to access excellent and relevant tertiary education, and
progress to higher levels of study and achievement; and 4 Enhancing capability and information quality in the tertiary system to support
learning, teaching and research. 245 The first key theme is the one most relevant to equity – and includes the priorities of improving learning outcomes generally, improving Māori and Pasifika participation and outcomes, and improving the transition of youth to tertiary education. Theme 2 explicitly links the tertiary sector to wider equity goals, by including as priorities ‘improving language, literacy and numeracy across the adult population’, ‘strengthening Māori development’, and ‘meeting the development aspirations of Pasifika’. 246 The principle of open access in theory gives all prospective students the opportunity to engage in tertiary education. Consequently, official equity measures in New Zealand largely consist of measures aimed at removing barriers to taking up that opportunity. The TES has identified four specific groups where increasing participation in the tertiary sector is of key concern:
Māori students (at degree level and higher); Pasifika students; Students with a disability; Moving from school to tertiary for students from lower socio-economic backgrounds.
247 All tertiary education organisations (TEOs) that wish to provide officially recognised New Zealand qualifications, access public funding, and/or allow their students access to public financial support are required to prepare charters and profiles that are negotiated with the Tertiary Education Commission (TEC). The documents outline how a TEO’s actions relate to the STEP and the TES, and so link the overall vision for the sector – including equity elements – with the actual practice of TEOs. Each TEO is required as part of its charter and profile to discuss the equity measures it has in place or intends to introduce. This ensures that equity issues are accounted for, while giving each TEO significant autonomy and flexibility in deciding how it can best meet these requirements. 248 It should be noted that the recently released Schooling Strategy 2005h010 contains priorities that will contribute to the wider equity goals of the tertiary sector. Enhancing equity: selection and admission 249 New Zealand’s tertiary education system operates according to a general principle of open access (sections 224 and 257 of the Education Act 1989). Under this principle, any domestic student who has met the minimum entry requirements for enrolling in a particular course offered by a TEO is entitled to enter that course. This ensures a basic level of equitable access into tertiary education. 250 The New Zealand system gives any domestic would-be student who is 20 years of age or older and who does not hold the required minimum entry qualifications the same right to enrol in a TEO course of study or training as those who do hold entry qualifications. 251 Would-be students who are younger than 20 and who wish to attend a university must meet minimum academic standards set by the New Zealand Qualifications Authority
73
(NZQA), in consultation with the universities. The NZQA must also consult the universities on the criteria under which otherwise ineligible students under 20 may attend university – provisional entrance and entrance ad eundum statum. Individual universities are responsible for accepting or declining applications under these criteria, but NZQA may also hear appeals against a university’s decision. 252 Although admission to tertiary education in general is not restricted, under section 224 (5) and (6) of the Education Act (refer to Anneex 6), the university councils may limit the number of places available in some courses and set their own admission requirements (subject to non-discrimination criteria). Degrees in such fields as law and architecture are typical examples. 253 Individual TEOs can also establish exceptions to these requirements – and so many TEOs have specific equity-quotas under which applicants from under-represented groups, such as Māori and Pasifika students, may enrol if eligible. 254 Also, under section 223 (2) of the Education Act, the government can direct the council of a TEI51 to not provide, or to continue to provide, particular courses to ensure efficient use of resources. Examples of this include medicine and dentistry programmes, which are offered by only two universities. Institutional funding for equity 255 The most fundamental instrument for promoting equity is the funding system itself. By tying funding to the numbers of students enrolled, the system provides a strong incentive for TEOs to attract and retain students. This theoretically encourages them to develop programmes that will suit the needs of both existing and new groups of students. Equity was also a factor in a controversial decision in 1999 to allow PTEs and OTEPs 52 greater access public funding.53 A key element in this decision was the large number of students from traditionally under-represented groups who were enrolled at PTEs – and many PTEs claimed they were particularly well-suited to providing education for groups with traditionally low rates of participation (notably Māori and Pasifika students). The large increase in participation by such groups since 1999 suggests that there may have been at least some truth to this claim; and some PTEs have identified themselves as being specialist providers of tertiary education provision for Māori or Pasifika. 256 The funding system has also allowed some TEOs to develop and operate innovative schemes that have had positive equity effects. The most notable of these are the ‘zero fees’ schemes operated by several TEOs. Through a combination of economies of scale, budgetary reform, and (on occasion) support from local communities, these TEOs are able to to cover the full cost of delivering programmes and so do not have to charge additional student fees. The key beneficiaries of these courses have been those from lower socio-economic backgrounds, those with low prior educational achievement, and older adults (Green, 2005). 257 Although the funding system appears to have had significant equity benefits in terms of promoting participation, the upsurge of enrolments in certificate and diploma level programmes has raised concerns about the quality of some low-cost and low-value education courses. This has particularly been so for courses that are not required to lead to an officially recognised qualification.
51 A public-sector TEO is known as a ‘tertiary education institution’ (TEI). 52 Private training establishments (PTEs) and ‘other’ tertiary education providers (OTEPs). 53 PTEs and OTEPs were allowed the same access to EFTS funding as TEIs from 1999, but from 2001 have had increasing controls placed on their ability to do so.
74
258 Various tertiary policy reviews have been undertaken to ensure that policies deliver value for money, that learners receive quality and relevant education, and that there is a strong network of certificate and diploma level provision across the country. Consequently, the government has decided to:
Tighten and enhance quality assurance and monitoring systems in government agencies, to ensure that both existing and new provision meets high-quality standards and is relevant;
Shift funding from low-quality courses of low value to courses that are relevant and of high quality, that meet the needs of communities, and that achieve national goals (including the promotion of social and economic equity);
Redirect all savings into more apprenticeships and industry training, and also into foundation-skills education such as literacy and numeracy for adults;
Replace the previous funding method for adult and community education with a dedicated fund; and
Support TEOs as they shift to this new environment through the operation of a Quality Reinvestment Fund.
Special supplementary grants 259 Special supplementary grants (SSGs) are a collection of separate funding streams, each of which provides public funding to TEIs for specific purposes. These grants are not intrinsically equity tools, but the most well-established SSGs are those that provide additional funding to improve equity for Māori and Pasifika students and students with disabilities. Recent changes following a review of ethnically targeted policies and programmes have led the government to propose changes to the administration and monitoring of these programmes, including the possible broadening of grants to cover a wider range of marginalised groups. 260 The SSG for students with a disability is allocated to all TEIs on a per-EFTS basis, rather than being tied to the number of students at a TEO that identify as having a disability. Its aims are to improve access for (and levels of enrolment and educational attainment by) students with a disability, and to make TEIs more accountable for their support of tertiary students with disabilities (Tertiary Education Commission, 2005d). 261 Accompanying this is the special education SSG, which is a grant for tutorial staff to work with disabled students on a one-to-one basis to promote the acquisition of knowledge and skills. The aim is to equip students for taking part in social and economic life in New Zealand. 262 Māori and Pasifika students are currently both supported by a single SSG that ties funding to the numbers of enrolled students who identify as having Māori or Pasifika ethnicity. It provides different levels of support depending on whether a student is enrolled at certificate and diploma, degree, or post-degree level – although from 2006 students enrolled below diploma level will not count toward this calculation. The aim is to provide incentives and funding for students to improve retention and completion rates amongst Māori and Pasifika learners, and to encourage such learners into areas where they are currently under-represented. A 2003 evaluation of the Māori and Pasifika SSG found that the scheme was seen to be a valuable tool in addressing the needs of these learners – although it also noted, as did the recent review of ethnically targeted policies and programmes, that consideration should be given to splitting the grant in order to recognise the different needs of Māori and Pasifika students (Ministry of Education, 2003b).54
54 Separate reports covered Māori and Pasifika experiences.

75
Foundation training and skill enhancement 263 The TEC operates three schemes to fund TEOs for running skill-development courses. 264 The first two of these are programmes that specifically support individuals who have low or no qualifications and who are currently receiving a state benefit – Training Opportunities (aimed at the long-term unemployed) and Youth Training (aimed at young learners). Although the courses do not provide them with financial assistance, students on such courses can continue to receive their existing income support. The schemes enhance overall social equity by providing the skills necessary for people to gain employment and build social capital. They also address equity within the tertiary sector by providing a base for moving on to higher qualifications. 265 The third scheme, Skill Enhancement, promotes training for Māori and Pasifika students: it comprises the Rangatahi Maia programme for Māori learners and Tupulaga Le Lumana'i for Pasifika learners. These programmes support learning that is vocationally focused and aimed at a higher level than foundation training. Both are being refined in the light of the recent review of ethnically targeted policies and programmes. Secondary Tertiary Alignment Resource (STAR) and Gateway 266 STAR and Gateway are aimed at senior students in secondary education; they allow these students to study for courses on the tertiary NQF. Operating across the twin divides between tertiary and secondary education and education and employment, STAR and Gateway are intended to build pathways for students who are at risk of leaving school with low or no qualifications. 267 STAR is not targeted at any particular group of senior students, but it has a clear equity aspect in terms of assisting those who might otherwise miss out on future opportunities. 268 The Gateway programme was launched in 2001 as a further attempt to promote the transition to ‘education, training, work or other options that will lead to long-term economic independence and wellbeing’ (Ministry of Education, 2004). Unlike STAR, Gateway is specifically targeted at assisting senior students in lower-decile secondary schools and thus addresses socio-economic inequity. 269 Both these programmes appear to have been reasonably effective at promoting transition to further training or employment. A recent evaluation, while recommending a number of administrative and monitoring changes, found that the STAR scheme is seen to be of significant value and held in high regard by the secondary sector (Vaughan and Kenneally, 2003). Similarly, in 2003, 30% of students on the Gateway programme moved on to employment and 65% carried on to further education or training (Ministry of Education, 2004). Affordability of tertiary education 270 Total government spending on tertiary education grew significantly as participation in tertiary education burgeoned in the 1990s. To make sure that the increased participation was funded, the share of the cost to be met by students rose. 271 More recently, efforts have been made to ease the costs of tertiary study for students by changes to the Student Loan Scheme – for instance, by providing full interest write-offs for full-time students and for part-time students on low incomes.

76
272 Policies have also been aimed at reducing the amount that needs to be borrowed – both by curbing the escalation of tuition fees, and increasing the number of students who are eligible for a student allowance. 273 The government stabilised tuition fees in 2001 as part of its commitment to help keep tertiary education affordable for students. The fee-stabilisation policy of 2001 to 2003 was replaced by the fee/course costs maxima (FCCM) policy for 2004 to 2006. A key aspect of the policy is the restriction it places on tuition-fee increases (limited to a maximum of 5% per annum) – which gives students greater certainty about future costs. It is also likely that FCCM will reduce the reliance of students on the Student Loan Scheme (see below).55 274 Since it came into effect, the fee-stabilisation policy has seen tertiary education become more affordable. The graph below compares the average weekly wage in New Zealand over the period 1997 to 2003 with the average fee charged for a full year’s study for a full-time student at a TEI (Ministry of Education, 2005h). Figure 6.1: Ratio of average domestic student fee at TEIs to average weekly income 1997-2003
0
1
2
3
4
5
6
1997 1998 1999 2000 2001 2002 2003
Universities Polytechnics Colleges of Education
Wānanga Overall Average
Source: Ministry of Education and Statistics New Zealand, New Zealand Income Survey. 275 Figure 6.2 shows that, in 2000, a full-time full year’s tuition fee in a university was, on average, the equivalent of six weeks’ average earnings. By 2003, this had dropped to five weeks. Student financial support 276 A variety of schemes provide financial assistance directly to students to help them with the costs of participating in tertiary education. Additional schemes fund courses aimed at individuals who receive state ‘social welfare’ payments – such as Youth Training and Training Opportunities, where students continue to receive their payments while they are enrolled in the course. Unemployment Benefit Student Hardship and the Accommodation Supplement benefit are also available for students in need during vacations.
55 Student groups dispute this assertion by claiming that the reliance will remain regales of changing trends in levels of borrowing.
77
Student Loan Scheme 277 The largest system of student financial support in New Zealand is the Student Loan Scheme. Students are able to borrow from the government the fees charged by their TEO, a fixed amount to cover course-related costs such as textbooks and materials, and a weekly amount to cover their cost of living. Interest on these loans is not accrued while a student is studying and from 1 April 2006, all borrowers who are not studying, irrespective of whether they have graduated with a qualification, will pay no interest on their student loan provided they are living in New Zealand. 278 Open access to the Student Loan Scheme, coupled with its income-contingent repayment features, has reduced the financial obstacles to tertiary education and lowered the risk to students and families of investing time and money in tertiary study. 279 When the scheme was introduced it was feared that students would not be prepared to take on the level of debt necessary to pay for their tertiary study. This has not been the case – the majority of full-time domestic students have loans.56 Between 1994 (two years after the scheme began) and 2004, the number of New Zealanders formally enrolled in TEIs rose by 82% while the number of borrowers increased even more - by 98%. 280 An indicator of the equitable nature of the scheme is the proportion of Māori and Pasifika borrowers: in 2004, this was similar to their shares of the overall student population. 281 The average amount borrowed (Ministry of Education et al, 2005) under the Student Loan Scheme in 2004 was $6,258. This amount is less than that for 2003, and is the first decrease since 1998/99; the decrease is mainly because more students are studying part-time. Median student-loan balances have grown since 2002, being $10,404 at 30 June 2005. This reflects the development of the loan scheme, rather than increases in the cost of tertiary education – more people are borrowing over a longer period of time. The forecast median loan-repayment time is now 6.7 years (compared with a forecast of 6.9 years in 2004). 282 The Student Loan Scheme, however, has not had universal public acceptance. The lack of consensus on the value of the scheme and the focus on debt accumulation by students have become prominent issues. The government’s 2005 election commitments dealt with the issue of consensus by increasing the scheme’s effective subsidy. Its election commitments to address debt accumulation included charging no interest on student loans for those borrowers in New Zealand, and providing an amnesty on penalties for borrowers in arrears who return to New Zealand or who enter into an acceptable instalment arrangement. The aim is to provide incentives for borrowers to remain in New Zealand, or return home sooner, and so contribute to New Zealand’s economy and society. 283 Other means the government has for supporting tertiary students are closely linked to loans. For instance, many government-funded scholarships deal with the affordability of tertiary education by providing grants to cover part of the scholar’s fees – which then reduces the entitlement to borrow under the scheme. In addition, any student allowances entitlement a student receives is subtracted from their living-cost loan entitlement. Student allowances 284 The second main form of government assistance is the Student Allowances Scheme, which is ‘designed to help people who are not in a position to support themselves with the assistance of their families, to meet their living costs while they are studying full-time’
56 Student groups dispute this assertion claiming it does not necessarily follow that students are prepared to take on the level of debt necessary to pay for their tertiary studies.
78
(Ministry of Education, 2003a). Student allowances are an equity-promoting tool aimed at students from lower socio-economic backgrounds. 285 The Student Allowance Scheme provides a weekly payment from the government. For students under 25, access to the scheme depends firstly on parental income. The full amount is available to those whose parents together earn less than a specified threshold, and then abates as parental income rises. Students also lose access to the scheme if their personal income is above a fixed threshold. Students of 25 or over are not subject to the parental income test, although they receive a lower allowance if they continue to live with their parents. 286 Despite an increase in the eligibility thresholds for parental income, the number of students under 25 years of age receiving a student allowance has been lower than expected. The current period of low unemployment may also have had the effect of lifting incomes of some families, resulting in lower allowances entitlements for their children. 287 Students who receive student allowances may also take up student loans, with (as mentioned above) the living-costs borrowing entitlement under the loan scheme being abated by the amount of the allowance. In 2004, 80% of student allowance recipients also took out a student loan (Ministry of Education, 2005). Those who received only a student allowance received $6,742 on average in 2004; those who also used the living-costs entitlement under the Student Loan Scheme borrowed $1,765 on average; and those who relied solely on the living-costs entitlement under the Student Loan Scheme borrowed an average of $4,489 during the year. 288 The proportion of Māori and Pasifika recipients of student allowances in 2004 were similar to their proportion of the overall student population. 289 In 2005, the government made an election commitment to increase access to student allowances through changes to the age at which targeting on parental income applies and through adjustments to the parental income thresholds. The aim is to have 50% of eligible students taking up allowances. Targeted equity scholarships 290 The government funds several different competitive scholarship schemes that serve a variety of purposes. Scholarships with an equity focus are mostly targeted at improving the participation of Māori and Pacific peoples in the tertiary sector at degree level or above. 291 Manaaki Tauira scholarships provide assistance toward tertiary fees for Māori students, and the Māori and Pacific Higher Education Scholarships provide full payment of fees and a living allowance to recipients for the length of their study. Several of these scholarships are currently in the process of being refined and modified. ‘Step Up’ scholarships 292 The Step Up scholarship programme was piloted in 2004 to encourage students from low-income backgrounds to study in the fields of human and animal health. Recipients must be under 25 and must be receiving a student allowance. Selection is based on merit determined by performance at secondary school. Recipients pay a flat fee of $1,000 a year, irrespective of the tuition fee for their chosen course, with the scholarship paying the remainder of the normal tuition fees for that course. 293 There were 213 applications approved for the ‘pilot’ Step Up scholarships in 2004, and the amount paid to students was, on average, $3,713 each (Ministry of Education, 2004).
79
294 From 2006, Step Up scholarships will also be available for school leavers from low-income backgrounds to study science and technology. Students must be in their final year of school or within one year of leaving, and are required to pay a flat fee of $2,000 towards their tuition fees. Training Incentive Allowance (TIA) 295 The TIA provides financial support to people receiving specific forms of state assistance so that they can undertake training for future employment. This assistance can be used directly for study – to offset fees, for example, or for associated expenses such as childcare. Most of those who take up the TIA receive the Domestic Purposes Benefit, a form of assistance for low-income sole parents. There were 21,411 TIA recipients in 2004, receiving on average around $1,850 each. Social mobility 296 There is a clear relationship in New Zealand between higher levels of education and increased indicators of social and economic wellbeing such as better health, improved employment outcomes and increased income. In 2004, the unemployment rate of those with degree-level or higher qualification was 2.7%, and with other tertiary qualifications 3.0%. This compared with a rate of 6.3% for those with no qualifications. The median weekly incomes for those with vocational qualifications at degree-level or higher qualification was $731; for those with other tertiary qualifications it was $537. This compared with $285 for those without qualifications (Ministry of Education, 2004). 297 Disparities between ethnic and gender groups close significantly with tertiary education.57 The unemployment rates for Māori and Europeans differ significantly between people with no qualifications, but in 2004 the rate was the same (1.9%) for those with a bachelors degree or higher. Women tend to have higher unemployment rates at almost all levels of qualifications, except at bachelors degree where their unemployment rate was lower than that for men.58 Māori with a bachelors degree or higher qualification had a median weekly income that was approximately the same as that of Europeans while the median income for Pasifika reached 85% of that of Europeans.59 The median weekly income for women in 2004 was 55% of that of men. However, at bachelors degree and higher qualifications this increased to 71%. 298 Completion of a tertiary qualification is an important factor in reducing income disparities. Māori and Pasifika gain relatively more income from completing a tertiary qualification than other ethnic groups Ministry of Education (2005i). This data also shows that the incomes of women who completed their qualifications were 96% of that of their male counterparts, compared with 87% for non-completion. 299 The relative gain in income for a woman holding a qualification (rather than no qualification) is greater than that of men for all levels of qualification held (Maani and Maloney, 2004). This does not mean that women earn more than men; instead, it implies that higher qualifications have the effect of reducing the disparities between the earnings of men and women. 300 Students from higher decile schools do better at completing a bachelors degree than those from lower deciles. However, when adjusted for other factors, the decile of the last
57 Source: Statistics New Zealand, Household Labour Force Survey. 58 Average for the year ended March 2004. 59 This analysis excludes investment income.
80
secondary school one attended was only a marginally statistically significant factor in completing a degree (Ministry of Education 2005c). 301 Other than these general measures, however, there has been no New Zealand research specifically on the relationship between social mobility and tertiary education.
302 Recent years have seen more monitoring of the outcomes of specific equity programmes. These reviews have generally found that participation in programmes aimed at building pathways or participation, such as Gateway or Skill Enhancement, have positive outcomes. For example, in 2003, 65% of all participants in Training Opportunities had moved into employment or further education or training within two months of completing their course (Ministry of Education, 2004). Similarly, an evaluation of the Training Incentive Allowance found that people receiving Domestic Purposes Benefits are more likely to move into part-time or full-time employment after participating in the TIA programme (Ministry of Social Development, 2004).
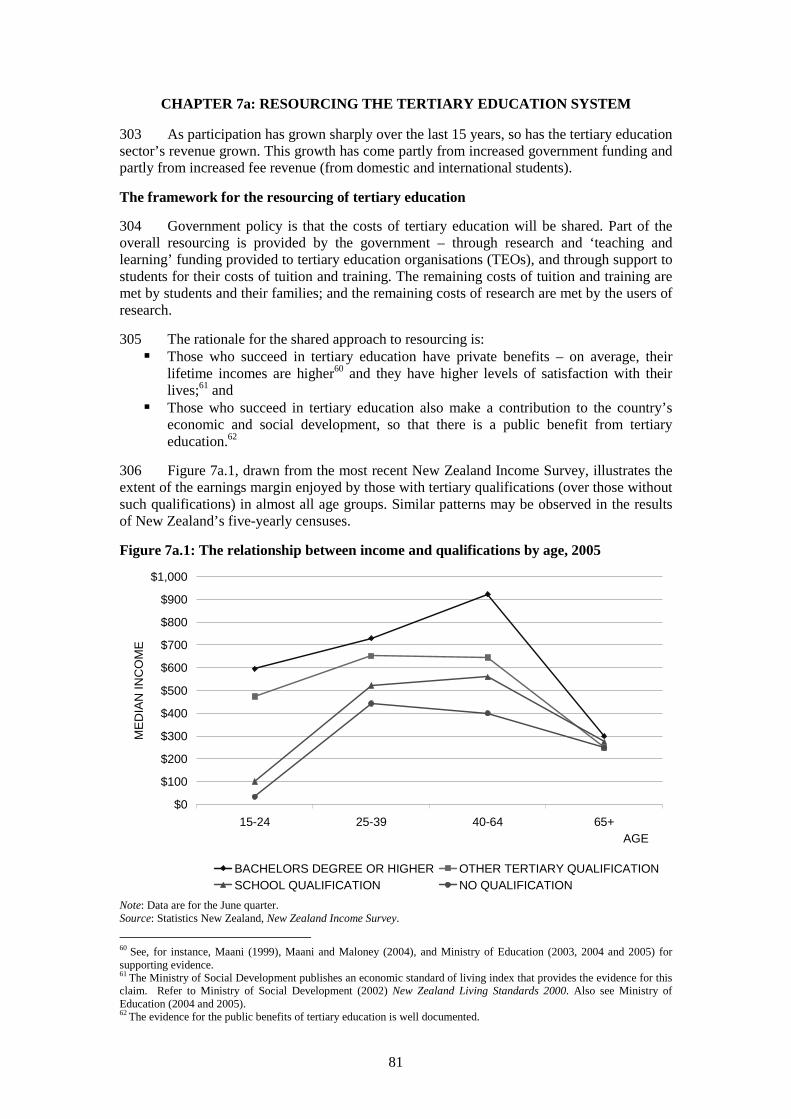
81
CHAPTER 7a: RESOURCING THE TERTIARY EDUCATION SYSTEM 303 As participation has grown sharply over the last 15 years, so has the tertiary education sector’s revenue grown. This growth has come partly from increased government funding and partly from increased fee revenue (from domestic and international students).
The framework for the resourcing of tertiary education
304 Government policy is that the costs of tertiary education will be shared. Part of the overall resourcing is provided by the government – through research and ‘teaching and learning’ funding provided to tertiary education organisations (TEOs), and through support to students for their costs of tuition and training. The remaining costs of tuition and training are met by students and their families; and the remaining costs of research are met by the users of research.
305 The rationale for the shared approach to resourcing is: Those who succeed in tertiary education have private benefits – on average, their
lifetime incomes are higher60 and they have higher levels of satisfaction with their lives;61 and
Those who succeed in tertiary education also make a contribution to the country’s economic and social development, so that there is a public benefit from tertiary education.62
306 Figure 7a.1, drawn from the most recent New Zealand Income Survey, illustrates the extent of the earnings margin enjoyed by those with tertiary qualifications (over those without such qualifications) in almost all age groups. Similar patterns may be observed in the results of New Zealand’s five-yearly censuses.
Figure 7a.1: The relationship between income and qualifications by age, 2005
$0
$100
$200
$300
$400
$500
$600
$700
$800
$900
$1,000
15-24 25-39 40-64 65+AGE
ME
DIA
N IN
CO
ME
BACHELORS DEGREE OR HIGHER OTHER TERTIARY QUALIFICATIONSCHOOL QUALIFICATION NO QUALIFICATION
Note: Data are for the June quarter. Source: Statistics New Zealand, New Zealand Income Survey.
60 See, for instance, Maani (1999), Maani and Maloney (2004), and Ministry of Education (2003, 2004 and 2005) for supporting evidence. 61 The Ministry of Social Development publishes an economic standard of living index that provides the evidence for this claim. Refer to Ministry of Social Development (2002) New Zealand Living Standards 2000. Also see Ministry of Education (2004 and 2005). 62 The evidence for the public benefits of tertiary education is well documented.
82
307 Because the costs of tertiary education are shared between government and students, the funding provided to TEOs by the government is seen as a subsidy – and, in general, it is not intended to meet the full cost of tuition. In most areas of tertiary education, TEOs charge a fee to students. In the case of industry training – where the trainees are in employment – the employers are expected to make a contribution, either in cost or in kind, to the cost of training.63 In the case of the research conducted by TEOs, there is an expectation that TEOs will supplement government research funding by raising funds through external research contracts. The structure of the government’s funding of tertiary education 308 The tertiary education system has an integrated funding framework. This framework is intended to resource and steer the tertiary education system, and to provide TEOs with the flexibility to operate in a responsive and innovative way. It has three broad elements:
Funding for the teaching and learning of domestic students, through the Student Component, the Industry Training Fund, and a number of targeted programmes;
Funding for research, through Centres of Research Excellence (CoREs) funding and the Performance-Based Research Fund (PBRF); and
Targeted funding, through a Strategic Development Component.
309 The framework as a whole has the following general features: Funding is delivered to TEOs as a bulk grant; No funding is delivered until the Tertiary Education Commission (TEC) approves
part or all of the TEO’s profile for funding purposes; and Over time, the funding framework is being moved to greater alignment with the goals
of the Tertiary Education Strategy (TES) 2002/07. 310 The government sets the total amount of funding available for tertiary education. The minister also determines the ‘design of funding mechanisms’ – that is, specifies the broad funding parameters. These parameters are communicated to the TEC, which is responsible for setting the operational rules for funding and for allocating funding to TEOs. The TEC then publishes its operational policy in funding guides.64 Under the Education Act 1989, the minister is not permitted to determine or intervene in the allocation of funding to any particular TEO. 311 TEOs must meet quality-assurance requirements as a pre-condition of eligibility for funding. Funding for teaching and learning 312 The level of funding for each TEO under the Student Component – by far the largest of the teaching and learning funding components – is determined by a calculation of the number of equivalent-full-time student (EFTS) places enrolled by each TEO in courses. Each course is assigned to a course classification, with each course classification allocated to a funding category which recognises the costs in the subject area covered by that classification. The funding category carries with it a funding rate per EFTS. 313 The number of EFTS that can be funded each year through the Student Component is subject to some limits. For instance, the government has established a limit to the number of EFTS that can be funded in private training establishments (PTEs). And there are limits to the extent to which increases in a TEO’s EFTS will be funded: if, in any year, there is an increase in a TEO’s EFTS of more than 15% or 1,000 EFTS (whichever is the greater), then the places
63 Refer to paragraph 317 below. 64 The guides are published by the Tertiary Education Commission and can be viewed at: www.tec.govt.nz

83
over that limit will not qualify for funding.65 In 2005, further limits on growth in enrolments at the certificate and diploma level were applied. There are also limits to the number of EFTS places that can be funded in certain high-cost specialist areas – such as dentistry, medicine, aviation, and veterinary science. Currently, however, there are no limits on the number of domestic EFTS places at degree and postgraduate level that will be funded in classifications such as arts, science, law and commerce: if enrolments rise in these fields at degree level, more funding will be generated for the TEO. 314 Quality assurance has always been a prerequisite for Student Component funding. The government has also signalled its intention to make 5% of Student Component funding linked to performance, using three performance indicators – student retention rates, rates of successful completion of courses, and the results of a learner survey. 315 International students do not attract teaching and learning funding.66 TEOs are expected to charge fees for international students that cover the full cost of their learning. 316 Funding for industry training and for targeted programmes67 is delivered through funding contracts between the TEC and TEOs. These contracts specify the number of learners to be funded and a number of performance measures. 317 Industry training is jointly funded by government and industry. The government’s contribution is made through the Industry Training Fund, with industry contributions being cash or in kind. Employees may bear some of the costs, by meeting some proportion of training fees or by accepting a lower rate of pay as part of the training arrangement. During 2004, the government invested $125 million in industry training while industry’s investment was $47 million in cash (27% of the total).68 Funding for research 318 Until 2004, the main funding for the research activities of TEOs was delivered as part of the Student Component funding for degree and postgraduate enrolments. This system of funding is being phased out over the period 2004 to 2007 as the new PBRF is introduced. Under the PBRF, funding is allocated to TEOs on the basis of their research performance, using a set of performance indicators complemented by peer assessment of the quality of their research. 319 In 2002, the government invited bids from TEOs to host CoREs, research networks focused on areas of established research excellence of importance to New Zealand. Seven CoREs were funded, each for a period of six years. 320 In addition to these sources of research funding, TEOs active in research raise additional research revenue through the contestable science funds funded by the government through Vote:RST (Research, Science and Technology). TEOs also bid for contracts to provide research for firms and other organisations that want research reports for the purposes of their businesses. 321 More detail on the financing of research is provided in Chapter 5 of this report.
65 In 2005, further limits on growth in enrolments at the certificate and diploma level were applied. 66 There are two exceptions to this statement. The first is in relation to international students enrolled in wholly research courses: these students attract some funding in recognition of the contribution they make to the country’s research effort. The second exception relates to international students enrolled for a doctoral degree: from 2006, such students will attract funding in some circumstances. 67 Such as Training Opportunities and Youth Training. 68 Research indicates that the employers’ actual cash contribution is likely to be understated in the data. This figure also ignores the value of contributions in kind – such as time spent in mentoring trainees.
84
The Strategic Development Component 322 The Strategic Development Component contains a number of funds intended to help tertiary education institutions (TEIs)69 align their provision with the TES. Among the funds in this component are:
Special Supplementary Grants – Tertiary Students with Disabilities: These provide funding for TEIs so that they can help students with disabilities to participate and achieve in tertiary education.
Partnerships for Excellence: This fund enables TEIs to support major strategic initiatives. Government funding under this scheme is to be matched by contributions from the private sector.
ITP Business Links Fund: Participation in this fund requires institutes of technology and polytechnics (ITPs) to negotiate an industry engagement plan with the TEC. The plan outlines how an ITP intends to engage or expand its connections with business and industry groups. Funding is allocated on the basis of achieving agreed milestones under the plan.
323 Other funds included in the Strategic Development Component are the Innovation Development Fund, which is intended to help TEIs develop initiatives that will support their strategies, and the e-Learning Collaborative Development Fund, which funds projects where TEOs work together on innovative e-learning projects. The approach taken to student fees 324 As noted above, the private benefits that flow from tertiary education are recognised through a student contribution to the costs of tuition or, in the case of industry training, through an employer contribution. 325 Until 1989, the fees charged to students in tertiary education in New Zealand were very low. In 1989, the fee for full-time full-year study at a university in New Zealand was less than $300 – and, for most students, 90% of that cost was met by the government through a fees grant (paid through the student support system). 326 In 1990, as a means of helping meet the increasing costs of expanding participation in tertiary education, the then government introduced a standard tertiary fee of $1,250 for full-year full-time study and abolished the fees grant. This move was seen by students as part of a trend towards a ‘user-pays’ approach to the provision of public services – a shift that students associations have continued to object to. 327 In the 1991 Budget, a newly elected government abolished the standard tertiary fee and allowed TEOs to set their own fees without regulation. The TEOs had the freedom to use fee-setting as part of their organisational strategy. They were free to set fees that differentiated between different fields of study, between different levels of study, and between different types of students. 328 Over the period 1991 to 1999, the rate of funding per EFTS was reduced progressively (Tertiary Education Advisory Commission, 2001; Ministry of Education, 2004), with most TEOs recovering the decreases in funding by increasing their fees each year. It is estimated that average fees increased by 170% from 1991 to 1999,70 while the consumer price index (CPI) rose by a little over 13% over the same period.
69 The public-sector providers of tertiary education – universities, institutes of technology and polytechnics (ITPs), colleges of education, and wānanga. 70 The average fee rise per year was around 13%.
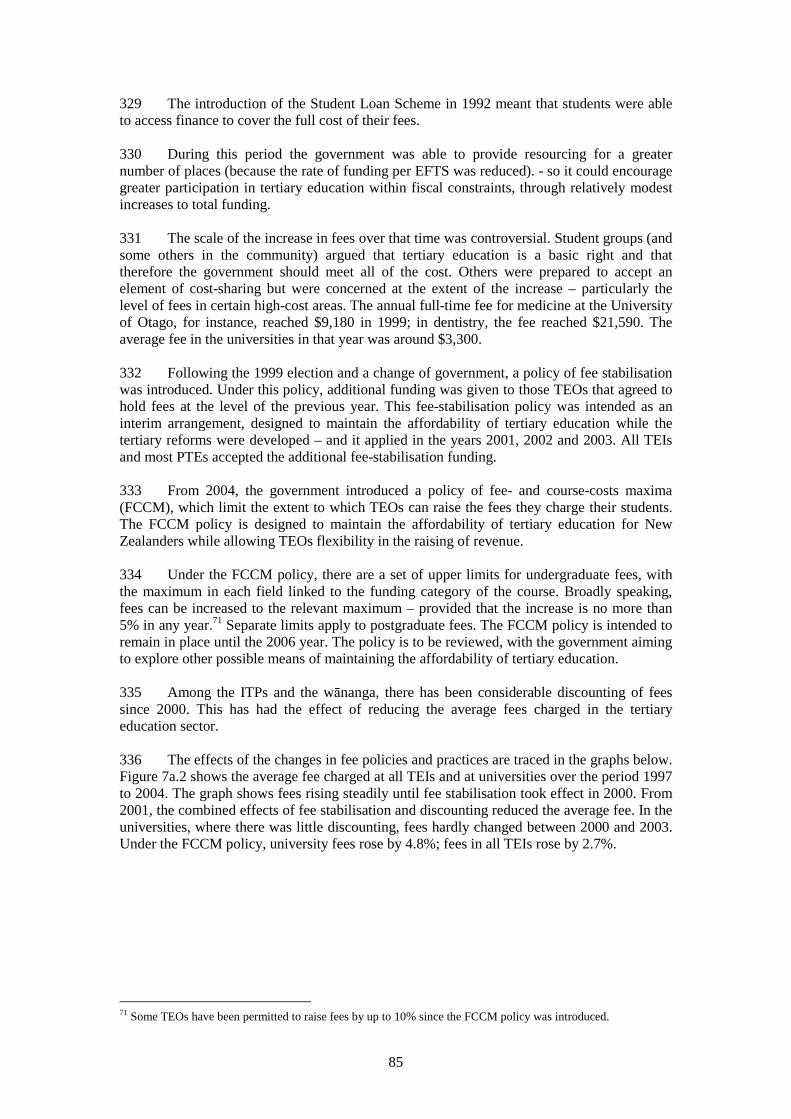
85
329 The introduction of the Student Loan Scheme in 1992 meant that students were able to access finance to cover the full cost of their fees. 330 During this period the government was able to provide resourcing for a greater number of places (because the rate of funding per EFTS was reduced). - so it could encourage greater participation in tertiary education within fiscal constraints, through relatively modest increases to total funding. 331 The scale of the increase in fees over that time was controversial. Student groups (and some others in the community) argued that tertiary education is a basic right and that therefore the government should meet all of the cost. Others were prepared to accept an element of cost-sharing but were concerned at the extent of the increase – particularly the level of fees in certain high-cost areas. The annual full-time fee for medicine at the University of Otago, for instance, reached $9,180 in 1999; in dentistry, the fee reached $21,590. The average fee in the universities in that year was around $3,300. 332 Following the 1999 election and a change of government, a policy of fee stabilisation was introduced. Under this policy, additional funding was given to those TEOs that agreed to hold fees at the level of the previous year. This fee-stabilisation policy was intended as an interim arrangement, designed to maintain the affordability of tertiary education while the tertiary reforms were developed – and it applied in the years 2001, 2002 and 2003. All TEIs and most PTEs accepted the additional fee-stabilisation funding. 333 From 2004, the government introduced a policy of fee- and course-costs maxima (FCCM), which limit the extent to which TEOs can raise the fees they charge their students. The FCCM policy is designed to maintain the affordability of tertiary education for New Zealanders while allowing TEOs flexibility in the raising of revenue. 334 Under the FCCM policy, there are a set of upper limits for undergraduate fees, with the maximum in each field linked to the funding category of the course. Broadly speaking, fees can be increased to the relevant maximum – provided that the increase is no more than 5% in any year.71 Separate limits apply to postgraduate fees. The FCCM policy is intended to remain in place until the 2006 year. The policy is to be reviewed, with the government aiming to explore other possible means of maintaining the affordability of tertiary education. 335 Among the ITPs and the wānanga, there has been considerable discounting of fees since 2000. This has had the effect of reducing the average fees charged in the tertiary education sector. 336 The effects of the changes in fee policies and practices are traced in the graphs below. Figure 7a.2 shows the average fee charged at all TEIs and at universities over the period 1997 to 2004. The graph shows fees rising steadily until fee stabilisation took effect in 2000. From 2001, the combined effects of fee stabilisation and discounting reduced the average fee. In the universities, where there was little discounting, fees hardly changed between 2000 and 2003. Under the FCCM policy, university fees rose by 4.8%; fees in all TEIs rose by 2.7%.
71 Some TEOs have been permitted to raise fees by up to 10% since the FCCM policy was introduced.
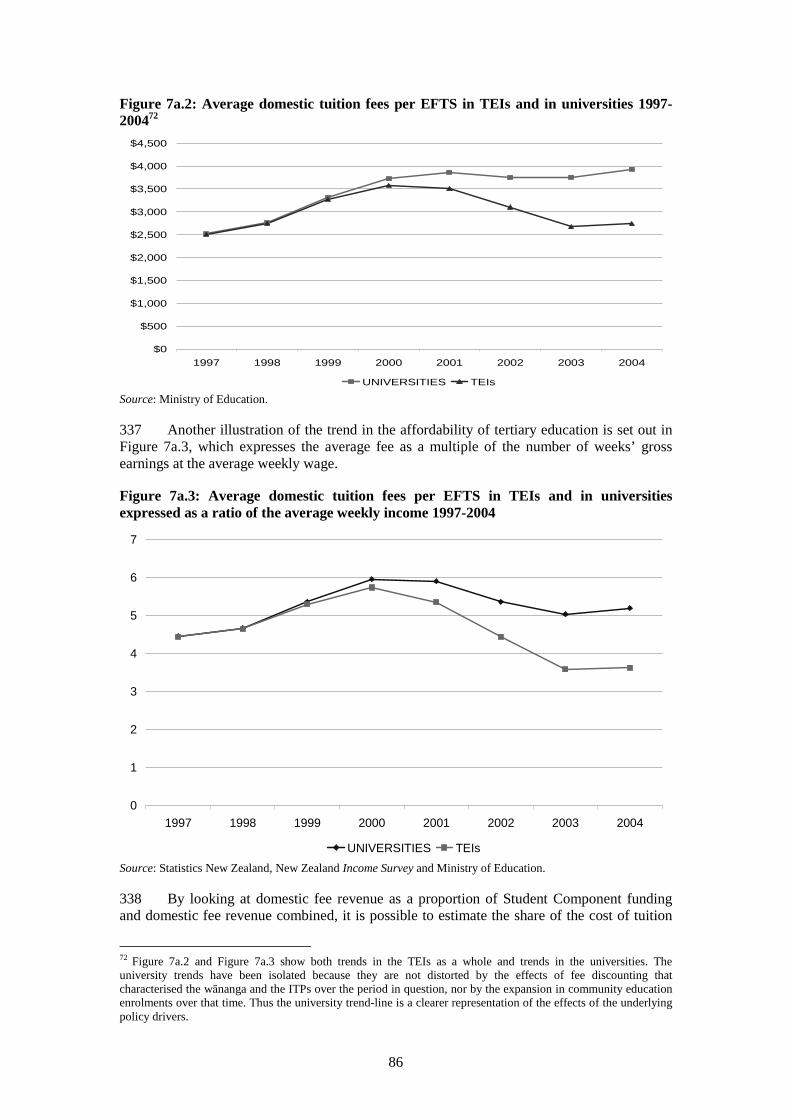
86
Figure 7a.2: Average domestic tuition fees per EFTS in TEIs and in universities 1997-200472
$0
$500
$1,000
$1,500
$2,000
$2,500
$3,000
$3,500
$4,000
$4,500
1997 1998 1999 2000 2001 2002 2003 2004
UNIVERSITIES TEIs Source: Ministry of Education. 337 Another illustration of the trend in the affordability of tertiary education is set out in Figure 7a.3, which expresses the average fee as a multiple of the number of weeks’ gross earnings at the average weekly wage. Figure 7a.3: Average domestic tuition fees per EFTS in TEIs and in universities expressed as a ratio of the average weekly income 1997-2004
0
1
2
3
4
5
6
7
1997 1998 1999 2000 2001 2002 2003 2004
UNIVERSITIES TEIs Source: Statistics New Zealand, New Zealand Income Survey and Ministry of Education. 338 By looking at domestic fee revenue as a proportion of Student Component funding and domestic fee revenue combined, it is possible to estimate the share of the cost of tuition
72 Figure 7a.2 and Figure 7a.3 show both trends in the TEIs as a whole and trends in the universities. The university trends have been isolated because they are not distorted by the effects of fee discounting that characterised the wānanga and the ITPs over the period in question, nor by the expansion in community education enrolments over that time. Thus the university trend-line is a clearer representation of the effects of the underlying policy drivers.
87
paid by students. Over the period 1997 to 2000, the proportion paid by students at all TEIs rose from 25% to 33%. Between 2000 and 2004, this fell to 26%. In universities, the proportion paid by students rose from 24% to 32% between 1997 and 2000. Between 2000 and 2004, it fell to 30%. 339 There is no special taxation treatment of private contributions to the cost of tertiary education. The student support system 340 Students finance their studies from a variety of sources. These include:
Student loans through the government’s Student Loan Scheme; Student allowances, which are available to students over 25 and to those under 25
whose parents’ incomes are below particular thresholds; and Part-time and vacation employment.
341 In 1989, the old tertiary grants system was replaced by student allowances (which are designed to help students meet their living expenses while they are studying). For those under 20 years of age, allowances were targeted against their parents’ incomes. In 1992, the Student Loan Scheme was introduced, with the intention of enabling students to meet the cost of tuition and other course-related expenses and also to provide assistance with living expenses for those with partial or no student allowances entitlement. Open access to the Student Loan Scheme, coupled with its income-contingent repayment features, has reduced the financial obstacles to tertiary education and lowered the risks to students and families of investing time and money in study. 342 With the introduction of student loans, the targeting provisions of the student allowances scheme were changed: eligibility for allowances for students under the age of 25 was based on their parents’ incomes. 343 Since 1999, the government has also introduced a variety of scholarships intended to improve the affordability of tertiary education for particular groups of students. 344 Student support has proved a controversial area of policy. There has been widespread opposition to student loans. Student groups have opposed the concept in principle, arguing that the notion of loans is contrary to their view that tertiary education is a right and that it should be wholly funded by the government. More broadly, there has been concern at the rate of increase in levels of student loans and at possible downstream impacts of loans – such as delays in childbearing and home ownership, and increases in the numbers of former students who leave New Zealand. The evidence for these impacts is rather sketchy. Nonetheless, the perception that loans have negative impacts is widespread. 345 There is also a substantial body of opinion in support of the current model – and there are arguments in favour of the current combination of an income-contingent loan scheme and targeted student allowances. The current model is progressive (in that it targets assistance according to means), and it provides savings that help the government increase access to tertiary education. Student loans with open access address the risk that the costs of study deter people from participating, because student loans provide finance up-front to meet those costs. The income-contingent repayment rules mean that those who receive an income benefit from their tertiary education repay, while those whose study doesn’t lead to higher incomes don’t have to meet repayment obligations. Loans are much less costly than many alternative approaches to student support – especially the universal grant system (which also would be regressive in its effects, disproportionately benefiting those from higher income families). In addition, the current targeting of allowances provides extra financial support for students from lower-income families, who might be more debt averse.
88
346 The government has sought to address such public concerns and perceptions with a programme of improved information on student support,73 and with a succession of changes to loans and allowances that have increased concessions in the former and broadened access to the latter. 347 The following paragraphs describe the student support system and its recent changes. Student loans 348 Student loans are available to all domestic students studying approved qualifications. Loans have four components:
Compulsory fees: Students can borrow the full amount of their compulsory fees. Course-related costs: Students can borrow up to $1,000 each year to help cover
expenses related to their studies, such as equipment, textbooks and field trips. Living costs: Full-time students can access a living-costs entitlement of $150 per
week for each week of the course, less any net entitlement to student allowances. Administration fee: Each time a new loan account is established, an administration
fee of $50 is charged. 349 Drawings from the Student Loan Scheme have attracted a real interest charge (i.e. the full interest rate was higher than the inflation rate). Until 2000, interest was charged on all loans, with interest write-offs for those on low incomes. In 2000, the government changed the scheme to write-off all interest for all full-time students and for part-time students on low incomes, and to provide further write-offs for those on low incomes. In effect, around half of all interest charged between 2000 and 2005 was written off: while the full interest rate is 7%, the effective interest rate74 in 2005/06 was expected to be 3.3%. In December 2005, the government passed legislation to write-off interest for all borrowers who are resident in New Zealand, with effect from 1 April 2006. 350 The collection of loan repayments is handled through the tax system, with payments being made to the Inland Revenue Department. As long as a borrower is resident in New Zealand, repayments are based on his or her income.75 Any borrower earning over the repayment threshold during an income year is required to make repayments towards the loan at the rate of 10 cents for every dollar of income over the income threshold. 351 Around 150,000 students have borrowed through the loan scheme in each year since 2001, with around 53% of eligible students using the scheme under the current scheme parameters. Median borrowing in 2004 was a little over $5,400. Around 445,000 people (or 14% of all New Zealanders aged 15 or over) had undischarged loan balances with Inland Revenue at 30 June 2005, the median balance being $10,400. The data show that the median loan balance on leaving study was $9,250 in 2001.76 The total of loan balances on 30 June 2005 was $7,499 billion.
73 In particular, an integrated dataset has been created that links educational data and borrowing and debt data to information on post-study incomes. See the Student Loan Scheme Annual Report to 30 June 2005 and reports drawn from that integrated dataset (available at www.minedu.govt.nz/goto/tertiaryanalysis). 74 That is, the amount of interest actually charged as a proportion of balances outstanding. For detailed information on this aspect of the scheme, see Ministry of Education, Ministry of Social Development and Inland Revenue (2005) Student Loan Scheme Annual Report to 30 June 2005 (available at www.minedu.govt.nz/goto/tertiaryanalysis). 75 For borrowers not resident in New Zealand, the required repayments are unrelated to income. 76 It is not possible to give more recent data on this indicator because it depends on an analysis from the integrated dataset – which is therefore subject to delays – and also because it is necessary to wait to distinguish between those who have left study and those who have simply taken time out. The ‘leaving-study’ loan balance is thought to have risen by no more than 3%-4% since then.
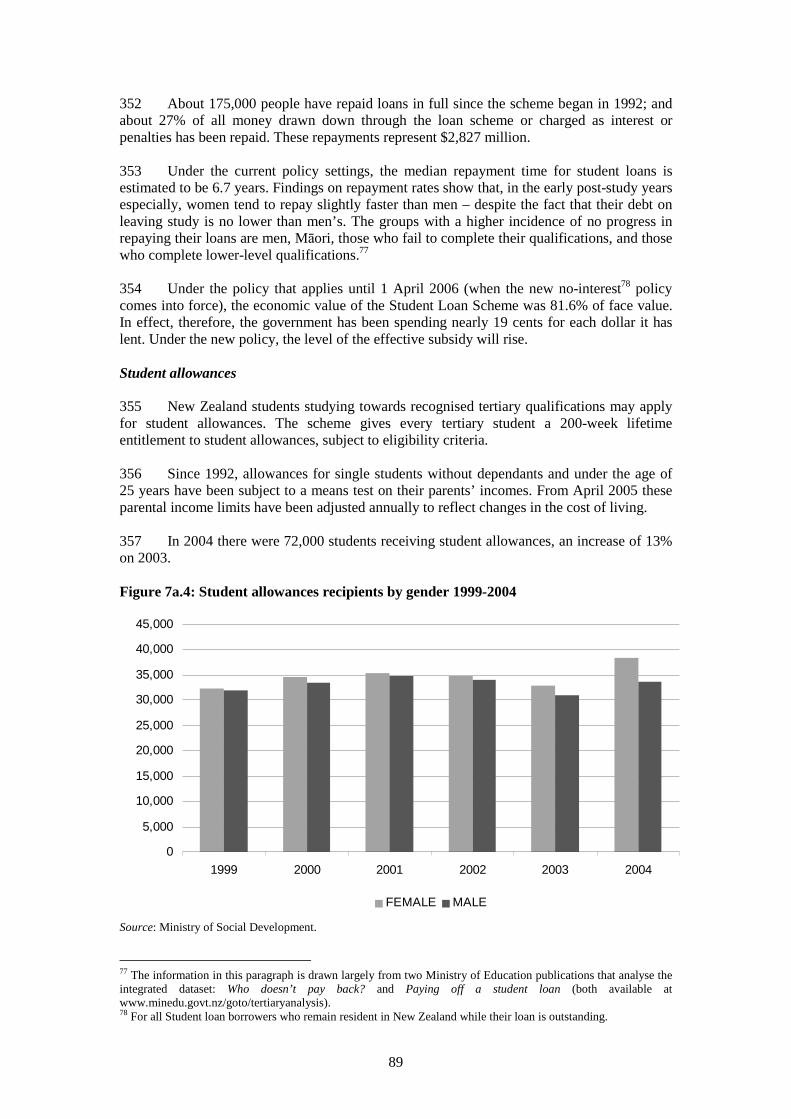
89
352 About 175,000 people have repaid loans in full since the scheme began in 1992; and about 27% of all money drawn down through the loan scheme or charged as interest or penalties has been repaid. These repayments represent $2,827 million. 353 Under the current policy settings, the median repayment time for student loans is estimated to be 6.7 years. Findings on repayment rates show that, in the early post-study years especially, women tend to repay slightly faster than men – despite the fact that their debt on leaving study is no lower than men’s. The groups with a higher incidence of no progress in repaying their loans are men, Māori, those who fail to complete their qualifications, and those who complete lower-level qualifications.77 354 Under the policy that applies until 1 April 2006 (when the new no-interest78 policy comes into force), the economic value of the Student Loan Scheme was 81.6% of face value. In effect, therefore, the government has been spending nearly 19 cents for each dollar it has lent. Under the new policy, the level of the effective subsidy will rise. Student allowances 355 New Zealand students studying towards recognised tertiary qualifications may apply for student allowances. The scheme gives every tertiary student a 200-week lifetime entitlement to student allowances, subject to eligibility criteria. 356 Since 1992, allowances for single students without dependants and under the age of 25 years have been subject to a means test on their parents’ incomes. From April 2005 these parental income limits have been adjusted annually to reflect changes in the cost of living. 357 In 2004 there were 72,000 students receiving student allowances, an increase of 13% on 2003. Figure 7a.4: Student allowances recipients by gender 1999-2004
0
5,000
10,000
15,000
20,000
25,000
30,000
35,000
40,000
45,000
1999 2000 2001 2002 2003 2004
FEMALE MALE
Source: Ministry of Social Development.
77 The information in this paragraph is drawn largely from two Ministry of Education publications that analyse the integrated dataset: Who doesn’t pay back? and Paying off a student loan (both available at www.minedu.govt.nz/goto/tertiaryanalysis). 78 For all Student loan borrowers who remain resident in New Zealand while their loan is outstanding.
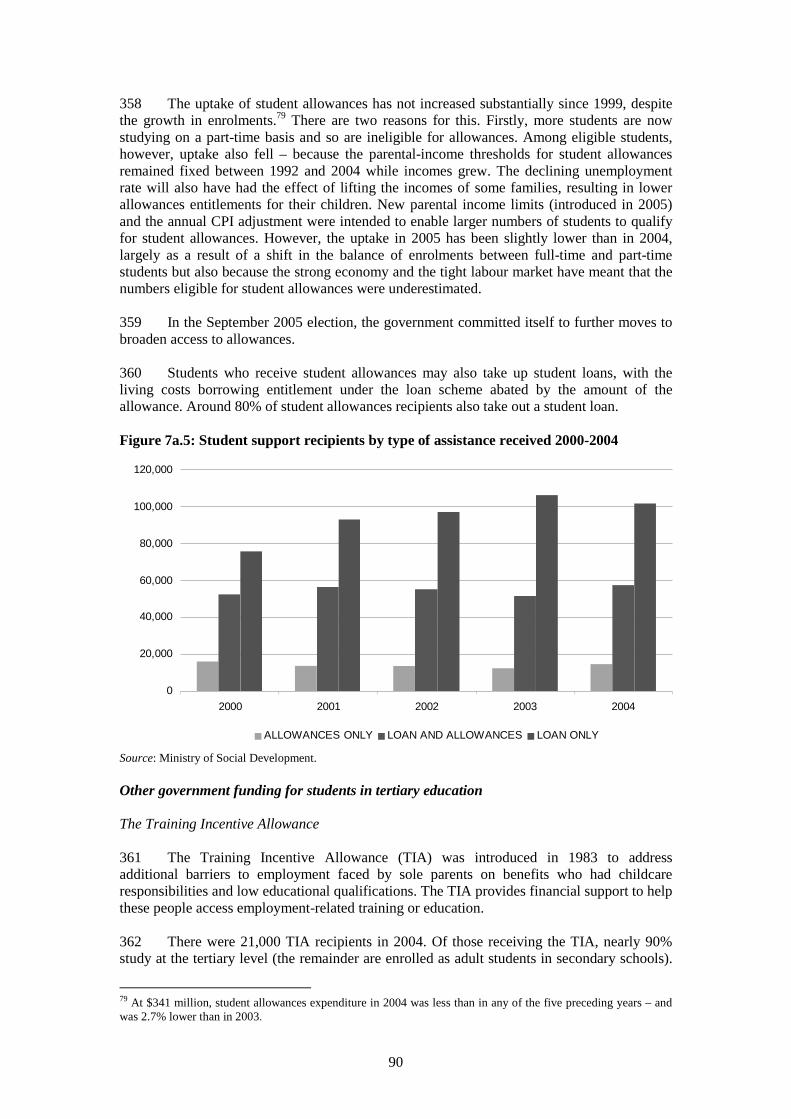
90
358 The uptake of student allowances has not increased substantially since 1999, despite the growth in enrolments.79 There are two reasons for this. Firstly, more students are now studying on a part-time basis and so are ineligible for allowances. Among eligible students, however, uptake also fell – because the parental-income thresholds for student allowances remained fixed between 1992 and 2004 while incomes grew. The declining unemployment rate will also have had the effect of lifting the incomes of some families, resulting in lower allowances entitlements for their children. New parental income limits (introduced in 2005) and the annual CPI adjustment were intended to enable larger numbers of students to qualify for student allowances. However, the uptake in 2005 has been slightly lower than in 2004, largely as a result of a shift in the balance of enrolments between full-time and part-time students but also because the strong economy and the tight labour market have meant that the numbers eligible for student allowances were underestimated. 359 In the September 2005 election, the government committed itself to further moves to broaden access to allowances. 360 Students who receive student allowances may also take up student loans, with the living costs borrowing entitlement under the loan scheme abated by the amount of the allowance. Around 80% of student allowances recipients also take out a student loan. Figure 7a.5: Student support recipients by type of assistance received 2000-2004
0
20,000
40,000
60,000
80,000
100,000
120,000
2000 2001 2002 2003 2004
ALLOWANCES ONLY LOAN AND ALLOWANCES LOAN ONLY
Source: Ministry of Social Development. Other government funding for students in tertiary education The Training Incentive Allowance 361 The Training Incentive Allowance (TIA) was introduced in 1983 to address additional barriers to employment faced by sole parents on benefits who had childcare responsibilities and low educational qualifications. The TIA provides financial support to help these people access employment-related training or education. 362 There were 21,000 TIA recipients in 2004. Of those receiving the TIA, nearly 90% study at the tertiary level (the remainder are enrolled as adult students in secondary schools).
79 At $341 million, student allowances expenditure in 2004 was less than in any of the five preceding years – and was 2.7% lower than in 2003.
91
The majority of TIA recipients are enrolled at ITPs; and the proportion of TIA recipients attending universities has remained steady at around 15 to 16%. 363 The TIA is managed by the Ministry of Social Development. The government allocated $43 million to the TIA in 2003/04 (compared with $45 million in 2001/02 and $34 million in 1999/2000). Scholarships and fellowships 364 The government offers scholarships and fellowships to:
Support doctoral research students; Promote linkages between businesses and TEIs (by supporting research students who
conduct their research while working in a business); Support top scholars from schools to undertake tertiary study; Encourage students to undertake study in science and technology subjects; Ensure an adequate supply of qualified teachers; and Assist successful sportspeople in gaining qualifications that will enable them to obtain
employment at the end of their sporting careers. 365 Such scholarships and fellowships include:
Step Up Scholarships, targeted at students from low- to medium-income families who have high academic potential and who are studying at degree level in health and a number of other specified areas;
Top Achiever Doctoral Scholarships, which recognise and support high-performing research students in their study at advanced levels in any discipline locally or internationally;
Enterprise Scholarships, designed to support students undertaking research projects in collaboration with a business (and so to ensure that research undertaken by students is more closely related to industry requirements);
Technology for Industry Fellowships, targeted at research students in science, engineering and technology who wish to be involved in commercial research and development within firms that use technological innovation to drive business growth;
New Zealand Science and Technology Post-Doctoral Fellowships, which provide support for New Zealand scientists, engineers and social scientists of outstanding talent working in post-doctoral research either in New Zealand or overseas;
School Top Scholars, targeted at top-achievers in the secondary-school NCEA level 3 and level 4 examinations who move on to tertiary study;
TeachNZ Scholarships, designed to encourage people with qualifications in particular areas to enter teacher training;
Manāki Tauira, a fee subsidy for Māori tertiary students; Māori and Pacific Higher Education Scholarships, targeted at Māori and Pasifika
students who have achieved NCEA level 3 at secondary school and who are studying or intending to study at a TEI;
Tūāpapa Pūtaiao Māori Fellowships, designed to support Māori undertaking research degrees in science and currently focused on science, engineering and technology;
Bonded Merit Scholarships, for top-achieving tertiary students;80 and The Prime Minister’s Scholarship, for students who perform at the elite level in
sport.
80 Recipients of Bonded Merit Scholarships must remain in New Zealand after they complete their study, for a length of time equivalent to the scholarship.
92
366 There are many other scholarships and fellowships administered by trusts, industry groups or TEOs. Information about these can be found on the Funding Information Service’s ‘Breakout’ database (at www.fis.org.nz/BreakOut/). 367 The Foundation for Research, Science and Technology (FRST) manages a number of schemes that support people in undertaking research. Each of these schemes has been developed to meet different needs:
To recognise and reward excellence; To support companies; To build links between companies and TEOs; and To increase the numbers of Māori involved in postgraduate research.
Other sources of financing for students 368 In addition to scholarships and financial support from the government, most students support themselves through part-time and vacation employment and through assistance from their families. 369 The New Zealand University Students’ Association (NZUSA) conducts periodic surveys of the expenditure and income of students (TNS, 2004; Ministry of Education, 2005i). The most recent survey, published in 2004, states that 67% of full-time students had regular term-time work in 2004 (compared with 41% in 2001). However, only 64% had summer vacation work (compared with 77% in 2001). Those working regularly during term-time had a median income of about $2,500 from that source, roughly the same as in 2001 – and those students worked on average 13 hours per week. 370 Students who receive student allowances during the academic year and who are unable to find vacation employment may receive the Unemployment Benefit Student Hardship during that vacation. 371 Students are helped in finding vacation work by Student Job Search, an organisation owned by students’ associations and part-funded by the government. Among other things, it manages a job-finder service through much of the country. Recent trends in government funding of tertiary education 372 Between 1999/2000 and 2004/05, government operating expenditure81 on tertiary education increased by 44% (from $1,887 million to $2,721 million). In real terms,82 this amounted to an increase of 27%. 373 Figure 7a.6 below traces trends in government tertiary education expenditure over the last six fiscal years, in both real and nominal terms.
81 The main difference between total and operating expenditure is student loans: most of the money drawn down under the loan scheme is treated as a capital item. 82 The CPI has been used to calculate the increase in real operating expenditure.
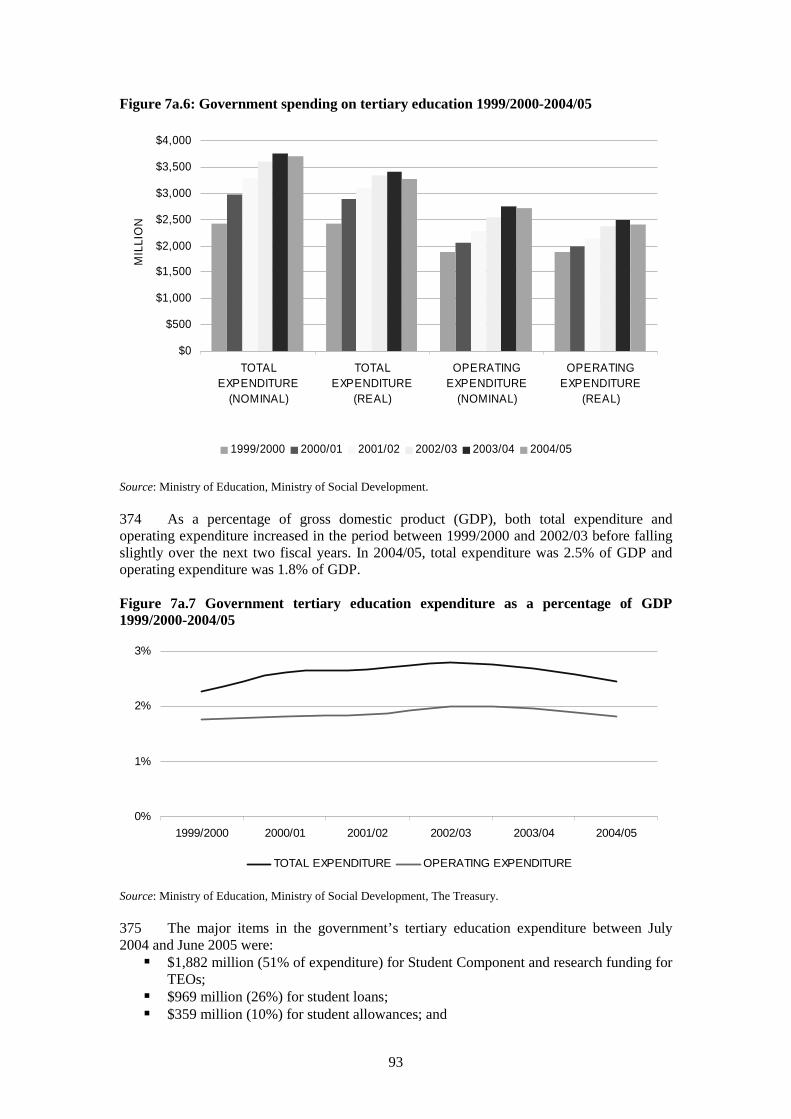
93
Figure 7a.6: Government spending on tertiary education 1999/2000-2004/05
$0
$500
$1,000
$1,500
$2,000
$2,500
$3,000
$3,500
$4,000
TOTALEXPENDITURE
(NOMINAL)
TOTALEXPENDITURE
(REAL)
OPERATINGEXPENDITURE
(NOMINAL)
OPERATINGEXPENDITURE
(REAL)
MIL
LIO
N
1999/2000 2000/01 2001/02 2002/03 2003/04 2004/05
Source: Ministry of Education, Ministry of Social Development. 374 As a percentage of gross domestic product (GDP), both total expenditure and operating expenditure increased in the period between 1999/2000 and 2002/03 before falling slightly over the next two fiscal years. In 2004/05, total expenditure was 2.5% of GDP and operating expenditure was 1.8% of GDP. Figure 7a.7 Government tertiary education expenditure as a percentage of GDP 1999/2000-2004/05
0%
1%
2%
3%
1999/2000 2000/01 2001/02 2002/03 2003/04 2004/05
TOTAL EXPENDITURE OPERATING EXPENDITURE
Source: Ministry of Education, Ministry of Social Development, The Treasury. 375 The major items in the government’s tertiary education expenditure between July 2004 and June 2005 were:
$1,882 million (51% of expenditure) for Student Component and research funding for TEOs;
$969 million (26%) for student loans; $359 million (10%) for student allowances; and
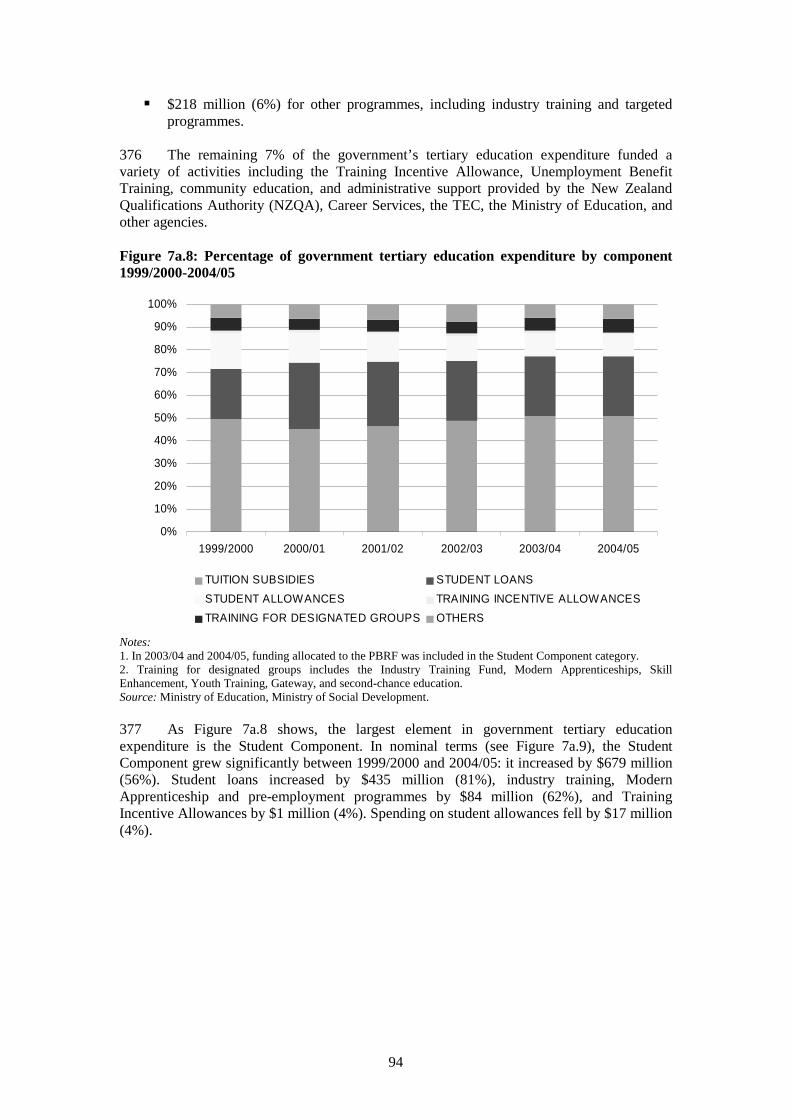
94
$218 million (6%) for other programmes, including industry training and targeted programmes.
376 The remaining 7% of the government’s tertiary education expenditure funded a variety of activities including the Training Incentive Allowance, Unemployment Benefit Training, community education, and administrative support provided by the New Zealand Qualifications Authority (NZQA), Career Services, the TEC, the Ministry of Education, and other agencies. Figure 7a.8: Percentage of government tertiary education expenditure by component 1999/2000-2004/05
0%
10%
20%
30%
40%
50%
60%
70%
80%
90%
100%
1999/2000 2000/01 2001/02 2002/03 2003/04 2004/05
TUITION SUBSIDIES STUDENT LOANS
STUDENT ALLOWANCES TRAINING INCENTIVE ALLOWANCES
TRAINING FOR DESIGNATED GROUPS OTHERS
Notes: 1. In 2003/04 and 2004/05, funding allocated to the PBRF was included in the Student Component category. 2. Training for designated groups includes the Industry Training Fund, Modern Apprenticeships, Skill Enhancement, Youth Training, Gateway, and second-chance education. Source: Ministry of Education, Ministry of Social Development. 377 As Figure 7a.8 shows, the largest element in government tertiary education expenditure is the Student Component. In nominal terms (see Figure 7a.9), the Student Component grew significantly between 1999/2000 and 2004/05: it increased by $679 million (56%). Student loans increased by $435 million (81%), industry training, Modern Apprenticeship and pre-employment programmes by $84 million (62%), and Training Incentive Allowances by $1 million (4%). Spending on student allowances fell by $17 million (4%).
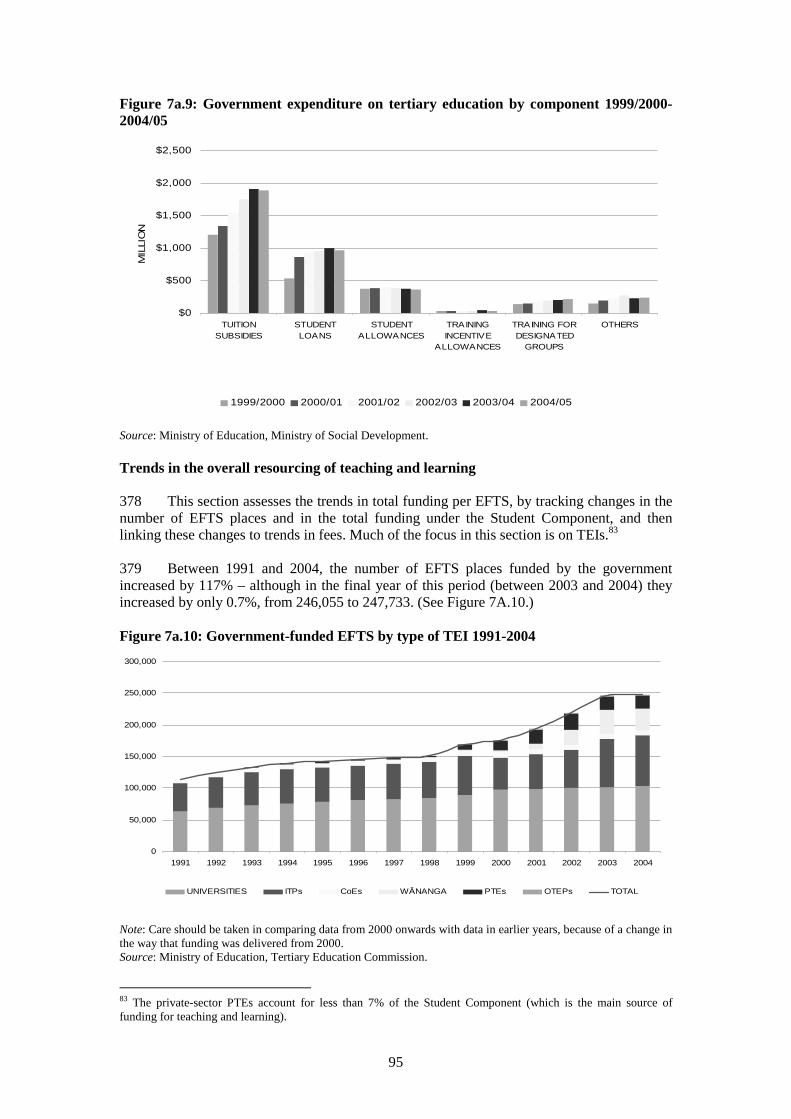
95
Figure 7a.9: Government expenditure on tertiary education by component 1999/2000-2004/05
$0
$500
$1,000
$1,500
$2,000
$2,500
TUITIONSUBSIDIES
STUDENTLOANS
STUDENTALLOWANCES
TRAININGINCENTIVE
ALLOWANCES
TRAINING FORDESIGNATED
GROUPS
OTHERS
MIL
LIO
N
1999/2000 2000/01 2001/02 2002/03 2003/04 2004/05
Source: Ministry of Education, Ministry of Social Development. Trends in the overall resourcing of teaching and learning 378 This section assesses the trends in total funding per EFTS, by tracking changes in the number of EFTS places and in the total funding under the Student Component, and then linking these changes to trends in fees. Much of the focus in this section is on TEIs.83 379 Between 1991 and 2004, the number of EFTS places funded by the government increased by 117% – although in the final year of this period (between 2003 and 2004) they increased by only 0.7%, from 246,055 to 247,733. (See Figure 7A.10.) Figure 7a.10: Government-funded EFTS by type of TEI 1991-2004
0
50,000
100,000
150,000
200,000
250,000
300,000
1991 1992 1993 1994 1995 1996 1997 1998 1999 2000 2001 2002 2003 2004
UNIVERSITIES ITPs CoEs WĀNANGA PTEs OTEPs TOTAL
Note: Care should be taken in comparing data from 2000 onwards with data in earlier years, because of a change in the way that funding was delivered from 2000. Source: Ministry of Education, Tertiary Education Commission.
83 The private-sector PTEs account for less than 7% of the Student Component (which is the main source of funding for teaching and learning).

96
380 In 2000, 55% of government-funded EFTS were in universities; in 2004, this figure was 41%. The ITPs’ share of total EFTS in 2004 was 33% (up from 29% in 2000), wānanga 14% (up from 1.6% in 2000), PTEs 8.3% (down from 8.8% in 2000), and other tertiary education providers (OTEPs) 0.7%. 381 Two key factors contributed to the slow-down in the rate of growth of government-funded EFTS in 2004. The first was the limits on growth applied by the government. The second was that the strong growth in EFTS experienced by wānanga between 2000 and 2003 came to an end, and their EFTS fell by 7% in 2004. 382 Spending on the Student Component continued to increase in 2004, owing to an increase in funding rates and slightly higher EFTS numbers overall. But the level of increase was much lower than in earlier years. Figure 7a.11: Total Student Component expenditure by type of TEI 1991-2004
$0
$500
$1,000
$1,500
$2,000
1991 1992 1993 1994 1995 1996 1997 1998 1999 2000 2001 2002 2003 2004
MIL
LIO
N
UNIVERSITIES ITPs CoEs WĀNANGA PTEs OTEPs TOTAL
Notes: 1. Inclusive of GST. 2. Data in this figure include base grants and fee stabilisation funding, as well as EFTS-based tuition subsidies delivered through the Student Component. It includes PBRF allocations only for 2004. 3. Care should be taken in comparing data from 2000 onwards with data in earlier years, because of a change in the way that funding was delivered from 2000. Source: Ministry of Education, Tertiary Education Commission. 383 The average tuition-subsidy funding per EFTS fell between 1991 and 2000. It has risen each year since then. On a per-EFTS basis, the actual average tuition subsidy depends on a number of factors – including the level of tuition funding rates and the mix of enrolments in the various funding categories. If there is a shift of enrolments into lower-funded categories, then the average funding per EFTS may decline, even if the funding rates in each category rise. For example, since 2000, the average per-EFTS subsidy in TEIs has increased by just 5.7%, compared with actual increases in funding rates of more than 12%. 384 The government currently operates a rolling funding triennium for Student Component funding. The amount appropriated in each year for the Student Component has been built from the current baseline by allowing for the effects of growth in enrolments and also for movements in the CPI.

97
Figure 7a.12: Average Student Component per EFTS by type of TEI 1991-2004
$0
$1,000
$2,000
$3,000
$4,000
$5,000
$6,000
$7,000
$8,000
$9,000
$10,000
1991 1992 1993 1994 1995 1996 1997 1998 1999 2000 2001 2002 2003 2004
UNIVERSITIES ITPs CoEs WĀNANGA TEIs
Notes: 1. Inclusive of GST. 2. Data in this figure include base grants and fee stabilisation funding, as well as EFTS-based tuition subsidies delivered through the Student Component. It includes PBRF allocations only for 2004. 3. Care should be taken in comparing data from 2000 onwards with data in earlier years, because of a change in the way that funding was delivered from 2000. Source: Ministry of Education, Tertiary Education Commission.
385 Changes in the share of revenue derived from government funding, however, are only part of the picture. By combining the revenue from the Student Component with domestic and international student tuition fees, a complete picture of the trends in the funding of tuition-related activities at TEIs can be given. Figure 7a.13 shows the combined tuition revenue per EFTS (domestic and international) in TEIs between 2000 and 2004. 386 Between 2000 and 2004, TEIs’ combined tuition revenue per EFTS increased by 0.4% (from $9,740 to $9,777). This modest rise reflects the trend to fee discounting in the ITPs and the wānanga – and also a drift in enrolments from higher-funded categories to lower-funded categories. 387 Within the TEIs, universities had the largest growth in combined tuition revenue per EFTS: this increased by 16%, from $10,247 to $11,885. The key factors in this were the progressive increases in funding rates and the steady increases in the average international fee per EFTS. An increase in average domestic fees in 2004 was also a contributor. 388 The extent of the increase over that time in the universities is greater than inflation (as measured by the CPI). The universities, however, argue that their costs rise at a faster rate than the CPI,84 and they use international data to argue that the funding of degree-level education in New Zealand is low when seen against the funding levels in comparable countries such as Australia. The universities have argued that they are under-resourced, that the fee stabilisation policy prevents them from dealing with this problem through their own
84 An alternative price deflator for universities has been created by two university economists (Scott and Scott, 2004) for the period 1980 to 2003. The Scott and Scott index implies that the universities’ input costs have risen faster than inflation over most of the last decade, even if the CPI is higher than the Scott and Scott index over the longer period.
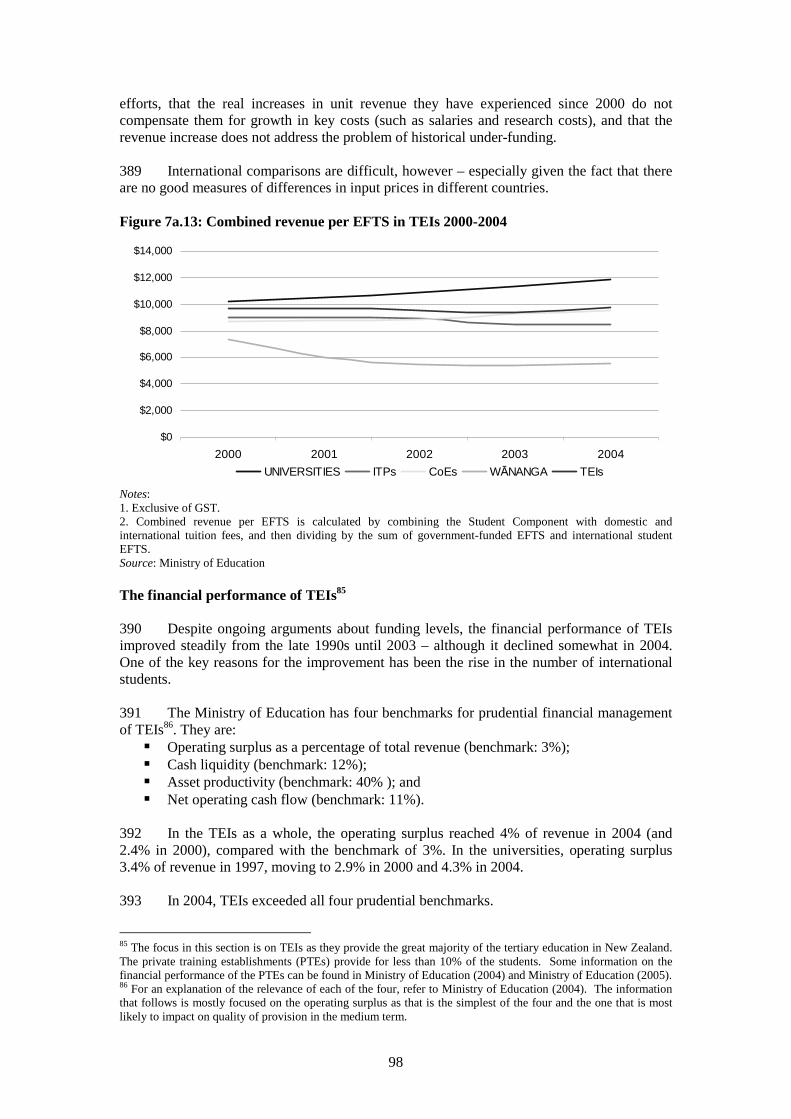
98
efforts, that the real increases in unit revenue they have experienced since 2000 do not compensate them for growth in key costs (such as salaries and research costs), and that the revenue increase does not address the problem of historical under-funding. 389 International comparisons are difficult, however – especially given the fact that there are no good measures of differences in input prices in different countries. Figure 7a.13: Combined revenue per EFTS in TEIs 2000-2004
$0
$2,000
$4,000
$6,000
$8,000
$10,000
$12,000
$14,000
2000 2001 2002 2003 2004
UNIVERSITIES ITPs CoEs WĀNANGA TEIs
Notes: 1. Exclusive of GST. 2. Combined revenue per EFTS is calculated by combining the Student Component with domestic and international tuition fees, and then dividing by the sum of government-funded EFTS and international student EFTS. Source: Ministry of Education The financial performance of TEIs85 390 Despite ongoing arguments about funding levels, the financial performance of TEIs improved steadily from the late 1990s until 2003 – although it declined somewhat in 2004. One of the key reasons for the improvement has been the rise in the number of international students. 391 The Ministry of Education has four benchmarks for prudential financial management of TEIs86. They are:
Operating surplus as a percentage of total revenue (benchmark: 3%); Cash liquidity (benchmark: 12%); Asset productivity (benchmark: 40% ); and Net operating cash flow (benchmark: 11%).
392 In the TEIs as a whole, the operating surplus reached 4% of revenue in 2004 (and 2.4% in 2000), compared with the benchmark of 3%. In the universities, operating surplus 3.4% of revenue in 1997, moving to 2.9% in 2000 and 4.3% in 2004. 393 In 2004, TEIs exceeded all four prudential benchmarks.
85 The focus in this section is on TEIs as they provide the great majority of the tertiary education in New Zealand. The private training establishments (PTEs) provide for less than 10% of the students. Some information on the financial performance of the PTEs can be found in Ministry of Education (2004) and Ministry of Education (2005). 86 For an explanation of the relevance of each of the four, refer to Ministry of Education (2004). The information that follows is mostly focused on the operating surplus as that is the simplest of the four and the one that is most likely to impact on quality of provision in the medium term.
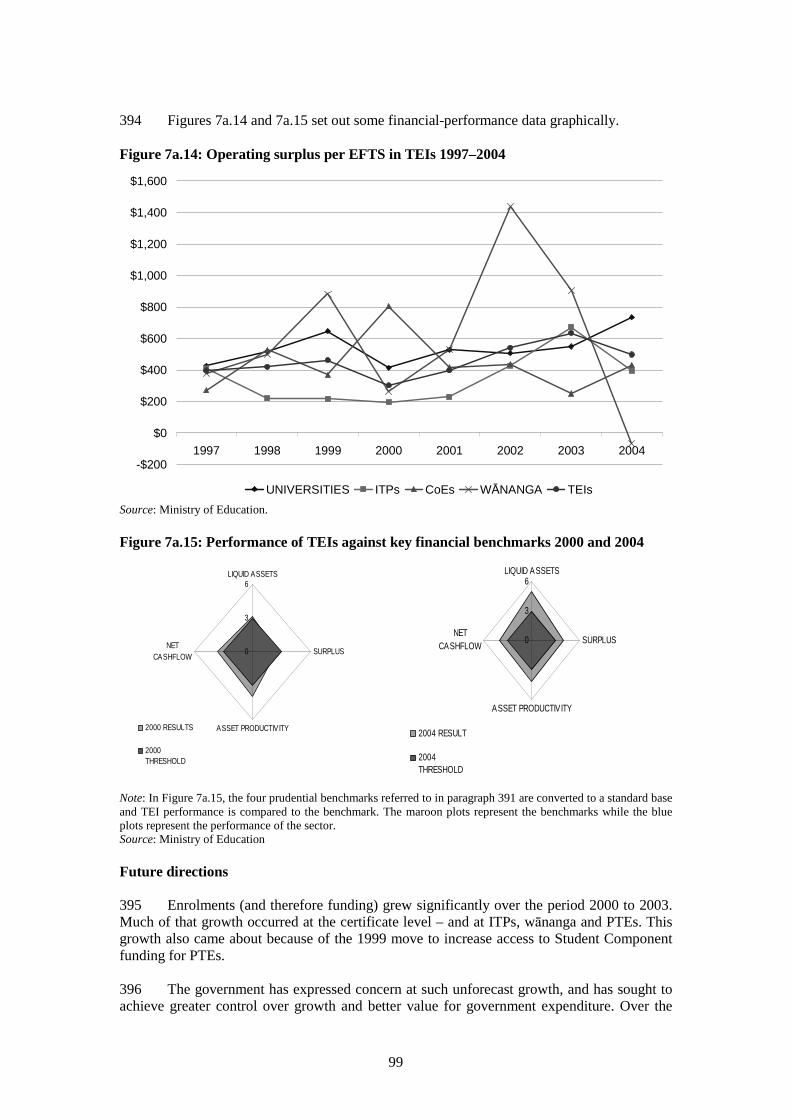
99
394 Figures 7a.14 and 7a.15 set out some financial-performance data graphically. Figure 7a.14: Operating surplus per EFTS in TEIs 1997–2004
-$200
$0
$200
$400
$600
$800
$1,000
$1,200
$1,400
$1,600
1997 1998 1999 2000 2001 2002 2003 2004
UNIVERSITIES ITPs CoEs WĀNANGA TEIs
Source: Ministry of Education. Figure 7a.15: Performance of TEIs against key financial benchmarks 2000 and 2004
0
3
6LIQUID ASSETS
SURPLUS
ASSET PRODUCTIVITY
NETCASHFLOW
2000 RESULTS
2000THRESHOLD
0
3
6LIQUID ASSETS
SURPLUS
ASSET PRODUCTIVITY
NETCASHFLOW
2004 RESULT
2004THRESHOLD
Note: In Figure 7a.15, the four prudential benchmarks referred to in paragraph 391 are converted to a standard base and TEI performance is compared to the benchmark. The maroon plots represent the benchmarks while the blue plots represent the performance of the sector. Source: Ministry of Education Future directions 395 Enrolments (and therefore funding) grew significantly over the period 2000 to 2003. Much of that growth occurred at the certificate level – and at ITPs, wānanga and PTEs. This growth also came about because of the 1999 move to increase access to Student Component funding for PTEs. 396 The government has expressed concern at such unforecast growth, and has sought to achieve greater control over growth and better value for government expenditure. Over the

100
period 2002 to 2005, it has started to implement a series of restrictions on growth – especially at certificate and diploma level. Some of the savings from the 2005 restrictions have been redirected to a Quality Reinvestment Fund designed to help ITPs and wānanga (which have been theTEIs most affected by the new restrictions) to make a shift towards provision that is more aligned to the TES. 397 The government has also initiated a longer-term review of the funding model, with a view to modifications that will give the government more certainty on expenditure and an assurance that there will be greater emphasis on the quality, relevance and comprehensiveness of tertiary education throughout New Zealand.
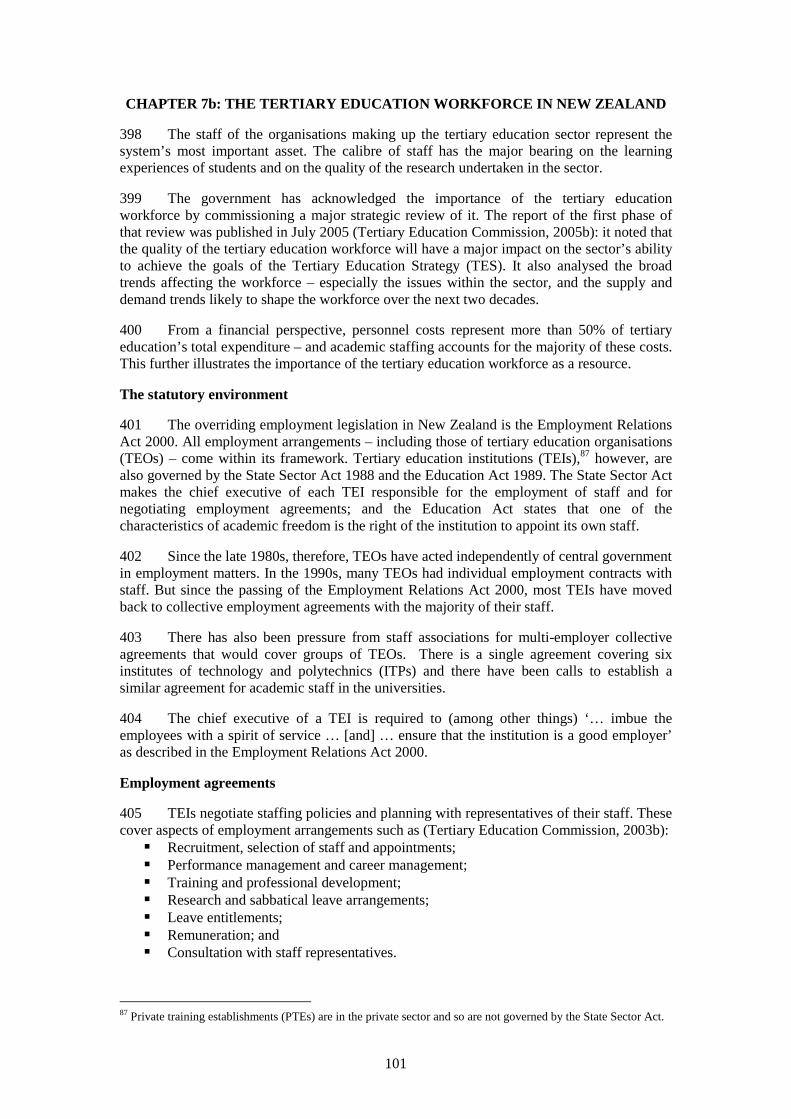
101
CHAPTER 7b: THE TERTIARY EDUCATION WORKFORCE IN NEW ZEALAND 398 The staff of the organisations making up the tertiary education sector represent the system’s most important asset. The calibre of staff has the major bearing on the learning experiences of students and on the quality of the research undertaken in the sector. 399 The government has acknowledged the importance of the tertiary education workforce by commissioning a major strategic review of it. The report of the first phase of that review was published in July 2005 (Tertiary Education Commission, 2005b): it noted that the quality of the tertiary education workforce will have a major impact on the sector’s ability to achieve the goals of the Tertiary Education Strategy (TES). It also analysed the broad trends affecting the workforce – especially the issues within the sector, and the supply and demand trends likely to shape the workforce over the next two decades. 400 From a financial perspective, personnel costs represent more than 50% of tertiary education’s total expenditure – and academic staffing accounts for the majority of these costs. This further illustrates the importance of the tertiary education workforce as a resource. The statutory environment 401 The overriding employment legislation in New Zealand is the Employment Relations Act 2000. All employment arrangements – including those of tertiary education organisations (TEOs) – come within its framework. Tertiary education institutions (TEIs),87 however, are also governed by the State Sector Act 1988 and the Education Act 1989. The State Sector Act makes the chief executive of each TEI responsible for the employment of staff and for negotiating employment agreements; and the Education Act states that one of the characteristics of academic freedom is the right of the institution to appoint its own staff. 402 Since the late 1980s, therefore, TEOs have acted independently of central government in employment matters. In the 1990s, many TEOs had individual employment contracts with staff. But since the passing of the Employment Relations Act 2000, most TEIs have moved back to collective employment agreements with the majority of their staff. 403 There has also been pressure from staff associations for multi-employer collective agreements that would cover groups of TEOs. There is a single agreement covering six institutes of technology and polytechnics (ITPs) and there have been calls to establish a similar agreement for academic staff in the universities. 404 The chief executive of a TEI is required to (among other things) ‘… imbue the employees with a spirit of service … [and] … ensure that the institution is a good employer’ as described in the Employment Relations Act 2000. Employment agreements 405 TEIs negotiate staffing policies and planning with representatives of their staff. These cover aspects of employment arrangements such as (Tertiary Education Commission, 2003b):
Recruitment, selection of staff and appointments; Performance management and career management; Training and professional development; Research and sabbatical leave arrangements; Leave entitlements; Remuneration; and Consultation with staff representatives.
87 Private training establishments (PTEs) are in the private sector and so are not governed by the State Sector Act.
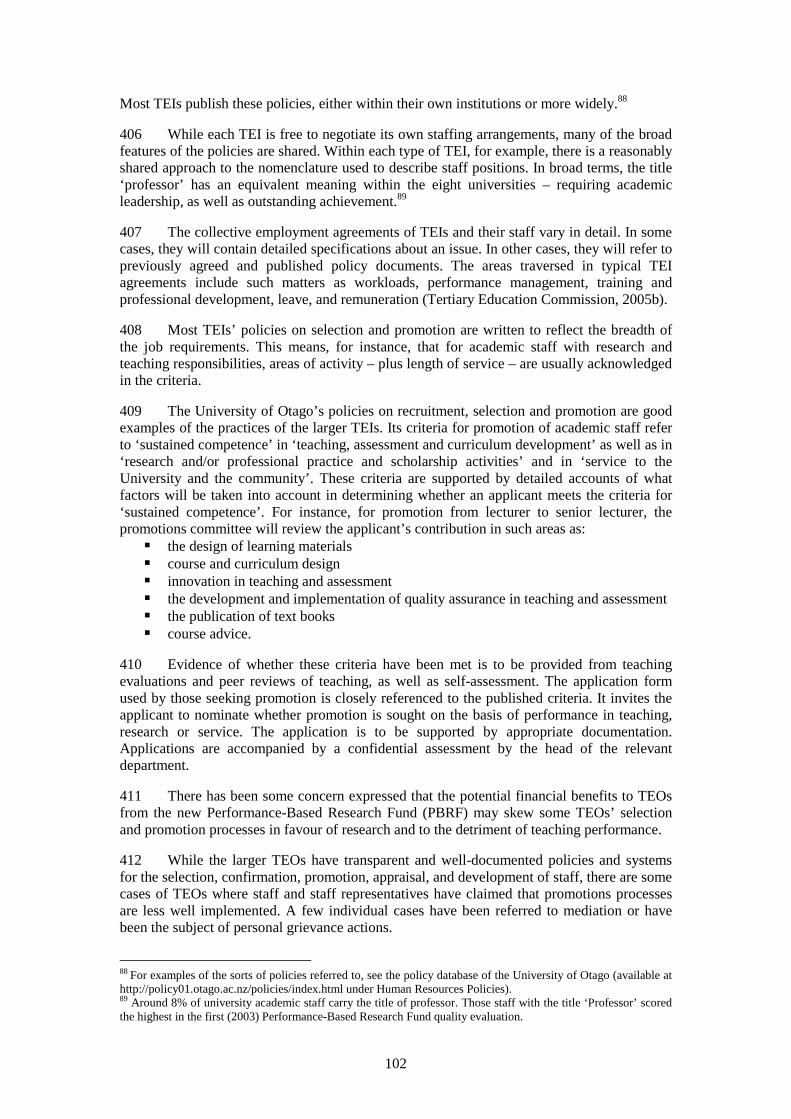
102
Most TEIs publish these policies, either within their own institutions or more widely.88 406 While each TEI is free to negotiate its own staffing arrangements, many of the broad features of the policies are shared. Within each type of TEI, for example, there is a reasonably shared approach to the nomenclature used to describe staff positions. In broad terms, the title ‘professor’ has an equivalent meaning within the eight universities – requiring academic leadership, as well as outstanding achievement.89 407 The collective employment agreements of TEIs and their staff vary in detail. In some cases, they will contain detailed specifications about an issue. In other cases, they will refer to previously agreed and published policy documents. The areas traversed in typical TEI agreements include such matters as workloads, performance management, training and professional development, leave, and remuneration (Tertiary Education Commission, 2005b). 408 Most TEIs’ policies on selection and promotion are written to reflect the breadth of the job requirements. This means, for instance, that for academic staff with research and teaching responsibilities, areas of activity – plus length of service – are usually acknowledged in the criteria. 409 The University of Otago’s policies on recruitment, selection and promotion are good examples of the practices of the larger TEIs. Its criteria for promotion of academic staff refer to ‘sustained competence’ in ‘teaching, assessment and curriculum development’ as well as in ‘research and/or professional practice and scholarship activities’ and in ‘service to the University and the community’. These criteria are supported by detailed accounts of what factors will be taken into account in determining whether an applicant meets the criteria for ‘sustained competence’. For instance, for promotion from lecturer to senior lecturer, the promotions committee will review the applicant’s contribution in such areas as:
the design of learning materials course and curriculum design innovation in teaching and assessment the development and implementation of quality assurance in teaching and assessment the publication of text books course advice.
410 Evidence of whether these criteria have been met is to be provided from teaching evaluations and peer reviews of teaching, as well as self-assessment. The application form used by those seeking promotion is closely referenced to the published criteria. It invites the applicant to nominate whether promotion is sought on the basis of performance in teaching, research or service. The application is to be supported by appropriate documentation. Applications are accompanied by a confidential assessment by the head of the relevant department. 411 There has been some concern expressed that the potential financial benefits to TEOs from the new Performance-Based Research Fund (PBRF) may skew some TEOs’ selection and promotion processes in favour of research and to the detriment of teaching performance. 412 While the larger TEOs have transparent and well-documented policies and systems for the selection, confirmation, promotion, appraisal, and development of staff, there are some cases of TEOs where staff and staff representatives have claimed that promotions processes are less well implemented. A few individual cases have been referred to mediation or have been the subject of personal grievance actions.
88 For examples of the sorts of policies referred to, see the policy database of the University of Otago (available at http://policy01.otago.ac.nz/policies/index.html under Human Resources Policies). 89 Around 8% of university academic staff carry the title of professor. Those staff with the title ‘Professor’ scored the highest in the first (2003) Performance-Based Research Fund quality evaluation.
103
A profile of current staffing in TEIs 413 The material in this section, which is focused largely on TEIs,90 draws some data from the 2004 edition of the Ministry of Education’s annual survey of the tertiary education sector, New Zealand’s Tertiary Education Sector: Profile & Trends 2004. The numbers of full-time-equivalent staff 414 The TEIs reported that they employed 29,000 full-time-equivalent (FTE) staff over the course of 2004, compared with 22,000 in 1997. This 32% increase between 1997 and 2004 contrasts with a rise of around 60% in the number of equivalent-full-time students (EFTS) over the same period. These figures vary between different types of TEIs – and they are much influenced by shifts in the nature and scope of teaching that have occurred in the ITPs and with the growth of wānanga. For example, in the universities over that period EFTS rose by 25% while reported FTE staffing grew by 26%. 415 Staff associations in TEOs generally have expressed concern at the level of casual and fixed-term employment agreements in the sector, and at the lack of continuity that casualised agreements encourage. There is concern at the potential for a reduced quality of tertiary education in TEOs that use casual agreements. Figure 7b.1: FTE staff employed in TEIs 1997-2004
0
5,000
10,000
15,000
20,000
25,000
30,000
35,000
UNIVERSITIES ITPs CoEs WĀNANGA TEIs
1997 1998 1999 2000 2001 2002 2003 2004
Source: Ministry of Education. 416 The mix of academic and non-academic staff varies between different types of TEIs. On an FTE basis, universities have the lowest proportion of academic staff; wānanga have the highest. In 2004, academic FTE staff constituted 45% of total FTE staff in universities –this compares with 53%-54% in other types of TEIs. Over time, the faster rate of growth in non-academic FTE staff has resulted in academic FTEs falling as a percentage of total FTEs. In 1997, academic FTE staff comprised 53% of total FTE staff in TEIs. By 2004, this had fallen to 48%.91 TEI staff associations argue that these trends illustrate increasing workloads for academic staff. 417 The ratios of students to academic staff provides an indication of average class size. It is only a broad indicator of efficiency and does not take into account differences in learning
90 TEIs have a statutory requirement to produce data on staff numbers and characteristics. PTEs, being in the private sector, are not required to do this – and so the information from PTEs is much less extensive. PTEs also represent a much smaller segment of the tertiary education sector than TEIs. 91 It is possible that the criteria used by some TEIs for classifying staff may have changed over time, so that a part of the apparent shift may be attributable to classification conventions.
104
support needs, qualifications or delivery methods – so comparisons between the ratios for types of TEIs or at individual TEIs must be made with caution. Variations will occur naturally because of institutional size (which can allow economies of scale), the types of programmes offered, the types of students taught, the delivery methods used, and the duration of the programmes offered. The ratio of EFTS to academic FTE staff was 19.3 for TEIs as a whole in 2003,92 compared with 14.6 in 1997. Again, the extent of the change was largely a consequence of shifts in delivery approach, especially in ITPs and wānanga. In the universities alone, the ratio changed from 15.3 in 1997 to 15.8 in 2003. TEI staffing costs 418 Expenditure on staffing amounted to $1.81 billion in 2004, compared with $1.23 billion in 2000 and $1.03 billion in 1997. This represents an increase of 60% between 1997 and 2004. Staffing expenditure per FTE increased by 35% between 1997 and 2004, with the increase being 19% between 2000 and 2004. By comparison, the consumer price index (CPI) increased 14.4% between 1997 and 2004 and 2.7% between 2000 and 2004.93 419 The fact that TEIs’ average expenditure on staffing rose faster than the CPI is an indication that remuneration (which accounts for the bulk of staffing expenditure) has risen in real terms. This is likely to reflect the higher levels of remuneration paid to an ageing workforce, the trend toward the employment of more specialised staff and new types of staff, some movement in salary levels, and more responsive remuneration practices in TEIs. 420 TEI staff associations argue that academic staff salaries fell in real terms during the 1990s, and that the more recent improvement has been in part a ‘catch up’. In their view, academic staff salaries still lag in relativity in many areas. 421 Expenditure on staffing is the largest budget item for TEIs. It has also remained relatively constant between 1997 and 2004 – at around 56% of total expenditure. Some characteristics of TEI staff 422 The majority (64%) of academic staff at TEIs were employed on a full-time basis in 2004. (This percentage increased in 2004 after declining for several years.) The percentage of male academic staff employed on a full-time basis (70%) was significantly greater than that of females (59%). 423 Women accounted for 58% of the total staff at TEIs in 2004.94 But men accounted for the majority (52%) of TEI academic staff. The universities had the lowest proportion of women on their academic staff, with 41%. In the other types of TEIs , women accounted for 50% or more of the academic staff – colleges of education had the highest proportion (76%).
424 Women were under-represented among the senior academic positions95 in universities and wānanga in 2004. And, in the universities in 2003, around 14% of the professors and 17% of the associate professors were women; by contrast nearly half of those holding lecturer rank were women. In the TEIs as a whole in 2004, women accounted for only 35% of the senior academic staff – but they accounted for about half of the senior academic staff in ITPs and well over half in the colleges of education.
92 Reclassification of some staffing categories in the data for 2004 means that the ratio for 2004 is not comparable with earlier figures. 93 The December quarter CPI was used for this analysis. 94 Available PTE data show that women comprised 57% of staff in 2004. 95 Senior academic positions are deans/heads of school, heads of department/faculty, principals of colleges of education, and senior lecturers.
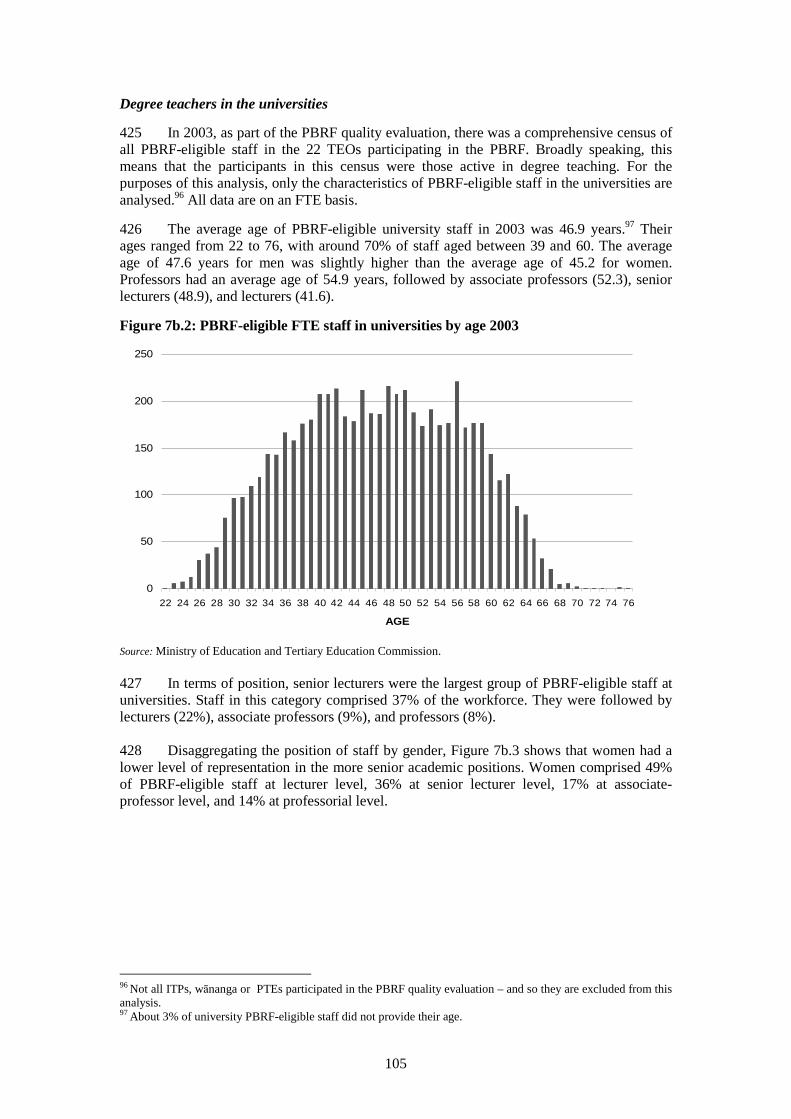
105
Degree teachers in the universities
425 In 2003, as part of the PBRF quality evaluation, there was a comprehensive census of all PBRF-eligible staff in the 22 TEOs participating in the PBRF. Broadly speaking, this means that the participants in this census were those active in degree teaching. For the purposes of this analysis, only the characteristics of PBRF-eligible staff in the universities are analysed.96 All data are on an FTE basis.
426 The average age of PBRF-eligible university staff in 2003 was 46.9 years.97 Their ages ranged from 22 to 76, with around 70% of staff aged between 39 and 60. The average age of 47.6 years for men was slightly higher than the average age of 45.2 for women. Professors had an average age of 54.9 years, followed by associate professors (52.3), senior lecturers (48.9), and lecturers (41.6).
Figure 7b.2: PBRF-eligible FTE staff in universities by age 2003
0
50
100
150
200
250
22 24 26 28 30 32 34 36 38 40 42 44 46 48 50 52 54 56 58 60 62 64 66 68 70 72 74 76
AGE
Source: Ministry of Education and Tertiary Education Commission. 427 In terms of position, senior lecturers were the largest group of PBRF-eligible staff at universities. Staff in this category comprised 37% of the workforce. They were followed by lecturers (22%), associate professors (9%), and professors (8%). 428 Disaggregating the position of staff by gender, Figure 7b.3 shows that women had a lower level of representation in the more senior academic positions. Women comprised 49% of PBRF-eligible staff at lecturer level, 36% at senior lecturer level, 17% at associate-professor level, and 14% at professorial level.
96 Not all ITPs, wānanga or PTEs participated in the PBRF quality evaluation – and so they are excluded from this analysis. 97 About 3% of university PBRF-eligible staff did not provide their age.
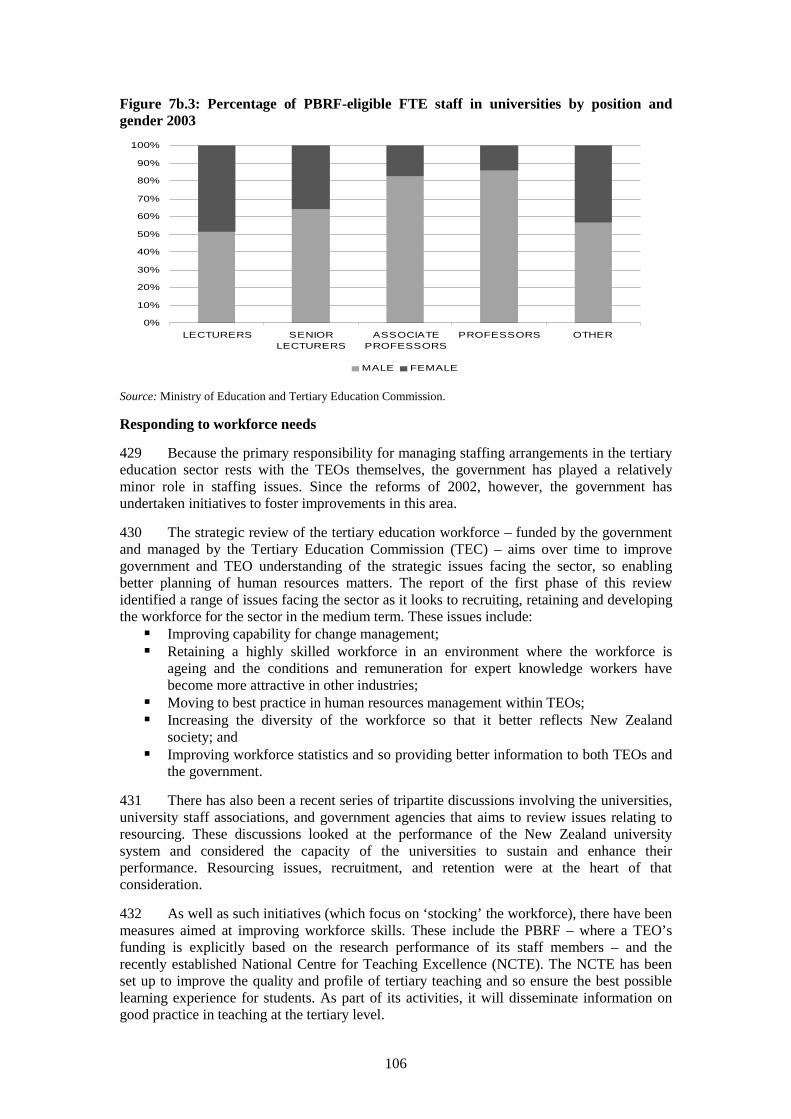
106
Figure 7b.3: Percentage of PBRF-eligible FTE staff in universities by position and gender 2003
0%
10%
20%
30%
40%
50%
60%
70%
80%
90%
100%
LECTURERS SENIORLECTURERS
ASSOCIATEPROFESSORS
PROFESSORS OTHER
MALE FEMALE
Source: Ministry of Education and Tertiary Education Commission.
Responding to workforce needs
429 Because the primary responsibility for managing staffing arrangements in the tertiary education sector rests with the TEOs themselves, the government has played a relatively minor role in staffing issues. Since the reforms of 2002, however, the government has undertaken initiatives to foster improvements in this area.
430 The strategic review of the tertiary education workforce – funded by the government and managed by the Tertiary Education Commission (TEC) – aims over time to improve government and TEO understanding of the strategic issues facing the sector, so enabling better planning of human resources matters. The report of the first phase of this review identified a range of issues facing the sector as it looks to recruiting, retaining and developing the workforce for the sector in the medium term. These issues include:
Improving capability for change management; Retaining a highly skilled workforce in an environment where the workforce is
ageing and the conditions and remuneration for expert knowledge workers have become more attractive in other industries;
Moving to best practice in human resources management within TEOs; Increasing the diversity of the workforce so that it better reflects New Zealand
society; and Improving workforce statistics and so providing better information to both TEOs and
the government.
431 There has also been a recent series of tripartite discussions involving the universities, university staff associations, and government agencies that aims to review issues relating to resourcing. These discussions looked at the performance of the New Zealand university system and considered the capacity of the universities to sustain and enhance their performance. Resourcing issues, recruitment, and retention were at the heart of that consideration.
432 As well as such initiatives (which focus on ‘stocking’ the workforce), there have been measures aimed at improving workforce skills. These include the PBRF – where a TEO’s funding is explicitly based on the research performance of its staff members – and the recently established National Centre for Teaching Excellence (NCTE). The NCTE has been set up to improve the quality and profile of tertiary teaching and so ensure the best possible learning experience for students. As part of its activities, it will disseminate information on good practice in teaching at the tertiary level.
107
CHAPTER 8: PLANNING, GOVERNING AND REGULATING THE SYSTEM Size and structure of the New Zealand tertiary education system 433 The range of tertiary education organisations (TEOs) in New Zealand has varied little over the last ten years. Currently, there are 33 public tertiary education institutions (TEIs) - eight universities, 20 polytechnics, two colleges of education, and three wānanga. There are also around 40 industry training organisations (ITOs), a large number of private training establishments (PTEs), and providers working in areas of national importance and known as ‘other tertiary education providers’ (OTEPs). The type of tertiary education provision, however, has changed – and has been reflected by a significant increase in, and change in type of, students who have entered tertiary education. 434 Over the past decade, the number of domestic students in tertiary education in New Zealand has increased by 82%. Much of the growth in the last five years has come at certificate level (ISCED levels 3 to 4), from people who had not previously participated in tertiary education. 435 This rapid expansion in certificate and diploma enrolments exposed some weaknesses in the system – both in terms of quality assurance systems within TEOs and in the funding system, with funding going to courses which seemed to be of low value, or of less relevance, or where the level of funding appeared very high in relation to the costs of course provision. As a result, the government has now strengthened its control over the scale of enrolments at certificate and diploma levels, through a series of caps and through measures designed to redirect enrolments into higher-quality and higher-relevance qualifications. 436 Policy changes have led to restrictions in growth rates and a series of review of certificate and diploma provision. Currently, work is under way to modify the tertiary education funding system to make it more sustainable and predictable, and to ensure that it gives greater value for money and that it makes a greater contribution to the government’s educational, economic and fiscal objectives. The challenge of this work will be to develop regulatory and funding levers that are predictable, reliable, flexible and sustainable as conditions change. Setting priorities and steering the sector 437 The government sets out national priorities for the tertiary education sector every five years in the Tertiary Education Strategy (TES), with more specific guidance set out in the Statement of Tertiary Education Priorities (STEP) every one to three years. These mechanisms inform planning and decision-making processes throughout the sector98. 438 There is no explicit use of targets in either the TES or the STEP. Instead, the Tertiary Education Commission (TEC) is to ‘steer’ the sector towards the goals of the TES and the STEP, through use of accountability tools such as charters and profiles, the Assessment of Strategic Relevance (ASR) and funding mechanisms. The TEC also works closely with the main quality assurance agency, the New Zealand Qualifications Authority (NZQA) in its steering of the sector. 439 To receive government funding, TEOs are required to demonstrate that their provision and activities align with the TES and STEP. This is done through their annual charter and profile negotiations with the TEC. 440 The key tool for proving alignment is the ASR. The ASR is intended to be used to:
98 The current TES objectives and the current STEP are attached as Annex 1 and Annex 2 respectively.
108
allocate government funding for provision in line with the TES and STEP priorities; rationalise qualifications among TEOs to reduce unnecessary duplication and to foster
collaboration; assess whether two TEOs should merge; and assess if a TEO should receive strategic development support.
441 The government monitors the sector’s progress towards the TES priorities in an annual TES monitoring report. A move to greater differentiation and specialisation 442 As the TES notes, the development of a focused, high-quality, relevant, and accessible tertiary education system in a small country with limited resources requires differentiation and specialisation of TEOs, and effective links between them. 443 While the Education Act 1989 and the Industry Training Act 1992 provide the foundations for differentiation between types of TEOs99, the TEC has invited debate on how these different types should focus in the future, through a discussion paper released in May 2004. The debate is focused on the distinctions that are necessary to provide an appropriate balance and diversity of teaching programmes, research, and capability across the system as a whole (Tertiary Education Commission, 2004a). 444 The Performance-Based Research Fund (PBRF) and Centres of Research Excellence (CoREs) have already made the role of universities more distinctive. The institutes of technology and polytechnics (ITPs) have for some time been consolidating their role in regional provision, focusing on local needs (especially in vocational areas) while metropolitan ITPs are now offering a significant number of degrees and postgraduate programmes in vocationally-oriented areas. Private training establishments (PTEs) complement public provision and generally focus on niches not addressed by the public sector. Governance and regulation 445 New Zealand public-sector TEOs (known as tertiary education institutions or TEIs) operate with substantial institutional autonomy. The Education Act 1989 decentralised much of the sector’s decision-making powers, in favour of letting TEIs take control of their own resources and future. The change affected especially the colleges of education and the ITPs, as they had been subject to a greater degree of central control than the universities previously. These changes were accompanied by changes in the resourcing system, which shifted to a bulk-funding basis, enabled TEIs to set fees, and gave them control over their own capital expenditure. Following this, in the 1990s, there was major growth in the sector as institutions developed innovative ways of meeting student demand in a relatively deregulated environment. 446 While most TEIs managed reasonably well in this environment, some struggled to maintain both their intellectual capital and an operating surplus. A small number of ITPs were absorbed into neighbouring TEOs as a result100. 447 Amendments to the Education Act in 2001 gave the government powers to intervene directly in at-risk TEIs. Until that point there had been no such powers, and intervention could only happen with the agreement of the TEI.
99 Section 162(4) of the Education Act 1989 describes the characteristics of different types of TEIs. 100 For instance, the Wairarapa Polytechnic and the Wanganui Community Regional Polytechnic were both absorbed into The Universal College of Learning (UCOL), an ITP based in Palmerston North. In the Wellington region, there was also a rationalisation of the ITPs.
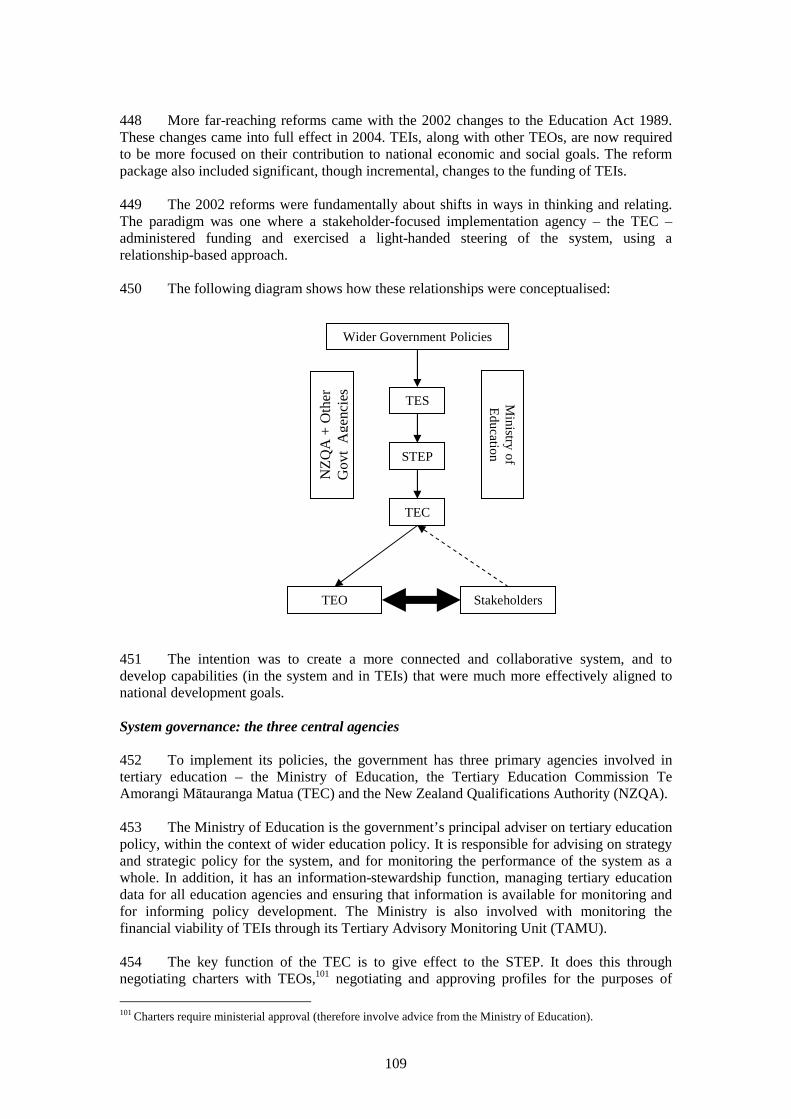
109
448 More far-reaching reforms came with the 2002 changes to the Education Act 1989. These changes came into full effect in 2004. TEIs, along with other TEOs, are now required to be more focused on their contribution to national economic and social goals. The reform package also included significant, though incremental, changes to the funding of TEIs. 449 The 2002 reforms were fundamentally about shifts in ways in thinking and relating. The paradigm was one where a stakeholder-focused implementation agency – the TEC – administered funding and exercised a light-handed steering of the system, using a relationship-based approach. 450 The following diagram shows how these relationships were conceptualised:
451 The intention was to create a more connected and collaborative system, and to develop capabilities (in the system and in TEIs) that were much more effectively aligned to national development goals. System governance: the three central agencies 452 To implement its policies, the government has three primary agencies involved in tertiary education – the Ministry of Education, the Tertiary Education Commission Te Amorangi Mātauranga Matua (TEC) and the New Zealand Qualifications Authority (NZQA). 453 The Ministry of Education is the government’s principal adviser on tertiary education policy, within the context of wider education policy. It is responsible for advising on strategy and strategic policy for the system, and for monitoring the performance of the system as a whole. In addition, it has an information-stewardship function, managing tertiary education data for all education agencies and ensuring that information is available for monitoring and for informing policy development. The Ministry is also involved with monitoring the financial viability of TEIs through its Tertiary Advisory Monitoring Unit (TAMU). 454 The key function of the TEC is to give effect to the STEP. It does this through negotiating charters with TEOs,101 negotiating and approving profiles for the purposes of
101 Charters require ministerial approval (therefore involve advice from the Ministry of Education).
Wider Government Policies
TES
STEP
TEC
TEO Stakeholders
NZ
QA
+ O
ther
G
ovt
Age
ncie
s
Ministry of
Education
110
funding, allocating funds to TEOs and building their capacity. The TEC is responsible for public funding of all tertiary education and training; and it advises the Minister on the activities of the sector, and on the TES and the STEP. 455 The NZQA has an overarching role in relation to quality assurance in New Zealand. It also has responsibility for the quality of the system as a whole – and for ensuring that a strategic overview of the system is maintained, in order to identify problems or areas where further development is needed. 456 The 2002 reforms established a complex set of inter-agency relationships and interdependencies which are still being worked through. Thus, for example, quality assurance is not only the concern of the primary agency, NZQA. Quality assurance continues to be pre-requisite for eligibility for public funding – but there are also levers in other areas to reward and improve performance and encourage quality improvement. Information from charters and profiles and from assessment mechanisms such as the PBRF, provide an additional source of data that can be used in quality assurance. Similarly, the assessment of quality is also related to institutional viability and to the ASR, all of which are key components in the monitoring of the system. 457 The State Services Commission recently reviewed inter-agency relationships and the capability of the agencies. It recommended three specific coordination and oversight arrangements to support leadership of the sector:
The creation of a high level oversight group comprising the minister responsible for tertiary education, the Secretary for Education, and chairs of the boards and chief executives of NZQA and the TEC.
The Secretary for Education102 is to have overall responsibility for coordinating the approach to tertiary education, leading the NZQA and TEC as well as the Ministry in giving greater emphasis to the achievement of outcomes and strategic implementation; and
A central and senior level strategic policy and oversight unit in the Ministry of Education to support the two roles above and to ensure the activities of all three agencies are contributing effectively to senior secondary and tertiary education goals.
These arrangements have now been put in place. TEI governance 458 Governing boards of TEIs are known as councils. Each council has the following functions:
To appoint a chief executive officer (CEO) and monitor and evaluate his/her performance;
To prepare, negotiate and adopt a charter for submission to the Minister of Education; To adopt an annual profile (which is negotiated with the TEC); To ensure the TEI is managed in accordance with its charter and profile; To determine policies for implementing the TEI’s charter and profile and managing
the TEI’s affairs; To strive to ensure the highest standards; To acknowledge the Treaty of Waitangi; To operate in a financially responsible manner, with efficient use of resources and a
focus on long-term viability; and To ensure proper standards of integrity and conduct in terms of the public interest and
student well-being.
102 The Secretary is the chief executive of the Ministry.
111
459 Councils must have between 12 and 20 members. Members include the TEI’s CEO, staff and student representatives, employer representatives, union representatives and various other stakeholder group representatives. In addition, there are four ministerial appointees. Many TEIs also have one or two members elected by its graduates. In most cases, the council will have a majority of external members. 460 Section 171(4) of the Education Act 1989 states that a council should reflect, as far as reasonably practicable, the ethnic and socio-economic diversity of the communities served by the TEI. It should also have a gender balance. In addition, the Minister and the council, when appointing and co-opting members, must try to ensure that the council has a sufficient number of members with expertise in management to enable the council to properly perform its functions. Institutional autonomy and accountability 461 The New Zealand system is built around recognition and acceptance of a high degree of institutional autonomy and clear statutory requirements for accountability and disclosure. 462 The CEO of each TEI is the legal employer of the staff of that institution, and there are limits to the powers of others (including the Council) to interfere in the CEO’s decision-making. Each TEI has an academic board that is required to assess and approve academic programmes and ensure effective academic decision-making. Councils and CEOs cannot make decisions on academic matters without first consulting the academic board. 463 The major accountability instrument for a TEI is its annual report, which has to be audited103 and has to meet public accounting and reporting standards. This is then tabled in the House of Representatives (Parliament), where it can be questioned. The Education and Science Select Committee of the House of Representatives also aims to review two to three TEIs each year and publishes the findings.104 464 The autonomy of TEIs is reflected in some of the differences between TEIs and other forms of Crown entities:
TEIs do not have to prepare annual Statements of Intent (which are required of other Crown entities, under the Public Finance Act 1989). Rather, TEIs must produce an annual profile, with this requirement derived from the Education Act 1989.
There is uncertainty over the legal ownership of TEIs, particularly universities, which has not yet been tested in the courts.
Unlike other Crown entities (where a Minister generally appoints the entire board), the Crown only has four appointees on TEI councils.
Although the changes made in 2002 to the Education Act 1989 require councils to have regard to the TES and the STEP, ministers do not explicitly determine priorities for tertiary education institutions on an annual basis as they do for other Crown entities.
465 A delicate balance therefore exists in the Crown-TEI relationship, in order to balance institutional autonomy and academic freedom with the need for prudent controls and oversight over assets held in the public good.
103 By the Office of the Auditor General (or its delegated agents in the private sector). 104 For example, refer to the committee’s Inquiry into Northland Polytechnic, 2004 at: www.clerk.parliament.govt.nz/Content/SelectCommitteeReports/esfrinqnorthland.pdf
112
Crown entities legislation 466 Further complicating the relationship between the Crown and TEIs is a bill105, introduced in December 2003, which aimed (among other things) to clarify Crown entity governance as a means of improving accountability and performance and to help manage risks to the Crown. 467 This legislation was intended to capture major differences between Crown entities106 and to reflect the different types of relationships with the government. It sought to clarify roles and responsibilities as a means of improving accountability and performance. TEIs are classified as a separate category within the Crown Entities Act and are able to maintain their distinctive characteristics and the special nature of their relationship with the Crown. A number of issues relating to TEIs remain to be dealt with, primarily through the Education Act 1989. 468 Within the TEI sector, the legislation has been controversial. There was significant consultation with the sector through a working party. Among the more difficult issues were the consequential changes that might be needed to implement the reforms. The prime areas of attention were: financial powers (including investments, derivatives, borrowing, and guarantees); TEI subsidiaries; duties of TEI council members; the process of ministerial appointments to councils; the liability of council members; the role of ministers; the role of academic boards; and the role of council chairs. 469 While the working party completed its work and reported to Ministers in 2005, it was agreed that it would be better to consider the report more fully and then issue a consultation document to the sector at a later stage. Governance in private training establishments 470 The private tertiary education sector is very diverse. There are some 900 registered PTEs that mostly aim to complement the provision of the TEIs and that focus on niche areas of provision. The range of organisational forms among PTEs is diverse. Some PTEs are companies that aim to make a profit, while others are governed by trusts, incorporated societies or iwi groups. Others are subsidiaries of larger groups. As a result, the governance requirements are also diverse. Given this diversity of legal and organisational forms, it is not possible to characterise the governance arrangements of PTEs. 471 Each PTE is required to be registered as a provider by the NZQA, while those seeking public funds have to submit a charter and profile to the TEC. The registration and charter/profile processes entail a range of assessments - financial, educational, quality and management - aimed at protecting the interests of students. Provider diversity 472 The Education Act 1989 establishes various classes of institution – universities, ITPs, colleges of education, and wānanga. It also provides for specialist colleges.
105 http://www.beehive.govt.nz/mallard/public-finance/index.cfm. The bill, called the Public Finance (State Sector Management) Bill, made changes to two existing acts that govern Crown entities and it complements those changes by creating a new Crown Entities Act. 106 There are approximately 2,630 Crown entities in total - about 2,500 school Boards of Trustees, and about 130 Crown entities of other forms (excluding subsidiaries). The relationship between Crown entities and the Crown ranges from close to distant.
113
473 Since then the colleges of education have gradually reduced in number through mergers with universities, and the remaining two colleges are now involved in merger discussions. 474 One new university has been created since the Education Act came into force - in 2000 the former Auckland Institute of Technology (an ITP) became the Auckland University of Technology. Currently, Unitec New Zealand (another Auckland-based ITP) is seeking to become a university of technology. The process requires an analysis by NZQA of whether the organisation meets certain specified criteria that elaborate on the characteristics of a university laid out in the Education Act. It also requires specific approval by the Minister of Education on a ‘national interest’ test. 475 Specialist colleges have not developed – indeed, most TEIs have seen it as in their interests to broaden rather than restrict their offerings. Under the Education Act 1989, the government has the authority to control the number of places in certain high-cost areas such as medicine, veterinary science and dentistry; and successive governments have made it clear that they do not wish to establish new programmes in these areas. System linkages 476 For much of the period from 1989 to 2000, there was no direct government encouragement of linkages between TEIs (although the principle of collaboration was supported).107 In 2001, the government set up the Collaborating for Efficiency project that explored the possibilities for collaboration between TEIs in a number of areas (Tertiary Education Commission, 2003a). The TES and STEP, released in 2002, also placed a significant emphasis on collaboration. 477 The universities have long collaborated in research projects – and the 2002 establishment of Centres of Research Excellence (CoREs) acted as a further incentive for them to collaborate with each other and with other research organisations. 478 The universities are now also recognising the need to relate to other types of TEOs and to open up pathways for students. The Tertiary Education Alliance (TEA), for example, is a strategic alliance of the University of Waikato and five North Island ITPs:108 it was intended to allow students greater access to tertiary education provision in the region. The Canterbury Tertiary Alliance (CTA)109 is another example of a regionally focused grouping, and comprises two universities, a college of education and an ITP. CTA works on transfer of credit and arranges reciprocal access to such facilities as libraries. 479 Another more widely spread grouping is the Tertiary Accord of New Zealand (TANZ), which was launched in 2000 with Christchurch Polytechnic Institute of Technology, Manukau Institute of Technology, Otago Polytechnic, and UCOL110 as its members. TANZ facilitates collaborative projects in such areas as course material design, qualification design and development and programme delivery – especially on-line delivery. TANZ also funds research and evaluation projects.
107 All the significant groupings or alliances of TEIs that currently exist have developed as TEI initiatives. 108 Bay of Plenty Polytechnic, Tairawhiti Polytechnic, University of Waikato, Waiariki Institute of Technology, Waikato Institute of Technology, and the Western Institute of Technology at Taranaki. 109 www.cta.ac.nz 110 Universal College of Learning (an ITP which has campuses in Wanganui, Palmerston North and Masterton).
114
Supporting learning pathways 480 The TES articulates the need for a comprehensive system of credit transfer, to provide a ‘seamless pathway’ of learning. In 2002 NZQA released Supporting Learning Pathways111 a policy report that uses the New Zealand Register of Quality Assured Qualifications (New Zealand Qualifications Authority, 2003) and the quality assurance requirements of the Education Act 1989 to provide the foundation and mechanism for credit recognition and transfer. 481 The key principles of Supporting Learning Pathways are:
Qualification, course and programme development and design should promote and facilitate credit recognition and transfer.
The key focus of credit transfer decisions should be on the benefit for learners and supporting effective learning pathways.
Transparency in credit recognition and transfer decision-making across the education system is a critical factor in supporting and encouraging the ongoing involvement of learners in education and training.
Credit transfer and recognition should be able to operate across different cultures and national borders, and robust policies and procedures need to be in place to support this.
Credit awarded as a result of either recognition of prior learning or recognition of current competency is of equal standing to credit awarded through other forms of assessment and should be able to be carried with the learner once awarded.
482 Since 2002, considerable work has gone into the policy’s implementation – including the work done by alliances of TEIs which have taken the principles of Supporting Learning Pathways and focused them on facilitating transfer arrangements amongst themselves. Recognition of non-formal prior learning 483 In New Zealand, the recognition of non-credentialed prior learning (RPL) is recognised into the National Qualifications Framework (NQF) assessment model. Most TEOs have policies for RPL assessment. Student movement/transfers 484 Student movement between programmes and TEOs was the focus of a study released in 2004 (Ministry of Education, 2004b). It describes the pathways taken by a cohort of some 55,640 domestic students who first studied in 1998 for formally assessed qualifications at TEIs, and it follows five years of their study until the end of 2002. The study, however, falls outside the period of major growth for wānanga, and so some of the findings regarding wānanga may no longer apply.112 485 Around 5.3% of the 1998 ‘starters’ gained two or more levels of qualification after five years.113 The most popular combinations were certificate and diploma (1.1%), certificate and degree (1.0%), diploma and degree (0.8%), degree and postgraduate certificate or diploma (0.7%), and degree and honours (0.7%). As an estimate of articulation114 in tertiary
111 Refer to www.nzqa.govt.nz/qualifications/creditpolicy.pdf 112 Almost all of this growth was however in low level foundation-type programmes. 113 Students who gain more than one qualification at the same level are counted as having gained one level in this report. 114 ‘Articulation’ refers to students who advance to and complete higher level qualifications instead of, or in addition to, the ones they started.
115
education, 6.2% of 1998 starters gained higher-level qualifications instead of, or in addition to, the level they started. 486 The most common pathway leading to articulation was study at diploma level at a college of education, where it was common to move on to study at degree level. Of the college of education diploma starters, 37.9% left with a degree. 487 Just under 5% of 1998 certificate starters gained higher-level qualifications between 1998 and 2002, compared with 8.3% for diploma starters, and 8.4% for degree starters. 488 Between 1998 and 2002, 8.9% of 1998 university starters gained qualifications at a higher level than the level at which they started. This compares with 3.8% of 1998 ITP starters, 21.9% of college of education starters,115 and 4.5% of wānanga starters. 489 Of the 55,640 domestic students starting in TEIs in 1998, 39.1% started at universities, 57.6% started at ITPs, 2.3% started at colleges of education, and 1.0% started at wānanga. Of all starting students, 7.8% studied at more than one type of TEO between 1998 and 2002. The most common combination was university and ITP (5.3% of all starters). Another 1.1% of all starters combined study at an ITP with study at a wānanga, 0.8% combined study at a college of education with study at a university, and 0.4% combined a college of education and an ITP. 490 Nearly 92% of university starters studied with the same type of TEO between 1998 and 2002. This compares with 92.6% of polytechnic starters, 86.7% of college of education starters, and 84.6% of wānanga starters. Student information 491 To make good choices, students need to have easy access to accurate and comprehensive information on matters such as career options, course cost, quality, and their eligibility for student loans and allowances. 492 Career Services is New Zealand's leading provider of career information, advice and guidance. It provides free career-information and advice services on campuses and through its website, and promotes the importance of career planning. Its website also provides extensive job, industry and training information. 493 NZQA provides information about qualifications, and also information on the quality of PTEs and wānanga. The New Zealand Register of Quality Assured Qualifications website (KiwiQuals), which allows people to compare all New Zealand quality-assured and approved qualifications, is administered by NZQA. 494 Students can access information on their tertiary education opportunities directly, through individual TEO websites. Most TEOs also provide printed materials to prospective students, organise campus visits, and send liaison officers to schools. 495 All TEOs are expected to have a student information policy. TEOs receiving government funding must reveal certain basic information to help students make informed choices about what they can study and where. This information includes arrangements for
115 Degrees in education or teaching became more common at colleges of education in 1999. In 1998, students enrolled in diplomas could also enrol in degree courses at a university. It is likely that the university component for these students is not well captured in the data. This factor will tend to under-represent the percentage of college of education students also enrolled at a university (6.8%). In 1999, we see a large percentage of college of education students who had been enrolled in diplomas in 1998 switching to degrees.
116
fees refunds, withdrawal policies, guarantees, credit transfer, and associations with other TEOs. Pathways into tertiary education 496 During the 1990s, there was significant development in New Zealand secondary schools of programmes that provided for a wider group of students than the traditional ‘entrance-qualification to university’ stream. These developments were innovative and wide ranging in content and form. At the same time, ITPs widened their course offerings – a response to the changing nature of education and training needs, the much higher participation in tertiary education, and the opening of tertiary education to market forces. 497 Both these changes occurred rapidly, and frequently without cross-sector co-ordination. So while they provided more opportunities for some students, they created barriers for others – often because of a lack of clarity in the pathways into tertiary study and weak alignment between secondary and tertiary study. 498 The curriculum-alignment project that started at Manukau Institute of Technology (MIT) in 2002 was a local response to this. It has now become a national project, with 17 ITPs participating. It is led by MIT and funded by the TEC’s Innovation Development Fund. Provider links with schools 499 Initiatives have been introduced in recent years to provide non-traditional pathways from school directly into tertiary education and/or work. 500 In 2003 there were almost 137,300 enrolments in the Secondary-Tertiary Alignment Resource (STAR) scheme, which aims to assist secondary school students into work or further study through courses not traditionally provided through the schools. In addition, 2,600 students participated in Gateway, a scheme that enables senior secondary students to undertake formal workplace learning while they are still at school. Of those students who participated in Gateway in 2003, 25% moved on to full-time employment and 65% to further training or education. 501 Bridging education programmes are designed to assist students in developing the skills necessary for success in tertiary study. From the mid 1980s, there has been a steady increase in the number and quality of bridging programmes offered by TEOs. Developing foundation competencies 502 There is a particular need to lift the general population’s level of education to ensure everyone has foundation-level learning and is able to move up to higher levels of learning. As such, enhancing foundation skills is one of the focus areas of the TES. Students who leave school without qualifications will generally require further education before they can advance to higher levels of tertiary education. 503 The 1996 International Adult Literacy Survey (IALS) found that around 20% of adult New Zealanders had very poor functional literacy skills. Low literacy is a major barrier to educational attainment, and the launch of the government’s adult literacy strategy in 2001 set goals in place to improve adult literacy. In 2002, the Adult Literacy Innovations Pool was set up to provide opportunities for literacy learning in TEIs and PTEs, and within communities – and it was extended in 2003 to provide a number of projects targeted at particular community groups who had low levels of literacy. A high proportion of participants were Māori and Pasifika peoples.
117
504 Literacy programmes are also delivered to learners through the community, vocational programmes, and in the workplace. In 2003, the Ministry of Education trialled the Adult Literacy Achievement Framework, and the TEC’s Workplace Literacy Fund provided funding for 17 workplace literacy projects involving over 800 learners. Literacy Aotearoa’s member organisations provided literacy education to about 6,300 learners in 2003, while 7,900 adult learners received English for Speakers of other Languages (ESOL) tuition and resettlement support from the National Association of ESOL Home Tutor Schemes. The English for Migrants programme also offers English language tuition to new migrants on a user-pays basis. 505 The government funds a range of transition, pre-employment, life, and job skills programmes which provide learners with foundations skills and sustainable employment outcomes. In 2003, there were nearly 82,000 people enrolled in one or more programmes based on developing foundation competencies such as language and numeracy, social skills, and employment skills. The majority of these programmes were provided by wānanga or ITPs. Since 2000, the number of students enrolled in these types of courses has increased by over 400%. One of the reasons for the scale of the expansion is related to the growth in foundation education enrolments at Te Wānanga o Aotearoa. 506 Training Opportunities is a labour-market programme that provides foundation and vocational skills training to jobseekers at levels 1 to 3 of the NQF. In 2003, nearly 19,000 learners participated in Training Opportunities programmes, and 65% of all learners had achieved a positive outcome from the programme within two months of completion (either moving into employment or taking up further education and training). Youth Training programmes are designed to assist school leavers with no or low qualifications to move into employment or further education and training. Around 12,500 trainees undertook Youth Training programmes during 2003. The majority of learners (71%) who completed Youth Training in 2003 had moved on to further training or employment within two months of completing the programme. 507 Adult and Community Education (ACE) offers a range of educational opportunities within the community. In 2003, there were more than 200,000 ACE enrolments through schools, which was an increase of around 13% from the previous year. In addition, there were 529,000 enrolments in ACE programmes offered by 29 TEIs in 2003. ACE enrolments at TEIs have increased by 380% since 2000, and this has raised questions about the appropriateness of the ACE activity in some TEIs. Much of the growth in ACE has occurred in ITPs as a result of development of ACE provision in new areas and through provision of zero-fee ACE courses. In 2004, the government initiated a project to review the rate of growth of ACE in TEIs and to look at the alignment of ACE with the TES. Provision of industry training 508 The workplace provides an increasingly important vehicle for tertiary learning. Increasing the productivity of those already in employment is expected to be the single most important factor in easing labour-market pressures and lifting New Zealand’s economic growth rate. For tertiary education, this means that there is likely to be greater demand for on-job training and less for low-level pre-employment training. 509 The government’s Industry Training Strategy is designed to increase the quality and quantity of industry training in New Zealand. Industry training was introduced in 1992 to assist in the development of an internationally competitive and highly skilled workforce. The strategy is industry-led and is designed to be responsive to the needs of enterprises and employees.

118
510 The Industry Training Act 1992 provided the framework for industry to control the development, implementation and management of industry training programmes; and it made Industry Training Organisations (ITOs) responsible for setting skill standards and arranging training programmes in the industry they represent. All industry training is assessed against national standards set by the ITOs and earns credits and qualifications registered on the NQF. ITOs do not provide training themselves, but make arrangements for workplace assessment and off-job delivery of training, such as purchase of training at an ITP or PTE. 511 The TEC purchases industry training through ITOs, using the same charters and profiles process as it uses for TEIs and other tertiary providers. Industry training is jointly funded by the government (through the Industry Training Fund) and by industry through financial and in-kind contributions). 512 The majority of industry training is at ISCED levels 3 and 4.
119
CHAPTER 9: ASSURING AND IMPROVING THE QUALITY OF TERTIARY EDUCATION
The components of quality assurance 513 The quality assurance system in tertiary education aims to provide learners and other stakeholders with confidence in the consistent quality of education, training, assessment and qualifications. Quality assurance in the tertiary sector also extends to research, whose quality comes under scrutiny through peer review as part of the Performance-Based Research Fund (PBRF) assessment 514 Quality assurance of provision has four levels – registration, approval, accreditation, and monitoring and audit:
Registration is required of any private training establishment (PTE) or ‘other’ tertiary education providers (OTEP) that wishes to receive government funding, offer approved courses or courses over three months to international students, or offer qualifications available for student loans or allowances. Because they are established under the Education Act 1989, universities, institutes of technology and polytechnics (ITPs), colleges of education, and wānanga do not need to be registered.
Approval against gazetted criteria is required for any qualification that is to be funded.
Accreditation of a tertiary education organisation is required for the delivery of each approved qualification or (in the case of national qualifications) for assessment against a particular field on the National Qualifications Framework (NQF).
Monitoring and audit ensures that TEOs can demonstrate ongoing compliance with quality assurance standards in all aspects of the development, delivery, and assessment of their education and training programmes. TEOs must put in place a quality management system that demonstrates they have the necessary policies, procedures and review mechanisms for maintaining quality standards and for meeting those of their goals and objectives that relate to teaching and learning.
515 Approved qualifications are registered on the New Zealand Register of Quality Assured Qualifications (New Zealand Qualifications Authority, 2003), which is being phased in over the period 2002 to 2006 and which sets out the essential details of the qualification, including statements of expected learning outcomes for each qualification. The register has led to standardisation of qualification nomenclature, a shared understanding of qualification level, and a credit-value system that defines a common metric for the ‘size’ of qualifications. In these ways, the Register has led to greater transparency. 516 There are 10 levels on the Register, with 10 (doctorates) being the highest. Levels 1 to 4 are certificates, levels 5 and 6 diplomas, level 7 bachelors degrees and graduate diplomas, level 8 postgraduate diplomas/certificates and bachelors-with-honours degrees, and level 9 masters degrees. It should be noted that levels do not equate to ‘years spent learning’ – they reflect the complexity of learning involved in the qualification. (See also Chapter 2.) 517 The NQF and the Register have the same ‘levels’ and credit-value system. The quality assurance system 518 The New Zealand Qualifications Authority (NZQA) is the organisation primarily responsible for quality assurance for non-university TEOs.116 Some lesser quality-assurance functions in non-university TEOs are delegated to their academic boards – for example, minor 116 Education Act 1989, s159AD (2).
120
changes to quality assured qualifications, and the quality assurance of certificate and diploma qualifications that are particular to individual TEOs. However, as a result of concerns about the quality of some certificate and diploma provision, the delegation of quality assurance functions to academic boards has recently been the subject of a review; and its scope is to be narrowed as a result. 519 In the case of universities, quality assurance is the responsibility of the New Zealand Vice-Chancellors Committee (NZVCC). NZVCC is independent,117 although its quality assurance role is governed by the Education Act 1989. Delegation of quality assurance 520 NZQA delegates its quality assurance functions as follows:
In ITPs (up to and including undergraduate degrees), these functions are delegated to the ITPs’ association, the Institutes of Technology and Polytechnics New Zealand (ITPNZ) – which in turn delegates to its independent committee, the Institutes of Technology and Polytechnics Quality (ITPQ)118;
for wānanga, PTEs, and government training establishments (GTEs), they are delegated to the NZQA’s own Approvals, Accreditation and Audit unit (AAA);
for colleges of education (up to certificate and diploma level), delegation is made to the Association of Colleges of Education New Zealand (ACENZ) – which in turn delegates these functions to the Colleges of Education Accreditation Committee (CEAC); and
for colleges of education (at degree level), quality assurance is delegated to AAA. 521 Similarly, the NZVCC delegates its quality assurance of universities to one of its standing committees, the Committee on University Academic Programmes (CUAP)119. 522 ITPQ, CEAC, AAA, and CUAP are known as quality assurance bodies (QABs). The effectiveness of quality assurance bodies is audited against the delegation and against a set of audit standards. Audits of ITPQ and CEAC are undertaken by an independent panel; audits of CUAP are undertaken by the New Zealand Universities Academic Audit Unit (NZUAAU), an independent body established by the NZVCC120. All the quality assurance bodies are brought together under the Inter-institutional Quality Assurance Bodies Consultative Group (IIQABCG), which provides a forum for discussion of quality assurance activities across the sector. The Ministry of Education and the Tertiary Education Commission (TEC) also participate in IIQABCG meetings, reinforcing the shared responsibility for quality across the sector and between the agencies. 523 The NZQA has recently moved to enhance quality assurance and risk management practices. Planning has begun to:
increase the focus on quality teaching and learning in the quality assurance processes of NZQA and its delegated bodies
enhance the monitoring of delegations to quality assurance bodies (including delegations to the academic boards of TEOs).
117 NZVCC is funded by the universities, but is recognised in the Education Act 1989 and hence, is required to meet certain public accountability requirements. 118 ITPQ’s functions, goals, personnel and procedures are set out at: www.itpq.ac.nz 119 For a detailed account of the approach to quality assurance taken by the CUAP, refer to Committee on University Academic Programmes (2005) Functions and Procedures 2005-2006, available at: www.nzvcc.ac.nz/default.aspx?l=3&p=1 120 For an overview of the unit, its history, its functions and its procedures, refer to New Zealand Universities Academic Audit Unit (2005) Unit History - A brief Overview, available at: www.aau.ac.nz/nzuaau_site/about/unit_history.htm
121
Quality assurance of research 524 The quality of a TEO’s research activities is assured primarily through the Performance-Based Research Fund (PBRF), being phased in from 2004 to 2007. The PBRF delivers the government’s primary funding for research in the tertiary sector and aligns research funding with TEOs’ research performance. Of the PBRF funding, 60% is allocated to TEOs on the basis of an assessment of the quality of the research outputs produced. 525 The PBRF quality evaluation employs peer-review processes and involves the direct assessment of the research outputs produced by individual staff (rather than academic units). The method of assessment employed avoids a simple quantitative assessment of research output by taking a holistic view of research quality and focusing on qualitative, expert-led assessment of each researcher’s ‘best’ outputs. Quality assessments are aggregated to provide an assessment of each TEO’s research quality.121 Complaints procedures for individuals 526 The government has charged the Office of the Ombudsmen – an independent review authority responsible to Parliament – with the responsibility of investigating complaints against public-sector TEOs (known as tertiary education institutions, or TEIs). The Office of the Ombudsmen requires each TEI to have an internal complaints-handling procedure. 527 PTEs have created a external-complaints mechanism similar to that of the Office of the Ombudsmen. In addition, NZQA can also investigate complaints at PTEs on behalf of the complainant – although complainants are advised to raise any matter initially with their PTE’s management. Quality management processes 528 Each TEO is expected to build and maintain a quality management system whose function is to foster continuous improvement in the quality of the education that the TEO provides. 529 TEIs are also required to establish an academic board responsible for advising on academic matters, including issues of teaching and learning quality. Most TEIs have professional development units that coordinate programmes of teaching improvement, and most maintain extensive surveying programmes – including surveys of current students and former students/graduates. 530 TEOs incorporate student perspectives into their quality management processes – for example, in activities such as departmental and programme reviews. In addition, students are represented on academic boards in most TEOs; and each TEI council is required to have some student representation. Students are consulted and/or participate in audits conducted by ITP Quality and the NZAAU. 531 TEOs are audited to ensure their ongoing compliance with quality assurance standards. They are also required to show that their quality management systems demonstrate the necessary policies, procedures and review mechanisms to maintain quality standards. 532 The quality of teaching and learning is monitored indirectly through the quality assurance bodies’ audit processes and directly by the TEOs themselves. There are also a number of centrally sponsored initiatives and mechanisms that directly and indirectly serve to
121 For more detail of the PBRF, refer to chapter 5 of this report, to Tertiary Education Commission (2004) or to Ministry of Education (2004), (2005g) or (2005f).
122
enhance the quality assurance of teaching – for example, work aimed at building a culture that enhances effective teaching and learning. The recently established National Centre for Tertiary Teaching Excellence has also been created to enhance the effectiveness of tertiary teaching and learning practices. 533 The Student Component Performance Measure – which will be introduced into student-component funding in the near future – is also expected to help secure improvements in the effectiveness of teaching and learning. The indicators which will be used in the measure are: course completions rates, course retention rates, and the results of an annual national survey122 of learners. Poor performance in this measure will be the subject of remedial action agreed between the TEC and the individual TEO. Persistently poor performance could put the TEO’s funding at risk. 534 The incorporation of student perspectives into quality assessments at a national level will occur in a comprehensive way through the national survey of learners undertaken as part of this measure. While details of the survey are still being developed, it is expected that it will provide statistically valid performance and quality information that will inform TEOs’ profile negotiations with the TEC. 535 There is no formal system-wide mechanism for ensuring international comparability of the quality of tertiary education. A number of TEOs, however, undertake benchmarking activity – either with other TEOs in New Zealand or with TEOs overseas. Issues relating to quality assurance of PTEs 536 As a condition of registering with NZQA, PTEs must subject themselves to the same quality assurance processes as TEIs – and they are quality assured by AAA, NZQA’s quality assurance body. Registration,123 accreditation and course approval are the three main outcomes of this quality assurance process carried out by AAA. Nonetheless, some issues of quality among PTEs have arisen; and NZQA audit reports have noted concerns about quality, especially in areas of rapid enrolment growth.124 In response to this, there will be a number of changes to the provision of certificate and diploma education for 2006 including:
Tighter and enhanced quality assurance and monitoring systems in government agencies, to ensure that both existing and new provision is relevant and of high quality;
Greater NZQA oversight over quality assurance bodies by way of auditing, monitoring and strengthening the conditions for course approval;125
The establishment of a Quality Reinvestment Fund, which will provide more than $175 million over five years and which is aimed at supporting TEOs from 2006, as they shift to new programmes and strengthen their current provision.
The audiences for quality-related information 537 Evidence on the quality of the tertiary education system is provided in a number of different ways:
122 To be conducted for the first time in 2007. 123 The length of the registration period reflects the confidence that NZQA has in the quality systems of the individual provider, with those PTEs who have the strongest systems being granted an audit cycle of three years. 124 Much of the significant expansion of enrolments in the first half of this decade has been a result of wānanga, ITPs and PTEs being extremely successful at enrolling into their certificate programmes large numbers of learners over the age of 25 who have never attended tertiary education and who have achieved low or no secondary school qualifications. 125 As mentioned earlier in this chapter, the process of delegating quality assurance to academic boards of individual TEOs will be strengthened.
123
Quality assurance bodies produce publicly available audit reports after their audits of TEOs126.
TEOs are required to report statistical data on enrolments, completions, and other data relating directly or indirectly to the quality of the system.
The Ministry of Education and the Tertiary Education Commission use the data collected from TEOs to analyse the performance of the system. A set of education indicators has been created, and an annual report on progress against the goals of the TES is published. An annual survey report, New Zealand’s Tertiary Education Sector: Profiles and Trends, summarises other analyses to provide an overview of the performance and key characteristics of the sector.
538 In practice, the audit reports produced by quality assurance bodies are used most by TEOs themselves, so their key audiences are the managers and academic staff of TEOs. The reports are, however, usually made available to the wider public through publication on websites. 539 Analyses of system performance are made available widely, and are reported in news media. These analyses also provide benchmark information against which TEOs can assess their own performance. They are also used by Career Services, the Crown entity that helps students and prospective students make decisions on careers and on tertiary education choices. (Career Services has also been working with other agencies towards an improved neutral information-platform that can integrate performance information and package it in ways suitable for its target audiences.) Qualification completion rates 540 Much of this section focuses on qualification completion rates. It needs to be recognised, however, that there are many students who are successful in completing some parts of a qualification without ever finishing the whole – and this effect is pronounced among those who study part-time (Ministry of Education, 2004d). As a result, qualification completion rates cannot be used in isolation as a quality measure. 541 Reliable evidence on retention and completion has become available in New Zealand only since 2003, with the creation of a longitudinal dataset containing matched enrolment and completion. Published analyses of retention, completion and retention have appeared since 2003, and the scope and range of those analyses have grown (Ministry of Education, 2004d). True cohort measures of qualification retention and completion for a wide range of demographic and study-related groups are now routinely reported.127 542 In 2003, around 14% of New Zealanders aged 15 and over were enrolled in some form of tertiary education. This equated to nearly 430,000 students or some 235,000 equivalent full-time students (EFTS). In the same year, around 95,000 of these students gained a qualification. Levels of participation and achievement are currently at their highest levels ever, driven largely by growth in certificate and diploma level qualifications. 543 At current rates of completion, around 40% of those starting a qualification will complete after five years. However, these rates vary significantly with such factors as the level of qualification, the TEO type, the type of student, and the mode of learning. When one looks at bachelors degree students who study on a full-time basis, the six-year completion rate rises to 72%, similar to comparable rates from the US and Australia and close to the UK. In
126 See for example the NZUAAU report on its cycle 3 audit of the University of Canterbury (2005a) Academic Audit Report Cycle 3, available at: www.aau.ac.nz/nzuaau_site/publications/reports/Canterbury-cyc3-2005.pdf 127 In, for example, Ministry of Education (2005) New Zealand's Tertiary Education Sector: Profile and Trends 2004. This is the most recent edition of an annual series that includes this material.
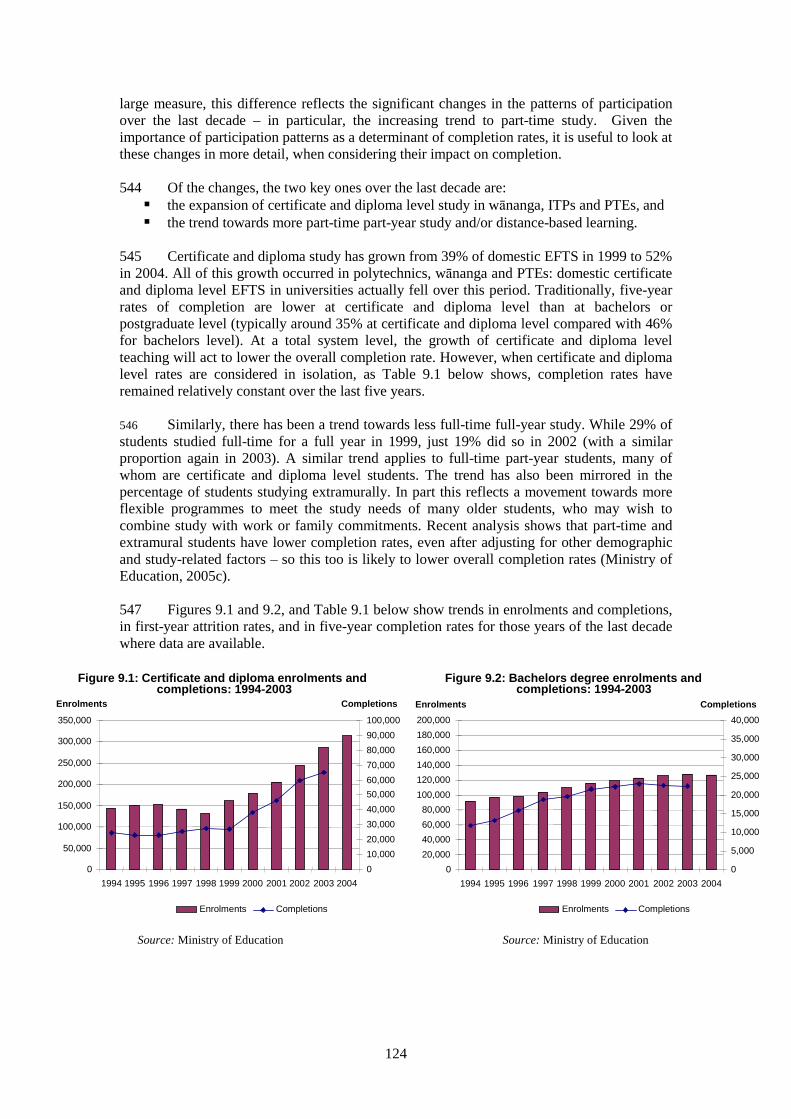
124
large measure, this difference reflects the significant changes in the patterns of participation over the last decade – in particular, the increasing trend to part-time study. Given the importance of participation patterns as a determinant of completion rates, it is useful to look at these changes in more detail, when considering their impact on completion. 544 Of the changes, the two key ones over the last decade are:
the expansion of certificate and diploma level study in wānanga, ITPs and PTEs, and the trend towards more part-time part-year study and/or distance-based learning.
545 Certificate and diploma study has grown from 39% of domestic EFTS in 1999 to 52% in 2004. All of this growth occurred in polytechnics, wānanga and PTEs: domestic certificate and diploma level EFTS in universities actually fell over this period. Traditionally, five-year rates of completion are lower at certificate and diploma level than at bachelors or postgraduate level (typically around 35% at certificate and diploma level compared with 46% for bachelors level). At a total system level, the growth of certificate and diploma level teaching will act to lower the overall completion rate. However, when certificate and diploma level rates are considered in isolation, as Table 9.1 below shows, completion rates have remained relatively constant over the last five years. 546 Similarly, there has been a trend towards less full-time full-year study. While 29% of students studied full-time for a full year in 1999, just 19% did so in 2002 (with a similar proportion again in 2003). A similar trend applies to full-time part-year students, many of whom are certificate and diploma level students. The trend has also been mirrored in the percentage of students studying extramurally. In part this reflects a movement towards more flexible programmes to meet the study needs of many older students, who may wish to combine study with work or family commitments. Recent analysis shows that part-time and extramural students have lower completion rates, even after adjusting for other demographic and study-related factors – so this too is likely to lower overall completion rates (Ministry of Education, 2005c). 547 Figures 9.1 and 9.2, and Table 9.1 below show trends in enrolments and completions, in first-year attrition rates, and in five-year completion rates for those years of the last decade where data are available.
Source: Ministry of Education Source: Ministry of Education
Figure 9.2: Bachelors degree enrolments and completions: 1994-2003
0 20,000 40,000 60,000 80,000
100,000 120,000 140,000 160,000 180,000 200,000
1994 1995 1996 1997 1998 1999 2000 2001 2002 2003 2004
Enrolments
0 5,000 10,000 15,000 20,000 25,000 30,000 35,000 40,000
Completions
Enrolments Completions
Figure 9.1: Certificate and diploma enrolments and completions: 1994-2003
0 50,000
100,000 150,000 200,000 250,000 300,000 350,000
1994 1995 1996 1997 1998 1999 2000 2001 2002 2003 2004
Enrolments
0 10,000 20,000 30,000 40,000 50,000 60,000 70,000 80,000 90,000 100,000
Completions
Enrolments Completions
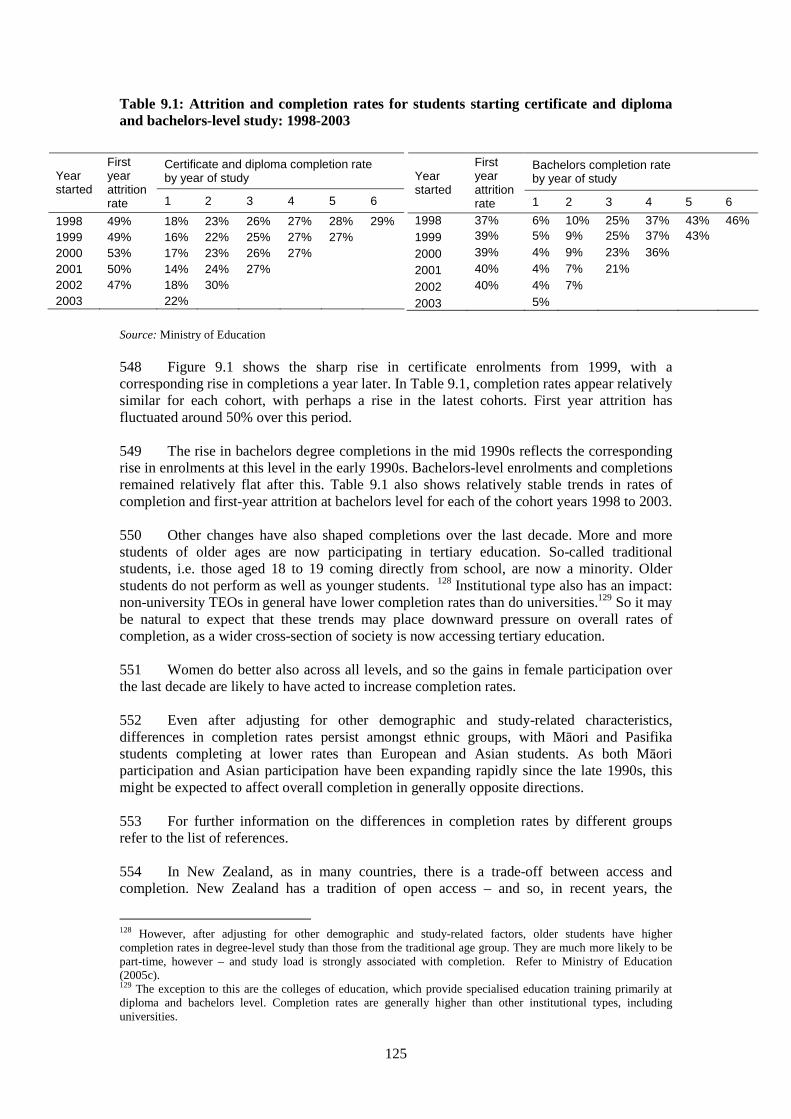
125
Table 9.1: Attrition and completion rates for students starting certificate and diploma and bachelors-level study: 1998-2003
Source: Ministry of Education 548 Figure 9.1 shows the sharp rise in certificate enrolments from 1999, with a corresponding rise in completions a year later. In Table 9.1, completion rates appear relatively similar for each cohort, with perhaps a rise in the latest cohorts. First year attrition has fluctuated around 50% over this period. 549 The rise in bachelors degree completions in the mid 1990s reflects the corresponding rise in enrolments at this level in the early 1990s. Bachelors-level enrolments and completions remained relatively flat after this. Table 9.1 also shows relatively stable trends in rates of completion and first-year attrition at bachelors level for each of the cohort years 1998 to 2003. 550 Other changes have also shaped completions over the last decade. More and more students of older ages are now participating in tertiary education. So-called traditional students, i.e. those aged 18 to 19 coming directly from school, are now a minority. Older students do not perform as well as younger students. 128 Institutional type also has an impact: non-university TEOs in general have lower completion rates than do universities.129 So it may be natural to expect that these trends may place downward pressure on overall rates of completion, as a wider cross-section of society is now accessing tertiary education. 551 Women do better also across all levels, and so the gains in female participation over the last decade are likely to have acted to increase completion rates. 552 Even after adjusting for other demographic and study-related characteristics, differences in completion rates persist amongst ethnic groups, with Māori and Pasifika students completing at lower rates than European and Asian students. As both Māori participation and Asian participation have been expanding rapidly since the late 1990s, this might be expected to affect overall completion in generally opposite directions. 553 For further information on the differences in completion rates by different groups refer to the list of references. 554 In New Zealand, as in many countries, there is a trade-off between access and completion. New Zealand has a tradition of open access – and so, in recent years, the
128 However, after adjusting for other demographic and study-related factors, older students have higher completion rates in degree-level study than those from the traditional age group. They are much more likely to be part-time, however – and study load is strongly associated with completion. Refer to Ministry of Education (2005c). 129 The exception to this are the colleges of education, which provide specialised education training primarily at diploma and bachelors level. Completion rates are generally higher than other institutional types, including universities.
Certificate and diploma completion rate by year of study Year
started
First year attrition rate 1 2 3 4 5 6
1998 49% 18% 23% 26% 27% 28% 29% 1999 49% 16% 22% 25% 27% 27% 2000 53% 17% 23% 26% 27% 2001 50% 14% 24% 27% 2002 47% 18% 30% 2003 22%
Bachelors completion rate by year of study Year
started
First year attrition rate 1 2 3 4 5 6
1998 37% 6% 10% 25% 37% 43% 46% 1999 39% 5% 9% 25% 37% 43%
2000 39% 4% 9% 23% 36%
2001 40% 4% 7% 21%
2002 40% 4% 7%
2003 5%
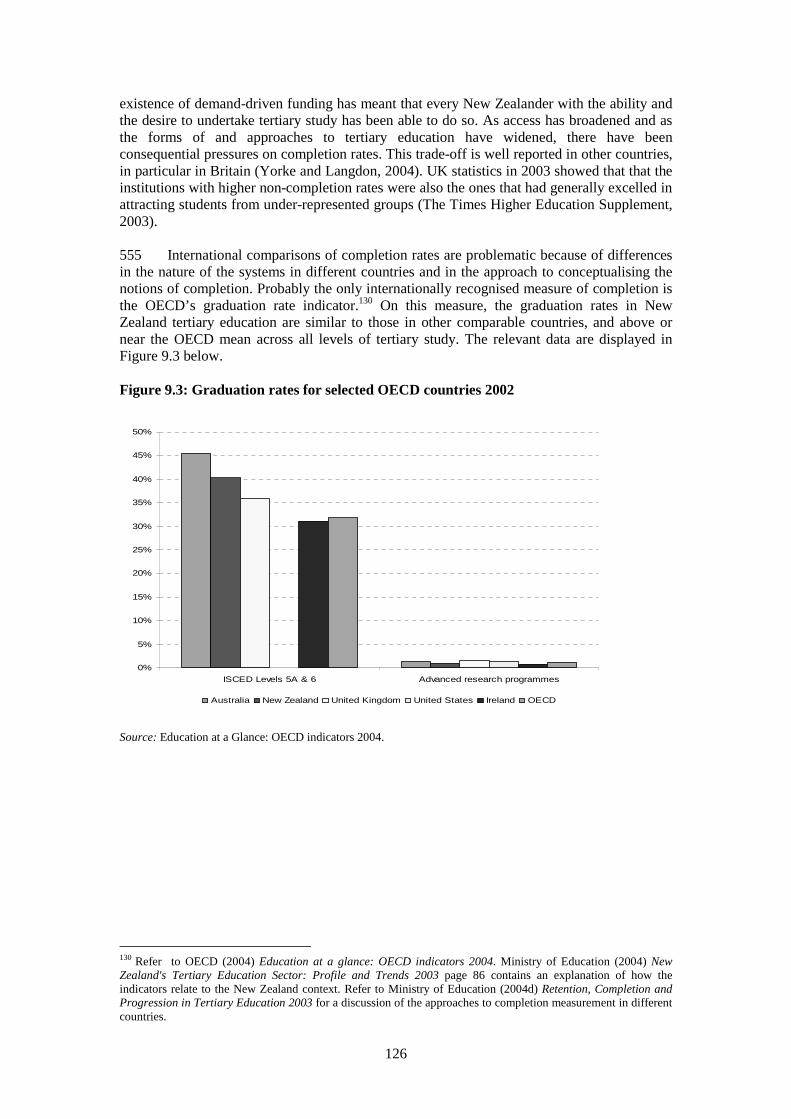
126
existence of demand-driven funding has meant that every New Zealander with the ability and the desire to undertake tertiary study has been able to do so. As access has broadened and as the forms of and approaches to tertiary education have widened, there have been consequential pressures on completion rates. This trade-off is well reported in other countries, in particular in Britain (Yorke and Langdon, 2004). UK statistics in 2003 showed that that the institutions with higher non-completion rates were also the ones that had generally excelled in attracting students from under-represented groups (The Times Higher Education Supplement, 2003). 555 International comparisons of completion rates are problematic because of differences in the nature of the systems in different countries and in the approach to conceptualising the notions of completion. Probably the only internationally recognised measure of completion is the OECD’s graduation rate indicator.130 On this measure, the graduation rates in New Zealand tertiary education are similar to those in other comparable countries, and above or near the OECD mean across all levels of tertiary study. The relevant data are displayed in Figure 9.3 below. Figure 9.3: Graduation rates for selected OECD countries 2002
0%
5%
10%
15%
20%
25%
30%
35%
40%
45%
50%
ISCED Levels 5A & 6 Advanced research programmes
Australia New Zealand United Kingdom United States Ireland OECD Source: Education at a Glance: OECD indicators 2004.
130 Refer to OECD (2004) Education at a glance: OECD indicators 2004. Ministry of Education (2004) New Zealand's Tertiary Education Sector: Profile and Trends 2003 page 86 contains an explanation of how the indicators relate to the New Zealand context. Refer to Ministry of Education (2004d) Retention, Completion and Progression in Tertiary Education 2003 for a discussion of the approaches to completion measurement in different countries.
127
CHAPTER 10 – INTERNATIONALISATION AND GLOBALISATION OF TERTIARY EDUCATION
Introduction 556 Internationalisation in the New Zealand tertiary education sector has developed gradually within an export education industry that has grown rapidly over a short period of time. Over recent years, the government, in partnership with the sector, has sought to develop a coordinated and strategic approach to export education that is sustainable and that supports the development of a broader spectrum of international activity in TEOs. The characteristics of export education and internationalisation 557 Historically, there was a small number of international students in the New Zealand tertiary education sector. There was also a limited range of international connections through academic and research activity. Before 1990, these international academic and research connections were largely focused on the universities, mainly with Australia, the United Kingdom, the United States, and Western Europe. While there were some postgraduate students from those countries, the majority of international students came from South East Asia, with some also from Pacific countries. Most international students came to New Zealand under schemes like the Commonwealth Scholarship and Fellowship Plan, the Colombo Plan and New Zealand’s bilateral aid programmes. 558 In the late 1980s, the New Zealand government promoted export education - allowing the recruitment of international students on a full-fee-paying basis. It also provided some support for marketing New Zealand education overseas. The government clarified the status of international students and provided ground rules for their enrolment. The Education Act 1989 allows tertiary education organisations (TEOs) to charge international students a fee to cover the costs of providing their education and prohibits the use of public funding to subsidise the costs of teaching international students. Since then, international students in New Zealand (with the exception of those on approved exchange programmes) have been charged fees that cover the full cost of their tuition. From that time, TEOs set about actively recruiting international students. The provision of education services for financial gain saw the creation of the export education industry. 559 The sector led most of the development of export education during the 1990s. Most TEOs active in the international student market did their own marketing. A national lead body, (now Education New Zealand), along with various tertiary sector representative groups, undertook coordination of marketing and advocacy for TEOs involved in export education. As well as provision for international students within New Zealand, there was some (limited) offshore campus-based and distance learning. 560 Initially, most in the tertiary education sector saw export education as primarily an opportunity to generate revenue. It allowed TEOs to increase the number of students and hence, gain economies of scale while the full-cost recovery basis of fees enabled them to cross-subsidise the provision of tertiary education to their domestic students. Much of the improvement in the financial performance of the public tertiary education institutions (TEIs) over the last five years was associated with the rapid rise in international student numbers. 561 In general, it is now accepted that the benefits of export education are not simply financial. There are significant non-commercial returns for those TEOs that adopt a strategic approach to internationalisation. The non-commercial aspects of the industry began to develop in the 1990s with some TEOs seeking to include an international dimension, beyond the presence of international students, in their services, programmes and culture (Ministry of Education, 1998). There was also a growing emphasis on the development of linkages with
128
institutions overseas and a greater encouragement of mobility by New Zealand students through participation in reciprocal exchange schemes. Despite these moves by some TEOs, there was little evidence across the tertiary sector of a widespread culture of internationalisation in the 1990s. 562 In general, it is agreed that the settings of the 1990s did enable a culture of internationalisation. Some curriculum changes occurred as international students reached a critical mass at TEOs but some argue that there was little central government support for TEOs to do so. The universities recognised the commercial value of their international student programme, but many also had student exchange agreements, while all had active research contacts with institutions abroad, sent their staff to institutions overseas for sabbatical leave and hosted academics from universities overseas. The universities also participated in some national internationalisation arrangements such as the Commonwealth Scholarship and Fellowship Plan131. 563 From 2000 onwards, during a time of rapid growth in export education, the government took a more active role in fostering the industry, both through funding a marketing strategy and by developing strategies to strengthen it and improve its sustainability. In 2004 the government developed the International Education Framework, a long-term strategic approach to export education and to a broader spectrum of international activity in the tertiary education sector. This strategic approach has also resulted in significant investment by the government and reflects not only the recognition of the benefits of internationalisation but also the export education industry’s contribution to the national economy. 564 The tertiary component of the International Education Framework supports the internationalisation objectives of the Tertiary Education Strategy 2002/07 (TES) which stress the need for TEOs to become more internationally connected132. Impact of Export Education 565 The number of full-fee paying international students studying in New Zealand increased by 263% over the last six years, growing from around 31,000 in 1999 to 113,000 in 2004. Nearly 40% of international students in 2004 were studying in English language schools - private training establishments (PTEs) which specialise in the delivery of English language training.133 Provisional figures for 2005 indicate a decline of around 10% from 2004 numbers with English language schools experiencing larger decreases than this. 566 In the TEIs, the rate of increase in international students was significantly greater than that of domestic students between 1999 and 2004. In 1999, only 4% of the student population in TEIs were international students compared with 10% in 2004. 567 Increasing fees has not deterred the significant growth in international student numbers. Although domestic tuition fees were frozen between 2001 and 2003 through the government’s fee stabilisation policy (refer to Chapter 7a), no such constraint applied to international fees. Without this restriction, international student fees increased by 24% on a per equivalent full-time student (EFTS) basis between 2000 and 2004. Over the period 2000
131 Refer to http://www.csfp-online.org/about.html. 132 There are two objectives in the TES that are explicitly focussed on internationalisation - Objective Four: Sustainable growth of export education capability centred on a reputation for quality teaching and pastoral care and Objective Thirty One: Increased global connectedness and mobility. In addition one of the nine key changes sought in the TES is Improved global linkages. Many of the other objectives, however, have an implied connection to internationalisation. 133 These figures are snapshots as at 31 July and hence are not comparable with the other student figures presented in this report. The majority of English language schools neither receive government funding nor are able to access student support and hence are not required to return data in the main data collection as per other TEOs.
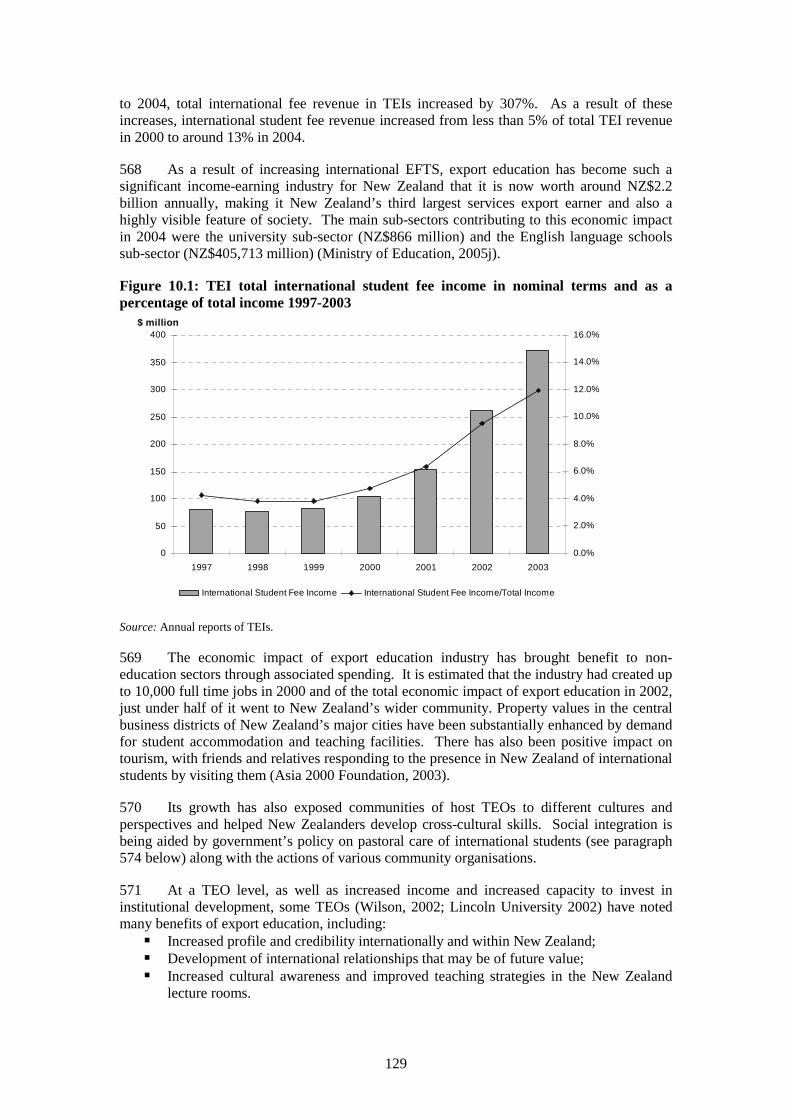
129
to 2004, total international fee revenue in TEIs increased by 307%. As a result of these increases, international student fee revenue increased from less than 5% of total TEI revenue in 2000 to around 13% in 2004. 568 As a result of increasing international EFTS, export education has become such a significant income-earning industry for New Zealand that it is now worth around NZ$2.2 billion annually, making it New Zealand’s third largest services export earner and also a highly visible feature of society. The main sub-sectors contributing to this economic impact in 2004 were the university sub-sector (NZ$866 million) and the English language schools sub-sector (NZ$405,713 million) (Ministry of Education, 2005j). Figure 10.1: TEI total international student fee income in nominal terms and as a percentage of total income 1997-2003
0
50
100
150
200
250
300
350
400
1997 1998 1999 2000 2001 2002 2003
$ million
0.0%
2.0%
4.0%
6.0%
8.0%
10.0%
12.0%
14.0%
16.0%
International Student Fee Income International Student Fee Income/Total Income
Source: Annual reports of TEIs. 569 The economic impact of export education industry has brought benefit to non-education sectors through associated spending. It is estimated that the industry had created up to 10,000 full time jobs in 2000 and of the total economic impact of export education in 2002, just under half of it went to New Zealand’s wider community. Property values in the central business districts of New Zealand’s major cities have been substantially enhanced by demand for student accommodation and teaching facilities. There has also been positive impact on tourism, with friends and relatives responding to the presence in New Zealand of international students by visiting them (Asia 2000 Foundation, 2003). 570 Its growth has also exposed communities of host TEOs to different cultures and perspectives and helped New Zealanders develop cross-cultural skills. Social integration is being aided by government’s policy on pastoral care of international students (see paragraph 574 below) along with the actions of various community organisations. 571 At a TEO level, as well as increased income and increased capacity to invest in institutional development, some TEOs (Wilson, 2002; Lincoln University 2002) have noted many benefits of export education, including:
Increased profile and credibility internationally and within New Zealand; Development of international relationships that may be of future value; Increased cultural awareness and improved teaching strategies in the New Zealand
lecture rooms.
130
572 The rapid development of export education, however, has raised a number of issues for the New Zealand government and the lead industry bodies including:
The capability of TEOs to manage risk and plan effectively to cover fluctuations in student numbers.
The reliance of TEOs on a limited number of source countries: While TEOs have encouraged enrolments from diverse countries, most of the recent expansion in the numbers of international students has come from China. In 2004, the majority of international students in New Zealand were from Asia (82%). The next largest groups were from Europe (7%), North America (6%) and the Pacific (3%).
Dependency on on-shore international students: The incentive for TEOs to pursue the indirect strategic or economic benefits of offshore programmes is not as great as that for on-shore education. Experience suggests that financial benefit to the TEO tends to be lower per student for off-shore than for on-shore programmes (Ministry of Education, 2004a). The risks of off-shore delivery are also very significantly higher. Nonetheless, in 2003, 14 of the 33 TEIs and five of the largest 49 PTEs delivered offshore programmes. E-learning initiatives are still primarily domestically-focussed.
The capacity of the education system to absorb and cater for international students: There are indications that export education has placed additional demands on academic staff and that a high proportion of international students in a class can have negative impacts on the outcomes of both domestic and international students (Gezentsvey, 2003; New Zealand Universities Academic Audit Unit, 2000). Ministry of Education data show that 15% of total EFTS at TEIs in 2004 were international. For universities, international EFTS were 20% of thew total while for institutes of technology and polytechnics (ITPs) the figure was 12%. Also, total international EFTS are spread unevenly across fields of study. For example, 50% of all international student EFTS at TEIs were enrolled in the management and commerce field of study, while that field of study accounted for only 18% of all enrolments. Some TEOs hold professional development programmes for their staff, focused on improving delivery in classes with large international enrolments. Many staff involved with international students have sought further professional development, and some institutions are now extending their programmes.
Protecting the interests of international students: Poor educational quality, support services, business failure or poor pastoral care can have reputational and economic risks for the education sector, and to New Zealand. New Zealand's immigration laws prevent international students from studying a programme not approved by a Quality Assurance Body (refer to Chapter 9) and there is a legal requirement that any TEO intending to enrol international students is a signatory to the Code of Practice for the Pastoral Care of International Students. Furthermore, PTEs are required to have adequate protection of student fees in the event of closure.
English language competency: There has been some concern among university staff that admission criteria have not accurately determined a student’s ability to communicate effectively in written English and as a consequence, that some courses were being ‘dumbed-down’ to accommodate students with poor preparation and inadequate English language skills (New Zealand Universities Academic Audit Unit, 2000 and 2003). The universities have taken steps to ensure that their English language admission requirements are appropriate for the study which international students will be undertaking. Universities have also made efforts to strengthen their foundation programmes to ensure that students are adequately academically and linguistically prepared to begin their studies. The Code of Practice requires TEOs to ensure that international students have the level of English necessary for their study programme and are advised of standards that must be met before they can be enrolled.
573 On-going consideration has been given to addressing these areas of concern in the development of government and sector policy responses on internationalisation of education.

131
Encouraging internationalisation of education Government policies
574 The main government policies covering internationalisation of tertiary education from 2001 to early 2004 were:
A strategic framework for the commercial aspects of international education (Ministry of Education, 2001) that examined the challenges facing export education and identified strategic initiatives for sustainable development. Although focussed on export education, it signalled an interrelationship between broader issues in international relations and international education and suggested they needed to be approached as a totality.
The establishment of an international education cluster group, comprising relevant public sector chief executives, to respond to the need for a more strategic and co-ordinated approach to international education by government agencies.
A Code of Practice for the Pastoral Care of International Students. All New Zealand TEOs that enrol international students in New Zealand are required, under the Education Act 1989, to be signatory to the Code which provides mandatory standards for the pastoral care of international students.
The introduction of a compulsory levy for TEOs that enrol full-fee paying international students to fund export education industry development, promotion, quality assurance and research, including the administration of the Code of Practice.
The Tertiary Education Strategy’s (TES) international education goals and their reflection in TEOs’ charters and profiles.
575 To strengthen and supplement these policies, the government approved an International Education Framework in 2004. This framework sets out a strategic approach to international education, which helps prioritise government work in international education and guide agencies across government in international education activity. The three broad goals of the Framework are to:
strengthen New Zealand education; produce sustainable and increasing economic benefit to New Zealand; and maximise the contribution to broader social and economic strategies.
576 The strategic approach of the International Education Framework focuses on:
enhancing quality to strengthen New Zealand’s reputation as a high quality provider of education services;
increasing the diversity of international education activities, and the range of countries of origin for onshore and offshore students;
increasing the skill component of international education to increase the contribution to overall education, social and economic development;
developing international education partnerships to sustain long-term relationships with key countries, regions and international organisations, and
strengthening public support in New Zealand to ensure the social, cultural and economic benefits of international education are fully realised.
577 Four principles underpin this strategic approach:
international education should serve the learner not use the student: TEOs’ focus should be on achieving good education outcomes for students, with effective transitions, consistent with student objectives, to further education or employment, and enhance New Zealand's reputation as a provider of first class education;
the presence of international students should enhance the education of domestic students - the desired internationalisation of the New Zealand education sector must be underpinned by improving the quality of the education experience and outcomes for all students;
132
the sector should be increasingly self-managing over time, as far as is possible, consistent with government regulatory responsibilities, and its ownership interests in schools and public tertiary education institutions; and
TEOs should have sound business practices, with respect to their international activities, at all times.
578 The International Education Framework is supported by a substantial package of funding from government, supporting:
TEO development of good practice models of education provision in international education, and broader internationalisation strategies, and to communicate these across the sector;
Education diplomacy via: the establishment of up to seven off-shore New Zealand education counsellors to strengthen long-term education partnerships with key regions, more education missions to and from New Zealand, and related work with multilateral agencies and international bodies such as the European Union;
Building quality via: strengthening New Zealand’s international education quality through identifying and sharing best practice, provision of scholarships for top international students to study and carry out research in New Zealand, and providing domestic student status for international PhD students;
Developing and maintaining worldwide study links via increasing the opportunities for talented New Zealand students, teachers and researchers to undertake study abroad placements, supporting alumni networks with international student graduates of New Zealand education;
Innovation in international education provision via: the development of new delivery options for offshore education, and to also support the sector to research risk factors of progressing the industry and hence build further capability;
Strategic promotion and marketing via: investigating, developing and diversifying the range of markets for New Zealand’s educational exports, and strengthening the national brand for New Zealand’s international education services;
579 These programmes complement policies and initiatives in areas such as pastoral care and sector development already described above in paragraph 574. Education sector initiatives 580 The education sector itself also has a range of policies and mechanisms to support engagement in the international exchange of students and the international marketing of educational services. 581 Many individual TEOs have taken responsibility for incorporating a culture of internationalisation into their own missions and plans. One university’s internationalisation management plan (University of Otago, 2003) states its purpose as being “to set out policies and implementation strategies for the enhancement and support of international activities in a manner consistent with the University’s Strategic Plan. In addition it: outlines the external context and general challenges confronting the University in its internationalisation efforts; details the administrative and funding infrastructures designed to support and encourage internationalisation; provides detailed direction, policy and support for the planning and development of international activities.” 582 Almost all tertiary institutions undertake their own individual international marketing and recruitment. Some institutions develop and maintain international links through consortia such as Universitas 21, the Association of Commonwealth Universities and the Association of Pacific Rim Universities.
133
583 A survey of all universities and a sample of polytechnics in 2004 revealed that a target or quota of international students was in place at all but two of the 16 TEIs surveyed (Smith and Rae, 2004). This target or quota ranged from 12% to 20%, with one institution not concerned if the figure reached 50% of total student numbers. The objectives in managing student numbers included: diversification and risk management; resource management; the impact on the domestic and international student experience; and issues of educational quality. Mechanisms used included quotas, fees policies, more stringent entry qualifications, English language requirements, selective marketing, and limits on the number of places in specific programmes. In most cases these strategies and tools have been implemented recently so their relative effectiveness and impact on international student numbers is still to be determined. 584 The Ministry of education has commissioned a repeat and update of a study of the internationalisation of the tertiary education sector undertaken in 1998134. Results from this study will present a more detailed picture of TEOs’ policies on internationalisation. 585 Education New Zealand is the industry body which covers public and private TEOs. Education New Zealand undertakes activity in a number of areas including:
advocacy on behalf of New Zealand’s education export industry; assisting the New Zealand government and its agencies with policy development in
relation to the education export industry; advice to foreign governments; generic and collective promotion of New Zealand as a study destination; promotion of the “Educated in New Zealand” brand; and some market research and scoping of new opportunities for New Zealand TEOs.
586 Education New Zealand, in consultation with the industry, is responsible for the management of the work programme associated with the Export Education Industry Development Fund (funded through the Export Education Levy). The reference groups which make up this programme oversee research, development of resources, provision of workshops etc to support the international education industry.
587 Education New Zealand has a range of relationships with key agencies including the Ministry of Education, New Zealand Trade and Enterprise, the Ministry of Foreign Affairs and Trade, Tourism New Zealand, the Department of Labour (the New Zealand Immigration Service) and the Asia New Zealand Foundation. 588 In 2003/2004, a reference group formed by Education New Zealand launched the Industry-Wide Strategy on International Education for New Zealand which outlines a set of goals, objectives and actions for the export education industry. Policy issues resulting from the impact of globalisation and internationalisation 589 Key challenges for New Zealand going forward in internationalisation of the education system include:
Strengthening New Zealand education
Ensuring quality outcomes for New Zealand students: New Zealand students should benefit from increased international exposure through learning with their international peers, through increased study abroad opportunities, and through an expanded international focus in the curriculum.
Improving the integration of international students into both classrooms and extra-curricular activities within TEOs and, more broadly, into New Zealand society. This
134 Ministry of Education (1998), Internationalisation and Tertiary Education Institutions in New Zealand.

134
will increase the benefits that New Zealand students can gain from learning with the international student peers, and the wider cultural benefits which can accrue.
Maintaining and building the academic and research capability and international reputation of the New Zealand tertiary sector. There is increasing competition for top quality research and academic staff world-wide. In theory, the New Zealand system should benefit from increased academic and research linkages with top overseas TEOs, both through the attraction of people and research funding to this country, and from increased New Zealand uptake of overseas funding and participation in research projects with links back to this country. However, it is clear that there will be winners and losers in this “brain chain”. New Zealand needs to maintain its reputation as a good place to work for academics and researchers to remain on the positive end of this chain.
Producing sustainable economic benefit
Ensuring diversity: to reduce over-reliance on a limited range of countries for international students, limited fields of study and limited modes of education.
Improving government/sector liaison to ensure a steady and diversified growth in international student enrolments consistent with both the government framework and the industry strategy.
Sustainable economic benefit requires maintenance of high quality systems, and good education outcomes for international students studying with New Zealand TEOs. Ensuring quality education outcomes for international students will involve research, monitoring and evaluation of existing programmes, and ongoing professional development work in the sector that links closely with quality development work with the sector domestically.
Further strengthening of quality assurance frameworks will be required. Clarification of jurisdictional responsibilities is becoming increasingly challenging for quality assurance agencies faced with cross border programmes, off-shore delivery and joint venture arrangements.
The international reputation and marketability of New Zealand qualifications is becoming increasingly important. There is a need for work on qualification recognition across borders as student and other academic mobility increases.
Effective sector responsibility for quality assurance. Contributing to government social and economic objectives
The roll out of the education counsellor network will be a significant addition to bilateral relationships with key countries and regions. It will need close coordination with other government agencies such as the Ministry of Foreign Affairs, New Zealand Trade and Enterprise, the Ministry of Research, Science and Technology and the Department of Labour (the New Zealand Immigration Service) to ensure that the work programmes accurately reflect the whole-of-government objectives for New Zealand’s relations with those countries or regions.
Managing potential conflicts between NZAID (New Zealand’s International Aid and Development Agency) education objectives and international education objectives – particularly in the Pacific. NZAID education policy is aimed at assisting developing countries up-skill their own populations, while international education policy can serve to attract highly educated students from developing countries to New Zealand for later temporary or permanent settlement.
A primary focus of Ministry of Education activity over the next two years will be monitoring and evaluation of new and existing international education programmes and policies to ensure government and industry short term and longer terms aims and objectives are being met, and to assist planning for the longer term.

135
CHAPTER 11: CONCLUSION Introduction 590 The New Zealand tertiary education sector operates in an environment characterised by complex demographic, technological, commercial and social forces. This means that the sector must have the capacity and capability to respond quickly to change, both at tertiary education organisation (TEO) level and across the system. For example the strength of the labour market and employment rates affect both the demand for tertiary education and the type of tertiary education required. 591 The system has always delivered benefits to both New Zealand’s economy and society, through its teaching, research and scholarship. From the middle of the 1990s, a consensus began to emerge that the tertiary education system was becoming increasingly important for New Zealand’s economic and social development and hence, that its focus should be more closely aligned to national goals. But before 2002, the system lacked a clear strategic direction. Towards the end of the 1990s, thinking began on what was to become the Tertiary Education Strategy 2002/07. 592 Since then, New Zealand’s tertiary education policy settings have shifted significantly. The current tertiary reforms are intended to shift the tertiary education system towards better alignment with national goals and achieving value for money. The new paradigm is more ambitious and more complex. The government’s role in the reforms is to provide a framework that will encourage the sector to take the lead in shifting towards a more outwardly focused and responsive tertiary education system. 593 The scale of the change is huge and there is still a way to go before the new approach is fully embedded. The changes encompass every dimension of tertiary policy and provision. They have links to moves in other policy areas, to other sectors of the economy and to other parts of the education system. The magnitude of the change adds to the capability and change-management challenges of the reforms. 594 In general, there has been widespread acceptance of the reforms being the right way forward for the system and there has been significant progress in the implementation of the reforms. But there have also been tensions during the initial phases of implementation particularly when changes to policy were undertaken in a short period of time. The current state of the New Zealand tertiary system 595 While it is not possible to measure accurately at this stage how far the tertiary system has shifted towards the changes sought in the current reforms, there are indications of some significant advances towards the goals and the key changes set out in the Tertiary Education Strategy (TES). 596 The strengths and weaknesses of the current system must be seen in the context of the general trends affecting the system (such as the demand in the labour market for skills) and the state of implementation of the current reforms. It is important to note that, given the early stage of the current reforms, some significant features of the current system (such as its high participation) may result as much from previous policy settings as from the reforms. 597 Major strengths of the New Zealand tertiary education system include:
Access to tertiary education: Overall, participation in tertiary education is the highest it has ever been. There is increased participation by traditionally under-represented groups such as Māori, Pasifika, people with disabilities, adults with low
136
or no qualifications. The diversity of provision and the open access to student support make tertiary education accessible to most New Zealanders.
Strategic alignment: Early monitoring shows the sector is engaging with the TES as
a driving influence (Ministry of Education, 2005h). There are definite shifts by the sector and government towards provision that is underpinned by the principles of excellence, relevance and quality.135 For example:
development of the National Centre for Tertiary Teaching Excellence (excellence)
increasing engagement of TEOs with industry (relevance), and prioritising improved learning outcomes in quality assurance systems (quality).
Strengthening system capability: Increased collaboration has helped lift capability
For example: The Partnerships for Excellence initiative (collaboration between the sector
and business and other private organisations) The development of the Centres of Research Excellence (collaboration
between universities) There are indications of some improvements in the management of TEOs.
598 Major challenges facing the New Zealand tertiary education system include:
There is a need to re-focus the funding system so that funding reinforces the goals of the reforms. The funding system needs a greater focus on quality and value for money. The predictability of funding needs to be improved.
There is a need for further work on the balance between the light-handed steering of
the sector sought by the TES and the autonomy needed by an innovative sector.
Providing quality, relevant tertiary education necessary for a knowledge society in an environment of limited resources and ensuring sustainable, predictable and value for money expenditure.
Managing shifting demands for education in TEO-based, work-based and community
settings. Increasing productivity of those already in employment will be the single most important factor in easing labour market pressures and lifting New Zealand’s economic growth rate. For tertiary education this means that there is likely to be greater demand for on-job training and less for low-level, pre-employment training.
Changes in the demographic profile of the New Zealand labour market are expected
to be rapid. In 20 years time, Pasifika and Maori together will comprise about 30 per cent of the new entrants into the labour force alone (Statistics New Zealand, 1999). Given the disparity with New Zealand Europeans, it is important that the increased Maori and Pasifika peoples’ increasing participation in tertiary education transpires into greater levels of achievement, particularly at higher levels of tertiary education.
There is a need to continually improve the capability of the sector and agencies to
manage the complexities of relationships required by the new paradigm. 135 These principles, along with access and capability, form the key criteria for decision making by the sector and government, e.g. profile negotiations. Each principle is also an aspect of the others.

137
Priorities ahead 599 Achieving the goals of the TES is the tertiary sector’s overarching priority and policy levers will continue to be refined to facilitate the changes required. 600 Government needs to be assured that its investment in tertiary education gives value for money. This means that education and research must be of good quality and meet the needs of the end-users. There is also a need to achieve an equitable balance of contributions from all parties. Current work is focusing on lifting the effectiveness of some areas of tertiary education to achieve higher quality, more relevant outcomes and continuous improvement. 601 Key priorities for the medium term ahead include (all not mutually exclusive):
Ensuring that there is a coherent network of provision of tertiary education in New Zealand, reflecting the size and geography of New Zealand, national and regional economic needs, the strengths of the current system, available funding and the cost of change. This includes developing policies that recognise the differentiation of the roles and functions of TEOs to promote greater specialisation, critical mass and reduce unnecessary duplication
Continuing to improve the quality of provision and the success of students. TEOs
and government agencies are being required to sharpen the focus of their quality assurance arrangements on evidence of effective teaching and learning.
Continuing to focus on the funding system’s ability to help steer the system. A ‘one
size fits all’ approach to funding and regulation may not always be the best model for achieving value for money. In supporting an effective and sustainable network for tertiary education, government may want to consider developing a more tailored or customised approach to different areas of provision, learner groups and different sectors to ensure that there is a sustainable system that achieves consistently good quality outcomes and meets both the national interest and regional needs.
Gaining clarity about the role of kaupapa Māori (Māori focussed tertiary education and in particular, the role of wānanga in the wider tertiary system.
Understanding better the reasons behind the current levels of progression of learners
from lower level to higher level qualifications. With the current structural pathways enabling effective progression between types and levels of learning, there is a need to better understand the incentives and other motivating factors that may be limiting progression.
Continuing to broaden the focus of international education to include stronger
educational exchange, teaching and research. Government’s engagement with strategic international partners is changing the way in which the tertiary sector operates in the international environment.
There is a need to work on the capability of the government agencies in tertiary
education to ensure they have the capability to manage the system in an effective and efficient manner.
138
References Asia 2000 Foundation of New Zealand (2003), The Export Education Industry: Challenges
for New Zealand - An Asia 2000 Occasional Paper, Asia 2000 Foundation of New Zealand, New Zealand.
Auckland UniServices Ltd (2005), Performance Review 2004, Auckland UniServices Ltd,
New Zealand. Boston, J. (1999), The Funding of Research in the Tertiary Sector, Access: Critical
Perspectives on Cultural and Policy Studies in New Zealand, 18(2) 103-119, New Zealand.
Boston, J. (2002), Designing a Performance-Based Research Fund for New Zealand, Report
for the Transition Tertiary Education Commission, New Zealand. Boston, J., B. Mischewski and R. Smyth (2005), Performance-Based Research Fund -
Implications for Research in the Social Sciences and Social Policy, New Zealand Journal of Social Policy, 24, New Zealand.
Committee on University Academic Programmes (2005), Functions and Procedures 2005-
2006, New Zealand Vice-Chancellors’ Committee, New Zealand. Department of Labour (2002), Globalisation of labour flows and its impacts on New Zealand,
Department of Labour, New Zealand. Department of Labour (2005), Overview from the Findings of Ten Professional Occupation
Skill Shortage Assessment Reports, Department of Labour, New Zealand. Department of Labour (2005a), 16 Trade Occupation Shortage Assessment Reports - An
Overview, Department of Labour, New Zealand. Dillingham, W. (2002), New Zealand’s Workforce: Qualifications and Evidence of
Upskilling, Department of Labour, New Zealand. Education and Science Select Committee (2004), Financial Review Enquiry into Northland
Polytechnic, Education and Science Committee of the House of Representatives, New Zealand.
Garlick, S. and G. Pryor (2002), Universities and their communities: creative regional
development through knowledge-based engagement, Report prepared for the Department of Transport and Regional Services, Australia.
Gezentsvey (2003), Attitudes toward International Students and International Education: A
test of the Instrumental Model of Group Conflict, Victoria University of Wellington, New Zealand.
Glass, H. and W. Choy (2001), Brain Drain or Brain Exchange? Treasury Working Paper
01/22, The Treasury, New Zealand. Green, N (2005), To Market and Back: An evaluation of the Universal Tertiary Tuition
Allowance policy of funding tertiary education in New Zealand, unpublished Masters thesis, Victoria University of Wellington, New Zealand.
139
Infometrics Consulting (2000), Economic Impact on Invercargill of SIT’s Proposed Zero Fees Policy, Infometrics Ltd, New Zealand.
Infometrics Consulting (2002), Economic Impact on Invercargill of SIT’s Zero Fees Policy,
Infometrics Ltd, New Zealand. Killerby, P., R. Macpherson and J. Smith (2004), Regional Partnerships and Jumbled
Jurisdictions: The Changing Face of Regional Economic Development in New Zealand, Sustaining Regions 4,1, Spring, 4-15, Australia.
Lincoln University (2002), Beyond New Zealand: Experiences, Developments and
Challenges, Lincoln University, New Zealand. Lincoln University (2003), Regional Economic Development Planning: A Study of its benefits
and best practice, Lincoln University, New Zealand. Maani, S. (1999), Private and Public Returns to Investments to Secondary and Higher
Education in New Zealand Over Time: 1981 - 1996, Report to The Treasury, New Zealand.
Maani, S. and T. Maloney (2004), Returns to post-school qualifications: New evidence based
on the HLFS Income Supplement (1997-2002). Report to the Department of Labour, New Zealand.
Martin, Yew May, Maureen Maclachlan, and Tom Karmel (1999), Postgraduate Completion
Rates, Occasional Paper Series, Higher Education Division, Department of Education, Training and Youth Affairs, Australia.
Ministry of Economic Development, Ministry of Social Development, Department of Labour
and Statistics New Zealand (2003), Population and Sustainable Development 2003, Ministry of Economic Development, Ministry of Social Development, Department of Labour, New Zealand.
Ministry of Education (1998), Internationalisation and Tertiary Education Institutions in New
Zealand, Ministry of Education, New Zealand. Ministry of Education (2001), Export Education in New Zealand: A Strategic Approach to
Developing the sector, Ministry of Education, New Zealand. Ministry of Education (2003), New Zealand’s Tertiary Education Sector: Profile and Trends
2002, Ministry of Education, New Zealand. Ministry of Education (2003a), Student Support in New Zealand: Discussion document,
Ministry of Education, New Zealand. Ministry of Education (2003b), Review of the Implementation and Effectiveness of Special
Supplementary Grants for Māori and Pasifika students at Tertiary Education Institutions from 2001-2002, Ministry of Education, New Zealand.
Ministry of Education (2004), New Zealand’s Tertiary Education Sector: Profile and Trends
2003, Ministry of Education, New Zealand. Ministry of Education (2004a), New Zealand’s Offshore Tertiary Education Programmes:
Stocktake for the 2003 Academic Year, Ministry of Education, New Zealand.

140
Ministry of Education (2004b), Pathways in Tertiary Education 1998-2002, Ministry of Education, New Zealand.
Ministry of Education (2004c), Statement of Tertiary Education Priorities 2005/07, Ministry
of Education, New Zealand. Ministry of Education (2004d), Retention, Completion and Progression in Tertiary
Education, 2003, Ministry of Education, New Zealand. Ministry of Education (2005), New Zealand’s Tertiary Education Sector: Profile and Trends
2004, Ministry of Education, New Zealand. Ministry of Education (2005a), Who doesn’t pay back? (An analysis of the Integrated Dataset
on Student Loan Scheme Borrowers), www.minedu.govt.nz/goto/tertiaryanalysis, Ministry of Education, New Zealand.
Ministry of Education (2005b), Paying off a student loan (An analysis of the Integrated
Dataset on Student Loan Scheme Borrowers), www.minedu.govt.nz/goto/tertiaryanalysis, Ministry of Education, New Zealand.
Ministry of Education (2005c), What factors make a difference to getting a degree in New
Zealand? Ministry of Education, New Zealand. Ministry of Education (2005d), Māori in Tertiary Education: A picture of the trends, Ministry
of Education, New Zealand. Ministry of Education (2005e), Tertiary Education Strategy 2002 -07 Monitoring Report
2004, Ministry of Education, New Zealand. Ministry of Education (2005f), Research measures: comparing seven new measures of
research performance in tertiary education, Ministry of Education, New Zealand. Ministry of Education (2005g), Research measures: comparing the new with the old, Ministry
of Education, New Zealand. Ministry of Education (2005h), Tertiary Education Strategy 2002/07 - Monitoring Report,
Ministry of Education, New Zealand. Ministry of Education (2005i), Income of Student Loan Scheme Borrowers, Ministry of
Education, New Zealand. Ministry of Education (2005j), The New Zealand International Education Sector - Trends
from 1999 to 2004, Ministry of Education, New Zealand. Ministry of Education and Transition Tertiary Education Commission (2002), Investing in
excellence: the report of the Performance-Based Research Fund working group, Ministry of Education, New Zealand.
Ministry of Education, Ministry of Social Development and Inland Revenue (2004), Student
Loan Scheme Annual Report to 30 June 2004, Ministry of Education, Ministry of Social Development and Inland Revenue, New Zealand.
Ministry of Education, Ministry of Social Development and Inland Revenue (2005), Annual
Report Student Loan Scheme to 30 June 2005, Ministry of Education, Inland Revenue, Ministry of Social Development, New Zealand.
141
Ministry of Research, Science and Technology, the Foundation for Research, Science and
Technology, the Health Research Council and the Royal Society of New Zealand, (2003), The National Bibliometric Report 1997 – 2001: International benchmarking of New Zealand research, Ministry of Research, Science and Technology, New Zealand.
Ministry of Social Development (2002), New Zealand Living Standards 2000, Ministry of
Social Development, New Zealand. Ministry of Social Development (2004), Pre-Budget Announcement: Training Incentive
Allowance Pilot for Teenage Parents, Ministry of Social Development, New Zealand. New Zealand Qualifications Authority (2002), Supporting Learning Pathways, New Zealand
Qualifications Authority, New Zealand. New Zealand Qualifications Authority (2003), The New Zealand Register of Quality Assured
Qualifications, New Zealand Qualifications Authority, New Zealand. New Zealand Qualifications Authority (2003a), The Approval and Accreditation of Courses
Leading to Degrees and Related Qualifications, New Zealand Qualifications Authority, New Zealand.
New Zealand Qualifications Authority (2005), Criteria, Requirements and Guidelines for
Course Approvals and Accreditation, New Zealand Qualifications Authority, New Zealand.
New Zealand Universities Academic Audit Unit (2000), Academic Audit Unit Report –
Lincoln University, The New Zealand Universities Academic Audit Unit, New Zealand. New Zealand Universities Academic Audit Unit (2000a), Academic Audit Unit Report –
University of Auckland, The New Zealand Universities Academic Audit Unit, New Zealand.
New Zealand Universities Academic Audit Unit (2003), Academic Audit Unit Report -
Massey University, The New Zealand Universities Academic Audit Unit, New Zealand. New Zealand Universities Academic Audit Unit (2005), Unit History – A Brief Overview,
New Zealand Universities Academic Audit Unit, New Zealand. New Zealand Universities Academic Audit Unit (2005a), University of Canterbury: Academic
Audit Report Cycle 3, New Zealand Universities Academic Audit Unit, New Zealand. OECD (2004), Education at a Glance, OECD Indicators 2004, Organisation for Economic
Cooperation and Development, France. Penny, N. (2005), The Approach to Measuring the Returns to Secondary and Tertiary
Qualifications in New Zealand: An Investigation and Update Using Data from the Census - unpublished thesis, Massey University, New Zealand.
Scott, W. G. and H. M. Scott (2004), University Income and Student Numbers Between 1980
and 2002, Massey University and Scott Economics Ltd, New Zealand. Smith, L. and A. Rae (2004), Managing International Student Numbers at New Zealand
Public Universities and Polytechnics, Report to the Ministry of Education, New Zealand.
142
Statistics New Zealand (1999), Demographic Trends 1999, Statistics New Zealand, New Zealand.
Statistics New Zealand (2003), Innovation in New Zealand, www.stats.govt.nz, Statistics New
Zealand, New Zealand. Statistics New Zealand (2005), New Zealand in the OECD, Statistics New Zealand, New
Zealand. Statistics New Zealand (2005a), Projections Overview, Statistics New Zealand, New Zealand. Statistics New Zealand and Ministry of Research, Science and Technology (1997), Research
and Development in New Zealand 1996, www.stats.govt.nz, New Zealand. Statistics New Zealand and Ministry of Research, Science and Technology (2005), Research
and Development in New Zealand 2004, www.stats.govt.nz, New Zealand. Tertiary Education Advisory Commission (2001), Shaping the Funding Framework, Fourth
Report of the Tertiary Education Advisory Commission, Ministry of Education, New Zealand.
Tertiary Education Commission (2003), Collaborating for Efficiency: Report of the
Entrepreneurial Subgroup, Tertiary Education Commission, New Zealand. Tertiary Education Commission (2003a), Collaborating for Efficiency: Report of the Steering
Group, Tertiary Education Commission, New Zealand. Tertiary Education Commission (2003b), Collaborating for Efficiency – Report of the Staffing
Subgroup, Tertiary Education Commission, New Zealand. Tertiary Education Commission (2004), Performance-Based Research Fund: Evaluating
Research Excellence – the 2003 Assessment, Tertiary Education Commission, New Zealand.
Tertiary Education Commission (2004a), The Distinctive Contributions of Tertiary Education
Organisations, Tertiary Education Commission, New Zealand. Tertiary Education Commission (2005) Performance-Based Research Fund: Annual Report
2004, Tertiary Education Commission, New Zealand. Tertiary Education Commission (2005a), Portrait of Tertiary Education in New Zealand 2005
Draft 3.3, Tertiary Education Commission, New Zealand. Tertiary Education Commission (2005b), Report on the Scope and the Methodology for the
Strategic Review of the Tertiary Education Workforce, www.tec.govt.nz Tertiary Education Commission, New Zealand.
Tertiary Education Commission (2005c), Summary of 2005 Funded Projects: The Institutes of
Technology and Polytechnics (ITP) Business Links Fund, Tertiary Education Commission, New Zealand.
Tertiary Education Commission (2005d), Tertiary Funding Guide, Tertiary Education
Commission, New Zealand.
143
The Times Higher Education Supplement (2003), The Times Higher Education Supplement No. 1,619, The Times Higher Education Supplement, United Kingdom.
TNS (2004), 2004 Income and Expenditure Survey: Report of findings prepared for NZUSA,
New Zealand University Students’ Association, New Zealand. University of Otago (2003), Internationalisation Management Plan 2003 – 2006, University
of Otago, New Zealand. University of Otago Planning Support and Funding Office (2005), Economic Impact Report
2004, University of Otago, New Zealand. Vaughan K and Kenneally N (2003), A Constellation of Prospects: A review of STAR, Report
to the Ministry of Education, Ministry of Education, New Zealand. Wilson, T. (2002), Working offshore - Rewards and Challenges, Manukau Institute of
Technology, New Zealand. Yorke and Langdon (2004), Retention and Student Success in Higher Education, Open
University Press, United Kingdom.