OECD Observer No 292 Q3 2012
44
No 292 Q3 2012 www.oecdobserver.org Business angels An OECD strategy on development Youth skills in Africa Inequality and growth Compact cities Health spending on the decline
-
Upload
loic-verdier -
Category
Documents
-
view
219 -
download
3
description
OECD Observer No 292 Q3 2012
Transcript of OECD Observer No 292 Q3 2012

OECD Observer No 292 Q3 2012 1
No 292 Q3 2012 www.oecdobserver.org
Business angels
An OECD strategy on development
Youth skills in Africa
Inequality and growth
Compact cities
Health spending on the decline

To succeed in today’s complex world,
you need a broader understanding of
global events and what they mean.
That’s why the International Herald
Tribune gives you perceptive coverage
of global geopolitics, security, culture
and society, plus Business with
Reuters, a superb report on fi nance,
economics and markets – all in one
concise, daily newspaper.
For business thinking that
stands out from the crowd.
Order a 6-month subscription
to the IHT and get 8 weeks of
bonus copies, plus free IHT All
Digital Access*.
visit
subs.iht.com/OECD
*Includes full access to the IHT apps for iPhone, Android-
powered smartphones and iPad, plus NYTimes.com.
Offer valid for new subscribers in Europe only and expires
December 31, 2012.
S
u
b
s
c
r
i
p
t
i
o
n
i
n
c
l
u
d
e
s
f
r
e
e
I
H
T
A
l
l
D
i
g
i
t
a
l
A
c
c
e
s
s
IHT2054_Biz ad_OECD_270x200.indd 1 04/05/2012 15:50

READERS’ VIEWS2 Skills for youth; Go with the flow; Turkish
example; First things first; Twitterings
EDITORIAL3 Towards a new departure Angel Gurría
NEWS BRIEF4 Stop tax evasion; Greener tourism;
Soundbites; Economy; Country roundup; Outlook still fragile; Learning inequality; Plus ça change…
INDUSTRY6 How manufacturing can create value
and jobs9 Resurrecting industrial policy10 Believing in angels Karen Wilson11 Made in USA, again?
DEVELOPMENT14 The OECD Strategy on Development: Giving fresh impetus to a core mission16 Minerals not to die for Nicholas Bray19 Africa’s young future
OECD INSIGHTS21 The arithmetick of green growth22 Inequality, the crash and the crisis Stewart Lansley, visiting fellow, Townsend
Centre for International Poverty Research, Bristol University
OECD.ORG24 All on board: Policies for inclusive
growth and jobs26 OECD Forum 2012: From Indignation and
Inequality to Inclusion and Integrity27 Recent speeches by Angel Gurría;
OECD Alumni launched28 Calendar; Frankie.org
BOOKS30 Saving retirement; Compact cities31 New publications on OECD iLibrary35 Teaching the teachers ORDER FORM…ORDER FORM
DATABANK37 Fresh water concerns; Productive hours38 Main economic indicators40 Health spending slows; Restart-up?
Published in English and French by the OECD EDITOR-IN-CHIEF: Rory J. ClarkeSENIOR EDITOR: Ricardo TejadaINSIGHTS EDITORS: Patrick Love, Anne-Lise PrigentEDITOR/WEB: Loïc VerdierWRITER: Marilyn AchironEDITORIAL ASSISTANT: Marie Francolin
LAYOUT: Design Factory, IrelandILLUSTRATIONS: André Faber, David Rooney, StikPHOTO RESEARCH: Rory ClarkeLOGISTICS: Jochen PichtADVERTISING MANAGER: François Barnaud
Applications for permission to reproduce or translate all or parts of articles from the OECD Observer, should be addressed to: The Editor, OECD Observer, 2 rue André Pascal, 75775 Paris, cedex 16, France.
All signed articles and letters express the opinions of the au-thors and do not necessarily represent the opinion of the OECD.
Reprinted and translated articles should carry the credit line “Reprinted from the OECD Observer”, plus date of issue. Signed articles reprinted must bear the author’s name. Two voucher copies should be sent to the Editor. All correspondence should be addressed to the Editor. The Organisation cannot be respon-sible for returning unsolicited manuscripts.
The statistical data for Israel are supplied by and under the responsibility of the relevant Israeli authorities. The use of such data by the OECD is without prejudice to the status of the Golan Heights, East Jerusalem and Israeli settlements in the West Bank under the
terms of international law.
www.oecdobserver.org© OECD July 2012
ISSN 0029-7054Tel.: +33 (0) 1 45 24 80 66Fax: +33 (0) 1 45 24 82 [email protected]
Founded in 1962 The magazine of the Organisation for Economic Co-operation and Development
OECD Publications 2 rue André Pascal 75775 Paris cedex 16, France [email protected]
No 292 Q3 2012
CONTENTS
Money from angels, page 10
A fresh impetus for development, page 14
Combating conflict minerals, page 16
On the cover ©ShutterstockAdapted for the OECD Observer by Design Factory

2
Readers’ views
We welcome your feedback.
Send your letters to [email protected] or post your comments at www.oecdobserver.org or www.oecdinsights.org
Skills for youthWhile the need to ensure that youths are provided with high-end skills may be true for developed economies, this argument does not hold for all countries. I recently visited Libya, where a large number of younger people hold degree level qualifications. Despite this, over 30% of the workforce under 30 is unemployed.
The focus there is now on providing second tier training and education. This will require developing national standards similar to those that the UK set up, and will be a priority after the upcoming elections, irrespective of who is elected. (Posted on: “Getting ahead of the curve: Skills policy in a changing global economy”)
Philip Hodkinson
Go with the flowInterestingly, it is possible to model the impact of inequality by using an analogue model from physics and the more specifically, fluid dynamics. The initial work, done in conjunction with Dominican University in California, was inspired by Phillip’s work in the 50’s, where he modelled complex non-linear relationships of stocks and flows with an amazingly ingenious hydro-mechanical analogue simulator.
Such a model shows that for a given structure, wealth distribution has a
major impact on economic performance. Essentially, the model looks at the momentum in flow over a surface to determine growth potential.
It finds that if those at the leading edge of the economy extract too much momentum from the flow, those downstream will have reduced spending power and economic efficiency will suffer. However, there is an optimum point which is not perfectly equal, where no flow would equal no growth. (Posted on: “Inequality, the crash and the crisis”, see page 22)
John Hulls
Turkish exampleAdvanced economies should know and accept their responsibilities, especially since developing nations make up a large and growing part of their markets. Your article “How Turkey was able to differentiate itself” demonstrates how developed economies can play a central role in boosting growth and decreasing inequality in emerging and developing countries.
Naeem ul Fateh
First things firstIt is great to see such a realistic article from a former official of the World Bank. Developing countries should keep food and major infrastructure as their main priorities. This is especially true regarding
the untapped water resources of Sub-Saharan Africa.
Only once these priorities are addressed can green development take hold. But this strategy differs from the “post wealth” approach pushed on developing countries by the developed world. Even green economic development in India and other Asian countries won’t happen without first addressing food and infrastructure needs. (Posted on “Lies and dam facts”)
Gettdebalkie
Twitterings
Tom Jagger: Prosperity without growth! The goal in a sustainable world should be to develop the quality of human life, not just only income per capita. I’m so excited about Rio+20!
Yusuf Yüksel: Retirement age should be compared with life expectancy at the age 60 not life expectancy at birth to see the years to be lived after retirement. It is a very common and simple mistake that The Economist also did.
Peter Christo: Wages are paid from profits. And profits are the results, in part, of low costs–including wages. So per definition there needs to be a disparity between profits and wages. Best let the market regulate this disparity. Government intervention, though well meant, will invariably affect competitiveness, and by extension demand, in a negative way.
MrWood_com_au: Promote entrepreneurship to exit the crisis, OECD says. Now THIS is an idea I can get behind!!
Comments and letters may be edited for publishing. See full comment at the respective websites, where replies can be made, or on Twitter @OECDObserver

OECD Observer No 292 Q3 2012 3
EDITORIAL
Towards a new departure
Two decades ago, when the first Rio Earth Summit took place in 1992, the most advanced economies were in an economic downturn. It was not as severe as the crisis many countries have endured since 2008, but asset bubbles had burst, unemployment had risen and recovery seemed a remote prospect.
Then, within two years a corner was turned, and 15 years of nearly uninterrupted expansion followed, driven by structural reforms, the spread of markets, booming global trade and investment, information technology and confidence. World GDP rose by 75%, and a billion people were lifted out of poverty. That period of growth ended abruptly for many countries in 2008 with a financial crisis that turned into an economic and employment crisis, causing suffering for millions of citizens.
Today policymakers are still wrestling with the pressing problems of reducing debt, restoring growth and boosting jobs and skills. At the same time they must confront the sustainability challenges, which have intensified since the first Rio summit. How can policymakers square the circle?
The economic situation is hardly favourable. The OECD Economic Outlook issued in May suggests modest growth in the US and Japan, but sees risks coming from the ongoing euro crisis and a slowdown in China. Uncertainty prevails and the world economy is not yet in the clear. That means unemployment, with dire prospects and poverty for millions of people.
A new departure is needed. This summed up the public mood at the G20 Leaders Summit in Los Cabos, Mexico and also at the OECD Ministerial Council Meeting (MCM) and Forum in Paris in May.
Political summits are not just about major breakthroughs, and steady progress was made at the G20 in consolidating joint efforts towards a lasting recovery. In Los Cabos, leaders strengthened their policy commitments and actions with a new accountability framework, the Los Cabos Growth and Jobs Action Plan. The summit was also a further positive step for the G20 as a forum where key global economic issues like the euro crisis can be discussed in an open and constructive manner. The OECD will continue to play its part by contributing to the Los Cabos Growth and Jobs Action Plan, and to
ongoing work on trade, governance, tax and development, as well as on financial education and incorporating green growth into reform agendas.
While decisive action to overcome the crisis is on the top of the policy agenda in many countries, we are still on a collision course with nature. At the Rio+20 Summit, some agreements were struck between business and civil society groups, reflecting a shared conviction of the need for greener growth, though this time there were no major political steps on climate change or biodiversity. This may in part reflect uncertainty about reforms and how they might affect growth and well-being. We need to overcome this deadlock.
In this context, the recently launched OECD initiative on New Approaches to Economic, Social and Environmental Challenges (NAEC) aims at strengthening the synergies between the different policy objectives and looking at the trade-offs. At the OECD MCM in May, inspired by the theme of “All on Board: Policies for Inclusive Growth and Jobs”, ministers expressed strong support for this NAEC initiative, and encouraged us to continue analysing the causes of the crisis and adjust our analysis and practical recommendations. The goal is to enrich our analytical framework, while identifying pillars for a strategic OECD policy agenda for inclusive growth. This means examining issues such as under-pricing risk, trade-offs between growth and inequality, and pro-growth policies and the environment. Ministers also welcomed a report on knowledge-based capital as a source of growth, and committed to support OECD strategies on green growth, innovation, skills, gender and global development.
Small wonder then that the NAEC initiative resonates so loudly with the public. For the 1,300 people from government, business and civil society who came together for the OECD Forum on 22–23 May, there was a clear common message: improve governance and structures for better policies, tackle inequality within societies and between men and women, address the causes of indignation, invest in new sources of growth and new jobs and skills, promote integrity, unleash people’s creativity and put well-being first. Fittingly, the second edition of the OECD Better Life Index, which incorporates more environmental indicators and adds Brazil and Russia to the countries covered, was successfully launched at the event.
Today, as 20 years ago, good policymaking can be the ultimate game-changer for unblocking progress. And it is important to consider the long-term trends that will influence policy decisions and action. The OECD’s aim is to help countries move towards inclusive growth, and ensure that the next upturn can be sustained by reducing social, economic and environmental imbalances, and by improving governance and confidence. It is up to governments to get their policies right and the OECD stands ready to help. Change may not come overnight, but as Tolstoy wrote, “time and patience are the strongest warriors”.
Visit www.oecd.org/mcmwww.oecdobserver.org/angelgurriawww.oecd.org/secretarygeneral
Good policymaking can be the ultimate game-changer
Angel Gurría
Secretary-General of the OECD

4
Green innovation in tourism can drive sustainable development by reducing costs, boosting revenue, creating jobs and improving resource efficiency. This was a conclusion drawn by participants in a Rio+20 side event, “Green Innovation in Tourism” co-hosted by the OECD and tended by tourism experts from international organisations, United Nations agencies and the tourism public and private sector.
An increased focus on sustainability–in particular, green innovation–can lead to more jobs and reduce environmental impacts, cutting costs and increasing competitive advantages while enhancing the visitor experience.
But obstacles remain. Tourists are often unaware of green options or unwilling to pay more for a sustainable holiday experience. Also, businesses misperceptions about investment costs, a lack of funding for micro and medium sized firms, and poor policy coordination among sectors such as tourism, transport, energy and environment also halt progress.
Visit www.oecd.org/cfe/tourism
News brief
SoundbitesNew movement
“Immigrants are crucial to innovation, study says.”
Headline in The New York Times, 25 June 2012
Euro options
“The marriage may have been foolish. But a divorce would be terrifying.”
Martin Wolf, Financial Times, 19 June 2012
“Just like in good story books, the hero will win the day. The euro will survive, much to the displeasure of the Anglo-Saxon press which has been pronouncing the death of the single currency for over two years.”Alain Frachon, Le Monde, June 2012
Better life yardstick
“The OECD [Better Life Index] rankings offer encouragement to the idea that social well-being can be measured, and should be a legitimate goal of governm1ent.”
Editorial, The Boston Globe, 4 June 2012
©RE
UTER
S/Pi
lar O
livar
es
EconomyQuarterly GDP in the G20 area grew by 0.8% in the first quarter of 2012, up from 0.7% in the previous quarter, according to preliminary estimates. This small pick-up in aggregate G20 GDP growth still masks diverging patterns among the world’s largest economies. Growth accelerated in the first quarter of 2012 in Australia, Germany, Japan, Korea, and Mexico, while it slowed or remained stable in all other G20 economies. Growth in China decelerated by 1.8%, slowed in India, Indonesia and South Africa, and continued to contract in Italy and the UK.
Composite leading indicators from the OECD, which are designed to anticipate turning points in economic activity, continue to point to divergence between economies. The leading indicators for Japan, the US and Russia continue to signal improvements in economic activity, while they continue to point to sluggish economic activity in France and Italy.
Annual inflation in the OECD area slowed to 2.5% in the year to April 2012, compared with 2.7% in the year to March 2012. This slowdown in the annual rate of inflation mainly reflected developments in energy
prices. Excluding food and energy, the annual inflation rate was broadly stable at 2.0% in April.
The OECD area unemployment rate was unchanged at 7.9% in April 2012, around the same level recorded since January 2011. The rate for the Euro area was unchanged at 11.0% in April, while it grew by 0.1 percentage point in the US to 8.2%, interrupting the decline recorded since August 2011.
Unit labour costs in the OECD area rose by 0.3 % in the first quarter of 2012, the same
Stop tax evasionThe global clampdown on tax evasion, which was one of the silver linings to emerge from the dark cloud of the crisis, continues to make steady progress, according to reports presented to G20 leaders at their summit in Los Cabos, Mexico. A report by the Global Forum on Transparency and Exchange of Information for Tax Purposes says significant progress has been made since the last G20 Summit in Cannes in November 2011. The Global Forum has now launched a number of reviews to assess whether cross-border exchange of information is being implemented effectively.
A supplementary report by the OECD shows that exchange of tax information among countries has been improving. The OECD also announced a new initiative to tackle the misuse of corporate vehicles such as shell companies. The work will tackle the issue of tax base erosion and profit shifting by some multinational firms. A progress report on the initiative will be presented to the next G20 Summit.
The Global Forum reports that more than 800 cross-border exchange of information agreements have now been signed. And since the Cannes Summit, four more countries–Colombia, Costa Rica, Greece and India–have signed a multilateral Convention to counter tax evasion. The number of signatory countries now stands at 35.
Visit www.oecd.org/tax/eoi
Greener tourism

OECD Observer No 292 Q3 2012 5
Plus ça change...
“In spite of such unquestionable assets, the small industrial firm is perhaps in greater danger now than ever before. Some of the threatening forces at work are particularly striking because they are the result of current economic trends: the acceleration of technological change, for instance, and the advent of huge international markets.”
“Among the business giants, can small industries survive?” in issue No 1, November 1962
NEWS
Learning inequalityThe US should do more to foster innovation and provide more equitable access to high-quality education in order to maintain its status as the world’s most vibrant and productive economy, according to OECD’s latest Economic Survey of the United States. Data from the survey suggest the US is losing its cutting edge in innovation.
Visit www.oecd.org/us
Country roundupFrom 2001 to 2010, Canada doubled its aid. But from 2010 to 2011, aid fell by just over 5% and the recent federal budget cuts off another 7%, according to the OECD’s Review of the Development Co-operation Policies and Programmes of Canada. The review highlights the country’s strong stand on human rights and effective efforts in Afghanistan and Haiti, but recommends that Canada increase aid to meet the international target of 0.7% of gross national income.
Source: OECD
7.0
6.0
5.0
4.0
3.0
2.0
1.0
0.0
©O
ECD
/Ben
jam
in R
enou
t
The accession of the Russian Federation to the OECD Nuclear Energy Agency was formalised in May. Russia has the fourth largest civilian nuclear programme in the world after the US, France and Japan. Currently, around 18% of the country’s electricity is produced by 33 nuclear reactors. Russia will then become the 31st member country of the NEA. Visit www.oecd-nea.org
All itemsEnergy
FoodAll items, non-food, non-energy
Consumer prices rise % change, April, year on year
2.53.1
OECD total
2.0
4.8
Outlook still fragile The global economy is gradually gaining momentum, but the recovery is fragile, extremely uneven across different regions and could be derailed by the crisis in the euro area, according to the latest OECD Economic Outlook released in May. GDP growth across the OECD is projected to slow from an annual rate of 1.8% in 2011 to 1.6% in 2012, before recovering to 2.2% in 2013.
Activity remains strong in most emerging-market economies, but policy challenges vary, with inflation acting as a drag on real incomes in some, while it remains subdued in others.
In Europe, recovery in the healthier economies is not strong enough to offset flat or negative growth elsewhere on the continent. Here weak competitiveness must be addressed in those countries with large external deficits, while structural adjustment and higher wages in surplus countries would contribute to a growth-friendly rebalancing process.
Visit www.oecd.org/economy
rate as in the previous quarter, according to early estimates.
Merchandise trade grew moderately in most major economies in the first quarter of 2012. Total imports and exports of G7 and BRICS countries grew by 1.0% and 0.6% respectively. In contrast, trade slowed sharply in China, with exports contracting (by 4.2%) for the second consecutive quarter and imports contracting (by 3.8%) for the first time since the first quarter of 2009.
Visit www.oecd.org/statistics
Germany is successfully limiting the amount of carbon, energy and resources needed to grow its economy while stringent environmental requirements have helped to turn the country into a leader in the environmental goods and services sector. Yet challenges remain in areas like air and water
quality, the protection of biodiversity, and de-carbonising energy production, according to the OECD’s Environmental Performance Review of Germany.
More than 12 years after making foreign bribery a crime, Sweden needs to make much greater efforts to actively enforce its anti-bribery legislation, according to a new OECD report. Despite a number of allegations against Swedish companies, the country has prosecuted only one case in 2004 and has never proceeded against a company for foreign bribery. Meanwhile, a similar report finds that Greece has failed to promptly investigate a significant foreign bribery case and to provide timely information on its anti-bribery efforts.
Colombia and Mexico are a step closer to benefiting from cross-border tax co-operation and information sharing. Colombia has signed, and Mexico has deposited its instrument of ratification for the OECD and Council of Europe’s Multilateral Convention on Mutual Administrative Assistance in Tax Matters.
Slovenia’s rich and diverse environment is under pressure from the country’s expanding economy, according to OECD’s first Environmental Performance Review of Slovenia. Green tax reform, better use of public and private finance, and more vigorous promotion of eco-innovation, could help Slovenia green its growth as well as boost productivity and competitiveness and improve its fiscal position.
Visit www.oecd.org/newsroom

6
How manufacturing can create value and jobs
©Sh
utte
rsto
ck
Bring back manufacturing! This refrain has echoed about since the start of the crisis: is it a serious proposition to win back manufacturing activity after years of decline and if so, how?
From the US to France, politicians, economists and voters have stomped the boards lamenting the loss of manufacturing jobs. Some point to the shift in the economic centre of gravity
towards emerging markets and the need for firms to be where the demand is; others criticise outsourcing and relocation of firms from developed countries to developing countries to cut labour costs and increase margins; still others blame labour replacing technology.
In truth, manufacturing production is still a very important driver of OECD economies, which account for some 60% of global manufacturing
value-added in 2010. However, other countries, particularly in Asia, have been catching up. Manufacturing jobs have declined in most, but not all, OECD countries too. Even in Germany they fell by about 5% from 2000 to 2008, though this pales in comparison to drops of over 25% in the UK and 20% in the US.
Some employment losses may be due to job destruction and firm closure, others reflect relocation to reduce costs, albeit creating jobs elsewhere, including within the OECD area: Poland and Estonia saw increases in manufacturing jobs for instance, as did Luxembourg, New Zealand and (to a lesser extent) Austria and Italy. But most of the shift in jobs has been in response to shifts in demand, particularly towards China, where manufacturing employment jumped by over 30 million in the same period.
Why should policymakers lament this shift? One obvious reason is the sharp rise in unemployment in several countries since the start of the crisis. People point to Germany, where joblessness has generally remained low, thanks in part to a strong, export-driven, manufacturing sector.
Policy appealBringing manufacturing back is an appealing proposition to policymakers for several reasons. Manufacturing in OECD countries boasts faster productivity growth than services, for instance, and generates well-paid jobs in a range of skills and professions, and not just on the production side; in fact, many large manufacturing companies are also services companies, in sales, design and so on. Factories plug into local businesses and drive services too. Crucially for any leading economy, manufacturing also drives technological change. Also, manufactures are easier to trade than most services, and can bolster export revenues.
Manufacturing has changed in the OECD area, thanks in part to better technology and to outsourcing of the more laborious, low-skilled processes along the value chain.

OECD Observer No 292 Q3 2012 7
2%
3%6%
10%
11%
9%
18%
19%
22%
OECD EU ChinaUnited States Other Asia & OceaniaJapan Other OECDSouth & Central America Other EuropeAfrica
What factories do has changed: a good portion of the cost of building cars and trucks in OECD countries nowadays is in software development and component design, for instance, and this demands specific skills and planning. Many factories are cogs in worldwide operations, forming complex global value chains,
so their tasks and functions, as well as their location, depend on where they are on that value chain–with R&D closer to home, for instance, but assembly further away. Factories have even become more comfortable and attractive places to work, with the likes of production line seats, air conditioning, escalators, training and a range of health and safety improvements.
Cost opportunityThere is another recent trend now attracting policy attention, and that is the rising costs of doing business in emerging markets, and the relative falling cost in OECD ones as the crisis bites deeper.
While a narrowing in the cost gap will not change the fact that demand has shifted to burgeoning economies of Asia and Latin America, it might cause more firms to reconsider (or even reverse) offshoring plans.
Moving business to far away countries brings challenges; reports in Area Development: Site and Facility Planning have decried complex supply chains, quality, intellectual property issues, and higher costs related to shipping and inventories, and also labour. “Gone are the days when overseas manufacturers could realise 30 to 50% cost savings in manufacturing their products”, one report said, pointing out that the cost advantage of China could recede further as tariff and wage laws come into effect.
This naturally presents an opportunity for policymakers in the OECD area to
reinforce their industrial bases and make their manufacturing more competitive. Such actions could also attract those who wish to use this “backshoring” to spread risk in light of natural disasters or political changes. But would those measures help tackle unemployment and offer a route out of the crisis?
The answer is far from certain. For policymakers to make a real difference, they need to know several things, starting with why firms stay or leave, and why they choose particular locations. Costs savings, being closer to cheap labour, tapping into growing markets, accessing commodities, even tastes: they can all matter.
Policymakers must also look at the long-term outlook for demand, and despite global turbulence in the short term, the room for growth in emerging and other middle income markets remains substantial. Several Asian, African and Latin American countries boast burgeoning middle classes, and there are millions more people in lower income groups poised to join them.
In contrast, the OECD markets face saturation for many products and services, although there is always hope that some game-changing innovation, analogous to the dot.com revolution, will appear on the scene to transform the economic future.
But even if that were to happen, in the long run most growth in mass manufacturing jobs will most likely take place outside the OECD area. Indeed, it is hard to see how any major job growth in manufacturing can take place in OECD countries, again–there is simply too much productivity growth elsewhere. However, other sectors will grow.
It’s value, stupidTo understand which ones, a good place to look is those global value chains. Should policy target those activities that lie closer to the high-value strategic end, such as R&D and design, or towards the low cost end such as assembly?
The development of global value chains involving offshoring of production, sourcing, and specialisation in upstream (and downstream) activities has been a major factor in the decline in manufacturing employment in OECD countries where production has become more capital intensive and skills-based.
In fact, the environment for investment in knowledge-based capital is likely to determine which countries retain or move into the highly value-adding segments of different industries. For example, in 2006, the iPod accounted for 41,000 jobs, with 27,000 outside the US and 14,000 inside. But in earnings the ratio was reversed,
Manufacturing remains central to OECD economies
Global manufacturing% share in world manufacturing value added, 2010
Source: United Nations Statistics
INDuSTRY

8
as US workers–where the focus was on design, R&D, software and marketing–earned a total of US$753 million, while those abroad earned $318 million.
Conversely, there has been a global increase in manufacturing jobs in poorer and middle income countries as labour-intensive, low-value added jobs, such as assembly and packaging, locate and expand relocate. Realistically, OECD countries cannot durably compete with low-cost countries for this kind of production.
Sure enough, the defining lines have become somewhat blurred in recent years, with concerns about a rising loss of middle skilled jobs too, and attendant effects on income inequality. Even R&D has shifted abroad.
This puts a higher premium on skills in middle-income countries and helps explain the cost increases there. It is also a nudge for OECD countries to compete for such activities again. In short, global value chains have changed the nature of global competition, and this should influence policy too.
One point seems clear: high value-added manufacturing investment does not necessarily lead to vast numbers of new jobs being created directly on site. A steel plant today may employ 50 people, not 500, because of huge gains in technology. A glance around the OECD countries reflects the importance of value-added, from automotive components firms in Austria to pharmaceuticals in Ireland, and even in traditional industries, such as Italy’s shoe trade, where local conditions and artisanal craftsmanship cannot easily be replicated by moving location.
The key lesson for policy is to encourage the accumulation of knowledge-based capital at home, and to be able to capture as much value from the investment as possible. Through ensuring good business frameworks, such as those affecting the supply of skills and the operation of intellectual property rights,
governments can help encourage firms to invest in certain high value functions, such as R&D, prototyping, design, etc, and while some low-skilled jobs will inevitably stay, most growth in low paid jobs will take place elsewhere.
The discussion on which activities could be kept close to home and which ones should go is a dynamic one. Technology may enable more manufacturing on demand, which could favour production closer to the customer. An example of this is the printing industry, with quite large jobs being done rapidly close to market, and print runs with longer lead times being
outsourced to lower cost countries. Also, firms may prefer to keep close control to ensure quality is not compromised, or timely deliveries.
Manufacturing remains central to OECD economies, in terms of productivity and income growth, and for innovation. But while there may not be many new jobs in manufacturing production, successful investments will stimulate job creation in upstream and downstream sectors, not to mention in related services.
As for offshoring versus backshoring, there will always be firms that bring activities back. However, it would be premature to expect this to become a big trend or to risk entire strategies on what could prove to be a false promise.
References
Goldsberry, Clare (2010), “Bringing Manufacturing Back to the United States”, at www.areadevelopment.com
OECD (2011), Attractiveness for Innovation: Location Factors for International Investment, OECD Publishing.
Visit www.oecd.org/innovation
For more on manufacturing and the ongoing OECD work on global value chains, contact: [email protected]
The environment for investment in knowledge-based capital is a determining factor
BETTER POLICIES FOR BETTER LIVES
development
jobs
inequality
progress
nuclearinnovation
governance
wag
es
policies
servicestrust
ideas
trad
e change
cris
is
skill
s
gender lives
ener
gy
renewables
youth
sustainable
better
food security
risk
technologywell-being
middle class
OECD YearbookOECD Yearbook 2012
BETTER POLICIES FOR BETTER LIVES
In this, the second annual OECD Yearbook, renowned guests from government, business, trade unions
and civil society join OECD experts to explore the key questions which confront the world economy in 2012.
What has the crisis taught us about the need for a new approach to economic policymaking? What risks
do we face and how do we deal with them? Will unemployed youths ever reach their full working potential?
How do we give greater economic empowerment to women? Is the middle class on the way out in advanced
economies and on the way up in the emerging world? Can better governance prevent future crises?
Do green and growth go together? How do we really measure the progress of our societies?
The OECD Yearbook looks at these and other questions. It also presents country snapshots for
40 economies with data and commentary from selected OECD publications.
OECD Yearbook 2012
ISBN 978-92-64-02226-3
01 2011 06 1 P
OECD Observer No. 288/289 January 2012
ISSN 0029-7054-:HSTCQE=UWWW[X:
OE
CD
Yearbo
ok 2012 B
ET
TE
R P
OLIC
IES
FOR
BE
TT
ER
LIVE
S
2012OECD Yearbook
InequalityWhy the struggle matters
No bonus: Publicis takes a lead
Brazil reaches new heights: Special focus
Spotlight: Higher education and globalisationGuest minister: UK’s David Willetts
Databank: The state’s anti-poverty effect
No 287 Q4 2011 www.oecdobserver.org
Your key to the OECD
An award-winning* magazine and online service to keep you ahead of today’s economic and social policy challenges. The OECD Observer magazine presents authoritative and concise analysis of crucial world economic and social issues. It helps business, NGOs, academics and journalists to stay ahead of the policy debate.
• Expertviewsonglobalissues• Specialin-depthreports• Keyeconomic,social,environmental
and scientific data• Links,referencesandbibliographies
for further research and background• Listingsofmeetings,books,reports,
working papers, etc.
Plus the agenda-setting OECD Yearbook, free with every order. Subscribe to the OECD Observer print edition today at www.oecdbookshop.org or benefit from a special two-year subscription rate only available at www.oecdobserver.org/subscribe.html
*2002 Highly-Commended award from the Association of Learned and Professional Society Publishers, UK
For editorial queries, contact [email protected]
No 290-291 Q1-Q2 2012 www.oecdobserver.org
Euro spotlightOccupy: Main lessons
Huffington on the squeezed middleGenerations together?
Gender: Pushing for a changeOECD Skills Strategy
Tax and inequalityLong-term investment
Ministerial Council and Forum Special 2012

OECD Observer No 292 Q3 2012 9
INDuSTRY
Resurrecting industrial policy
Can governments play a positive role in boosting their countries’ industrial sectors?
“Industrial policy has often been criticised as “picking winners”; it is argued that the government is particularly ill-suited to that task (…) The objective of government policy is to identify winning projects with large externalities. In this, they have had a history of notable successes.”
These words by Nobel economics laureate, Joseph Stiglitz, in 1999, point to the crux of a common debate: Do governments need to use “industrial policy” to stimulate new sources of growth?
The term “industrial policy” is itself divisive: to some it means meddling governments, choosing national champions and cramping markets, to others it means simply that governments will sometimes need to make strategic choices about where to invest, be it in research and innovation, infrastructure or skills.
To be sure, any form of industrial policy has its risks. Subsidies and the promotion of industrial champions leave governments open to capture from vested interests, just as has happened with certain fossil fuel companies today. This leads to the dangers of lack of competition or allowing protectionism to creep in, with costs for producers, consumers and the wider economy. In fact, most evidence shows that losers are more likely to receive government support than winners, perhaps because they lobby harder.
On the other hand, since governments often end up helping losers, researchers may have underestimated any positive effects, leading to an over-pessimistic assessment of industrial policy. In other words, industrial policy can be made to work.
For a variety of reasons, there is a resurgence of interest in industrial policy, with some of it moving away from subsidies and the promotion of national champions, to “softer”–and potentially
less distorting–forms of support or encouragement. Governments are also seeking to become more strategic in their policies, aiming to support the rebalancing of economies in the wake of the crisis.
Boosting renewable energy usage is the kind of project where such strategic interventions by governments could make sense: private returns may be (at least initially) low; its aims have a social and public benefit (clean air, lower carbon emissions, less fossil fuel depletion); there could be economic spinoffs (retrofitting buildings, new jobs), and it involves technologies that require further development and R&D funding.
Government may also have a strategic role to playing fostering clusters for regional development purposes, or to overcome market failures, in finance for instance. The OECD has started to look at the resurgence of industrial policy recently with an eye to improving its evaluation. The aim of this work is not to rehabilitate “old-style” industrial policies, but to strengthen the evidence on how governments can make strategic choices, and what measures are most likely to be successful and in what circumstances.
Good policy should avoid the inertia that can come with targeting particular firms, be based on competition, and support a range of technologies and players instead. They should deal with issues such as skill shortages and supply chain effects, promote accountability, assure public access and evaluation, and protect tax-payers money. They should set realistic goals–there is no point in trying to replicate Silicon Valley, but there is value in supporting basic research in local universities. In short, good design, competition and oversight are a winning formula for sensible “industrial” policies.
See www.oecd.org/enterprise
For more information on industry issues, contact: [email protected]

10
Believing in angels
The current economic climate has put increased pressure on young firms trying to raise money and develop their businesses. Banks remain reluctant to provide loans to start-ups and venture capital firms prefer to invest in later stage companies. Now, a growing class of experienced entrepreneurs and business people–known as “angel investors”–is stepping in to fill this funding gap. Could this be encouraged further?
Angel investing is not a new phenomenon. In fact, it can be traced back in time to great historical adventures, such as Christopher Columbus’ westward voyage which Ferdinand and Isabella of Spain financed. Over the centuries, individual
“angel investors” have played a key role in funding many important innovations, projects and firms, including household technology names such as Apple, Google and Skype.
Unlike venture capitalists, angel investors invest their own money and therefore have more of their own “skin in the game”. As a result, they tend to be more committed
Karen Wilson, Science, Technology and Industry Directorate, OECD
to the long-term success of the businesses in which they invest. Furthermore, angel investors not only provide funding but also leverage their expertise and personal networks to mentor new entrepreneurs. More than just providers of financial capital, angel investors can be a source of valuable social capital and play a key role in providing strategic and operational expertise for promising new ventures.
While angel investment has existed in practice for centuries, the concept of angel investors as a powerful source of financing for high growth companies has only grabbed attention in the past couple of decades, primarily in the US and Europe. Findings from over a hundred interviews with entrepreneurs, policymakers and academics from 32 countries show that financing by angel investors is rapidly increasing around the world. The sector is not only expanding but becoming more formalised and organised through the creation of angel networks, which enable angel investors to invest larger amounts together to meet the financing needs of young innovative firms.
Angel investors support a much wider range of innovation than venture capital
firms as they traditionally invest locally and in a wider range of sectors. Since angels live everywhere–not only in those few technology or science hubs where venture capitalists have offices–they encourage broader investment coverage both in terms of industry sectors and geography.
While venture capital tends to attract significant attention from policymakers, the primary source of external seed and early stage equity financing in many countries is angel financing. Data from the US and Europe show that angel investment has been consistently larger than seed and early stage venture capital investment, and in a number of countries, larger than total venture capital investment (including the later stages). Angel investors are thus playing an increasingly important role in the economy around the world. Policymakers are starting to take notice too.
Yet relatively little is known about the phenomenon. Individual angel investors have traditionally preferred to keep
information about their investments private, despite the formation of groups and networks. Accurate data collection has remained a major challenge, and there has been limited academic literature to date on angel investing.
It is only with a recent OECD book, Financing High-Growth Firms: The Role of Angel Investors, that angel investing has even been analysed on a global basis.
Government policies to boost angel investment can make a difference, though any government intervention should aim to provide incentives for greater private sector involvement. As the book describes, some options include tax incentive schemes such as the ones in the UK
Angel investors support a much wider range of innovation than venture capital firms as they traditionally invest locally and in a wider range of sectors

OECD Observer No 292 Q3 2012 11
INDuSTRY
and France, and co-investment funds like those in the Netherlands, Scotland and New Zealand. In addition, a number of countries, particularly those in Europe, have supported national angel associations, groups and networks.
There is no homogeneous national angel market. The level, sophistication and dynamics of angel investment can vary greatly across regions within countries and policymakers must take this into account, since policies that have worked in one country may not work the same way or be as successful in another. In fact, in Canada
and the US, for instance, angel policies are implemented at the regional rather than the national level. While policies targeting angel investment are being put in place in a growing number of countries, there have been few formal evaluations of these programmes to date. More research into the angel market is needed.
Policymakers and others tend to focus on the venture capital market, which is more visible than the angel market, but data indicates that angel investors will continue to be critical in overcoming the financial and growth challenges facing
entrepreneurs. These angel investors will, in turn, contribute to job creation and economic growth–greatly needed today around the world. By facilitating their action, policymakers may well help unleash the next great discoveries.
References
OECD (2011), Financing High-Growth Firms: The Role of Angel Investors, OECD Publishing.
www.oecd.org/sti/angelinvestors
Sahlman, W. and E. Richardson (2010), The Changing Face of Angel Investing, Harvard Business School Publishing, Boston.
“The Worlds Greatest Angel Investment: Google”, at www.venturegiant.com, 2012.
Google’s recently launched Nexus Q is a minimalist home media server that can stream social media content stored in the cloud on to home entertainment systems and computer screens. A recent article in the New York Times highlights an unusual–though perhaps not for long–aspect of this device: it is assembled in the US. Most of its components will be US made as well.
Electronic devices such as this one have been manufactured outside the US for so long that the idea seems almost novel. But can this move make economic sense? Perhaps. Wages, once dramatically low in countries like China, have been on the increase. Rising fuel costs have made transportation more expensive and intellectual property issues have increased the attractiveness of producing at home. Also, as the crisis keeps unemployment rates stubbornly high in many countries, consumers may feel better about buying products made at home. To be sure, Google may be banking on the added brand value that a
“made in USA” tag might bring, though they have said this is not a reason for their decision. Regardless, a homemade label may very well prove to be a precious intangible asset.See:
Markoff, John (2012), “Google Tries Something Retro: Made in the U.S.A.”, in The New York Times, 27 June.
©JIM
WIL
SON/
The
New
Yor
k Ti
mes
-RED
UX-R
EA
Made in uSA, again?

EDF generates nearly 10% of France’s elec-tricity from hydropower: each year its plants provide an average of 46 TWh, equivalent to the total annual consumption of the Ile-de-France region.
EDF’s French hydropower production has made France the European Union’s leading renewable energy producer and is helping to meet national and European targets whereby 23% of electricity must be sourced from renewable energy by 2020. Combined with nuclear energy, it plays a key role in enabling the EDF group to produce 95% of its electricity in France without CO2 emissions, and to contribute significantly to the country’s security.
EDF’s hydropower generation system in metropoli-tan France includes more than 600 dams and close to 450 power plants of different sizes. Hydropower is currently the most competitive renewable energy, and thanks to its responsiveness, allows to address fluctuations in electricity demand.
Two main elements characterise the context in which EDF’s hydropower production activity is carried out:
Predominantly European regulation developments. The Water Framework Directive (WFD) is methodi-cally implemented.
Growing concerns regarding climate change which, together with the protection of biodiversity, are now a priority in environmental policies.
In both cases, discussions and decisions take place at European, even global, level while a frequent, important aspect of hydropower is a case-by-case, site-by-site approach, at a local level. This too is where the strongest relationships are formed with all stakeholders.
An active discussion with all stakeholders
EDF takes the view that they should:
be beyond reproach with respect to their opera-tions and compliance with all regulations;
continue and expand their ability to listen to and to take into account the views of stakeholders, and find the best compromises in the management of water resources;
promote hydropower, given its competitiveness and its flexibility, but also its contribution to reduc-tions in the emission of greenhouse gases.
Concrete actions are therefore taken only after dis-cussion with all the stakeholders. Finding compro-mises is complex because in many cases the different uses of water are in conflict with one another. Fur-thermore, as EDF manages almost 75% of France’s surface reserves (7 billion m3 of water), it is expected to hold the positions of both arbitrator and overall river manager.
That is why EDF not only closely monitors the state of resources but also manages its stocks with the grea-test vigilance in order to guarantee their availability in the event of exceptional circumstances. For instance, dry summers not only reduce water resources but also raise the water temperature. This has led EDF to adapt its methods of operation.
An optimized and responsible management of water resources
In order to ensure optimal management of its hydro-plants, EDF has implemented and operates an integra-ted hydro-meteorological monitoring and forecasting system in Grenoble.
For example, in high mountain ranges, cosmic-ray snow sensors calculate the thickness of snow-pack water content in order to predict as accurately as pos-sible the amount of water which will pour into the dams when the snow thaws. Combined with measu-rements of water flow and precipitation, snow-gauge measurements allow EDF to forecast the production capacities of hydropower stations.
Nearly one billion m3 of water is set aside each year by EDF for purposes other than power generation either in line with the specifications or agreements or because other users have financed a share of the reserves.
This is the case for agricultural irrigation, drinking water supply and river navigation, but also for the creation of artificial snow, for water recreation, tou-rism, or other leisure activities.
Thus EDF’s hydropower production plays a decisive role in the management of water resources at a natio-nal level as well as in regional economic development. It also contributes to support employment in the valleys.
The preservation and even restoration, of aqua-tic environments and the protection of fauna and flora are also priorities for EDF, and are materialized through many policies, such as:
Maintaining a minimum flow downstream of the installations, so-called “in-stream flow”, needed for the development of the aquatic environment; it is set to a minimum of 1/10th or 1/20th of the average flow of the river, depending on the type of installation;
Creation of crossings so that the dam is not a bar-rier to migratory fish (salmon, shad or eels). Almost 100 dams are already equipped;
Management of sedimentary deposits, crucial to the management of river morphology.
In additive, it is generally expected from EDF dams to protect downstream from rises in water levels and floods, even when the dams were not initially desi-gned for this purpose, and to support the river flow during dry spells. EDF plays a crucial role in the mana-gement of these natural but extreme events.
EDF sits in on all local and national consultations on water management set up by public authorities: water agencies, local water committees, etc. It is involved with them in the definition of river basin management plans, as provided for by law.
EDF’s hydropower plant,at the heart of water management challenges in France
In total, more than 1,500 EDF researchers and engineers are employed, along with 3,500 ope-rators who work at the plants, to maintain and modernise the equipment, limit its impact, contribute to river management and protect aquatic environments and, in addition, develop hydropower.
This innovative engineering is exported
The best example is the Nam Theun hydropower plant in Laos with a capacity of 1,070 MW, commissioned in 2010. Not only is it vital for Laos development’s, but sponsored by World Bank, and in the light of its ambitious environmental and social programmes, it is regarded as a prime example of meeting the expectations of local populations .
© E
DF
- C
laud
e Pa
uque
t
The EDF Roselend Dam in the Alps
Sponsored statement
OCDE - EDF_uk.indd 1-2 18/10/11 14:50

14
The OECD Strategy on Development: Giving fresh impetus to a core mission
In May 2012 the OECD Ministerial Council endorsed the OECD Strategy on Development, describing it as an essential tool for adapting the organisation’s work to fast changing realities. What are the factors behind the new strategy and what are the aims?
A key to answering lies in understanding the founding mission of the OECD. Since its creation in 1961, the OECD has been promoting better governance and more effective policy reform to help countries everywhere achieve and sustain economic growth and improve well-being. For President John F. Kennedy, whose support helped create the organisation, the OECD would help to provide for “the hopes for
growth of the less developed lands”. This vision is reflected in the OECD Convention. In fact, the word
“development” in the organisation’s title was chosen precisely to underline the point that, as well as boosting growth in member countries, a key goal would be to share the lessons of the post-war era and offer consultation on economic policy beyond the developed world.
The new OECD Strategy on Development gives fresh impetus to that founding mission, and it comes at an appropriate time.
The world’s economic centre of gravity has changed significantly in 50 years, with some developing countries now the key drivers of global growth.
Particularly since the 1990s when globalisation accelerated, scores of low-income and middle-income countries have recorded very high growth. Several major emerging economies–including China, India, Brazil, Indonesia and South Africa–grew by more than double the OECD rate from 2000 to 2010.
This shifted the economic weight between developed and developing countries, and has increased the need for developed and emerging markets to work together to address shared challenges. It has changed governance too, as shown by the coming to prominence of the G20, which groups developed, and emerging markets, as well as international organisations such as the OECD.

OECD Observer No 292 Q3 2012 15
Getting developed and developing countries to work ever more closely together and at every level–government, business and civil society, etc.–is particularly important, given changes in the geography and nature of poverty. A growing proportion of the world’s poor lives in the urban areas of middle-income countries, for instance. Inequality has also become a major challenge in advanced and developing countries, while all countries must address the challenges of climate change and resource scarcity.
Another important impulse behind the new strategy is to improve the coherence and effectiveness of development co-operation. Millions of people have been lifted out of poverty in 50 years, but millions more have been left behind. The importance of donor aid, or official development assistance (ODA), has not diminished, particularly for the least developed countries. But even if more countries were to meet the UN recommended goal of 0.7% of gross national income–currently just five OECD members reach it, with the OECD average at 0.3%–ODA alone would not be enough. Rather, financing is also changing as many developing economies become important global players in finance, trade, investment, innovation and development cooperation. Traditional ODA must also evolve, and act as a catalyst that links policymaking across the new architecture.
By emphasising “development” effectiveness, rather than the narrower
“aid” effectiveness, the OECD Strategy on Development builds on from the Global Partnership for Effective Development established in Busan, Korea, in 2011; then, some 80 countries agreed to work together as partners to tackle issues such as inequality, vulnerability and fragile states, and to build a better future for all.
How will the OECD Strategy on Development fit in to the evolving new architecture? A rule of thumb will be respond to the needs of developing countries in a spirit of knowledge-sharing,
mutual learning and collaboration. By making full use of the organisation’s expertise and comprehensive, evidence-based, and multidisciplinary approaches to policymaking and economic reform, the strategy will enable the OECD to strengthen its contribution to “more inclusive growth in the widest array of countries”.
The focus will be on four thematic areas for which, according to the 2011 OECD Ministerial Council, the OECD could add value to other international efforts: innovative and sustainable sources of growth; mobilising resources for
development–so helping countries help themselves more effectively; promoting good governance; and measuring progress–an area where the OECD is breaking new ground.
The OECD’s multidisciplinary approach to policy issues is what is needed for addressing the wide range of cross-cutting challenges all countries face, including green growth, gender, inequality, innovation, skills, migration, infrastructure, taxation and service provision, and fighting corruption. These issues have to be linked together coherently to improve policy effectiveness and prevent unwanted spill-overs from different domestic policies from undermining development efforts. Indeed, enhancing policy coherence for development is a primary aim of the new OECD strategy. This also helps when it comes to tailoring policies for specific country circumstances.
A good example is food security. Hundreds of millions of people in the world suffer from chronic hunger. Infrastructure and technological investments, in irrigation and crops, are not keeping up, while a combination of demand and supply factors
hamper availability, access, and utilisation of food. The new strategy will explore how OECD country and global policies can be better aligned with food security strategies among partner countries.
The OECD Strategy on Development offers a valuable framework for policymakers to work together more effectively, strengthen policy dialogue, promote development and seek effective solutions to global issues. It strengthens the organisation’s timeless mission to work alongside countries everywhere, and to help build better policies for better lives.
References
OECD (2012), OECD Strategy on Development, available at www.oecd.org/development/policycoherence
OECD (2011) “John F. Kennedy’s vision” in OECD Yearbook 2011, available at www.oecdobserver.org
OECD (2011), “A majestic start: How the OECD was won”, in OECD Yearbook 2011, by Rory Clarke and Lyndon Thompson.
A rule of thumb will be respond to the needs of developing countries in a spirit of knowledge-sharing, mutual learning and collaboration
DEvELOpMENT
Order this now!What is the state of play on the MDGs?Browse and order at www.oecd.org/bookshop

16
Minerals not to die for
©RE
UTER
S/Fi
nbar
r O’R
eilly
The OECD is cooperating with governments and companies to combat the scourge of conflict minerals and has issued a guidance that several African countries have endorsed. There are encouraging signs of progress.
Rare metal ores scratched from the ground, often by children, in countries such as those in the Great Lakes region of the
Nicholas Bray*
continent, are used to make a range of routine high-tech goods for sale in OECD countries and worldwide, such as laptops, mobile phones and light-bulbs. This is a lucrative industry, but it is also a fraught and dangerous one, with deep-seated interests, both in terms of sellers and buyers. Indeed, mineral sales have been known to contribute to finance armed violence in several African countries for years. In remote parts of the Democratic Republic of Congo (DRC) for instance,
ravaged by civil war for much of the past 15 years, ores rich in tin, tantalum, tungsten and gold are still being mined and sold by militias and racketeers. Across the state borders, accomplices are said to aid and abet their illicit trade.
But who really drives this trade and who really profits? What role if any do governments, mining companies, importers, shippers or IT manufacturers play? How can the rewards be routed

OECD Observer No 292 Q3 2012 17
towards the countries that produce the minerals, and away from opaque, criminal interests?
Now, governments, international organisations and interested companies have joined forces to combat abuses in the precious mineral sector by bringing new transparency to the supply chain.
At the heart of their efforts lies a set of due diligence recommendations developed at the OECD and complemented by on-going certification efforts led by African countries themselves.
Backed by the United Nations, the OECD drive to freeze so-called “conflict minerals” has gained momentum as a result of legislation passed by the US Congress in 2010. The Dodd-Frank Wall Street Reform and Consumer Protection Act began as an effort to clean up American financial markets. In one of many sub-clauses, it imposed stiff reporting requirements on US-listed companies that use or trade in minerals from the DRC.
The result was a flurry of concern among international businesses. Many firms stopped buying in the region, prices plummeted and trading firms closed. Some complained that the effect, though unintended, was to cut even legitimate DRC minerals suppliers off from their markets.
The fallout from Dodd-Frank spurred the OECD and others in their efforts to find a way forward and their discussions gave birth to a set of recommendations enshrined in the OECD Due Diligence Guidance for Responsible Supply Chains of Minerals from Conflict-Affected and High-Risk Areas.
The Guidance, with the approval of African countries–Angola, Burundi, Central African Republic, Republic of Congo, Democratic Republic of Congo, Kenya, Rwanda, Sudan, Tanzania, Uganda and Zambia–calls on all participants in
the supply chain, from mining companies to exporters, processors and end-users, to undertake due diligence to ensure that the minerals that they trade, process and include in final products are free of any association with conflict. In 60 pages, it sets out detailed recommendations for action at company level, including the appointment of officers directly responsible for undertaking due diligence and the public disclosure of actions taken to address or mitigate risks.
And in case anything is still unclear, it includes a series of red flags to alert companies to possible risks, such as, for example, the fact that minerals may have transited through a conflict area or that
a supplier may have a stake in a company operating in such an area.
For multinationals like Boeing, Nokia, General Electric and Siemens, which use tin, tantalum, tungsten and gold in their products, following the OECD recommendations will not merely enable them to conform to the requirements of Dodd-Frank. It will also help them to avoid the risks to their reputation of being associated with human rights abuses and irresponsible practices.
That is why they and more than two dozen other major corporates, plus associations representing the electronics and auto-motive industries, are working with the OECD as part of the programme to implement effective due diligence systems for companies “downstream” in the minerals supply chain. But
“downstream” companies need to be confident that parallel controls are
operating “upstream” in the supply chain at the level of mining companies, traders, processors and smelters.
Drawing on the OECD Guidance, “upstream” participants have now joined forces in Africa to prevent illicit “conflict minerals” from entering the supply chain. One example is a system of bagging and tagging minerals now being implemented to trace the origin of minerals in the DRC province of Katanga and in Rwanda. Ore that is mined legitimately is required to be stored and transported in bags bearing official tags certifying each consignment’s origin, weight and composition. These tags then accompany shipments to the smelters who transform the ore into metal.
Organised by ITRI, an industry organisation grouping the world’s major tin mining and smelting companies, and the Tantalum-Niobium International Study Center, or T.I.C., which groups companies involved with tantalum and niobium used to make turbine blades, the system, known as iTSCi (ITRI Tin Supply Chain Initiative) also ensures weight checks and other controls on bagged material are used to avoid the clandestine infiltration of illicit minerals into the supply chain.
Implementing all this is easier said than done, of course, and ending the trade in “conflict minerals” won’t happen overnight. Much of the region’s mining activity is informal, carried out by artisanal miners that dig out and sell their production to buying houses known as comptoirs, which then sell it on to exporters and processors. Large tracts of minerals-rich territory in the eastern DRC are outside the control of the central government, with poor communications and no roads. Despite a sharp drop in demand for minerals from these areas in the wake of Dodd-Frank, armed rebels and criminal groups continue to exploit deposits under their control. Though prices for ore from these areas have plunged, late in 2011 the UN reported that a few comptoirs were still purchasing
More than two dozen major corporates, plus associations representing the electronics and automotive industries, are working with the OECD as part of the
“conflict minerals” programme
DEvELOpMENT

18
untagged minerals for sale to refiners, smelters and traders in China.
Other major weaknesses include the lack of border controls between the DRC and Rwanda, where a number of mining companies have reported unexplained increases in production, prompting suspicions that they are siphoning minerals (though not necessarily conflict ones) from the DRC into the supply chain. Even in areas where the “bag and tag” system is up and running–in fact, in Rwanda, the transportation of minerals without tags has been made illegal–there is still room for improvement in the processes for issuing tags and recording the data of shipments. Log books get incorrectly filled in, lost, or damaged by bad weather. Some companies conspire with tagging officials to circumvent the process.
Despite such shortcomings, officials involved in monitoring the process are optimistic. Rwanda’s Geology and Mines Department has hired more than 100 agents to administer tagging, and some 25,000 workers at more than 400 Rwandan mining sites are now covered by the traceability scheme. In the DRC, things are less advanced, but more than 12,000 miners on 123 sites in seven target areas of Katanga are now involved.
“It was really a huge step forward to implement the iTSCi processes in both the DRC and Rwanda,” says Cecile Collin of Brussels-based consultancy Channel Research, which has been auditing the bagging and tagging programme.
“Hundreds of people are mobilised.”
Efforts are being made to comply with the OECD Guidance both by the corporate sector of the mineral supply chain and by the institutions and state services of the DRC and Rwanda, she notes. In March 2012 the Rwandan Geology and Mines Department (GMD) blacklisted four Rwandan companies for illegally tagging minerals, and in May the DRC
suspended the operations of two exporting companies for failing to check on the sources of mineral ores they were trading. These developments follow Rwanda’s announcement in October 2011 that it was returning to the DRC 70 tonnes of untagged minerals that had been smuggled across its borders, and the arrest of four senior military officers on charges of illicit cross-border dealings in January 2012. “There is a need to make some adjustments in terms of procedures,” Ms. Collin acknowledges, but “these are being monitored.”
At ITRI’s headquarters in the UK, officials share this positive view. Although the main objective of the system is the control of “conflict minerals”, there have also been some useful side-effects. DRC officials say they now find it easier to monitor minerals production and flows and collect legal taxes, while local traders and transporters say they are less subject to fraud, extortion and theft.
Long-term, cleaner minerals trading will provide benefits for everyone–with the exception of warlords, racketeers and rapists. “Companies who perform due diligence, both through their own company actions and through iTSCi, are hoping to reduce the risk of exposure to reputational damage,” says Kay Nimmo, ITRI’s manager of regulatory affairs.
But even more important for many, she suggests, is being “part of a system that will allow clean trade to grow and develop, increasing opportunity for local and international companies alike.”
*Nicholas Bray is a journalist and former media chief at the OECD
For more on the OECD Guidance, visit www.oecd.org/daf/investment/mining
Visit www.itri.co.uk
Order this now!Africa foreverBrowse and order at www.oecd.org/bookshop
Also available online:

OECD Observer No 292 Q3 2012 19
With over 200 million people between the ages of 15 and 24–a figure that will double by 2045–Africa’s fast-growing population is the youngest in the world. In the coming decades, hundreds of millions of young Africans will pour on to the job labour market as they leave schools branding qualifications of various levels.
The International Labour Organization estimates that between 2000 and 2008, Africa created 73 million jobs, but only 16 million for young people aged between 15 and 24.Youth employment is largely a problem of quality (of jobs and job seekers) in low-income countries and one of insufficient quantity in middle-income countries. Youth in vulnerable employment and working poverty are the large majority in poor countries–think mining for rare earth metals for instance–while in upper middle-income countries youth are more likely to be unemployed, underemployed or out of the labour force altogether. Across the African continent, more young people are discouraged than unemployed, suggesting that the challenge of youth employment could be much worse than it appears. And the cost in terms of poverty is high. On average 72% of the youth population in Africa live with less than $2 per day.
But where will the jobs come from? Public sectors will not be able to absorb
DEvELOpMENT
Africa’s young future
the tide of young job seekers. And while the private formal sector is growing, it does so from too small of a base to absorb the looming demand for jobs. Existing firms in this sector are the primary source of jobs paying a living wage, but they will need support if they are to grow further, become more competitive and eventually turn into a decent source of job creation.
The informal and rural sectors will continue to be the most important source of new employment by far. Governments
must work with this reality and focus on removing obstacles to the many small informal firms, helping them to grow and create decent jobs.
Take informal street trading which accounts for a large proportion of new urban jobs in Sub-Saharan Africa. Workers in this informal sector often lack a right to a place to work and are vulnerable to harassment by police, city officials and wholesale traders. The latter often abuse their relatively strong positions to force street traders to borrow from them at very high interest rates.
To address such problems, street traders in some countries have become organised
and even participate in urban planning. This has been the case in Dar es Salaam as well as in Durban where street traders have been issued licences to operate. Here, associations of street traders have established good relationships with city authorities and special infrastructure was set up for them in central locations.
Skills pose another common problem. Schools and training centres are simply not providing young people with the know-how that employers are looking for. However, a lack of demand for labour generally is the main barrier to overcome.
Governments must do more to help on this front. Although there is no shortage of government programmes focused on youth employment, their track record is poor. One of the biggest shortcomings of these initiatives is a general lack of knowledge on what works well and what does not, something closely linked to a major scarcity of employment data available for Africa. A second obstacle is a frequent lack of co-ordination among government agencies.
Despite this challenging short-term outlook, the long-term perspective is good, but only if African governments manage to tackle the hurdles young people face. Improvements in education, the emergence of new technologies and rapid urbanisation all present opportunities for developing burgeoning economic sectors and creating jobs. But ironically, it is in the informal and rural sectors, long seen as problems, that lies much of the entrepreneurial talent needed to raise employment prospects for youth. Tapping into this resource is what government policies must now focus on.
References
AfDB, OECD, UNDP, UNECA (2012), African Economic Outlook 2012: Promoting Youth Employment, OECD Publishing.
Jütting, J., J. de Laiglesia (2009), Is Informal Normal? Towards More and Better Jobs in Developing Countries, Development Centre Studies, OECD Publishing.
Street traders have become organised and even participate in urban planning
©RE
UTER
S/Fi
nbar
r O’R
eilly

At Microsoft, we are committed to helping students and educators realize their full potential. By partnering with education communities around the world, we strive to deliver relevant, effective and scalable solutions that focus the contributions of many on improved learning outcomes for all.Learn more at Microsoft.com/education
Microsoft in EducationAnytime Anywhere Learning for All
JOB NO:
PROJECT:
ELEMENT:
TRIM Size: 20 cm w x 27 cm h LIVE Area: 19 cm w x 26 cm h BLEED Area: 21 cm w x 28 cm h
SR. ACCOUNT ACCOUNT PROOFREAD SR. CREATIVE-ART CREATIVE-ART CREATIVE-WRITER PRINT PRODUCTION STUDIO
THIS PRINT OUT IS 100% OF FINAL SIZETHIS DIGITAL FILE IS BUILT 100% OF FINAL SIZE
NAP_S5801‘12 OECD All Up EducationPrint Ad CYAN MAGENTA BLACKYELLOW
Nap_S5801_OECD_Ad.ai
DOCUMENT NAME
4/18/12
DATE CREATED
4C Process
JOB TO BE PRINTED

OECD Observer No 292 Q3 2012 21
Green growth cannot be measured using GDP. Is there another way?
Here’s one of the best ever openings to a paper in any academic discipline you care to name: “The economic changes that occurred in this country during recent years are sufficiently striking to be apparent to any observer without the assistance of statistical measurements. There is considerable value, however, in checking the unarmed observation of even a careful student by the light of a quantitative picture of our economy.” That’s Simon Kuznets in his unremarkably entitled 1934 paper National Income, 1929–1932. Three years later, he would present a report to the US Congress that formulated such a “quantitative picture”: GDP, a single measure of the size of a nation’s economy.
Before GDP was invented (and it seems such an obvious, natural measure it’s hard to believe both that it was invented and invented so recently) governments did have some objective data on the state of the economy on which to base policy. In the 17th century already, William Petty established the bases of national accounting, essentially for tax purposes.
Despite the centuries separating them, Petty and Kuznets were responding to a similar need to understand a changing situation. Petty’s concern was that
The arithmetick of green growthalthough money rather than barter was starting to dominate economic transactions, national wealth was still counted as it had been for centuries in terms of gold and silver. In Kuznets’ time, the US government’s role in the economy was growing after the Great Depression, but as Richard T. Froyen points out, its interventions were being guided by a sketchy set of indicators such as freight car loadings or stock price indices.
The beauty of GDP was that it included so many different things in a single figure, and despite the suspicion and even outright hostility any innovative approach attracts, it became the standard measure of national economies following the 1944 Bretton Woods conference. The main criticism was, and still is, that it is not a measure of well-being since production can increase while leaving most people no better off in any way. Kuznets himself insisted that GDP was a quantitative measure and not meant to describe the quality of growth.
Speaking to the OECD Observer in 2005, François Lequiller, head of National Accounts work at the OECD, also defended GDP as doing very well what it was designed for, but admitted that it left out a number of key topics such as environmental degradation. However, as he pointed out, it’s probably impossible to design a single GDP-like figure for a wider application that would reflect the many different aspects in any meaningful way, and including them in GDP would damage its usefulness as a measure of output. A suite of indicators is more appropriate in these cases.
When OECD governments asked the organisation to develop tools to support policy analysis and monitor the progress of green growth strategies, it was clear that by its very nature green growth is not easily captured by a single indicator, and a set of measures would be needed as markers on a path to greening growth and seizing new economic opportunities.
A database of green growth indicators has just been launched by the OECD, structured around four groups to capture the main features of green growth:
Environmental and resource productivity, to indicate whether economic growth is becoming greener with more efficient use of natural capital and to capture aspects of production which are rarely quantified in economic models and accounting frameworks;
The natural asset base, to indicate the risks to growth from a declining natural asset base.
Environmental quality of life, to indicate how environmental conditions affect the quality of life and wellbeing of people.
Economic opportunities and policy responses, to indicate the effectiveness of policies in delivering green growth and describe the societal responses needed to secure business and employment opportunities.
Colombia, the Czech Republic, Korea, Mexico and the Netherlands have already applied the OECD’s preliminary set of green growth indicators to assess their state of green growth, and Costa Rica, Ecuador, Guatemala and Paraguay are now doing so.
Apart from providing data on what we know, compiling the database also reveals a number of gaps in our information relevant to green growth, for instance on biodiversity, what’s happening at industry level, or monetary values to reflect prices and quantities of stocks and flows of natural assets. Even where enough data exists, it may be difficult to combine them due to differences in classifications, terminology or timeliness, to allow cross-country comparisons for example. Patrick Love
OECD Insights
www.OECDInsights.org
www.OECDInsights.org

22
Inequality, the crash and the crisis
Inequality is “the defining issue of our times” says Stewart Lansley, visiting fellow, Townsend Centre for International Poverty Research, Bristol University.
Does inequality trigger economic instability? A few years ago this was an issue that did not register on the political Richter scale. Nor did it attract much attention amongst professional economists. As James Galbraith, the economist son of John Kenneth Galbraith, has put it, those few working in inequality research were in an economics “backwater”. Proving his point, the academic Journal of Economic Literature has no section examining inequality and economic instability.
There is one key reason for this lack of interest. For the last 30 years, the economic orthodoxy has been that inequality is a necessary condition for economic success. We can have greater equality or faster growth but not both. That orthodoxy emerged out of the global crisis of the 1970s when, it was claimed, the move towards more equal societies in the immediate post-war decades had gone too far and had led to economic sclerosis. What was needed to put economies back on an upward and sustainable path was a stiff dose of inequality.
Since the late 1970s that theory–for theory it was–has been put to the test in a real
life experiment in both the US and the UK, and more latterly in a number of rich countries. As a result, the income gap in America and Britain has grown to levels last seen in the inter-war years. So has the experiment in “unequal market capitalism” worked in the way predicted by the theory? The answer appears to be no. The income gap has surged but without the promised pay-off of wider economic progress.
On all measures of economic success bar inflation, the post-1980 era of rising inequality has a much poorer record than the egalitarian post-war decades. In the UK, growth and productivity rates have been about a third lower since 1980 than in the post-war era, while unemployment has averaged five times the level of the 1950s and 1960s. The three post-1979 recessions have been deeper and longer than the shallow and short-lived ones of the two post-war decades. The main outcome for the countries that have embraced the post-1980 model of market capitalism most fully has been economies that are both much more polarised and much more fragile, culminating in the great crash of 2008 and today’s increasingly prolonged and intractable crisis.
So does this mean the theory is fundamentally wrong? Do high levels of inequality lead to economic collapse? Was rising inequality from the 1980s in fact a central player in driving the global economy over the cliff in 2008, and in the dogged persistence of the current slump?
The official view is that inequality played no part in the present crisis. The report of the bipartisan US Financial Crisis Inquiry Commission into the causes of the 2008–9 Crash, published in January 2011, for example, failed to mention “inequality” once in its 662 page report.
Two years ago the handful of economists who argued that inequality was the real cause of the current crisis were easily dismissed as an insignificant and heretical minority. The political consensus remained that inequality was not an economic issue.
Yet gradually, opinion is beginning to turn. At the 2011 World Economic Forum in Davos, Min Zhu, former Deputy Governor of the People’s Bank of China and a special adviser at the International Monetary Fund, told his audience: “The increase in inequality is the most serious challenge facing the world.” In his economic address in Kansas last December, President Obama attacked the long period of stagnant earnings facing most Americans, or what he called the erosion of the “basic bargain that made this country great”. “But this isn’t just another political debate,” he continued,
“this is the defining issue of our time.”
At the OECD’s annual conference in Paris in May, the packed agenda was dominated by the issue of the growing divide, while the IMF has produced several reports that question the orthodox explanation of the role of inequality. In one study, two IMF economists, Andrew Berg and Jonathan Ostry, argue that the 1970s theory–by Arthur Okun in his highly influential book Equality and Efficiency, The Great Trade-Off–has failed to stand up to real world application: “When growth is looked at over the long term, the [efficiency/inequality] trade-off may not exist. In fact equality appears to be an important ingredient in promoting and sustaining growth.”
Not only has the rise in inequality failed to deliver on faster growth, history shows a clear association between inequality and instability. The great crashes of 1929 and 2008 and the deep-seated recessions that followed were both preceded by sharp rises in inequality. In contrast, the most prolonged period of economic success and stability in recent history–from 1950 to the early 1970s–was one in which inequality fell across the rich world and especially in the UK and the US. Of course, association is one thing, causation is another.
This post is the first in a three-part series. See www.oecdinsights.org for more.
www.OECDInsights.org

Copyright ©2011 Merck Sharp & Dohme Corp., a subsidiary of Merck & Co., Inc., Whitehouse Station, NJ, USA. All Rights Reserved.
At MSD, we work hard to keep the world well. How? By providing people all around the globe with innovative prescription medicines, vaccines, and consumer care and animal health products. We also provide leading healthcare solutions that make a difference. And we do it by listening to patients, physicians and our other partners — and anticipating their needs.
Not just healthcare.
We believe our responsibility includes making sure that our products reach people who need them, regardless of where they live or their ability to pay. So we’ve created many far-reaching programs and partnerships to accomplish this. You can learn more about them at msd.com.
We continue on our journey to redefine ourselves to bring more hope to more people around the world. Our goals are clear and our commitment is fierce. We are dedicated to solving problems and pursuing new answers.

24
All on board: Policies for inclusive growth and jobs
This is the Ministerial Council Statement adopted at the OECD Ministerial Council Meeting on 24 May 2012. The Chair’s Summary and other information related to the meeting can be found at www.oecd.org/mcm
On the occasion of the 2012 OECD Ministerial Council Meeting, we* have assembled under the Chairmanship of Turkey and the Vice-Chairmanship of Chile and Poland. Our discussions benefited greatly from the participation of the Russian Federation, which is in the accession process to the OECD and our Key Partners–Brazil, People’s Republic of China, India, Indonesia and South Africa–and international organisations.
We welcome the solid progress that has been made to implement the OECD
50th anniversary Vision Statement adopted at the 2011 MCM and collectively engage to translate it into concrete results. We welcome the role the Secretary-General has played in proposing new initiatives, including his Strategic Orientations, and increasing the organisation’s visibility and impact.
Inclusive growth and jobsIn light of the current economic situation, we are strongly committed to achieving inclusive growth and jobs through effective structural reforms, responsible fiscal and social policies, and appropriate measures to stabilise the financial sector. Sustainable economic growth is a critical objective and future OECD strategies will promote green growth. We underscore the importance of empowering people and enterprises to overcome current economic challenges, including the worrying trend of rising inequality and high levels of
unemployment in many countries. We therefore encourage further investment in people’s skills, and better matching skill supply and demand. We underline the importance of the full participation of women for the success of our economies. We welcome the OECD’s new initiatives, namely the Skills Strategy and the Gender Initiative, as well as the ongoing work on Inequality, Innovation, Green Growth and New Sources of Growth, like Knowledge Based Assets, and on Measuring Progress. They provide significant insights and guidance and serve as important tools for employment-oriented growth and valorisation of human capital. We also welcome the OECD’s work to promote open markets and legal certainty for international investment and responsible conduct of multinational enterprises, and to ensure competitive neutrality between public and private owned-businesses. We will continue to promote competition
©O
ECD/
Herv
é Co
rtina
tOECD.ORG
OECD ministers gathered at the annual Ministerial Council Meeting at the organisation’s headquarters on May 23, 2012
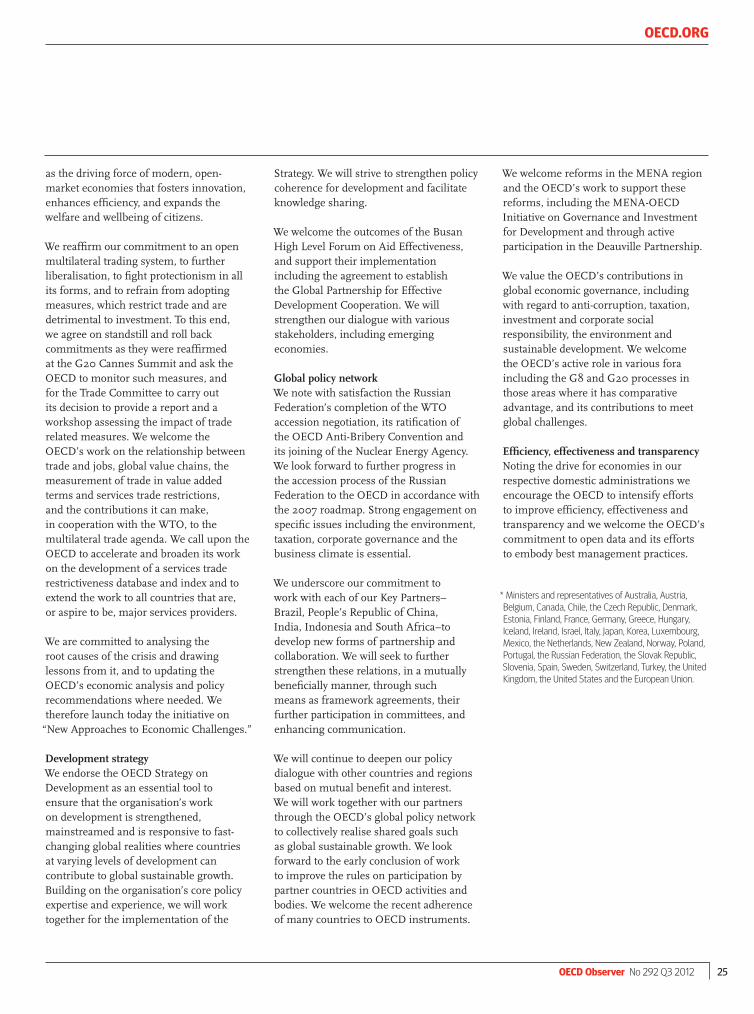
OECD Observer No 292 Q3 2012 25
OECD.ORG
as the driving force of modern, open-market economies that fosters innovation, enhances efficiency, and expands the welfare and wellbeing of citizens.
We reaffirm our commitment to an open multilateral trading system, to further liberalisation, to fight protectionism in all its forms, and to refrain from adopting measures, which restrict trade and are detrimental to investment. To this end, we agree on standstill and roll back commitments as they were reaffirmed at the G20 Cannes Summit and ask the OECD to monitor such measures, and for the Trade Committee to carry out its decision to provide a report and a workshop assessing the impact of trade related measures. We welcome the OECD’s work on the relationship between trade and jobs, global value chains, the measurement of trade in value added terms and services trade restrictions, and the contributions it can make, in cooperation with the WTO, to the multilateral trade agenda. We call upon the OECD to accelerate and broaden its work on the development of a services trade restrictiveness database and index and to extend the work to all countries that are, or aspire to be, major services providers.
We are committed to analysing the root causes of the crisis and drawing lessons from it, and to updating the OECD’s economic analysis and policy recommendations where needed. We therefore launch today the initiative on
“New Approaches to Economic Challenges.”
Development strategyWe endorse the OECD Strategy on Development as an essential tool to ensure that the organisation’s work on development is strengthened, mainstreamed and is responsive to fast-changing global realities where countries at varying levels of development can contribute to global sustainable growth. Building on the organisation’s core policy expertise and experience, we will work together for the implementation of the
Strategy. We will strive to strengthen policy coherence for development and facilitate knowledge sharing.
We welcome the outcomes of the Busan High Level Forum on Aid Effectiveness, and support their implementation including the agreement to establish the Global Partnership for Effective Development Cooperation. We will strengthen our dialogue with various stakeholders, including emerging economies.
Global policy networkWe note with satisfaction the Russian Federation’s completion of the WTO accession negotiation, its ratification of the OECD Anti-Bribery Convention and its joining of the Nuclear Energy Agency. We look forward to further progress in the accession process of the Russian Federation to the OECD in accordance with the 2007 roadmap. Strong engagement on specific issues including the environment, taxation, corporate governance and the business climate is essential.
We underscore our commitment to work with each of our Key Partners–Brazil, People’s Republic of China, India, Indonesia and South Africa–to develop new forms of partnership and collaboration. We will seek to further strengthen these relations, in a mutually beneficially manner, through such means as framework agreements, their further participation in committees, and enhancing communication.
We will continue to deepen our policy dialogue with other countries and regions based on mutual benefit and interest. We will work together with our partners through the OECD’s global policy network to collectively realise shared goals such as global sustainable growth. We look forward to the early conclusion of work to improve the rules on participation by partner countries in OECD activities and bodies. We welcome the recent adherence of many countries to OECD instruments.
We welcome reforms in the MENA region and the OECD’s work to support these reforms, including the MENA-OECD Initiative on Governance and Investment for Development and through active participation in the Deauville Partnership.
We value the OECD’s contributions in global economic governance, including with regard to anti-corruption, taxation, investment and corporate social responsibility, the environment and sustainable development. We welcome the OECD’s active role in various fora including the G8 and G20 processes in those areas where it has comparative advantage, and its contributions to meet global challenges.
Efficiency, effectiveness and transparency Noting the drive for economies in our respective domestic administrations we encourage the OECD to intensify efforts to improve efficiency, effectiveness and transparency and we welcome the OECD’s commitment to open data and its efforts to embody best management practices.
* Ministers and representatives of Australia, Austria, Belgium, Canada, Chile, the Czech Republic, Denmark, Estonia, Finland, France, Germany, Greece, Hungary, Iceland,Ireland,Israel,Italy,Japan,Korea,Luxembourg,Mexico,theNetherlands,NewZealand,Norway,Poland,Portugal, the Russian Federation, the Slovak Republic, Slovenia, Spain, Sweden, Switzerland, Turkey, the United Kingdom, the United States and the European Union.

26
From Indignation and Inequality to Inclusion and Integrity
paris, 22–23 May
“The challenges we face are immense. It’s beyond the capabilities of any group in society to find the answers in isolation. The answers will be found through wide and deep participation in a debate that takes the principle of civic equality seriously”. These words, by Naomi Colvin from Occupy London, captured the spirit and purpose of the 12th annual OECD Forum: “From Indignation and Inequality to Inclusion and Integrity” held in May.
More than 1300 participants from government, civil society, business, trade unions, media and academia came from some 70 countries to exchange views and hear new ideas about how to solve the global crisis and put the world on a path to a new and better future.
The opening remarks on inequality by Queen Rania Al Abdullah of Jordan set the tone to the two-day Forum:
“Millions of people have been lifted out of absolute poverty in recent years but the benefits of economic growth have not been shared evenly. They are not the “bottom billion”, some anonymous mass. They are members of our global family. They have names; they have dignity.”
In packed panel sessions, interactive “OECD_IdeaFactories”, and “food for thought” lunchtime discussions, participants covered a range of issues, from financial reform and youth skills to inclusiveness and gender quality.
Recent OECD initiatives, such as the Gender Initiative, the Skills Strategy, and the initiative on New Approaches to Economic Challenges were critically discussed. An updated version of the Better Life Index was launched, which now incorporates metrics on gender and inequality while the index covers Brazil and Russia in addition to the OECD member countries.
In the end the OECD Forum is about plotting new ways forward and involving as many interested stakeholders as possible in constructive interaction. By being held in conjunction with the OECD Ministerial Council which took place on 23-24 May, the event has the scope to influence policymakers too. Did the Forum contribute to shift from indignation towards integrity? As Cobus de Swardt of Transparency International said that
“[the] integrity of leaders is a most valuable public good. It is earned over years of open, honest and accountable behaviour. Moreover, it is never owned forever–it must be re-earned every day anew.”
The OECD is convinced that the path to integrity is taken with ongoing and open dialogue involving all stakeholders. In May the OECD Forum showed it was very much a part of this dialogue.
OECD Forum 2012 website: www.oecd.org/forum
OECD Forum 2012
©O
ECD
Some Forum snapshots (left to right): Robert Skidelsky, Emeritus Professor of Political Economy, University of Warwick; Michèle Pagé, Head of Human Resource Management at the OECD, speaks on promoting women champions; Her Majesty Queen Rania Al Abdullah of Jordan at the opening session; Shiv Malik, author and journalist with The Guardian,UK;anexhibitionmarks50yearsoftheOECD Observer; Anja von Moltke, Economic Affairs Officer, UNEP; OECD logo; cameras on “Squeezed and Emerging Middle Classes: From Silent Majority to Motor of the Economy”. More snapshots and video on www.oecdforum.org
OECD.ORG

OECD Observer No 292 Q3 2012 27
OECD.ORG
OECD Alumni launchedA new OECD Staff and Alumni Network has been launched and already boasts over 1,200 members. All former and current staff are welcome to join. “The organisation needs to retain knowledge that has grown out of the OECD and maintain that thread of continuity. This is even more important in a world of increasing mobility”, says OECD’s Makoto Miyasako in an interview with Jill Ramsey, the editor of OECD staff magazine, @tmosphere. Work is now under way to refine electronic profiles so that members can find one another and communicate more easily. Access to the OECD Staff and Alumni Network is via the OECD website.
Contact [email protected]
The Russian Federation’s accession to the Nuclear Energy Agency
23 May 2012Remarks delivered at the OECD Forum 2012, Paris, France.
Delivering jobs, growth and trust
23 May 2012Keynote speech delivered at the OECD Forum 2012, Paris, France.
All on board for gender equality
22 May 2012Remarks delivered for the launch of OECD and BIAC gender reports at the OECD Forum 2012, Paris, France.
From indignation and inequality to inclusion and integrity
22 May 2012Opening Remarks delivered at the OECD Forum 2012, Paris, France. Presentation of the 2012 Economic Outlook
22 May 2012Remarks delivered in Paris, France.
Global dialogue on sustainability and inclusion
22 June 2012Remarks delivered at the Rio+20 conference, Rio de Janeiro, Brazil.
Sustainable development in an unequal world
20 June 2012Remarks delivered at the Rio+20 conference, Rio de Janeiro, Brazil.
Improving transparency and anti-corruption
17 June 2012Remarks delivered at the B20 task force on anti-corruption and transparency, Los Cabos, Mexico.
Dialogue with labour organisations
17 June 2012Remarks delivered at the G20, Los Cabos, Mexico.
World Economic Outlook and the situation in the Euro area
17 June 2012Remarks delivered at the B20 summit, Los Cabos, Mexico.
Improving the assessment of disaster risks to strengthen financial resilience
16 June 2012Remarks delivered at a side event to the G20 Leaders Summit, Los Cabos, Mexico.
Mekorot, the national water company of Israel
6 June 2012Remarks delivered in Tel Aviv, Israel.
New guidelines to multinational enterprises and the OECD anti-bribery convention
6 June 2012Remarks delivered at the Manufacturers association of Israel seminar, Tel Aviv, Israel.
Clean-tech clustering as an engine for local development: The Negev region, Israel
5 June 2012Remarks delivered in Jerusalem, Israel. Social policies in Israel–Future directions
5 June 2012Remarks delivered at “Social policies–Future directions”, Jerusalem, Israel.
A secure Internet as an engine of economic growth
31 May 2012Remarks delivered at “The EU cybersecurity & digital crimes forum”, Brussels, Belgium.
Revitalising the European dream
31 May 2012Remarks delivered at “The state of the European Union conference”, Brussels, Belgium.
Latin America: A bright future
25 May 2012Opening Remarks delivered at the IV International Economic Forum on Latin America and the Caribbean, Paris, France.
My strategic orientations and new approaches to economic challenges
23 May 2012Remarks delivered at the OECD Ministerial Council Meeting 2012, Paris, France.
Signature ceremony with Colombia and Mexico
23 May 2012Remarks delivered at the OECD Forum 2012, Paris, France.
For a complete list of speeches and statements, including those in French and other languages, go to www.oecd.org/speeches
Recent speeches by Angel Gurría
© O
sman
Ors
al/R
eute
rs

28
OECD.ORG
Calendar highlightsPlease note that many of the OECD meetings mentioned are not open to the public or the media and are listed as a guide only. All meetings are in Paris unless otherwise stated. For a comprehensive list, see the OECD website at www.oecd.org/media/upcoming which is updated regularly.
JUNE
14–15 Linking renewable energy to rural development: Drivers and constraints, OECD Rural Development Policy Conference.
14–15 Tax and crime: A whole government approach to fighting illicit financial flows, meetingorganisedbytheCentreforTaxPolicy and Administration. Rome, Italy.
18 Global forum on transparency and exchange of information for tax purposes peer review report: Phase 1: Legal and Regulatory Framework for Cook Islands, Liberia, Lebanon, Grenada, Montserrat, St Lucia and United Arab Emirates. Combined: Phase 1 + Phase 2 for China and Greece.
18–19 G20 summit.LosCabos,Mexico.
18–20 Enhancing the competitiveness of universities through educational facilities, conference organised by the OECD Centre for Effective Learning Environments (CELE) and the Korean Educational Development Institute. Seoul, Korea.
20–22 United Nations conference on sustainable development, Rio+20. Rio de Janeiro, Brazil.
21–22 Getting the long-term unemployed back into work: New finance and delivery mechanisms, capacity building seminar. Trento, Italy.
25–26 Measuring the economic impact of ICTs: Policy drivers and economic evidence, conference of the ICTNET/International Research Network on the Economic Impact of ICTs.
26 Launch of the OECD Economic Survey of the United States.
26–28 European framework for measuring progress, European conference on measuring well-being and fostering the progress of societies: e-frame, organised by the OECD, the Italian National Institute of Statistics (Istat) and Statistics Netherlands (CBS) in collaboration with Eurostat and the European Statistical System.
27–29 6th OECD forum on African public debt management. Midrand, South Africa.
JULY
3–4 Strategic approaches to demographic change in Russia and Eastern Europe, capacity building seminar. Trento, Italy.
11 Launch of OECD-FAO Agricultural Outlook. Rome, Italy.
14–15 Latin America and Caribbean tax policy forum. Colombia.
AUGUST
5–11 International youth nuclear congress IYNC2012, regional forum to promote informationexchangeofideasandmanagement approaches to maintaining occupationalradiationexposuresAsLowAs Reasonably Achievable (ALARA), co-sponsored by the Nuclear Energy Agency. Charlotte, USA.
SEPTEMBER
1–7 United Nations world urban forum. Naples, Italy.
5–6 Global value-chains and competitiveness: Latin America and Caribbean, conference of the Latin America and Caribbean-OECD Investment Initiative co-organised with the Government of Costa Rica and the
Inter-American Development Bank (IDB). San José, Costa Rica.
17–19 IMHE general conference 2012: Attaining and sustaining mass higher education: Towards the equitable development of higher education.
24–26 Innovative approaches to turn statistics into knowledge, seminar co-organised by the OECD Statistics Directorate and Statistics Korea. Seoul, Korea.
OCTOBER
3 Council of Europe parliamentary assembly debate. Strasbourg, France.
3–5 Innovation and modernising the rural economy, 8th rural development policy conference. The SIBERIA International BusinessExhibitionCentreinKrasnoyarsk,Russia.
12–14 International Monetary Fund/World Bank Annual Meetings. Japan.
16–17 Global economic symposium. Rio de Janeiro, Brazil.
16–19 4th OECD world forum on statistics, knowledge, and policies: Measuring well-being and fostering the progress of societies. New Delhi, India.
NOVEMBER
14–15 Economy/Health forum, organised by Les Échos. Paris, France.
28–29 Patent statistics for decision-makers 2012: Knowledge assets and economic growth, organised by the OECD and the European Patent Office (EPO).

To view the OECD Factbook online, go to: www.OECD-iLibrary.org/factbook
To order book and USB memory stick versions, go to our online bookshop
and search for “factbook”; www.oecd.org/bookshop
To get a version for your iPhone, go to the App Store. Blackberry and other
smartphone versions available at: www.oecd.org/publications/factbook
OECD Factbook is the OECD’s annual flagship that presents key data across the full subject range of OECD work.
Each variable is presented in a two-page spread, with definitions, overviews of recent trends, comments on comparability, and indications
on where to go for more information on the left-hand side, and tables and graphs showing the actual data on the right-hand side.
In some cases, more than one page of charts and graphs are shown. All of the charts and graphs include StatLinks, URLs linking to
Excel®spreadsheetfilescontainingtheunderlyingdata.
BETTER POLICIES FOR BETTER LIVES
OECD Factbook

30
Over the next 50 years, life expectancy at birth is expected to increase by more than seven years in developed economies. While this is good news for many, it will
also be a strain on pension systems. To be sure, governments will need to address increasing life expectancy by raising retirement ages gradually. This is a key conclusion of the first Pensions Outlook 2012, a new OECD report which looks at the future of pensions.
Denmark and Italy actually link retirement ages to life expectancy, a policy that others may need to consider. But even this is not enough. Governments will also need to
By 2050, 70% of the world’s population more than 5.5 billion people will live in urban areas. This population boom, combined with threats of global warming, high energy
prices and tight government budgets make a convincing argument for better city planning. Governments faced with growing populations and dwindling natural resources have two choices: they can let urban sprawl continue to eat up useful land or they can plan “compact cities” that will be better for the economy and the environment.
Using the examples of Melbourne, Paris, Portland, Toyama and Vancouver, OECD’s new Compact City Policies: A comparative assessment says that, with
the right policies, compact cities can protect the environment, foster regional economic growth and offer a better quality of life. For example, a proposal has been made to increase forests of the greater Paris area by at least 30% in order to limit the temperature in case of a heat wave.
As well as preserving biodiversity, farmland directly adjacent to cities encourages local food consumption, reduces the distance the food travels and limits green house gas emissions. For citizens, the high cost of energy will be off-set by shorter travel time, access to public transport and access to local services and jobs. For governments looking to save money, compact cities offer more efficient infrastructure investment and reduce the cost of maintenance for transport, energy, water supply, and waste collection and disposal.
The book contains the policy practices of almost 30 countries and gives 18 compact city indicators which can help
governments to benchmark their results and improve their policy actions. The book recommends, for example, that national, regional and urban governments work together with investors and other actors to encourage density, particularly in new developments and to synchronise urban and rural land-use policies. It calls for governments to retrofit existing buildings and increase the diversity of land use and quality of life by mixing commercial and residential areas. It also suggests that governments minimise the adverse effects of compact cities by limiting traffic congestion through taxation on vehicles or fuel for instance, encouraging affordable housing, promoting attractive urban design and public spaces, and greening built-up areas.
See: www.oecd.org/gov/cities
ISBN 9789264167841
make greater efforts to promote private pensions. Indeed, reforms over the past decade have cut future public pension payouts, typically by 20% to 25%. This means that on average in OECD countries, people starting work today can expect a public pension to cover only about half their net earnings, if they retire after a full career and at the official retirement age. Better to be in one of the countries that have made private pensions mandatory, for there, pensioners can expect benefits of around 60% of earnings.
The outlook for pensions is more worrying in countries where public pensions are relatively low and private pensions voluntary, such as in Germany, Ireland, Korea, Japan and the US. Here major falls in income upon retirement will be commonplace, potentially driving up poverty in old age. Encouraging private pension savings will be essential,
Saving retirement
Compact cities
Pensions Outlook 2012 believes. Facilitating matching contributions or giving flat subsidies to savers, such as in Germany and New Zealand, would improve incentives to contribute.
The inaugural edition of the Pensions Outlook also includes the first comprehensive evaluation of national
“defined contribution” systems, which are now a central feature of many countries’ pension systems. Contributions to these systems will need to be made high enough in many cases so that together with public pensions, they generate sufficient income for retirement periods that might very well prove lengthier than many pension systems originally bargained for.
See: www.oecd.org/pensions
ISBN 9789264169395
BOOKS
OECD iLibrary

OECD Observer No 292 Q3 2012 31
OECD Economic Outlook, Volume 2012, Issue 1
The OECD Economic Outlook is the OECD’s twice yearly analysis of the major economic
trends and prospects for the next two years. In these turbulent times, the OECD Economic Outlook provides critical information on the evolution of the world economy.
ISBN978-92-64-13047-0,May2012,350pages €102 $147 £91 ¥12 200
African Economic Outlook 2012: Promoting Youth Employment
This 11th edition of the African Economic Outlook provides coverage of all African
countries except Somalia. This edition’s focus concerns the promotion of youth employment in Africa.
ISBN 978-92-64-17609-6, June 2012, 300 pages €50$70£45¥6500
OECD Pensions Outlook 2012
This 2012 edition looks at pension reform during the crisis and beyond, the design of automatic adjustment mechanisms,
reversals of systemic pension reforms in Central and Eastern Europe, coverage of private pension systems and guarantees in defined contribution pension systems.
ISBN978-92-64-16939-5,June2012,232pages €60$84£54¥7800
Languages in a Global World: Learning for Better Cultural Understanding
This book examines the links between globalisation
and the way we teach and learn languages.
ISBN 978-92-64-12324-3 May 2012, 470 pages €54$75£48¥7000
Preparing Teachers and Developing School Leaders for the 21st Century: Lessons from around the World
This book uses PISA data to show that a substantial proportion of students in OECD countries now attend schools that have high degrees of autonomy in different areas of decision making.
ISBN 978-92-64-17421-4, July 2012, 108 pages €32 $44 £28 ¥4 100
PISALet’s Read Them a Story! The Parent Factor in Education
This book presents good news for stressed and concerned parents:
it does not require a Ph.D or unlimited hours for parents to make a difference in their children’s education.
ISBN978-92-64-17619-5,July2012,81pages €15$21£13¥1900
Entrepreneurship at a Glance 2012
This second issue of Entrepreneurship at a Glance, a product of the OECD-Eurostat Entrepreneurship Indicators Programme,
presents an original collection of indicators for measuring the state of entrepreneurship.
ISBN978-92-64-17309-5,June2012,136pages €45$63£40¥5800
International Migration Outlook 2012
This publication analyses recent development in migration movements and policies in OECD countries
and some non member countries. This edition’s special chapters cover renewing ageing workforce skills and Asia in international migration.
ISBN978-92-64-17720-8,June2012,385pages €90 $126 £81 ¥11 700
Model Tax Convention on Income and on Capital 2010: Full Version
This full version contains the full text of the Model Tax Convention on Income and on Capital as it read on 22 July 2010 and replaces the old looseleaf version.
ISBN978-92-64-17517-4,July2012,2000pages €325$455£292¥42200
Current bestsellers
BOOKS
OECD iLibrary
All publications available at www.oecd.org/bookshop and www.OECD-iLibrary.org

32
New publications DEVELOPMENT
Conflict and FragilityManaging Risks in Fragile and Transitional Contexts: The Price of Success?
ISBN 978-92-64-11873-7, May 2012, 164 pages €35$49£31¥4500
Better AidAid Effectiveness 2011: Progress in Implementing the Paris Declaration
ISBN978-92-64-12549-0,April2012,200pages €50$70£45¥6500
Poverty Reduction and Pro-Poor Growth: The Role of Empowerment
ISBN 978-92-64-16834-3, June 2012, 300 pages €84$117£75¥10900
Development Centre StudiesCan We Still Achieve the Millennium Development Goals? From Costs to Policies
ISBN 978-92-64-17323-1, May 2012, 84 pages
€25$35£22¥3200
Development Centre StudiesIndustrial Policy and Territorial Development: Lessons from Korea
ISBN978-92-64-17351-4,June2012,152pages €39$54£35¥5000
African Central Government Debt 2012: Statistical Yearbook
ISBN 978-92-64-09069-9, July 2012, 196 pages €53$74£47¥6800
EDUCATION
OECD Reviews of Evaluation and Assessment in Education: Portugal 2012
ISBN 978-92-64-11701-3, April 2012, 180 pages €30 $42 £27 ¥3 900
ECONOMY
OECD Economic Surveys: Canada 2012
ISBN 978-92-64-12792-0, June2012,115pages €61$86£54¥7200
OECD Economic Surveys: Netherlands 2012
ISBN 978-92-64-12790-6, June 2012, 127 pages €61$86£54¥7200
OECD Economic Surveys: Poland 2012
ISBN 978-92-64-12728-9, April 2012, 123 pages €61$86£54¥7200
OECD Economic Surveys: United States 2012
ISBN978-92-64-12795-1,June2012,112pages €61$86£54¥7200
Promoting Inclusive Growth: Challenges and Policies
ISBN 978-92-64-16829-9, May 2012, 288 pages €84$117£75¥10900
National Accounts of OECD Countries, Volume 2012 Issue 1: Main Aggregates
ISBN978-92-64-17452-8,May2012,180pages €75$105£67¥9700
AGRICULTURE
OECD Review of Fisheries 2011: Policies and Summary Statistics
ISBN 978-92-64-12912-2, July 2012, 400 pages €98 $137 £88 ¥12 700
Rebuilding Fisheries: The Way Forward
ISBN 978-92-64-17692-8, July 2012, 108 pages €30 $42 £27 ¥3 900
PISALearning beyond Fifteen: Ten Years after PISA
ISBN 978-92-64-17204-3, May-2012, 120 pages €35$49£31¥4500
PISAPISA 2009 Technical Report
ISBN978-92-64-04018-2,May-2012,295pages €95$133£85¥12300
PISAPublic and Private Schools: How Management and Funding Relate to their Socio-economic Profile
ISBN 978-92-64-17491-7, June 2012, 108 pages €24 $33 £21 ¥3 100
EMPLOYMENT
Jobs for Immigrants, Volume 3: Labour Market Integration in Austria, Norway and Switzerland
ISBN978-92-64-16752-0,June2012,298pages €50$70£45¥6500
ENERGY
Energy Technology Perspectives 2012: Pathways to a Clean Energy System
ISBN 978-92-64-17488-7, June 2012, 700 pages €150$210£135 ¥19500
Energy Policies of IEA Countries: Ireland 2012
ISBN 978-92-64-17146-6, July 2012, 160 pages €75$97£54¥10400
Energy Policies of IEA Countries: Switzerland 2012
ISBN978-92-64-17148-0,July2012,150pages €75$105£54¥10400
BOOKS
OECD iLibrary

OECD Observer No 292 Q3 2012 33
Evaluating Laws and Regulations: The Case of the Chilean Chamber of Deputies
ISBN978-92-64-17625-6,June2012,100pages €29 $40 £26 ¥3 700
OECD Public Governance Reviews: Slovenia Towards a Strategic and Efficient State
ISBN:978-92-64-17325-5,July2012,220pages €54$75£48¥7000
Value for Money in Government: Australia 2012
ISBN978-92-64-17879-3,June2012,150pages €30 $42 £27 ¥3 900
INDUSTRY AND SERVICES
OECD Tourism Trends and Policies 2012
ISBN978-92-64-17755-0,July2012,451pages €90 $126 £81 ¥11 700
Entrepreneurship at a Glance 2012
ISBN978-92-64-17309-5,June 2012, 136 pages €45$63£40¥5800
Financing SMEs and Entrepreneurs 2012: An OECD Scoreboard
ISBN 978-92-64-02802-9, May 2012, 196 pages €62$86£55¥8000
NUCLEAR ENERGY
Nuclear DevelopmentNuclear Education and Training: From Concern to Capability
ISBN 978-92-64-17637-9, April 2012, 200 pages €60$84£54¥7800
Thermodynamic Sorption Modeling in Support of Radioactive Waste Disposal Safety Cases: NEA Sorption Project Phase III
ISBN978-92-64-17781-9,May2012,153pages €46$64£41¥5900
SCIENCE AND INFORMATION TECHNOLOGY
OECD Reviews of Innovation Policy: Slovenia 2012
ISBN 978-92-64-16722-3, May 2012, 188 pages €40$56£36¥5200
Knowledge Networks and Markets in the Life Sciences
ISBN 978-92-64-11937-6, May 2012, 100 pages €30 $42 £27 ¥3 900
Meeting Global Challenges through Better Governance: International Co-operation in Science, Technology and Innovation
ISBN 978-92-64-17869-4, July 2012, 242 pages €60$84£54¥7800
SOCIAL AFFAIRS – MIGRATION – HEALTH
OECD Reviews of Health Systems: Russian Federation 2012
ISBN 978-92-64-16808-4, June 2012, 120 pages €36$50£32¥4600
OECD Reviews of Health Care Quality: Korea 2012: Raising Standards
ISBN 978-92-64-17334-7, May 2012, 166 pages €36$50£32¥4600
Energy Policies of IEA Countries: United Kingdom 2012
ISBN978-92-64-17086-5,June2012,180pages €75$101£54¥10400
Medium-Term Gas Market Report 2012
ISBN 978-92-64-17797-0, June 2012, 100 pages €100 $140 £90 ¥13 000
ENVIRONMENT
OECD Environmental Performance Reviews: Slovenia 2012
ISBN978-92-64-16925-8,June2012,168pages €50$70£45¥6500
FINANCE AND INVESTMENT
Competitiveness and Private Sector Development: Ukraine 2011: Sector Competitiveness Strategy
ISBN 978-92-64-12878-1, June 2012, 191 pages €57$79£51¥7400
OECD Investment Policy Reviews: Colombia 2012
ISBN978-92-64-16772-8,May2012,150pages €35$49£31¥4500
Identification and Quantification of the Proceeds of Bribery: Revised edition, February 2012
ISBN978-92-64-17538-9,April 2012, 70 pages €24 $33 £21 ¥3 100
GOVERNANCE
Better Regulation in Europe: Italy 2012
ISBN 978-92-64-16996-8, April 2012, 132 pages €30 $42 £27 ¥3 900
BOOKSOECD iLibrary

34
TAXATION
Model Tax Convention on Income and on Capital 2010: Full Version
This full version contains the full text of the Model Tax Convention on Income and on Capital as it read on 22 July 2010 and replaces the old looseleaf version.
ISBN978-92-64-17517-4,July2012,2000pages €325$455£292¥42200
Global Forum on Transparency and Exchange of Information for Tax Purposes Peer Reviews
Allpricedat€36$50£32 ¥4 600
Brazil 2012: Phase 1: • Legal and Regulatory Framework ISBN 978-92-64-16871-8, April 2012, 92 pages
Chile 2012: Phase 1: • Legal and Regulatory Framework ISBN 978-92-64-16873-2, April 2012, 76 pages
Costa Rica 2012: Phase 1: • Legal and Regulatory Framework ISBN978-92-64-16875-6,April2012,72pages
Cyprus 2012: Phase 1: • Legal and Regulatory Framework ISBN 978-92-64-16877-0, April 2012, 76 pages
Czech Republic 2012: Phase 1: • Legal and Regulatory Framework ISBN 978-92-64-16879-4, May 2012, 88 pages
Guatemala 2012: Phase 1: • Legal and Regulatory Framework ISBN 978-92-64-16881-7, May 2012, 68 pages
Republic of Korea 2012: Combined: • Phase 1 + Phase 2 ISBN 978-92-64-16896-1, May 2012, 116 pages
Malta 2012: Phase 1: • Legal and Regulatory Framework ISBN 978-92-64-16883-1, April 2012, 84 pages
Mexico 2012: Phase 1: • Legal and Regulatory Framework ISBN978-92-64-16885-5,April2012,84pages
Saint Vincent and the Grenadines 2012: • Phase 1: Legal and Regulatory Framework ISBN 978-92-64-16892-3, April 2012, 80 pages
Slovak Republic 2012: Phase 1: • Legal and Regulatory Framework ISBN 978-92-64-16894-7, April 2012, 84 pages
URBAN, RURAL AND REGIONAL DEVELOPMENT
OECD Green Growth StudiesCompact City Policies: A Comparative Assessment
ISBN 978-92-64-16784-1, May 2012, 284 pages €90 $126 £81 ¥11 700
Redefining “Urban”: A New Way to Measure Metropolitan Areas
ISBN978-92-64-17405-4,June2012,148pages €27$37£24¥3500
OECD Territorial Reviews: Chihuahua, Mexico 2012
ISBN 978-92-64-12897-2, May 2012, 262 pages €65$91£58¥8400
FORTHCOMING
Education at a Glance 2012: Highlights•
Education at a Glance 2012: OECD Indicators•
Electricity and a Climate-Constrained World: Data • and Analyses
Free Movement of Workers and Labour Market • Adjustment:RecentExperiencesfromOECD Countries and the European Union
Livestock Diseases: Prevention, Control and • compensation Schemes
ModelTaxConventiononIncomeandonCapital• 2010: Electronic Version (eMTC)
OECD Employment Outlook 2012•
OECD-FAO Agricultural Outlook 2012•
BOOKSOECD iLibrary
OECD Integrity Review of Brazil: Managing Risks • for a Cleaner Public Service
OECD Reviews of National Policies for Education: • Higher Education in the Dominican Republic 2012
OECD Reviews of Risk Management Policies: • Systemic Financial Risk
OECD Territorial Reviews: Brazil 2011•
OECD Territorial Reviews: Skåne, Sweden 2012•
Stocktaking of Business Integrity and Anti-Bribery • Legislation, Policies and Practices in Twenty African Countries
Trends in the Transport Sector 2012•
Untapped Skills: Realising the Potential of • Immigrant Students
Working Smarter in Revenue Administration•
All publications listed on these pagesare available at:
www.oecd.org/bookshop andwww.oecdilibrary.org
A list of OECD publications distributorsin various countries is available at:
www.oecd.org/publishing/distributors
A list of institutions subscribing to the OECD iLibrary is available at:
www.oecd.org/publishing/oecdilibrarysubscribers

OECD Observer No 292 Q3 2012 35
How can teachers know what–let alone how–to teach when the world is changing so quickly around us? That, in a nutshell, was the topic of discussion at the second International
Summit on the Teaching Profession, held in New York in March 2012 and attended by ministers, union leaders and teacher leaders from 23 of the 25 highest-performing and most rapidly improving education systems, according to the OECD’s Programme for International Student Assessment (PISA). Preparing Teachers and Developing School Leaders for the 21st Century: Lessons from around
the World, the report that guided the talks, tackles the issues involved in a three-pronged approach: developing school leaders, improving teaching practices, and recruiting, training and retaining high-quality teachers.
OECD research finds that school leaders can make a difference in school and student performance if they are granted the autonomy to make important decisions–including about which teachers to hire for their schools. For their part, teachers not only need a rich repertoire of teaching strategies and the knowledge of how and when to use certain methods and strategies, they also need to be able to use new technologies as teaching tools and be open to innovation. Meanwhile, education systems must be able to attract high-quality teachers
by offering competitive compensation and professional status and by encouraging opportunities for professional development throughout their careers.
Sprinkled throughout the concise report are examples of successful or promising policies and programmes from around the world, including: programmes to develop school leaders in Ontario, the US, Singapore and Scotland; teacher-education approaches in Finland, Australia, Japan and China; and recruitment and retention practices in Singapore, Sweden and England.
OECD (2012), Preparing Teachers and Developing School Leaders for the 21st Century: Lessons from around the World, OECD Publishing.
ISBN 9789264174214
Teaching the teachers
BOOKSOECD iLibrary
OECD OBSERVER ORDER FORM – SUBSCRIBE TODAY!
Yes, sign me up for 4 issues and my annual OECD Yearbook.
€ 73US$ 101£57¥9500
Yes, sign me up for 8 issuesplus 2 annual OECD Yearbooks and save 30%!
€ 101US$ 141£ 83¥ 13 900
You can order your BOOKS either online at www.oecd.org/bookshop or by mailing your choices from the New OECD publications titles in this section to one of the addresses below.
Cheque/money order enclosed (payable to “OECD”)PleasechargemyVISA/MasterCard/AmericanExpress
Subscriptionwillstartwiththenextavailableissue.YouwillreceivetheEnglishlanguageeditionunless you select the French - tick here
For customers in the USTurpin Distribution, The Bleachery, 143 West Street, New Milford, Connecticut 06776 USATel:(1)8004566323Fax:(1)8603500039Email:[email protected]
For customers in the rest of the worldTurpin Distribution Ltd., Stratton Business Park, Pegasus Drive, Biggleswade, Bedfordshire SG18 8QB, UKTel:(44)1767604960Fax:(44)1767601640E-mail:[email protected]
Payment details
Name
Telephone Fax
Address
Postcode, City and Country
TOTAL amount due
Card number Expiry date
Organisation
Position held
Signature
Date

BETTER POLICIES FOR BETTER LIVES
www.oecd-ilibrary.org
OECD’s global knowledge base

OECD Observer No 292 Q3 2012 37
0
500
1000
1500
2000
2500
Australia Germany Greece Korea Spain Sweden US OECD total0%
25%
50%
75%
100%
72.4 71.259.6 63.3 59.4
72.766.7 64.6
Hours worked 2008-2010 Employment rate, % of working age population, 2010
Fresh water concerns“We’re going to run out of water much much earlier than we’ll run out of oil,” warned Peter Brabeck-Letmathe, chairman of Nestlé, at the OECD Forum in May 2012. The projections in the OECD’s Environmental Outlook to 2050 certainly suggest that freshwater availability will be strained unless new action is taken. For instance, by 2050 some 2.3 billion more people than today (that’s a total of over 40% of the global population) are projected to be living in river basins experiencing severe water stress, with parts of Africa and Asia being particularly affected. Also, global water demand is projected to increase by some 55%, due to manufacturing (demand up 400%), electricity generation (+140%) and domestic use (+130%).
Moreover, there is little scope for increasing irrigation water under current baseline scenarios, while groundwater depletion will threaten agriculture and
urban water supplies. Pollution from wastewater and agriculture will worsen too, damaging biodiversity and well-being.
Though access to improved water sources (but not necessarily safe for consumption) should increase, more than 240 million people are expected to be without such access by 2050. Moreover, 1.4 billion people worldwide are projected to be
Productive hours“Work more to earn more” was former French president Nicolas Sarkozy’s refrain in his 2007 election campaign. But does working more hours mean the economy is better off? Not necessarily.
Take Greece, where the average number of hours worked per worker is among the highest in the OECD area, second to Korea (see chart). And while in Greece the number of hours worked has steadied since the crisis started, averaging 2,121 hours per worker per year in 2008–2010, in Germany each worker clocked up 1,412 hours per year in the same period, down from 1,431 hours in 2005–2007.
So, why is the Greek economy not doing better than the German one? There are a number of factors at play. For a start, the employment rate is higher in robust economies such as Germany and Sweden, at over 70% of the workforce, than in
Greece, where it has hovered at around 60% for a decade. Economic structure also counts, with some low skilled services jobs, in catering and tourism for instance, being labour intensive but less productive than, say, manufacturing technology where value-added is high. The trouble is, while productivity is much lower in Greece than
in Germany, wages are not correspondingly lower, which makes many Greek firms uncompetitive. In short, higher real output per hour worked is generally associated with lower annual hours per worker, so that working long hours is not enough for countries to earn more. See www.oecd.org/statistics
Population projected to be living in river basins under severe water stress in 2050
Hours worked per workerAverage annual working time and employment rate, selected countries
Source: OECD Employment and Labour Market Statistics
DATABANK
without access to basic sanitation. Only new policies can help improve this outlook, with greener infrastructure investment, sewage and wastewater management, better governance, and water pricing to encourage more efficient use.
OECD (2012), OECD Environmental Outlook to 2050: The Consequences of Inaction, OECD Publishing.
See www.oecd.org/water
Severitylevel(waterexploitationrate)
No (< 0.1) Medium (0.2 – 0.4) Low (0.1 – 0.2) Severe (> 0.4)
Source: OECD Environmental Outlook Baseline projections
http://dx.doi.org/10.1787/annual-work-table-2011-1-en

% change from: level:
previousperiod
currentperiod
previousyear
same periodlast year
DATABANK
Current balanceUnemployment rateInterest rate
Current balanceUnemployment rateInterest rate
Current balanceUnemployment rateInterest rate
Current balanceUnemployment rateInterest rate
Current balanceUnemployment rateInterest rate
Current balanceUnemployment rateInterest rate
Current balanceUnemployment rateInterest rate
Current balanceUnemployment rateInterest rate
Current balanceUnemployment rateInterest rate
Current balanceUnemployment rateInterest rate
Current balanceUnemployment rateInterest rate
Current balanceUnemployment rateInterest rate
Current balanceUnemployment rateInterest rate
Current balanceUnemployment rateInterest rate
Current balanceUnemployment rateInterest rate
Current balanceUnemployment rateInterest rate
Current balanceUnemployment rateInterest rate
Current balanceUnemployment rateInterest rate
Current balanceUnemployment rateInterest rate
Current balanceUnemployment rateInterest rate
Current balanceUnemployment rateInterest rate
Q1-2012 -4.1 -2.9Q1-2012 5.2 5.0Q1-2012 4.4 4.9
Q4-2011 1.5 3.0Q1-2012 4.1 4.3Q1-2012 1.0 1.1
Q4-2011 -0.9 0.0Q1-2012 7.3 7.1Q1-2012 1.0 1.1
Q4-2011 -2.4 -2.5Q1-2012 7.4 7.7Q1-2012 1.2 1.2
Q3-2011 -3.3 1.3Q1-2012 6.7 7.4Q1-2012 5.0 3.9
Q4-2011 -1.7 -3.5Q1-2012 6.7 6.9Q1-2012 1.2 1.2
Q4-2011 5.8 6.1Q1-2012 7.5 7.5Q1-2012 0.8 0.9
Q4-2011 3.3 3.5Q1-2012 10.8 13.6Q1-2012 1.0 1.1
Q1-2012 1.1 1.1Q1-2012 7.6 8.0Q1-2012 1.0 1.1
Q1-2012 -2.8 -2.5Q1-2012 10.1 9.6Q1-2012 1.0 1.1
Q1-2012 6.0 6.1Q1-2012 5.5 6.3Q1-2012 1.0 1.1
.. ..Q4-2011 20.4 14.1Q1-2012 1.0 1.1
Q4-2011 1.3 2.2Q1-2012 11.1 10.9Q1-2012 8.7 6.6
Q4-2011 -14.9 -17.4Q1-2012 6.8 7.8Q1-2012 4.8 4.0
Q4-2011 -0.5 1.6Q1-2012 14.5 14.2Q1-2012 1.0 1.1
Q4-2011 -1.2 1.1Q1-2012 6.9 6.0Q1-2012 2.5 2.4
Q4-2011 -1.7 -3.6Q1-2012 9.8 7.9Q1-2012 1.0 1.1
Q1-2012 1.5 3.0Q1-2012 4.5 4.8Q1-2012 0.3 0.3
Q4-2011 4.4 3.0Q1-2012 3.4 3.8Q1-2012 3.5 3.1
Q4-2011 16.0 4.5Q1-2012 5.2 4.7Q1-2012 1.0 1.1
Q4-2011 -1.2 -1.0Q1-2012 5.1 5.2Q1-2012 4.8 4.9
Australia Gross domestic product Industrial production Consumerpriceindex
Austria Gross domestic product Industrial production Consumerpriceindex
Belgium Gross domestic product Industrial production Consumerpriceindex
Canada Gross domestic product Industrial production Consumerpriceindex
Chile Gross domestic product Industrial production Consumerpriceindex
Czech Gross domestic product Republic Industrial production Consumerpriceindex
Denmark Gross domestic product Industrial production Consumerpriceindex
Estonia Gross domestic product Industrial production Consumerpriceindex
Finland Gross domestic product Industrial production Consumerpriceindex
France Gross domestic product Industrial production Consumerpriceindex
Germany Gross domestic product Industrial production Consumerpriceindex
Greece Gross domestic product Industrial production Consumerpriceindex
Hungary Gross domestic product Industrial production Consumerpriceindex
Iceland Gross domestic product Industrial production Consumerpriceindex
Ireland Gross domestic product Industrial production Consumerpriceindex
Israel Gross domestic product Industrial production Consumerpriceindex
Italy Gross domestic product Industrial production Consumerpriceindex
Japan Gross domestic product Industrial production Consumerpriceindex
Korea Gross domestic product Industrial production Consumerpriceindex
Luxembourg Grossdomesticproduct Industrial production Consumerpriceindex
Mexico Grossdomesticproduct Industrial production Consumerpriceindex
Q1-2012 1.3 4.3Q1-2012 0.8 4.7Q1-2012 0.1 1.6
Q1-2012 0.3 0.7Q1-2012 2.0 1.2Q1-2012 0.4 2.6
Q1-2012 0.3 0.5Q1-2011 2.2 10.8Q1-2012 1.4 3.6
Q1-2012 0.5 1.8Q1-2012 -0.1 0.8Q1-2012 0.5 2.3
Q1-2012 1.4 4.8Q4-2011 -0.7 1.3Q1-2012 0.9 4.1
Q1-2012 -0.8 -0.7Q1-2012 -0.8 0.7Q1-2012 2.4 3.7
Q1-2012 0.3 0.4Q1-2012 0.2 -0.4Q1-2012 1.3 2.8
Q1-2012 0.5 2.8Q1-2012 1.5 -1.7Q1-2012 1.4 4.4
Q1-2012 0.8 1.7Q1-2012 -2.7 -4.1Q1-2012 1.1 3.1
Q1-2012 0.0 0.3Q1-2012 -0.1 -1.4Q1-2012 0.6 2.3
Q1-2012 0.5 1.2Q1-2012 0.1 1.9Q1-2012 0.7 2.2
Q1-2011 0.2 -5.5Q1-2012 0.4 -8.7Q1-2012 -0.9 2.0
Q1-2012 -1.2 -1.4Q1-2012 -0.8 -1.5Q1-2012 3.3 5.6
Q1-2012 2.4 4.2Q4-2011 -3.9 16.0Q1-2012 1.6 6.4
Q4-2011 -0.2 1.0Q1-2012 -5.1 -3.0Q1-2012 0.3 2.2
Q1-2012 0.7 3.3Q1-2012 -2.7 -0.2Q1-2012 0.1 1.8
Q1-2012 -0.8 -1.4Q1-2012 -2.0 -5.2Q1-2012 0.9 3.3
Q1-2012 1.2 2.7Q1-2012 1.2 2.4Q1-2012 0.3 0.3
Q1-2012 0.9 2.9Q1-2012 2.2 2.9Q1-2012 1.0 3.0
Q4-2011 0.2 0.8Q1-2012 2.2 -7.0Q1-2012 0.6 2.9
Q1-2012 1.3 4.7Q1-2012 1.3 ..Q1-2012 1.8 3.9
38

level:
currentperiod
same periodlast year
Gross Domestic product: Volume series; seasonally adjusted. Leading Indicators: A composite indicator based on other indicators of economic activity, which signals cyclicalmovementsinindustrialproductionfromsixtoninemonthsinadvance.Consumer price Index:Measureschangesinaverageretailpricesofafixedbasketof goods and services. Current Balance: Billion US$; seasonally adjusted. unemployment Rate: % of civilian labour force, standardised unemployment rate; national definitionsforIceland,MexicoandTurkey;seasonallyadjustedapartfromTurkey.Interest Rate: Three months.
..=not available1Accession candidate to OECD 2 Enhanced engagement programmeSource: Main Economic Indicators, June 2012
Current balanceUnemployment rateInterest rate
Current balanceUnemployment rateInterest rate
Current balanceUnemployment rateInterest rate
Current balanceUnemployment rateInterest rate
Current balanceUnemployment rateInterest rate
Current balanceUnemployment rateInterest rate
Current balanceUnemployment rateInterest rate
Current balanceUnemployment rateInterest rate
Current balanceUnemployment rateInterest rate
Current balanceUnemployment rateInterest rate
Current balanceUnemployment rateInterest rate
Current balanceUnemployment rateInterest rate
Current balanceUnemployment rateInterest rate
Current balanceUnemployment rateInterest rate
Current balanceUnemployment rateInterest rate
Current balanceUnemployment rateInterest rate
Current balanceUnemployment rateInterest rate
Current balanceUnemployment rateInterest rate
Current balanceUnemployment rateInterest rate
Current balanceUnemployment rateInterest rate
Q1-2012 -0.2 -1.1Q1-2012 2.2 -0.9Q1-2012 0.5 2.4
Q4-2011 0.3 1.1Q4-2011 -2.1 -0.6Q1-2012 0.5 1.6
Q1-2012 1.4 4.1Q1-2012 2.5 2.7Q1-2012 0.5 0.8
Q1-2012 0.8 3.8Q1-2012 -0.6 6.1Q1-2012 1.6 4.0
Q1-2012 -0.1 -2.2Q1-2012 0.0 -5.6Q1-2012 0.9 3.4
Q1-2012 0.7 3.2Q1-2012 3.1 5.1Q1-2012 1.9 3.8
Q1-2012 0.2 -0.8Q1-2012 1.0 0.2Q1-2012 -0.1 2.5
Q1-2012 -0.3 -0.4Q1-2012 -1.1 -5.8Q1-2012 -0.6 2.0
Q1-2012 0.8 1.5Q1-2012 -0.7 -2.8Q1-2012 -0.2 1.8
Q1-2012 0.7 2.0Q4-2011 1.0 -1.4Q1-2012 -0.2 -0.9
Q4-2011 0.6 4.8Q1-2012 1.1 1.3Q1-2012 2.0 10.5
Q1-2012 -0.3 -0.1Q1-2012 -0.4 -3.0Q1-2012 0.1 3.5
Q1-2012 0.5 2.0Q1-2012 1.3 4.3Q1-2012 0.8 2.8
Q1-2012 0.0 -0.1Q1-2012 -0.4 -1.6Q3-2010 .. 1.7
Q1-2012 0.2 0.7Q1-2012 1.0 -4.0Q1-2012 1.4 5.8
.. .. .. ..Q1-2012 1.6 3.8
Q1-2012 1.3 5.7Q1-2012 1.6 0.5Q1-2012 0.7 7.2
Q1-2012 1.3 6.3 .. ..Q1-2012 1.3 3.7
Q4-2011 1.9 4.6Q1-2012 1.0 2.7Q1-2012 1.4 3.9
Q1-2012 0.7 2.1 .. ..Q1-2012 1.5 6.3
Q4-2011 12.0 8.4Q1-2012 5.0 4.3Q1-2012 1.0 1.1
Q4-2011 -4.0 -5.3Q1-2012 6.7 6.6 Q1-2012 2.7 3.0
.. ..Q1-2012 3.2 3.3Q1-2012 2.6 2.6
Q4-2011 -3.8 -5.2Q1-2012 9.9 9.4Q1-2012 5.0 4.1
Q4-2011 -3.1 -8.6Q1-2012 14.9 12.3Q1-2012 1.0 1.1
Q4-2011 2.7 -0.9Q1-2012 14.0 13.4Q1-2012 1.0 1.1
Q3-2011 -1.0 -0.6Q1-2012 8.7 8.1Q1-2012 1.0 1.1
Q4-2011 -2.4 -3.6Q1-2012 23.8 20.7Q1-2012 1.0 1.1
Q4-2011 6.6 7.2Q1-2012 7.5 7.7Q1-2012 1.5 1.7
Q4-2011 18.2 14.2Q4-2011 4.0 4.1Q1-2012 0.1 0.2
Q4-2011 -9.2 -8.5Q4-2011 8.3 9.9 .. ..
Q4-2011 -2.2 -3.8Q4-2011 8.3 7.7Q1-2012 1.1 0.8
Q4-2011 -3.2 -3.0Q1-2012 8.3 9.0Q1-2012 0.3 0.3
.. ..Q1-2012 10.9 9.9Q1-2012 1.0 1.1
.. .. .. .. .. ..
.. .. .. ..Q1-2012 5.6 4.6
.. .. .. .. .. ..
Q4-2011 -0.5 0.4 .. ..Q1-2012 6.5 6.9
Q4-2011 7.1 4.5 .. ..Q1-2012 7.3 4.6
.. .. .. ..Q1-2012 5.5 5.5
DATABANK
Non-members
Netherlands Gross domestic product Industrial production Consumerpriceindex
NewZealand Grossdomesticproduct Industrial production Consumerpriceindex
Norway Gross domestic product Industrial production Consumerpriceindex
Poland Gross domestic product Industrial production Consumerpriceindex
Portugal Gross domestic product Industrial production Consumerpriceindex
Slovak Gross domestic product Republic Industrial production Consumerpriceindex
Slovenia Gross domestic product Industrial production Consumerpriceindex
Spain Gross domestic product Industrial production Consumerpriceindex
Sweden Gross domestic product Industrial production Consumerpriceindex
Switzerland Gross domestic product Industrial production Consumerpriceindex
Turkey Gross domestic product Industrial production Consumerpriceindex
United Gross domestic product Kingdom Industrial production Consumerpriceindex
United Gross domestic product States Industrial production Consumerpriceindex
Euro area Gross domestic product Industrial production Consumerpriceindex
2Brazil Gross domestic product Industrial production Consumerpriceindex
2China Gross domestic product Industrial production Consumerpriceindex
2India Gross domestic product Industrial production Consumerpriceindex
2Indonesia Gross domestic product Industrial production Consumerpriceindex
1Russian Gross domestic product Federation Industrial production Consumerpriceindex
2South Gross domestic product Africa Industrial production Consumerpriceindex
% change from:
previousperiod
previousyear
OECD Observer No 292 Q3 2012 39

40
-1.0
0
1.0
2.0
3.0
4.0
5.0
6.0
7.0
2001 2002 2003 2004 2005 2006 2007 2008 2009 2010
Total Public
%
0
20
40
60
80
100
120
Australia Denmark UK US Spain Germany
Q2 2007 Q2 2011
Health spending slowsFor the first time in decades, health spending has not increased in real terms on average across OECD countries. According to figures published in the latest OECD health data 2012, the growth in health spending in 2010 slowed or turned negative in almost all OECD countries. Since the global economic crisis took hold in 2008, health spending has stalled in many OECD countries after years of continuous growth; and preliminary figures for some countries suggest that this slowdown continued in 2011.
The average growth rate in health spending of 0.0% in 2010 compares with 4.3% in 2009 and an annual average growth of 4.8% over the period 2000–2008, when health spending outpaced economic growth and accounted for an increasing share of GDP.
While government tended to maintain health spending in the immediate wake of the economic slowdown–even in some of the hardest-hit countries–cuts really began to take effect in 2010. Growth in public spending on health averaged -0.5% in 2010 compared with 5.1% in 2009. In a number of European countries,
Restart-up?Start-up rates in OECD countries are slowly edging back to their pre-crisis levels, but not all countries have seen significant acceleration in new businesses, according to Entrepreneurship at a Glance 2012.
New data on enterprise creations and bankruptcies show the major impact that the economic and financial crisis has had on entrepreneurial activity. Start-up rates fell sharply from mid-2008 in all OECD countries where data are available. Momentum slowed again in early-2011 in most countries but has since shown tentative signs of a pick-up.
France has shown the most spectacular increase in new businesses, due to introduction of a simplified start-up procedure or the régime de l’auto-entrepreneur. Australia and the UK have reported robust growth in business creation in late-2011 and Norway has grown steadily, but the number of newly created enterprises remains below its pre-crisis level in most countries surveyed.
The number of bankruptcy procedures, which increased considerably across the OECD area over the 2008–09 period, hovered above pre-crisis levels in most countries in 2011.
Men are more likely to run businesses with employees in every country studied.
Typically, around 2% of employed women own a business and employ others. The corresponding percentage for men is more than double that in most countries.
See www.oecd.org/statistics/entrepreneurshipindicators
Health expenditureReal annual average growth rates since 2000
New start upsNumber of new enterprises, 2006=100
Source: OECD Entrepreneurship at a Glance 2012
Source: OECD health data 2012
DATABANK
overall health spending reversed in 2010 as drastic measures to cut public spending were put in place. At the same time health spending still managed to grow by around 3% in the US, Canada and New Zealand but by more than 8% in Korea.
See www.oecd.org/health
Formorecountries,seehttp://dx.doi.org/10.1787/888932596669

!" #$ % & ' ( $ )* % )+,-!.-! $# " ' / ' % ) 0 "1 #2") # ' ( $)* % )+
1.", % $ & % 1 "3 ' 4 % ) $ ), % $ & ' 1 "! 0 % , "1 ' / ' % ) 1 5! $),".! % 0$# " ' ( $ )* % )+ 6
+ &-($ & ' % ) 0 "1 #2") # '2 $)$+"2") # ' / ' 1 "!0 % , "1
-)" ' ($)* 78 8 '2 % & & % -) ' , & % ") #1 7-)" ' # " $2 ' 1. % ! % #7
!"#$%&%' (%)%*+,%' $-' +.&/"*$-%0' +)0' *%1.,+&%0' 23' &/%' 4*%)#/' 5.&"*$&6' 0%' 7")&*8,%' 9*.0%)&$%,' +)0' 5.&"*$&6' 0%-' :+*#/6-' 4$)+)#$%*-;' </$-' =+&%*$+,' /+-' 2%%)' >*%>+*%0'-",%,3' ?"*' $)?"*=+&$")' >.*>"-%-' +)0' 0"%-' )"&' #")-&$&.&%' +)' "? ?%*' &"' %)&%*' $)&"' +' #")&*+#&;' @"&' +,,' >*"0.#&-' +)0' -%*A$#%-' "? ?%*%0' 23' !"#$%&%' (%)%*+,%' +*%' +A+$,+2,%'$)' +,,' B.*$-0$#&$")-;' 9,%+-%' #")&+#&' 3".*' ,"#+,' "? ? $#%' ?"*' +)3' ?.* &/%*' $)?"*=+&$");' ' C' DEFF' !"#$%&%' (%)%*+,%' (*".>' +)0' $&-' +? ? $ , $+&%-' C' (%&&3G=+1%-' H' 4IJKL45IGK
!"#$%&'()*+(",
!"#$%&'()**+++! ,%-""-""+++"#.#,