Career Records - Amazon S3 · 2018. 11. 6. · Career Records - Amazon S3 ... 6

OEA Report 19‐04
Copyright © 2019 University of Washington Office of Educational Assessment http://uw.edu/assessment/reports
Assessing Undergraduate Writing and Composition Learning Outcomes
Using SERU 2019 Survey Data Jillian Morn, Research Scientist December 2019
EXECUTIVE SUMMARY This report summarizes the results of 4 existing questions and 1 new question on writing and composition learning outcomes from the SERU 2019 survey of undergraduates at the University of Washington. 15.6% of undergraduates gave a partial or complete response. 2,718 to 2,802 students responded to the 5 questions identified. Overall, undergraduate students reported that their writing and reading proficiency improved from when they started on this campus compared to now. 64% of respondents said their writing proficiency was good to excellent when they started at UW, compared to 87% now. 58% of respondents said their reading proficiency was good to excellent when they started at UW, compared to 89% now. Among respondents who indicated they had taken General Education courses, 79% somewhat to strongly agreed that the courses helped develop effective writing skills. Responses varied by student level, entrance type, gender, and race/ethnicity of respondents. Seniors reported the highest average difference in their proficiency levels from when they started compared to now for both reading and writing proficiencies. Seniors were also more likely than other levels of students to disagree with the statement that general education coursework helped them develop effective writing skills. Transfer students reported higher reading and writing proficiency ratings compared to students who entered as first time first year students. 21% of transfer student respondents indicated they had not taken the general education courses at UW, compared to 3% of first time first year students. International students and Hispanic students reported the highest average increase in reading and writing proficiency ratings. Pacific Islander and International students were more likely than students of other races or ethnicities to agree with the statement that general education coursework helped them develop effective writing skills.
INTRODUCTION
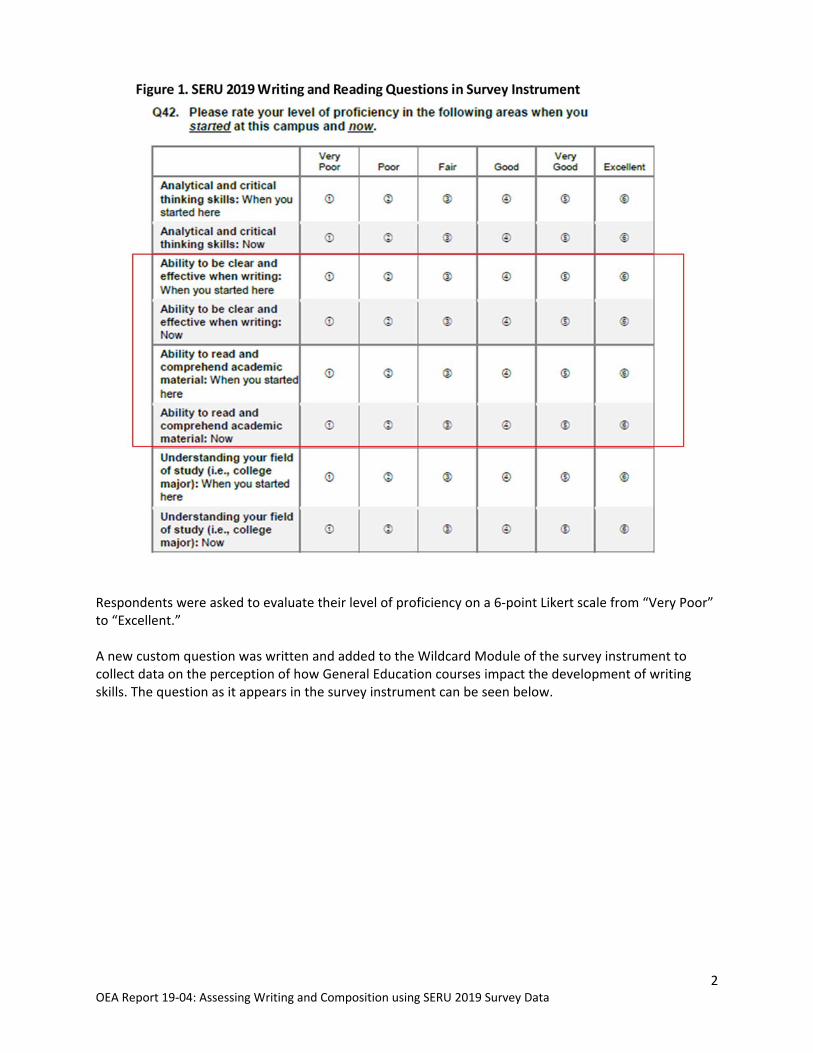
This report provides results of the SERU 2019 survey of University of Washington. Specifically, this report summarizes the results of five SERU questions identified by the UW Task Force on Writing and Composition and the Office of Educational Assessment related to writing and composition requirements for undergraduate students. Prior to survey launch, OEA and the Task Force identified two sets of preexisting survey questions that could be used to examine student perception of writing and composition skill development. These questions ask respondents to rate their level of proficiency in specific areas when they started at this campus and to rate their level of proficiency now. The first set of questions ask about being clear and effective when writing and the second set of questions ask about the ability to read and comprehend academic material. The questions as they appear in the survey instrument can be seen below.
2 OEA Report 19‐04: Assessing Writing and Composition using SERU 2019 Survey Data
Respondents were asked to evaluate their level of proficiency on a 6‐point Likert scale from “Very Poor” to “Excellent.” A new custom question was written and added to the Wildcard Module of the survey instrument to collect data on the perception of how General Education courses impact the development of writing skills. The question as it appears in the survey instrument can be seen below.

3 OEA Report 19‐04: Assessing Writing and Composition using SERU 2019 Survey Data
Respondents were asked to select their level of agreement with the statement on a 6‐point Likert scale. A seventh response option of “No courses taken” was provided as well.
METHOD Population The original population selected for the survey sample included all undergraduate students enrolled at the Seattle campus on the tenth day of winter quarter 2019. Students under the age of 18 at the start of the survey, visiting and exchange students, university employees enrolled using a faculty or staff exemption, and those with no email address on file were excluded from the population. The final population included N=29,688 students. Students were recruited to participate through targeted emails, physical ads displayed on campus, and digital ads in online spaces like MyUW.

4 OEA Report 19‐04: Assessing Writing and Composition using SERU 2019 Survey Data
Response Rate The survey went out on April 1, 2019. The survey closed on May 10, 2019 with 5,349 interactions. Of the 5,349 interactions, 679 individuals reached the consent page and did not consent or decline to participate, 14 respondents formally declined to participate, 1,864 respondents consented and provided a partial survey response, and 2,792 respondents consented and provided a complete survey response. Of the 4,656 partial and complete responses, 4 were graduate students and 8 were students who were under the age of 18 who must be excluded from analysis. Thus, the qualified total response rate for SERU 2019 was 4,644/29,688, or 15.6%. The table below shows the response counts and rates for each of the writing and composition questions identified. Table 1. SERU 2019 Responses Rates for Writing and Composition Questions
Question Count of Responses
Question Response Rate
Clear and effective writing when started 2,800 60.3%
Clear and effective writing now 2,802 60.3%
Read and comprehend academic material when you started 2,798 60.2%
Read and comprehend academic material now 2,791 60.1%
GenEd coursework helped develop effective writing skills 2,718 58.5%
The four preexisting questions appear near the end of the survey, in Question 42 of 76 Core Survey questions. The fifth new question appears in the very last section of the survey in the Wildcard Module. Question location in the survey may explain the low and declining response rates among respondents.
RESULTS “Ability to be clear and effective when writing” On a 6‐point Likert scale, with 1 being “Very Poor” and 6 being “Excellent”, respondents gave an average rating of 3.86 when they started compared to an average rating of 4.51 now on their ability to be clear and effective when writing. 64% of respondents rated their writing proficiency at good to excellent when they started at UW. 87% of respondents rated their writing proficiency at good to excellent now.
2,799 respondents provided a rating for both questions. A paired t‐test shows that the average difference in the rating for clear and effective writing proficiency when they started and now was significantly different at p<0.001, with a mean difference of 0.65. 53% of those who provided a rating for both when they started and now indicated their level
Table 2. SERU 2019 Responses Writing
N % N %
Very Poor (1) 52 2% 16 1%
Poor (2) 185 7% 43 2%
Fair (3) 770 28% 300 11%
Good (4) 1,051 38% 986 35%
Very Good (5) 586 21% 1,062 38%
Excellent (6) 156 6% 395 14%
N
Mean Rating
p The difference in mean rating for clear and effective
writing abil ity when you started and now is significant at
p<0.001
3.86
2,802
4.51p
Ability to be clear and effective when writing:
When you started Now
2,800

5 OEA Report 19‐04: Assessing Writing and Composition using SERU 2019 Survey Data
of writing proficiency increased overtime (N=1,480). 41% indicated there was no change in their writing proficiency (N=1,159). And 6% indicated their level of writing proficiency decreased over time (N=160). Figure 3.
Mean ratings of writing proficiency when they started and now varied by student level, entrance type, gender, and race/ethnicity.
Table 3. SERU 2019 Ability to be clear and effective when writing, Mean ratings
Mean Rating
When you started
Mean Rating
Now Difference
By Class
First‐year 3.78 4.29 0.52 *** 227
Sophomore 3.89 4.34 0.45 *** 614
Junior 3.93 4.49 0.57 *** 853
Senior 3.80 4.65 0.85 *** 1105
By Entry Type
FTFY 3.82 4.48 0.65 *** 2,325
Transfer 4.02 4.65 0.63 *** 474
By Gender
Men 3.75 4.41 0.67 *** 1,007
Women 3.92 4.56 0.64 *** 1,790
By Ethnicity
African American 3.78 4.47 0.70 *** 76
American Indian/Alaska Native 4.23 4.60 0.37 ** 35
White 4.12 4.72 0.60 *** 1,102
Hispanic/Latino 3.79 4.57 0.78 *** 261
Asian 3.71 4.37 0.63 *** 996
Hawaiian/Pacific Islander 3.71 4.35 0.65 ** 34
Other/Unknown 4.38 4.38 0.00 21
International 3.28 4.13 0.85 *** 274
Total who
answered both
***Overall
N 2,802
4.51
2,800
3.86
2,799
0.65
Note: 3 alphas for statistical significance of paired t‐tests are denoted in this table: * p<0.05, **p<0.01 *** p<0.001.
6 OEA Report 19‐04: Assessing Writing and Composition using SERU 2019 Survey Data
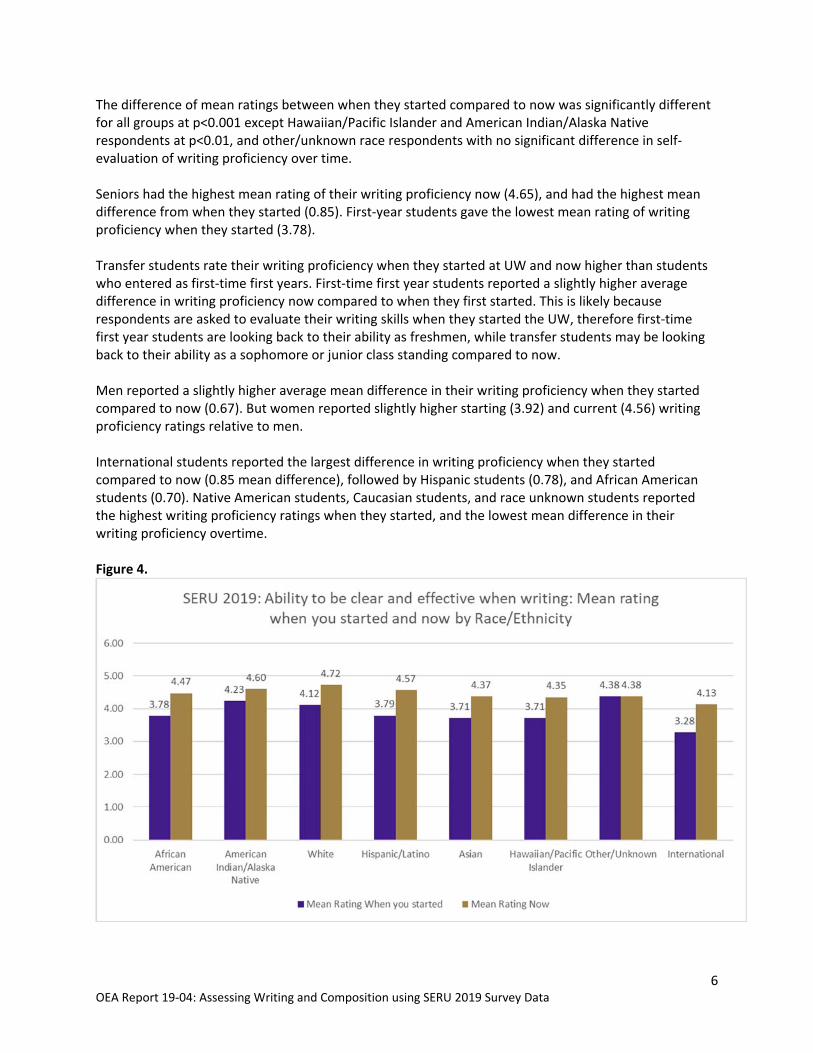
The difference of mean ratings between when they started compared to now was significantly different for all groups at p<0.001 except Hawaiian/Pacific Islander and American Indian/Alaska Native respondents at p<0.01, and other/unknown race respondents with no significant difference in self‐evaluation of writing proficiency over time. Seniors had the highest mean rating of their writing proficiency now (4.65), and had the highest mean difference from when they started (0.85). First‐year students gave the lowest mean rating of writing proficiency when they started (3.78). Transfer students rate their writing proficiency when they started at UW and now higher than students who entered as first‐time first years. First‐time first year students reported a slightly higher average difference in writing proficiency now compared to when they first started. This is likely because respondents are asked to evaluate their writing skills when they started the UW, therefore first‐time first year students are looking back to their ability as freshmen, while transfer students may be looking back to their ability as a sophomore or junior class standing compared to now. Men reported a slightly higher average mean difference in their writing proficiency when they started compared to now (0.67). But women reported slightly higher starting (3.92) and current (4.56) writing proficiency ratings relative to men. International students reported the largest difference in writing proficiency when they started compared to now (0.85 mean difference), followed by Hispanic students (0.78), and African American students (0.70). Native American students, Caucasian students, and race unknown students reported the highest writing proficiency ratings when they started, and the lowest mean difference in their writing proficiency overtime. Figure 4.

7 OEA Report 19‐04: Assessing Writing and Composition using SERU 2019 Survey Data
“Ability to read and comprehend academic material” On a 6‐point Likert scale, with 1 being “Very Poor” and 6 being “Excellent”, respondents gave an average rating of 3.71 when they started compared to 4.53 now on their ability to read and comprehend academic material. 58% of respondents rated their reading proficiency at good to excellent when they started at UW. 89% of respondents rated their reading proficiency at good to excellent now.
2,787 respondents provided a rating for both questions. A paired t‐test shows that the average difference in the rating for reading and comprehending academic material proficiency when they started and now was significantly different at p<0.001, with a mean difference of 0.82. 60% of those who provided a rating for both when they started and now indicated their level of reading proficiency increased over time (N=1,676). 36% indicated there was no change in their reading proficiency (N=1,012). And 4% indicated their level of reading proficiency decreased over time (N=99). Figure 5.
Mean ratings of reading proficiency when they started and now varied by student level, entrance type, gender, and race/ethnicity.
Table 4. SERU 2019 Responses Reading
N % N %
Very Poor (1) 59 2% 13 0%
Poor (2) 231 8% 34 1%
Fair (3) 893 32% 248 9%
Good (4) 1,033 37% 1,032 37%
Very Good (5) 448 16% 1,105 40%
Excellent (6) 134 5% 359 13%
N
Mean Rating
p The difference in mean rating for reading and
comprehending academic material when you started and
now is significant at p<0.001
Ability to read and comprehend academic material:
When you started Now
2,798 2,791
3.71 4.53p
8 OEA Report 19‐04: Assessing Writing and Composition using SERU 2019 Survey Data
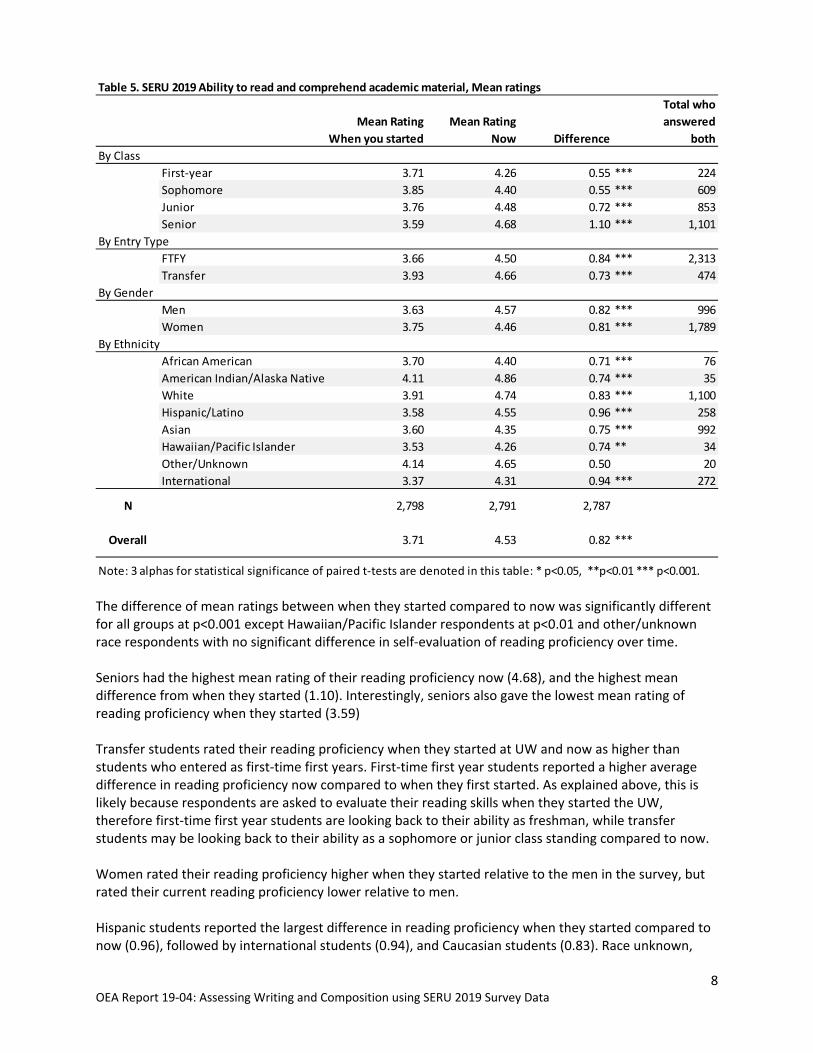
The difference of mean ratings between when they started compared to now was significantly different for all groups at p<0.001 except Hawaiian/Pacific Islander respondents at p<0.01 and other/unknown race respondents with no significant difference in self‐evaluation of reading proficiency over time. Seniors had the highest mean rating of their reading proficiency now (4.68), and the highest mean difference from when they started (1.10). Interestingly, seniors also gave the lowest mean rating of reading proficiency when they started (3.59) Transfer students rated their reading proficiency when they started at UW and now as higher than students who entered as first‐time first years. First‐time first year students reported a higher average difference in reading proficiency now compared to when they first started. As explained above, this is likely because respondents are asked to evaluate their reading skills when they started the UW, therefore first‐time first year students are looking back to their ability as freshman, while transfer students may be looking back to their ability as a sophomore or junior class standing compared to now. Women rated their reading proficiency higher when they started relative to the men in the survey, but rated their current reading proficiency lower relative to men. Hispanic students reported the largest difference in reading proficiency when they started compared to now (0.96), followed by international students (0.94), and Caucasian students (0.83). Race unknown,
Table 5. SERU 2019 Ability to read and comprehend academic material, Mean ratings
Mean Rating
When you started
Mean Rating
Now Difference
Total who
answered
both
By Class
First‐year 3.71 4.26 0.55 *** 224
Sophomore 3.85 4.40 0.55 *** 609
Junior 3.76 4.48 0.72 *** 853
Senior 3.59 4.68 1.10 *** 1,101
By Entry Type
FTFY 3.66 4.50 0.84 *** 2,313
Transfer 3.93 4.66 0.73 *** 474
By Gender
Men 3.63 4.57 0.82 *** 996
Women 3.75 4.46 0.81 *** 1,789
By Ethnicity
African American 3.70 4.40 0.71 *** 76
American Indian/Alaska Native 4.11 4.86 0.74 *** 35
White 3.91 4.74 0.83 *** 1,100
Hispanic/Latino 3.58 4.55 0.96 *** 258
Asian 3.60 4.35 0.75 *** 992
Hawaiian/Pacific Islander 3.53 4.26 0.74 ** 34
Other/Unknown 4.14 4.65 0.50 20
International 3.37 4.31 0.94 *** 272
Note: 3 alphas for statistical significance of paired t‐tests are denoted in this table: * p<0.05, **p<0.01 *** p<0.001.
***Overall 3.71 4.53 0.82
N 2,798 2,791 2,787

9 OEA Report 19‐04: Assessing Writing and Composition using SERU 2019 Survey Data
Native American, and Caucasian students reported the highest writing proficiency level when they started and now. Figure 6.
“My GE coursework helped me develop effective writing skills for my UW courses” On a 6‐point Likert scale, with 1 being “Strongly Disagree” and 6 being “Strongly Agree”, respondents gave an average rating of 4.26 on their agreement that General Education coursework helped them develop effective writing skills. Among the 2,547 respondents who indicated they had taken General Education courses, 79% somewhat to strongly agreed that the courses helped develop effective writing skills. Levels of agreement varied by student level, entrance type, gender, and race/ethnicity.
N %
Strongly Disagree (1) 79 3%
Disagree (2) 145 5%
Somewhat Disagree (3) 318 12%
Somewhat Agree (4) 815 30%
Agree (5) 863 32%
Strongly Agree (6) 327 12%
No Courses Taken 171 6%
N 2,718
Mean Rating* 4.26
My GE coursework helped me develop effective
writing skills for my UW courses:
Table 6. SERU 2019 Responses GenEd Courses Writing
*Mean rating excludes those who selected
No Courses Taken

10 OEA Report 19‐04: Assessing Writing and Composition using SERU 2019 Survey Data
Sophomores had the highest mean rating of agreement (4.46), while seniors had the lowest mean rating or agreement (4.14). Juniors had the highest percent of class (9%) and absolute value of students (72) who indicated they had not taken relevant General Education courses yet. 83% of first‐years, 81% of sophomores, 71% of juniors, and 70% of seniors somewhat to strongly agree that general education coursework helped them develop writing skills for UW courses. Figure 7.
Table 7. SERU 2019 General Education courses for writing skills, Mean ratings
Mean
Rating Total
By Class
First‐year 4.41 5 2% 8 4% 17 8% 76 35% 74 34% 30 14% 8 4% 218
Sophomore 4.46 7 1% 24 4% 57 10% 176 29% 232 39% 79 13% 23 4% 598
Junior 4.24 29 4% 34 4% 106 13% 244 30% 236 29% 103 13% 72 9% 824
Senior 4.14 38 4% 79 7% 138 13% 319 30% 321 30% 115 11% 68 6% 1078
By Entry Type
FTFY 4.25 65 3% 127 6% 277 12% 714 32% 734 32% 269 12% 73 3% 2259
Transfer 4.35 14 3% 18 4% 41 9% 101 22% 129 28% 58 13% 98 21% 459
By Gender
Men 4.20 41 4% 56 6% 112 11% 292 30% 307 31% 110 11% 68 7% 986
Women 4.30 38 2% 89 5% 206 12% 522 30% 556 32% 217 13% 102 6% 1730
By Ethnicity
African American 4.21 3 4% 3 4% 7 9% 24 32% 26 35% 5 7% 6 8% 74
American Indian/Alaska Native 4.48 1 3% 1 3% 3 9% 11 33% 7 21% 8 24% 2 6% 33
White 4.19 36 3% 71 7% 124 12% 308 29% 331 31% 116 11% 85 8% 1071
Hispanic/Latino 4.35 7 3% 10 4% 30 12% 71 29% 75 30% 39 16% 16 6% 248
Asian 4.23 27 3% 56 6% 113 12% 316 32% 315 32% 103 11% 45 5% 975
Hawaiian/Pacific Islander 4.40 1 3% 1 3% 2 6% 11 33% 11 33% 4 12% 3 9% 33
Other/Unknown 4.24 0 0% 1 5% 5 26% 4 21% 3 16% 4 21% 2 11% 19
International 4.50 4 2% 2 1% 34 13% 70 26% 95 36% 48 18% 12 5% 265
17112%32%30%12%318 815 863 327
Somewhat
Disagree
Somewhat
Agree Agree
Strongly
Agree
No Courses
Taken
27186%5%Overall 4.26 3%
Strongly
Disagree Disagree
79 145
11 OEA Report 19‐04: Assessing Writing and Composition using SERU 2019 Survey Data
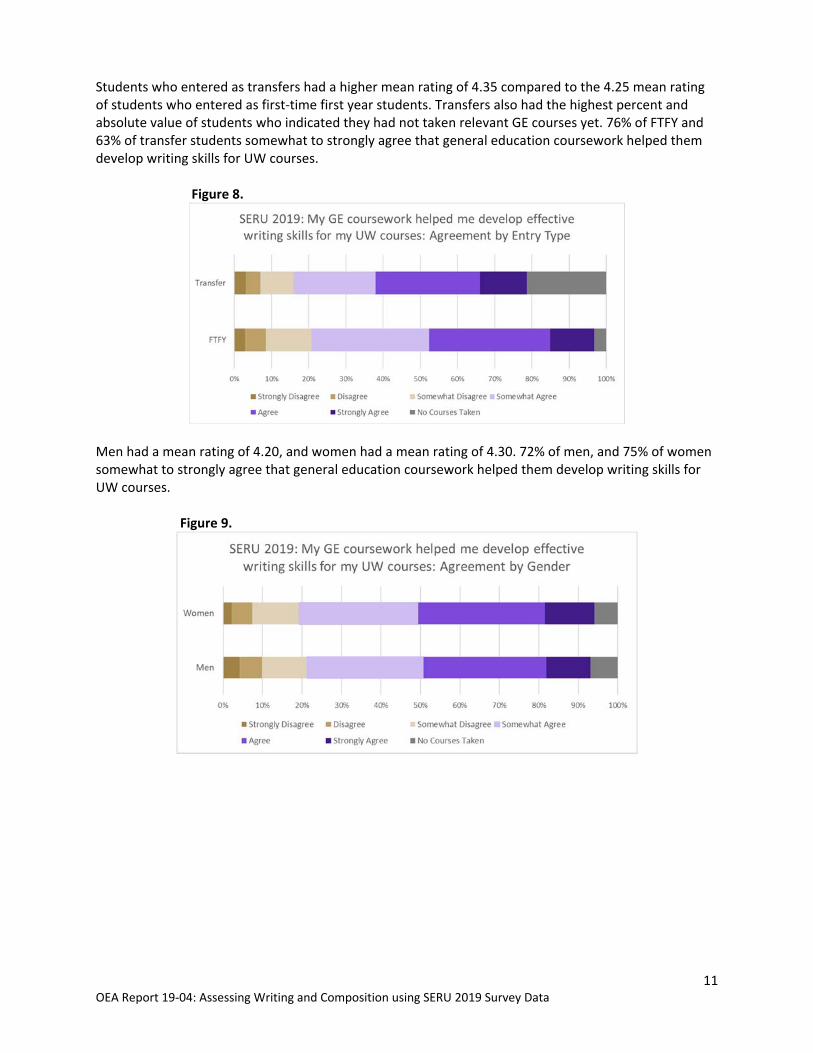
Students who entered as transfers had a higher mean rating of 4.35 compared to the 4.25 mean rating of students who entered as first‐time first year students. Transfers also had the highest percent and absolute value of students who indicated they had not taken relevant GE courses yet. 76% of FTFY and 63% of transfer students somewhat to strongly agree that general education coursework helped them develop writing skills for UW courses. Figure 8.
Men had a mean rating of 4.20, and women had a mean rating of 4.30. 72% of men, and 75% of women somewhat to strongly agree that general education coursework helped them develop writing skills for UW courses. Figure 9.

12 OEA Report 19‐04: Assessing Writing and Composition using SERU 2019 Survey Data
White students had the lowest mean rating of 4.19. International students had the highest mean rating of 4.50. 80% of International, 79% of Pacific Islander, 79% of Native American, 75.3% of Asian, 75% of Hispanic, 74% of African American, 71% of white, and 58% of Other/Unknown students somewhat to strongly agree that general education coursework helped them develop writing skills for UW courses. Figure 10.