October Reserve Bank of India Bulletin 2004 Financial ...
27
851 October Reserve Bank of India Bulletin 2004 851 Financial Sector Reforms in India: Policies and Performance Analysis * RAKESH MOHAN I. INTRODUCTION As the economy grows and becomes more sophisticated, the banking sector has to develop pari pasu in a manner that it supports and stimulates such growth. With increasing global integration, the Indian banking system and financial system has as a whole had to be strengthened so as to be able to compete. India has had more than a decade of financial sector reforms during which there has been substantial transformation and liberalisation of the whole financial system. It is, therefore, an appropriate time to take stock and assess the efficacy of our approach. It is useful to evaluate how the financial system has performed in an objective quantitative manner. This is important because India’s path of reforms has been different from most other emerging market economies: it has been a measured, gradual, cautious, and steady process, devoid of many flourishes that could be observed in other countries. Until the beginning of the 1990s, the state of the financial sector in India could be described as a classic example of “financial repression” a la MacKinnon and Shaw. The sector was characterised, inter alia , by administered interest rates, large pre-emption of resources by the authorities and extensive micro-regulations directing the major portion of the flow of funds to and from financial intermediaries. While the true health of financial intermediaries, most of them public sector entities, was masked by relatively opaque accounting norms and limited disclosure, there were general concerns about their viability. Insurance companies – both life and non-life - were all publicly owned and offered very little product choice. In the securities market, new equity issues were governed by a plethora of complex regulations and extensive restrictions. There was very little transparency and depth in the secondary market trading of such * Expanded version of lectures by Dr. Rakesh Mohan, Deputy Governor, Reserve Bank of India at the International Monetary Fund, Washington D.C on September 2, 2004 and at a seminar ‘Global Banking: Paradigm Shift’ organised by the Federation of Indian Chambers of Commerce and Industries, Bangalore on September 16, 2004. He would like to acknowledge the assistance of Sujan Hajra and Partha Ray in the preparation of this paper. securities. Interest rates on government securities, the predominant segment of fixed-income securities, were decided through administered fiat. The market for such securities was a captive one where the players were mainly financial intermediaries, who had to invest in government securities to fulfill high statutory reserve requirements. There was little depth in the foreign exchange market as most such transactions were governed by inflexible and low limits and also prior approval requirements. Compartmentalisation of activities of different types of financial intermediaries eliminated the scope for competition among existing financial intermediaries. In addition, strong entry barriers thwarted competition from new entrants. The end result was low levels of competition, efficiency and productivity in the financial sector, on the one hand, and severe credit constraints for the productive entities, on the other, especially for those in the private sector. The other major drawback of this regime was the scant attention that was placed on the financial health of the intermediaries. Their capitalisation levels were low. The lack of commercial considerations in credit planning and weak recovery culture resulted in large accumulation of non-performing loans. This had no impact on the confidence of depositors, however, because of government ownership of banks and financial intermediaries. The predominance of Government securities in the fixed-income securities market of India mainly reflects the captive nature of this market as most financial intermediaries need to invest a sizeable portion of funds mobilised by them in such securities. While such norms were originally devised as a prudential measure, during certain periods, such statutory norms pre-empted increasing proportions of financial resources from intermediaries to finance high Government borrowings.
Transcript of October Reserve Bank of India Bulletin 2004 Financial ...

851
October Reserve Bank of India Bulletin 2004
851
Financial Sector Reforms in India:Policies and Performance Analysis*
RAKESH MOHAN
I. INTRODUCTION
As the economy grows and becomes moresophisticated, the banking sector has to develop pari pasuin a manner that it supports and stimulates such growth.With increasing global integration, the Indian bankingsystem and financial system has as a whole had to bestrengthened so as to be able to compete. India has hadmore than a decade of financial sector reforms duringwhich there has been substantial transformation andliberalisation of the whole financial system. It is, therefore,an appropriate time to take stock and assess the efficacyof our approach. It is useful to evaluate how the financialsystem has performed in an objective quantitative manner.This is important because India’s path of reforms has beendifferent from most other emerging market economies: ithas been a measured, gradual, cautious, and steadyprocess, devoid of many flourishes that could be observedin other countries.
Until the beginning of the 1990s, the state of thefinancial sector in India could be described as a classicexample of “financial repression” a la MacKinnon andShaw. The sector was characterised, inter alia, byadministered interest rates, large pre-emption of resourcesby the authorities and extensive micro-regulationsdirecting the major portion of the flow of funds to andfrom financial intermediaries. While the true health offinancial intermediaries, most of them public sectorentities, was masked by relatively opaque accountingnorms and limited disclosure, there were general concernsabout their viability. Insurance companies – both life andnon-life - were all publicly owned and offered very littleproduct choice. In the securities market, new equity issueswere governed by a plethora of complex regulations andextensive restrictions. There was very little transparencyand depth in the secondary market trading of such
* Expanded version of lectures by Dr. Rakesh Mohan, Deputy Governor, Reserve Bank of India at the International MonetaryFund, Washington D.C on September 2, 2004 and at a seminar ‘Global Banking: Paradigm Shift’ organised by the Federationof Indian Chambers of Commerce and Industries, Bangalore on September 16, 2004. He would like to acknowledge theassistance of Sujan Hajra and Partha Ray in the preparation of this paper.
securities. Interest rates on government securities, thepredominant segment of fixed-income securities, weredecided through administered fiat. The market for suchsecurities was a captive one where the players weremainly financial intermediaries, who had to invest ingovernment securities to fulfill high statutory reserverequirements. There was little depth in the foreignexchange market as most such transactions were governedby inflexible and low limits and also prior approvalrequirements.
Compartmentalisation of activities of different typesof financial intermediaries eliminated the scope forcompetition among existing financial intermediaries. Inaddition, strong entry barriers thwarted competition fromnew entrants. The end result was low levels ofcompetition, efficiency and productivity in the financialsector, on the one hand, and severe credit constraints forthe productive entities, on the other, especially for thosein the private sector. The other major drawback of thisregime was the scant attention that was placed on thefinancial health of the intermediaries. Their capitalisationlevels were low. The lack of commercial considerationsin credit planning and weak recovery culture resulted inlarge accumulation of non-performing loans. This had noimpact on the confidence of depositors, however, becauseof government ownership of banks and financialintermediaries.
The predominance of Government securities in thefixed-income securities market of India mainly reflectsthe captive nature of this market as most financialintermediaries need to invest a sizeable portion of fundsmobilised by them in such securities. While such normswere originally devised as a prudential measure, duringcertain periods, such statutory norms pre-emptedincreasing proportions of financial resources fromintermediaries to finance high Government borrowings.

852
October Reserve Bank of India Bulletin 2004
852
The interest rate on Government debt was administeredand the rate of interest charged by the Reserve Bank ofIndia (RBI) for financing Government deficit wasconcessional. On top of this, there were limited externalcapital flows. Such a closed-economy set-up kept debtmarkets underdeveloped and devoid of any competitiveforces. In addition, there was hardly any secondarymarket for Government securities, and such transactionswere highly opaque and operated through over-the-telephone deals. The provision of fiscal accommodationthrough ad hoc treasury bills led to high levels ofmonetisation of fiscal deficit during the major part ofthe 1980s.
The phase of nationalisation and ‘social control’ offinancial intermediaries, however, was not withoutconsiderable positive implications as well. The sharpincrease in rural branches of banks increased depositand savings growth considerably. There was a markedrise in credit flow towards economically important buthitherto neglected activities, most notably agriculture andsmall-scale industries. The urban-bias and markedpreference of banks to lend to the industrial sector,especially large industrial houses, was contained. Theimplicit guarantee emanating from public ownershipcreated an impression of infallibility of these institutionsand the expectation was self-fulfilling – there was nomajor episode of failure of financial intermediaries inthis period.
Starting from such a position, it is widely recognisedthat the Indian financial sector over the last decade hasbeen transformed into a reasonably sophisticated, diverseand resilient system. However, this transformation hasbeen the culmination of extensive, well-sequenced andcoordinated policy measures aimed at making the Indianfinancial sector efficient, competitive and stable.
The main objectives, therefore, of the financial sectorreform process in India initiated in the early 1990s havebeen to :
l Remove financial repression that existed earlier;l Create an efficient, productive and profitable
financial sector industry;l Enable price discovery, particularly, by the market
determination of interest rates that then helps inefficient allocation of resources;
l Provide operational and functional autonomy toinstitutions;
l Prepare the financial system for increasinginternational competition;
l Open the external sector in a calibrated fashion;
l Promote the maintenance of financial stabilityeven in the face of domestic and externalshocks.
Since there is a rich array of literature analysing theanthology of the reform process per se, the story of policyreforms in the India financial sector since the early 1990sis quite well known.1 What is less probed, however, isthe outcome. In fact, from the vantage point of 2004,one of the successes of the Indian financial sector reformhas been the maintenance of financial stability andavoidance of any major financial crisis during the reformperiod - a period that has been turbulent for the financialsector in most emerging market countries. The domainof analysis of the paper is, however, somewhat limited.Specifically, this paper limits itself to the impact analysisof financial sector reforms in the areas where the ReserveBank of India has had a dominant role. These includethe banking sector, foreign exchange and governmentsecurities markets and also the conduct of monetarypolicy.
The rest of the paper is organised as follows. SectionII provides the rationale of financial sector reforms inIndia. While policy reforms in the financial sector aredealt with in section III, section IV is devoted to reformsin the monetary policy framework. Against this briefchronicle of the financial sector reforms process, I shalllook into the outcomes of the financial sector reformprocess in section V in some detail. Instead of presentingany concluding observations, I shall raise some issues inthe last section.
II. FINANCIAL SECTOR REFORMS: THE APPROACH
The initiation of financial reforms in the countryduring the early 1990s was to a large extent conditionedby the analysis and recommendations of variousCommittees/Working Groups set-up to address specificissues. The process has been marked by ‘gradualism’with measures being undertaken after extensiveconsultations with experts and market participants.From the beginning of financial reforms, India hasresolved to attain standards of international best
1 See, for example, Hanson and Kathuria (1999) and Reddy (2002a).

853
October Reserve Bank of India Bulletin 2004
853
practices but to fine tune the process keeping in viewthe underlying institutional and operationalconsiderations (Reddy, 2002 a). Reform measuresintroduced across sectors as well as within each sectorwere planned in such a way so as to reinforce eachother. Attempts were made to simultaneously strengthenthe institutional framework while enhancing the scopefor commercial decision making and market forces inan increasingly competitive framework. At the sametime, the process did not lose sight of the socialresponsibilities of the financial sector. However, forfulf i l l ing such objectives, rather than usingadministrative fiat or coercion, attempts were made toprovide operational flexibility and incentives so thatthe desired ends are attended through broad interplayof market forces.
The major aim of the reforms in the early phase ofreforms, known as first generation of reforms, was tocreate an efficient, productive and profitable financialservice industry operating within the environment ofoperating flexibility and functional autonomy. Whilethese reforms were being implemented, the worldeconomy also witnessed significant changes, ‘coincidingwith the movement towards global integration offinancial services’ [Government of India (GoI), 1998].The focus of the second phase of financial sector reformsstarting from the second-half of the 1990s, therefore,has been the strengthening of the financial system andintroduction of structural improvements.
Two brief points need to be mentioned here. First,financial reforms in the early 1990s were preceded bymeasures aimed at lessening the extent of financialrepression. However, unlike in the latter period, theearlier efforts were not part of a well-thought out andcomprehensive agenda for extensive reforms. Second,financial sector reform in India was an importantcomponent of the comprehensive economic reformprocess initiated in the early 1990s. Whereas economicreforms in India were also initiated following an externalsector crisis, unlike many other emerging marketeconomies where economic reforms were driven by crisisfollowed by a boom-bust pattern of policy liberalisation,in India, reforms followed a consensus driven patternof sequenced liberalisation across the sectors (Ahluwalia,2002). That is why despite several changes ingovernment there has not been any reversal of directionin the financial sector reform process over the last 15years.
As pointed out by Governor Reddy (Reddy, 2002 a),the approach towards financial sector reforms in India isbased on panchasutra or five principles:
1. Cautious and appropriate sequencing of reformmeasures.
2. Introduction of norms that are mutuallyreinforcing.
3. Introduction of complementary reforms acrosssectors (most importantly, monetary, fiscal andexternal sector).
4. Development of financial institutions.
5. Development of financial markets.
An important salient feature of the move towardsglobalisation of the Indian financial system has been theintent of the authorities to more towards international bestpractices. This is illustrated by the appointment of severaladvisory groups designed to benchmark Indian practiceswith international standards in several crucial areas ofimportance like monetary policy, banking supervision, datadissemination, corporate governance and the like. Towardsthis end, a Standing Committee on International FinancialStandards and Codes (Chairman: Dr. Y. V. Reddy) wasconstituted and the recommendations contained thereinhave either been implemented or are in the process ofimplementation.
Having delineated the broad philosophy, let me nowturn to specifics of reform. I will paint the story of Indianreform with a broad brush so as to provide a context ofthe impact analysis that follows.
III. POLICY REFORMS IN THE FINANCIAL SECTOR
BANKING REFORMS
Commercial banking constitutes the largest segmentof the Indian financial system. Despite the generalapproach of the financial sector reform process to establishregulatory convergence among institutions involved inbroadly similar activities, given the large systemicimplications of the commercial banks, many of theregulatory and supervisory norms were initiated first forcommercial banks and were later extended to other typesof financial intermediaries.
After the nationalisation of major banks in two waves,starting in 1969, the Indian banking system becamepredominantly government owned by the early 1990s.Banking sector reform essentially consisted of a two

854
October Reserve Bank of India Bulletin 2004
854
pronged approach. While nudging the Indian bankingsystem to better health through the introduction ofinternational best practices in prudential regulation andsupervision early in the reform cycle, the idea was toincrease competition in the system gradually. Theimplementation periods for such norms were, however,chosen to suit the Indian situation. Special emphasis wasplaced on building up the risk management capabilitiesof the Indian banks. Measures were also initiated to ensureflexibility, operational autonomy and competition in thebanking sector. Active steps have been taken to improve
the institutional arrangements including the legalframework and technological system within which thefinancial institutions and markets operate. Keeping in viewthe crucial role of effective supervision in the creation ofan efficient and stable banking system, the supervisorysystem has been revamped. Stylised features of thebanking sector reforms have been given in Box I.
Unlike in other emerging market countries, many ofwhich had the presence of government owned banks andfinancial institutions, banking reform has not involvedlarge scale privatisation of such banks. The approach,
A. Prudential Measures
l Introduction and phased implementation ofinternational best practices and norms on risk-weightedcapital adequacy requirement, accounting, incomerecognition, provisioning and exposure.
l Measures to strengthen risk management throughrecognition of different components of risk,assignment of risk-weights to various asset classes,norms on connected lending, risk concentration,application of marked-to-market principle forinvestment portfolio and limits on deployment of fundin sensitive activities.
B. Competition Enhancing Measures
l Granting of operational autonomy to public sectorbanks, reduction of public ownership in public sectorbanks by allowing them to raise capital from equitymarket up to 49 per cent of paid-up capital.
l Transparent norms for entry of Indian private sector,foreign and joint-venture banks and insurancecompanies, permission for foreign investment in thefinancial sector in the form of Foreign DirectInvestment (FDI) as well as portfolio investment,permission to banks to diversify product portfolio andbusiness activities.
C. Measures Enhancing Role of Market Forces
l Sharp reduction in pre-emption through reserverequirement, market determined pricing for governmentsecurities, disbanding of administered interest rateswith a few exceptions and enhanced transparency anddisclosure norms to facilitate market discipline.
l Introduction of pure inter-bank call money market,auction-based repos-reverse repos for short-termliquidity management, facilitation of improvedpayments and settlement mechanism.
Box I: Reforms in the Banking Sector
D. Institutional and Legal Measuresl Settling up of Lok Adalats (people’s courts), debt
recovery tribunals, asset reconstruction companies,settlement advisory committees, corporate debtrestructuring mechanism, etc. for quicker recovery/restructuring. Promulgation of Securitisation andReconstruction of Financial Assets and Enforcementof Securities Interest (SARFAESI), Act and itssubsequent amendment to ensure creditor rights.
l Setting up of Credit Information Bureau for informationsharing on defaulters as also other borrowers.
l Setting up of Clearing Corporation of India Limited(CCIL) to act as central counter party for facilitatingpayments and settlement system relating to fixedincome securities and money market instruments.
E. Supervisory Measuresl Establishment of the Board for Financial Supervision
as the apex supervisory authority for commercialbanks, financial institutions and non-banking financialcompanies.
l Introduction of CAMELS supervisory rating system,move towards risk-based supervision, consolidatedsupervision of financial conglomerates, strengtheningof off-site surveillance through control returns.
l Recasting of the role of statutory auditors, increasedinternal control through strengthening of internal audit.
l Strengthening corporate governance, enhanced duediligence on important shareholders, fit and proper testsfor directors.
Technology Related Measuresl Setting up of INFINET as the communication backbone
for the financial sector, introduction of NegotiatedDealing System (NDS) for screen-based trading ingovernment securities and Real Time Gross Settlement(RTGS) System.

855
October Reserve Bank of India Bulletin 2004
855
instead, first involved recapitalisation of banks fromgovernment resources to bring them up to appropriatecapitalisation standards. In the second phase, instead ofprivatisation, increase in capitalisation has been donethrough diversification of ownership to private investorsup to a limit of 49 per cent, thereby keeping majorityownership and control with the government. With suchwidening of ownership most of these banks have beenpublicly listed; this was designed to introduce greatermarket discipline in bank management, and greatertransparency through enhanced disclosure norms. Thephased introduction of new private sector banks, andexpansion in the number of foreign bank branches,provided for new competition. Meanwhile, increasinglytight capital adequacy, prudential and supervision normswere applied equally to all banks, regardless ofownership.
DEBT MARKET REFORMS
Major reforms have been carried out in thegovernment securities (G-Sec) debt market. In fact, it isprobably correct to say that a functioning G-Sec debt
market was really initiated in the 1990s. The systemhad to essentially move from a strategy of pre-emptionof resources from banks at administered interest ratesand through monetisation to a more market orientedsystem. Prescription of a “statutory liquidity ratio”(SLR), i.e., the ratio at which banks are required toinvest in approved securities, though originally devisedas a prudential measure, was used as the main instrumentof pre-emption of bank resources in the pre-reformperiod. The high SLR requirement created a captivemarket for government securities, which were issued atlow administered interest rates. After the initiation ofreforms, this ratio has been reduced in phases to thestatutory minimum level of 25 per cent. Over the pastfew years numerous steps have been taken to broadenand deepen the Government securities market and toraise the levels of transparency. Automatic monetisationof the Government’s deficit has been phased out andthe market borrowings of the Central Government arepresently undertaken through a system of auctions atmarket-related rates. Major facets of the reforms in thegovernment securities are provided in Box II.
Box II: Reforms in the Government Securities Market
Institutional Measures
l Administered interest rates on government securitieswere replaced by an auction system for price discovery.
l Automatic monetisation of fiscal deficit through theissue of ad hoc Treasury Bills was phased out.
l Primary Dealers (PD) were introduced as marketmakers in the government securities market.
l For ensuring transparency in the trading of governmentsecurities, Delivery versus Payment (DvP) settlementsystem was introduced.
l Repurchase agreement (repo) was introduced as a toolof short-term liquidity adjustment. Subsequently, theLiquidity Adjustment Facility (LAF) was introduced.LAF operates through repo and reverse repo auctionsto set up a corridor for short-term interest rate. LAFhas emerged as the tool for both liquidity managementand also signalling device for interest rates in theovernight market.
l Market Stabilisation Scheme (MSS) has beenintroduced, which has expanded the instrumentsavailable to the Reserve Bank for managing the surplusliquidity in the system.
Increase in Instruments in the Government SecuritiesMarket
l 91-day Treasury bill was introduced for managingliquidity and benchmarking. Zero Coupon Bonds,Floating Rate Bonds, Capital Indexed Bonds wereissued and exchange traded interest rate futures wereintroduced. OTC interest rate derivatives like IRS/FRAs were introduced.
Enabling Measures
l Foreign Institutional Investors (FIIs) were allowed toinvest in government securities subject to certain limits.
l Introduction of automated screen-based trading ingovernment securities through Negotiated DealingSystem (NDS). Setting up of risk-free payments andsettlement system in government securities throughClearing Corporation of India Limited (CCIL). Phasedintroduction of Real Time Gross Settlement System(RTGS).
l Introduction of trading of government securities onstock exchanges for promoting retailing in suchsecurities, permitting non-banks to participate in repomarket.
856
October Reserve Bank of India Bulletin 2004
856
The key lesson learned through this debt marketreform process is that setting up such a market is noteasy and needs a great deal of proactive work by therelevant authorities. An appropriate institutionalframework has to be created for such a market to be builtand operated in a sustained manner. Legislative provisions,technology development, market infrastructure such assettlement systems, trading systems, and the like have allto be developed.
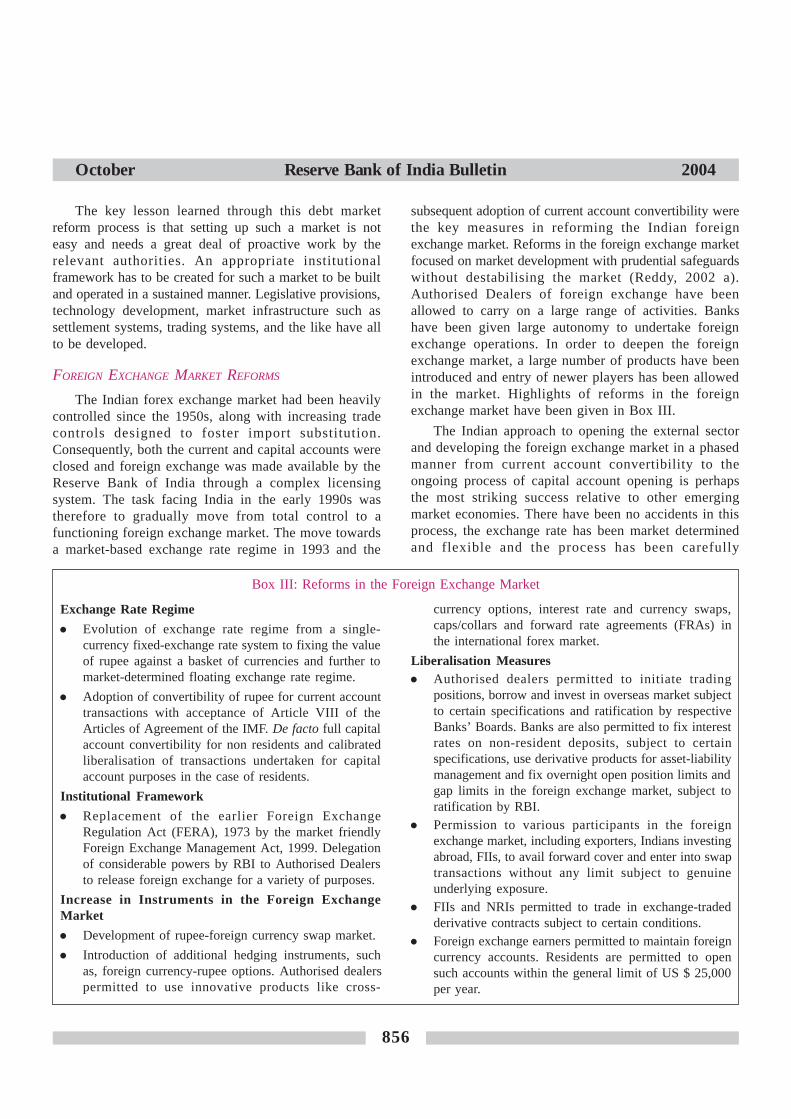
FOREIGN EXCHANGE MARKET REFORMS
The Indian forex exchange market had been heavilycontrolled since the 1950s, along with increasing tradecontrols designed to foster import substitution.Consequently, both the current and capital accounts wereclosed and foreign exchange was made available by theReserve Bank of India through a complex licensingsystem. The task facing India in the early 1990s wastherefore to gradually move from total control to afunctioning foreign exchange market. The move towardsa market-based exchange rate regime in 1993 and the
subsequent adoption of current account convertibility werethe key measures in reforming the Indian foreignexchange market. Reforms in the foreign exchange marketfocused on market development with prudential safeguardswithout destabilising the market (Reddy, 2002 a).Authorised Dealers of foreign exchange have beenallowed to carry on a large range of activities. Bankshave been given large autonomy to undertake foreignexchange operations. In order to deepen the foreignexchange market, a large number of products have beenintroduced and entry of newer players has been allowedin the market. Highlights of reforms in the foreignexchange market have been given in Box III.
The Indian approach to opening the external sectorand developing the foreign exchange market in a phasedmanner from current account convertibility to theongoing process of capital account opening is perhapsthe most striking success relative to other emergingmarket economies. There have been no accidents in thisprocess, the exchange rate has been market determinedand flexible and the process has been carefully
Box III: Reforms in the Foreign Exchange Market
Exchange Rate Regime
l Evolution of exchange rate regime from a single-currency fixed-exchange rate system to fixing the valueof rupee against a basket of currencies and further tomarket-determined floating exchange rate regime.
l Adoption of convertibility of rupee for current accounttransactions with acceptance of Article VIII of theArticles of Agreement of the IMF. De facto full capitalaccount convertibility for non residents and calibratedliberalisation of transactions undertaken for capitalaccount purposes in the case of residents.
Institutional Framework
l Replacement of the earlier Foreign ExchangeRegulation Act (FERA), 1973 by the market friendlyForeign Exchange Management Act, 1999. Delegationof considerable powers by RBI to Authorised Dealersto release foreign exchange for a variety of purposes.
Increase in Instruments in the Foreign ExchangeMarket
l Development of rupee-foreign currency swap market.
l Introduction of additional hedging instruments, suchas, foreign currency-rupee options. Authorised dealerspermitted to use innovative products like cross-
currency options, interest rate and currency swaps,caps/collars and forward rate agreements (FRAs) inthe international forex market.
Liberalisation Measuresl Authorised dealers permitted to initiate trading
positions, borrow and invest in overseas market subjectto certain specifications and ratification by respectiveBanks’ Boards. Banks are also permitted to fix interestrates on non-resident deposits, subject to certainspecifications, use derivative products for asset-liabilitymanagement and fix overnight open position limits andgap limits in the foreign exchange market, subject toratification by RBI.
l Permission to various participants in the foreignexchange market, including exporters, Indians investingabroad, FIIs, to avail forward cover and enter into swaptransactions without any limit subject to genuineunderlying exposure.
l FIIs and NRIs permitted to trade in exchange-tradedderivative contracts subject to certain conditions.
l Foreign exchange earners permitted to maintain foreigncurrency accounts. Residents are permitted to opensuch accounts within the general limit of US $ 25,000per year.

857
October Reserve Bank of India Bulletin 2004
857
calibrated. The capital account is effectively convertiblefor non-residents, but has some way to go for residents.The Indian approach has perhaps gained greaterinternational respectability after the enthusiasm for rapidcapital account opening has been dimmed since theAsian crisis.
REFORMS IN OTHER SEGMENTS OF THE FINANCIAL SECTOR
Measures aimed at establishing prudential regulationand supervision and also competition and efficiencyenhancing measures have also been introduced for non-bank financial intermediaries as well. Towards this end,non-banking financial companies (NBFCs), especiallythose involved in public deposit taking activities, havebeen brought under the regulation of RBI. DevelopmentFinance Institutions (DFIs), specialised term-lendinginstitutions, NBFCs, Urban Cooperative Banks andPrimary Dealers have all been brought under thesupervision of the Board for Financial Supervision(BFS). With the aim of regulatory convergence forentities involved in similar activities, prudentialregulation and supervision norms were also introducedin phases for DFIs, NBFCs and cooperative banks.
The insurance business remained within the confinesof public ownership until the late 1990s. Subsequent tothe passage of the Insurance Regulation and DevelopmentAct in 1999, several changes were initiated, includingallowing newer players/joint ventures to undertakeinsurance business on risk-sharing/commission basis. TheInsurance Regulatory and Development Agency (IRDA)has been established to regulate and supervise theinsurance sector.
With the objective of improving market efficiency,increasing transparency, integration of national marketsand prevention of unfair practices regarding trading, apackage of reforms comprising measures to liberalise,regulate and develop capital market was introduced. Animportant step has been the establishment of theSecurities and Exchange Board of India (SEBI) as theregulator for equity markets. Since 1992, reformmeasures in the equity market have focused mainly onregulatory effectiveness, enhancing competitiveconditions, reducing information asymmetries,developing modern technological infrastructure,mitigating transaction costs and controlling ofspeculation in the securities market. Another importantdevelopment under the reform process has been the
opening up of mutual funds to the private sector in 1992,which ended the monopoly of Unit Trust of India (UTI),a public sector entity. These steps have been buttressedby measures to promote market integrity.
The Indian capital market was opened up for foreigninstitutional investors (FIIs) in 1992. The Indian corporatesector has been allowed to tap international capitalmarkets through American Depository Receipts (ADRs),Global Depository Receipts (GDRs), Foreign CurrencyConvertible Bonds (FCCBs) and External CommercialBorrowings (ECBs). Similarly, Overseas Corporate Bodies(OCBs) and non-resident Indians (NRIs) have beenallowed to invest in Indian companies. FIIs have beenpermitted in all types of securities including Governmentsecurities and they enjoy full capital convertibility. Mutualfunds have been allowed to open offshore funds to investin equities abroad.
IV. REFORM IN THE MONETARY POLICY FRAMEWORK
What has been the change in monetary policy inthe wake of these changes in different market segmentsas well as sectors? The transition of economic policiesin general, and financial sector policies in particular,from a control oriented regime to a liberalised butregulated regime has also been reflected in changes inthe nature of monetary management. While the basicobjectives of monetary policy, namely price stability andensuring adequate credit flow to support growth, haveremained unchanged, the underlying operatingenvironment for monetary policy has undergone asignificant transformation. An increasing concern is themaintenance of financial stability. The basic emphasisof monetary policy since the initiation of reforms hasbeen to reduce market segmentation in the financialsector through increase in the linkage between varioussegments of the financial market including money,government securities and forex market. Major featuresof the reforms in the monetary policy framework havebeen provided in Box IV.
The key policy development that has enabled a moreindependent monetary policy environment was thediscontinuation of automatic monetisation of thegovernment’s fiscal deficit through an agreementbetween the Government and the Reserve Bank of Indiain 1997. The enactment of the Fiscal Responsibility andBudget Management Act has strengthened this further :

858
October Reserve Bank of India Bulletin 2004
858
Box IV: Reforms in the Monetary Policy Framework
Objectives
l Twin objectives of “maintaining price stability” and“ensuring availability of adequate credit to productivesectors of the economy to support growth” continueto govern the stance of monetary policy, though therelative emphasis on these objectives has varieddepending on the importance of maintaining anappropriate balance.
l Reflecting development of financial market andliberalisation, use of broad money as an intermediatetarget has been de-emphasised and a multiple indicatorapproach has been adopted.
l Emphasis has been put on development of multipleinstruments to transmit liquidity and interest rate signalsin the short-term in a flexible and bi-directional manner.
l Increase of the linkage between various segments ofthe financial market including money, governmentsecurity and forex markets.
Instruments
l Move from direct instruments (such as, administeredinterest rates, reserve requirements, selective creditcontrol) to indirect instruments (such as, open marketoperations, purchase and repurchase of governmentsecurities) for the conduct of monetary policy.
l Introduction of Liquidity Adjustment Facility (LAF),which operates through repo and reverse repo auctionsto set up a corridor for short-term interest rate. LAFhas emerged as the tool for both liquidity managementand also as a signalling devise for interest rate in theovernight market.
l Use of open market operations to deal with overallmarket liquidity situation especially those emanatingfrom capital flows.
l Introduction of Market Stabilisation Scheme (MSS) asan additional instrument to deal with capital inflowswithout affecting short-term liquidity management roleof LAF.
Developmental Measures
l Discontinuation of automatic monetisation through anagreement between the Government and the CentralBank. Rationalisation of Treasury Bill market.Introduction of delivery versus payment system anddeepening of inter-bank repo market.
l Introduction of Primary Dealers in the governmentsecurities market to play the role of market maker.
l Amendment of Securities Contracts Regulation Act tocreate the regulatory framework.
l Deepening of government securities market by makingthe interest rates on such securities market related.Introduction of auction of government securities.Development of a risk-free credible yield curve in thegovernment securities market as a benchmark forrelated markets.
l Development of pure inter-bank call money market.Non-bank participants to participate in other moneymarket instruments.
l Introduction of automated screen-based trading ingovernment securities through Negotiated DealingSystem (NDS). Setting up of risk-free payments andsystem in government securities through ClearingCorporation of India Limited (CCIL). Phasedintroduction of Real Time Gross Settlement (RTGS)System.
l Deepening of forex market and increased autonomyof Authorised Dealers.
from 2006, the Reserve Bank will no longer be permittedto subscribe to government securities in the primarymarket. The development of the monetary policyframework has also involved a great deal of institutionalinitiatives to enable efficient functioning of the moneymarket: development of appropriate trading, paymentsand settlement systems along with technologicalinfrastructure.
Against this discussion of what has been done, letme now turn to what the process has led to in the Indianfinancial sector.
V. PERFORMANCE OF THE FINANCIAL SECTOR UNDERTHE REFORM PROCESS
BANKING SECTOR
Banking sector reform has established a competitivesystem driven by market forces. The process, however,has not resulted in disregard of social objectives such asmaintenance of the wide reach of the banking system orchannelisation of credit towards disadvantaged but sociallyimportant sectors. At the same time, the reform periodexperienced strong balance sheet growth of the banks in

859
October Reserve Bank of India Bulletin 2004
859
an environment of operational flexibility. A keyachievement of the banking sector reform has been thesharp improvement in the financial health of banks,reflected in significant improvement in capital adequacyand improved asset quality. This has been achieved despiteconvergence of the prudential norms with the internationalbest practices.2 There have also been substantialimprovements in the competitiveness of the Indianbanking sector reflected in the changing composition ofassets and liabilities of the banking sector across bankgroups. In line with increased competitiveness, there hasbeen improvement in efficiency of the banking systemreflected inter alia in the reduction in interest spread,operating expenditure and cost of intermediation ingeneral. Contemporaneously there have beenimprovements in other areas as well includingtechnological deepening and flexible human resourcemanagement. A more detailed discussion on theperformance analysis of the banking sector under thereform process is given below.
Social Objectives and Balance Sheet Management
The Indian banking system has acquired a widereach, judged in terms of expansion of branches andthe growth of credit and deposits (Tables 1 and 2). Theexpansion of branch network peaked in the phase ofsocial banking during the 1970s and 1980s. Despite theslowdown in branch expansion since the 1990s, thepopulation per bank branch, however, has not changedmuch since the 1980s, and has remained at around15,000. It is often asserted that the Indian banking sectoris saddled with too many branches, adding to its highintermediation costs. In fact, at about 8-10,000, the
Table 1: Progress of Commercial Banking in India
Indicators June June March March March March1969 1980 1991 1995 2000 2003
1. No. of Commercial Banks 73 154 272 284 298 292
2. No. of Bank Offices 8,262 34,594 60,570 64,234 67,868 68,561
Of which
Rural and semi-urban bank offices 5,172 23,227 46,550 46,602 47,693 47,496
3. Population per Office (’000s) 64 16 14 15 15 16
4. Per capita Deposit (Rs.) 88 738 2,368 4,242 8,542 12,253
5. Per capita Credit (Rs.) 68 457 1,434 2,320 4,555 7,275
6. Priority Sector Advances@ (per cent) 15.0 37.0 39.2 33.7 35.4 33.7 *
7. Deposits (per cent of National Income) 15.5 36.0 48.1 48.0 53.5 51.8
@: Share of Priority Sector Advances in Total Non-Food Credit of Scheduled Commercial Bank, *: As at end-March 2002.
Source: Reserve Bank of India.
Table 2: Select Balance Sheet Indicators of Commercial BanksOperating in India
(Per cent)
As a Ratio of Total Assets/Liabilities
Deposits Total Non-SLR Loans andInvestments Investment Advances
1991-92 77.7 28.9 .. 46.8 (17.1) (28.4) .. (13.7)
1992-93 78.4 30.5 .. 45.0 (13.9) (19.0) .. (8.6)
1993-94 80.3 35.4 5.0 38.7 (15.5) (31.1) .. -(3.0)
1994-95 78.9 33.6 4.6 40.5 (16.3) (12.2) (9.4) (24.0)
1995-96 76.4 31.0 3.5 42.1 (12.7) (7.4) -(11.7) (20.9)
1996-97 79.9 33.3 5.0 41.0 (17.5) (20.6) (60.2) (9.2)
1997-98 81.0 34.2 7.1 40.8 (19.8) (21.5) (69.3) (17.6)
1998-99 81.1 35.7 8.6 38.8 (19.7) (24.9) (45.3) (13.9)
1999-00 81.1 37.3 9.1 40.2 (16.3) (21.3) (22.4) (20.3)
2000-01 81.5 38.0 8.9 40.6 (17.7) (19.3) (14.2) (18.5)
2001-02 78.5 38.2 8.7 42.0 (14.3) (19.4) (16.5) (22.7)
2002-03 79.8 40.8 8.1 43.6 (12.4) (18.1) (3.3) (14.7)
2003-04* 80.5 41.7 7.2 45.0 (17.5) (19.7) (2.9) (15.3)
*: Based on supervisory returns, ..: Not available, SLR: Statutory Liquidity Ratio.
Note: Figures in brackets are annual growth rates.
Source: Reserve Bank of India.
population per branch in developed countries is lowerthan that in India. Therefore, the reform process hasmaintained the gains in terms of the outreach of bankbranches achieved in the phase of social banking.
2 In fact, in some cases, prudential norms in India have surpassed the international best practices and many of the proposals ofBasel II are already under the process of phased implementation.

860
October Reserve Bank of India Bulletin 2004
860
Despite a decline, direct lending to disadvantagedsegments of the economy under the priority sectoradvances remained high during the reform period. Thedecline in priority sector lending since the initiation ofreforms in fact reflects greater flexibility provided tobanks to meet such targets. Currently, in the event a bankfails to meet the priority sector lending target throughdirect lending, the bank can invest the shortfall amountwith the apex organisations dealing with flow of fundstowards agriculture and small-scale industries. Whileadherence of banks to the norms on direct lending towardsthe priority sector still remains desirable, the currentarrangement reflects how the reform process has providedoperational flexibility to banks even while meeting socialobjectives.
The discernible increase in the proportion of bankdeposits to national income is reflective of the enhanceddeepening of the Indian financial system during theperiod. Simultaneously, there have been considerableincreases in per capita deposits and credit. This alsoimplies an increase in the average business per bankbranch, which is likely to have improved the viability ofindividual bank branches including those in the rural andsemi-urban centres.
In the post-reform period, banks have consistentlymaintained high rates of growth in their assets andliabilities. This is particularly credible given the lowinflationary situation that prevailed in this periodcompared to the earlier periods, most notably in the 1980s.On the liability side, there has not been muchcompositional change since the initiation of reformswhereby deposits continue to account for about 80 percent of the total liabilities. On the asset side, however,there is a definite increase in the share of investments.While the share of loans and advances did decline in the1990s, it has recovered in recent years.
Despite the large decline in SLR in the 1990s,3 thesharp increase in investments by banks is reflective oftheir attempt to evolve treasury operations into profitcentres. The reduction in cash reserve ratio and improvedinter-office adjustments in a substantially computerisedand networked environment, inter alia, did free upsubstantial amounts of bank resources, which enabledbanks to concentrate on investment operations with greatervigour.
Interestingly, despite the reduced regulatory requirementto invest in government and other securities approved forSLR investment, the major increase in investmentoperations by Indian banks since the mid 1990s has beenon account of their investment in government securities.This reflects the sustenance of high fiscal deficits of bothcentral and state governments, particularly after the PayCommission award leading to increase in the governmentsalary bill in 1997. Furthermore, subdued industrial growthsince 1997 also led to lower credit demand, providingbanks further incentive to place their resources in risk-free government securities. It is also possible that, in adeclining interest rate scenario in the presence of adeveloping debt market, this was a rational profitmaximising strategy. Banks’ investment in non-SLRsecurities as a proportion of total assets has in factdeclined since 1999-2000. While in the 1990s, greaterorientation towards investment activities and aversion tocredit risk exposure may have deterred banks fromundertaking their ‘core function’ of providing loans andadvances, banks seem to have struck a greater balancebetween investment and loans and advances in recentyears. Improved atmosphere for recovery created in therecent years coupled with greater awareness about marketrisks associated with large holding of securities portfolioseem to have induced banks to put greater efforts inextending loans.
Capital Position and Asset Quality
A set of micro-prudential measures have beenstipulated since the onset of reforms aimed at impartingstrength to the banking system as well as ensuring safetyand soundness in order to fix ‘the true position of bank’sbalance sheet and…to arrest its deterioration’ (Rangarajan,1998). With regard to prudential requirements, norms forincome recognition and asset classification (IRAC),introduced in 1992, have been strengthened over the yearsin line with international best practices. A strategy toattain CRAR of 8 per cent in a phased manner was putin place and subsequently the level was raised to 9 percent with effect from 1999-2000.
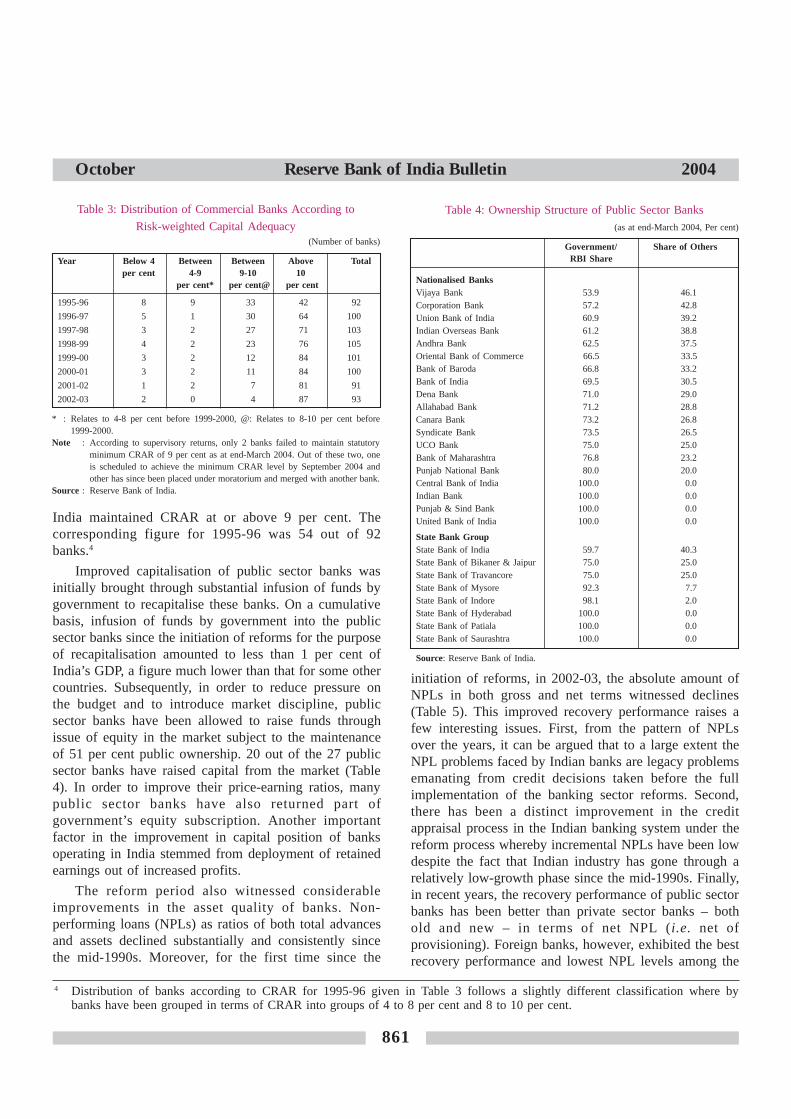
The overall capital position of commercial sectorbanks has witnessed a marked improvement during thereform period (Table 3). Illustratively, as at end-March2003, 91 out of the 93 commercial banks operating in
3 In the early 1990s through the use of SLR and cash reserve ratio (CRR) as much as 63.5 per cent of the bank resources werepre-empted. Since the introduction of financial sector reforms these rates have been cut considerably in a sequenced manner.SLR has been reduced to the statutory minimum of 25 per cent, while CRR is currently at 5.0 per cent.
861
October Reserve Bank of India Bulletin 2004
861
Table 3: Distribution of Commercial Banks According to
Risk-weighted Capital Adequacy(Number of banks)
Year Below 4 Between Between Above Totalper cent 4-9 9-10 10
per cent* per cent@ per cent
1995-96 8 9 33 42 92
1996-97 5 1 30 64 100
1997-98 3 2 27 71 103
1998-99 4 2 23 76 105
1999-00 3 2 12 84 101
2000-01 3 2 11 84 100
2001-02 1 2 7 81 91
2002-03 2 0 4 87 93
* : Relates to 4-8 per cent before 1999-2000, @: Relates to 8-10 per cent before1999-2000.
Note : According to supervisory returns, only 2 banks failed to maintain statutoryminimum CRAR of 9 per cent as at end-March 2004. Out of these two, oneis scheduled to achieve the minimum CRAR level by September 2004 andother has since been placed under moratorium and merged with another bank.
Source : Reserve Bank of India.
India maintained CRAR at or above 9 per cent. Thecorresponding figure for 1995-96 was 54 out of 92banks.4
Improved capitalisation of public sector banks wasinitially brought through substantial infusion of funds bygovernment to recapitalise these banks. On a cumulativebasis, infusion of funds by government into the publicsector banks since the initiation of reforms for the purposeof recapitalisation amounted to less than 1 per cent ofIndia’s GDP, a figure much lower than that for some othercountries. Subsequently, in order to reduce pressure onthe budget and to introduce market discipline, publicsector banks have been allowed to raise funds throughissue of equity in the market subject to the maintenanceof 51 per cent public ownership. 20 out of the 27 publicsector banks have raised capital from the market (Table4). In order to improve their price-earning ratios, manypublic sector banks have also returned part ofgovernment’s equity subscription. Another importantfactor in the improvement in capital position of banksoperating in India stemmed from deployment of retainedearnings out of increased profits.
The reform period also witnessed considerableimprovements in the asset quality of banks. Non-performing loans (NPLs) as ratios of both total advancesand assets declined substantially and consistently sincethe mid-1990s. Moreover, for the first time since the
4 Distribution of banks according to CRAR for 1995-96 given in Table 3 follows a slightly different classification where bybanks have been grouped in terms of CRAR into groups of 4 to 8 per cent and 8 to 10 per cent.
Table 4: Ownership Structure of Public Sector Banks(as at end-March 2004, Per cent)
Government/ Share of OthersRBI Share
Nationalised BanksVijaya Bank 53.9 46.1Corporation Bank 57.2 42.8Union Bank of India 60.9 39.2Indian Overseas Bank 61.2 38.8Andhra Bank 62.5 37.5Oriental Bank of Commerce 66.5 33.5Bank of Baroda 66.8 33.2Bank of India 69.5 30.5Dena Bank 71.0 29.0Allahabad Bank 71.2 28.8Canara Bank 73.2 26.8Syndicate Bank 73.5 26.5UCO Bank 75.0 25.0Bank of Maharashtra 76.8 23.2Punjab National Bank 80.0 20.0Central Bank of India 100.0 0.0Indian Bank 100.0 0.0Punjab & Sind Bank 100.0 0.0United Bank of India 100.0 0.0
State Bank GroupState Bank of India 59.7 40.3State Bank of Bikaner & Jaipur 75.0 25.0State Bank of Travancore 75.0 25.0State Bank of Mysore 92.3 7.7State Bank of Indore 98.1 2.0State Bank of Hyderabad 100.0 0.0State Bank of Patiala 100.0 0.0State Bank of Saurashtra 100.0 0.0
Source: Reserve Bank of India.
initiation of reforms, in 2002-03, the absolute amount ofNPLs in both gross and net terms witnessed declines(Table 5). This improved recovery performance raises afew interesting issues. First, from the pattern of NPLsover the years, it can be argued that to a large extent theNPL problems faced by Indian banks are legacy problemsemanating from credit decisions taken before the fullimplementation of the banking sector reforms. Second,there has been a distinct improvement in the creditappraisal process in the Indian banking system under thereform process whereby incremental NPLs have been lowdespite the fact that Indian industry has gone through arelatively low-growth phase since the mid-1990s. Finally,in recent years, the recovery performance of public sectorbanks has been better than private sector banks – bothold and new – in terms of net NPL (i.e. net ofprovisioning). Foreign banks, however, exhibited the bestrecovery performance and lowest NPL levels among the

862
October Reserve Bank of India Bulletin 2004
862
all bank-groups. This raises a question mark on theapplicability of the argument that links performance ofbanks with ownership pattern in the context of Indianbanking.
Another interesting point that merits mention is thatdespite India’s transition to a 90-day NPL recognitionnorm (from 180-day norm) since 2004, both gross andnet NPLs as a percentage of total advances declinedbetween end-March 2003 and end-March 2004. This
reflects the success of new initiatives for resolution ofNPLs including promulgation of the SARFAESI5 Act incontaining NPLs. Greater provisioning and write-off ofNPLs in the face of greater profitability also helpedkeeping the NPLs low during 2003-04.
Competition and Efficiency
One of the major objectives of banking sector reformshas been to enhance efficiency and productivity throughenhanced competition. Such policies have led toconsiderable and consistent reduction in the shares ofpublic sector banks in the total income, expenditure andassets of the commercial banking system (Table 6). Sharesof Indian private sector banks, especially new privatesector banks established in the 1990s, in the total incomeand assets of the banking system have improvedconsiderably since the mid-1990s. A number of newprivate sector banks have emerged as dynamiccomponents of the Indian banking system, reducing notonly the market share of public sector banks but alsothose of foreign banks. The reduction in the asset shareof foreign banks, however, is partially due to theirincreased focus on off-balance sheet non-fund basedbusiness.
Notwithstanding such transformation, the position ofpublic sector banks in the Indian banking systemcontinues to be predominant as these banks account for
5 Securitisation and Reconstruction of Financial Assets and Enforcement of Security Interest Act, 2002.
Table 5: NPL of Scheduled Commercial Banks (Per cent)
Gross NPL/ Gross NPL/ Net NPL/ Net NPL/advances Assets advances Assets
Scheduled commercial banks 1996-97 15.7 7.0 8.1 3.31997-98 14.4 6.4 7.3 3.01998-99 14.7 6.2 7.6 2.91999-00 12.7 5.5 6.8 2.72000-01 11.4 4.9 6.2 2.52001-02 10.4 4.6 5.5 2.32002-03 8.8 4.0 4.4 1.92003-04* 7.3 .. 3.0 ..
Public sector banks 1996-97 17.8 7.8 9.2 3.61997-98 16.0 7.0 8.2 3.31998-99 15.9 6.7 8.1 3.11999-00 14.0 6.0 7.4 2.92000-01 12.4 5.3 6.7 2.72001-02 11.1 4.9 5.8 2.42002-03 9.4 4.2 4.5 1.9
Old private sector banks 1996-97 10.7 5.2 6.6 3.11997-98 10.9 5.1 6.5 2.91998-99 13.1 5.8 9.0 3.61999-00 10.8 5.2 7.1 3.32000-01 10.9 5.1 7.3 3.32001-02 11.0 5.2 7.1 3.22002-03 8.9 4.3 5.5 2.6
New private sector banks 1996-97 2.6 1.3 2.0 1.01997-98 3.5 1.5 2.6 1.11998-99 6.2 2.3 4.5 1.61999-00 4.1 1.6 2.9 1.12000-01 5.1 2.1 3.1 1.22001-02 8.9 3.9 4.9 2.12002-03 7.6 3.8 4.6 2.2
Foreign banks in India 1996-97 4.3 2.1 1.9 0.91997-98 6.4 3.0 2.2 1.01998-99 7.6 3.1 2.9 1.11999-00 7.0 3.2 2.4 1.02000-01 6.8 3.0 1.8 0.82001-02 5.4 2.4 1.9 0.82002-03 5.2 2.4 1.8 0.8
NPL: Non-performing loans, *: Based on supervisory returns, ..: not available.
Note : Bank group specific details for 2003-04 are not available.
Source : Reserve Bank of India.
Table 6: Bank Group-wise Shares: Select Indicators(Per cent)
1995-96 2000-01 2002-03
Public Sector BanksIncome 82.5 78.4 74.5Expenditure 84.2 78.9 74.8Total Assets 84.4 79.5 75.7Net Profit -39.1 67.4 64.8Gross Profit 74.3 69.9 76.6
Private Sector BanksIncome 8.2 12.6 18.5Expenditure 7.4 12.3 18.6Total Assets 7.7 12.6 17.5Net Profit 59.3 17.8 15.6Gross Profit 10.1 14.4 18.7
Foreign BanksIncome 9.4 9.1 7.0Expenditure 8.3 8.8 6.6Total Assets 7.9 7.9 6.9Net Profit 79.8 14.8 19.6Gross Profit 15.6 15.7 4.7
Source : Reserve Bank of India.

863
October Reserve Bank of India Bulletin 2004
863
nearly three-fourths of assets and income. It is importantto note that public sector banks have responded to thenew challenges of competition, which is reflected in theincrease in share of these banks in the overall profit ofthe banking sector. From the position of net loss in themid-1990s, in recent years the share of public sectorbanks in the profit of the commercial banking systemhas become broadly commensurate with their share ofassets, indicating a broad convergence of profitabilityacross various bank groups. This is yet another examplethat, with operational flexibility, public sector banks arecompeting effectively with private sector and foreignbanks. The market discipline imposed by the listing ofmost public sector banks has also probably contributedto this improved performance. Public sector bankmanagements are now probably more attuned to themarket consequences of their activities.
Since the mid-1990s, profitabil i ty levels ofcommercial banks have hovered in the range of 0.7-0.8 per cent, except during certain exceptional years(Table 7). Clearly this is an improvement over theprofitability prior to the initiation of the reform process.Moreover, there is a general improvement in theprofitability situation in the recent years across bankgroups. Since the mid-1990s, consistent with softinterest rate policies, both interest income and interestexpenditure of banks as proportions of total assets havedeclined. However, interest expenditure declined fasterthan interest income, resulting in an increase in netinterest income (Table 7).
Reflecting the greater emphasis on income andexpenditure management, there has been a generalreduction in the operating expenditure as a proportion oftotal assets (Table 7). This is also reflective of efficiencygain of the Indian banking under the reform process. Thishas been achieved in spite of large expenditures incurredby Indian banks in installation and upgradation ofinformation technology. Moreover, in order to addressmanpower redundancies, public sector banks also incurredlarge expenditures under voluntary pre-mature retirementof nearly 12 per cent of their total staff strength. Theprocess, however, resulted in reduced operatingexpenditure in the medium-term.
Another reflection of greater competition andefficiency of the Indian banking system can be capturedfrom the considerable reduction in interest spread overthe reform period. Once again, this reduction has beenacross the bank-groups. In fact, the spread is the highestfor foreign banks and lowest for new private sector banks(Table 8).
A major impact of the reform process on the Indianbanking has been in terms of change in business strategyof the banks. When banking sector reforms wereintroduced, over 90 per cent of the income of commercialbanks in India was in the form of interest income, thisproportion has gone down substantially to about 80 percent in recent years. This reflects greater diversificationof banks into non-fund based business and also emergenceof treasury and foreign exchange business as profit centresfor Indian banks.
Table 7: Earnings and Expenses of Scheduled Commercial Banks(Rs. billion)
Year Total Assets Total Earnings Interest Earnings Total Expenses Interest Expenses Establishment Net InterestExpenses Earning
1951 12 1 0 0 0 0 0(3.8) (3.1) (2.6) (0.9) (1.3) (2.2)
1969 68 4 4 4 2 1 2(6.2) (5.3) (5.5) (2.8) (2.1) (2.5)
1980 582 42 38 42 27 10 10(7.3) (6.4) (7.2) (4.7) (1.7) (1.8)
1991 3,275 304 275 297 190 76 86(9.3) (8.4) (9.1) (5.8) (2.3) (2.6)
2000 11,055 1,149 992 1,077 690 276 301(10.4) (9.0) (9.7) (6.2) (2.5) (2.7)
2002 15,355 1,510 1,270 1,395 875 337 395(9.8) (8.3) (9.1) (5.7) (2.2) (2.6)
2003 16,989 1,724 1,407 1,553 936 3,809 471 (10.2) (8.3) (9.1) (5.5) (2.2) (2.8)
Note : Figures in brackets are ratios to total assets.Source : Reserve Bank of India.

864
October Reserve Bank of India Bulletin 2004
864
of financial sector reforms, 26 out of the 27 public sectorfinancial intermediaries have been successful inrestructuring their workforce, which involved downsizingof the labour force by 12 per cent. Such steps haveresulted in decline in staff cost and increase in businessper employee.
This brief quantitative review of the performance ofthe Indian banking sector documents the very significantimprovements that have occurred over the decade ofreforms. The performance parameters of Indian banks arenow approaching international standards and they areamong the better performers in the emerging market group(Table 9). As both domestic and international competitionintensifies, it will be essential for Indian banks to furtherimprove their efficiency and also deploy better theirresources as fiscal dominance declines.
DEBT MARKET
In nominal terms, fiscal deficit of the centralgovernment has increased substantially since the early
Inflexibility of the Indian labour market is oftenidentified as one of the weak points of the Indian reformprocess. It is, however, important to note that as a part
Table 8: Important Parameters for Indian Banking Sector(Per cent)
Bank Group 1996-97 2001-02 2002-03
Operating Expenses/Total AssetsScheduled Commercial Banks 2.9 2.2 2.2Public Sector Banks 2.9 2.3 2.3Old Private Sector Banks 2.5 2.1 2.0New Private Sector Banks 1.9 1.1 2.0Foreign Banks 3.0 3.0 2.8
Spread/Total AssetsScheduled Commercial Banks 3.2 2.6 2.8Public Sector Banks 3.2 2.7 2.9Old Private Sector Banks 2.9 2.4 2.5New Private Sector Banks 2.9 1.2 1.7Foreign Banks 4.1 3.2 3.4
Net Profit/Total AssetsScheduled Commercial Banks 0.7 0.8 1.0Public Sector Banks 0.6 0.7 1.0Old Private Sector Banks 0.9 1.1 1.2New Private Sector Banks 1.7 0.4 0.9Foreign Banks 1.2 1.3 1.6
Note : Spread = interest income-interest expenditure.Source : Reserve Bank of India.
Table 9: Cross-Country Performance Analysis of Banks(Per cent)
Country 2001 2002 2003 Latest
Gross Non-Performing Loans to Total Loans
Latin America Argentina1 13.2 17.5 22.7 NovemberBrazil 5.7 5.3 5.7 JuneMexico 5.1 4.6 3.7 September
Asia China 29.8 25.5 22.0 JuneIndia 11.4 10.4 8.8 MarchIndonesia 11.9 5.8 .. Malaysia 17.8 15.9 14.8 JunePhilippines 16.9 15.4 15.2 SeptemberSingapore 3.6 3.4 3.5 SeptemberThailand 10.5 15.8 15.5 August
Memo US3 1.4 1.6 1.3 SeptemberUK 2.6 2.6 2.2 JuneJapan 6.6 8.9 7.2 September
Profitability of Major Banks
Latin America Argentina -0.2 -9.7 -2.5 AugustBrazil 0.2 1.9 1.9 JuneMexico 0.8 -1.1 1.6 September
Asia China 0.1 0.1 .. India 0.5 0.8 1.0 MarchIndonesia 0.8 1.3 .. Malaysia 1.0 1.3 .. Philippines 0.4 0.8 1.0 SeptemberSingapore 0.8 0.8 0.8 SeptemberThailand -0.1 0.4 1.1 August
Memo US1 1.1 1.4 1.4 SeptemberUK 2,3 0.5 0.9 0.5 JuneJapan2 0.1 0.0 .. September
.. Not available.1. With asset exceeding US $ 1 billion,2. Before tax,3. Includes mortgage banksSource : Global Financial Stability Report, April 2004.

865
October Reserve Bank of India Bulletin 2004
865
1990s and as a proportion of GDP it has hovered around6 per cent. However, more importantly, the dependenceof government on market borrowings has increasedsharply in this period. The outstanding stocks of bothCentre and State Government debt each increased byabout 10 times since the initiation of reforms (Table 10).From around 20 per cent in the early 1990s, share ofnet market borrowing in financing fiscal deficit of thecentral government has increased to 80 per cent in recentyears (Table 11).
Despite such rapid increase in market borrowing andcontinued dominance of financial intermediaries,especially banks, in the government securities market,there has been substantial reduction in the yield as wellas cost of borrowing of the Government (Tables 12 and13). While a major part of such reductions are in linewith the high liquidity phase of the global financialmarket witnessed in the past few years, the reduction in
Table 10: Outstanding Stock of Central and StateGovernment Securities
(Amounts in Rs. Billion, Ratios in Per cent)
1992 1995 2000 2003 2004
Centre 769 1,375 3,819 6,739 8,243(10.3) (11.6) (18.1) (27.3) (29.7)
States 190 312 739 1,331 1,795(2.5) (2.6) (3.5) (5.4) (6.5)
Note : Figures in bracket are outstanding debt as a ratio of GDP at current marketprices.
Source : Reserve Bank of India.
Table 12: Range of Yield by Maturity of Primary Issues
(Per cent)
Under 5 years 5-10 years Over 10 years
1995-96 13.25-13.73 13.25-14.00 -
1996-97 13.40-13.72 13.55-13.85 -
1997-98 10.85-12.14 11.15-13.05 -
1998-99 11.40-11.68 11.10-12.25 12.25-12.60
1999-00 - 10.73-11.99 10.77-12.45
2000-01 9.47-10.95 9.88-11.69 10.47-11.70
2001-02 - 6.98-9.81 7.18-11.00
2002-03 - 6.65-8.14 6.84-8.62
2003-04 4.69 4.62-5.73 5.18-6.35
Source : Reserve Bank of India.
yield and interest rate started much earlier, indicatingefficiency gains in the government securities market.
Between the mid- and late-1990s, there has been asubstantial widening of maturity profile of governmentsecurities, which has reduced the roll-over risk ofgovernment debt. Apart from reduction in yield, thedispersion of yield rate on different types of governmentsecurities has also declined considerably. These positivedevelopments, to a large extent, reflect the improvedmarket structure for the government securities since theinitiation of reforms. Reflecting the buoyancy of thefixed-income securities market in India, despite almostsecular decline in yield rate across the maturity spectrum,the turnover in the market has increased over ten-timesbetween 1998-99 and 2003-04 (Table 14) (Mohan, 2004).
Table 11: Share of Market Borrowing in Financing of FiscalDeficit of Central Government
(Per cent)
Market Borrowing Other Sources
1991-92 20.7 79.3
1992-93 9.2 90.8
1993-94 48.0 52.0
1994-95 35.2 64.8
1995-96 54.9 45.1
1996-97 30.0 70.0
1997-98 36.5 63.5
1998-99 60.9 39.1
1999-2000 67.1 32.9
2000-01 61.4 38.6
2001-02 62.2 37.8
2002-03 79.3 20.7
2003-04 67.2 32.8
Source : Reserve Bank of India.
Table 13: Weighted Average Yield andMaturity of Outstanding Stock
(Maturity in years and Yield in Per cent)
Years Weighted Range of Weighted WeightedAverage Maturity of Average average
Yield New Loans Maturity maturity ofoutstanding
stock
1995-96 13.75 2--10 5.7 N.A.
1996-97 13.69 2--10 5.5 N.A.
1997-98 12.01 3--10 6.6 6.5
1998-99 11.86 2--20 7.7 6.3
1999-00 11.77 5.26--19.61 12.6 7.1
2000-01 10.95 2.89--20 10.6 7.5
2001-02 9.44 5--25 14.26 8.2
2002-03 7.34 7--30 13.83 8.86
2003-04 5.74 4--30 14.94 9.78
N.A. : Not available.Source : Reserve Bank of India.

866
October Reserve Bank of India Bulletin 2004
866
Table 14: Turnover in Government Securities Market
(Rs. billion)
Outstanding Repos Total
1995-96 176 928 1,272
1996-97 599 254 1,229
1997-98 1,185 208 1,857
1998-99 1,431 381 2,272
1999-00 4,053 757 5,393
2000-01 5,091 1,091 6,981
2001-02 11,385 3,359 14,744
2002-03 13,781 5,635 19,416
2003-04 16,852 9,547 26,399
N.A. : Not available.Source : Reserve Bank of India.
FOREIGN EXCHANGE MARKET
The reforms measures in the foreign exchange markethave resulted in significant deepening of the market interms of both instruments and variety of players. Despitecertain fluctuations, daily average turnover in the Indianforeign exchange market has shown a general increase.A survey by the Bank for International Settlements onthe foreign exchange market turnover during 2001 inwhich 43 countries including India participated revealsthat while foreign exchange market turnover declined theworld over considerably as compared to 1998, it increasedin India. The turnover has increased particularly in recentyears (Table 15).
In recent years, the turnover in the foreign exchangemarket has been nearly 6 times higher than the aggregatesize of India’s balance of payments. While inter-banktransactions accounted for about 80 per cent of theturnover in the foreign exchange market, merchanttransactions registered high growth rates in recent years.The increased turnover can be taken as an indicator ofthe extent of liberalisation of the Indian foreign exchangemarket and the consequent deepening of the foreignexchange market. Full convertibility on the currentaccount and extensive liberalisation of the capital accounttransactions have facilitated not only transactions inforeign currency, these have enabled the corporates tohedge various types of risks associated with foreigncurrency transactions.
Authorised Dealers (ADs) are the leading agenciesin the transmission of the liberalisation measures in thecontext of foreign exchange market as well as wideningand deepening of such markets. ADs also facilitate
Table 15: Turnover in Indian Foreign Exchange Market
(US $ billion)
Year Average Daily Turnover
1998 5.22
1999 5.31
2000 4.74
2001 5.74
2002 5.95
2003 6.34
Source : Reserve Bank of India.
corporates in hedging foreign currency risk exposures.With the deepening of foreign exchange market andincreased turnover, income of commercial banks throughsuch transactions increased considerably. In recent years,profit from foreign exchange transactions accounted for20-30 per cent of the total profit of the public sectorbanks.
Despite liberalisation of the capital account andintroduction of a market determined exchange rate, theforeign exchange market in India remained stable barringa few episodes of mild volatility (Table 16). Therefore,India’s current exchange rate policy of managingvolatility without fixed target levels has yieldedsatisfactory results. It is, however, important to pointout that RBI intervention in the foreign exchange markethas been relatively small in terms of volume. During2002-03, a year considered to be characterised byconsiderable intervention by the Reserve Bank, grossintervention by the Reserve Bank of India accountedfor less than 3 per cent of the turnover in the foreignexchange market. This shows the predominant role ofmarket forces in determination of the external value ofthe rupee.
Reflecting the resilience of the Indian economy, inparticular the financial sector, there has been a largeinflow of funds towards the country in recent years. Thishas reflected in large accumulation of foreign exchangereserves (Table 17). An analysis of the sources of reserveaccretion indicates that buoyancy in services exports, largeunilateral private transfers reflecting mainly remittancefrom Diaspora, and various types of non-debt creatingcapital inflows have been the major source for theaccumulation of foreign exchange reserves. It is interestingto note that while financial sector reforms started at thebackdrop of external sector crisis, India’s foreignexchange reserves reached historical peaks when thecountry has substantially liberalised norms governing

867
October Reserve Bank of India Bulletin 2004
867
flows of foreign exchange. Accumulation of foreignexchange reserves also reflects monetary policy responsein face of large capital inflows. The process has beensuccessful in maintaining price stability. Availableindicators of reserve adequacy suggest that India’s currentlevel of foreign exchange reserves can be considered
adequate as a cushion against potential disruptions to tradeand current transactions as well as external debt servicingobligations. In the absence of an international lender oflast resort, the reserves also provide the country a levelof self-insurance against destabilising and costly financialcrisis.
Table 17: India's Foreign Exchange Reserves
(US $ million)
Year Gold SDRs Foreign Total Reserve Position Outstanding Use ofCurrency Position in the Fund IMF Credit
Mar-93 3,380 18 6,434 9,832 296 4,799
Mar-94 4,078 108 15,068 19,254 299 5,040
Mar-95 4,370 7 20,809 25,186 331 4,300
Mar-96 4,561 82 17,044 21,687 310 2,374
Mar-97 4,054 2 22,367 26,423 291 1,313
Mar-98 3,391 1 25,975 29,367 283 664
Mar-99 2,960 8 29,522 32,490 663 287
Mar-00 2,974 4 35,058 38,036 658 26
Mar-01 2,725 2 39,554 42,281 616 0
Mar-02 3,047 10 51,049 54,106 610 0
Mar-03 3,534 4 71,890 75,428 672 0
Mar-04 4,198 2 107,448 112,959 1,311 0
Sept. 17, 2004 4,140 1 112,919 118,359 1,299 0
Source: Reserve Bank of India.
Table 16: Trends in External Value of the Rupee
(Per cent)
Export-Based Weights Trade-Based Weights
REER %Variation NEER %Variation REER %Variation NEER %Variation
1990-91 73.3 -5.2 66.2 -7.6 75.6 -3.6 67.2 -6.9
1991-92 61.4 -16.3 51.1 -22.8 64.2 -15.1 52.5 -21.9
1992-93 54.4 -11.3 42.3 -17.3 57.1 -11.1 43.5 -17.2
1993-94 59.1 8.6 43.5 2.8 61.6 7.9 44.7 2.8
1994-95 63.3 7.1 42.2 -2.9 66.0 7.2 43.4 -2.9
1995-96 60.9 -3.7 38.7 -8.2 63.6 -3.7 39.7 -8.4
1996-97 61.1 0.3 38.1 -1.7 63.8 0.3 39.0 -1.9
1997-98 63.8 4.3 38.9 2.2 67.0 5.0 40.0 2.7
1998-99 60.1 -5.7 35.3 -9.3 63.4 -5.3 36.3 -9.2
1999-00 59.7 -0.7 34.3 -2.9 63.3 -0.2 35.5 -2.4
2000-01 62.5 4.6 34.2 -0.2 66.5 5.1 35.5 0.2
2001-02 64.4 3.0 34.5 0.9 68.4 2.8 35.8 0.7
2002-03 67.9 5.5 35.4 2.5 72.8 6.3 37.1 3.6
2003-04 69.7 2.6 34.9 -1.5 74.1 1.9 36.3 -2.2
REER : Real effective exchange rate. NEER : Nominal effective exchange rate.
Note : Both REER and NEER are based on 36 country bilateral weight-based index.
Source : Reserve Bank of India.

868
October Reserve Bank of India Bulletin 2004
868
OTHER FINANCIAL INTERMEDIARIES
In line with banks, there has been an almost across-the-board improvement in the financial health of otherfinancial intermediaries as well in terms of improvementsin capital position and reduction in NPLs. Among thecooperative banks, there have been improvements incapital position, reduction in spread and operatingexpenses. Despite the decline in NPLs as a proportion oftotal assets for a majority of the cooperative banks, theratio for some of the large cooperative banks increasedsignificantly, mainly on account of inappropriate risk-management and corporate governance practices.Measures have been put in place to guard againstrepetition of such episodes, but this remains a burden.
Capital adequacy levels of most of the major DFIshave improved while NPL levels declined since the mid-1990s. Moreover, reflecting the adaptability of DFIs tochanged business environment under the reform process,the share of para-banking activities such as underwriting,direct subscription and guarantees has increased from 10per cent in the early-1990s to over 30 per cent in recentyears. Some of the DFIs, however, have not been able toadjust as well as the others in the new environment mainlybecause of their past investment behaviours. Moreover, afew of the large DFIs felt that they could perform betteras banks under the new environment. ICICI has alreadytransformed itself into a bank and similar moves areunderway for the Industrial Development Bank of India(IDBI). There has also been a large transformation in theNBFC sector, whereby a large number of NBFCs havediscontinued their public deposit taking activities.
Under the strategy of sequenced reform, suchmeasures in the insurance sector were introduced laterthan the banking sector. Despite this relatively late start,the insurance sector has witnessed considerable changesover the past few years. A large number of privateinsurance companies, generally with foreign capitalparticipation, have entered the sector. The current profileof the Indian insurance industry reflects that,notwithstanding the entry of private sector players, interms of both assets and liabilities, insurance companiesfrom the public sector continue to dominate the industry.Despite this, given the fast pace of growth in the insuranceindustry, private players have been able to market theirproducts (IRDA, 2002).
Perhaps more importantly, liberalisation of entrynorms in insurance segment has brought about a sea
change in product composition. While in the past, taxincentives were the major driving force of the insuranceindustry, particularly life insurance industry, in theemerging situation the normal driving force of aninsurance industry is taking important roles (IRDA, 2002).Driven by competitive forces and also the emerging socio-economic changes including increased wealth, educationand awareness about insurance products have resulted inintroduction of various novel products in the Indianmarket. Along with the changing product profile, therehave also been salutary improvements in consumer servicein recent years, driven largely by the impact of newtechnology usage, better technical know-how consequentupon foreign collaboration and focused product targeting,dovetailed to specific segments of the populace as wellas cross-selling of products through bancassurance.Insurance companies are also taking active steps toventure into innovative distribution channels for theirproducts over and above creating strong agency network.
EQUITY MARKET
The 1990s have been good for the Indian equitymarket. The market has grown exponentially in terms ofresource mobilisation, number of stock exchanges, numberof listed stocks, market capitalisation, trading volumes,turnover and investors’ base (Table 18). Along with thisgrowth, the profile of the investors, issuers andintermediaries has changed significantly. The market haswitnessed a fundamental institutional change resulting indrastic reduction in transaction costs and significantimprovement in efficiency, transparency and safety (NSE,2003). In the 1990s, reform measures initiated by SEBIsuch as, market determined allocation of resources, rollingsettlement, sophisticated risk management and derivativestrading have greatly improved the framework andefficiency of trading and settlement. Almost all equitysettlements take place at the depository. As a result, theIndian capital market has become qualitatively comparableto many developed and emerging markets.
The liberalisation and consequent reform measureshave drawn the attention of foreign investors leading toa rise in portfolio investment in the Indian capital market.During the first half of the 1990s, India accounted for alarger volume of international equity issues than any otheremerging market (IMF, 1995). Over the recent years, Indiahas emerged as a major recipient of portfolio investmentamong the emerging market economies. Apart from suchlarge inflows, reflecting the confidence of cross-border

869
October Reserve Bank of India Bulletin 2004
869
investors on the prospects of Indian securities market,since 1993, when entry of FII was permitted for the firsttime, except for one year, India received positive portfolioinflows in each year. The stability of portfolio flowstowards India is in contrast with large volatility ofportfolio flows in most emerging market economies.
VI. ISSUES
As the foregoing analysis suggests, there has been astructural transformation in almost all segments of theIndian financial sector since the initiation of reforms. Thereform process has strengthened the health of financialintermediaries, deepened financial markets and enhancedthe instruments available in the financial system. At thelevel of individual institutions as well as at the systemiclevel, there has been considerable reinforcement of theframework for stability. There have also been discernibleimprovements in the competitiveness, efficiency andproductivity of the Indian financial system. What thenare important issues facing the Indian financial systemnow?
Even after one and a half decades of financial sectorreforms, continued predominant public sector entities inthe sector has often been a topic of debate. India’sexperience in this respect is different from many otheremerging market economies, especially the transitioncountries, where financial sector reforms resulted inprivatisation of erstwhile public sector financialintermediaries. In the late 1990s, India too proposedlegislative change to enable reduction in governmentownership up to 33 per cent in the public sector banks.It was proposed that notwithstanding such ownershippattern change, these banks “would retain their publicsector character”. The proposal, however, failed to meetparliamentary approval, indicating a lack of politicalacceptability on privatisation so far. Meanwhile publicsector banks continue to raise capital from market and innine public sector banks, including the State Bank of
India, the largest Indian bank, private ownerships havebecome close to 40 per cent. It is also important to recallthat this paper has shown that since the initiation ofreforms, financial health as well as efficiency of the publicsector banks closely matched and some times surpassedthose of the private sector including foreign banks.Therefore, there is no definite observed link betweenefficiency and ownership in the contemporary Indianbanking system. The competition induced by the newprivate sector banks has clearly re-energised the Indianbanking sector as a whole: new technology is now thenorm, new products are being introduced continuously,and new business practices have become common place.
India’s approach towards treatment of insolvent banksis yet another interesting issue. Rather than closing themdown, policymakers in India have shown a preference tomerge such banks with healthy public sector banks. Ithas been felt in certain circles that such an approach maygive rise to a moral hazard problem. However, two issuesneed consideration in this context. First, commercial banksare the most dominant and systemically important segmentof the financial system. Second, over 70 per cent of thebank depositors in India are small depositors. Therefore,systemic concerns coupled with the necessity to safeguardthe interest of small depositors have been paramount inthe minds of policy makers while dealing with insolventbanks. This issue had not received much attention in thecontext of a predominantly government owned bankingsystem. As the weight of private banks increases furtherthinking will need to be done on this subject, both interms of prevention of insolvency through advanceregulatory supervision and action, and post insolvencymeasures that discourage moral hazard and eventual fiscalcost.
Certain banking sector and related indicators on selectemerging market economies (EMEs) have been presentedin Annex I. Some broad points can be drawn from thesedata. First, while almost all EMEs have been successfulin reducing domestic inflation rates since the 1990s, mostof them experienced occasional inflationary spikes in this
Table 18: Select Stock Market Indicators in India
(Per cent)
Year (end-March) 1961* 1971* 1980* 1991 2000 2002 2003
Number of stock exchanges 7 8 9 22 23 23 23
Number of listed companies 1,203 1,599 2,265 6,229 9,871 9,644 9,413
Market capitalisation (Rs. Billion) 12 27 68 1,103 11,926 7,493 6,319
* End-December, the Stock Exchange, Mumbai only.Source : The Stock Exchange (BSE), Mumbai and National Stock Exchange (NSE).

870
October Reserve Bank of India Bulletin 2004
870
period. Reversing the situation, in the new millennium,countries such as China and Singapore experienceddeflationary situations. Along with sustained reduction ininflation during the reform period, India has been able toavoid both the extreme situations. This can be taken asan indicator of the quality of financial sector reforms andmonetary management in the country. Second, thoughlower than most of the East Asian EMEs, Indiamaintained reasonably high and generally rising savingsand investment rates since the 1990s. Stability in thefinancial market under the reform process has facilitatedthis process. Third, compared to most other EMEs, Indiamaintained a stable real interest rate situation under thereform process. The generally increasing trend of the realrate, however, is an issue that needs greater attention ofthe authorities. Various steps have already been initiatedin this context. Fourth, while banks in India needed tokeep high proportions of their assets as liquid assets atthe start of reform process, such requirements have beenrelaxed in a sequenced manner. Currently, theserequirements in India are on the lower side among theEMEs. Lastly, despite substantial deepening of the Indianfinancial system as measured by the domestic bank creditto GDP ratio and domestic credit to private sector to GDPratio, such processes are yet to catch-up the levels of theEast Asian EMEs. This is yet another area where theIndian financial sector needs to make significant stridesin the coming years.
Judged by the conventional measures such as shareof foreign holdings in the Indian financial market, theextent of globalisation of Indian financial sector maylook quite limited as compared to many other EMEs.Moreover, association of the authorities in the financialsystem either in the form of government ownership offinancial intermediaries or intervention in the financialmarket may appear to be high. The conduct of the Indianfinancial sector in the face of various uncertainties andcrises in various parts of the world, however, driveshome the point that “On balance, there appears to be agreat advantage in well-managed and appropriateintegration into the global process … markets do notand cannot exist in a vacuum, i.e., without someexternally imposed rules and such order is a result ofpublic policy” (Reddy, 2003). Similar views have beenexpressed in the influential work of Prasad and others(Prasad et al, 2003), “The empirical evidence has notestablished a definitive proof that financial integrationhas enhanced growth for developing countries.
Furthermore, it may be associated with higherconsumption volatility. … (I)mproving governance, inaddition to sound macroeconomic frameworks and thedevelopment of domestic financial markets, should bean important element of such strategies”. It is importantto point out that despite the earlier apprehensions aboutthe outcome of India’s approach of sequencedimplementation of international best practices in thefinancial sector and gradual opening up of the sector tointernational competition, such measures have enabledthe country to avoid major financial sector crisisexperienced by many emerging market economies sincethe 1990s. A list of such crises is given in the Annex IIand the country experiences show that prematureglobalisation financial market and lack of prudentialframework for financial regulation and supervision havebeen two major reasons for financial crises in emergingmarket economies. Indian policy makers have beenconscious of the fact that international financial marketacts in a strongly pro-cyclical manner in the case ofEMEs. At the same time, these countries, especiallydisadvantaged strata within these economies, areseriously constrained in managing the impact of suchvolatility. Therefore, maintenance of stability becomesa part of public policy in the emerging market countries(Reddy, 2003). Accordingly, concern for stability hasbeen a major plank of the financial sector reforms inIndia. Available indicators reinforce India’s resolve forthe continuance of this approach.
Despite the considerable progress in terms of bothefficiency and stability of the financial sector under thereform process, it needs to be reiterated that India hasmiles to go in deepening the process. Despite considerableimprovements, the current level of efficiency of the Indianfinancial sector is far from satisfactory. Reduction intransaction costs and improving the credit deliverymechanism are two areas, which require focused attentionat the current stage of reforms. There are needs for theconsolidation of the banking system in India and atpresent there are still various institutional and legalreforms that still need attention.
Effective implementation of corporate governancepractices in financial intermediaries has been a long-standing concern of the regulators and supervisors acrossthe world. In India too, instances of inadequacies in theimplementation of corporate governance norms anddisregard to prudential practices on internal control havecome to light. Such instances have seriously compromised

871
October Reserve Bank of India Bulletin 2004
871
the financial health of a few private sector commercialbanks and cooperative banks. Prompt corrective actionsincluding criminal proceedings against the errantindividuals have been initiated by the authorities in suchcases. In order to guard against recurrence of suchpractices the Reserve Bank has taken various measuresincluding implementation of important facets ofinternational best practices in corporate governance andinternal control, strengthening of the role of statutoryauditors, recasting of the supervisory framework andincreased disclosure to strengthen the role of marketdiscipline. In the cooperative banking sector, continuationof multiple regulators has been identified as a majorchallenge before the authorities in effective regulation andsupervision including implementation of corporategovernance and internal control norms. The Reserve Bankhas suggested jurisdiction of a single regulator to dealwith this banking segment.
Despite decline, continuation of considerable stockof NPLs in the banking system continues to be a causefor concern. Improved institutional and legal arrangementsand strengthening of risk management practices by banksis likely to keep incremental NPLs low. Initiatives suchas setting up of Asset Reconstruction Companies andgreater emphasis on compromise settlements are likelyto deal with the stock problem for NPLs. Banks mayneed to adopt a more pro-active approach in dealing withthese issues.
Enforcement of creditors rights will need continuousstrengthening. The implementation of recent legislationwill progressively be subject to judicial testing as it getsmore accepted and as problems occur in its application.The legal provisions and practice in bankruptcy of thereal sector are still inadequate and need further reform.
Another area of concern relates to the decline indirect bank credit towards disadvantaged but sociallyimportant sectors such as agriculture and small-scaleindustries. It is felt that in the past inadequate riskmanagement practices constrained banks to morevigorously pursue financing of such sectors. Withimproved risk management, it is likely that banks woulddeploy larger portions of their funds in these sectors.As this assessment and risk management practicesimprove, banks should be able to distinguish the riskquality of individual borrowers, rather than treatingborrowers of a particular class as equally risky. Theintroduction of credit information bureau is in itsinfancy: the large scale availability of credit histories
of borrowers at low cost is essential for better creditdelivery, particularly for smaller borrowers.
DEBT MARKET
The Indian debt market ranks third in Asia, after Japanand South Korea, in terms of issued amount. Outstandingsize of the debt floatation as a proportion of GDP,however, is not very high in India. Moreover, althoughin terms of the primary issues Indian debt market is quitelarge, the Government continues to be the large borrower,unlike in South Korea where the private sector is the mainborrower. The corporate debt market in the country isstill at a nascent stage. Factors such as lack of goodquality issuers, institutional investors, supportinginfrastructure and high cost of issuance, marketfragmentation, etc. have been identified as the reason forlack of depth of the corporate debt market in India(Mohan, 2004). However, to place India on a high andsustained growth trajectory and particularly to meet thehuge financing needs of the infrastructure projects, it isnecessary to develop the corporate bond market.
As the debt market becomes larger, both forgovernment securities and for corporate debt, its efficientfunctioning will depend a great deal on deepening ofliquidity in the market so that trading becomes easier andmore efficient. The government securities market needsto be widened much more to non-bank participants suchas insurance companies, pension and provident funds, andmany real sector participants who need fixed instrumentsfor their treasury management. This will need greatertrading of debt in the stock exchanges and better pricediscovery through anonymous, screen based, ordermatching systems. With increasing interest rate movement,in both directions, the efficient functioning of the debtmarket will also be aided by further development of thederivatives market. However, this has to be done in acareful manner, while ensuring that market participantshave adequate risk management systems.
Financial sector reforms in India were initiated earlyin the reform cycle. Complementary measures in otherareas including fiscal and external sector provided thecrucial support to the financial sector reform process. Inorder to deepen the financial sector reforms further, it isessential that significant reform measures are initiated inother segments of the economy including real sectors.Since the early 1990s, India as well as the world economyhave undergone a structural transformation. An enduringdevelopment has been the changed perception about India

872
October Reserve Bank of India Bulletin 2004
872
– both internally and from the rest-of-the-world. WhileIndia assumes a more pivotal role in the global arena,internally the country needs to reassess the future courseof restructuring process. Managing heightenedexpectations is going to be the major challenge of futurepublic policy in India since, this, on the one hand,provides the country to take a quantum jump in terms ofdevelopment, but, on the other hand, even a small slippagein the policy framework may prove to be the undoing ofthe past painstaking reform efforts. As envisaged by the10th Plan, India is posed to attain 8 per cent per annumgrowth rate on a consistent basis. This was even outsidethe realm of wishful thinking a few years back.Appropriate sequencing and repackaging of reformmeasures with changed emphasis and relative speed ofreforms at various sectoral levels would ultimatelydetermine whether India would be able to leapfrog intothe new growth trajectory.
REFERENCES
Ahluwalia, M. S. (2002). “Economic Reforms in Indiasince 1991: Has Gradualism Worked?” Journal ofEconomic Perspectives, 16, (3), 67-88.
Government of India (GoI) (1998). Report of theCommittee on Banking Sector Reforms (Chairman: ShriM. Narasimham), Government of India, New Delhi.
Hanson, J. A. and S. Kathuria, (1999). India: A FinancialSector for the Twenty-First Century, New Delhi,
Insurance Regulatory and Development Authority (IRDA)(2002). Annual Report, IRDA, Mumbai.
International Monetary Fund (IMF) (1995). IMF Survey,IMF, Washington, D.C.
Mohan, R. (2002). “Transforming Indian Banking: InSearch of a Better Tomorrow”, Valedictory address at theTwenty-Fourth Bank Economists’ Conference, Bangalore,printed in Reserve Bank of India Bulletin, January 2003.
— (2004). “A Decade of Reforms in the GovernmentSecurities Market and Agenda for the Future”, KeynoteAddress at FIMMDA-PDAI Conference, Dubai.
National Stock Exchange (NSE) (2003). Indian SecuritiesMarket Review, NSE, Mumbai.
Prasad, Eswar, Kenneth Rogoff, Shang-Jin Wei, and M.Ayhan Kose (2003). “Effects of Financial Globalisationon Developing Countries: Some Empirical Evidence”,mimeo, International Monetary Fund.
Rangarajan, C. (1998). “Banking Sector Reforms:Rationale and Relevance”, SICOM Silver JubileeMemorial Lecture, Mumbai.
Reddy, Y. V. (2002). “Public Sector Banks and theGovernance Challenge: Indian Experience” Paperpresented at World Bank, International Monetary Fund,and Brookings Institution Conference on Financial SectorGovernance: The Roles of the Public and Private Sectors,New York, USA.
— (2002 a). “Monetary and Financial Sector Reforms inIndia: A Practitioner’s Perspective”, Presentation at theIndian Economy Conference, Cornell University, USA.
— (2003). “Towards Globalisation in the Financial Sectorin India”, Inaugural address at the Twenty-Fifth BankEconomists’ Conference, Mumbai.
Reserve Bank of India (1991). Report of the Committeeon the Financial System (Chairman: Shri M.Narasimham), Reserve Bank of India, Mumbai.
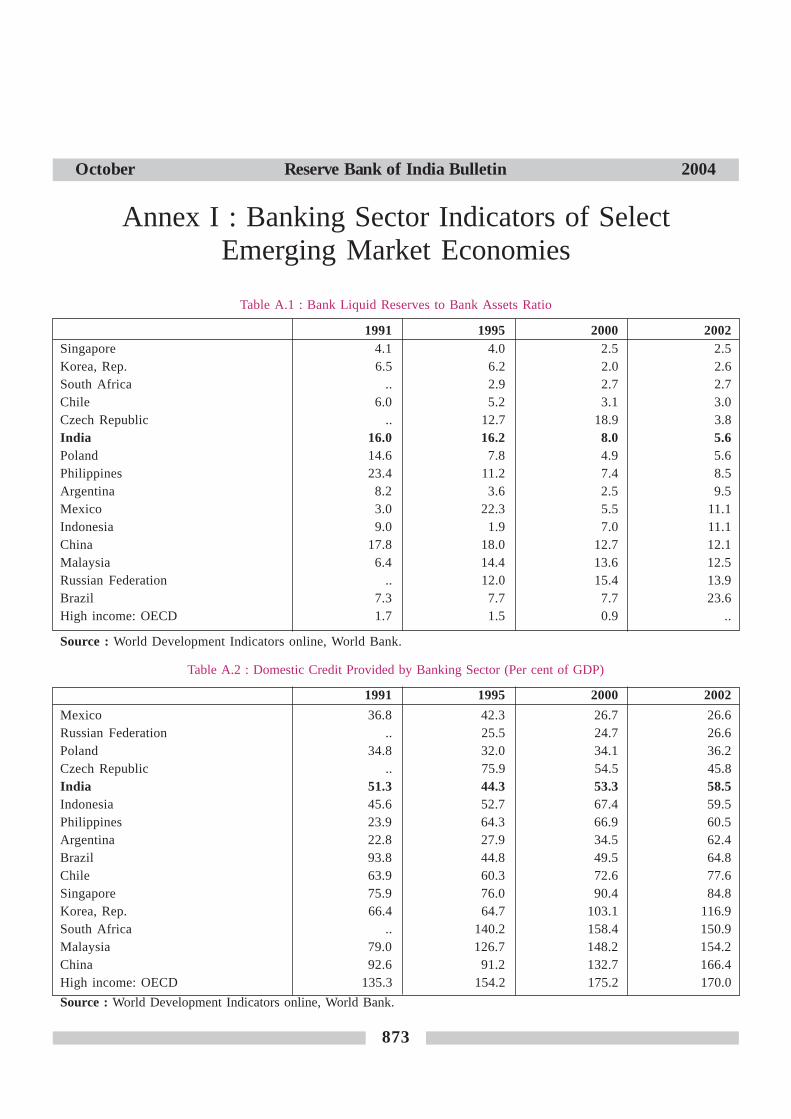
873
October Reserve Bank of India Bulletin 2004
873
Annex I : Banking Sector Indicators of SelectEmerging Market Economies
Table A.1 : Bank Liquid Reserves to Bank Assets Ratio
1991 1995 2000 2002Singapore 4.1 4.0 2.5 2.5Korea, Rep. 6.5 6.2 2.0 2.6South Africa .. 2.9 2.7 2.7Chile 6.0 5.2 3.1 3.0Czech Republic .. 12.7 18.9 3.8India 16.0 16.2 8.0 5.6Poland 14.6 7.8 4.9 5.6Philippines 23.4 11.2 7.4 8.5Argentina 8.2 3.6 2.5 9.5Mexico 3.0 22.3 5.5 11.1Indonesia 9.0 1.9 7.0 11.1China 17.8 18.0 12.7 12.1Malaysia 6.4 14.4 13.6 12.5Russian Federation .. 12.0 15.4 13.9Brazil 7.3 7.7 7.7 23.6High income: OECD 1.7 1.5 0.9 ..
Source : World Development Indicators online, World Bank.
Table A.2 : Domestic Credit Provided by Banking Sector (Per cent of GDP)
1991 1995 2000 2002
Mexico 36.8 42.3 26.7 26.6Russian Federation .. 25.5 24.7 26.6Poland 34.8 32.0 34.1 36.2Czech Republic .. 75.9 54.5 45.8India 51.3 44.3 53.3 58.5Indonesia 45.6 52.7 67.4 59.5Philippines 23.9 64.3 66.9 60.5Argentina 22.8 27.9 34.5 62.4Brazil 93.8 44.8 49.5 64.8Chile 63.9 60.3 72.6 77.6Singapore 75.9 76.0 90.4 84.8Korea, Rep. 66.4 64.7 103.1 116.9South Africa .. 140.2 158.4 150.9Malaysia 79.0 126.7 148.2 154.2China 92.6 91.2 132.7 166.4High income: OECD 135.3 154.2 175.2 170.0
Source : World Development Indicators online, World Bank.
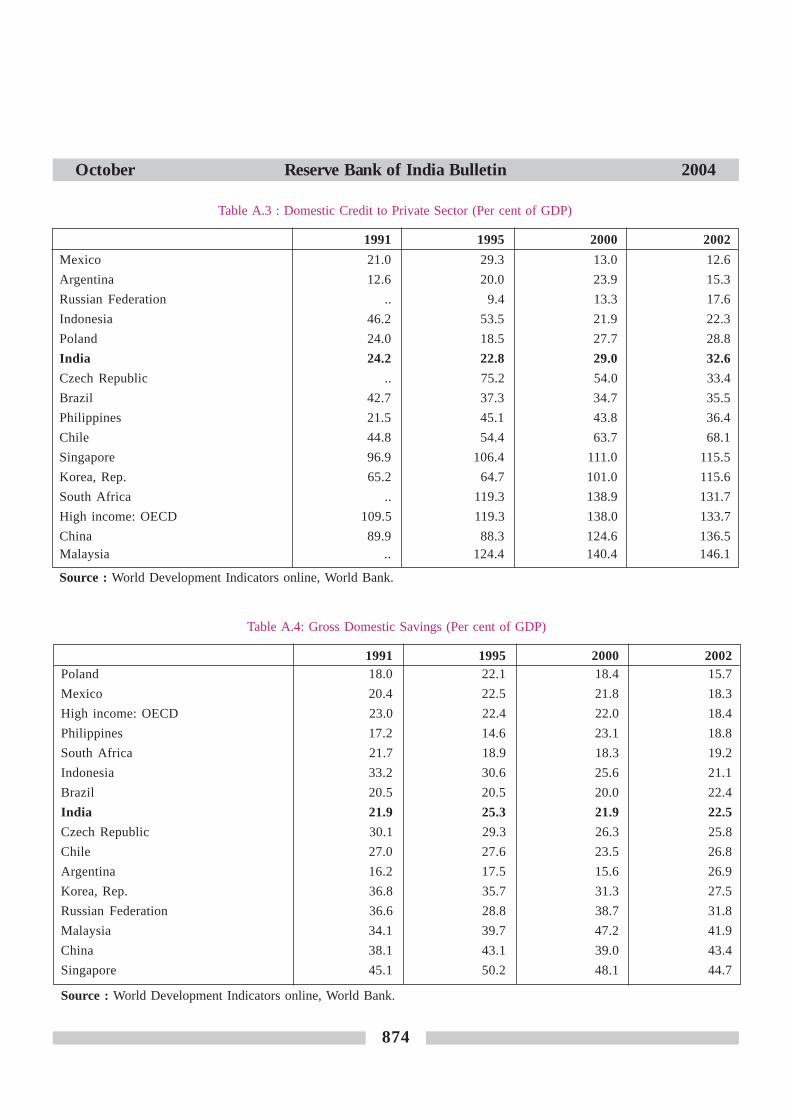
874
October Reserve Bank of India Bulletin 2004
874
Table A.3 : Domestic Credit to Private Sector (Per cent of GDP)
1991 1995 2000 2002
Mexico 21.0 29.3 13.0 12.6
Argentina 12.6 20.0 23.9 15.3
Russian Federation .. 9.4 13.3 17.6
Indonesia 46.2 53.5 21.9 22.3
Poland 24.0 18.5 27.7 28.8
India 24.2 22.8 29.0 32.6
Czech Republic .. 75.2 54.0 33.4
Brazil 42.7 37.3 34.7 35.5
Philippines 21.5 45.1 43.8 36.4
Chile 44.8 54.4 63.7 68.1
Singapore 96.9 106.4 111.0 115.5
Korea, Rep. 65.2 64.7 101.0 115.6
South Africa .. 119.3 138.9 131.7
High income: OECD 109.5 119.3 138.0 133.7
China 89.9 88.3 124.6 136.5Malaysia .. 124.4 140.4 146.1
Source : World Development Indicators online, World Bank.
Table A.4: Gross Domestic Savings (Per cent of GDP)
1991 1995 2000 2002Poland 18.0 22.1 18.4 15.7
Mexico 20.4 22.5 21.8 18.3
High income: OECD 23.0 22.4 22.0 18.4
Philippines 17.2 14.6 23.1 18.8
South Africa 21.7 18.9 18.3 19.2
Indonesia 33.2 30.6 25.6 21.1
Brazil 20.5 20.5 20.0 22.4
India 21.9 25.3 21.9 22.5
Czech Republic 30.1 29.3 26.3 25.8
Chile 27.0 27.6 23.5 26.8
Argentina 16.2 17.5 15.6 26.9
Korea, Rep. 36.8 35.7 31.3 27.5
Russian Federation 36.6 28.8 38.7 31.8
Malaysia 34.1 39.7 47.2 41.9
China 38.1 43.1 39.0 43.4
Singapore 45.1 50.2 48.1 44.7
Source : World Development Indicators online, World Bank.

875
October Reserve Bank of India Bulletin 2004
875
Table A.6 : Inflation, Consumer Prices (annual %)
1991 1995 2000 2002
China 3.5 16.9 0.3 -0.8
Singapore 3.4 1.7 1.4 -0.4
Czech Republic .. 9.2 3.9 1.8
Malaysia 4.4 3.5 1.5 1.8
Poland 76.7 28.1 10.1 1.9
Chile 21.8 8.2 3.8 2.5
Korea, Rep. 9.3 4.4 2.2 2.8
Philippines 18.5 8.0 4.4 3.1
India 13.9 10.2 4.0 4.4
Mexico 22.7 35.0 9.5 5.0
Brazil 432.8 66.0 7.0 8.4
South Africa 15.3 8.7 5.3 9.2
Indonesia 9.4 9.4 4.5 11.5
Russian Federation .. 197.5 20.8 15.8
Argentina 171.7 3.4 -0.9 25.9
Source : World Development Indicators online, World Bank.
Table A.5 : Gross Fixed Capital Formation (Per cent of GDP)
1991 1995 2000 2002
Argentina .. 17.9 16.2 12.0
South Africa 17.2 15.9 14.8 15.1
Russian Federation 23.3 21.1 16.9 17.9
Poland 19.5 18.6 23.9 18.6
Mexico 18.7 16.2 21.4 18.9
High income: OECD 22.6 21.2 21.9 19.0
Philippines 20.0 22.2 21.2 19.2
Brazil 18.1 20.5 21.8 19.3
Indonesia 27.0 28.4 21.8 20.2
Chile 19.9 23.9 21.0 21.6
India 22.0 24.4 22.0 22.5
Malaysia 36.4 43.6 25.6 23.2
Singapore 33.6 33.4 30.0 25.7
Czech Republic 24.1 32.0 28.3 26.3
Korea, Rep. 39.0 36.7 28.4 26.7
China 27.5 34.7 36.5 40.2
Source : World Development Indicators online, World Bank.
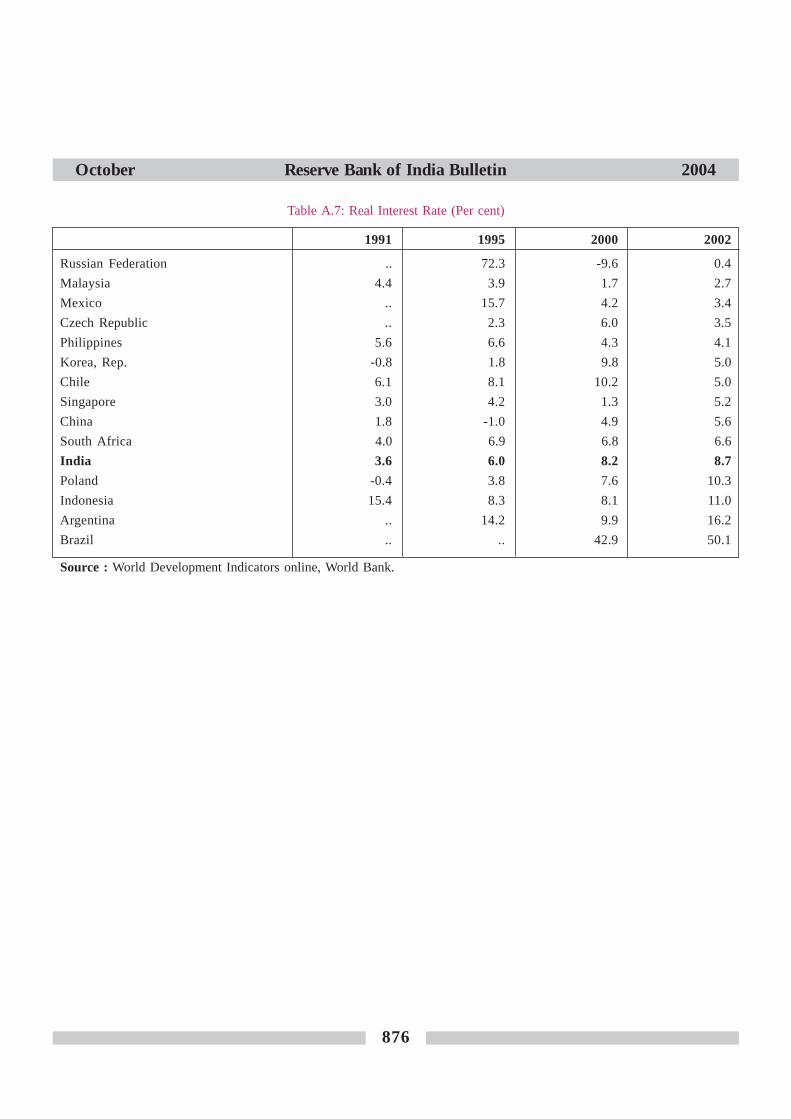
876
October Reserve Bank of India Bulletin 2004
876
Table A.7: Real Interest Rate (Per cent)
1991 1995 2000 2002
Russian Federation .. 72.3 -9.6 0.4
Malaysia 4.4 3.9 1.7 2.7
Mexico .. 15.7 4.2 3.4
Czech Republic .. 2.3 6.0 3.5
Philippines 5.6 6.6 4.3 4.1
Korea, Rep. -0.8 1.8 9.8 5.0
Chile 6.1 8.1 10.2 5.0
Singapore 3.0 4.2 1.3 5.2
China 1.8 -1.0 4.9 5.6
South Africa 4.0 6.9 6.8 6.6
India 3.6 6.0 8.2 8.7
Poland -0.4 3.8 7.6 10.3
Indonesia 15.4 8.3 8.1 11.0
Argentina .. 14.2 9.9 16.2
Brazil .. .. 42.9 50.1
Source : World Development Indicators online, World Bank.

877
October Reserve Bank of India Bulletin 2004
877
Annex II : Major Financial Crises Since the 1990sNature of Crises
ERM crisis of 1992-93,affected the countries under theExchange Rate Mechanism
Currency crisis in Mexico in1994-95 which graduated intoa debt crisis
East Asian currency crisiswhich started with the collapseof the Thai Baht in July 1997engulfed other Asian countrieslike South Korea, Indonesia,Philippines and Malaysia
Russian currency crisis inAugust 1998
Brazilian currency crisis inFebruary 1999
Argentinean crisis inSeptember 2001
Crisis in Turkey in 2001
Reasons
The ERM crisis brought into focus the ability of speculators to precipitate acrisis and the limited ability of available foreign exchange reserves to stem therun on a currency in a world of volatile capital flows. The ERM crisis alsohighlighted the trade-off between monetary and exchange rate managementpolicies under a convertible currency.
Volatile capital flows resulted in a currency crisis, which graduated into a debtcrisis with the inability of the government to redeem the ‘tesebonos’, whichwere short-term debt instruments repayable in Pesos but were indexed to the USdollar issued by the Mexican Government.
The crisis reflected a typical case of structural imbalance and some majordeficiencies in the affected economies. Uncontrolled capital account liberalisationon the back of weak financial systems that were characterised by poor monitoringand surveillance, inappropriate policy stances such as pegged exchange ratesand unlimited access to foreign currency loans for the private sector led to thecrisis. Lack of timely and adequate financial assistance from the multilateralinstitutions, at least initially, seems to have exacerbated the crisis.
Faced with significantly large capital outflows in the face of inadequate reserves,Russia defaulted on its domestic and external debt in August 1998. It subsequentlydevalued its currency, thereby disrupting the international economy to a certainextent.
In February 1999, following months of speculative pressure and in spite of alarge IMF rescue package, the Brazilian Real was devalued. Reasons includedvolatile capital flows and fundamental problems associated with the adoption ofthe Real Plan (1994) to control hyperinflation. Inadequate fiscal consolidationalso led to fears of default, high interest rates, and a consequent debt spiral.
In September 2001, Argentina defaulted on almost US $ 3 billion debt owed byit to the IMF. Interactions between an unsustainable fiscal regime and the existingcurrency board arrangement in the face of unfavourable external developmentswere the most crucial elements in the Argentine crisis.
The immediate cause of crisis in Turkey in 2001 was a combination of portfoliolosses and liquidity problems in a few banks, which triggered a loss of confidencein the entire banking system leading to a reversal of capital flows. The TurkishLira was devalued by 30 per cent in February 2001 and the Government adopteda floating exchange rate regime to keep most of its reserves intact.