October 3, 2019
53
Opportunity International US Strategic Plan 2020-2022 OIUS Board Meeting Chicago, IL October 3, 2019
Transcript of October 3, 2019

Opportunity International US Strategic Plan 2020-2022
OIUS Board Meeting Chicago, ILOctober 3, 2019

2
“For which of you, desir ing to bui ld a tower, does not f irst si t down and count the cost, whether
he has enough to complete i t?” Luke14:28

3 | OPPORTUNITY INTERNATIONAL
TABLE OF CONTENTS
• Client Impact Plan: Executive Summary• 2020-2022 Financial Plan• Fundraising Plan Summary• Program Business Plans (provided in separate
attachment)

4 | OPPORTUNITY INTERNATIONAL
STRATEGIC PLAN PROCESS

5 | OPPORTUNITY INTERNATIONAL
OPPORTUNITY INTERNATIONAL’S MANDATE
• Vision: Our vision is a world in which all people have the opportunity to achieve a life free from poverty, with dignity and purpose
• Mission: By providing financial solutions and training, we empower people living in poverty to transform their lives, their children’s futures and their communities.
• Motivation: We respond to Jesus Christ’s call to love and serve the poor. We seek to emulate the Good Samaritan, whose compassion crossed ethnic groups and religions. We serve all people regardless of religion, race, ethnicity, or gender.
6 | OPPORTUNITY INTERNATIONAL
Client Impact Plan: Executive Summary

7 | OPPORTUNITY INTERNATIONAL
24m Clients
Banking SchoolsFarmsInsurance
70 Finance Institutions and 53 MFIs, Banks and S&Ls Created by OI. 17 MFIs Recruited to Network
• $9b loaned to 24m clients
• 125m family members impacted
• 22m jobs created
• 6m clients with savings accounts
MicroEnsure starts as product line at Opportunity MFIs• OI spins out as
Independent Company to reach more families
• Gates provides $24m for global expansion
• Omidyar, IFC and Telenor invest. OI divests
• MicroEnsure the Global Leader!
55m Insured 600k Farms 4m students Ag Finance: 2008• $250m loaned
• 8 countries in program
• 6 USAID loan guarantees
• Measurable increases in yields and income
• Farmer support agent program established
• Ready for scale
EduFinance 2008• $250m loaned in 22
countries in program
• 47 financial services partners ‐ 9,000 schools
• EdQuality Program serving 1,800 schools
• Going down market, Improving teacher quality, student outcomes and employment
• The Global Leader!
THE OPPORTUNITY MODEL: BUILDING SUSTAINABLE INSTITUTIONS AND CREATING MARKETS FOR OUR CLIENTS AT THE BOTTOM OF THE POVERTY PYRAMID
8 | OPPORTUNITY INTERNATIONAL
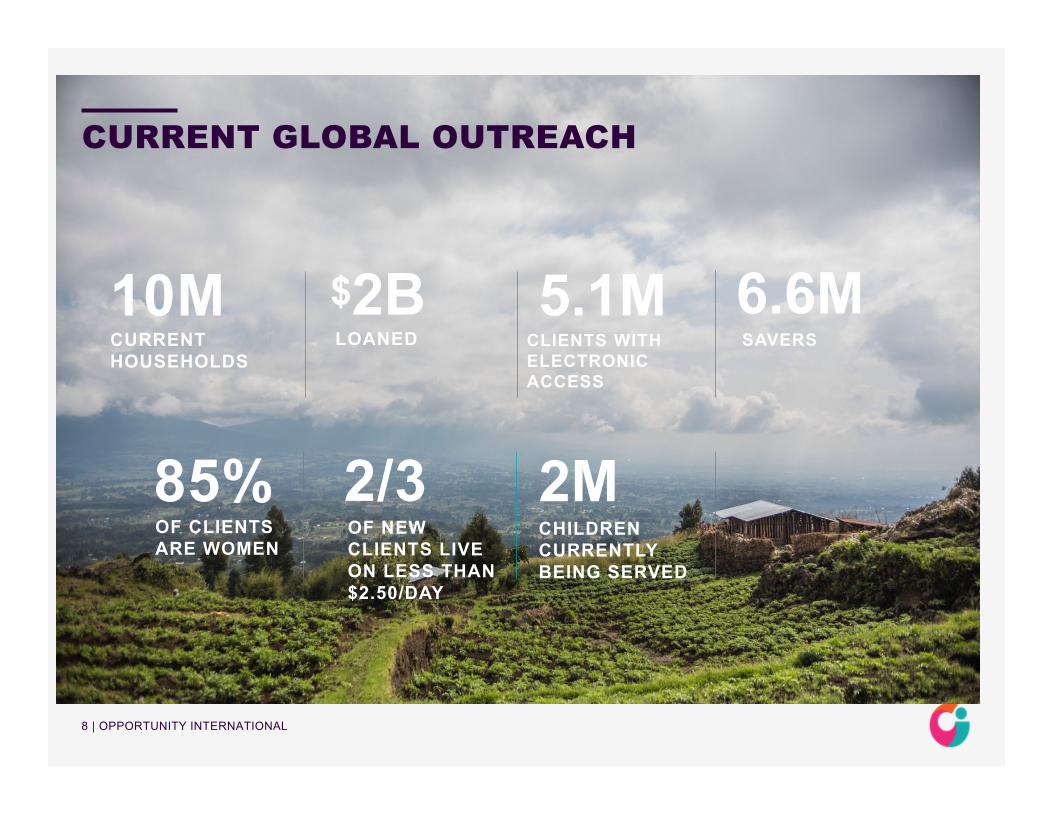
CURRENT GLOBAL OUTREACH
85%OF CLIENTS ARE WOMEN
10MCURRENT HOUSEHOLDS
2MCHILDREN CURRENTLY BEING SERVED
$2BLOANED
2/3OF NEW CLIENTS LIVE ON LESS THAN $2.50/DAY
5.1MCLIENTS WITH ELECTRONIC ACCESS
6.6MSAVERS

9 | OPPORTUNITY INTERNATIONAL
OPPORTUNITY’S BUSINESS LEVEL STRATEGYCore Programs Focused on the 800m People Living In Extreme Poverty: Less Than $1.90/day
• AgFinance• Aggressive scaling to meet tremendous need in rural economies• Staffing increased threefold over plan term, all in Africa
• EduFinance• Continued growth – moderate without incl. Economic Opportunity Zones• Focus on less countries, concentrating resources on core countries
• Micro and Small Business Finance• Important but with limited new investment
• Economic Opportunity Zones• Exciting innovation• Leverages Ag and EduFinance significantly
10 | OPPORTUNITY INTERNATIONAL
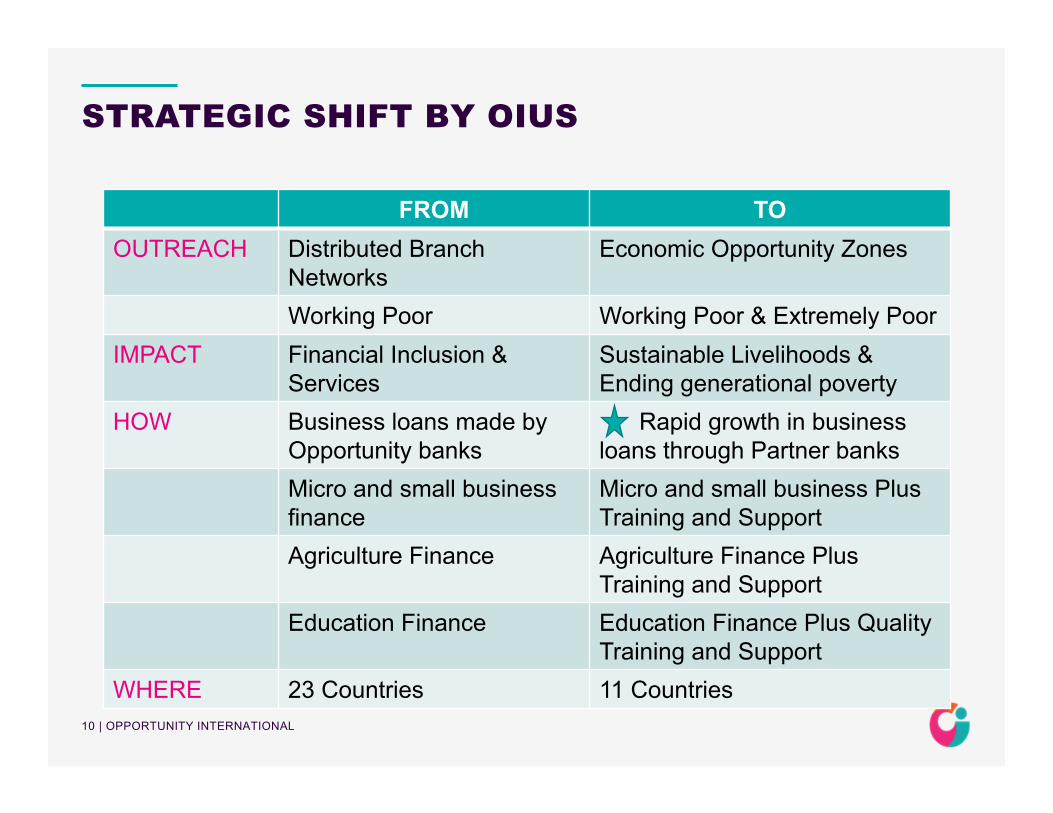
STRATEGIC SHIFT BY OIUS
FROM TO OUTREACH Distributed Branch
NetworksEconomic Opportunity Zones
Working Poor Working Poor & Extremely PoorIMPACT Financial Inclusion &
Services Sustainable Livelihoods &Ending generational poverty
HOW Business loans made by Opportunity banks
Rapid growth in business loans through Partner banks
Micro and small business finance
Micro and small business Plus Training and Support
Agriculture Finance Agriculture Finance Plus Training and Support
Education Finance Education Finance Plus Quality Training and Support
WHERE 23 Countries 11 Countries
11 | OPPORTUNITY INTERNATIONAL
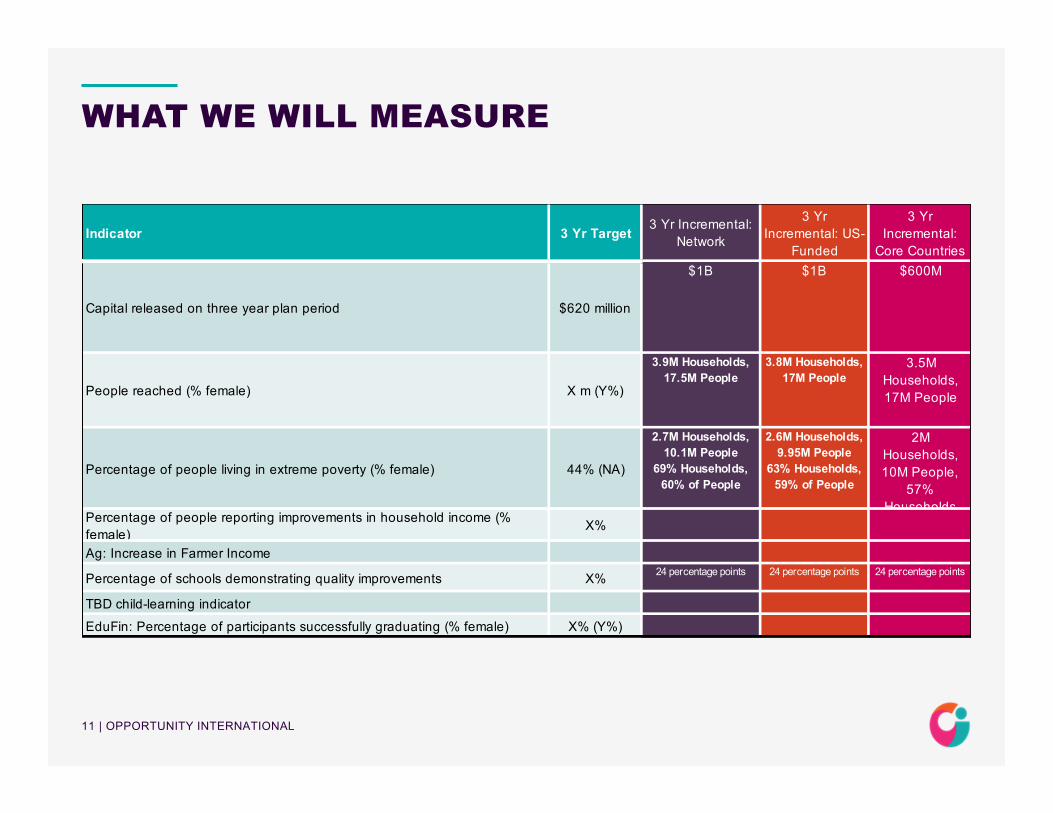
WHAT WE WILL MEASURE
Indicator 3 Yr Target 3 Yr Incremental: Network
3 Yr Incremental: US-
Funded
3 Yr Incremental:
Core Countries
Capital released on three year plan period $620 million
$1B $1B $600M
People reached (% female) X m (Y%)
3.9M Households, 17.5M People
3.8M Households, 17M People
3.5M Households, 17M People
Percentage of people living in extreme poverty (% female) 44% (NA)
2.7M Households, 10.1M People
69% Households, 60% of People
2.6M Households, 9.95M People
63% Households, 59% of People
2M Households, 10M People,
57% Households
Percentage of people reporting improvements in household income (% female)
X%
Ag: Increase in Farmer Income
Percentage of schools demonstrating quality improvements X% 24 percentage points 24 percentage points 24 percentage points
TBD child-learning indicatorEduFin: Percentage of participants successfully graduating (% female) X% (Y%)

12 | OPPORTUNITY INTERNATIONAL
ECONOMIC OPPORTUNITY ZONES A Focused Approach to Accelerate the End of Extreme Poverty
• A Zone is a defined geographical region within a country that has a large concentration of people living in extreme poverty. The population of a region ranges from 250,000 to 1,500,000. The goal of Opportunity Zones is to increase incomes, create jobs, provide a quality education for children and youth that leads to a job, starting a business or going to college
• Opportunity Zones will utilize an integrated approach to maximize the impact of Education and Agricultural Finance initiatives and the impact of financial literacy and life skills training.
• Parents with jobs in an Opportunity Zone can support a quality school in their neighborhood. On the other hand, students educated in an Opportunity Zone can secure jobs or start businesses in the Zone.
• Opportunity will serve two roles in a Zone – we will be the master planner and recruiter of operating partners who provided critical services to our clients and we will serve as a direct service provider in training and support for our targeted families.

13 | OPPORTUNITY INTERNATIONAL
AgFinance
Strengthens and Grows Rural Businesses to Increase Incomes, Create Jobs and Contribute to the Development of Thriving Families and Rural Economies.
SynergyParents with jobs in an Opportunity Zone can support a quality school in their neighborhood
EduFinance
Provides a Quality Education for Children, Leading to Employment, Business Startups, Vocational Schools or Colleges
SynergyStudents educated in an Opportunity Zone can secure jobs or start businesses in the Zone
Digital Delivery Channels• Serve the hardest to reach families
living in extreme poverty• Enhance the training programs of
Ag Finance, EduFinance, and Holistic Transformation
Thriving Families and Communities
Knowledge Management• Develop impact indicators for
Opportunity Zones• Track learning on the fly and
incorporate emerging best practices into the Zones
Program Innovations• Pilot graduation programs for
Ultra Poor• Pilot financial and biz training
programs for refugees
CORE AND SUPPORT PROGRAMS IN ECONOMIC OPPORTUNITY ZONES
Financial Literacy and Life Skill Training
Provides formal and informal training and mentoring in financial and life skills to clients of Ag and Ed Finance to build social and values-base capital alongside of the financial capital we provide
SynergyFinancial and life skills provide a strong foundation for thriving rural families and communities
Supporting Services to Core Programs

14 | OPPORTUNITY INTERNATIONAL
ECONOMIC OPPORTUNITY ZONESSelecting the Zone – Building The Plan
• Zone location, boundaries & population established• Landscape Assessment: Identifies client and market needs – define addressable market. Define current OI assets (branches, staff,
locations and other non-OI assets in the Zone.• Impact metrics and capture method defined• 3-year business plan developed with capital requirements stretching to 7 and 10 years. The plan provides the roadmap for all OI
groups: IBD, Philanthropy, Program Management, MarCom, Finance, HR, Ed, Ag, KM, DFS, and Innovations• Core Operating Partners Recruited• Marketing and fundraising strategy completed and collateral material developed• Opportunity Transformation Services (OTS) transitioned and integrated
Year One: Launching the Zone• Internal Task Force and Champions Team formed• Campaign donor committee formed• Internal Task Force meets bi-weekly for Q1• Zone Director Selected• Kickoff Meeting Held• Initial $1.5m committed• Formal Zone Launch with Board, Champions, ELT and Select Program Leaders. Speeches, Hopes, Prayers.
Years Two through Five: Growth and ScalePlanned Economic Opportunity Zones• Colombia• DRC• Ghana• Malawi• Nicaragua• Uganda

15 | OPPORTUNITY INTERNATIONAL
CORE COUNTRIES – AND ECONOMIC OPPORTUNITY ZONES
Opportunity Zones
Funding RequirementsFunding Requirements
2020 2021 2022 Total 2020-2022 %Nicaced $1,000,000 $1,640,000 $2,150,000 $4,790,000 22.3%Agape 200,000 640,000 1,400,000 2,240,000 10.4%AgFin 793,333 4,333,333 4,506,667 9,633,333 44.8%EduFin 396,667 2,166,667 2,253,333 4,816,667 22.4%Total $2,390,000 $8,780,000 $10,310,000 $21,480,000 100.0%

16 | OPPORTUNITY INTERNATIONAL
Small/Medium Size Ag Businesses
Processing plants, seed/fertilizer stores, warehouses, irrigation, transport, buyers
Objectives
• Increase yields and incomes of smallholder farms
• Build their businesses, increase their income and performance
• Become engines of economic growth through job creation
• Connect to regional and global markets
Business Model• Loan mobilization from partner banks• Business training and links to markets
80% of the world’s extreme poor live in rural sub Saharan Africa and India
“The fastest way to end the intergenerational transfer of poverty is by investing in rural economies” Akinwumi Adesina, President, Africa Development Bank & Director, Rockefeller Foundation.
Smallholder Farms
Objectives
• Increase yields and incomes• Create on-farm and off-farm jobs• Accelerate the expansion of the ag sector
to end extreme poverty and feed families, communities and countries
Business Model
• Loan mobilization from partner banks• GAP training and support for farmers• Links to markets and buyers
AgFinance Supports the Growth of Rural Businesses in the Ag Sector
When these two business sectors grow together, they can create . . .
ThrivingRural
Economies
AG FINANCEIncreases Incomes, Creates Jobs and Builds Thriving Rural Households and Economies

17 | OPPORTUNITY INTERNATIONAL
AG FINANCEWhat we will measure Activities, Targets, Impact 2020 2021 2022 Total
Number of Financial Services Partners (FSPs) 10 14 17
Number of smallholder farm loans 62,752 79,962 87,958
Capital released for smallholder farm households $15 million $20 million $22 million $57 million
Number of off‐farm businesses financed 1,124 2,296 3,817
Capital released for off‐farm businesses $5 million $6 million $6 million $17 million
Number of farm services agents (FSAs) 320 406 516
Number of farmers trained by FSAs 88,991 125,553 138,108
Number/percentage of farm households living on less than $2.50/day
77% 85% 80%
Number/percentage of farm households living on less than $1.90/day
46% 46% 44%
# Non‐financial service partners 37 44 51Number of lives impacted 680,000 900,000 1,050,000Average increase in crop yield during first two years in the program
TBD TBD TBD
Average increase in farm income during first two years in the program
TBD TBD TBD

18 | OPPORTUNITY INTERNATIONAL
AG FINANCEFootprint
Current / 2019E 2020E 2021E 2022E
Countries 6 8 8 8
Financial Services Partners 7 10 14 17
Non-financial service partners 31 37 44 51
Geographic ExpansionGeographic Expansion

19 | OPPORTUNITY INTERNATIONAL
AG FINANCEBusiness plan summary
Today• Cumulatively, more than 500k Ag loans in sub-Saharan Africa impacting close to 3 million lives in rural communities
• 6 countries: Mozambique, Malawi, Rwanda, Uganda, Ghana, DRC
• 7 Financial Service Partners (FSP)
• 31 Non-financial service partners
Three-Year Plan Highlights• Expand Capital Acceleration Support, Yield Improvement Support and Market Improvement Support to 2 new countries
• Work with 10 new FSPs
• Add 20 new non-financial service partners
• Engage 250 new Farmer Support Agents (FSA) – will need > 500 agents with Opportunity Zones
• Impact 1,050,000 lives by end of plan period – with Opportunity Zones impact, grows to 2,050,000
Funding Required, $ millions
2020 $2.0
2021 $3.4
2022 $4.3
3 Yr Total $9.7
Funding Required with Opportunity Zones, $ millions
2020 $2.8
2021 $7.7
2022 $8.8
3 Yr Total $19.3

20 | OPPORTUNITY INTERNATIONAL
• If all students in low income countries left school with basic reading skills,170 million people could be lifted out of poverty, a 12% reduction in world poverty
• Future wages increase up to 20% for every additional year of primary school
School Owners
Objectives• Increase # of classrooms• Increase # of teachers• Improved premises• Improved school management
competency & capacity
Business Model• School improvement loans
mobilization• Ed Quality program on site and in
clusters.
Edufinance clients in the affordable private school sector
Parents and Students
Objectives• Access to quality, affordable schools• Children in schools all the time• Improved learning outcomes• Access to vocational training• Secure jobs, start businesses, go to
college
Business Model• Mobilize school fee loans• Mobilize vocational training loans
When parents and
school proprietors commit to
providing a quality
education for all children, they are . . .
On a Path to End Extreme
Poverty
EDUFINANCEEduFinance accelerates availability of capital and seeks to improve education quality

21 | OPPORTUNITY INTERNATIONAL
EDUFINANCEWhat we will measureActivities, Targets, Impact 2020 2021 2022 TotalNumber of financial services partners (FSPs) 81 91 107Capital released for school improvement loans $44 million $49 million $52 million $143 millionNumber of new schools financed 2,859 3,153 3.352Number of students in new schools financed 715,000 788,250 838,000Number of school fee loans 141,846 178,670 204,959Capital released for school fee loans $49 million $62 million $72 million $183 millionNumber of vocational/tertiary fee loans 8,741 11,077 12,790Capital released for voc/tertiary fee loans $8 million $10 million $12 million $30 millionPercentage of schools in Ed quality 25% 30% 30%Number/percentage of schools/students in extreme poverty locations (less than $1.90/day)
39% 41% 43%
Progress on student level learning outcomes. TBDProgress on school improvement in Ed quality TBDNumber of schools in Ed Quality 1,839 2,259 2,259Number/percentage of schools/students serving families with income less than $2.50/day
55% 57% 59%
22 | OPPORTUNITY INTERNATIONAL
EDUFINANCEBusiness plan summary
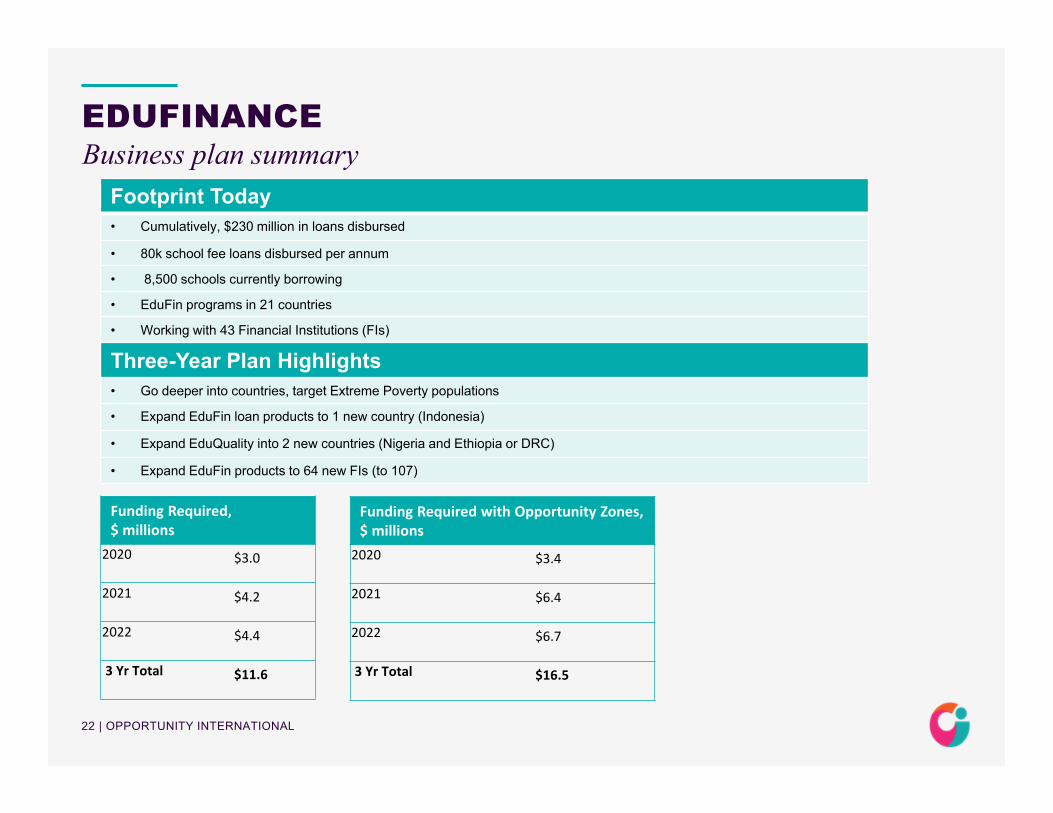
Footprint Today• Cumulatively, $230 million in loans disbursed
• 80k school fee loans disbursed per annum
• 8,500 schools currently borrowing
• EduFin programs in 21 countries
• Working with 43 Financial Institutions (FIs)
Three-Year Plan Highlights• Go deeper into countries, target Extreme Poverty populations
• Expand EduFin loan products to 1 new country (Indonesia)
• Expand EduQuality into 2 new countries (Nigeria and Ethiopia or DRC)
• Expand EduFin products to 64 new FIs (to 107)
Funding Required, $ millions
2020 $3.0
2021 $4.2
2022 $4.4
3 Yr Total $11.6
Funding Required with Opportunity Zones, $ millions
2020 $3.4
2021 $6.4
2022 $6.7
3 Yr Total $16.5

23 | OPPORTUNITY INTERNATIONAL
EDUFINANCE Footprint
Indonesia
Uganda
IndiaRwanda
Malawi
Democratic Republic of Congo
GhanaNicaragua
Colombia
Nigeria
Mozambique
Tanzania
Kenya
Ethiopia
EduFin partners with certain Financial Institutions in other African, Asian and LATAM countries that are non‐US focus, some of which are funded by other Strategic Member partners.
Philippines

24 | OPPORTUNITY INTERNATIONAL
Micro-Business Finance
Objectives
• Increase household incomes• Create jobs for neighbors • Build assets• Build social capital
Business Model
• Loan mobilization• Access to savings accounts• Imbed clients (90% are women) in
social networks for technical learning and relational support
Small-Business Finance
Objectives
• Increase household incomes• Become a major job generator for the
community • Build assets• Build social capital
Business Model
• Loan mobilization• Access to savings accounts• Access to technical training• Advice on business management and
growth
Thriving Families and Communities
MICRO AND SMALL BUSINESS FINANCE
Some of our micro businesses transform into small and medium businesses that become the engines of job creation for an entire community. Economic, social and spiritual growth, traveling together, builds thriving families and communities

25 | OPPORTUNITY INTERNATIONAL
PILOTS AND INNOVATIONS THROUGH OUR OWNED PARTNERS
• Opportunity has long standing and fruitful relationships with the Financial Institutions we established, owned and operated in Africa and Latin America and with a select group of Financial Institutions in India.
• These institutions include Opportunity International Savings and Loan in Ghana, Opportunity Bank of Uganda Limited, Vision Fund DRC, BOM in Mozambique and OICC in Colombia.
• We no longer operate these institutions, but work closely with them to test new products, services and delivery channels for our targeted clients. The pilots and innovations include:
• Working in Refugee Camps• Graduations Programs• Opportunity Zones• Youth Financial and Employment Services• Helping EduFinance serve poorer schools in rural areas.
• We will continue to raise and place funds with these Partners for these types of activities. Depending upon the program we will place funds as equity, guarantees, debt and grants for buy-downs on interest rates and subsidies to reach the hardest to serve clients

26 | OPPORTUNITY INTERNATIONAL
PARTNER NETWORK
Equity Partners• Dia Vikas, India, 9%• Vision Fund DRC, 20% • OISL, Ghana, 10% for OIUS and 10% for OIUK (signed deal, not closed)• OBS, Serbia, 100%• OBUL, Uganda, 43% including 6% of OI Canada
Collective three-year impact (excluding Dia Vikas)• Clients with savings accounts 1.1 million (29%) • Micro business loans 126,000 (21%)• Small business loans 21,000 (29%)
Dia Vikas: supports 14 Indian microfinance entities, representing 4,570,495 loan clients; gross loan portfolio of $1.417 billion, 7,705,916 depositors
Partners by Program Area # of Partners # of Equity Partners
AgFinance 9 2
EduFinance 42 2
Micro/Small Business Finance 18 5

27 | OPPORTUNITY INTERNATIONAL
The Role of Financial Services Partners
• Financial Products/Services for Clients: business loans, school fee loans and savings accounts for clients in EduFinance, Ag Finance and Microfinance
• Delivery Channels: branch networks ATMs, point-of-sale devices, agent networks and mobile phones
Institution | UNTU Capital, Nigeria. 5,900 clients, $7 millionportfolio. Partnership level | Level 1: Pilot
Monitoring, Evaluation and Best PracticesThe Data & Business Intelligence team harnesses the power of data to drive better service delivery to financial institutions, schools, parents and donors. The team captures and monitors data and reports sent from financial institutions, schools, own staff and third parties.
By organizing this data into databases and through rigorous analysis and monitoring of the results, we identify key areas of success, points for improvement and generate new ideas.We share our deep knowledge and best practices with partners across the sector, working to build capacity and put more kids in better schools.
The Role of Opportunity: (Live example from EduFinance)
RECRUITING, EQUIPPING AND SUPPORTING FINANCIAL SERVICES PARTNERS
Implementation Plan1) translate results of market research2) develop loan products3) capacity‐building of loan officers4) follow‐up; project completed in 9 months with on‐going
relationship
1 = lowest; 5 = highest

28 | OPPORTUNITY INTERNATIONAL
KNOWLEDGE MANAGEMENT
Today• Research supports end-clients, donors/fundraisers, OI programs and partners, and microfinance industry
• Research helps optimize operations and strengthen program strategy
• Most research studies are funded by restricted grants
Three-Year Plan Highlights• Support OI programs (EdFin, AgFin, Opportunity Zones)
• Market positioning: collateral for donors, webinars, conferences, panels at industry events, website content
• Major study: Impact of Microfinance Plus; provide recommendations for improving program design and training
• Major study: 24 module Holistic Transformation client training program. Addresses financial literary, business management skills, and biblical principles in the family and community
• Major impact study on “microfinance plus” requires releasing results externally, regardless of findings. New impact studies will serve as internal learning documents published externally on a case by case basis.
• Landscape assessment for innovations - Generate ideas (e.g., refugees, water, youth)
Funding Requirement2020 $2.22021 $1.72022 $1.0
$4.9 of this amount, $1.9 is already committed
29 | OPPORTUNITY INTERNATIONAL
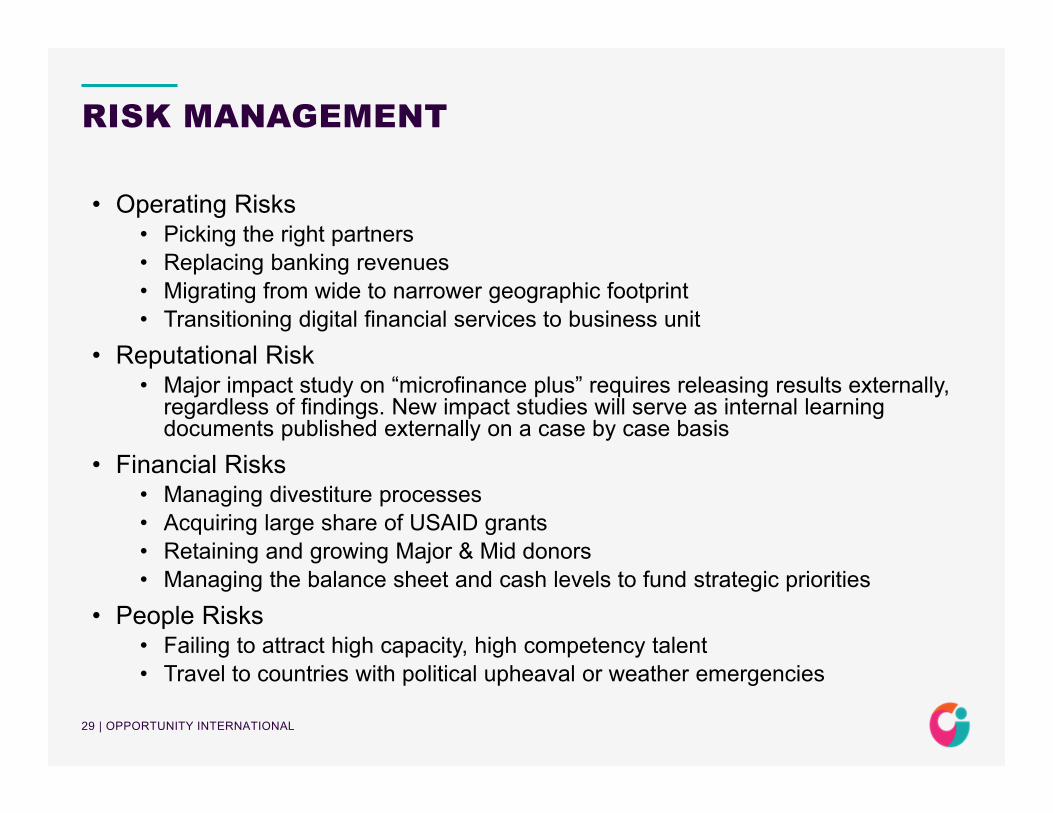
RISK MANAGEMENT
• Operating Risks• Picking the right partners• Replacing banking revenues• Migrating from wide to narrower geographic footprint• Transitioning digital financial services to business unit
• Reputational Risk• Major impact study on “microfinance plus” requires releasing results externally,
regardless of findings. New impact studies will serve as internal learning documents published externally on a case by case basis
• Financial Risks• Managing divestiture processes• Acquiring large share of USAID grants• Retaining and growing Major & Mid donors• Managing the balance sheet and cash levels to fund strategic priorities
• People Risks• Failing to attract high capacity, high competency talent• Travel to countries with political upheaval or weather emergencies

30 | OPPORTUNITY INTERNATIONAL
STRATEGIC CHALLENGES
• Impact of an impending recession• Developing/managing country strategies• Managing Opportunity Zones rollout• Continued innovation of new programs to mitigate disintermediation of
core programs• Explaining change from asset-heavy owned banks to asset-efficient
non-owned partner institutions• Determining how to release/unlock social impact capital to serve the
extremely poor v. working poor• Opportunity Network management and SM collaboration

31 | OPPORTUNITY INTERNATIONAL
2020-2022 Financial Plan

32 | OPPORTUNITY INTERNATIONAL
INCOME STATEMENT(Accrual) 2019 2020 (9 mo.) 2020 Annualized 2021 2022 Total 2020‐2022ReveueFundraisingPrivate $15,598,520 $8,800,000 $17,600,000 $20,000,000 $22,500,000 $51,300,000Special Designation 591,430 450,000 600,000 600,000 600,000 1,650,000IBD 5,645,813 7,943,000 10,590,667 13,690,000 14,496,000 36,129,000Gift in Kind 350,000 262,500 350,000 350,000 350,000 962,500
Total Fundraising $22,185,763 $17,455,500 $29,140,667 $34,640,000 $37,946,000 $90,041,500(‐) Allowance for Uncoll. Pledge (500,000) (375,000) (500,000) (500,000) (500,000) (1,375,000)
Net Fundraising $21,685,763 $17,080,500 $28,640,667 $34,140,000 $37,446,000 $88,666,500
Other IncomeBank IT Services $630,366 $60,000 $60,000 – – $60,000Bank Mgmt Services 1,050,000 262,500 787,500 – – 262,500Misc. Income 243,524 100,000 100,000 100,000 100,000 300,000
Total Other Income $1,923,890 $422,500 $947,500 $100,000 $100,000 $622,500
Total Revenue $23,609,653 $17,503,000 $29,588,167 $34,240,000 $37,546,000 $89,289,000
Expenses 2020 AnnualizedProgramAgricultural Finance $791,592 $2,007,408 $2,676,544 $3,416,645 $4,316,298 $9,740,352Education Finance 3,058,972 3,034,334 4,045,779 4,205,234 4,428,752 11,668,319Knowledge Management 2,369,647 2,192,775 2,923,700 1,746,787 1,025,849 4,965,411Program Management 3,084,652 2,461,126 3,281,501 3,812,842 3,802,303 10,076,270Micro and Small Business Finance 5,153,640 2,193,819 2,925,092 1,646,641 1,684,060 5,524,520Opportunity Zones 2,606,199 2,390,000 3,186,667 8,780,000 10,310,000 21,480,000Support of Implementing Teams 651,434 402,808 537,077 553,189 569,785 1,525,782Gift‐in‐kind 350,000 262,500 350,000 350,000 350,000 962,500
Yield to Program $18,066,136 $14,944,769 $19,926,359 $24,511,339 $26,487,047 $65,943,154
Yield to Program / Revenue 77% 85% 72% 71%YoY Growth 10% 23% 8% 3‐yr CAGR (13.6%)FG&AFundraising $4,547,885 $3,705,127 $4,940,169 $5,161,907 $5,210,961 $14,077,995General & Administrative 1,597,861 1,247,764 1,663,686 2,067,477 2,305,478 5,620,720
Total FG&A $6,145,747 $4,952,891 $6,603,855 $7,229,385 $7,516,439 $19,698,715
FG&A / Revenue 26% 28% 21% 20%
Total Expenses $24,211,884 $19,897,661 $26,530,214 $31,740,725 $34,003,487 $85,641,873
Change in Net Assets ‐Operating Activity ($602,231) ($2,394,661) $2,499,275 $3,542,513 $3,647,127
Banking Revenue 57,131,778 35,497,850Banking Expense 51,874,804 31,686,110Net Income 5,256,974 3,811,740Combined Charitable & Banking Revenue $80,741,431 $53,000,850 $70,491,131 $34,240,000 $37,546,000

33 | OPPORTUNITY INTERNATIONAL
CONSOLIDATED BALANCE SHEET(in $000's)
12/31/19 9/30/20 9/30/21 9/30/22
Current Assets Unrestricted Cash $3,348 $9,269 $6,369 $5,942 Cash for Restricted Gifts 7,300 7,324 7,348 7,374 Net Pledges Receivable 5,138 7,685 11,870 13,180 Investments ‐ Securities & DAF 946 976 1,008 1,041 Miscellaneous Receivables & Prepaid Expenses 450 450 450 450 Total Current Assets 17,182 25,704 27,044 27,987
OTI Investments Minority Interest Investment in Members & Others 8,410 14,792 14,792 14,792 Majority Interest Investment in Members 31,912 0 0 0
Total OTI Investments 40,321 14,792 14,792 14,792
Net Property & Equipment 72 48 24 0 Total Long Term Assets 40,393 14,840 14,816 14,792
Total Assets $57,575 $40,544 $41,860 $42,779
Accounts Payable 800 824 849 874 Accrued expenses 2,973 2,022 1,734 1,615 Current Portion of LTD and short term borrowings 1,643 920 2,530 50 Total Current Liabilities 5,416 3,766 5,113 2,539
Long‐Term Notes Payable 10,947 2,680 150 100 Charitable Gift Annuity Obligation 300 300 300 300 Total Non‐Current Liabilities 11,247 2,980 450 400
Net Assets 40,912 33,798 36,297 39,840
Total Liabilities and Net Assets $57,575 $40,544 $41,860 $42,779
Net cash position = Unrestricted cash less LTD including current portion (9,242) 5,669 3,689 5,792
34 | OPPORTUNITY INTERNATIONAL
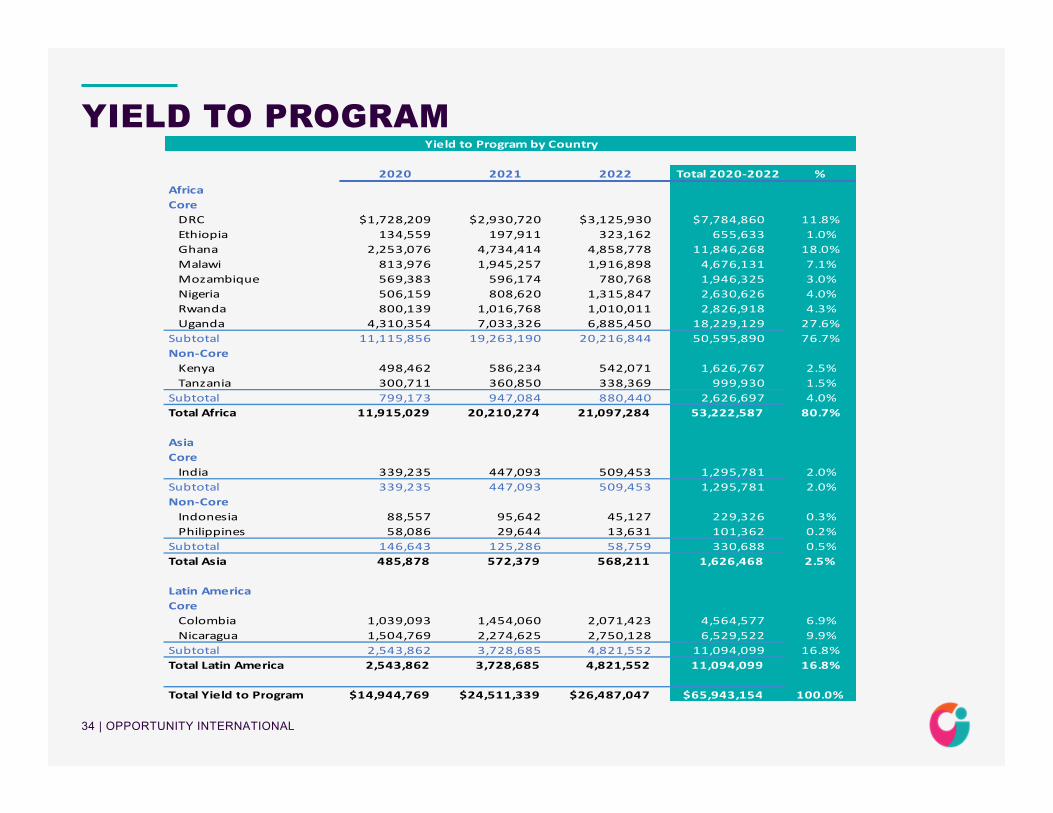
YIELD TO PROGRAMYield to Program by Country
2020 2021 2022 Total 2020‐2022 %AfricaCore DRC $1,728,209 $2,930,720 $3,125,930 $7,784,860 11.8%Ethiopia 134,559 197,911 323,162 655,633 1.0%Ghana 2,253,076 4,734,414 4,858,778 11,846,268 18.0%Malawi 813,976 1,945,257 1,916,898 4,676,131 7.1%Mozambique 569,383 596,174 780,768 1,946,325 3.0%Nigeria 506,159 808,620 1,315,847 2,630,626 4.0%Rwanda 800,139 1,016,768 1,010,011 2,826,918 4.3%Uganda 4,310,354 7,033,326 6,885,450 18,229,129 27.6%
Subtotal 11,115,856 19,263,190 20,216,844 50,595,890 76.7%Non‐Core Kenya 498,462 586,234 542,071 1,626,767 2.5%Tanzania 300,711 360,850 338,369 999,930 1.5%
Subtotal 799,173 947,084 880,440 2,626,697 4.0%Total Africa 11,915,029 20,210,274 21,097,284 53,222,587 80.7%
AsiaCore India 339,235 447,093 509,453 1,295,781 2.0%
Subtotal 339,235 447,093 509,453 1,295,781 2.0%Non‐Core Indonesia 88,557 95,642 45,127 229,326 0.3%Philippines 58,086 29,644 13,631 101,362 0.2%
Subtotal 146,643 125,286 58,759 330,688 0.5%Total Asia 485,878 572,379 568,211 1,626,468 2.5%
Latin AmericaCoreColombia 1,039,093 1,454,060 2,071,423 4,564,577 6.9%Nicaragua 1,504,769 2,274,625 2,750,128 6,529,522 9.9%
Subtotal 2,543,862 3,728,685 4,821,552 11,094,099 16.8%Total Latin America 2,543,862 3,728,685 4,821,552 11,094,099 16.8%
Total Yield to Program $14,944,769 $24,511,339 $26,487,047 $65,943,154 100.0%

35
Opportunity InternationalIBD & PRIVATE PHILANTHROPY
2020-2022

36 | OPPORTUNITY INTERNATIONAL
Private Philanthropy

37 | OPPORTUNITY INTERNATIONAL
AGENDA
Philanthropy Portfolio Objectives for 2020-20221. IBD Fundraising2. Private Fundraising

38 | OPPORTUNITY INTERNATIONAL
2020-2022 FINANCIAL OBJECTIVES
Private and IBD Fundraising Revenue
2019 2020 2020 Annualized 2021 2022 Total 2020‐2022ACCRUALPrivate RevenueNew Cash $12,598,520 $7,216,000 $14,432,000 $16,400,000 $18,450,000 $42,066,000New Pledges 3,000,000 1,584,000 3,168,000 3,600,000 4,050,000 9,234,000GIK 300,470 225,000 300,000 300,000 300,000 825,000Total Private Revenue 15,898,990 9,025,000 17,900,000 20,300,000 22,800,000 52,125,000
YoY Growth 13% 13% 12%IBD RevenueNew Cash 3,120,813 4,568,000 6,090,667 9,740,000 10,546,000 24,854,000New Pledges 2,525,000 3,375,000 4,500,000 3,950,000 3,950,000 11,275,000GIK 49,530 37,500 50,000 50,000 50,000 137,500Total IBD Revenue 5,695,343 7,980,500 10,640,667 13,740,000 14,546,000 36,266,500
YoY Growth 87% 29% 6%Total Accrual Revenue 21,594,333 17,005,500 28,540,667 34,040,000 37,346,000 88,391,500
Special Designation 591,430 450,000 600,000 600,000 600,000 1,650,000
Total Accrual with Special Designation $22,185,763 $17,455,500 $29,140,667 $34,640,000 $37,946,000 $90,041,500

39 | OPPORTUNITY INTERNATIONAL
IBD Fundraising

40 | OPPORTUNITY INTERNATIONAL
THREE MAJOR DONOR GROUPS AND WHAT THEY ARE FUNDING
Corporations
Credit Suisse
Cisco
Caterpillar
Amway
Milliman
Visa
Dalio
Citi
Exxon
Goldman Sachs
John Deere
Foundation Donors
Elma
Gates
MasterCard
MacArthur
Foundation for a Smoke Free World
What They Are Funding
EduFinance: Scale in-country, new country; down-market schools; school improvement loans; school fee loans; education quality; teacher training; student learning outcomes; student jobs, startups, college; vocational trainingPotential Game Changers: go down-market: fees for Ed Quality paid by banks or schools: student learning outcomes; student employment Agriculture Finance: Smallholders: Loan mobilization, training and support, market links, irrigation systems. Agro-businesses: Loan mobilization, biz training and market links. Guarantees.
Potential Game Changers: Farmers pay for training, affordable irrigation systems to combat climate change.
Refugees in camps: Loans, savings, cash transfers, biz training.
Youth: Jobs, startups, vocational training, entrepreneurial training. Anything that effectively addresses employment for youth, at scale and at reasonable price would be considered a game changers
Sub-Saharan Africa
Digital Channels for finance and training
Opportunity Zones
Government DonorsUSAID Washington DC
USAID Missions
United Nations Development ProgramUnited Nations High Commission for RefugeesInternational Finance Corporation

41 | OPPORTUNITY INTERNATIONAL
• Market Position of Opportunity as global leader in EduFinance strengthened.
• Products and Services of EduFinance flywheel expanded to improve impact.
• Growing Portfolio of USAID grants built primarily through EduFinance, Ag Finance and closely related sectors.
• Program Leaders have high-visibility and excellent reputation in their sector.
• Long-term Relationships with key Corporations and Foundations expanded.
Build Growing Portfolio of Grants Through Strong Products, Performance and People

42 | OPPORTUNITY INTERNATIONAL
PROJECTIONS FOR INTERNATIONAL BUSINESS DEVELOPMENT
2019 2020 2020 Annualized 2021 2022 Total 2020‐2022ACCRUALIBD RevenueNew Cash 3,120,813 4,568,000 6,090,667 9,740,000 10,546,000 24,854,000New Pledges 2,525,000 3,375,000 4,500,000 3,950,000 3,950,000 11,275,000GIK 49,530 37,500 50,000 50,000 50,000 137,500Total IBD Revenue 5,695,343 7,980,500 10,640,667 13,740,000 14,546,000 36,266,500

43 | OPPORTUNITY INTERNATIONAL
Private Fundraising

44 | OPPORTUNITY INTERNATIONAL
PRIVATE PHILANTHROPY: FINANCIAL OBJECTIVES
2019 2020 2020 Annualized 2021 2022 Total 2020‐2022ACCRUALPrivate RevenueNew Cash $12,598,520 $7,216,000 $14,432,000 $16,400,000 $18,450,000 $42,066,000New Pledges 3,000,000 1,584,000 3,168,000 3,600,000 4,050,000 9,234,000GIK 300,470 225,000 300,000 300,000 300,000 825,000Total Private Revenue 15,898,990 9,025,000 17,900,000 20,300,000 22,800,000 52,125,000

45 | OPPORTUNITY INTERNATIONAL
HISTORY & FULL 3 YEAR PLAN: DONOR FILE SIZE & AVERAGE GIFT
# Donors $ Avg Gift
2016 Actual 2567 $5,700
2017 Actual 2322 $7,300
2018 Actual Pledge/+ Commitments
1897 $7,300/$10,000
2019 Goal/Estimated Range
2000‐2200 $7,200‐$7,500
2020 Full Yr Goal 2200 $8,000
2021 Full Yr Goal 2420 $8,300
2022 Full Yr Goal 2662 $8,500

46 | OPPORTUNITY INTERNATIONAL
PRIVATE PHILANTHROPY PORTFOLIO & DONOR PROFILE
Private 2020-2022
Mega & Major Donors& HNW Prospects
Priority Expansion
Middle Donors& HNW Prospects
Expand As On Ramp to Mega/Major
Entry Donors Not Our Focus Can Be On Ramp to Middle/Major
• INCOME: 87% @ $100K +
• AGE: 58‐71 Most frequent range
• RACE: 92% Caucasian/Other
• EDUCATION: 60% college grads
• RELIGION: High Christian“People of God’s Will & Good Will”
• MARITAL STATUS: 75% married
• HOME MARKET VALUE: 61% $500K+
47 | OPPORTUNITY INTERNATIONAL
PRIVATE PHILANTHROPY OBJECTIVES
Provide an outstanding engagement experience to high value donors to enable them realize/fulfill their passion for helping the poor, and maximize their number/lifetime giving to Opportunity International

48 | OPPORTUNITY INTERNATIONAL
BOARD RESOLUTION TO APPROVE OIUS STRATEGIC PLAN
• WHEREAS, the OIUS Strategic Plan: 2020-2022 has been presented at the OIUS Board of Directors Meeting
• NOW THEREFORE, IT IS RESOLVED THAT: The OIUS Strategic Plan has been approved by the U.S. Board of Directors


50 | OPPORTUNITY INTERNATIONAL
APPENDIX

51 | OPPORTUNITY INTERNATIONAL
MICRO AND SMALL BUSINESS ENTERPRISE
Indicator3 Yr
Incremental: Network
3 Yr Incremental: US-Funded
3 Yr Incremental:
Core Countries
Capital released on three year plan period $1B $1B $600M
Clients reached with Loans, Savings, Insurance and Training
3M 2.9M 2.7M
Clients with Loans 2.6M 2.5M 2.3M
Clients with Savings 1.1M 1M 1M
Clients reached with digital inclusion 0.5M 0.5M 0.5M

52 | OPPORTUNITY INTERNATIONAL
WHAT WE WILL MEASURE
Indicator 3 Yr. Target
Capital released during three year‐plan period from owned banks and financial services partners
$620 million
People reached (% female) X m (Y%)
Percentage of people living in extreme poverty (% female) 44% (NA)
Percentage of people reporting improvements in household income (% female)
X %
Ag: Increase in farmer income
Percentage of schools demonstrating quality improvements X%
TBD child‐learning indicator
EduFin: Percentage of participants successfully graduating (% female) X% (Y%)

53 | OPPORTUNITY INTERNATIONAL
WHAT WE WILL MEASURE
Indicator 3 Yr Incremental: Network
3 Yr Incremental: US-
Funded
3 Yr Incremental:
Core Countries
Capital released on three year plan period
$1B $1B $600M
People reached (% female)
3.9M Households, 17.5M People
3.8M Households, 17M People
3.5M Households, 17M People
Percentage of people living in extreme poverty (% female)
2.7M Households, 10.1M People69% Households, 60% of People
2.6M Households, 9.95M People63% Households, 59% of People
2M Households, 10M People, 57% Households
Percentage of people reporting improvements in household income (% female)Ag: Increase in Farmer Income
Percentage of schools demonstrating quality improvements 24 percentage points 24 percentage points 24 percentage points
TBD child-learning indicatorEduFin: Percentage of participants successfully graduating (% female)