October 2013 - rccao€¦ · October 2013 County of Wellington ... multi-year contract bundling and...
44
October 2013 County of Wellington Bridge Study An Independent Study Commissioned by
-
Upload
trinhquynh -
Category
Documents
-
view
215 -
download
1
Transcript of October 2013 - rccao€¦ · October 2013 County of Wellington ... multi-year contract bundling and...
October 2013
County of Wellington Bridge Study
An Independent Study Commissioned by


October 2013
County of Wellington Bridge Study
An Independent Study Commissioned by the
OntariO GOOd rOads assOciatiOn
and the rEsidEntiaL and ciViL
cOnstrUctiOn aLLiancE OF OntariO
With financial support from the
OntariO Ministry OF transpOrtatiOn
Prepared by
rccao.com4
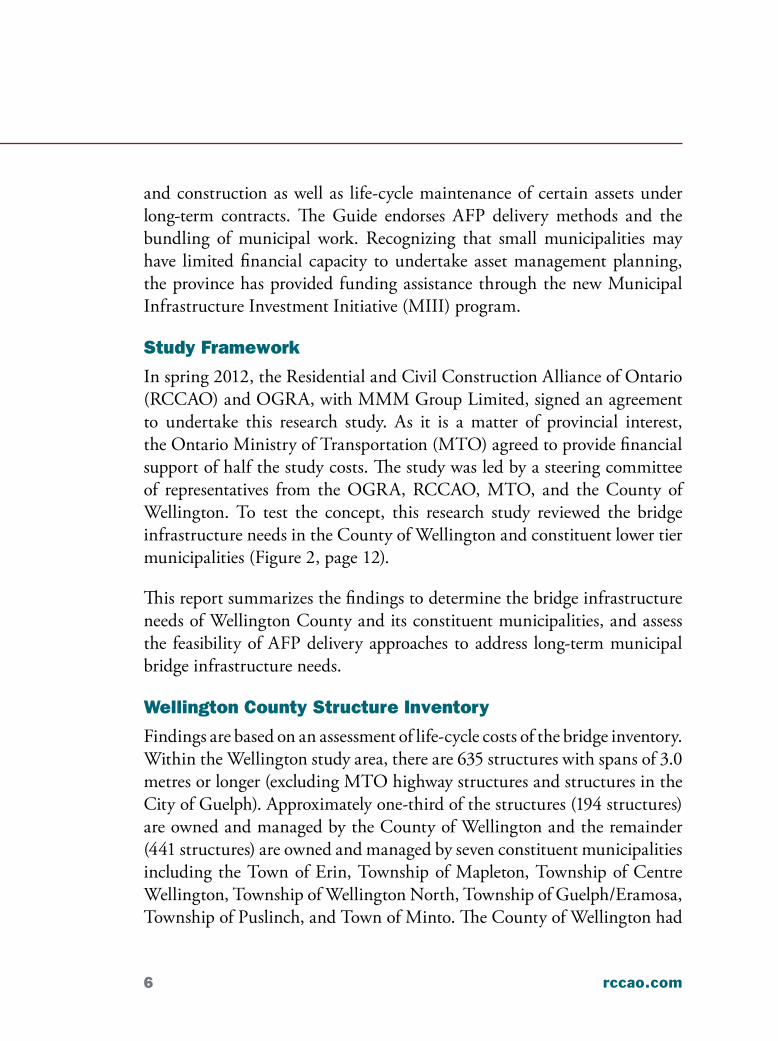
Table of ConTenTs
Executive Summary 5
Structure Inventory 12
Structure Needs 17
Cost of Structure Rehabilitations/Replacements 21
Structure Needs Results 24
Alternative Delivery Options 31
Conclusions and Recommendations 41
List of Figures, Charts and Tables
Figure 1: Small but Timely Renewal Investments Save Money 10
Figure 2: County of Wellington and Constituent Municipalities 12
Figure 3: Total Inventory (635 Structures) 15
Figure 4: Structures Included in Needs Analysis (464 Structures) 16
Chart 1: Total Structural Needs in the County of Wellington and Constituent Townships (2011 dollars) 24
Chart 2: Total Structural Needs in the County of Wellington and Constituent Townships with 3% Inflation 25
Table 1: Study Needs Assumptions – Rehabilitation Cycle 20
Table 2: Comparison of Life-cycle Cost Estimates between the County’s 2011 Bridge and Culvert Appraisal Report and this Study’s Results 26
Table 3: Number of Culverts and Estimated Costs under this Study and the County’s 2011 Bridge and Culvert Appraisal Report 27
Table 4: Number of Bridges and Estimated Costs under this Study and the County’s 2011 Bridge and Culvert Appraisal Report 29
Table 5: Estimated Cost Savings of AFP Bridge Bundling in the County of Wellington and Constituent Townships 38

5County of Wellington Bridge Study October 2013
exeCuTive summary
The issue
Many of Ontario’s bridges are over 50 years old and require major rehabilitation and reconstruction. Municipalities have limited financial resources to address these critical infrastructure needs, so it is essential to find new approaches to improve asset management and address this backlog for bridge rehabilitation. Alternative Financing and Procurement (AFP) delivery and project bundling have been identified by the Province of Ontario as approaches that the municipal sector should consider. To determine whether it is feasible or worthwhile for municipalities to adopt AFP and bundling models, this research study was commissioned to scope the magnitude of bridge work for a typical Ontario county and its constituent municipalities. Using the network of contacts within the Ontario Good Roads Association (OGRA), Wellington County and its constituent municipalities was identified as being a representative candidate for this study.
Despite significant investments by all levels of government, more must be done to address current and emerging municipal infrastructure needs. In June 2011, Ontario’s Ministry of Infrastructure released a long-term infrastructure plan known as Building Together. This 10-year infrastructure plan outlined a number of objectives, such as setting long-term investment priorities by sector, ensuring a pipeline of infrastructure projects, and improving asset management. The plan envisions a broader role for Infrastructure Ontario in all types of government procurement activity, including a stronger presence in transportation projects.
In August 2012, the Ministry of Infrastructure released Building Together: Guide for Municipal Asset Management Plans to provide a framework to address these municipal infrastructure challenges. This framework includes making asset management planning and public reporting universal, making optimal use of the full range of budgeting and financing tools, and addressing the infrastructure challenges that are confronting small municipalities. Provincial infrastructure funding grants would be conditional on published municipal asset management plans. The Guide encourages municipalities to utilize the AFP model where the private sector would have a role in design
rccao.com6
and construction as well as life-cycle maintenance of certain assets under long-term contracts. The Guide endorses AFP delivery methods and the bundling of municipal work. Recognizing that small municipalities may have limited financial capacity to undertake asset management planning, the province has provided funding assistance through the new Municipal Infrastructure Investment Initiative (MIII) program.
study framework
In spring 2012, the Residential and Civil Construction Alliance of Ontario (RCCAO) and OGRA, with MMM Group Limited, signed an agreement to undertake this research study. As it is a matter of provincial interest, the Ontario Ministry of Transportation (MTO) agreed to provide financial support of half the study costs. The study was led by a steering committee of representatives from the OGRA, RCCAO, MTO, and the County of Wellington. To test the concept, this research study reviewed the bridge infrastructure needs in the County of Wellington and constituent lower tier municipalities (Figure 2, page 12).
This report summarizes the findings to determine the bridge infrastructure needs of Wellington County and its constituent municipalities, and assess the feasibility of AFP delivery approaches to address long-term municipal bridge infrastructure needs.
Wellington County structure inventory
Findings are based on an assessment of life-cycle costs of the bridge inventory. Within the Wellington study area, there are 635 structures with spans of 3.0 metres or longer (excluding MTO highway structures and structures in the City of Guelph). Approximately one-third of the structures (194 structures) are owned and managed by the County of Wellington and the remainder (441 structures) are owned and managed by seven constituent municipalities including the Town of Erin, Township of Mapleton, Township of Centre Wellington, Township of Wellington North, Township of Guelph/Eramosa, Township of Puslinch, and Town of Minto. The County of Wellington had
7County of Wellington Bridge Study October 2013
generally available and reliable data sets that documented original year of construction, type of structure, and size. Unfortunately, the study includes only 60% of the lower-tier municipal inventory due to missing data that was required for the needs assessment. Despite the missing data, a sufficient sample size was available for the study, and the results were extrapolated to reflect the total infrastructure inventory.
structure improvement Costs
Based on the projections of this study, addressing the bridge infrastructure needs in the County and constituent municipalities will require, over the next seven years (by 2020), approximately $132 million (2011 dollars), or $19 million annually (2011 dollars). The annual rate may be somewhat higher than expected due to the potential backlog of bridge work that has not been addressed in the past. Over the longer term from 2020 to 2050, once the backlog is dealt with, the average annual expenditure required to address these needs is reduced to approximately $10-$11 million (in 2011 dollars—not adjusted for inflation) per year. This expenditure poses significant challenges for the case study municipalities. Clearly there will be competing infrastructure priorities over this period which will be a challenge for any municipality will limited financial resources. The same challenges exist for other Ontario municipalities with a large inventory of bridges that require repair or replacement over the next 20 years.
opportunities for afP Delivery
Municipalities can consider a range of options to gain efficiencies and reduce overall bridge renewal costs, such as municipal managed Design-Build contracts, multi-year contract bundling and AFP delivery. But there is no “one-size-fits-all” approach. A municipality must consider the technical and financial risks and determine whether there is Value for Money (VfM) in delivering through an AFP model, or choosing a Design-Build or other model. When considering any multi-year bridge renewal program, municipalities must also consider long-term allocation of capital and operating budgets and their financial means.
rccao.com8
Applying AFP or public-private partnerships (P3) contract procurement methods to address the structural infrastructure needs has potential benefits for municipalities. The AFP model brings together private and public-sector expertise in a unique structure that reduces the risk of project cost increases and improves project delivery schedule when compared with traditional project delivery methods.
AFP or P3 project delivery can be accomplished by one of several approaches, including Design-Build (DB), Design-Build-Finance (DBF) and Design-Build-Finance-Operate-Maintain (DBFOM). AFP delivery approaches have been implemented by the province on large health, education, and transportation projects to deliver hospitals, schools, highways, and other critical infrastructure. While the AFP model best suits large complex projects, bundling smaller projects together can achieve similar benefits. The Ministry of Infrastructure has identified AFP as an opportunity for municipalities to reduce costs and risk of both capital investments and long-term maintenance commitments.
An earlier study undertaken for Infrastructure Ontario in 2011 identified that AFP-procured projects can achieve significant costs savings (overall in the range of 30%). The savings come from reduced owner costs (10% to 15%), bidder innovation and value engineering (10% to 20%), avoidance of change orders and scope creep (10% +), an accelerated schedule (5% to 10%), and economies of scale. This study conservatively estimates that applying AFP delivery methods can achieve savings in the order of 13% to 20%, in addition to the benefits of accelerated construction.
The preliminary results of this study favour an AFP DB contract that includes bundling County and Township structures over a multi-year period. This type of contract requires the municipalities to make long-term budgetary commitments while at the same time recognizing that there are affordability considerations.
AFP is one option that can be considered for the delivery of such a large
9County of Wellington Bridge Study October 2013
and diverse program of municipal bridge renewal investments. Although AFP delivery has shown promising results in the past, more detailed analysis would be needed to identify the technical and financial risk of the specific investments. A VfM analysis can determine whether an AFP project will deliver value when compared to traditional delivery methods.
benefits of afP Delivery
This study considers how the benefits of a DB contract can be applied to high-value municipal bridge work, which is distributed over a wide geographic area and covers several municipal jurisdictions. Since few municipalities have a volume of work that would provide VfM for a single AFP contract, the study proposes adjoining municipalities with similar structural needs combine resources to prepare a single AFP contract that includes the rehabilitation of many structures over several years. Combining many individual structure projects into one large AFP contract provides the opportunity to achieve the savings that are inherent with AFP contracts.
afP Delivery expertise in ontario
Taking this step may be daunting for municipalities that may not have the technical resources or expertise to manage a DB AFP. There is significant positive AFP/P3 experience in Ontario, however, to help guide the process using Infrastructure Ontario, as well as private consulting expertise. The Province of Ontario and upper-tier municipalities have an opportunity to champion the AFP process and address some of these municipal infrastructure concerns.
improving structure inventory Data
On a broader scale, much can be done to improve the quality of municipal structure inventory data in Ontario. Although the County of Wellington and its constituent townships are considered proactive municipalities, the study team found a number of inconsistencies with the data that hampered the ability to make firm predictions on the state of the infrastructure. OGRA has data collection and asset management tools available and municipalities
rccao.com10
will benefit from making use of these tools. The completeness and quality of the structure inventory and inspection records are essential for efficient asset management. Greater support needs to be provided to ensure that there are regular inspections and that municipal structure inventory data are collected across the province.
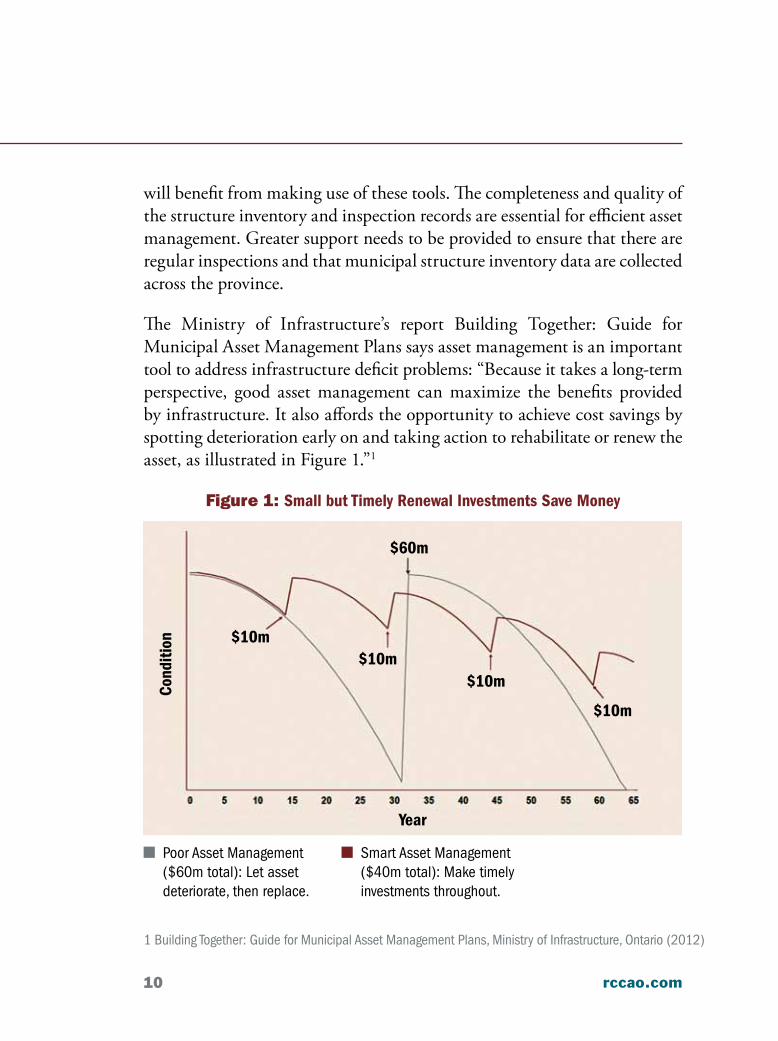
The Ministry of Infrastructure’s report Building Together: Guide for Municipal Asset Management Plans says asset management is an important tool to address infrastructure deficit problems: “Because it takes a long-term perspective, good asset management can maximize the benefits provided by infrastructure. It also affords the opportunity to achieve cost savings by spotting deterioration early on and taking action to rehabilitate or renew the asset, as illustrated in Figure 1.”1
1 Building Together: Guide for Municipal Asset Management Plans, Ministry of Infrastructure, Ontario (2012)
figure 1: Small but Timely Renewal Investments Save Money
Smart Asset Management ($40m total): Make timely investments throughout.
Cond
ition
Year
$10m$10m
$10m
$10m
$60m
Poor Asset Management ($60m total): Let asset deteriorate, then replace.

11County of Wellington Bridge Study October 2013
summary recommendations:
1 A concerted effort is required by the Province and municipalities across Ontario to improve the quality of bridge inventory data.
2 Apply asset management tools to provide a long-range plan of municipal infrastructure needs. The Province of Ontario should continue to fund programs to assist municipalities with infrastructure asset management plans.
3 Where appropriate, bundle municipal bridge rehabilitation work geographically and over time to increase the size of contracts and give contractors the flexibility to standardize operations and apply innovation.
4 Consideration should be given to use AFP/P3 procurement delivery models to improve the value of contracts and reduce costs. Municipalities will require assistance from the Province of Ontario to develop AFP strategies to tackle these infrastructure management challenges.
5 The Province of Ontario should consider opportunities to explore AFP delivery options for municipal bridge infrastructure projects and champion a demonstration project with a willing municipality. Such a project will enable municipalities to better determine the financial viability and Value for Money of using AFP/bundled methods.
This study conservatively estimates that
applying AFP delivery methods can achieve
savings in the order of 13% to 20%, in addition
to the benefits of accelerated construction.

rccao.com12
The study area is located in southwestern Ontario and includes the County of Wellington and its constituent municipalities, excluding the City of Guelph, as shown in Figure 2. There are 635 structures within the study area: 323 bridges and 312 culverts.
sTruCTure invenTory
Wellington County Official Map
figure 2: County of Wellington and Constituent Municipalities
Source: County of Wellington
The first step in determining the bridge infrastructure needs was to gather existing data on each structure in the inventory. OGRA’s Municipal DataWorks (MDW) database provided the data, and MMM supplemented it with in-house bridge structure data collected from past work for the County of Wellington and the Township of Centre Wellington.

13County of Wellington Bridge Study October 2013
In accordance with Ontario’s Public Transportation and Highway Improvement Act (PTHIA), R.S.O. 1990, all structures with spans equal to or greater than 3.0 metres require biennial inspection under the direction of a professional engineer. For guidance on bridge inspections, the Ontario Structure Inspection Manual (OSIM) provides a comprehensive methodology; however, use of the OSIM is not a legal requirement and bridge inventory reporting is sometimes inconsistent. OSIM recommends that structures in poor condition be inspected more frequently, and the Highway Traffic Act (HTA) provides posted load limits, which are set according to recommendations provided by two professional engineers. The posted load limit, description of the structure, additional investigations, and repairs required on an element by element basis, including quantities, are to be provided on the inspection forms (reports) for each structure. As the Province now requires municipalities to complete asset management plans and demonstrate critical infrastructure needs before requesting provincial capital funding, it is expected that more extensive data, including structure needs and required repairs, will be available over the next 10 years.
Data sufficiency
Although OGRA’s MDW database provides a means to document the OSIM reports, many municipalities are not in full compliance with the bridge inspection reports. The reason could be the cost of inspecting and reporting such detailed quantity-based information on an element-by-element basis. Many municipalities still report structure condition data in accordance with the old Bridge Appraisal Sheets, which are not quantity or element-based. Much of the data required for more detailed assessment of each structure needs is simply not available at the lower-tier level. While the reporting of structure condition should be more detailed, the structures are being inspected, which addresses the due diligence required for public safety in accordance with the Act.

rccao.com14
A review of the study area data indicated that there was generally insufficient information for the majority of the lower-tier structures to make an assessment of the structures needs (costs) over the next 10-year period normally covered by OSIM reports. Inspecting the structures to “fill in the blanks” was beyond the scope of this study and, for 635 structures, would be a formidable task. Copies of the actual inspection reports to “fill in the blanks” on the MDW data were requested; however, the response was limited due to incomplete information.
A review of the data indicated the following information was available for the majority of the structures:• Original year of construction• Structure type: bridge or culvert• Type of bridge or culvert (e.g. rigid frame, slab-on-girder,
truss, CSP, box culvert, etc.)• Deck width or culvert length• Span.
Some structures were likely not classified correctly, based on the stated geometric data. For example, a culvert by definition is an opening through an embankment and its length is more than the roadway’s width. However, the data recorded many structures with “deck widths” much wider than the travel width or road width, which is indicative of a culvert-type structure. Some culverts were classified as bridges, probably because the structure was not buried, but the proportions of the structure appeared to be more “culvert” than “bridge,” therefore they were reclassified as “culverts.” Following reclassification adjustments to the data, the study team determined the inventory is comprised of 312 culverts and 323 bridges.
The bridge inventory by municipality is presented in Figure 3.

15County of Wellington Bridge Study October 2013
Data adjustments
There was also confusion with respect to what constitutes the “span” of a structure. By definition, “span” is the distance from centre to centre of supports (or bearings). Much of what was reported as a span was likely the opening width between abutments, particularly on the concrete rigid frame and concrete box culvert type structures. Furthermore, in some cases the deck length was incorrect and included the length of the approach slabs or the data provided for deck length was the same as the data provided for span.
Where inconsistencies in the data were found, the span and deck length data were corrected based on engineering judgement. Where there was insufficient data to make a reasonable determination of the existing structure size (equivalent deck length and width) or if the original year of construction was missing, the structure was not included in the analysis of the needs.
figure 3: Total Inventory (635 Structures)
Wellington County194
Erin48
Guelph/Eramosa
29
Puslinch14
Centre Wellington
104
Mapleton107
Wellington North96
Minto43

rccao.com16
Another challenge was the stated year of construction. In one municipality, the original year of construction was the same for more than 40 structures. Since it was unlikely that more than 40 structures would be constructed in the same year, the structures reportedly built in the same year were excluded from further analysis. Missing or unreliable data reduced the number of structures in the inventory to be included in the needs analysis from 635 structures to 464 structures comprised of 260 bridges and 204 culverts.
Details of the inventory versus number of structures included in the needs analysis and structure classification are available in the Data Summary in the Appendices. Figure 4 shows the number of structures included in the needs analysis.
figure 4: Structures Included in Needs Analysis (464 Structures)
Guelph/Eramosa29
Puslinch12
Minto14
Wellington North38
Mapleton32
Wellington County192
Centre Wellington
99
Erin48
17County of Wellington Bridge Study October 2013
The next step was to develop a decision matrix for future structural work for each structure to determine costs and year when minor rehabilitation, major rehabilitation, and replacement of the structures will be required. The study adopted a life-cycle of 75 years. According to the current Canadian Highway Bridge Design Code (CHBDC), this number corresponds to the projected service life of new structures.
The resulting decision matrix reflects the available data. The County of Wellington has an asset management plan available for the next 10 years, which details the needs in “now”, “1 to 5 years,” and “5 to 10 year” categories. The lower-tier municipalities do not have asset management plans for their structures or a determination of their bridge infrastructure needs in the near future. Therefore, the decision matrix must provide an assessment of the lower-tier structure needs and of the total inventory needs beyond the next decade. In the future, the study team expects municipalities will have completed asset management plans that provide this critical bridge needs and cost data.
bridges
Typical practice indicates that bridges require minor rehabilitation after 25 years and major rehabilitation after 50 years. Minor rehabilitation works typically include the replacement of bridge bearings, resurfacing, replacement of waterproofing, concrete patching, replacement of expansion joints, and barrier repairs. Major rehabilitations typically involve more extensive work such as concrete overlays on decks or deck replacements, replacement of bridge barriers, resurfacing of substructure components, recoating structural steel, etc.
Theoretically, bridges can be maintained indefinitely by performing minor and major rehabilitation work as required. However, the cumulative effects of fatigue, environmental effects, and accident damage can eventually take a toll on the structure. Without regular maintenance and rehabilitation, the need for rehabilitation becomes more frequent and rehabilitation costs increase significantly. In addition, frequent lane or road closures to
sTruCTure neeDs

rccao.com18
accommodate major rehabilitation increases user costs (although bridge construction traffic interruptions and detours are not always a significant factor on rural low-volume municipal roads). In due course, replacing the structure becomes more economical than repairing it.
To estimate long-term bridge renewal needs and costs, this study assumed lower-tier bridges will be replaced at 75 years of age, and County bridges will be replaced at 100. For the County bridges, the study assumed additional life before replacement because the County has a proactive bridge maintenance program, including annual cleaning.
Structure replacements may also be required for functional reasons. Since most of these bridges were built, traffic loads and demands for structures to carry oversize and overweight loads have steadily increased. Structures with low posted load limits affect routes for maintenance vehicles (snow plows), transportation of goods, as well as emergency vehicle access. In cases where posted load limits do not meet demand and the cost of rehabilitating and strengthening the structure reaches unacceptable levels, replacement would be the practical option. Similarly, if the bridge width is no longer adequate for the traffic volume, increased traffic generated by adjacent land development may accelerate the need for replacement. Municipalities might also need wider bridges to accommodate the increased width of modern farm equipment, calling for replacement rather than rehabilitation. For this study, replacement for “functional” reasons is assumed when existing posted load limits are less than 20 tonnes for single-unit vehicles or the existing structure width is less than the tolerable width for two-way traffic.
Corrugated steel Pipe Culverts
Corrugated steel pipe (CSP) culverts generally have a shorter lifespan than concrete structures. In northern Ontario, CSP culverts are not recommended because the acidity of stormwater corrodes CSP structures in a relatively short period. CSP culverts in the Wellington County geographic area have long service lives compared to those in northern Ontario. Most problems experienced with structural CSP structures in the study area are the result of
19County of Wellington Bridge Study October 2013
bolt-line cracking, a fatigue defect resulting from improper installation. The problem of bolt-line cracking, which is related to how the plates are lapped, was not diagnosed until the 1980s, so there are many existing structures with this problem in the study area. Fortunately, the problem is related to fatigue and many of the bolted CSP structures simply have not achieved enough load cycles (due to low traffic volume) for the problem to develop. In addition, industry has developed a standardized repair for bolt-line cracking. If this repair is applied before or when the cracks first appear, it effectively solves the problem. For this study, the team assumed CSP culverts will have a lifespan of 50 years before requiring replacement.
The service life of CSP culvert structures could be extended by rehabilitation, lining, or other methods. Culvert rehabilitation methods result in smaller waterway openings, reducing flow capacity and possibly having an unacceptable impact on flood lines. The majority of the CSP culverts in the study area are not buried very deeply, however, so the cost to excavate, replace, and backfill corroded CSP culverts is not significantly more than the cost of rehabilitation. Therefore, the study has assumed that CSP structures will be replaced at the end of their service life.
Concrete Culverts
Concrete culverts typically have a longer service life than concrete bridges because they are buried and don’t have joints. Concrete culverts are not subject to deterioration of the deck section and substructure that result from joint leaks and exposure to chloride salts. In addition, structures buried in more than 500 millimetres of fill receive a lower oxygen supply that keeps reinforcing steel from becoming corroded at a higher rate and the fill prevents much of the chloride-laden road drainage from reaching the structure.
Concrete culvert deterioration is typically associated with freeze-thaw deterioration or concrete erosion. New concrete structures are built with air-entrainment to resist freeze-thaw deterioration and are constructed with higher density and stronger concrete than the material used prior to 1970. Freeze-thaw deterioration typically occurs on the culvert fascia with southern

rccao.com20
exposure, which is subjected to more freeze-thaw cycles and direct surface runoff. Because it is limited to the culvert ends which are not subjected to traffic loads, this deterioration is usually of little structural consequence. The more rapid structural deterioration occurs at water level on the culvert walls where freeze-thaw cycles and erosion reduce the wall thickness. Experience has shown that a significant amount of culvert wall deterioration may occur before it has an impact on structural adequacy. The reason is that the deterioration is typically at low-stress locations near the bottom of the walls. The study assumes that concrete culverts will not require rehabilitation for 40 years compared to the 25-year rehabilitation cycle assumed for bridge type structures. As with bridges, the study assumes that concrete culverts will be replaced at 75 years because they are older concrete structures built without air-entrained concrete.
summary of assumptions
The assumptions used in this study to estimate the County and Township needs for the next 75 years are summarized in Table 1 below.
Table 1: Study Needs Assumptions – Rehabilitation Cycle
Structure TypeMinor
Rehabilitation Cycle (years)
Major Rehabilitation Cycle (years)
Replacement Cycle (Years)
Bridges - County 25 50 100
Bridges - Municipal 25 50 75
Culverts - CSP N/A N/A 50
Culverts - Concrete N/A 40 75
21County of Wellington Bridge Study October 2013
The estimated cost of minor and major rehabilitations is normally expressed as a percentage of the existing asset value. The existing asset value for this study is defined as the cost to replace the structure with a deck area of the same size. The cost is determined from average costs per square metre of deck area of bridge and culvert. The study team requested data on costs of bridge contracts in the County of Wellington area as a basis for the costs, but these were not available. Consequently, the team based the structural cost estimates on the parametric unit costs from the MTO 2011 Parametric Estimating Guide (PEG). As the PEG does not include costs for CSP culverts, 75% of the parametric unit cost for concrete culverts was used and based on the author’s experience.
Guide rail
The MTO PEG unit costs provide estimated replacement costs for the structure only and do not include allowances for guide rail on the approaches. Based on experience, it is noted that many of the existing lower-tier structures may not have guide rail on the approaches to the structure, or guide rail is in poor condition or missing end treatments according to current standards. To address this issue, the study assumptions include a $35,000 lump sum cost for the installation of new guide rail systems on the culvert approaches. As a reflection of the 25-year service life of steel beam guide rail systems, the cost is applied to both rehabilitation and replacement estimates.
approach Work
The costs of approach road work associated with bridge and culvert replacements are also not included in the PEG unit structure replacement costs. Local (transition) widening of the approaches is typically required on lower-tier roads to match the width of the replacement structure. In addition, some minor grade changes are typically required to accommodate current soffit clearance requirements and increases in superstructure depth. As noted earlier, the inventory data did not identify the proportion of the bridge structure costs that applied to approach work. Based on collective experience, the study team applied a multiplier of 50% of the bridge replacement cost
CosT of sTruCTure rehabiliTaTions/rePlaCemenTs

rccao.com22
to cover the cost of approach road work. The actual approach road work is expected to vary significantly from site to site depending on the realignment (vertical and horizontal) required to suit the replacement structure.
It was assumed that road width at the County culverts was adequate. Also, since culverts are buried, changes in approach grade are probably not required when culverts are replaced. Approach work on County culverts associated with replacement was considered minimal, so no multiplier was applied for culvert approach work. With respect to lower-tier municipalities, it was assumed the road width at the culverts was likely deficient and transition widening from the existing road width to the structure would be required. A multiplier of 20% of the culvert replacement cost was applied to the lower-tier culvert replacements for associated road work.
Details of the unit costs, multipliers for approach work, and guide rail costs used for bridge and culvert replacements may be found in the Basic Study Assumptions for Bridges and Culverts in the Appendices.
bridge Widths
When existing bridges or culverts require replacement and the existing deck width is insufficient to meet current road standards, the replacement cost is based on the new bridge width or culvert length required.
Many lower-tier structures are on low-volume roads, which suggests that one-lane-only replacement structures are adequate, thereby reducing the width required for the replacement structures. However, the majority of lower-tier roads are posted at 80 kilometres per hour, where single-lane bridges are not allowed according to current standards for this speed. Many other structures need to service farm equipment, which require wider travel widths. Therefore, the study assumed all replacement bridge widths would accommodate current standards for two-way traffic plus an allowance for bridge barriers.

23County of Wellington Bridge Study October 2013
Performance Level 3 barriers with a width of 600 millimetres were assumed for County Roads subjected to higher traffic volumes and Performance Level 2 barriers with a width of 300 millimetres were assumed for the lower tiers. The road standards for lane and shoulder widths according to County Road (arterial or collector) or lower tier (local) road used in the study may be found in the Appendices.
Culvert Widths
Determining the length of replacement culverts was difficult because the depth of the culvert was generally not recorded and what inspectors consider ‘travel width,’ if recorded in the data, was not clear and generally inconsistent with the road widths. In addition, many lower-tier roads are gravel roads, which are treated regularly with maintenance gravel. The many years of the application of maintenance gravel has reduced the platform width and increased the depth of bury on the culverts. The result is that the lengths of the existing culverts are not sufficient to maintain the road cross-section travel width standards. A 3.0-metre increase over the existing culvert length was applied to culverts on lower-tier roads to determine the replacement culvert length. As the County roads are generally paved, this increase in length was not applied to County culverts.
Many of the existing concrete culverts have shallow or no bury depth. Therefore, the required replacement concrete culvert length was based on an assessment of the capability of the existing culvert length to accommodate the replacement travel width. Where the existing concrete culvert length was greater than required for the travel width, the existing concrete culvert length was used for the replacement structure. Where the existing culvert length was less than the replacement travel width (plus an allowance for barriers), the replacement concrete culvert length was based on the new travel width required. However, some existing concrete culverts may be longer than indicated by travel width requirements due to sidewalks or skewed orientation with respect to the road. The study did not consider this factor.

rccao.com24
The structure needs identified in this study represent the costs to address the immediate and anticipated future costs of rehabilitation and replacement, according to the decision matrix and cost formulas developed for the study. Details of the results for each municipality may be found in the Appendices. The resulting needs—assuming no inflation for all of the included structures—were totalled in five-year increments. See Chart 1.
sTruCTure neeDs resulTs
Chart 1: Total structural needs in the County of Wellington and Constituent Townships (2011 dollars)
2011
-201
5
120
100
80
60
40
20
0
Cost
($M
illio
n)
104
28
57 60 58
67
45
59
40
26
59
42 4438
53
21
2016
-202
020
21-2
025
2026
-203
020
31-2
035
2036
-204
020
41-2
045
2046
-205
020
51-2
055
2056
-206
020
61-2
065
2066
-207
020
71-2
075
2076
-208
020
81-2
085
2086
-209
0
total needs in 5 year ranges (0% inflation, Extrapolated)
Wellington County
Lower Tiers (Aggregate of all municipalities)
A key observation on Chart 1 is the high value of bridge work in the first five-year period (2011-2015). It reflects the magnitude of the backlog of the estimated bridge rehabilitation requirements that have not been adequately addressed in the past and have been confined to the first period. Beyond the
25County of Wellington Bridge Study October 2013
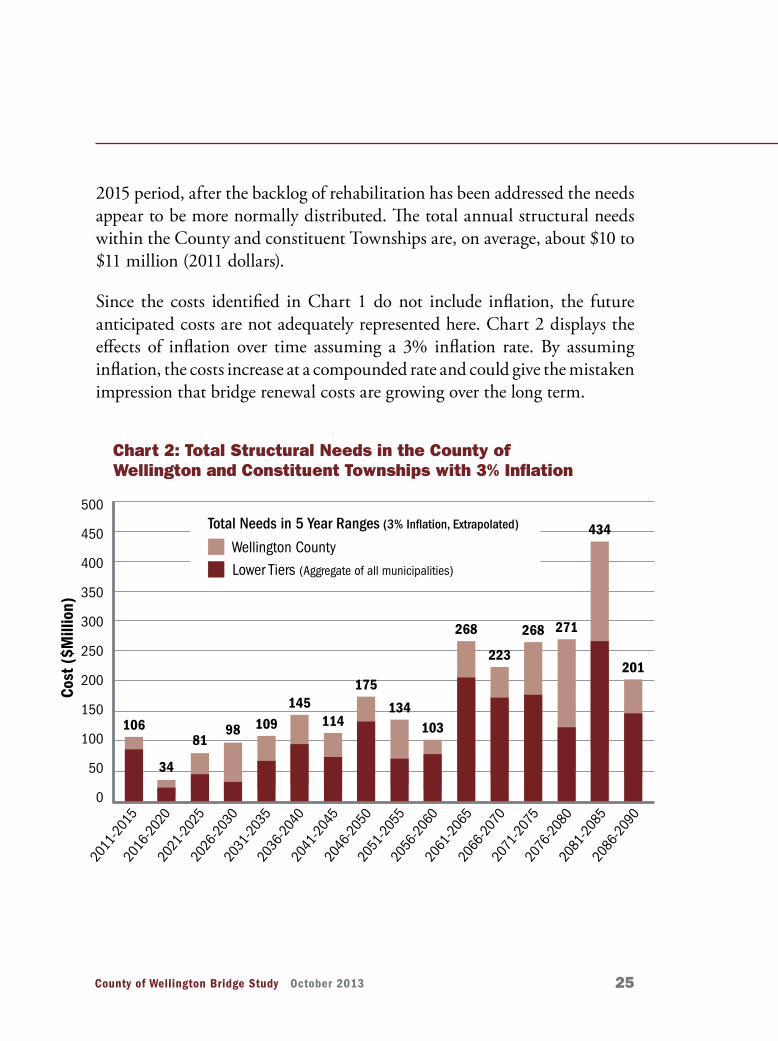
2015 period, after the backlog of rehabilitation has been addressed the needs appear to be more normally distributed. The total annual structural needs within the County and constituent Townships are, on average, about $10 to $11 million (2011 dollars).
Since the costs identified in Chart 1 do not include inflation, the future anticipated costs are not adequately represented here. Chart 2 displays the effects of inflation over time assuming a 3% inflation rate. By assuming inflation, the costs increase at a compounded rate and could give the mistaken impression that bridge renewal costs are growing over the long term.
Chart 2: Total structural needs in the County of Wellington and Constituent Townships with 3% inflation
500
450
400
350
300
250
200
150
100
50
0
Cost
($M
illio
n)
106
34
8198 109
145114
175
134103
268
223
268 271
434
201
2011
-201
520
16-2
020
2021
-202
520
26-2
030
2031
-203
520
36-2
040
2041
-204
520
46-2
050
2051
-205
520
56-2
060
2061
-206
520
66-2
070
2071
-207
520
76-2
080
2081
-208
520
86-2
090
total needs in 5 year ranges (3% inflation, Extrapolated)
Wellington County
Lower Tiers (Aggregate of all municipalities)

rccao.com26
The County of Wellington independently prepared a Bridge and Culvert Appraisal Report (2011) that outlines the structure needs for a 10-year period between 2011 and 2021. The results of this study were compared with the County’s 2011 Appraisal Report as a means to validate the findings. Table 2 compares the 2011 report findings to the results of this study.
A review of Table 2 shows the 2011 County report estimates greater needs for bridges and slightly lesser needs for culverts than this study identifies. Overall, the findings of this study appear to underestimate the inventory needs for the County structures by approximately 16%.
A review of the culvert OSIM reports, however, shows that approximately $1.4 million of the culvert work shown in the 2011 report is solely related to guide rail upgrades. If we consider these requirements, the 2011 report culvert costs decrease to approximately $8.9 million when the costs for guide rail deficiencies are removed.
Table 2: Comparison of Life-cycle Cost Estimates between the County’s 2011 Bridge and Culvert Appraisal Report and this Study’s Results
LIFE-CYCLE COST ANALYSIS RESULTS COUNTY STRUCTURES FOR PERIOD 2011-2021 ($ Million)
Bridges Culverts Total Bridges Culverts Total
28.5 10.3 38.8 20.8 11.8 32.6
County of Wellington 2011 Bridge and Culvert Appraisal
Study Results (Estimate Based on Original Date of Construction)

27County of Wellington Bridge Study October 2013
In order to compare the results, the following assumptions were applied to the individual structure costs in the 2011 report:• costs less than or equal to 15% of the asset value indicated maintenance
work only;• costs between 15% and 35% of the asset value indicated minor rehabilitation
work; • costs between 35% and 75% of the asset value indicated major rehabilitation
work; and• costs greater than 75% of the asset value indicated structure replacements.
Table 3 describes the number of culverts and the estimated cost of the rehabilitation work over the next 10 years indicated by each study.
1 - Maintenance activities were not addressed in this study.
Table 3: Number of Culverts and Estimated Costs under this Study and the County’s 2011 Bridge and Culvert Appraisal Report
CULvERT WORk
CATEgORY
Maintenance1 35 1.4 N/A N/A
Minor Rehab. 15 0.8 0 0
Major Rehab. 6 1.0 2 0.6
Replacement 15 7.1 30 11.3
Total Excluding Maintenance1 36 8.9 32 11.9
Number of Culverts
Cost of Work ($ million)
Number of Culverts
Cost of Work ($ million)
County of Wellington 2011 Bridge and Culvert Appraisal
Study Results (Estimate Based On Original Date of Construction)

rccao.com28
Table 3 shows that significantly more (30 versus 15) culverts are scheduled to be replaced over the next 10 years compared to the OSIM recommendations. Furthermore, the review of the OSIM reports indicates that only one culvert was recommended for replacement in the “6 to 10 years” category. This suggests inspectors readily report culvert needs when signs of structural distress are evident, but are reluctant to make long-term forecasts of culvert needs, which are difficult to determine based solely on a visual inspection. The study also found that, despite observations of heavy corroded steel, inspectors did not recommend rehabilitation or replacement in the next 10 years if there were no signs of structural distress on CSP culverts. In addition, a review of the OSIM reports and comparison of the results suggests the lifespan assumed in the study for culverts, particularly for CSP culverts, may be conservative (shorter lifespan than that found in reality).
Overall the number of culverts identified in this study (32) is within 10% of the County’s estimate (36). Although the County may have indicated that only 15 culverts need replacement, it also identified another 21 culverts needing either minor or major rehabilitation. The overall numbers are close but indicate that this study’s approach to identifying the need may be more conservative.
Another interesting note of comparison between the two studies is the cost of the proposed work. The County’s estimate for the replacement of 15 culverts is approximately $475,000 each, while this study’s estimate is $375,000. Whereas this study may be more conservative in identifying the need, it also may be underestimating the value of the work.
Recent trends indicate that environmental agencies, including conservation authorities (CAs), the Ministry of Natural Resources (MNR), and the Department of Fisheries and Oceans (DFO), are requiring that replacement structures accommodate animal passage and the width of the meander belts of waterways. The result is that many culverts require significantly longer spans when replaced, for which this study does not account. Costs for the culvert work could increase by a factor of 10 or more based on current environmental trends.

29County of Wellington Bridge Study October 2013
In summary, this study shows approximately 34% greater needs for culverts over the next 10 years compared to the County’s report, but the overall cost difference is partially offset by the higher unit culvert cost replacement. Future studies could consider extending the assumed lifespan of culverts and increasing the unit cost for culvert replacement.
1 - Maintenance activities were not addressed in this study.
Table 4: Number of Bridges and Estimated Costs under this Study and the County’s 2011 Bridge and Culvert Appraisal Report
BRIDgE WORk
CATEgORY
Maintenance1 37 1.2 N/A N/A
Minor Rehab. 15 3.0 4 0.8
Major Rehab. 17 4.7 16 10.2
Replacement 16 19.6 10 8.3
Total Excluding Maintenance 48 27.3 30 19.3
Number of Bridges
Cost of Work ($ million)
Number of Bridges
Cost of Work ($ million)
County of Wellington 2011 Bridge and Culvert Appraisal
Study Results (Estimate Based On 0riginal Date of Construction)
Table 4 shows the similar comparison of bridge statistics between this study and the County’s 2011 Appraisal Report. Based on a review of OSIM reports, the majority of the identified costs for the County bridges reports are a result of guide rail deficiencies. It is not surprising that a large number of the bridges (36%) have deficient guide rail given the average age of the bridges in the County is 51 years, and standards for guide rail end treatments have changed significantly over the last 25 years.

rccao.com30
Table 4 also shows that this study assumes a low typical cost of minor rehabilitation for the County bridge inventory—it is only 25% of the cost estimated in the County’s report. The sample size for minor rehabilitations over the next 10 years is relatively small and, therefore, inconclusive with respect to trends. Conversely, despite a similar number of major rehabilitations, this study’s cost estimate is approximately twice the County’s estimate, suggesting the study’s assumed cost of major rehabilitation work is too high.
With respect to bridge replacements, the 2011 report shows the average cost of a bridge replacement is approximately $1.2 million, which is approximately 50% higher than the study’s estimated average bridge replacement cost. This suggests the study’s assumed costs for bridge replacement may be low. In addition, according to the 2011 report, the number of bridge replacements required for the next 10 years is approximately 50% higher than the study. This observation suggests the study assumes a lifespan of bridges (100 years for the County bridges) that may be too high.
When the maintenance costs generally associated with guide rail upgrades are removed from the bridge and culvert needs, the study results are within 10% of the 2011 report on total inventory needs for the County over the next 10 years. Long-term needs (more than five years from inspection), however, are probably underestimated in previous reports due to the difficulty in determining the “6 to 10 year” needs. The overall study results (total of bridges and culverts) for the inventory are probably 15% to 20% lower than the actual needs.
Details on the extrapolated bridge and culvert costs may be found in the Appendices.
31County of Wellington Bridge Study October 2013
This section considers the possible opportunities to bundle structural work among the municipalities as a means to provide greater value. Increasing the number of structures in a single contract will reduce overall unit costs by providing economies of scale for similar work and better use of labour and equipment. In addition to considering the bundling of structural work, this report also considers the prospect of AFP delivery options, in accordance with recent initiatives in the Province of Ontario, Canada, and the United States.
AFP contracts, also referred to as P3 contracts, are partnerships with major contractors and developers that provide a full range of services to the owner, including design, construction management, and project financing. In a traditional contract delivery, the owner is responsible for the design and tells the contractor what to do; hence, the owner owns all of the design risks and unknown risks. In an AFP contract, the scope of work is defined by the desired results, based on performance specifications. It is up to the contractor to decide how to design and undertake the construction, so the contractor owns most of the risk. Value is achieved because the contractor is most knowledgeable in this area and is in the best position to accept and manage these risks.
General benefits of afP
The delivery of an AFP project for a bundled group of bridges would typically be accomplished in a relatively simple DB contract, where the contractor is responsible for both design and construction. To reduce the financial risk for a municipality, it would be desirable to keep the financial requirements of such a contract to simple milestone payments that are made upon completion of basic elements of structure and/or total completion of the work.
The payment terms are an important element of an AFP contract. These terms can provide a strong incentive to complete the project on time. Experience has shown that most AFP contracts are completed ahead of schedule while traditional design-bid-build contracts are often completed behind schedule. AFP contracts often include performance clauses as a further incentive.
alTernaTive Delivery oPTions

rccao.com32
On August 21, 2013, the Conference Board of Canada released a report, Canada as a Global Leader: Delivering Value through Public-Private Partnerships at Home and Abroad, which assesses the recent cost and time performance of P3s in Canada. The report updates an earlier 2010 Conference Board study, Dispelling the Myths: A Pan-Canadian Assessment of Public-Private Partnerships for Infrastructure Investments. It reviews the flow of Canadian P3 projects that have been procured or have reached construction completion since January 2010. In the Conference Board’s analysis, most recent P3 projects in Canada have been delivered successfully. Of the 42 projects assessed in the study, 35 were completed on time or early. According to the value-for-money studies, cost savings on these projects have averaged 13% in comparison to traditional delivery models.
AFP and P3 contracts are becoming more common. Public agencies are using AFP and P3 contracts in North America to take advantage of the greater value and improved schedule that these contracts provide. As the contractor accepts all of the design and construction risks, public agencies are not subject to the typical scope changes and claims that result when the owner prepares the design and manages the contract. An AFP contract is established on performance based specifications that define the end product instead of how to build it. When advance design work is not provided to contractors in AFP projects, more effort is required by the owner in advance of the procurement process to properly scope the project requirements, identify potential risks, secure/recognize government approvals and prepare detailed cost estimates.
afP Contracts for municipal bridge Works
A 2011 study for Infrastructure Ontario consulted a number of major Canadian transportation construction companies with respect to their views on the delivery of AFP/P3 projects. A key consideration was that a Design-Build contract needs to be of sufficient size, at least $50 million to $100 million, to be viable with the assumption of risk and to justify the investment in the bid process. This may not be a problem on large transportation projects
33County of Wellington Bridge Study October 2013
like Highway 407, the Herb Gray Parkway in Windsor, or an urban light-rail transit project. However, to apply the benefits of AFP procurement to bridge contracts, it would be necessary to bundle bridge work geographically into contracts worth over $50 million.
Depending on the size of a municipality, it may be a challenge to bundle $50 million of bridge work, particularly for some rural Ontario municipalities. The aim of this study is to consider opportunities to pool bridge projects over a number of adjoining municipalities. Although it might be challenging to bring together several municipalities with varying infrastructure priorities, fiscal capacities, and technical resources, the potential benefits are worth the effort.
Case studies
There is limited municipal experience in North America with bridge AFP/P3 contracts. One good municipal example is the Disraeli Bridge in Winnipeg which was procured as a DBFM project. Although this was a single structure, the contract was worth $195 million. The bridge was opened on time and on budget in the fall of 2012 and resulted in multi-million-dollar cost savings in comparison to a traditional delivery approach. The results from the final value-for-money report, completed by Deloitte & Touche LLP, assessed the value of savings at approximately $47.7 million, or 17.1%.
On a larger scale, the State of Missouri launched an ambitious program in September 2008 with a goal to have 802 of the state’s bridges completed by the end of 2014 (250 bridge rehabilitations and 554 bridge replacements).Due to underestimated state of infrastructure (repair cost) and the financial market troubles at the time, the original project launch was cancelled. After repackaging the program, a Design-Build contractor was selected in May 2009 for the $685 million Safe & Sound Bridge Improvement Program. On November 8, 2012, the program drew to a close, with all 802 bridges completed in just slightly more than 3.5 years. The project was expected to take more than five years to complete, so this was a truly successful program.

rccao.com34
MTO has considerable experience with bundling bridge rehabilitation projects. MTO has bundled rehabilitation design and delivery, using DB and traditional design-bid-build approaches. Bundling projects is intended to reduce overall costs, save time, and introduce opportunities for innovative construction approaches. It also permits a contractor to plan work to manage the traffic impacts of construction. There are many Ontario-based contractors that are involved in such major projects and have the necessary construction management and coordination experience.
Partnership with infrastructure ontario
Smaller Ontario municipalities do not often have the experience or expertise to put together and manage major AFP projects; however, in sectors such as health, education and transportation, municipalities have established partnerships with Infrastructure Ontario (IO) to successfully deliver major projects. For example, in recent years IO has partnered with Ottawa, Toronto and Kitchener-Waterloo to deliver light-rail transportation projects. The technical and environmental requirements for delivering bridge projects can be developed by in-house municipal staff resources, or with consultant engineering and project management support.
Bundling several bridge projects requires an understanding of how to set up the AFP procurement process, prepare the performance-based specifications, set up the payment mechanisms, and prepare the project agreement (contract). IO, as well as a select number of engineering consulting firms, has expertise in this area. Significant experience has been gained from AFP projects, such as hospital and transportation projects, to help municipalities with this step. They have built up considerable experience delivering institutional projects (hospitals, courts) and will be able to use this experience to help municipalities with civil infrastructure projects using AFP and bundling methods.
35County of Wellington Bridge Study October 2013
Interested municipalities can become familiar with the process and the results by contacting IO or the respective agencies that have implemented AFP projects. Experience is critical to understanding the potential and the feasibility of alternative delivery approaches, and to assess the agency’s abilities and willingness to undertake a large-scale initiative.
application of afP to bridge Works
AFP models provide an opportunity to advance bridge work and reduce overall costs. Based on MMM’s AFP experience and studies undertaken for IO, it was determined that significant costs savings (overall in the range of 30%) can be achieved from AFP-procured projects. The savings can be realized through: • Reduced owner costs (10% to 15%) as a result of reduced effort in design,
pre-engineering services and construction management.• Bidder innovation and value engineering (10% to 20%) that result from
performance-based specifications.• Avoidance of change orders and scope creep (10% +) as the contractor
assumes most construction risks.• Accelerated schedule (5% to 10%) which can reduce financing costs and
make the infrastructure available sooner.• Economies of scale (also present in a traditional procured project of the
same size).
Although an AFP project will lower the overall project costs for the owner, the contractor cost will be higher due to the additional responsibility for the design, construction management, and risk. Contractor soft costs generally increase to about 40% of the hard construction cost as compared to 30% on a traditional bid-build project. The savings to the owner are reflected in overall project cost savings achieved as a result of contractor innovation as well as reduced owner’s soft cost (design and construction administration), change orders, claims, and owner’s risks.
rccao.com36
large Contracts
How can the potential cost savings of AFP projects be applied to municipal bridge infrastructure projects? The first consideration would be to consolidate the work into a much larger contract. Benefits are achieved if there is a sufficient quantity (value) of work to give contractors the flexibility to standardize work operations and apply innovation. Bundling structures in a geographic area with surrounding municipalities is an excellent way to increase the volume of work. Consideration for grouping structures that are targeted for rehabilitation over subsequent years is another way to increase the volume of work. Bridges can also be bundled on a road network basis or along with major road construction work.
Type of afP Contract
A second consideration is the type of AFP contract. AFP contracts refer to a partnership between the owner and contractor that allows for risk sharing. The most commonly used types of AFP/P3 contracts are Design-Build (DB), Design-Build-Finance (DBF) and Design-Build-Finance-Operate-Maintain (DBFOM).
DB is the simplest alternative. It allows the contractor to undertake the most efficient design and build the project in accordance with performance specifications. Payment can be through regular periodic payments or by milestone payments.
A DBF contract includes the cost to finance the project until completion and handover. In essence, a DBF contract is similar to a DB contract except that full payment is made at the project’s close. A DBF contract usually includes a financial partner (other than the contractor), who finances the project until completion. The financial partner’s interests are aligned with the owner to provide an extra layer of oversight and rigour to ensure the project is delivered on time and in accordance with the contract conditions. A DBF project provides a significant advantage in the form of completion on time or ahead of time.
37County of Wellington Bridge Study October 2013
A DBFOM contract includes not only the financing for the project but the responsibility to operate and maintain the system. This type of contract provides a very powerful incentive to ensure the best and most efficient decisions are made to support the project over the long term. A DBFOM contract provides the most value by including the life-cycle costs. Payments are usually made in lump sum amounts for the capital investment and regular periodic payments during the term of the operations and maintenance.
Potential Cost savings
In the case of a bundled bridge contract, there are likely two scenarios: a simple contract (DB) to deliver the rehabilitated structures, or a longer-term contract that includes the rehabilitation and future maintenance of the infrastructure (DBFOM). While the latter could provide more value over the long term, it would be difficult to scope. It may also be less desirable as it requires a long-term commitment which may financially burden the municipality and provide less flexibility of choice. Rehabilitation work on bridges tends to be spread over longer cycles and in order to achieve benefits from a DBFOM contract, it would be necessary to have a contract term of at least 30 years.
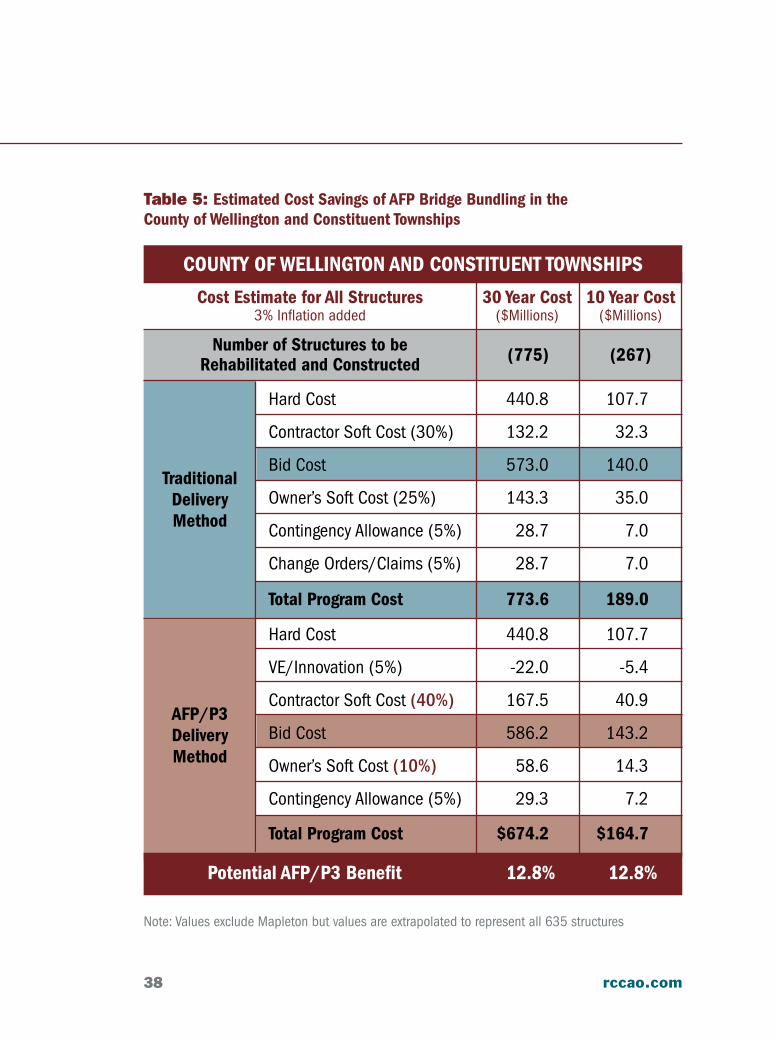
As an example, Table 5 illustrates the potential savings of an AFP project if all the structure work within the county and the constituent townships were to be bundled into a single contract over a 30-year period or a 10-year period. A 30-year contract may be useful if there was interest in committing to a long-term DBFOM contract that included maintenance (note: maintenance cost is not included in these estimates). The 10-year contract provides a more practical approach that typically would be delivered through a DB or DBF approach. The 10-year contract would allow municipalities to achieve the same savings levels at a contact value that meets the threshold for AFP procurement, but without the long-term commitments. Another potential benefit (depending on how payment terms are established) is the work required to address the current structural needs within the program would be accelerated to be completed in less than 10 years (as experienced during the Missouri Safe and Sound program).
rccao.com38
Table 5: Estimated Cost Savings of AFP Bridge Bundling in the County of Wellington and Constituent Townships
Note: Values exclude Mapleton but values are extrapolated to represent all 635 structures
Number of Structures to be Rehabilitated and Constructed
Cost Estimate for All Structures 3% Inflation added
30 Year Cost($Millions)
10 Year Cost($Millions)
COUNTY OF WELLINgTON AND CONSTITUENT TOWNShIPS
TraditionalDeliveryMethod
Hard Cost 440.8 107.7
Contractor Soft Cost (30%) 132.2 32.3
Bid Cost 573.0 140.0
Owner’s Soft Cost (25%) 143.3 35.0
Contingency Allowance (5%) 28.7 7.0
Change Orders/Claims (5%) 28.7 7.0
Total Program Cost 773.6 189.0
AFP/P3DeliveryMethod
Hard Cost 440.8 107.7
VE/Innovation (5%) -22.0 -5.4
Contractor Soft Cost (40%) 167.5 40.9
Bid Cost 586.2 143.2
Owner’s Soft Cost (10%) 58.6 14.3
Contingency Allowance (5%) 29.3 7.2
Total Program Cost $674.2 $164.7
Potential AFP/P3 Benefit 12.8% 12.8%
(775) (267)
39County of Wellington Bridge Study October 2013
bundling structure Projects
Although specific 10- and 30-year examples are provided above, there are various different ways the structures can be bundled, either geographically, by municipal jurisdiction or by different time periods. The basic message: if a sufficient size of contract can be achieved, there is an opportunity to derive savings and accelerate construction. The savings assumptions used in this study are fairly conservative yet still produce benefits in the order of 13%. Considering that experience has demonstrated that AFP benefits typically produce savings in the order of 30%, it is not out of the question to anticipate even greater savings. The degree of savings will depend on a number of things, such as volume and type of work, similarity of the work (repetitiveness), opportunity for innovation, and geographic proximity of all the structures.
The estimates of the number of structures and costs shown in Table 5 were developed by extrapolating the values of the known structural deficiencies excluding the Town of Mapleton to conform to the total number of structures within the county and the townships. The contractor “Hard Costs” were also calculated in order to determine the contractor bid costs under both traditional and AFP scenarios. In order to be conservative and not paint an overly optimistic scenario, lower values were applied for the savings associated with reduced claims (5%) and innovation (5%) in AFP. Overall savings are noted to be in the order of 13%; however, the potential exists for savings to be significantly higher.
implementation
In order to implement an AFP procurement contract, the County and Townships would have to agree to participate in such a venture. The costs of the work would be allocated to each municipality based on estimated costs to do the work in their jurisdiction. The estimates would be used to apportion the final bid cost on a percentage basis of the total. Any scope changes or deviations that may arise after the contract is established would be negotiated separately with the respective municipality that has
rccao.com40
jurisdiction over the structure subject to the change. IO can be called upon for advice and assistance with respect to the procurement methods and contract documents. IO has actively participated with a number of urban municipalities in the procurement of recent major municipal AFP contracts.
This study is based on the preliminary information currently available. More detailed information is required to properly assess both the structural needs and the financial implications. A thorough structural investigation would be required on the target structures to identify the specific structural needs, the proposed solutions, and the costs. Advance engineering work is also recommended to better scope the project, such as environmental approvals, geometric surveys, and geotechnical investigations. This is needed to reduce risk and allow both the municipalities and potential bidders to properly assess the work and determine costs.
reducing uncertainty and risk
A key consideration is to reduce uncertainty with respect to environmental and community impacts. Municipalities can overcome this uncertainty with a bridge infrastructure plan that integrates bridge needs analysis with environmental assessment (EA) planning principles. An example is the Bruce County Bridge Infrastructure Master Plan that examined a group of related bridge projects to address the first two stages of the municipal class EA. This involves consultation with the public, regulatory agencies, and property owners adjacent to the bridges. Through this process the natural, social, economic, and cultural (heritage and archaeological) impacts are considered. This can minimize the transfer of risks to bidders and build community support for the bridge projects ultimately bundled together in the AFP initiative.

41County of Wellington Bridge Study October 2013
1 A concerted effort is required by the Province and municipalities across Ontario to improve the quality of bridge inventory data. 2 Apply asset management tools to provide a long-range plan of municipal
infrastructure needs. The Province of Ontario should continue to fund programs to assist municipalities with infrastructure asset management plans.3 Where appropriate, bundle municipal bridge rehabilitation work geographically and over time to increase the size of contracts and give contractors the flexibility to standardize operations and apply innovation. 4 Consideration should be made to AFP/P3 procurement delivery models to improve the value of contracts and reduce costs. Municipalities will require assistance from the Province of Ontario to develop AFP strategies to tackle these infrastructure management challenges.5 The Province of Ontario should consider opportunities to explore AFP delivery options for municipal bridge infrastructure projects and champion a demonstration project with a willing municipality. Such a project will enable municipalities to better determine the financial viability and Value for Money of using AFP/bundled methods.
This study is a starting point for exploring the potential of alternative delivery approaches for municipal bridge infrastructure. Going forward, the County of Wellington and constituent municipalities are encouraged take action to define any missing bridge data and develop comprehensive bridge asset management plans. The asset management plans will provide the necessary foundation for future consideration of any new and innovative approaches to bridge infrastructure renewal. Having an understanding of the state of the infrastructure is essential for informed decision making.
The municipalities and Wellington County are facing challenges similar to many other Ontario municipalities. Ontario municipalities should be encouraged to develop infrastructure asset management plans and consider new ways of delivering infrastructure including alternative delivery methods. The recent positive AFP experience in Ontario should inspire partnerships to be developed with the private sector, the Ontario government, and neighbouring municipalities.
ConClusions anD reCommenDaTions

County of Wellington Bridge Study September 201342
RCCAO members include: • Carpenters’ Union • Greater Toronto Sewer and Watermain Contractors Association • Heavy Construction Association of Toronto • International Union of Operating Engineers, Local 793 • International Union of Painters and Allied Trades, District Council 46 • Joint Residential Construction Council • LIUNA Local 183 • Residential Carpentry Contractors Association • Toronto and Area Road Builders Association
The Residential and Civil Construction Alliance of Ontario (RCCAO) is composed of management and labour groups that represents a wide spectrum of the Ontario construction industry. The RCCAO’s goal is to work in cooperation with governments and related stakeholders to offer realistic solutions to a variety of challenges facing the construction industry and which also have wider societal benefits. For more information on the RCCAO or to view copies of other studies and submissions, please visit the RCCAO website at rccao.com
RCCAO 25 North Rivermede Road, Unit 13Vaughan, Ontario L4K 5V4Andy Manahan, executive directore [email protected] p 905-760-7777w rccao.com
OGRA’s mandate identifies advocacy as one of the five business objectives that will be pursued on behalf of the membership.
• To advocate for sustainable funding for municipal infrastructure.
• To advocate the collective interests of our members through policy analysis, legislative review and consultation.
• To provide affordable and accessible education and training services.
• To promote leadership with regard to infrastructure asset management.
• To develop plans, programs and partnerships for the delivery of services that meet the needs of our members.
Ontario Good Roads Association 1525 Cornwall Road, Unit 22Oakville, ON L6J 0B2Joe Tiernay, executive directore [email protected] p 289-291-6472w ogra.org

Design by Actual Media
view this report with appendices at
rccao.com or at ogra.org