October 2011 - Society of Actuaries
38
CompAct http://www.soa.org/library/newsletters/compact/2011/october/com-2011-iss41.aspx[2/14/2012 10:27:30 PM] ISSUE 41 | OCTOBER 2011 Table of Contents Letter from the Chair Editors' Notes Actuarial Software Wins Microsoft Innovation Award Touch the SCAI One Actuary's Journey Through Technology Keys to Successful Reports Excel Formula Rogue's Gallery 2: Electric Bugaloo Speaking "Data" Properly Part 2 Articles Needed Technology Section Web site Council LETTER FROM THE CHAIR by Jeffrey Pomerantz It's hard for me to believe that the year is coming to a close and that this will be my last "Letter from the Chair." It has been a pleasure serving the Technology Section as chairperson. I am very pleased with what we have accomplished this year, and I'm even more excited about what the future may hold for some of the initiatives that are underway. [ full article ] EDITORS' NOTES by J. Eddie Smith, Rich Junker, and Andrew Chan The triumvirate you see above is temporary. Eddie will be advancing to the role of chairperson of the Technology Section. For the coming year, Rich and Andrew will share the editing role. ... [ full article ] ACTUARIAL SOFTWARE WINS MICROSOFT INNOVATION AWARD by Kevin Pledge I recently attended the Microsoft World Partner Conference in Los Angeles. With 15,000 attendees, this is the largest conference in North America. ... [ full article ]
Transcript of October 2011 - Society of Actuaries
CompAct
http://www.soa.org/library/newsletters/compact/2011/october/com-2011-iss41.aspx[2/14/2012 10:27:30 PM]
ISSUE 41 | OCTOBER 2011
Table of Contents
Letter from the Chair
Editors' Notes
Actuarial Software Wins
Microsoft Innovation
Award
Touch the SCAI
One Actuary's Journey
Through Technology
Keys to Successful
Reports
Excel Formula Rogue's
Gallery 2: Electric
Bugaloo
Speaking "Data" Properly
Part 2
Articles Needed
Technology Section
Web site
Council
LETTER FROM THE CHAIRby Jeffrey Pomerantz
It's hard for me to believe that the year is coming to a close and that
this will be my last "Letter from the Chair." It has been a pleasure
serving the Technology Section as chairperson. I am very pleased
with what we have accomplished this year, and I'm even more
excited about what the future may hold for some of the initiatives that
are underway.
[ full article ]
EDITORS' NOTESby J. Eddie Smith, Rich Junker, and Andrew Chan
The triumvirate you see above is temporary. Eddie will be advancing
to the role of chairperson of the Technology Section. For the coming
year, Rich and Andrew will share the editing role. ...
[ full article ]
ACTUARIAL SOFTWARE WINS MICROSOFT INNOVATIONAWARDby Kevin Pledge
I recently attended the Microsoft World Partner Conference in Los
Angeles. With 15,000 attendees, this is the largest conference in
North America. ...
[ full article ]
CompAct
http://www.soa.org/library/newsletters/compact/2011/october/com-2011-iss41.aspx[2/14/2012 10:27:30 PM]
Links of Interest
Fiction Contest
Richard Junker, Co-editor
Andrew Chan, Co-editor
SOA StaffMeg Weber, Staff Partner
Sue Martz,
Section Specialist
Sam Phillips, Staff Editor
TOUCH THE SCAIby Van Beach
Last year, I wrote an article for CompAct where I playfully dubbed
the term "SCAI" (pronounced sky) and discussed how shared
computing resources from multi-core servers to public clouds like
Azure contribute to a continuum of solutions to support actuarial
processing. ...
[ full article ]
ONE ACTUARY'S JOURNEY THROUGH TECHNOLOGYby Dave Kester
I am an actuary with more than 25 years of experience. The first few
years of my actuarial career were in a "technology heaven." PCs
were just showing up, and the power of spreadsheets, databases
and programming languages were available for those who wanted to
pursue them. ...
[ full article ]
KEYS TO SUCCESSFUL REPORTSby Jeremy Benson
In my 15 years as an actuary, I have had many opportunities to
produce reports for many different people. The actuarial reports
could be anything from simple loss ratio reports to a full pricing
analysis. ...
[ full article ]
EXCEL FORMULA ROGUE'S GALLERY 2: ELECTRICBUGALOOby Mary Pat Campbell
Welcome to the second installment of the horror that is the Excel
Formula Rogue's Gallery! ...
[ full article ]
SPEAKING "DATA" PROPERLY PART 2by Dan Rachlis
This article is the second in a four-part series about eliminating the
confusion with using data terminology. ...
[ full article ]

CompAct
http://www.soa.org/library/newsletters/compact/2011/october/com-2011-iss41.aspx[2/14/2012 10:27:30 PM]
475 North Martingale Road, Suite 600 Schaumburg, Illinois 60173
Phone: 847.706.3500 Fax: 847.706.3599 www.soa.org

CompAct
http://www.soa.org/library/newsletters/compact/2011/october/com-2011-iss41-pomerantz.aspx[2/14/2012 10:27:42 PM]
ISSUE 41 | OCTOBER 2011
Table of Contents
Letter from the Chair
Editors' Notes
Actuarial Software Wins
Microsoft Innovation
Award
Touch the SCAI
One Actuary's Journey
Through Technology
Keys to Successful
Reports
Excel Formula Rogue's
Gallery 2: Electric
Bugaloo
Speaking "Data" Properly
Part 2
Articles Needed
Technology Section
Web site
Council
LETTER FROM THE CHAIRby Jeff Pomerantz
Greetings!!! It's hard for me to believe that the year is coming to a
close and that this will be my last "Letter from the chair." It has been
a pleasure serving the Technology Section as chairperson. I am very
pleased with what we have accomplished this year, and I'm even
more excited about what the future may hold for some of the
initiatives that are underway.
I have enjoyed working with all of the council members the last three
years. I want to thank our other two retiring council members, Tim
Deitz (2010 chairperson) and Frank Reynolds, for their contributions.
I wish Tim and Frank the best as they move on to other
opportunities. Even though I will no longer be on the council next
year, I am excited about what's next. Eddie Smith will take over as
chairperson in 2012. Eddie brings a lot of enthusiasm and knowledge
to his role; he has already had a big impact on the council, and I
know that he will continue to do the same in 2012.
I want to mention a few highlights from the past year that will
continue to be major initiatives for 2012. The number one topic for
our council this year has undoubtedly been "Apps for Actuaries." The
topic is an almost constant brainstorm on what apps might be useful
for actuaries. There have been sessions and discussions at
meetings, ongoing columns in our newsletter, member survey
questions, as well as the actual implementation of a mobile app for
actuarial meetings, beginning with the Health Spring Meeting this
year. If you have suggestions on apps you would find useful, please
send them to any Council member. Also, be sure to check out the
CompAct
http://www.soa.org/library/newsletters/compact/2011/october/com-2011-iss41-pomerantz.aspx[2/14/2012 10:27:42 PM]
Links of Interest
Fiction Contest
Richard Junker, Co-editor
Andrew Chan, Co-editor
SOA StaffMeg Weber, Staff Partner
Sue Martz,
Section Specialist
Sam Phillips, Staff Editor
"Apps for Actuaries" session at the Annual Meeting
(Wed., 8:30 - 9:45 a.m.). There is also a Technology-sponsored
session on "Model Management" that you may find interesting
(Tues., 3:45 - 5 p.m.).
Another hot topic this year has been LinkedIn (www.linkedin.com).
The LinkedIn group for section members, "Society of Actuaries
Technology Section," is continuing to grow. I am happy to say that
we now have 192 members, up from 120 members just a few
months ago. I would love to see this number go to 500 or more in
the near future. This online forum for networking and information
sharing is only what you, the members, make of it. So, please join,
read and participate in discussions that interest you. If you have any
reservations about joining the LinkedIn site, please let us know what
those are so we can address them. Addressing how this forum, as
well as others, such as Twitter, can best serve the members will
continue to be a priority for the 2012 council.
I won't go into any detail on the rest of our activities in 2011, but
here is a non-exhaustive list:
actuarial club presentations
actuarial meeting sessions
co-sponsoring of speculative fiction contest
table manager updates
newsletter articles writing and editing
On the topic of the newsletter, I would like to thank Howard Callif
and Eddie Smith for serving as co-editors of CompAct for several
years. Howard has served as editor of the newsletter for the past
four years and Eddie has served as co-editor the past two. Howard
and Eddie have done a terrific job in obtaining and editing articles for
CompAct in what is often a thankless and not at all well-recognized
role. It is efforts like theirs that make the Technology Section what it
is today, and those efforts are definitely appreciated. Howard and
Eddie are both stepping down from their co-editorship role in 2012.
New co-editors will be Andrew Chan and Rich Junker. Rich has
already been working on the newsletter in a co-editor capacity.
Thanks to Andrew and Rich for taking on this critical role.
As I close, I want to thank all of our volunteers for their willingness
to get involved, and say thanks again to all of our council members
and friends of the council who work hard to keep our section going.
Please reach out to any of the council members listed inside the
front cover of this newsletter with your ideas or to volunteer.
CompAct
http://www.soa.org/library/newsletters/compact/2011/october/com-2011-iss41-pomerantz.aspx[2/14/2012 10:27:42 PM]
Additional Food for Thought
I thought it would be interesting to mention some interesting quotes
relating to technology, so I looked online. Probably the most
interesting quote was the "640K ought to be enough for anybody"
quote supposedly uttered to Bill Gates at a trade show in 1981.
However, despite Bill Gates' denial and a lack of any solid proof, the
quote lives on. Some other interesting quotes I found are as follows:
Any sufficiently advanced technology is indistinguishable from magic.
~Arthur C. Clarke
Lo! Men have become the tools of their tools. ~Henry David Thoreau
The production of too many useful things results in too many useless
people. ~Karl Marx
The Internet is so big, so powerful and pointless that for some
people it is a complete substitute for life. -Andrew Brown
However, of all the ones I saw, probably my favorite is this one:
For a list of all the ways technology has failed to improve the quality
of life, please press three. ~Alice Kahn
I don't know about you, but sometimes, I really prefer talking to a
person over pushing a button.
Thanks, and happy reading!!!
Jeff Pomerantz
2011 Section Council Chair
Jeff Pomerantz, FSA, CFA, MAAA, is an actuarial consultant at
Quantitative Risk Management in Chicago and can be contacted at
475 North Martingale Road, Suite 600 Schaumburg, Illinois 60173
Phone: 847.706.3500 Fax: 847.706.3599 www.soa.org

CompAct
http://www.soa.org/library/newsletters/compact/2011/october/com-2011-iss41-smith.aspx[2/14/2012 10:27:51 PM]
ISSUE 41 | OCTOBER 2011
Table of Contents
Letter from the Chair
Editors' Notes
Actuarial Software Wins
Microsoft Innovation
Award
Touch the SCAI
One Actuary's Journey
Through Technology
Keys to Successful
Reports
Excel Formula Rogue's
Gallery 2: Electric
Bugaloo
Speaking "Data" Properly
Part 2
Articles Needed
Technology Section
Web site
Council
EDITORS' NOTESby J. Eddie Smith, Rich Junker, and Andrew Chan
The triumvirate you see above is temporary. Eddie will be advancing
to the role of Chairperson of the Technology Section. For the coming
year, Rich and Andrew will share the editing role. Eddie has made
exceptional contributions over the past few years in the editor role,
and been active in all facets of the Technology Section's operations.
It was inevitable that he would soon accede to the Chairperson role.
So Andrew and Rich soldier on, inheriting a newsletter process
greatly improved during Eddie's stint as primary editor.
Speaking of Andrew Chan, he will be coming on board as CompAct
co-editor. Andrew has contributed outstanding material in the past,
such as the sharing link you see at the top of each article. He will be
a prolific source of ideas for advancing our newsletter. Andrew is a
seasoned actuarial systems consultant who has been helping
actuaries to develop/implement systems that can increase their
productivity. He has a wide range of working experience, e.g., C++,
Excel add-ins, MATLAB, and more.
Number Puzzle
With regret, we say adieu to the Number Puzzle. The last puzzle
solution ran with the July 2011 issue. Intricate and elegant in our
mother tongue numbers, each puzzle was a small work of art. We
salute Marc Whinston, Teachers Insurance and Annuity, for
providing us a welcome diversion in many past issues of CompAct.
Apps, apps, apps
Dave Kester writes in "One Actuary's Journey Through Technology"
CompAct
http://www.soa.org/library/newsletters/compact/2011/october/com-2011-iss41-smith.aspx[2/14/2012 10:27:51 PM]
Links of Interest
Fiction Contest
Richard Junker, Co-editor
Andrew Chan, Co-editor
SOA StaffMeg Weber, Staff Partner
Sue Martz,
Section Specialist
Sam Phillips, Staff Editor
of the explosion of the past few years in Social Media, Smart Phone
Apps, and iPad/Tablet hardware. It's wonderful how affordable, easy
to install, mobile and synchronizable the tools are all becoming. Yet
the number of tools and the variety of the features in each makes it
extremely difficult to exploit all these recent wonders, atop the
demands of our omni-imposing jobs. Dave has the right idea,
learning from his kids and colleagues.
Group teaching sessions over a lunch hour, or an after-work session
one-on-one can be a great help in sorting out which new app to take
up next. We all love our technology toys, and we love talking about
them. Sharing these apps can be an effective strategy for each of us
to keep up, and to extend the reach of our skills to fellow actuaries.
If you would like to share apps that you've found useful, a short
article in CompAct is the ideal way. Even if you'd rather not write an
article, feel free to submit your app experiences to the editors.
Honing Technological Competency
The Competency Framework tool introduced by the Society of
Actuaries office in 2008 was recently highlighted anew this past May
with a terrific article by Rod Bubke of the Professional Development
Committee, How to Become a Better Actuary. First you complete the
100-question survey in terms of how important each of the skills is to
your work and how well you are able to perform them. Then you are
directed to a spreadsheet, the personal planning workbook tool. It
provides methods to improve your self-assessed personal
deficiencies on each of the eight families of competencies.
The competencies with the largest gaps are areas where you will
want to focus your professional development efforts. If, heavens
forfend, you conclude that the Technical Skills & Analytical Problem
Solving competency is one of your greater weaknesses, the personal
planning workbook provides remedies. It provides the following array
of improvement methods:
Listen to relevant meeting sessions from recent SOA
meetings—audio recordings sessions,
Listen to relevant meeting sessions from recent SOA meeting
—slides, and
Take a relevant e-Course.
Now how could accessing section newsletters ever have been
omitted as a method? Most prominently, your CompAct newsletters
have featured a multitude of articles that target the Technical Skills &
Analytical Problem Solving competency head on. For example, if lack
CompAct
http://www.soa.org/library/newsletters/compact/2011/october/com-2011-iss41-smith.aspx[2/14/2012 10:27:51 PM]
of adroitness with Excel is among your perceived deficiencies,
several articles written from the unique perspective of actuaries are
available from recent editions. For us actuaries, this is significantly
more palatable reading than the online tutorials of Microsoft. Not to
impugn the MS tutorials! They are wonderful in their own way.
To buttress Rod Bubke's words ...
"The Committee on Professional Development has done us all a
salutary service in devising the Competency Framework and the
Self-Assessment Tool. We are all self-teachers, and this tool is an
outstanding aid to focusing our professional development and
furthering our careers."
Looking Back And Forward
Many thanks to all of the authors contributing to the newsletter in
2011, both articles and suggestions.
As we move farther into the 21st century, we're seeing the pace of
technological innovation increase more rapidly every year. From
cloud computing to mobile apps, there are many fronts that present
opportunities for actuaries, but they require education as well.
Without technology education, the chasm between tech-savvy
actuaries and those less eager to try new things will grow even
larger than it is today.
CompAct is a potent conduit for transferring technology knowledge
among SOA members. You can play a key educator role in this
technology-dependent era by sharing your knowledge in the form of
articles, or even article ideas.
We look forward to hearing from you!
475 North Martingale Road, Suite 600 Schaumburg, Illinois 60173
Phone: 847.706.3500 Fax: 847.706.3599 www.soa.org

CompAct
http://www.soa.org/library/newsletters/compact/2011/october/com-2011-iss41-pledge.aspx[2/14/2012 10:28:00 PM]
ISSUE 41 | OCTOBER 2011
Table of Contents
Letter from the Chair
Editors' Notes
Actuarial Software Wins
Microsoft Innovation
Award
Touch the SCAI
One Actuary's Journey
Through Technology
Keys to Successful
Reports
Excel Formula Rogue's
Gallery 2: Electric
Bugaloo
Speaking "Data" Properly
Part 2
Articles Needed
Technology Section
Web site
Council
ACTUARIAL SOFTWARE WINS MICROSOFT INNOVATIONAWARDby Kevin Pledge
I recently attended the Microsoft World Partner Conference in Los
Angeles. With 15,000 attendees, this is the largest conference in
North America. To accommodate the large numbers keynote
sessions were held in the Staples Center, and breakout sessions
took up the LA Convention Center and several hotels.
Over the past few years I have been quite vocal about how little
technology companies understand the needs of insurance
companies and even that life insurance is different from P&C. The
converse has also been true; many insurance software vendors care
little about technology standards and practices and focus only
meeting the immediate business needs. This can result in
underperformance, incompatibility and leave gaps in security,
governance and disaster recovery. The large technology companies
all offer certification programs for developers and software; there is
little excuse for software vendors who are serious about developing
solutions.
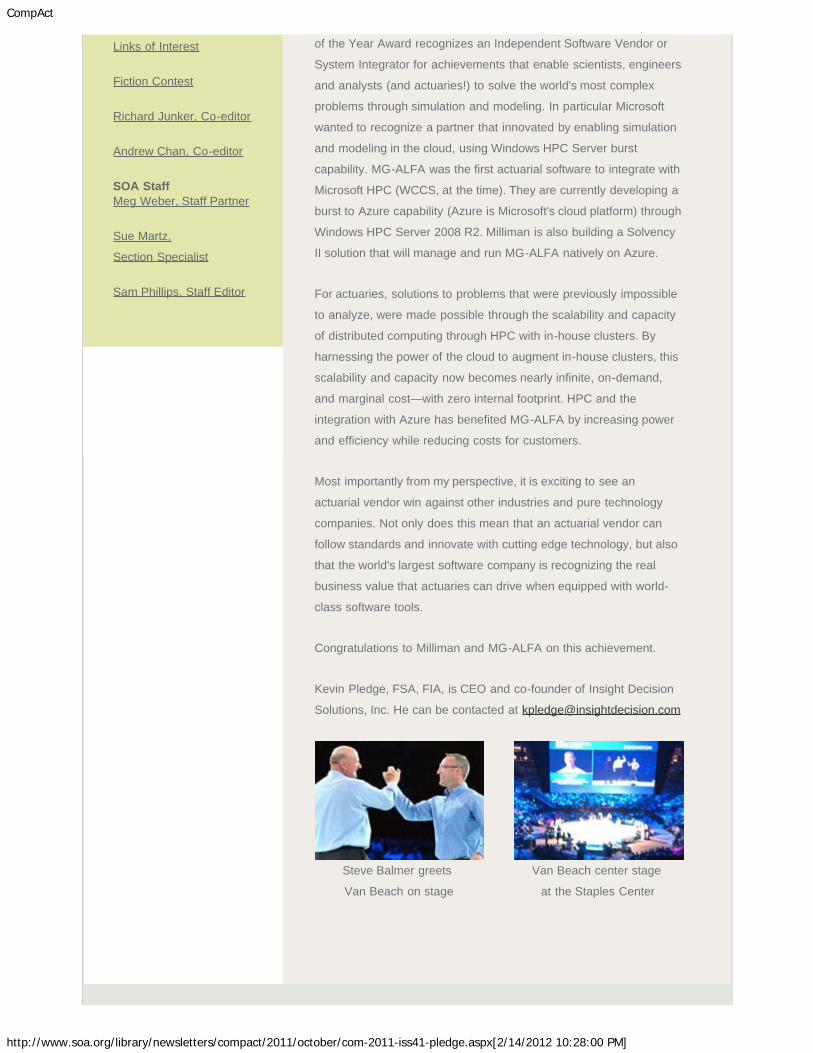
Back to the Microsoft World Partner Conference: I didn't expect to
run into any other actuaries at this conference as it is technology
focused, so imagine my surprise on the first day when Van Beach of
Milliman is called onto center stage at the Staples Center with Steve
Ballmer to receive the Innovation Partner of the Year Award for
Technical and High Performance Computing (HPC) for MG-ALFA.
The Technical and High Performance Computing Innovation Partner
CompAct
http://www.soa.org/library/newsletters/compact/2011/october/com-2011-iss41-pledge.aspx[2/14/2012 10:28:00 PM]
Steve Balmer greets
Van Beach on stage
Van Beach center stage
at the Staples Center
Links of Interest
Fiction Contest
Richard Junker, Co-editor
Andrew Chan, Co-editor
SOA StaffMeg Weber, Staff Partner
Sue Martz,
Section Specialist
Sam Phillips, Staff Editor
of the Year Award recognizes an Independent Software Vendor or
System Integrator for achievements that enable scientists, engineers
and analysts (and actuaries!) to solve the world's most complex
problems through simulation and modeling. In particular Microsoft
wanted to recognize a partner that innovated by enabling simulation
and modeling in the cloud, using Windows HPC Server burst
capability. MG-ALFA was the first actuarial software to integrate with
Microsoft HPC (WCCS, at the time). They are currently developing a
burst to Azure capability (Azure is Microsoft's cloud platform) through
Windows HPC Server 2008 R2. Milliman is also building a Solvency
II solution that will manage and run MG-ALFA natively on Azure.
For actuaries, solutions to problems that were previously impossible
to analyze, were made possible through the scalability and capacity
of distributed computing through HPC with in-house clusters. By
harnessing the power of the cloud to augment in-house clusters, this
scalability and capacity now becomes nearly infinite, on-demand,
and marginal cost—with zero internal footprint. HPC and the
integration with Azure has benefited MG-ALFA by increasing power
and efficiency while reducing costs for customers.
Most importantly from my perspective, it is exciting to see an
actuarial vendor win against other industries and pure technology
companies. Not only does this mean that an actuarial vendor can
follow standards and innovate with cutting edge technology, but also
that the world's largest software company is recognizing the real
business value that actuaries can drive when equipped with world-
class software tools.
Congratulations to Milliman and MG-ALFA on this achievement.
Kevin Pledge, FSA, FIA, is CEO and co-founder of Insight Decision
Solutions, Inc. He can be contacted at [email protected]

CompAct
http://www.soa.org/library/newsletters/compact/2011/october/com-2011-iss41-pledge.aspx[2/14/2012 10:28:00 PM]
475 North Martingale Road, Suite 600 Schaumburg, Illinois 60173
Phone: 847.706.3500 Fax: 847.706.3599 www.soa.org

CompAct
http://www.soa.org/library/newsletters/compact/2011/october/com-2011-iss41-beach.aspx[2/14/2012 10:28:09 PM]
ISSUE 41 | OCTOBER 2011
Table of Contents
Letter from the Chair
Editors' Notes
Actuarial Software Wins
Microsoft Innovation
Award
Touch the SCAI
One Actuary's Journey
Through Technology
Keys to Successful
Reports
Excel Formula Rogue's
Gallery 2: Electric
Bugaloo
Speaking "Data" Properly
Part 2
Articles Needed
Technology Section
Web site
Council
TOUCH THE SCAIby Van Beach
While SCAI (Scalable Cloud Actuarial Infrastructure) is a somewhat
lighthearted reference to "the Cloud," the implications of cloud-based
infrastructures such as Microsoft Azure are serious business. Cloud
computing is a major disruptor to nearly all software products, and
actuarial software is no different. Insurers need to start thinking
about how they are going to work with their vendors to move to the
next level of actuarial infrastructure—"touch the SCAI."
Last year, I wrote an article for CompAct where I playfully dubbed
the term "SCAI" (pronounced sky) and discussed how shared
computing resources from multi-core servers to public clouds like
Azure contribute to a continuum of solutions to support actuarial
processing. While SCAI is a somewhat lighthearted play on words,
the concept and implications are all serious business.
The Cloud is here to stay. Microsoft has publicly doubled-down on
their "all-in" position with regard to Azure (Microsoft's cloud
infrastructure). Specific to actuarial computing environments,
Microsoft has enabled a bridge between on-premise HPC (High
Performance Computing) clusters to Azure through their recent
release of Server 2008. Amazon, Google, IBM and others are all
investing in cloud infrastructures. With each new software vendor
that moves to the cloud and each company that utilizes a cloud-
based offering, the fear and uncertainty break down and the very real
business benefits come into focus.
Actuarial Computing Capacity Delivered Through the Cloud
CompAct
http://www.soa.org/library/newsletters/compact/2011/october/com-2011-iss41-beach.aspx[2/14/2012 10:28:09 PM]
Links of Interest
Fiction Contest
Richard Junker, Co-editor
Andrew Chan, Co-editor
SOA StaffMeg Weber, Staff Partner
Sue Martz,
Section Specialist
Sam Phillips, Staff Editor
The following scenario still holds today:
Results are needed immediately, but the in-house compute cluster
(i.e., the grid of servers used to parallelize computations) is already
fully utilized and there is a queue of jobs that will keep the resources
occupied for days. A job could get bumped, or priorities reordered,
but even with all 200 computing resources (cores) in the cluster
available, running another 1000 scenarios will require over 10 hours
to complete.
The 10-hour run-time is certainly a dramatic improvement over
running on a single computer (which was the situation before the
compute cluster was installed), but it is still far from ideal.
Instead of 200 cores available 365 days a year, a more effective
distribution might be 2,000 cores 36.5 days a year. At certain times,
20,000 cores for 3.65 days would be the optimal configuration. If
computing capacity were marginal cost, these would all be
equivalent. In addition to marginal cost, the ideal solution would also
provide infinite, on-demand, zero-footprint resources.
This "nirvana" solution—effectively infinite resources that are on-
demand, marginal cost, and zero-footprint—exists. Further, this
cloud-computing infrastructure is being used to provide the
computing capacity to back mission-critical Solvency II actuarial
models and will regularly utilize multiple thousands of cloud-based
CPUs. And when the calculations are done, the resources are de-
provisioned, and the meter stops running. Touch the SCAI.
Bridging On-Premise and Cloud Computing through Microsoft
HPC Server
In-house computer clusters to support actuarial calculations have
provided a computational "backbone" for actuarial projection work.
The key innovation that triggered this expansion was the introduction
of Microsoft HPC—a cost-effective, centralized operating system
that turns a bank of servers into a scalable resource that can be
made broadly available. In recent years companies have continued
to expand their on-premise computing capacity and are thoroughly
invested in this environment. As such, a cloud-only option is not
practical.
However, it seems inevitable. To help illustrate this coming reality,
let's contrast the process for bringing a new bank of servers online
within a traditional grid farm to a Cloud approach using MS Azure.
With a traditional grid farm, servers are delivered and a rack is
CompAct
http://www.soa.org/library/newsletters/compact/2011/october/com-2011-iss41-beach.aspx[2/14/2012 10:28:09 PM]
constructed where each server needs to be network connected,
plugged in, configured, tested, etc. This happens in a room with
special cooling, power, and surge protection. Expert technicians are
often involved for the setup, configuration, and maintenance of the
grid farm. This process, expertise, and footprint is redundant across
thousands of companies.
Now consider bringing several thousand new Azure servers online
instead. A huge container the size of a semi-trailer is dropped off at
what looks like a giant parking lot. A single large cable is hooked up.
Immediately, the thousands of servers boot up, automatically
configure themselves, and bring themselves online within minutes.
Further, the maintenance cost ratios for Azure servers are a fraction
of in-house servers. The efficiencies are too significant to ignore.
The R2 release of Microsoft Windows HPC Server 2008 aims to
bridge the gap between on-premise HPC Clusters and Azure. R2
enables a "Burst to Azure" capability where on-premise resources
can be augmented with Azure resources—so the cluster can be
expanded virtually. Jobs are still submitted to the local cluster, but
can then be "re-routed" to execute on Azure. This feature provides
companies with an option to blend in-house and cloud-based
computation resources. Touch the SCAI.
The Role of the Application
In most cases, the software vendor must cloud-enable their product,
so the benefits of cloud-computing will not necessarily be available
(or effective) for a given actuarial projection software application.
Further, there are at least two levels to consider—integration and
optimization.
At a minimum, an application needs to provide an integration layer to
make the computing option available. For example, there needs to be
an integration layer between the application and Microsoft HPC for
the Microsoft compute cluster to be available as a compute option.
It is a different question to ask whether the application has been
optimized for the given computing option. With a cloud-based
infrastructure such as Azure, where all resources are essentially
identical, the vendor can begin tailoring their application to run
effectively in that environment. Further, the vendor can build
additional controls, redundancies, and safeguards to ensure the
environment is robust, secure, and controlled.
In short, working with a cloud platform like Azure requires a
tremendous amount of effort and expertise on the part of the
CompAct
http://www.soa.org/library/newsletters/compact/2011/october/com-2011-iss41-beach.aspx[2/14/2012 10:28:09 PM]
application vendor to utilize the cloud resources optimally. If done
well, however, a SCAI can reduce maintenance costs, improve
turnaround time for calculations, and reduce risk.
Summary
The need for actuarial computing capacity is not going to recede. To
meet regulatory and risk management requirements, companies will
need to find solutions to this capacity challenge. Public clouds such
as Microsoft Azure are emerging as a transformative technology
across many applications including actuarial software—assuming
your actuarial projection software can support the cloud. The
question is no longer "if" additional capacity is needed. The question
is "how" the capacity can most effectively be provided. Insurers need
to move to the next level of actuarial infrastructure.
It's time to touch the SCAI.
Van Beach, FSA, MAAA is the MG-ALFA Product
Manager at Milliman. He can be reached at
475 North Martingale Road, Suite 600 Schaumburg, Illinois 60173
Phone: 847.706.3500 Fax: 847.706.3599 www.soa.org

CompAct
http://www.soa.org/library/newsletters/compact/2011/october/com-2011-iss41-kester.aspx[2/14/2012 10:28:17 PM]
ISSUE 41 | OCTOBER 2011
Table of Contents
Letter from the Chair
Editors' Notes
Actuarial Software Wins
Microsoft Innovation
Award
Touch the SCAI
One Actuary's Journey
Through Technology
Keys to Successful
Reports
Excel Formula Rogue's
Gallery 2: Electric
Bugaloo
Speaking "Data" Properly
Part 2
Articles Needed
Technology Section
Web site
Council
ONE ACTUARY'S JOURNEY THROUGH TECHNOLOGYby Dave Kester
I am an actuary with more than 25 years of experience. The first few
years of my actuarial career were in a "technology heaven." PCs
were just showing up, and the power of spreadsheets, databases
and programming languages were available for those who wanted to
pursue them. I didn't have much formal training in technology (BS in
math education), but I had a willingness to learn. I was constantly
learning new tricks, tools and trade.
However, at the turn of the century, my focus shifted from a
technology actuary to a business actuary. I started my own
consulting company in the mid-1990s, and solving clients' problems
took center stage. In fact, I found technology often got in the way of
those solutions. Thus, for the first decade of the 21st century, I put
my technology on the shelf and probably functioned more like a
"normal" FSA: Let other, younger actuaries "do the dirty work."
Usher in the second decade of the 21st century. It started simple
enough with the purchase of a smartphone. For me, it is probably
stretching to call it a smartphone because all I used it for was to
make phone calls and occasionally check email. Of course, I had to
have my kids or staff members set up the phone so it could check my
email.
Next, came the iPad. I'm not sure what motivated me to buy an iPad.
I suppose I thought it was going to be kind of a fun toy to play with.
That is a bit odd since my life was already overflowing and adding a
toy to play with was not consistent with my goals or responsibilities
CompAct
http://www.soa.org/library/newsletters/compact/2011/october/com-2011-iss41-kester.aspx[2/14/2012 10:28:17 PM]
Links of Interest
Fiction Contest
Richard Junker, Co-editor
Andrew Chan, Co-editor
SOA StaffMeg Weber, Staff Partner
Sue Martz,
Section Specialist
Sam Phillips, Staff Editor
at that time. Regardless, I bought it for some reason. After I had my
staff and kids set it up so I could get email and some other basic
functionality, the iPad was a convenient tool to check email and surf
the Web at night. Nothing too fancy.
Finally, early in 2011, I bought an Apple MacBook Air. I really
appreciated my iPad in how quick it would start, wouldn't need to be
reboot, and how applications rarely crashed. Given the MacBook Air
book had a hard drive that was always "on," it would be almost as
quick as the iPad in getting started and staying active. After using it
awhile, I became increasingly less patient with my "work" computer
as it continued to drag and spin its way through the applications.
In the spring of 2011, I got my first smartphone app, which gave me
instant weather. As a runner, I loved to be able to instantly get not
only the temperature but the humidity—an important fact when
running in Iowa in the summer. Slowly initially, I started reviewing
other apps, primarily for my iPad. It didn't take long until I realized I
had been hooked again by the "technology bug."
The technology advances of the late 1980s and 1990s were
impressive. However, what has changed with the latest advancement
are the following components, which were primarily missing from the
20th century:
1. Ability to use mobile technology. I know that isn't news to
anyone. However, until you really experience it, you miss the
power and capacity that we have now. And by mobile, I'm not
referring to carrying around an eight-pound notebook
computer.
2. New opportunities. Mobility not only has a convenience
factor, but it greatly increases the opportunities for tools. If
you can run an app from anywhere, and there is technology
such as GPS and cloud storage, the opportunity for software
development goes to all new levels.
3. Ease of software installation. It is amazing how quickly we
can search, install and use a new app. Most apps have very
short learning curves to them.
4. Affordability. I see great apps that get poor ratings by users
because they are so expensive. And they cost less than $20!
Software in the 1980s and 1990s usually cost more than
$100.
5. Synchronization. This was briefly mentioned in item number
2, but it's now easier than ever to synchronize your data and
applications so that it doesn't matter whether you are using
CompAct
http://www.soa.org/library/newsletters/compact/2011/october/com-2011-iss41-kester.aspx[2/14/2012 10:28:17 PM]
your PC desktop at work, your iPad, or your SmartPhone.
They all can work together. This is still a work in progress,
but it has come a long way, and it is getting there. The iCloud
concept from Apple that is due out in the Fall of 2011 will be
a game changer.
Actuaries, as expected, are not at the cutting edge of developing
these apps. That's OK. However, we are getting started. We will be
discussing where we should go and how we can get there at the
2011 Annual SOA meeting in Chicago. I look forward to going on this
new technology adventure with other actuaries to see how we can
use these apps to better manage risk in a digital world.
David Kester, FSA, MAAA is the co-founder and President of SALT
Solutions, an actuarial consulting company from Des Moines, Iowa.
David's focus is converting actuarial beasts into beauties by using
technology as a friend. His latest venture is CoachingActuaries.com,
a site that provides online practice tools for students preparing for
actuarial exams.
475 North Martingale Road, Suite 600 Schaumburg, Illinois 60173
Phone: 847.706.3500 Fax: 847.706.3599 www.soa.org

CompAct
http://www.soa.org/library/newsletters/compact/2011/october/com-2011-iss41-benson.aspx[2/14/2012 10:28:26 PM]
ISSUE 41 | OCTOBER 2011
Table of Contents
Letter from the Chair
Editors' Notes
Actuarial Software Wins
Microsoft Innovation
Award
Touch the SCAI
One Actuary's Journey
Through Technology
Keys to Successful
Reports
Excel Formula Rogue's
Gallery 2: Electric
Bugaloo
Speaking "Data" Properly
Part 2
Articles Needed
Technology Section
Web site
Council
KEYS TO SUCCESSFUL REPORTSby Jeremy Benson
In my 15 years as an actuary, I have had many opportunities to
produce reports for many different people. The actuarial reports
could be anything from simple loss ratio reports to a full pricing
analysis. I have also produced reports for marketing, underwriting,
claims, external clients and others.
Today, I am responsible for approximately 20 different reports. Some
of these were built by my team and me, while some were built by
others and transferred to us. Because of this, we are going through
an extensive process improvement project.
Based on these experiences, I have found that customers, quality
and efficiency are the three key components to successful reports.
And that implies that:
Reports that are not used by your customer are useless
Reports that have bad information are useless
Reports that are late are useless
In addition to the above, technology enables you to create the
reports, and product knowledge enables you to understand the
information in the reports.
Customers
First, let's define what a customer is. A customer is anyone who uses
CompAct
http://www.soa.org/library/newsletters/compact/2011/october/com-2011-iss41-benson.aspx[2/14/2012 10:28:26 PM]
Links of Interest
Fiction Contest
Richard Junker, Co-editor
Andrew Chan, Co-editor
SOA StaffMeg Weber, Staff Partner
Sue Martz,
Section Specialist
Sam Phillips, Staff Editor
your product. In this case your product is the report. Part of a
successful reporting process is to find out who your customers are
for each report. Once you have done that, the next step is to
determine how your customers are using the report. A tool used in
Six Sigma is called Voice of Customer (VoC). VoC is used to
understand what is critical to the quality of the process according to
your customer. It can be used to gather the needs and issues of the
customers and requires a dialogue between both parties.
For those who are using the reports, discuss with them ways that
you can improve the product. Is there additional data they would like
to be included? Would they like it in a different format? Would they
like it more or less frequently? Would they like an alternative way to
access the report? Would they like canned reports or dynamic?
If there are people that you thought were your customers, but they
aren't using the reports—find out why. Is the report too complicated?
Does it have the wrong information? Is it too complex to use (i.e., is it
in the format of a pivot table and the customer doesn't know how to
use pivot tables)? Does the report not reconcile with other
information?
If no one is using the reports, you should also consider whether the
report is worth producing. It does not make sense to create a report
that no one is using.
After talking to your customers, you will start turning their needs into
requirements. These requirements will then need to be prioritized
with all other requirements for all reports. The needs of the business
along with the complexity and time required to complete the
requirements should determine the priority.
Quality
Ideally, every report that you produce will have information that is
100 percent accurate. In the real world, this is not always possible.
However, you should strive to produce reports with as high a quality
of information as possible.
The first issue is the quality of the data that is used for the report.
This is the classic "garbage-in garbage-out" situation. If your data
that you use for the report is bad, then the information in the report
will also be bad.
Before you start testing for quality of the data, you need to
understand what is in the database. It is ideal to have metadata, or
data about the data. Metadata can be pretty extensive, so it might be
CompAct
http://www.soa.org/library/newsletters/compact/2011/october/com-2011-iss41-benson.aspx[2/14/2012 10:28:26 PM]
too time consuming to capture every piece of information about each
field. At a minimum you should have an operational definition,
possible values and any business rules associated with each field in
the report.
There are two main approaches that I have used on testing data
quality on input data. First, a thorough data profiling exercise on the
data is important. Data profiling is an exercise in exploring and
learning about data. The main types of information that you should
capture during this stage are:
1. Fill Rates - This is the percentage of the field that does not
contain missing or null records for a particular field. It will help
you identify whether data even exists or not. Care should be
taken, however. There could be some fields that may have
missing values by design. It is important to compare these
results to the expected domain (desired or valid values) in the
metadata.
2. Frequency Distributions - This is a count of how often each
value occurs in the dataset for a given attribute (field). When
comparing to expectations, you should be able to identify
instances where information is not valid.
3. Two-way profiling - This is basically extending the two
methods above to a second dimension. For example, you
may want to see how an attribute's fill rate has changed over
time, so you calculate it by year. Two-way frequency
distributions are useful in looking at relationships between
two attributes. If you know that two values shouldn't be
related, but they occur for the same record, this signals a
quality issue.
4. Basic statistics - Statistics like mean, minimum, maximum,
standard deviation should be compared to the expected
values. They could identify outliers or data that is
unexpected.
A second way to identify data quality errors is more direct. It is
through the testing of business rules. Since they are tests of the data
already in the database, some call them data validation rules, but
they are usually synonymous with business rules used in application
development.
These rules are tested against the data and any violations are
flagged and investigated. If the data is determined to be in error,
then there are two ways to fix the error.
1. First, the actual data should be cleaned. Either it can be
CompAct
http://www.soa.org/library/newsletters/compact/2011/october/com-2011-iss41-benson.aspx[2/14/2012 10:28:26 PM]
cleaned at the source or in the database used for reporting
(e.g., data warehouse).
2. Second, the process that caused the error should be fixed so
the error doesn't occur again.
It is very important to analyze the data to understand the root cause
of any data quality issues. Only through an understanding of the root
cause can the underlying issue be fixed. Otherwise, even if you
clean the data, more errors will occur in the future.
There are several ways to examine the root cause. A qualitative way
used in Six Sigma is a Cause and Effect Diagram which is
sometimes called a Fishbone because of the way it looks. It
organizes possible causes for a specific problem by displaying them
in increasing detail. A quantitative way to examine root causes with
data is data lineage. Data lineage is the history of a data item,
including its acquisition, transformation and integration. Knowing
where the data came from can help you find the root cause of the
error.
Even if the underlying data is correct, the report could have
information that is not. Therefore, the person producing the reports
should perform additional quality tests on the reports themselves
before they are released to the customer.
There are two main tests that we do. They are called delta reports
and control totals. The delta reports show what has changed from
one report to the next. If what has changed is different from
expected, then the reason should be investigated. Delta reports are
part art, part science. It requires someone knowledgeable enough
about the business to know what is expected; therefore, a subject
matter expert can be referred to in such cases.
Control totals are basically a reconciliation of the report results with a
source that either should be equal to the report totals (or subtotals),
or the differences can be explained. If the report cannot be
reconciled, then further investigation is required. The results of the
investigation might show an issue with the process that creates the
report, or it may be a data quality issue.
One important lesson on data quality when doing reporting is to get
to know the people who use the data and the people who own the
data. The people who use the data will be able to help you answer
questions about unusual things you see in the data. They also will
help you identify whether rule violations are errors or not. The people
who own the data will many times be the ones you will have to work

CompAct
http://www.soa.org/library/newsletters/compact/2011/october/com-2011-iss41-benson.aspx[2/14/2012 10:28:26 PM]
with to fix the process that is causing the data quality error.
One other way to find out about data and information quality errors is
to listen to your customer. This can be conducted formally through
surveys, focus groups or interviews or done informally. In talking with
your customers, many times you will discover information that is very
difficult to glean from the data itself.
Successful reporting provides information that is used by customers,
is of a high quality, and arrives in a timely manner. Potential misuse
is still possible (if not probable) when users misunderstand or
misinterpret the information. Three ways to minimize this are to:
1. provide clear definitions for the fields in the reports
2. identify key takeaways from each report for the user
3. train report users on how to interpret the information in the
report
Efficiency
There are many ways that the process used to produce the report
can be inefficient. The main ones that I have witnessed are lack of
automation, useless information, redundant information, wasteful
process steps and a lack of documentation.
Lack of Automation
When a report is first created, manual steps are important in order to
understand the process. However, once the report is in production,
manual steps can add significant time to the process. In addition,
manual steps increase the probability of human error.
One of the dangers of automation is that a change in the underlying
data might go unrecognized. That is why you must still be diligent in
testing the quality of the data and reports as discussed above.
It is also important to make sure the process continues to run
smoothly. Capturing the time it takes to run each step and building
Statistical Control Charts are one way to do this. Whenever a step
takes significantly more time, it will be outside of the upper control
level (UCL). When this happens, the cause of the variation should be
investigated.
Useless Information
Extra information not used by the customer is useless. Having this
information slows down processing time. It also slows down the time
to test the quality of the data. If your customers are not using that
information, then you should consider removing it from the report.
CompAct
http://www.soa.org/library/newsletters/compact/2011/october/com-2011-iss41-benson.aspx[2/14/2012 10:28:26 PM]
One thing to keep in mind is that you might be a customer of your
own report, so if you need the information, keep it.
Removing information from your report does not mean removing the
data from your database. You should probably keep more data in
your database than in the reports, in case you need to fulfill requests
for reports using that data.
Redundant Information
When you have different customers asking for similar information,
but in different formats, there is a tendency to create different reports
and thus have a different process for each of them. When this
happens, you could meet with each of your customers and
determine if there is a way to combine the reports.
The decision to do this also depends on how long it takes to create a
single report. For example, if the report can be created easily from a
data mart with a dynamic interface, then the time saved may not be
significant. So make sure that the benefits of the time saved by
combining the reports outweigh the benefits that your customers may
have had with separate reports.
Wasteful Process Steps
Some steps don't add any value to the process. Either in the
development stage or when the reports are in production, it is
important to determine if each step leads to the ultimate goal. If it
doesn't, then the process should be redesigned.
Lean Six Sigma has a process improvement method called MUDA,
which is a Japanese term for eliminating waste. It identifies activities
that add no value to the overall process, but add time and/or cost.
These concepts come from manufacturing, but can be used in data
management and reporting also. There are seven categories of
waste in lean:
1. Overproduction - this usually happens when we give the
customer more information than they actually need (such as
too many fields).
2. Unnecessary transportation - this happens when data moves
from one system to another unnecessarily. The process
should minimize the number of movements of data from
source to final report.
3. Waiting/queuing - this is waste caused by inactivity in the
process. It is usually caused by manual processes in which
you rely on someone else for information.
CompAct
http://www.soa.org/library/newsletters/compact/2011/october/com-2011-iss41-benson.aspx[2/14/2012 10:28:26 PM]
4. Extra processing - this is additional work needed after the
product is completed that adds no value to the customer.
One example in reporting is continually cleaning data instead
of fixing the process.
5. Motion - this is movement of people that doesn't add value.
One example is having different people generating similar
reports.
6. Inventory - this is having more reports on hand than are
actually needed.
7. Defects - this is reports that are produced with errors.
Lack of Documentation
When a reporting process is put into production, the process should
be documented. Lack of documentation becomes an issue when:
Frequency of reports is low - A person tends to forget the
steps if there is significant time between creation of the
reports.
Turnover - When a process has to be transferred from one
person to another, lack of documentation makes it difficult to
train the new person on the process.
Manual Steps - If there are any steps that are manual, a
process with documentation takes less time and is more
efficient.
Each process should have standard operating procedures. In
addition, every attribute (column) in the report should be defined so
that the user of the report does not misinterpret it.
Technology
Technology is an enabler to the process. However, the choice of
which technology we use does not change the customer requirement
or the quality of the input data. Certain technologies can help you be
more efficient, but process efficiencies go far beyond the type of
technology that is being used.
Too many times we have seen companies implement new systems
and talk about all of the great things they can do. But in my
experience, too much of the focus is on the front-end of the system,
and as a result the back-end data and the reporting suffer. When
building new systems, customer reporting requirements, data quality
and how efficiently you can create reports should be part of the main
considerations.
Product Knowledge
CompAct
http://www.soa.org/library/newsletters/compact/2011/october/com-2011-iss41-benson.aspx[2/14/2012 10:28:26 PM]
The reporting team needs to have knowledge of the products that
reports are based on. However, it should not be assumed that they
know everything. There will always be people inside of the business
that know a lot more (called subject matter experts, SMEs). You
should work with these people to help tackle issues that are outside
your area of expertise.
Conclusion
In order to have a successful reporting process, it is essential to
understand customer needs, produce high quality reports and
produce them in an efficient manner. Technology and product
knowledge will also enable you to have successful reports.
Jeremy Benson, FSA, FCAS, MAAA is senior pricing actuary for the
Medical Expense Group of Swiss Re. He can be reached at
475 North Martingale Road, Suite 600 Schaumburg, Illinois 60173
Phone: 847.706.3500 Fax: 847.706.3599 www.soa.org

CompAct
http://www.soa.org/library/newsletters/compact/2011/october/com-2011-iss41-campbell.aspx[2/14/2012 10:28:34 PM]
ISSUE 41 | OCTOBER 2011
Table of Contents
Letter from the Chair
Editors' Notes
Actuarial Software Wins
Microsoft Innovation
Award
Touch the SCAI
One Actuary's Journey
Through Technology
Keys to Successful
Reports
Excel Formula Rogue's
Gallery 2: Electric
Bugaloo
Speaking "Data" Properly
Part 2
Articles Needed
Technology Section
Web site
Council
EXCEL FORMULA ROGUE'S GALLERY 2: ELECTRICBUGALOOby Mary Pat Campbell
Welcome to the second installment of the horror that is the Excel
Formula Rogue's Gallery!
But before we get started in this funhouse, let me pass on a request
from the European Spreadsheet Risks Interest Group:
EuSPRIG has been seeking to build up a repository of "model"
spreadsheets—models of both what is good practice and what is
bad practice. Below is a list of the sorts of things they are looking for:
Please point us to links to publicly available spreadsheets that
have something of interest in their construction:
* very large number of formulas
* complex formulas or VBA
* user has sustained a material loss because of an error
* exemplifies good practice in construction
* or anything else that is outside the run-of-the-mill
spreadsheet with three sheets and a few dozen SUM formulas.
Download an example of the sort of thing they're looking for.
CompAct
http://www.soa.org/library/newsletters/compact/2011/october/com-2011-iss41-campbell.aspx[2/14/2012 10:28:34 PM]
Links of Interest
Fiction Contest
Richard Junker, Co-editor
Andrew Chan, Co-editor
SOA StaffMeg Weber, Staff Partner
Sue Martz,
Section Specialist
Sam Phillips, Staff Editor
(The linked workbook was associated with work on Basel II. More
info on the QIS 5 exercise.)
If the spreadsheets aren't publicly available, a suitably anonymized
version that could be shared with the group (original raw data
scrubbed, for instance) is also welcome. Please email examples or
links to Patrick O'Beirne. If you send them to me, I will also make
sure EuSPRIG gets them.
And now back to the horror show
First up, Gadi Bizinyan from the Excel Gurus LinkedIn group shared
his experience:
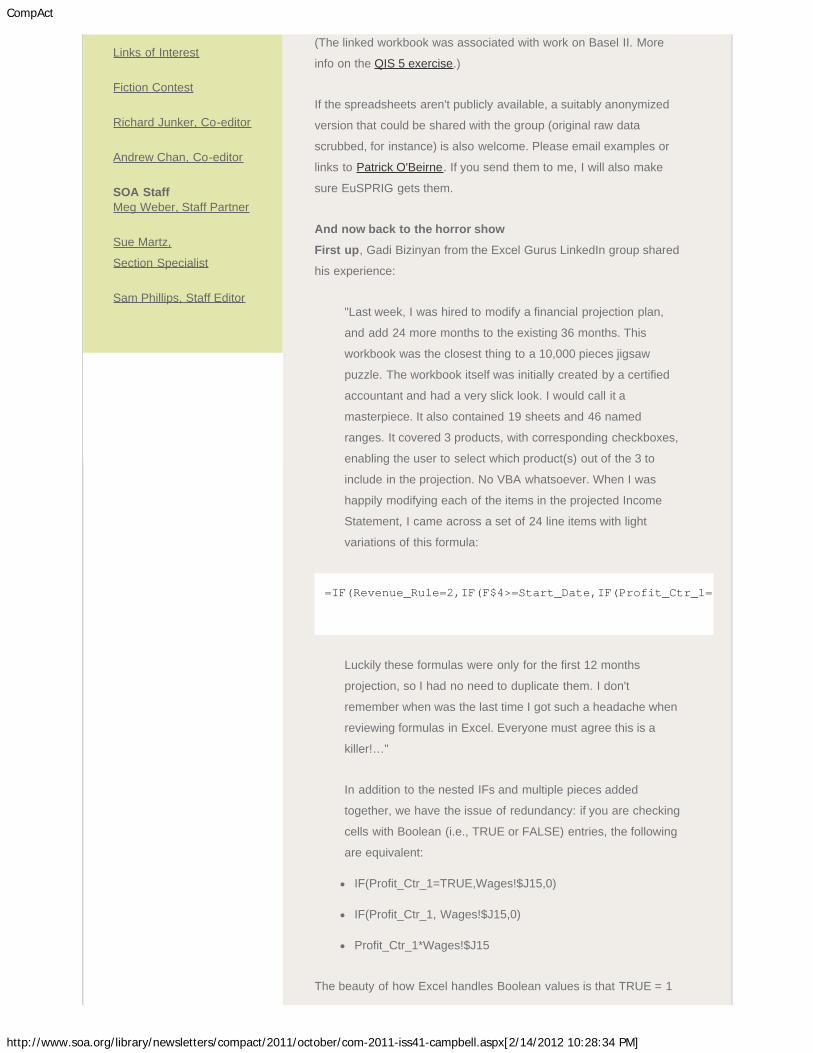
"Last week, I was hired to modify a financial projection plan,
and add 24 more months to the existing 36 months. This
workbook was the closest thing to a 10,000 pieces jigsaw
puzzle. The workbook itself was initially created by a certified
accountant and had a very slick look. I would call it a
masterpiece. It also contained 19 sheets and 46 named
ranges. It covered 3 products, with corresponding checkboxes,
enabling the user to select which product(s) out of the 3 to
include in the projection. No VBA whatsoever. When I was
happily modifying each of the items in the projected Income
Statement, I came across a set of 24 line items with light
variations of this formula:
Luckily these formulas were only for the first 12 months
projection, so I had no need to duplicate them. I don't
remember when was the last time I got such a headache when
reviewing formulas in Excel. Everyone must agree this is a
killer!…"
In addition to the nested IFs and multiple pieces added
together, we have the issue of redundancy: if you are checking
cells with Boolean (i.e., TRUE or FALSE) entries, the following
are equivalent:
IF(Profit_Ctr_1=TRUE,Wages!$J15,0)
IF(Profit_Ctr_1, Wages!$J15,0)
Profit_Ctr_1*Wages!$J15
The beauty of how Excel handles Boolean values is that TRUE = 1
=IF(Revenue_Rule=2,IF(F$4>=Start_Date,IF(Profit_Ctr_1=T
CompAct
http://www.soa.org/library/newsletters/compact/2011/october/com-2011-iss41-campbell.aspx[2/14/2012 10:28:34 PM]
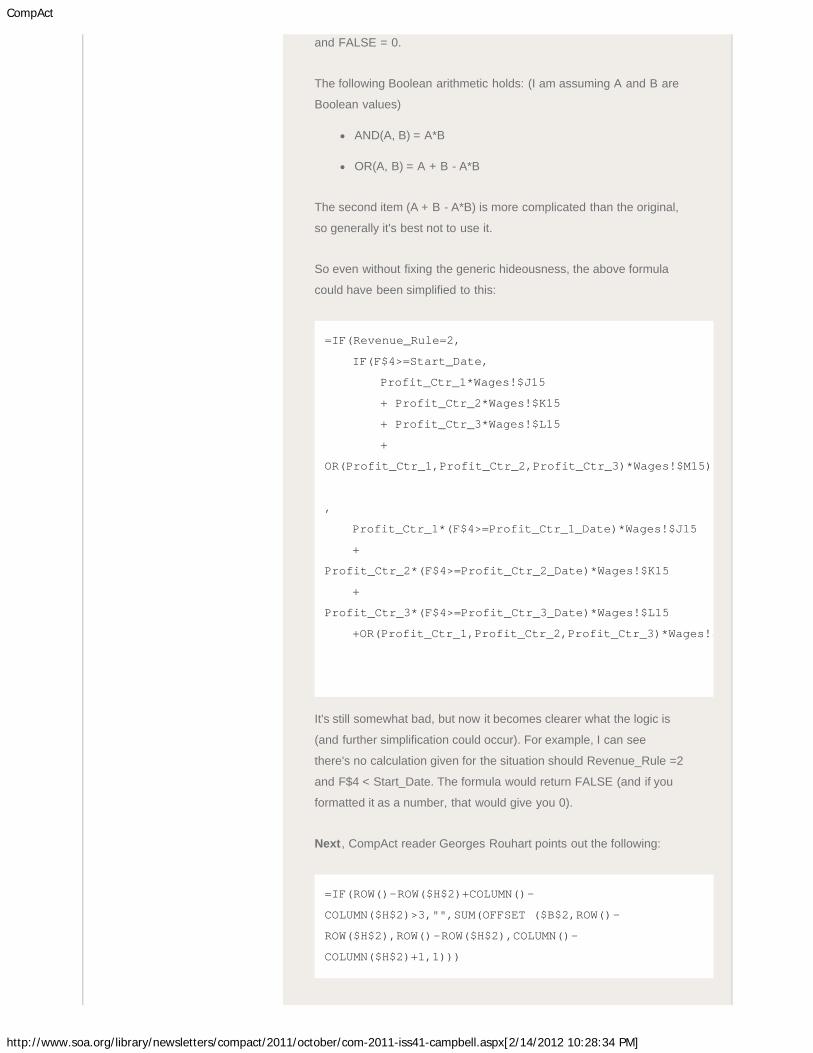
and FALSE = 0.
The following Boolean arithmetic holds: (I am assuming A and B are
Boolean values)
AND(A, B) = A*B
OR(A, B) = A + B - A*B
The second item (A + B - A*B) is more complicated than the original,
so generally it's best not to use it.
So even without fixing the generic hideousness, the above formula
could have been simplified to this:
It's still somewhat bad, but now it becomes clearer what the logic is
(and further simplification could occur). For example, I can see
there's no calculation given for the situation should Revenue_Rule =2
and F$4 < Start_Date. The formula would return FALSE (and if you
formatted it as a number, that would give you 0).
Next, CompAct reader Georges Rouhart points out the following:
=IF(Revenue_Rule=2,
IF(F$4>=Start_Date,
Profit_Ctr_1*Wages!$J15
+ Profit_Ctr_2*Wages!$K15
+ Profit_Ctr_3*Wages!$L15
+
OR(Profit_Ctr_1,Profit_Ctr_2,Profit_Ctr_3)*Wages!$M15)
,
Profit_Ctr_1*(F$4>=Profit_Ctr_1_Date)*Wages!$J15
+
Profit_Ctr_2*(F$4>=Profit_Ctr_2_Date)*Wages!$K15
+
Profit_Ctr_3*(F$4>=Profit_Ctr_3_Date)*Wages!$L15
+OR(Profit_Ctr_1,Profit_Ctr_2,Profit_Ctr_3)*Wages!$
=IF(ROW()-ROW($H$2)+COLUMN()-
COLUMN($H$2)>3,"",SUM(OFFSET ($B$2,ROW()-
ROW($H$2),ROW()-ROW($H$2),COLUMN()-
COLUMN($H$2)+1,1)))

CompAct
http://www.soa.org/library/newsletters/compact/2011/october/com-2011-iss41-campbell.aspx[2/14/2012 10:28:34 PM]
Rouhart's comment:
"What does this formula do? I have no idea because I have not
taken the time or effort to parse it. The significance of the
formula is its source! It is extracted from the CompAct
electronic newsletter issue 40; the article by Damian."
Yes, well, these things do happen. More specifically, it can be
difficult to avoid complexity when you're doing something complex
with your formulas.
I must say, this one took me a while to think through. (And while I
was thinking it through, I got height and width in the OFFSET mixed
up in my mind. I had to do some examples to check if the logic was
right.) Considering what it is doing (taking cumulative sums along a
diagonal … sort of), there's no real elegant way to do the above,
unless one wants to use more unique formulas with interim steps.
For this particular example, the non-empty result is contained in a
4x4 area of the spreadsheet (intended to fill the upper triangle of H2
to K5), so it would be simple to have a bunch of unique formulas
doing those sums … but what if you wanted to do it over 200 rows
and columns?
As has been shown with the Obfuscated C contest (and many
examples of code in Perl or APL), one can make some relatively
terse formulas do some complicated things … but it becomes difficult
to debug such things should there be errors in the logic.
Rouhart has some helpful advice on the score of teasing apart these
complicated formulas—because many times we are given these
formulas as part of legacy spreadsheets, and we are forced to parse
them in order to update them or audit them.
For situations such as your rogue formulas, a solution is to use the
"Evaluate Formula" that is buried in the Excel menus and tool bars of
Office. It allows you to step through each element of an Excel
formula and see it operate. The number one solution when faced
with a mega or cryptic formula.
In Excel 2007 and 2010, the "Evaluate Formula" tool can be found in
the Formulas tab on the ribbon. In Excel 2003, this tool is in the
Formula Auditing toolbar and also under the "Tools" menu, under
Formula Auditing.
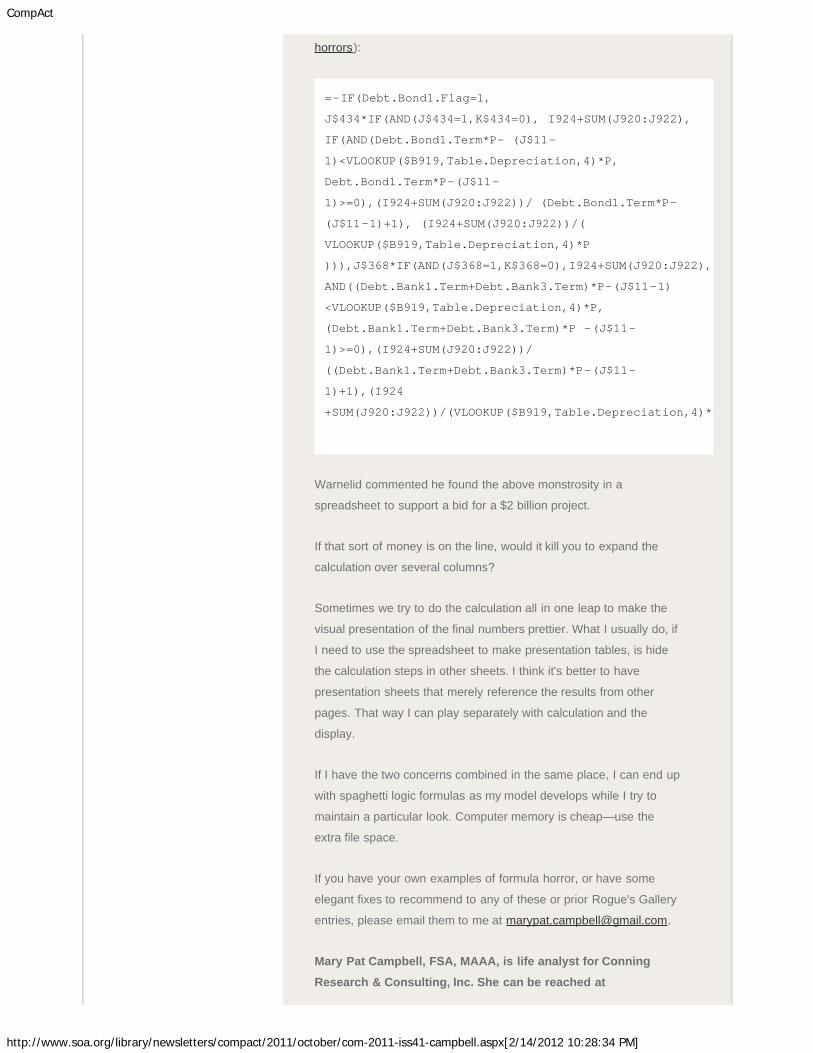
Finally, Rickard Warnelid at Corality (a firm specializing in financial
modeling, model audits, and training) shares the following two other
CompAct
http://www.soa.org/library/newsletters/compact/2011/october/com-2011-iss41-campbell.aspx[2/14/2012 10:28:34 PM]
horrors):
Warnelid commented he found the above monstrosity in a
spreadsheet to support a bid for a $2 billion project.
If that sort of money is on the line, would it kill you to expand the
calculation over several columns?
Sometimes we try to do the calculation all in one leap to make the
visual presentation of the final numbers prettier. What I usually do, if
I need to use the spreadsheet to make presentation tables, is hide
the calculation steps in other sheets. I think it's better to have
presentation sheets that merely reference the results from other
pages. That way I can play separately with calculation and the
display.
If I have the two concerns combined in the same place, I can end up
with spaghetti logic formulas as my model develops while I try to
maintain a particular look. Computer memory is cheap—use the
extra file space.
If you have your own examples of formula horror, or have some
elegant fixes to recommend to any of these or prior Rogue's Gallery
entries, please email them to me at [email protected].
Mary Pat Campbell, FSA, MAAA, is life analyst for Conning
Research & Consulting, Inc. She can be reached at
=-IF(Debt.Bond1.Flag=1,
J$434*IF(AND(J$434=1,K$434=0), I924+SUM(J920:J922),
IF(AND(Debt.Bond1.Term*P- (J$11-
1)<VLOOKUP($B919,Table.Depreciation,4)*P,
Debt.Bond1.Term*P-(J$11-
1)>=0),(I924+SUM(J920:J922))/ (Debt.Bond1.Term*P-
(J$11-1)+1), (I924+SUM(J920:J922))/(
VLOOKUP($B919,Table.Depreciation,4)*P
))),J$368*IF(AND(J$368=1,K$368=0),I924+SUM(J920:J922),
AND((Debt.Bank1.Term+Debt.Bank3.Term)*P-(J$11-1)
<VLOOKUP($B919,Table.Depreciation,4)*P,
(Debt.Bank1.Term+Debt.Bank3.Term)*P -(J$11-
1)>=0),(I924+SUM(J920:J922))/
((Debt.Bank1.Term+Debt.Bank3.Term)*P-(J$11-
1)+1),(I924
+SUM(J920:J922))/(VLOOKUP($B919,Table.Depreciation,4)*P
CompAct
http://www.soa.org/library/newsletters/compact/2011/october/com-2011-iss41-campbell.aspx[2/14/2012 10:28:34 PM]
475 North Martingale Road, Suite 600 Schaumburg, Illinois 60173
Phone: 847.706.3500 Fax: 847.706.3599 www.soa.org

CompAct
http://www.soa.org/library/newsletters/compact/2011/october/com-2011-iss41-rachlis.aspx[2/14/2012 10:28:42 PM]
ISSUE 41 | OCTOBER 2011
Table of Contents
Letter from the Chair
Editors' Notes
Actuarial Software Wins
Microsoft Innovation
Award
Touch the SCAI
One Actuary's Journey
Through Technology
Keys to Successful
Reports
Excel Formula Rogue's
Gallery 2: Electric
Bugaloo
Speaking "Data" Properly
Part 2
Articles Needed
Technology Section
Web site
Council
SPEAKING "DATA" PROPERLYby Dan Rachlis
Data Mining, Data Analysis, Data Warehouse, Data Mart, Data
Modeling, Data Requirements, Data Integration, Data
Visualization, Data Cleansing, Data Transformation, Relational
Database, Business Intelligence, Data Management, Data
Architecture, Data Privacy, Data Security, Data Access, Data
Integrity, Metadata, Data Backup, Disaster Recovery, Business
Continuity Planning, Data Governance, Data Asset Customer
Relationship Management (CRM) Software, Records
Management, Data Structure, Data Movement
Have you ever used any of the above terms? Chances are that you
have and that you may be using them incorrectly. In an era where
technology is continually advancing, electronic data can be found
everywhere. In the health care actuarial industry especially, data and
understanding how to manage the constant flow of information is
vital to an organization's operational and financial viability. Actuaries
need to be sure the analysis and opinions they provide are accurate,
asking for the wrong data or not understanding what data to ask for
can have a significant impact.
This article is the second in a four-part series about eliminating the
confusion with using data terminology. In part one, we discussed
data governance, the formal management of data assets with
respect to availability, usability, integrity, and security throughout the
enterprise. Data governance ensures that data can be trusted and
that people can be made accountable for any adverse event that
happens because of low data quality. It assigns responsibilities to fix
CompAct
http://www.soa.org/library/newsletters/compact/2011/october/com-2011-iss41-rachlis.aspx[2/14/2012 10:28:42 PM]
Links of Interest
Fiction Contest
Richard Junker, Co-editor
Andrew Chan, Co-editor
SOA StaffMeg Weber, Staff Partner
Sue Martz,
Section Specialist
Sam Phillips, Staff Editor
and prevent issues with data so that an enterprise can become more
efficient. Part two will discuss data analysis and database
management.
Data Architecture, Analysis and Design
Data Analysis is a process in which raw data is organized and
reviewed so that useful information can be extracted. The main goal
of data analysis is to highlight information to draw conclusions and
support decision making. Data analysis has multiple facets and
approaches that encompass many techniques in different business
and consulting environments. A data structure is a specialized
format for storing and organizing data in a computer so that it can be
used efficiently in data analysis. Data architecture describes the
data structures used by a business and/or its applications. These are
descriptions of data in storage and data in motion including
descriptions of data stores, data groups and data items and
mappings of those data artifacts to data qualities, applications and
locations. Data is commonly in tables, which are a collection of
meaningful data elements. A data dictionary is a centralized
repository of information about data such as the source table,
meaning or description, relationships to other data, origin, usage,
and format. A database is an organized collection of data in the form
of tables for one or more uses. Data modeling is the formalization
and documentation of a business process. A data model defines,
analyzes and diagrams data requirements and relationships needed
to support the business processes of an organization. Data
visualization is the graphical representation of data or information
which has been abstracted in some schematic form, with the goal of
providing the viewer with a qualitative understanding of the
information contents. Data integration involves combining data
residing in different sources and providing users with a unified view
of this data. Data cleansing or data scrubbing is the term used to
identify and correct (or remove) corrupt or inaccurate information
from a table. Data cleansing differs from data validation. The term
data validation refers to a process during which data is subject to a
comparison with a set of acceptance criteria. Data validation
guarantees to your application that every data value is correct and
accurate. Data integrity is data that has a complete or whole
structure. All characteristics of the data including business rules, the
accuracy and consistency of the data, and the exact duplication of
data must be correct for data to be complete. Data that has integrity
is identically maintained during any operation (such as transfer,
storage or retrieval). Put simply in business terms, data integrity is
the assurance that data is consistent, certified and can be
reconciled.
CompAct
http://www.soa.org/library/newsletters/compact/2011/october/com-2011-iss41-rachlis.aspx[2/14/2012 10:28:42 PM]
Future articles in this series will focus on data warehousing, business
intelligence, and records management.
Dan Rachlis, ASA, is a specialist master in the Chicago office of
Deloitte Consulting LLP. He can be reached at
[email protected] or at 312.486.5631.
475 North Martingale Road, Suite 600 Schaumburg, Illinois 60173
Phone: 847.706.3500 Fax: 847.706.3599 www.soa.org

Articles Needed for CompAct Newsletter
http://www.soa.org/library/newsletters/compact/2011/october/com-2011-iss41-soa.aspx[2/14/2012 10:28:51 PM]
ISSUE 41 | OCTOBER 2011
Table of Contents
Letter from the Chair
Editors' Notes
Actuarial Software Wins
Microsoft Innovation
Award
Touch the SCAI
One Actuary's Journey
Through Technology
Keys to Successful
Reports
Excel Formula Rogue's
Gallery 2: Electric
Bugaloo
Speaking "Data" Properly
Part 2
Articles Needed
Technology Section
Web site
Council
ARTICLES NEEDED FOR COMPACT NEWSLETTERYour help and participation are needed: Articles, book reviews and
other information on technology useful to actuaries are needed! All
articles will include a byline to give you full credit for your effort. An
annual prize is awarded for the best article of the year. If you would
like to submit or discuss an idea for an article, please contact
Richard Junker or Andrew Chan.
Submissions for future editions are also welcome!
Submission deadline is November 7 for the January issue.
Thank you for your ideas!
Andrew Chan can be reached at [email protected].

Articles Needed for CompAct Newsletter
http://www.soa.org/library/newsletters/compact/2011/october/com-2011-iss41-soa.aspx[2/14/2012 10:28:51 PM]
Links of Interest
Fiction Contest
Richard Junker, Co-editor
Andrew Chan, Co-editor
SOA StaffMeg Weber, Staff Partner
Sue Martz,
Section Specialist
Sam Phillips, Staff Editor
475 North Martingale Road, Suite 600 Schaumburg, Illinois 60173
Phone: 847.706.3500 Fax: 847.706.3599 www.soa.org