October 14, 20101 INTRODUCTION The purpose of this presentation is to give a brief overview of a...
34
October 14, 2010 1 INTRODUCTION The purpose of this presentation is to give a brief overview of a lengthy and complex process. If you have questions or need more information, please contact the Assessing Office (see contact information on slide 15).
-
Upload
garry-clark -
Category
Documents
-
view
215 -
download
1
Transcript of October 14, 20101 INTRODUCTION The purpose of this presentation is to give a brief overview of a...
October 14, 2010 1
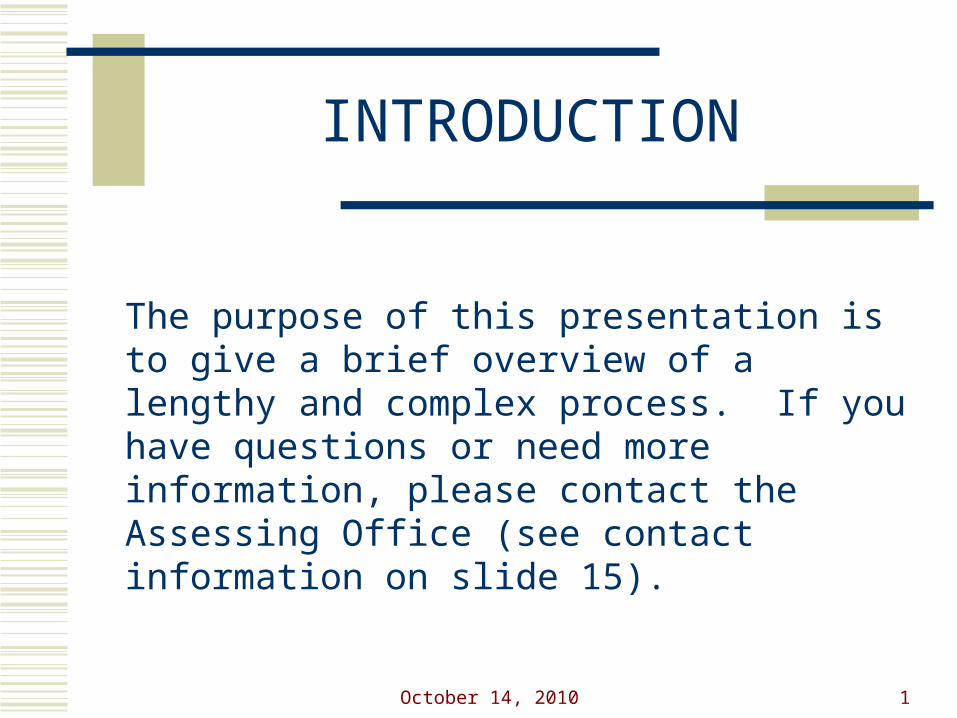
INTRODUCTION
The purpose of this presentation is to give a brief overview of a lengthy and complex process. If you have questions or need more information, please contact the Assessing Office (see contact information on slide 15).

October 14, 2010 2
FY11 PUBLIC FORUMBoard of Assessors
FY2011
October 14, 2010 3
FY11 PUBLIC FORUMBoard of Assessors
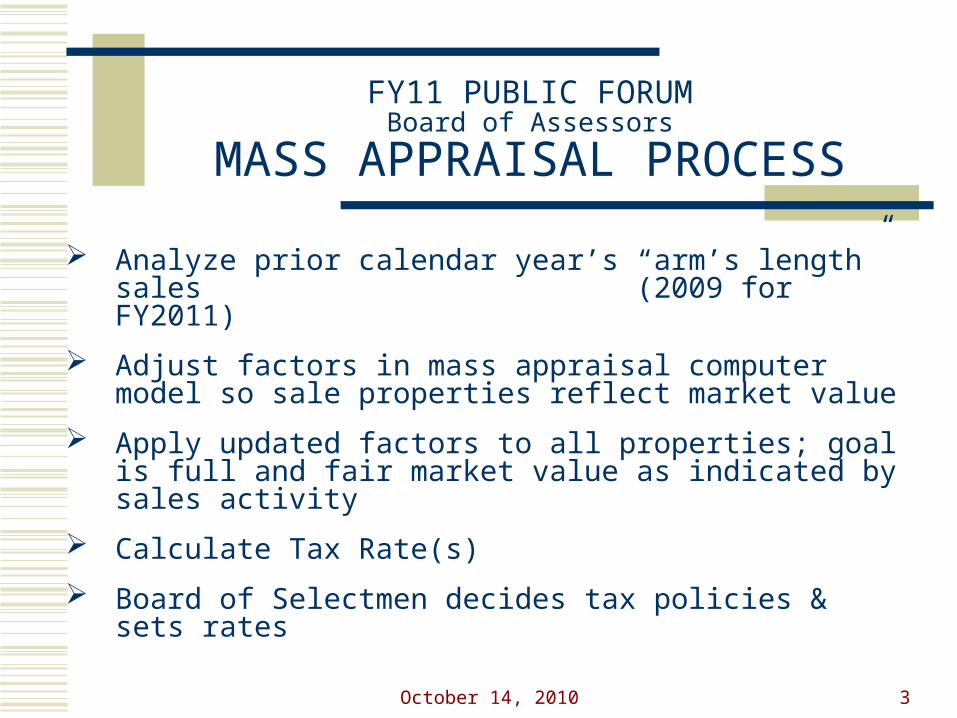
MASS APPRAISAL PROCESS
Analyze prior calendar year’s “arm’s length” sales (2009 for FY2011)
Adjust factors in mass appraisal computer model so sale properties reflect market value
Apply updated factors to all properties; goal is full and fair market value as indicated by sales activity
Calculate Tax Rate(s)
Board of Selectmen decides tax policies & sets rates
October 14, 2010 4
FY11 PUBLIC FORUMBoard of Assessors
STATE REQUIREMENTS
Sales are stratified in several ways: class, neighborhoods, style, building and lot size, age, sale price, and sale date
ASR* median within 10% of 100% of full and fair market value
Within dispersion limits for various classes
*Assessment to Sale Price Ratio
October 14, 2010 5
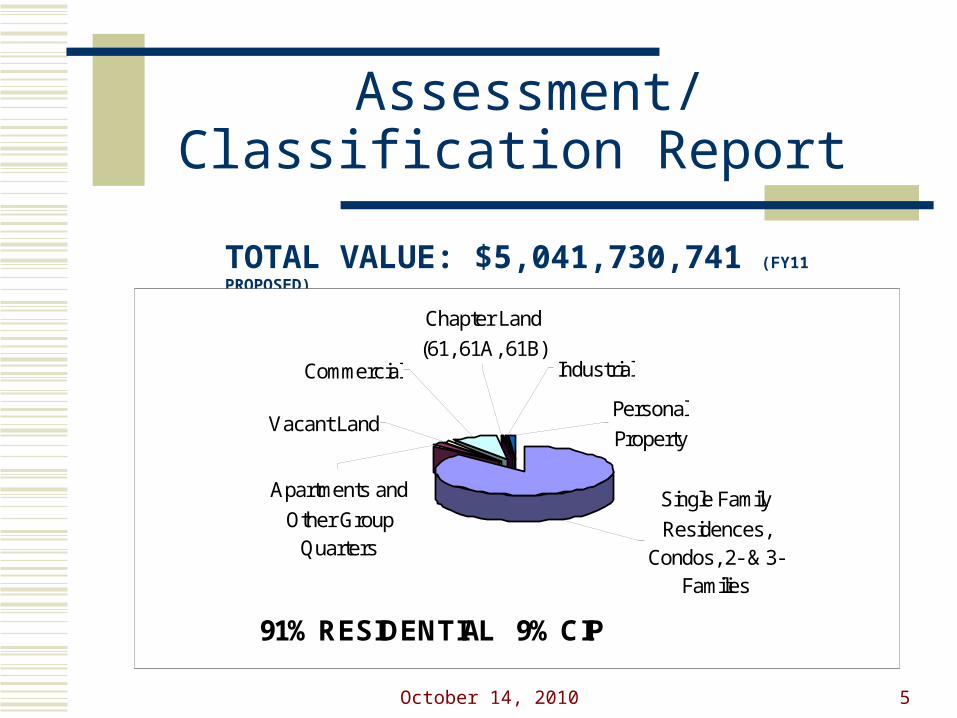
Assessment/ Classification Report
TOTAL VALUE: $5,041,730,741 (FY11 PROPOSED)
Apartments and
Other Group Quarters
Single Family
Residences, Condos, 2- & 3-
Families
Chapter Land
(61, 61A, 61B)
Vacant Land
Commercial
Personal
Property
Industrial
91% RESIDENTIAL 9% CIP
October 14, 2010 6
FY11 PUBLIC FORUMBoard of Assessors
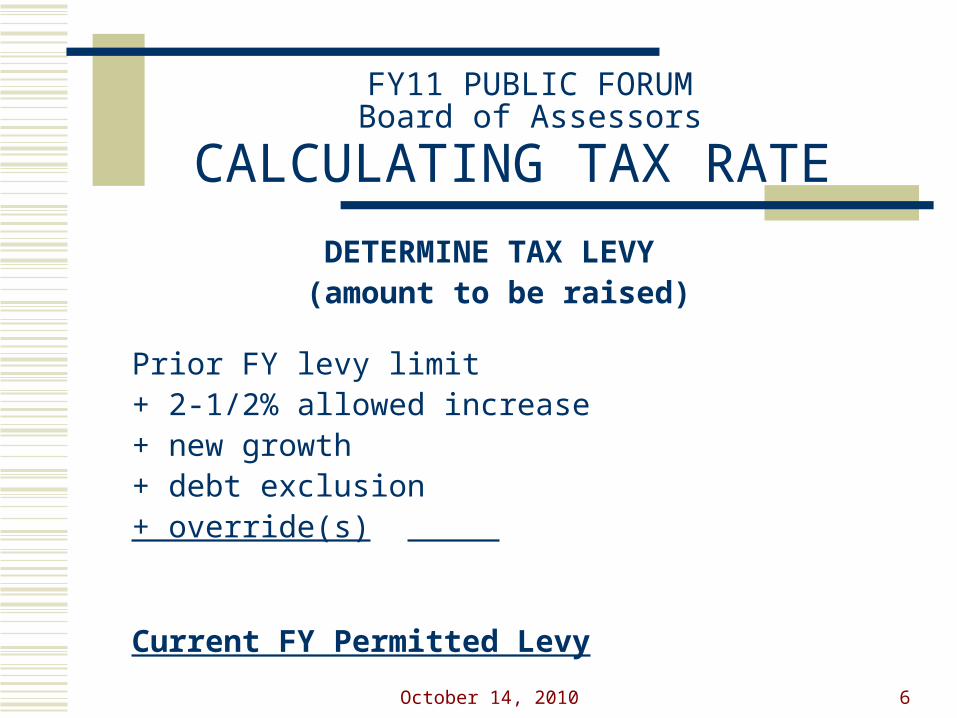
CALCULATING TAX RATE DETERMINE TAX LEVY
(amount to be raised)
Prior FY levy limit+ 2-1/2% allowed increase+ new growth+ debt exclusion+ override(s)
Current FY Permitted Levy

October 14, 2010 7
FY11 PUBLIC FORUMBoard of Assessors
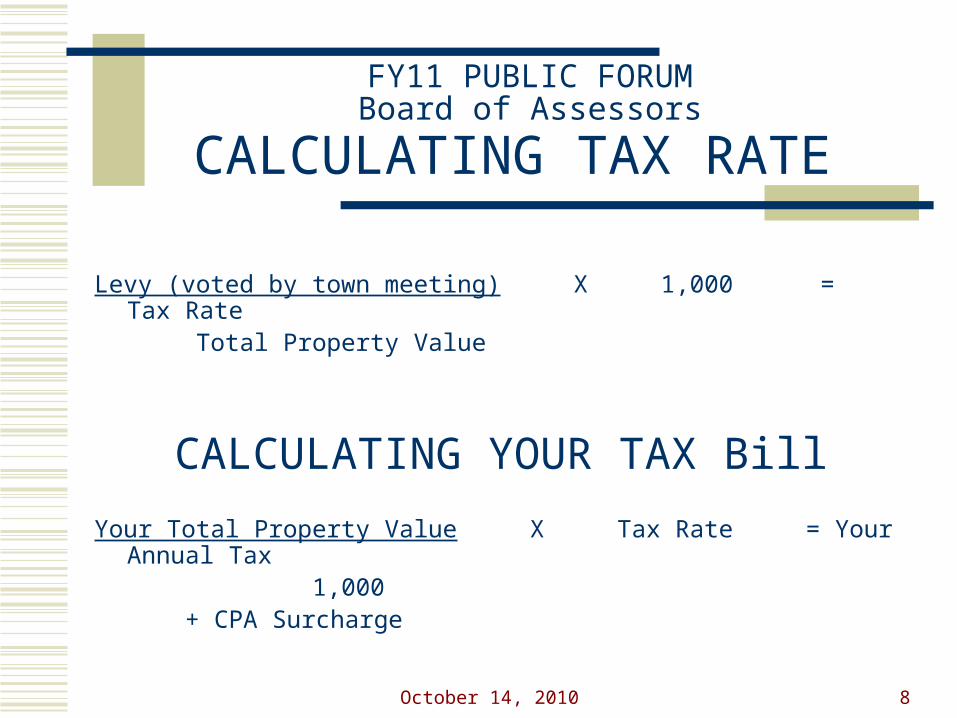
CALCULATING TAX RATE
Levy (voted by town meeting) Total Property Valuation X 1,000 = Tax Rate
FY10 $65,797,569
$5,026,552,229 X 1,000 = $13.09*
FY11 (estimated) $66,525,315
$5,041,730,741 X 1,000 = $13.20
*Tax Rate if maximum levy limit used: $13.27 Tax Rate if at 2.5%: $25.00
October 14, 2010 8
FY11 PUBLIC FORUMBoard of Assessors
CALCULATING TAX RATE
Levy (voted by town meeting) X 1,000 = Tax Rate Total Property Value
CALCULATING YOUR TAX Bill
Your Total Property Value X Tax Rate = Your Annual Tax 1,000
+ CPA Surcharge
October 14, 2010 9
FY11 PUBLIC FORUMBoard of Assessors
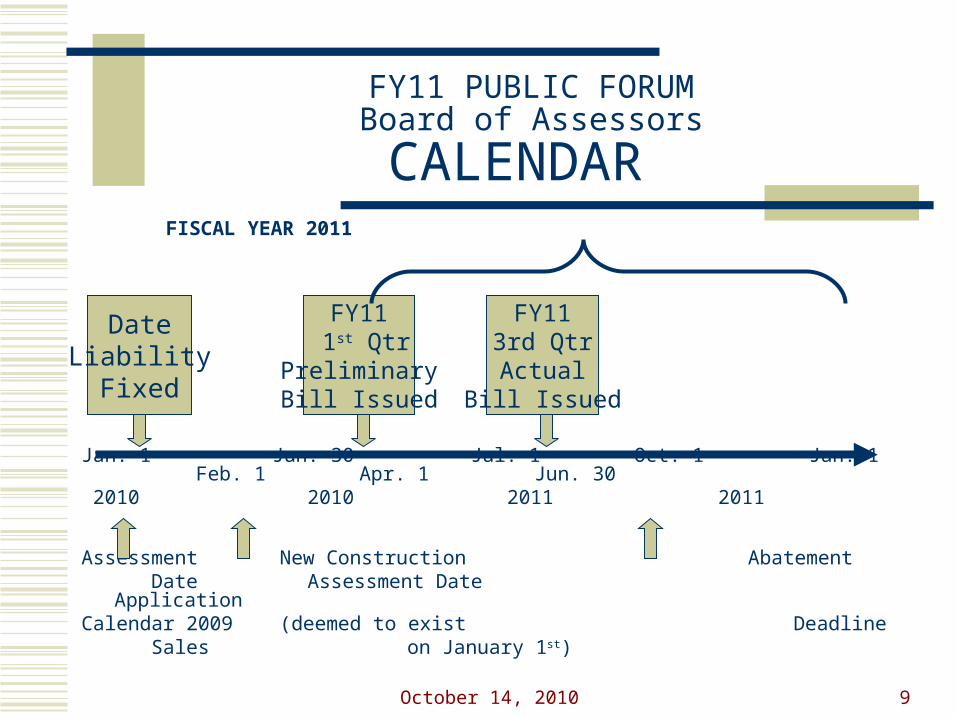
CALENDAR FISCAL YEAR 2011
Jan. 1 Jun. 30 Jul. 1 Oct. 1 Jan. 1 Feb. 1 Apr. 1 Jun. 30
2010 2010 2011 2011
Assessment New Construction Abatement Date Assessment Date ApplicationCalendar 2009 (deemed to exist Deadline Sales on January 1st)
DateLiability
Fixed
FY11 1st Qtr
PreliminaryBill Issued
FY113rd QtrActual
Bill Issued

October 14, 2010 10
FY11 PUBLIC FORUMBoard of Assessors
CONCORD TRENDS
In FY2011 the total value of the town stays almost the same as FY10
Residential property owners’ share of total tax burden continues at 91%
State aid % of budget decreases FY10 to FY11 (.02%) (Total non-tax revenues stable)
FY10 to FY11 Total Budget increase: 1.3%
October 14, 2010 11
FY11 PUBLIC FORUMBoard of Assessors
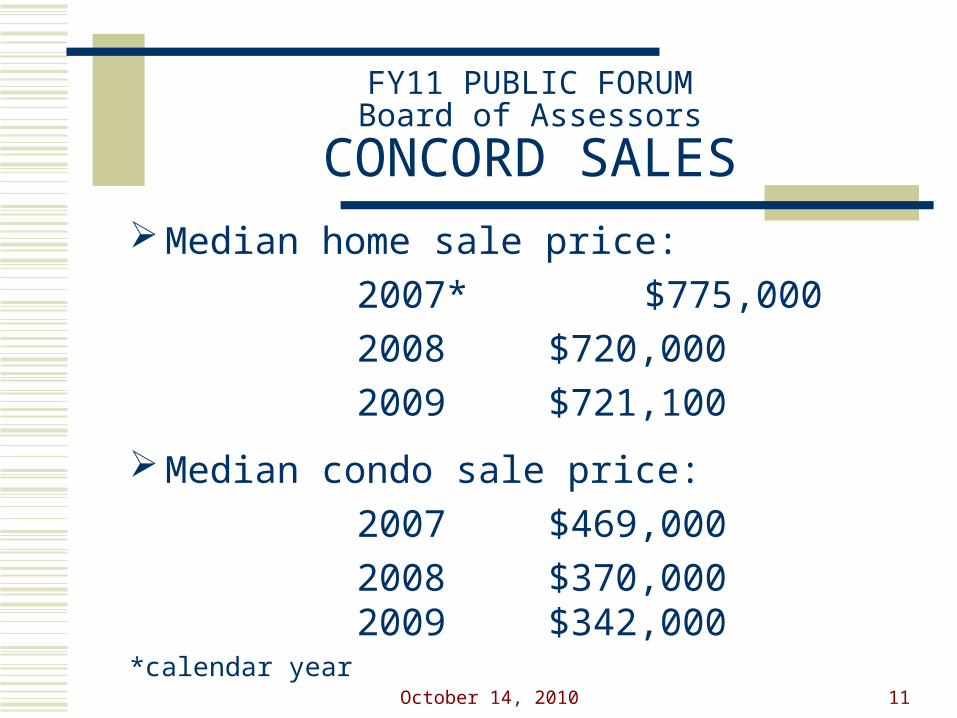
CONCORD SALES Median home sale price:
2007* $775,000
2008 $720,000
2009 $721,100
Median condo sale price:
2007 $469,000
2008 $370,0002009 $342,000
*calendar year
October 14, 2010 12
FY11 PUBLIC FORUMBoard of Assessors
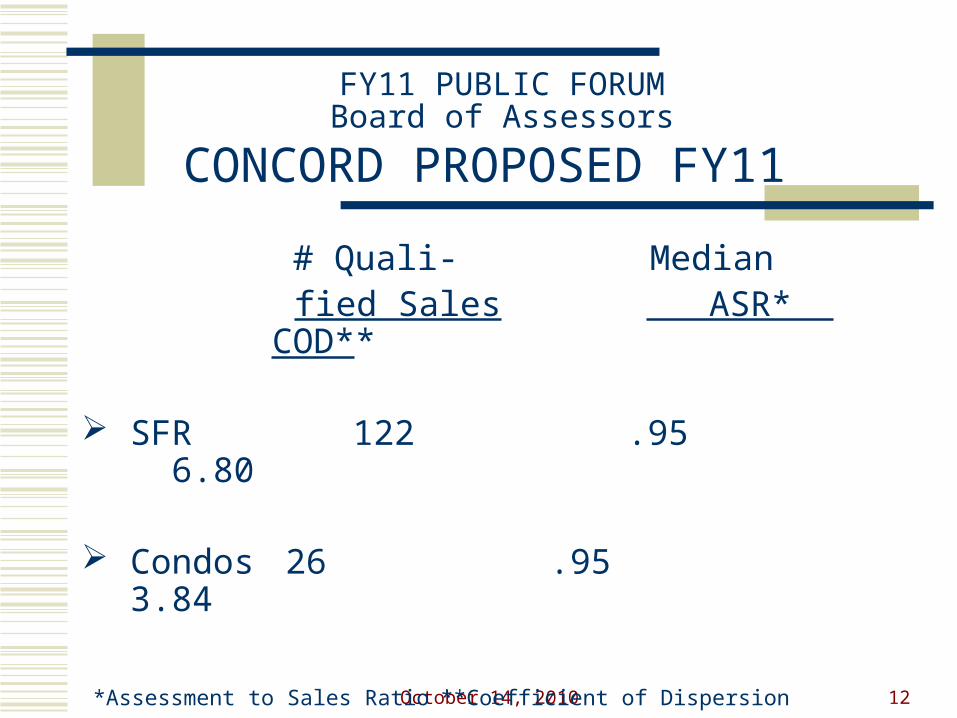
CONCORD PROPOSED FY11
# Quali- Median fied Sales ASR* COD**
SFR 122 .95 6.80
Condos 26 .95 3.84
*Assessment to Sales Ratio **Coefficient of Dispersion

October 14, 2010 13
FY11 PUBLIC FORUMBoard of Assessors
FY2011 ADJUSTMENTS
Median Market Area changed; Land Curve adjusted
Market Area Factors adjusted
Some minor shifts between areas
Site indices reviewed; rarely used
Excess land rate decreased; wetlands rateincreased (most removed)
Building values relatively stable
October 14, 2010 14
FY11 PUBLIC FORUMBoard of Assessors
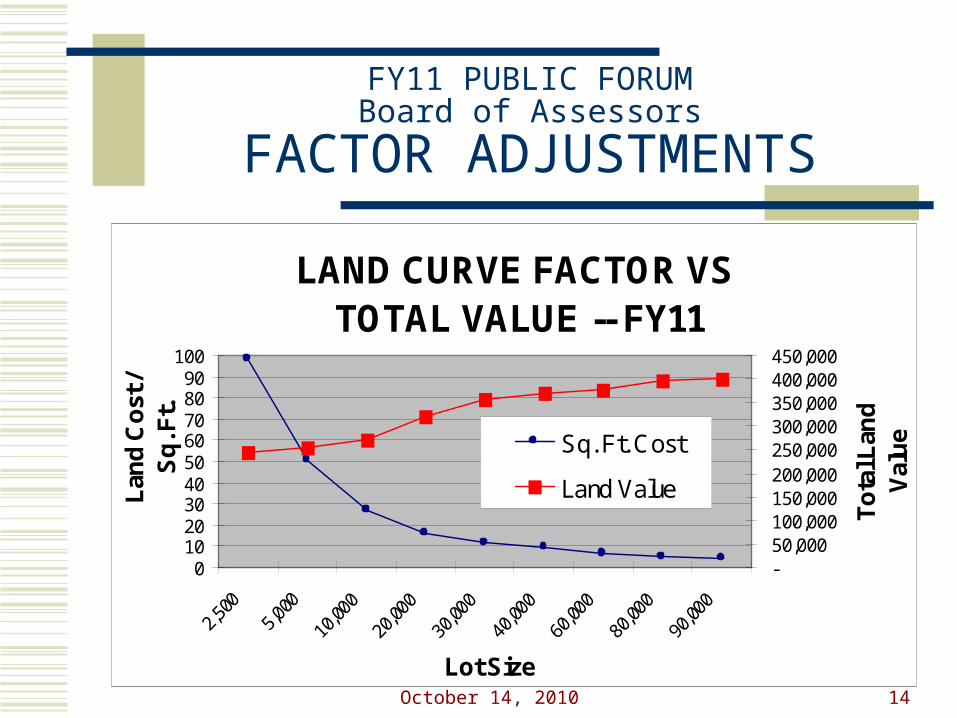
FACTOR ADJUSTMENTS
LAND CURVE FACTOR VS TOTAL VALUE -- FY11
0102030405060708090
100
Lot Size
Lan
d C
ost
/ S
q. F
t.
-50,000100,000150,000200,000250,000300,000350,000400,000450,000
To
tal L
and
V
alu
eSq. Ft. Cost
Land Value

October 14, 2010 15
FY11 PUBLIC FORUMBoard of Assessors
CONTACTS24 Court Lane (Sleepy Hollow)
8:30 a.m. to 4:30 p.m.(978) [email protected] (town
departments: assessors)Visionappraisal.com
October 14, 2010 16
FY11 PUBLIC FORUMBoard of Assessors
APPENDIXAssessors’ DutiesDefinitionsSample Land Values FY10 to FY11Site Indices/Condition Factors% Change HistogramsProperty Record CardCAMA Cost Formula/Table FactorsValuation versus Tax Bill

October 14, 2010 17
FY11 PUBLIC FORUMBoard of Assessors
ASSESSORS’ DUTIES
For all physical property, real and personal1. Inventory all property2. ID legal owner3. Value each property
a. As of fixed date (January 1st)b. 100% of full and fair market value
4. Classify (R,C,I,O,S,E)5. Calculate tax rate
Administer excise taxes, special assessments and betterments, delinquent municipal charges
October 14, 2010 18
FY11 PUBLIC FORUMBoard of Assessors
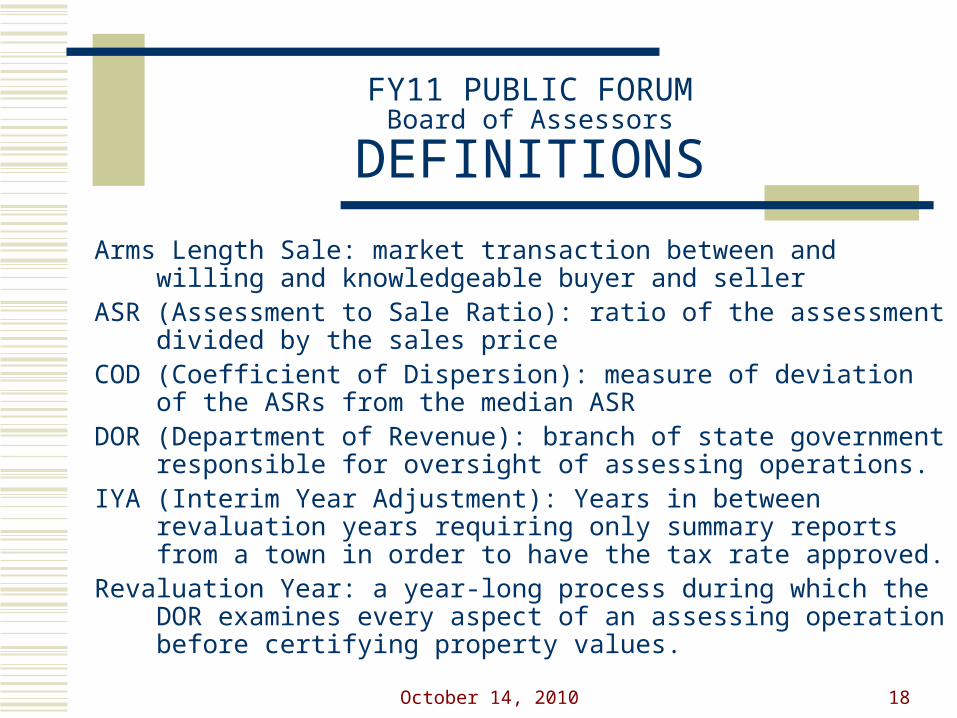
DEFINITIONS
Arms Length Sale: market transaction between and willing and knowledgeable buyer and seller
ASR (Assessment to Sale Ratio): ratio of the assessment divided by the sales price
COD (Coefficient of Dispersion): measure of deviation of the ASRs from the median ASR
DOR (Department of Revenue): branch of state government responsible for oversight of assessing operations.
IYA (Interim Year Adjustment): Years in between revaluation years requiring only summary reports from a town in order to have the tax rate approved.
Revaluation Year: a year-long process during which the DOR examines every aspect of an assessing operation before certifying property values.
October 14, 2010 19
FY11 PUBLIC FORUMBoard of Assessors
INTERIM YEAR
State requirement for all cities and towns to undergo revaluation every third year
Interim year adjustments in the two years in between keep property valuations in line with the market to follow annual fluctuations
October 14, 2010 20
FY11 PUBLIC FORUMBoard of Assessors
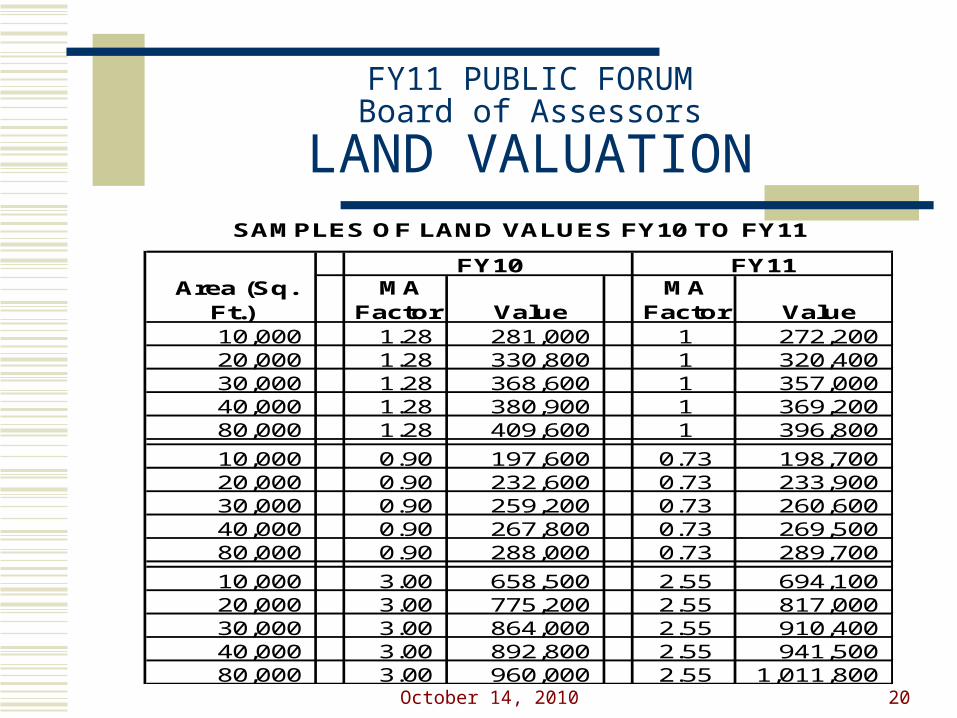
LAND VALUATIONSAMPLES OF LAND VALUES FY10 TO FY11
FY10 FY11 MA
Factor Value MA
Factor Value 10,000 1.28 281,000 1 272,200 20,000 1.28 330,800 1 320,400 30,000 1.28 368,600 1 357,000 40,000 1.28 380,900 1 369,200 80,000 1.28 409,600 1 396,800
10,000 0.90 197,600 0.73 198,700 20,000 0.90 232,600 0.73 233,900 30,000 0.90 259,200 0.73 260,600 40,000 0.90 267,800 0.73 269,500 80,000 0.90 288,000 0.73 289,700
10,000 3.00 658,500 2.55 694,100 20,000 3.00 775,200 2.55 817,000 30,000 3.00 864,000 2.55 910,400 40,000 3.00 892,800 2.55 941,500 80,000 3.00 960,000 2.55 1,011,800
Area (Sq. Ft.)
October 14, 2010 21
FY11 PUBLIC FORUMBoard of Assessors
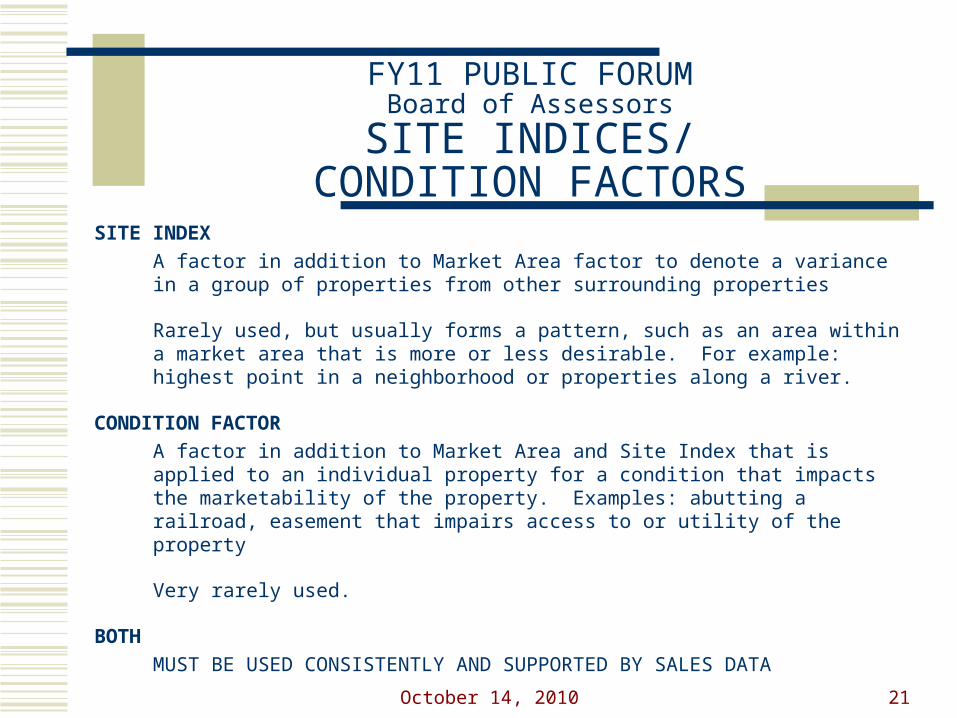
SITE INDICES/CONDITION FACTORS
SITE INDEX
A factor in addition to Market Area factor to denote a variance in a group of properties from other surrounding properties
Rarely used, but usually forms a pattern, such as an area within a market area that is more or less desirable. For example: highest point in a neighborhood or properties along a river.
CONDITION FACTOR
A factor in addition to Market Area and Site Index that is applied to an individual property for a condition that impacts the marketability of the property. Examples: abutting a railroad, easement that impairs access to or utility of the property
Very rarely used.
BOTH
MUST BE USED CONSISTENTLY AND SUPPORTED BY SALES DATA
October 14, 2010 22
FY11 PUBLIC FORUMBoard of Assessors
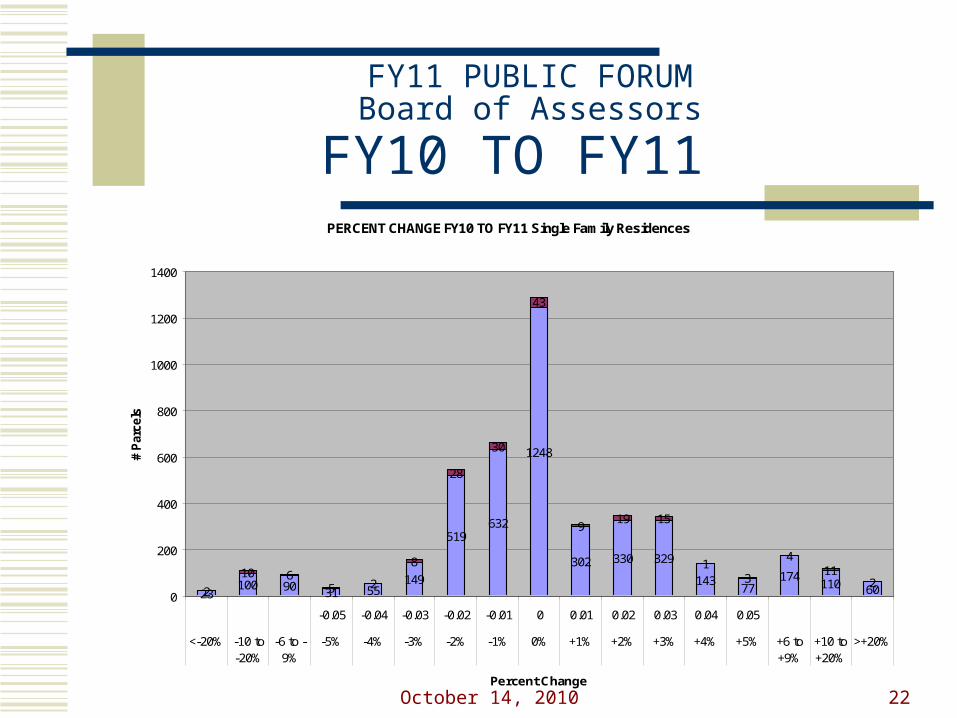
FY10 TO FY11 PERCENT CHANGE FY10 TO FY11 Single Family Residences
23100 90 31 55
149
519632
1248
302 330 329
14377
174110 602
10 65 2
8
28
30
43
919 15
13
411
20
200
400
600
800
1000
1200
1400
-0.05 -0.04 -0.03 -0.02 -0.01 0 0.01 0.02 0.03 0.04 0.05
<-20% -10 to-20%
-6 to -9%
-5% -4% -3% -2% -1% 0% +1% +2% +3% +4% +5% +6 to+9%
+10 to+20%
>+20%
Percent Change
# P
arce
ls
OVERALL CHANGE <+1%
65% Decrease or No Change20% Increase +3% or More

October 14, 2010 23
FY11 PUBLIC FORUMBoard of Assessors
FY10 TO FY11 PERCENT CHANGE FY10 TO FY11 Residential Condominiums
224 18
61
2 3 1 11523
30
12012
6
264
22 8 20 2517
3
2
7 131
9
4
1
1
9
1
1
75
0
50
100
150
200
250
300
0 0.05 0.06 0.07 0.08 0.09
-9 to -21% -3 to -8% -1 to -2% 0% +1 to +2% +3 to +4% +5% +6% +7% +8% +9% +10% or More
Percent Change
# P
arce
ls

October 14, 2010 24
FY11 PUBLIC FORUMBoard of Assessors
FY10 TO FY11 PERCENT CHANGE FY10 TO FY11 Vacant Residential Land
1 1 37
24
12 12
20
11
1
26
125
8
10
15
18
1
8
2 2
1
2
4
6
8
7
22
54
26
1
42
1
7
5
1
3
0
10
20
30
40
50
60
70
(0.48) (0.47) (0.46) -
< -48% -48% -47% -46% -30 to -45% -11 to -29% -1 to -10% 0 +1 to +20% +30 to +100% > 150%
Percent Change
# P
arce
ls
October 14, 2010 25
FY11 PUBLIC FORUMBoard of Assessors
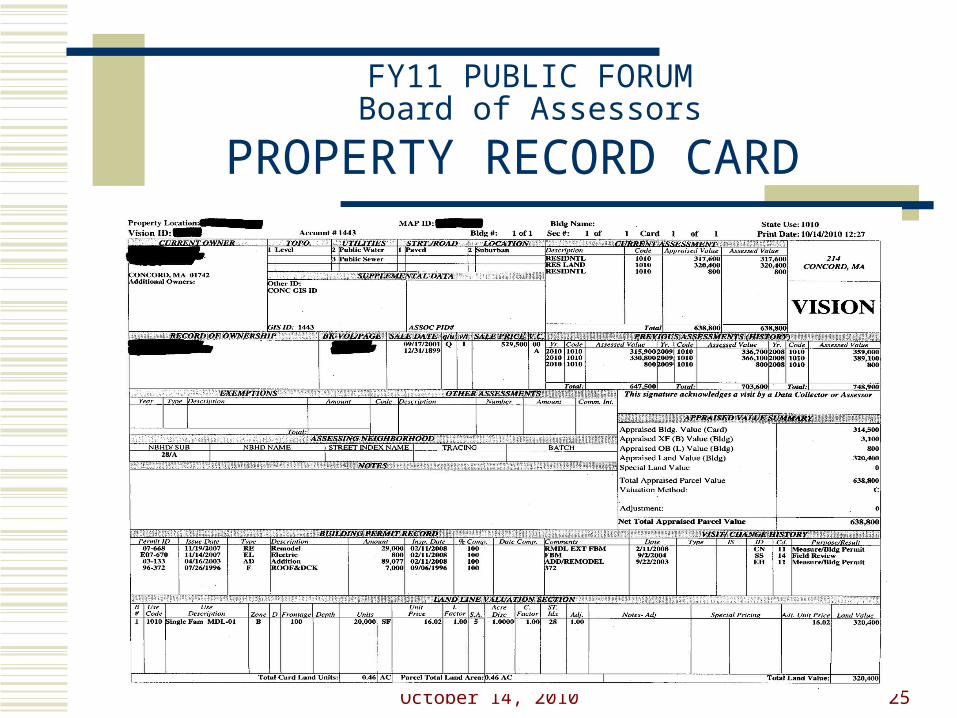
PROPERTY RECORD CARD

October 14, 2010 26
FY11 PUBLIC FORUMBoard of Assessors
PROPERTY RECORD CARD
October 14, 2010 27
FY11 PUBLIC FORUMBoard of Assessors
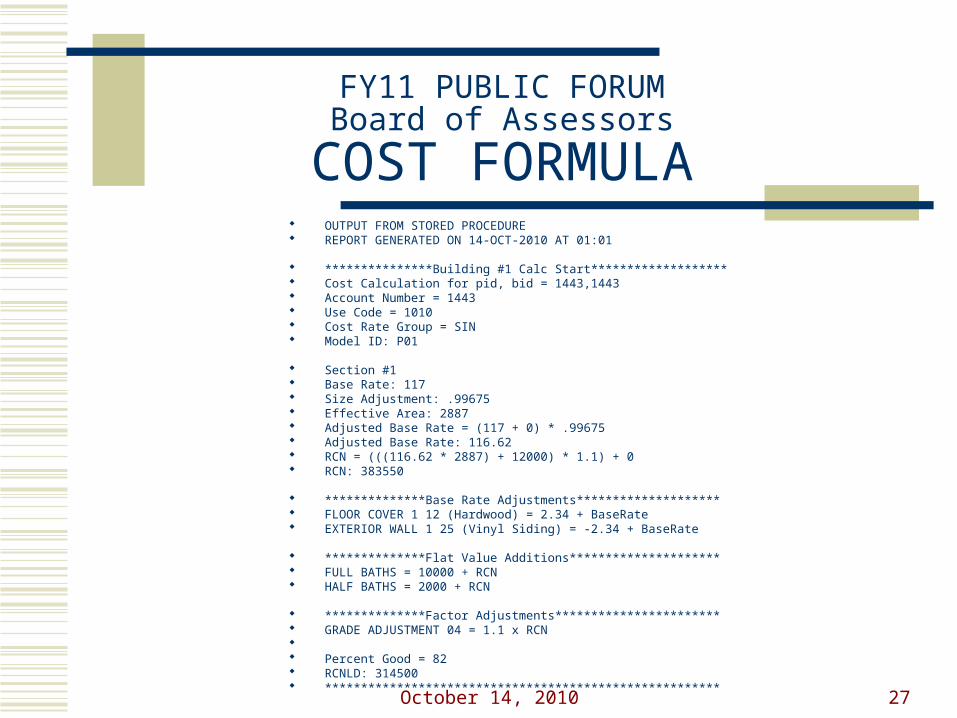
COST FORMULA OUTPUT FROM STORED PROCEDURE REPORT GENERATED ON 14-OCT-2010 AT 01:01
***************Building #1 Calc Start******************* Cost Calculation for pid, bid = 1443,1443 Account Number = 1443 Use Code = 1010 Cost Rate Group = SIN Model ID: P01
Section #1 Base Rate: 117 Size Adjustment: .99675 Effective Area: 2887 Adjusted Base Rate = (117 + 0) * .99675 Adjusted Base Rate: 116.62 RCN = (((116.62 * 2887) + 12000) * 1.1) + 0 RCN: 383550
**************Base Rate Adjustments******************** FLOOR COVER 1 12 (Hardwood) = 2.34 + BaseRate EXTERIOR WALL 1 25 (Vinyl Siding) = -2.34 + BaseRate
**************Flat Value Additions********************* FULL BATHS = 10000 + RCN HALF BATHS = 2000 + RCN
**************Factor Adjustments*********************** GRADE ADJUSTMENT 04 = 1.1 x RCN Percent Good = 82 RCNLD: 314500 *******************************************************
October 14, 2010 28
FY11 PUBLIC FORUMBoard of Assessors
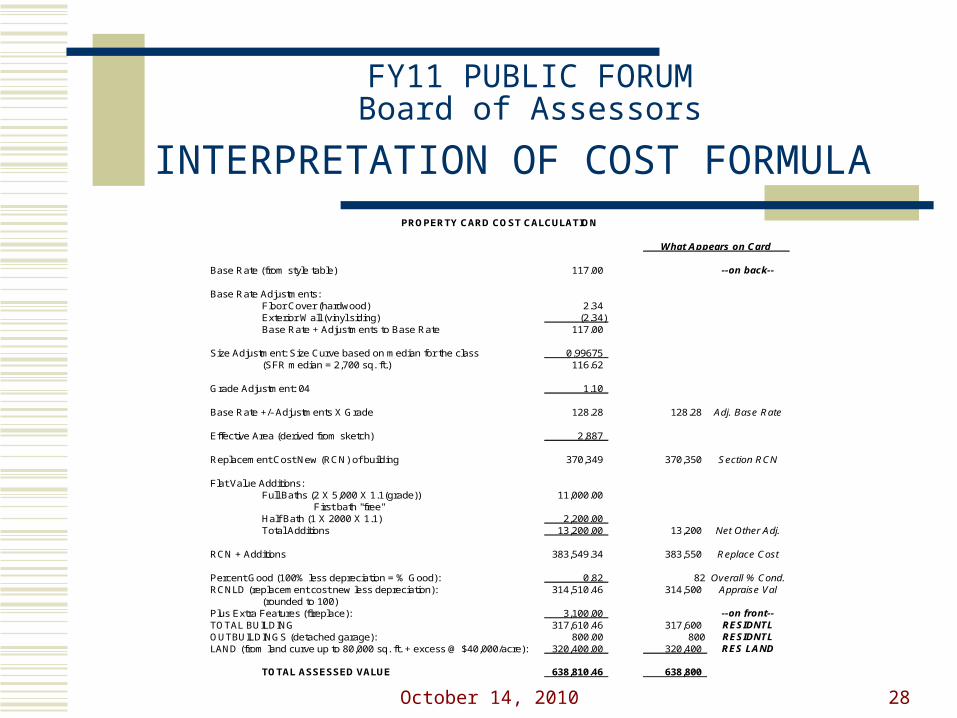
INTERPRETATION OF COST FORMULA PROPERTY CARD COST CALCULATION
What Appears on Card
Base Rate (from style table) 117.00 --on back--
Base Rate Adjustments:Floor Cover (hardwood) 2.34 Exterior Wall (vinyl siding) (2.34) Base Rate + Adjustments to Base Rate 117.00
Size Adjustment: Size Curve based on median for the class 0.99675 (SFR median = 2,700 sq. ft.) 116.62
Grade Adjustment: 04 1.10
Base Rate +/- Adjustments X Grade 128.28 128.28 Adj. Base Rate
Effective Area (derived from sketch) 2,887
Replacement Cost New (RCN) of building 370,349 370,350 Section RCN
Flat Value Additions:Full Baths (2 X 5,000 X 1.1(grade)) 11,000.00
First bath "free"Half Bath (1 X 2000 X 1.1) 2,200.00 Total Additions 13,200.00 13,200 Net Other Adj.
RCN + Additions 383,549.34 383,550 Replace Cost
Percent Good (100% less depreciation = % Good): 0.82 82 Overall % Cond.RCNLD (replacement cost new less depreciation): 314,510.46 314,500 Appraise Val
(rounded to 100)Plus Extra Features (fireplace): 3,100.00 --on front--TOTAL BUILDING 317,610.46 317,600 RESIDNTLOUTBUILDINGS (detached garage): 800.00 800 RESIDNTLLAND (from land curve up to 80,000 sq. ft. + excess @ $40,000/acre): 320,400.00 320,400 RES LAND
TOTAL ASSESSED VALUE 638,810.46 638,800
October 14, 2010 29
FY11 PUBLIC FORUMBoard of Assessors
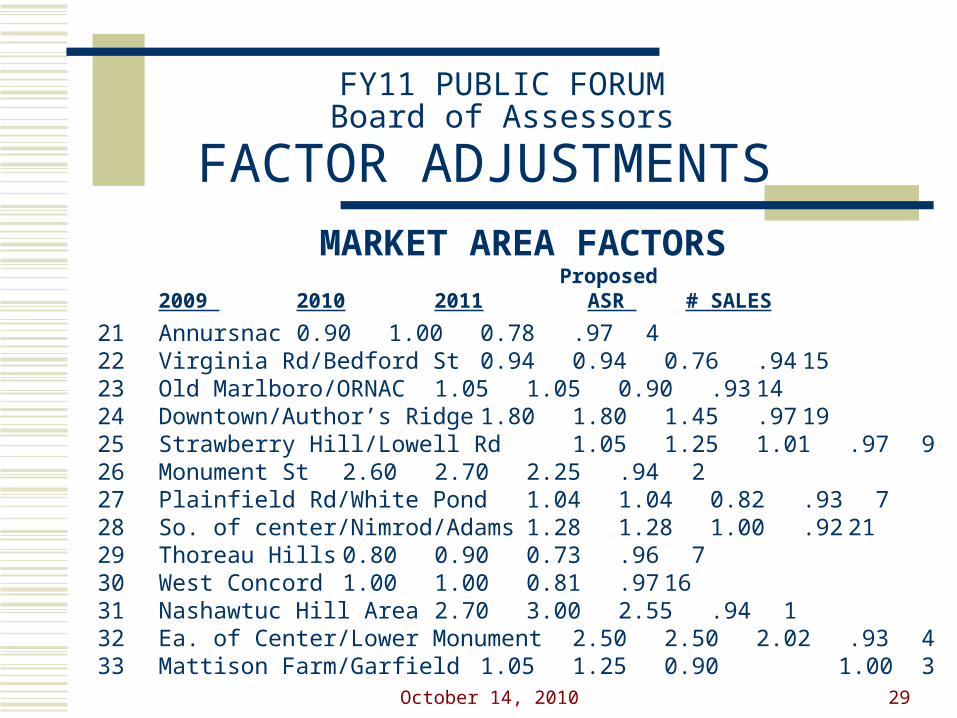
FACTOR ADJUSTMENTS MARKET AREA FACTORS
Proposed2009 2010 2011 ASR #
SALES
21 Annursnac 0.90 1.00 0.78 .97 422 Virginia Rd/Bedford St 0.94 0.94 0.76 .94 1523 Old Marlboro/ORNAC 1.05 1.05 0.90 .93 1424 Downtown/Author’s Ridge 1.80 1.80 1.45 .97 1925 Strawberry Hill/Lowell Rd 1.05 1.25 1.01 .97 926 Monument St 2.60 2.70 2.25 .94 227 Plainfield Rd/White Pond 1.04 1.04 0.82 .93 728 So. of center/Nimrod/Adams 1.28 1.28 1.00 .92 2129 Thoreau Hills 0.80 0.90 0.73 .96 730 West Concord 1.00 1.00 0.81 .97 1631 Nashawtuc Hill Area 2.70 3.00 2.55 .94 132 Ea. of Center/Lower Monument 2.50 2.50 2.02 .93 433 Mattison Farm/Garfield 1.05 1.25 0.90 1.00 3
October 14, 2010 30
FY11 PUBLIC FORUMBoard of Assessors
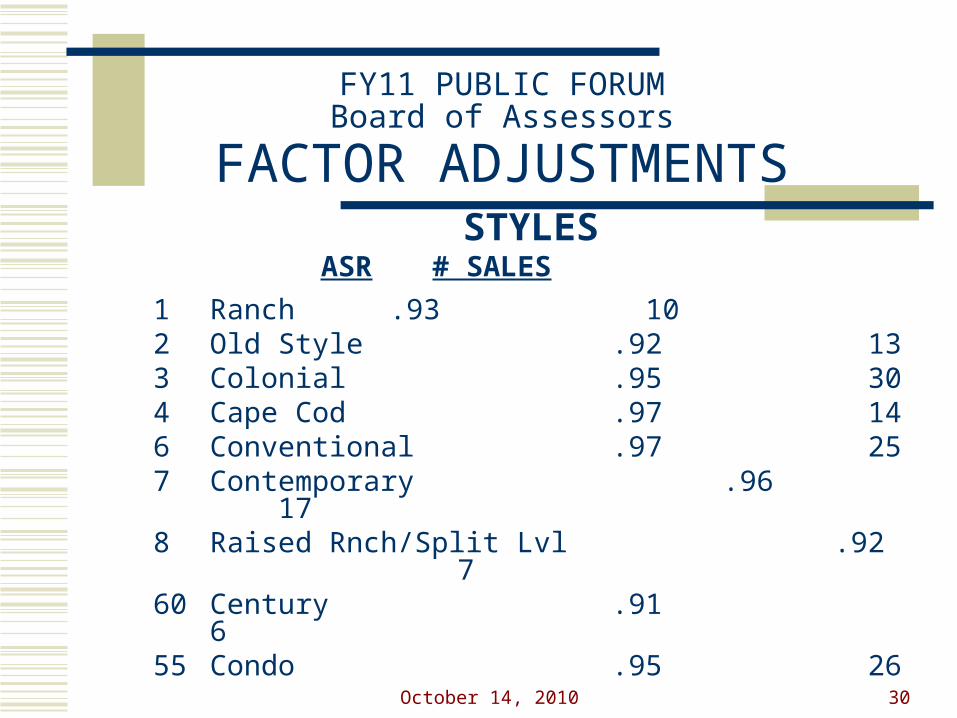
FACTOR ADJUSTMENTS STYLES
ASR# SALES
1 Ranch .93 102 Old Style .92 133 Colonial .95 304 Cape Cod .97 146 Conventional .97 257 Contemporary .96 178 Raised Rnch/Split Lvl .92 760 Century .91 655 Condo .95 26

October 14, 2010 31
FY11 PUBLIC FORUMBoard of Assessors
FACTOR ADJUSTMENTS STYLES
2009 2010 2011
1 Ranch $100 $ 90 $ 902 Old Style 153 142 1503 Colonial 125 117 1174 Cape Cod 118 110 1105 Bungalow 105 80 856 Conventional 143 140 1407 Contemporary 112 104 1048 Raised Ranch/Split Level 104 90 909 Family Flat, 2-Family 135 130 13010 3-Family 135 120 12060 Century 200 170 170100 Custom 200 170 17055 Condo 275 248 248
October 14, 2010 32
FY11 PUBLIC FORUMBoard of Assessors
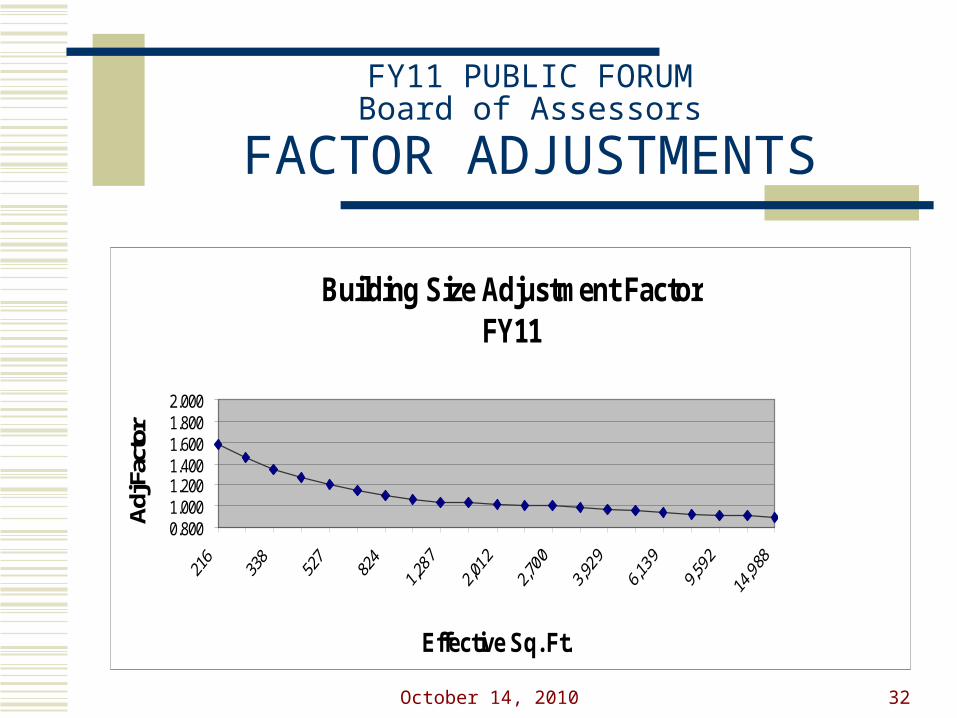
FACTOR ADJUSTMENTS
Building Size Adjustment FactorFY11
0.8001.0001.2001.4001.6001.8002.000
Effective Sq. Ft.
Adj
Fac
tor
October 14, 2010 33
FY11 PUBLIC FORUMBoard of Assessors
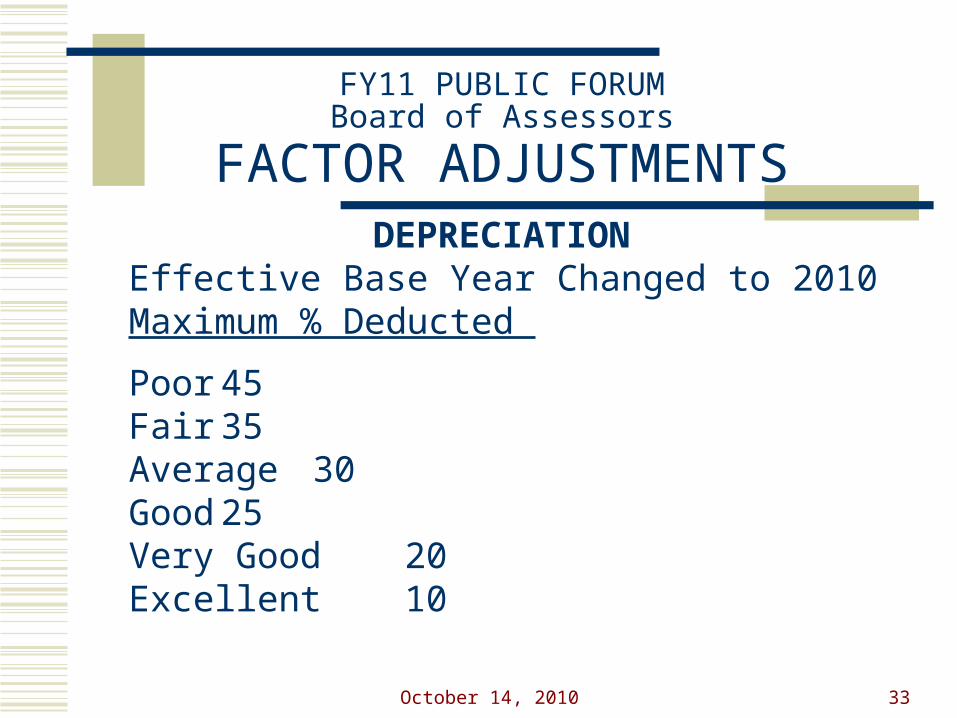
FACTOR ADJUSTMENTS DEPRECIATION
Effective Base Year Changed to 2010Maximum % Deducted
Poor 45Fair 35Average 30Good 25Very Good 20Excellent 10

October 14, 2010 34
FY11 PUBLIC FORUMBoard of Assessors
VALUATION vs. TAX BILL
FY10 FY11 (for
demonstration purposes only)
% Change
A. Total Property Value of Concord 5,026,552,229 5,041,730,741 0.003%
B. Total divided by 1,000 5,026,552 5,041,731
C. Tax Levy 65,797,569 66,525,315 0.011%
D. Tax Rate (Levy "C" Divided by "B") 13.09 13.20 0.009%
E. Example Property Value 950,000 952,850 0.003%