OCEAN–CLOUD–ATMOSPHERE– LAND …€¦ · along the Chilean and Peruvian coasts entering...
19
New focused measurements, analyses, and modeling of the southeast Pacific climate system are helping to improve our understanding of key atmospheric and oceanic processes and their interactions in the eastern tropical ocean regions. OCEAN–CLOUD–ATMOSPHERE– LAND INTERACTIONS IN THE SOUTHEASTERN PACIFIC The VOCALS Program BY C. R. MECHOSO, R. WOOD, R. WELLER, C. S. BRETHERTON, A. D. CLARKE, H. COE, C. FAIRALL, J. T. FARRAR, G. FEINGOLD, R. GARREAUD, C. GRADOS, J. MCWILLIAMS, S. P. DE SZOEKE, S. E. Y UTER, AND P. ZUIDEMA T he Variability of American Monsoon Systems (VAMOS) 1 Ocean–Cloud–Atmosphere–Land Study (VOCALS) is an international re- search program focused upon improved understanding and modeling of the southeast Pacific (SEP) climate system on diurnal to interannual time scales. The SEP is very important in many ways. The region produces nearly a fifth of the global fish catch (Sherman and Hempel 2008), and variations in its climate can have global reach through teleconnec- tions and aerosol indirect effects. The SEP is characterized by strong coastal ocean upwelling, the coldest sea surface temperatures (SSTs) at com- parable latitudes, the planet’s most extensive subtropical stratocumulus deck, and a high and steep cordillera to the east (Fig. 1). The regional climate is 1 VAMOS is a panel of the World Climate Research Programme (WCRP) Climate Variability and Predictability (CLIVAR). VOCALS researchers acknowledge the community that originated and nurtured the program. FIG. 1. The southeast Pacific climate system. 357 MARCH 2014 AMERICAN METEOROLOGICAL SOCIETY |
Transcript of OCEAN–CLOUD–ATMOSPHERE– LAND …€¦ · along the Chilean and Peruvian coasts entering...
New focused measurements, analyses, and modeling of the southeast Pacific climate system
are helping to improve our understanding of key atmospheric and oceanic processes and
their interactions in the eastern tropical ocean regions.
OCEAN–CLOUD–ATMOSPHERE–LAND INTERACTIONS IN THE
SOUTHEASTERN PACIFICThe VOCALS Program
by C. R. MeChoso, R. Wood, R. WelleR, C. s. bRetheRton, A. d. ClARke, h. Coe, C. FAiRAll, J. t. FARRAR, G. FeinGold, R. GARReAud, C. GRAdos, J. MCWilliAMs,
s. P. de szoeke, s. e. yuteR, And P. zuideMA
T h e Va r i a b i l i t y o f A m e r i c a n Monsoon Systems (VA MOS)1 Ocean–Cloud–Atmosphere–Land
Study (VOCALS) is an international re-search program focused upon improved understanding and modeling of the southeast Pacific (SEP) climate system on diurnal to interannual time scales. The SEP is very important in many ways. The region produces nearly a fifth of the global fish catch (Sherman and Hempel 2008), and variations in its climate can have global reach through teleconnec-tions and aerosol indirect effects.
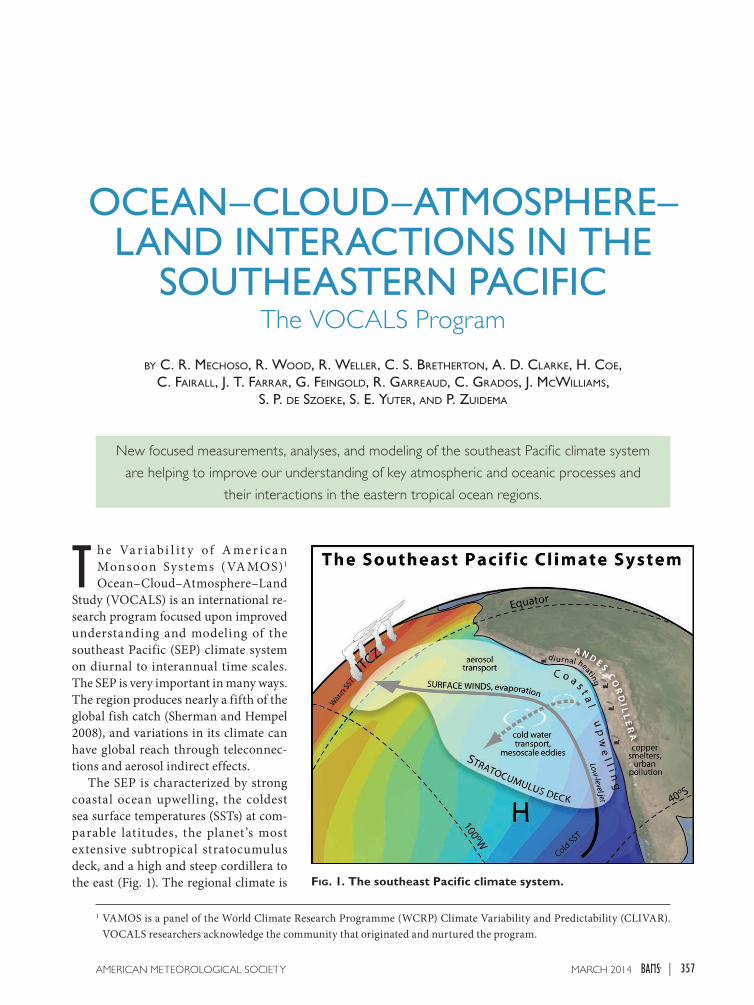
The SEP is characterized by strong coastal ocean upwelling, the coldest sea surface temperatures (SSTs) at com-parable latitudes, the planet’s most extensive subtropical stratocumulus deck, and a high and steep cordillera to the east (Fig. 1). The regional climate is
1 VAMOS is a panel of the World Climate Research Programme (WCRP) Climate Variability and Predictability (CLIVAR). VOCALS researchers acknowledge the community that originated and nurtured the program.
Fig. 1. The southeast Pacific climate system.
357MARCH 2014AMERICAN METEOROLOGICAL SOCIETY |
defined by strong interactions between the ocean, atmosphere, land, clouds, and aerosol particles, providing extraordinary challenges to numerical simulations and model-based predictions of climate variability and change. Extreme spatial contrasts in aerosol and cloud microphysical properties exist because of anthropogenic emissions of pollutants along the Chilean and Peruvian coasts entering otherwise extremely pristine air masses over the Pacific. A deeper and broader understanding of the physical–chemical processes that shape such a complex climate system is invaluable and will pro-vide guidance on how these processes may be better represented in numerical models. In the framework of the SEP climate, VOCALS has been addressing two fundamental objectives: 1) improved simulations with coupled atmosphere–ocean general circulation models (CGCMs), with an emphasis on reducing systematic errors in the region (Mechoso et al. 1995; Davey et al. 2001; de Szoeke and Xie 2008); and 2) im-proved estimates of the indirect effects of aerosols on low clouds and climate, with an emphasis on a more precise quantification of those effects (Lohmann and Feichter 2005; Quaas et al. 2009).
The VOCALS program is built on several research activities in SEP climate research (Mechoso and Wood 2010). The preceding Eastern Pacific Investi-gation of Climate Processes in the Coupled Ocean–Atmosphere System (EPIC) provided important insight on the intertropical convergence zone (ITCZ)/cold-tongue complex and marine boundary layer (MBL) clouds over the SEP (Bretherton et al. 2004). A unique dataset on the diurnal to interannual vari-ability of regional meteorology, clouds, and upper-ocean structure is available from an instrumented mooring installed at 20°S, 85°W by the Woods Hole Oceanographic Institution (WHOI) in October 2000
(called the WHOI buoy; Colbo and Weller 2007, 2009). A second mooring maintained by the Chilean Navy Hydrographic and Oceanographic Service (SHOA) close to (20°S, 75°W) with supplementary instrumentation by WHOI (called the SHOA buoy) has produced additional data. Annual buoy-tending cruises generate opportunities for shipborne atmo-spheric and ocean sampling (e.g., Tomlinson et al. 2007; Serpetzoglou et al. 2008; Zuidema et al. 2009; de Szoeke et al. 2010; and references therein). Other cruises and field campaigns organized in the region with invaluable participation from scientists from Chile and Peru keep providing major contributions to the knowledge of the coastal atmospheric and ocean circulations (e.g., the CIMAR-5 cruise; Garreaud et al. 2001; Painemal et al. 2010).
These activities have resulted in a substantial body of knowledge on the SEP clouds. Satellite data and the first cloud-focused research cruise over the SEP show that the clouds are typified by extremely strong gradients in the concentration of cloud drop-lets (Bretherton et al. 2004; Bennartz 2007) and that gradients could have major impacts on the radiative budget of the region. The existence of open cellular convection termed pockets of open cells (POCs) that frequently punctuate the stratocumulus deck in the SEP was known and documented (Stevens et al. 2005; Wood and Hartmann 2006). Furthermore, it was agreed that stratocumulus cloud albedo is sensitive to both natural and anthropogenic atmospheric aerosols (Twomey 1974, 1977), which are both produced in the SEP by desert dust, the ocean, copper smelters (Huneeus et al. 2006), and urban areas.
VOCALS is also built on an important body of modeling work on the SEP climate. Several studies have led to the wide recognition that clouds in the subsiding regions of the eastern tropical oceans
AFFILIATIONS: MeChoso And MCWilliAMs—Department of Atmospheric and Oceanic Sciences, University of California, Los Angeles, Los Angeles, California; Wood And bRetheRton—Department of Atmospheric Sciences, University of Washington, Seattle, Washington; WelleR And FARRAR—Department of Physical Oceanography, Woods Hole Oceanographic Institution, Woods Hole, Massachusetts; ClARke—Department of Oceanography, University of Hawai‘i at Mãnoa, Honolulu, Hawaii; Coe—School of Earth, Atmospheric and Environmental Sciences, University of Manchester, Manchester, United Kingdom; FAiRAll And FeinGold—NOAA/Earth System Research Laboratory, Boulder, Colorado; GARReAud—Department of Geophysics, and Center for Climate and Resilience Research, Universidad de Chile, Santiago, Chile; GRAdos—Instituto del Mar del Perú, Circuito-Callao, Peru; de szoeke—College of Earth, Ocean, and Atmospheric Sciences,
Oregon State University, Corvallis, Oregon; yuteR—Department of Marine, Earth and Atmospheric Sciences, North Carolina State University, Raleigh, North Carolina; zuideMA—Rosenstiel School of Marine and Atmospheric Science, University of Miami, Miami, FloridaCORRESPONDING AUTHOR: Carlos R. Mechoso, Department of Atmospheric and Oceanic Sciences, University of California, Los Angeles, 408 Hilgard Ave., Los Angeles, CA 90045E-mail: [email protected]
The abstract for this article can be found in this issue, following the table of contents.DOI:10.1175/BAMS-D-11-00246.1
In final form 11 July 2013©2014 American Meteorological Society
358 MARCH 2014|
drive uncertainty in climate sensitivity simulated by numerical models (e.g., Bony and Dufresne 2005). In the specific context of the eastern Pacific climate, modeling has shown that stratocumulus cloud decks are essential for key features, such as the asymmetry about the equator in SST and precipitation and an annual cycle dominated by the semiannual compo-nent (Philander et al. 1996; Ma et al. 1996; Yu and Mechoso 1999a,b; Zhang et al. 2005). Large-eddy simulation (LES) studies have demonstrated that low aerosol concentrations could promote open cell formation (Savic-Jovcic and Stevens 2008).
Despite such extensive background, major gaps and difficulties remained in the knowledge and simu-lation of the SEP climate. Most notably, analyses of the data coming from the WHOI buoy raised questions on the processes that balance the net positive heat flux into the ocean surface under the stratocumulus clouds (Colbo and Weller 2007). Systematic errors in the SEP of CGCMs of the type used in reports of the Intergovernmental Panel on Climate Change (IPCC) stood out as examples of shortcomings of those im-portant tools for climate studies (Mechoso et al. 1995). The SSTs simulated in the region were too warm by ~2–4 K and cloudiness was too low by ~50% (e.g., Ma et al. 1996). The regional information required for GCM validation and development to reduce these errors and hence improve quantification of Earth’s climate sensitivity was either unavailable or incom-plete. The SEP was perceived as a good test bed to examine and quantify key issues on the aerosol indi-rect effects (AIEs), such as the impacts of aerosols on precipitation and cloud mesoscale organization, the transport of continental aerosols to the remote ocean, and the processing of aerosols by clouds. Research on the AIEs in the context of the SEP was viewed as a way to reduce numerical models’ difficulties with these effects (Lohmann and Feichter 2005; Quaas et al. 2009). The knowledge of POCs was substantial but incomplete. The few in situ measurements of POCs prior to VOCALS had shown the association of POCs with strong drizzle (Van Zanten and Stevens 2005; Sharon et al. 2006; Comstock et al. 2005, 2007) and very low aerosol concentrations (Petters et al. 2006; Sharon et al. 2006; Wood et al. 2008), consistent with strong precipitation scavenging. These suggestions required further testing. Gaps and difficulties in the knowledge and simulation of the SEP climate such as those just listed motivated the VOCALS program.
The present paper describes VOCALS, outlines key scientific activities within the program, and highlights selected achievements. We start in the next section by describing the major research activities in
the program. The section “The coastal circulation” details the coastal circulations in the SEP. The section “The ocean heat budget” narrows down on issues associated with the ocean heat budget in the SEP. The section “Aerosol–cloud–precipitation interactions” highlights research on aerosol–cloud–precipitation interactions. The section “Modeling” discusses how regional and large-scale modeling is been applied to address VOCALS science questions. The section “Community capacity building” briefly presents some of the program’s contributions to community capacity building before a summary of science findings and a selection of remaining questions.
RESEARCH ACTIVITIES. VOCALS research has been organized around two sets of broad hypoth-eses on coupled ocean–atmosphere–land interac-tions and aerosol–cloud–precipitation (Wood et al. 2011a). Starting from the hypotheses, a verification strategy was designed to provide the strongest pos-sible synergy between long-term observations and monitoring, intensive field measurements, and mod-eling. The following subsections highlight activities in these three categories.
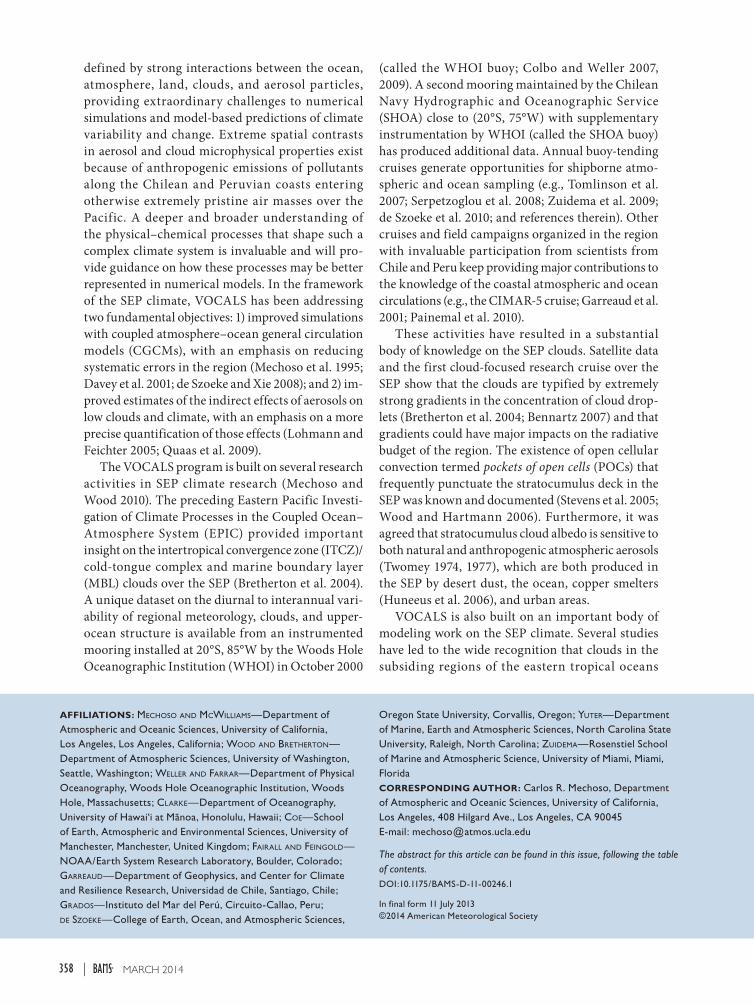
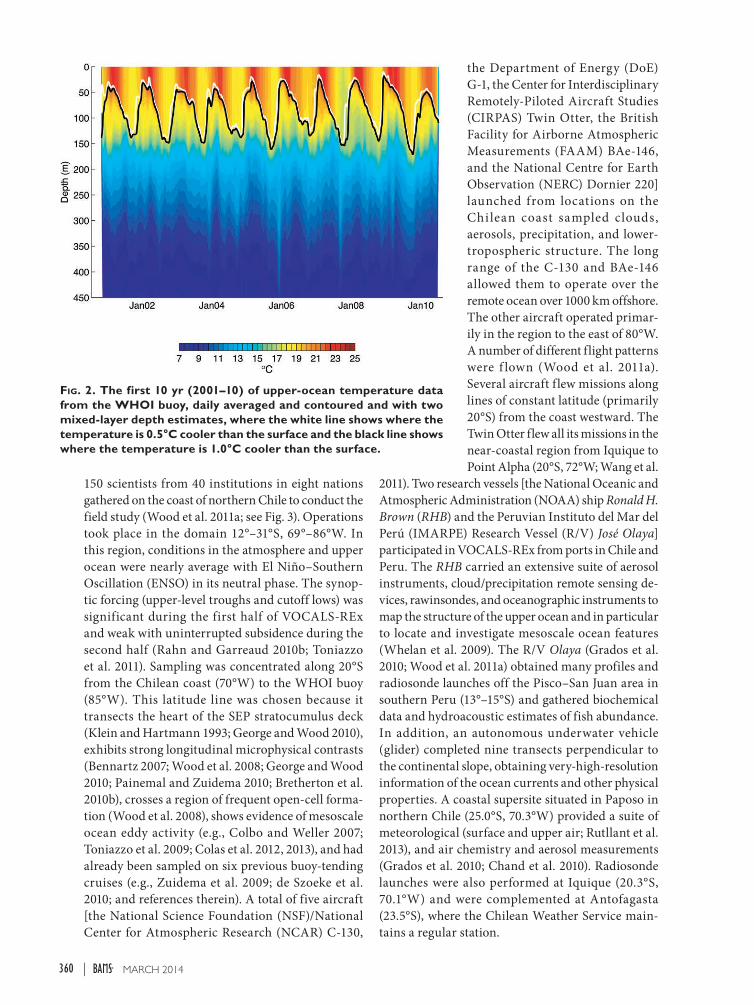
Monitoring: Surface f luxes and drivers over the SEP. Data collected by the WHOI buoy have allowed for the compilation of a surface climatology and air–sea fluxes during the period 2001–10. At the mooring loca-tion and in the annual mean, a remarkably consistent southeasterly wind of ~6 m s–1 drives latent heat fluxes exceeding 100 W m–2. Surface precipitation on the buoy’s rain gauge is negligible. The net annual-mean surface heat flux is ~35 W m–2 (positive values cor-responding to ocean warming), with values ranging from 21 (in 2009) to 60 W m–2 (in 2001). Wind speed, air temperature, SST, and shortwave radiation have marked annual cycles. The annual cycle of net surface heat flux is driven primarily by that in net shortwave radiation. The upper ocean responds to the surface forcing, with the warmest temperatures and shallowest surface mixed layers occurring in austral fall and the coolest temperatures and deepest mixed layer seen in early spring (Fig. 2). Salinity in the upper ocean also has a seasonal cycle with the shallow summer mixed layer becoming saltier in response to the evaporation. A layer of fresher water (the eastern South Pacific Intermediate Water; Schneider et al. 2003) lies at a depth of 150–250 m below the surface layer.
The f ield campaign: VOCALS-REx. The VOCALS Regional Experiment (VOCALS-REx) took place during October and November 2008, when some
359MARCH 2014AMERICAN METEOROLOGICAL SOCIETY |
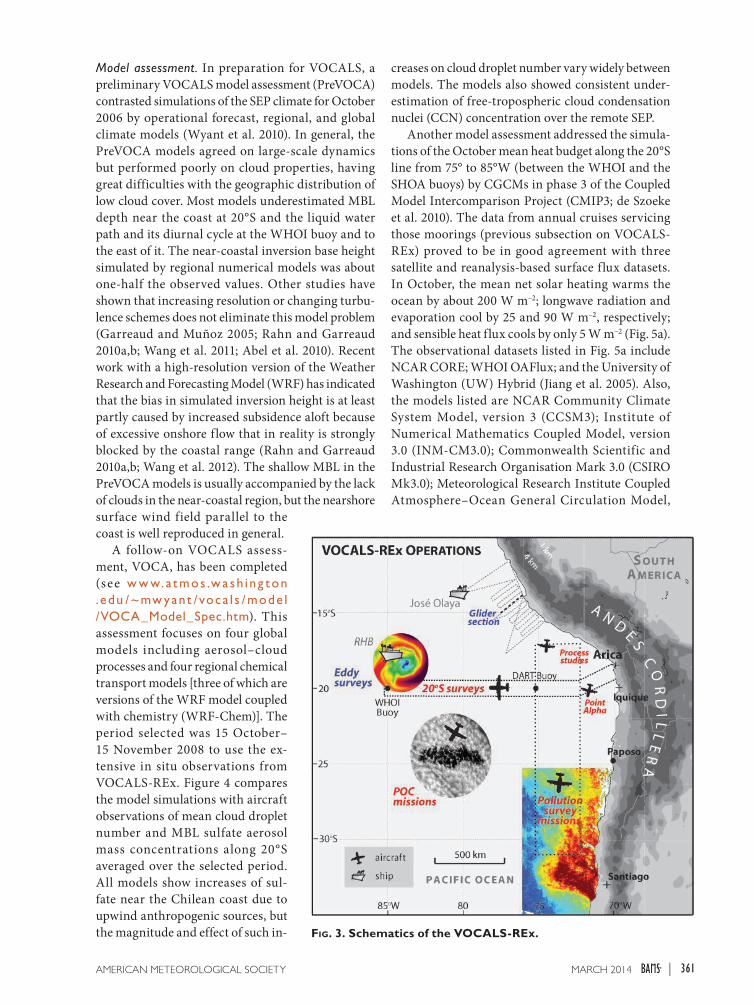
150 scientists from 40 institutions in eight nations gathered on the coast of northern Chile to conduct the field study (Wood et al. 2011a; see Fig. 3). Operations took place in the domain 12°–31°S, 69°–86°W. In this region, conditions in the atmosphere and upper ocean were nearly average with El Niño–Southern Oscillation (ENSO) in its neutral phase. The synop-tic forcing (upper-level troughs and cutoff lows) was significant during the first half of VOCALS-REx and weak with uninterrupted subsidence during the second half (Rahn and Garreaud 2010b; Toniazzo et al. 2011). Sampling was concentrated along 20°S from the Chilean coast (70°W) to the WHOI buoy (85°W). This latitude line was chosen because it transects the heart of the SEP stratocumulus deck (Klein and Hartmann 1993; George and Wood 2010), exhibits strong longitudinal microphysical contrasts (Bennartz 2007; Wood et al. 2008; George and Wood 2010; Painemal and Zuidema 2010; Bretherton et al. 2010b), crosses a region of frequent open-cell forma-tion (Wood et al. 2008), shows evidence of mesoscale ocean eddy activity (e.g., Colbo and Weller 2007; Toniazzo et al. 2009; Colas et al. 2012, 2013), and had already been sampled on six previous buoy-tending cruises (e.g., Zuidema et al. 2009; de Szoeke et al. 2010; and references therein). A total of five aircraft [the National Science Foundation (NSF)/National Center for Atmospheric Research (NCAR) C-130,
the Department of Energy (DoE) G-1, the Center for Interdisciplinary Remotely-Piloted Aircraft Studies (CIRPAS) Twin Otter, the British Facility for Airborne Atmospheric Measurements (FAAM) BAe-146, and the National Centre for Earth Observation (NERC) Dornier 220] launched from locations on the Chilean coast sampled clouds, aerosols, precipitation, and lower-tropospheric structure. The long range of the C-130 and BAe-146 allowed them to operate over the remote ocean over 1000 km offshore. The other aircraft operated primar-ily in the region to the east of 80°W. A number of different flight patterns were f lown (Wood et al. 2011a). Several aircraft flew missions along lines of constant latitude (primarily 20°S) from the coast westward. The Twin Otter flew all its missions in the near-coastal region from Iquique to Point Alpha (20°S, 72°W; Wang et al.
2011). Two research vessels [the National Oceanic and Atmospheric Administration (NOAA) ship Ronald H. Brown (RHB) and the Peruvian Instituto del Mar del Perú (IMARPE) Research Vessel (R/V) José Olaya] participated in VOCALS-REx from ports in Chile and Peru. The RHB carried an extensive suite of aerosol instruments, cloud/precipitation remote sensing de-vices, rawinsondes, and oceanographic instruments to map the structure of the upper ocean and in particular to locate and investigate mesoscale ocean features (Whelan et al. 2009). The R/V Olaya (Grados et al. 2010; Wood et al. 2011a) obtained many profiles and radiosonde launches off the Pisco–San Juan area in southern Peru (13°–15°S) and gathered biochemical data and hydroacoustic estimates of fish abundance. In addition, an autonomous underwater vehicle (glider) completed nine transects perpendicular to the continental slope, obtaining very-high-resolution information of the ocean currents and other physical properties. A coastal supersite situated in Paposo in northern Chile (25.0°S, 70.3°W) provided a suite of meteorological (surface and upper air; Rutllant et al. 2013), and air chemistry and aerosol measurements (Grados et al. 2010; Chand et al. 2010). Radiosonde launches were also performed at Iquique (20.3°S, 70.1°W) and were complemented at Antofagasta (23.5°S), where the Chilean Weather Service main-tains a regular station.
Fig. 2. The first 10 yr (2001–10) of upper-ocean temperature data from the WHOI buoy, daily averaged and contoured and with two mixed-layer depth estimates, where the white line shows where the temperature is 0.5°C cooler than the surface and the black line shows where the temperature is 1.0°C cooler than the surface.
360 MARCH 2014|
Model assessment. In preparation for VOCALS, a preliminary VOCALS model assessment (PreVOCA) contrasted simulations of the SEP climate for October 2006 by operational forecast, regional, and global climate models (Wyant et al. 2010). In general, the PreVOCA models agreed on large-scale dynamics but performed poorly on cloud properties, having great difficulties with the geographic distribution of low cloud cover. Most models underestimated MBL depth near the coast at 20°S and the liquid water path and its diurnal cycle at the WHOI buoy and to the east of it. The near-coastal inversion base height simulated by regional numerical models was about one-half the observed values. Other studies have shown that increasing resolution or changing turbu-lence schemes does not eliminate this model problem (Garreaud and Muñoz 2005; Rahn and Garreaud 2010a,b; Wang et al. 2011; Abel et al. 2010). Recent work with a high-resolution version of the Weather Research and Forecasting Model (WRF) has indicated that the bias in simulated inversion height is at least partly caused by increased subsidence aloft because of excessive onshore flow that in reality is strongly blocked by the coastal range (Rahn and Garreaud 2010a,b; Wang et al. 2012). The shallow MBL in the PreVOCA models is usually accompanied by the lack of clouds in the near-coastal region, but the nearshore surface wind field parallel to the coast is well reproduced in general.
A follow-on VOCALS assess-ment, VOCA, has been completed (see w w w. a tmos .wa sh ing ton .edu / ~mw yant / voca l s /mode l /VOCA_Model_Spec.htm). This assessment focuses on four global models including aerosol–cloud processes and four regional chemical transport models [three of which are versions of the WRF model coupled with chemistry (WRF-Chem)]. The period selected was 15 October– 15 November 2008 to use the ex-tensive in situ observations from VOCALS-REx. Figure 4 compares the model simulations with aircraft observations of mean cloud droplet number and MBL sulfate aerosol mass concentrations along 20°S averaged over the selected period. All models show increases of sul-fate near the Chilean coast due to upwind anthropogenic sources, but the magnitude and effect of such in-
creases on cloud droplet number vary widely between models. The models also showed consistent under-estimation of free-tropospheric cloud condensation nuclei (CCN) concentration over the remote SEP.
Another model assessment addressed the simula-tions of the October mean heat budget along the 20°S line from 75° to 85°W (between the WHOI and the SHOA buoys) by CGCMs in phase 3 of the Coupled Model Intercomparison Project (CMIP3; de Szoeke et al. 2010). The data from annual cruises servicing those moorings (previous subsection on VOCALS-REx) proved to be in good agreement with three satellite and reanalysis-based surface flux datasets. In October, the mean net solar heating warms the ocean by about 200 W m–2; longwave radiation and evaporation cool by 25 and 90 W m–2, respectively; and sensible heat flux cools by only 5 W m–2 (Fig. 5a). The observational datasets listed in Fig. 5a include NCAR CORE; WHOI OAFlux; and the University of Washington (UW) Hybrid (Jiang et al. 2005). Also, the models listed are NCAR Community Climate System Model, version 3 (CCSM3); Institute of Numerical Mathematics Coupled Model, version 3.0 (INM-CM3.0); Commonwealth Scientific and Industrial Research Organisation Mark 3.0 (CSIRO Mk3.0); Meteorological Research Institute Coupled Atmosphere–Ocean General Circulation Model,
Fig. 3. Schematics of the VOCALS-REx.
361MARCH 2014AMERICAN METEOROLOGICAL SOCIETY |

version 2.3.2a (MRI CGCM2.3.2a); Geophysical Fluid Dynamics Laboratory Climate Model, version 2.1 (GFDL CM2.1); Met Office Hadley Centre Coupled Model, version 3 (UKMO HadCM3); Institute of Atmospheric Physics Flexible Global Ocean–Atmosphere–Land System Model gridpoint, version 1.0 (IAP FGOALS-g1.0); NCAR Parallel Climate Model, version 1 (PCM1), Geophysical Fluid Dynamics Laboratory Climate Model, version 2.0 (GFDL CM2.0), Model for Interdisciplinary Research on Climate, version 3.2 (high resolution) [MIROC3.2 (hires)], Centre National de Recherches Météorologiques Coupled Global Climate Model,
version 3 (CNRM-CM3), Model for Interdisciplinary Research on Climate, version 3.2 (medium resolution)[MIROC3.2 (medres]; Canadian Centre for climate Modelling and Analysis (CCCma) Coupled Global climate Model, version 3.1 (CGCM3.1); L’Institute Pierre-Simon Laplace coupled Model, version 4 (IPSL-CM4); and Max Planck Institute ECHAM 5 (MPI ECHAM5)(de Szoeke et al. 2010). A residual cooling of some 30 W m–2 must be provided to a ~50-m-thick ocean mixed layer to limit the sea-sonal SST warming to the observed value of ~0.7° K
Fig. 4. (a) Model mean cloud droplet number concen-tration along 20°S compared with C-130 aircraft in-cloud measurements during VOCALS. (b) Comparison of C-130 and BAe-146 aircraft-measured boundary layer sulfate aerosol mass with model boundary layer–mean values. The models include the NCAR CAM, version 5 (CAM5); the NOAA/ GFDL Atmo-spheric Model, version 3 (AM3; Donner et al. 2011); the European Centre for Medium-Range Weather Fore-casts (ECMWF) Monitoring Atmospheric Composition and Climate (MACC) model; the Met Office (UKMO) Unif ied Model (MetUM; Davies et al. 2005); the International Pacific Research Center (IPRC) Regional Atmospheric Model, version 1.2 (iRAM 1.2; Lauer et al. 2009); and various configurations of the WRF-Chem model from the Pacific Northwest National Labora-tory (PNNL; Q. Yang et al. 2011), The University of Iowa (UIOWA; Saide et al. 2012a), and the University of Washington (UW; similar to George et al. 2013).
Fig. 5. (a) October mean components of the surface heat budget in CGCMs participating in CMIP3 aver-aged over a 5° latitude band centered on 20°S and from 75° to 85°W. Also shown are reanalysis products and ship observations [NOAA (www.esrl.noaa.gov/psd/) Physical Sciences Division (PSD)]. The observational products (in bold and bold italic font) and models are organized from left to right according to solar flux. The storage term assumes a mixed-layer depth of 50 m. (b) Surface cloud forcing (W m–2) as a function of cloud fraction averaged over the same domain for observa-tional products and models. ISCCP FD = International Satellite Cloud Climatology Project flux data dataset.
362 MARCH 2014|

month–1. Some 10 W m–2 of solar radiation is esti-mated to penetrate the 50-m mixed layer. The ocean must provide 20 W m–2 cooling, therefore, to balance its heat budget. All CGCMs analyzed have at least 30 W m–2 too much solar warming, of which about half is compensated by increased longwave cooling (Fig. 5b). The lateral ocean cooling found as a residual varies among models but is usually underestimated and can even have the wrong sign.
THE COASTAL CIRCULATION. Winds, MBL structure, ocean upwelling, and mesoscale eddies. The data collected by the R/V Olaya reveal a great deal of alongshore variability of the near-surface wind field with local maxima just to the north of major head-lands and minima farther downstream (e.g., Rahn et al. 2011). Along the coast for more than 700 km between Arica (18°S) and Paposo (25°S), the seasonal mean height of the MBL inversion is remarkably uniform at about 1000 m above mean sea level, which is the approximate elevation of the coastal range, although SST cools gradually from north to south (Rahn and Garreaud 2010a). The inversion height remains around this altitude at least up to 200 km offshore. In the near-coastal zone the MBL tends to be cloud capped and well mixed, with the maximum inversion strength about 100–200 km off the coast.
Synoptic-scale disturbances (upper-level troughs and cutoff lows) propagating from midlatitudes into the subtropics can intermittently lower the height of the coastal MBL down to 700 m (Rutllant et al. 2013) in northern Chile and also offshore (Rahn and Garreaud 2010b; Toniazzo et al. 2011). This is associated with more polluted air but also thinner coastal clouds, which limits the overall radiative impact of the
increased pollution (Painemal and Zuidema 2010; George and Wood 2010; Twohy et al. 2013).
The coastal ocean along the Chilean and Peruvian coasts is characterized by upwelling that drives ocean biological productivity and is a key source region for mesoscale ocean eddies (Grados et al. 2010; Garreaud et al. 2011). The surface alongshore ocean circulation in the northern boundary of the most intense upwelling cell of Peru—the Pisco–San Juan upwelling—was stud-ied at a weekly frequency during VOCALS-REx with a Slocum glider. A glider measured temperature, salinity, fluorescence and oxygen at a high spatial resolution (2 km) along a ~100-km cross-shore section near 14°S. Using the drift of the glider between two dives and temperature–salinity profiles for thermal wind allowed for estimates of the absolute geostrophic current over a 200-m-deep surface layer (Fig. 6). The offshore surface equatorward jet and nearshore subsurface poleward undercurrent display a high variability at weekly time scales. These measurements have provided invalu-able insight on the submesoscale upwelling dynamics responsible for the subsurface cross-isopycnal salinity intrusions (Pietri et al. 2013).
Chaigneau et al. (2011) used Argo float profiles and satellite altimetry data to estimate the mean ver-tical structure of mesoscale eddies in the Peru–Chile Current system. Their estimates are consistent with the core of cyclonic eddies being centered at ~150-m depth and that of the anticyclonic eddies below the thermocline at ~400-m depth. They also argued that each cyclonic and anticyclonic eddy yields to a heat and salt transport anomaly of ±1–3 × 10¹¹ W and ±3–8 × 10³ kg s–1, respectively. These eddies propagate westward across the area of the VOCALS region, con-tribute the dominant signal in oceanic velocities at the
WHOI buoy, and influence biology (Chelton et al. 2011).
Diurnal cycle of cloud and precipitation over the SEP. Ship observations capture diurnal cycles of cloud f rac t ion, l iqu id water pat h , t her mody na m ic decoupling between the surface and cloud, and precipitation (de Szoeke et al. 2012; Burleyson et al. 2013). Cloud fraction, cloud thickness, l iquid water path, and precipitation in-crease at night when solar warming of the cloud top
Fig. 6. Alongshore absolute geostrophic velocity [m s–1; near the Peru shelf (l4°S) in 2008]: (a) 4–8 Oct, (b) 18–22 Oct, and (c) 3–8 Nov. See Pietri et al. (2013) for more details on the data.
363MARCH 2014AMERICAN METEOROLOGICAL SOCIETY |

ceases but longwave cooling continues (see Fig. 7). The displacement between cloud base and lifting condensation level (LCL) of air at the surface is a thermodynamic proxy for turbulent decoupling and suppressed mixing between the surface layer and the cloud. Cloud base–LCL displacement grows during the day, but the cloud rapidly recouples to the surface layer at night. Cloud fraction is reduced during the day as the cloud rises and entrains dry air, while moisture flux from the surface layer to the cloud is suppressed through the stable subcloud boundary layer. Precipitation averaged over the MBL length has a diurnal maximum in the early morning. West of 80°W, the precipitation begins to decrease before the sun rises, raising the possibility that precipita-tion limits itself in the region. Subcloud evaporative cooling of rain may establish a local stable layer suf-ficient to reduce the precipitation. Decoupling and precipitation are stronger and have stronger diurnal cycles in the mean west of 80°W than east of 80°W.
The cloud properties over the SEP show significant semidiurnal and diurnal components with especially strong amplitude close to the Peruvian and Chilean coastline in October, reaching locations over 1500 km offshore (Garreaud and Muñoz 2004; O’Dell et al. 2008; Wood et al. 2009; Zuidema et al. 2009; Rahn and Garreaud, 2010a, de Szoeke et al. 2012). Toniazzo et al. (2011) examined the diurnal variability over the SEP on the basis of simulations with WRF. A deep wave with a 24-h period is generated over the Peruvian orography and moves southwestward, while a weaker and shallower wave with a significant semidiurnal component propagates westward from the Chilean orography. These waves are primarily confined to the lower troposphere, and their impact on the inversion at the top of the MBL is substantial within ~500 km away from the coast. As perturbations move toward the open ocean, the remotely generated downwelling and upwelling waves can be either in phase, out of phase, or
phase lagged with respect to variations locally forced by solar radiation. Since the waves gradually disperse or dissipate while propagating, a clear semidiurnal signal appears only near coastal regions.
THE OCEAN HEAT BUDGET. The essential question in the oceanic heat budget is how a surface ocean heated by air–sea exchange can remain cool enough to sustain the wide stratus cloud deck. In a vertical integral in the ocean depth, this requires a lateral supply of cool water or, equivalently, an export of warm water. Colbo and Weller (2007) using the WHOI buoy data estimated indicate that the mean ocean circulation, including geostrophic and Ekman transport, was insufficient to provide the required lateral flux of cold water. Addressing these issues has been one of VOCALS main concerns.
Numerical modeling has provided new insight on the oceanic heat budget (J. Zheng et al. 2011). Toniazzo et al. (2009) examined heat transport by ocean eddies away from the coast by using the High-Resolution Global Environmental Model (HiGEM), a CGCM with relatively high resolution in the global ocean (1/3° × 1/3°). In the SEP, HiGEM simulates significant contributions to the long-term mean heat budget of the water column from heat advection by ocean transients with length scales of 200–450 km and time scales between 4 months and 1 year. At least part of the heat advection is due to transients associated with an intrusion of freshwater from higher latitudes along the east Pacific coast. This contribution is highly variable both in space and time, and its mean magnitude at the location of the WHOI buoy is consistent with the estimate by Colbo and Weller (2007). The contribution of transients farther out at 85°W is unclear and can be of either sign in the ocean interior (see also Zheng et al. 2010).
Colas et al. (2012, 2013) addressed the ocean budget problem in the vicinity of the coastal current
Fig. 7. Schematic of the diurnal cycle of cloud and precipitation over the SEP.
364 MARCH 2014|

system using a regional eddy-resolving ocean model (7.5 km × 7.5 km). The results showed an important component of the lateral heat f lux by mesoscale eddies in the pycnocline. This heat flux is primarily shoreward and upward, providing a conduit between the warmer offshore waters and the cooler coastal waters caused by wind-driven upwelling. Colas et al. (2012) also found that cyclonic vortices tend to domi-nate the surface field, whereas anticyclonic vortices dominate the subsurface. The undercurrent sheds coherent subsurface anticyclones with warm and salty cores, in agreement with the observational results of Chaigneau et al. (2011). The offshore vertical heat bal-ance is then completed by an exchange between the surface and pycnocline. In the results of Colas et al. (2013), a significant part of this is the submesoscale restratification buoyancy and heat flux in a shallow cell of eddy-induced circulation within the surface boundary layer and upper pycnocline.
Some controversy remains in the understanding of the vertical heat f luxes in the upper ocean and their role on the SST. Another possible contributor is diabatic transport by near-inertial wave motions. This has yet to be determined, and a better understanding of their effects may require long time series of upper-ocean measurements. A recent analysis with additional observations by Holte et al. (2013) has sug-gested that the eddies do not substantially contribute to cooling the surface layer of the SEP.
AEROSOL – CLOUD – PRECIPITATION INTERACTIONS. One of VOCALS central goals is the better understanding of interactions between clouds, aerosols, and precipitation. VOCALS-REx ob-servations were collected to address factors controlling precipitation and POC formation, how anthropogenic pollution is transported to the MBL and affects cloud microphysics, and the role played by precipitation in removing aerosol particles from the atmosphere. This section highlights a few of the new findings.
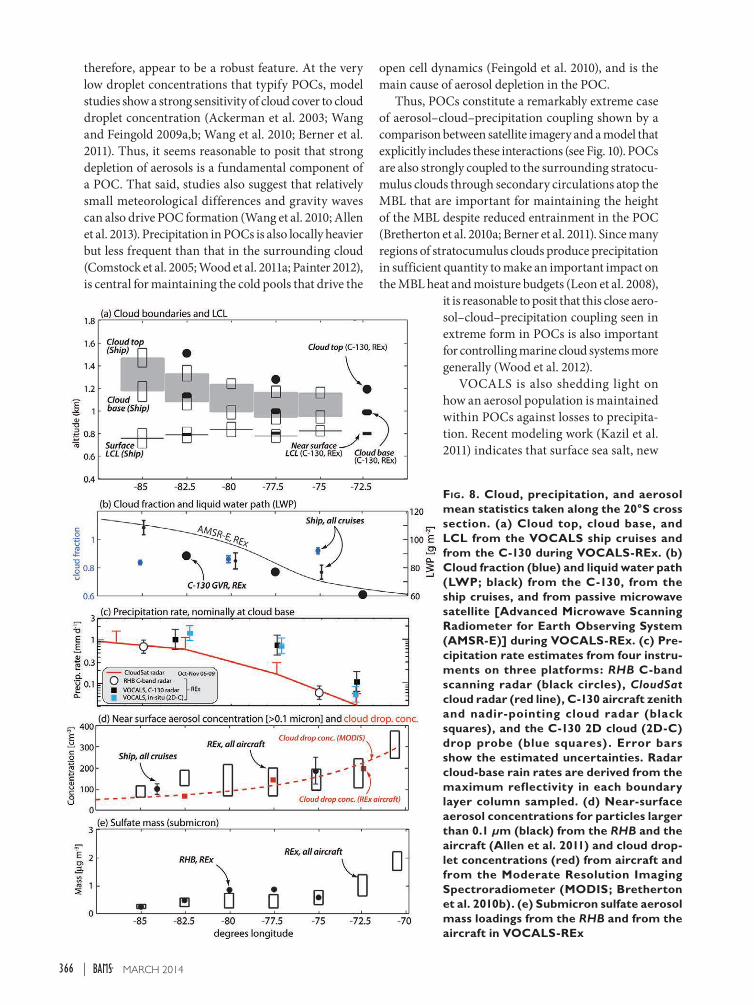
Structure of a stratocumulus region: Clouds, MBL structure, and aerosols along 20°S. The 20°S syn-thesis constructed using data from the five aircraft and the RHB participating in VOCALS-REx (see Fig. 8) provides insight into the processes controlling stratocumulus variability on regional and synoptic scales (Bretherton et al. 2010b; Allen et al. 2011; Zuidema et al. 2012), and is being used to test climate models (subsection on model development in the “Modeling” section). Cloud top, situated immediately beneath a strong inversion, rises sharply from the coast offshore (Fig. 8a). (Here data from the seven
research cruises in the VOCALS region were used to build a climatology.) A concomitant rise in cloud base means that about one-half of the clouds sampled were considered decoupled from the surface (Jones et al. 2011). Low cloud cover remains above 80% over the entire transect, but the amount of condensate almost doubles offshore (Fig. 8b) because cloud thickness increases. This helps to drive stronger precipitation offshore (Fig. 8c). Reduced cloud droplet concentra-tions due to lower aerosol concentrations offshore (Fig. 8d) act also likely to increase the offshore precipitation gradient (Terai et al. 2012), but studies with cloud-resolving models (CRMs) suggest that cloud-top height may have a stronger control on precipitation than aerosols (Mechem et al. 2012). Along 20°S the submicron aerosol is dominated by sulfates (Fig. 8e), with organic species accounting for less than 30% of the aerosol mass (Hawkins et al. 2010; Allen et al. 2011) and even less in the less pol-luted air masses over the remote ocean (Shank et al. 2012). The increased sulfate loading near the coast is driven by anthropogenic pollutants primarily from the Santiago megacity and secondarily from smelters (Yang et al. 2011; Saide et al. 2012a; Twohy et al. 2013) rather than by enhanced dimethyl sulfide (DMS) near the coast. On the other hand, DMS is the primary source in the sulfate mass budget over the remote ocean west of 80°W (M. Yang et al. 2011). The increase in near-coastal cloud droplet number concentrations attributed to activated sulfate particles increases their cloud brightness or albedo significantly for the same cloud liquid water path, which is known as the first or Twomey aerosol indirect effect (Painemal and Zuidema 2013; Q. Yang et al. 2011). However, because the polluted near-coastal clouds are also thinner, the overall top-of-atmosphere reflected shortwave radiation decreases, rather than increases, when near-coastal aerosol loading increases (Painemal and Zuidema 2010; Twohy et al. 2013). Figure 9 summa-rizes the key aerosol, cloud, and precipitation changes from the coast to the remote ocean along 20°S.
Pockets of open cells: Extreme coupling between clouds, aerosols, and precipitation. Flights were dedicated during VOCALS-REx to study the spatial transition between POCs and overcast stratocumulus and the relative influence of aerosols and meteorology on POC formation. The RHB also sampled POCs (Waliser et al. 2012) during VOCALS-REx. All of the POCs sampled showed strong microphysical gradients across the boundaries (Painter 2012) and ultraclean layers (Wood et al. 2011b) near the MBL top. The microphysical contrasts between POCs and the surrounding cloud,
365MARCH 2014AMERICAN METEOROLOGICAL SOCIETY |
therefore, appear to be a robust feature. At the very low droplet concentrations that typify POCs, model studies show a strong sensitivity of cloud cover to cloud droplet concentration (Ackerman et al. 2003; Wang and Feingold 2009a,b; Wang et al. 2010; Berner et al. 2011). Thus, it seems reasonable to posit that strong depletion of aerosols is a fundamental component of a POC. That said, studies also suggest that relatively small meteorological differences and gravity waves can also drive POC formation (Wang et al. 2010; Allen et al. 2013). Precipitation in POCs is also locally heavier but less frequent than that in the surrounding cloud (Comstock et al. 2005; Wood et al. 2011a; Painter 2012), is central for maintaining the cold pools that drive the
open cell dynamics (Feingold et al. 2010), and is the main cause of aerosol depletion in the POC.
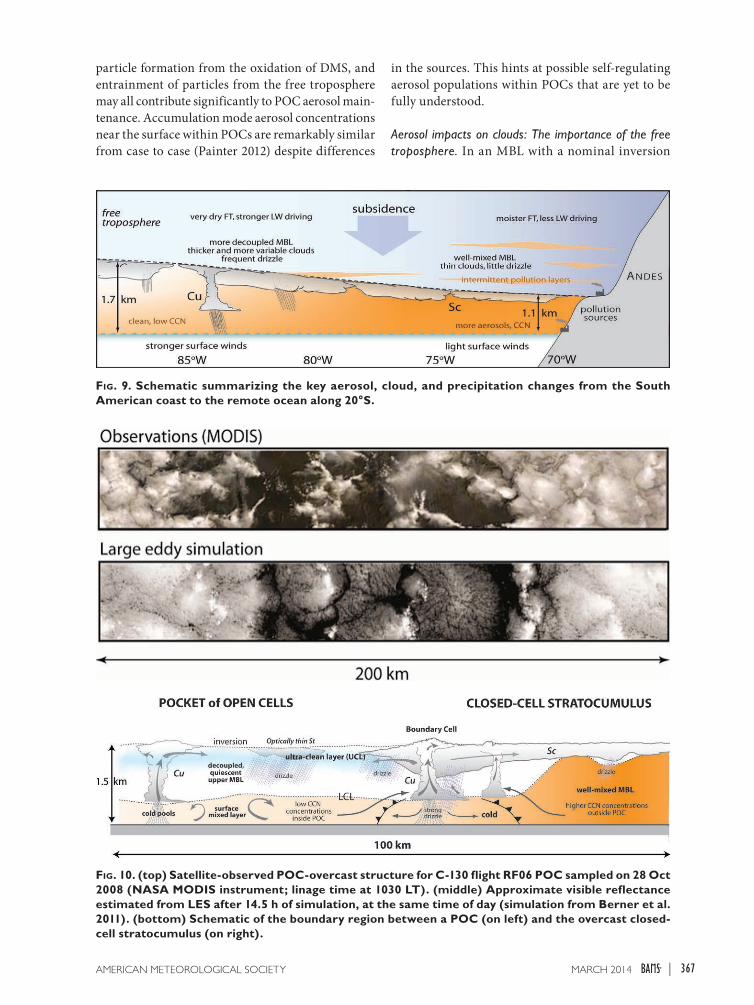
Thus, POCs constitute a remarkably extreme case of aerosol–cloud–precipitation coupling shown by a comparison between satellite imagery and a model that explicitly includes these interactions (see Fig. 10). POCs are also strongly coupled to the surrounding stratocu-mulus clouds through secondary circulations atop the MBL that are important for maintaining the height of the MBL despite reduced entrainment in the POC (Bretherton et al. 2010a; Berner et al. 2011). Since many regions of stratocumulus clouds produce precipitation in sufficient quantity to make an important impact on the MBL heat and moisture budgets (Leon et al. 2008),
it is reasonable to posit that this close aero-sol–cloud–precipitation coupling seen in extreme form in POCs is also important for controlling marine cloud systems more generally (Wood et al. 2012).
VOCALS is also shedding light on how an aerosol population is maintained within POCs against losses to precipita-tion. Recent modeling work (Kazil et al. 2011) indicates that surface sea salt, new
Fig. 8. Cloud, precipitation, and aerosol mean statistics taken along the 20°S cross section. (a) Cloud top, cloud base, and LCL from the VOCALS ship cruises and from the C-130 during VOCALS-REx. (b) Cloud fraction (blue) and liquid water path (LWP; black) from the C-130, from the ship cruises, and from passive microwave satellite [Advanced Microwave Scanning Radiometer for Earth Observing System (AMSR-E)] during VOCALS-REx. (c) Pre-cipitation rate estimates from four instru-ments on three platforms: RHB C-band scanning radar (black circles), CloudSat cloud radar (red line), C-130 aircraft zenith and nadir-pointing cloud radar (black squares), and the C-130 2D cloud (2D-C) drop probe (blue squares) . Error bars show the estimated uncertainties. Radar cloud-base rain rates are derived from the maximum reflectivity in each boundary layer column sampled. (d) Near-surface aerosol concentrations for particles larger than 0.1 µm (black) from the RHB and the aircraft (Allen et al. 2011) and cloud drop-let concentrations (red) from aircraft and from the Moderate Resolution Imaging Spectroradiometer (MODIS; Bretherton et al. 2010b). (e) Submicron sulfate aerosol mass loadings from the RHB and from the aircraft in VOCALS-REx
366 MARCH 2014|
particle formation from the oxidation of DMS, and entrainment of particles from the free troposphere may all contribute significantly to POC aerosol main-tenance. Accumulation mode aerosol concentrations near the surface within POCs are remarkably similar from case to case (Painter 2012) despite differences
in the sources. This hints at possible self-regulating aerosol populations within POCs that are yet to be fully understood.
Aerosol impacts on clouds: The importance of the free troposphere. In an MBL with a nominal inversion
Fig. 10. (top) Satellite-observed POC-overcast structure for C-130 flight RF06 POC sampled on 28 Oct 2008 (NASA MODIS instrument; linage time at 1030 LT). (middle) Approximate visible reflectance estimated from LES after 14.5 h of simulation, at the same time of day (simulation from Berner et al. 2011). (bottom) Schematic of the boundary region between a POC (on left) and the overcast closed-cell stratocumulus (on right).
Fig. 9. Schematic summarizing the key aerosol, cloud, and precipitation changes from the South American coast to the remote ocean along 20°S.
367MARCH 2014AMERICAN METEOROLOGICAL SOCIETY |
at 1-km height and cloud-top entrainment rates of 0.3–0.6 cm s–1 (Wood and Bretherton 2004; Caldwell et al. 2005), such as in the VOCALS region, CCN concentrations would be rapidly diluted if the free-troposphere (FT) air were particle free. FT air over the VOCALS region, however, contains aerosols that vary markedly in total aerosol number, size, and geographi-cal distribution, and can be entrained into the MBL.
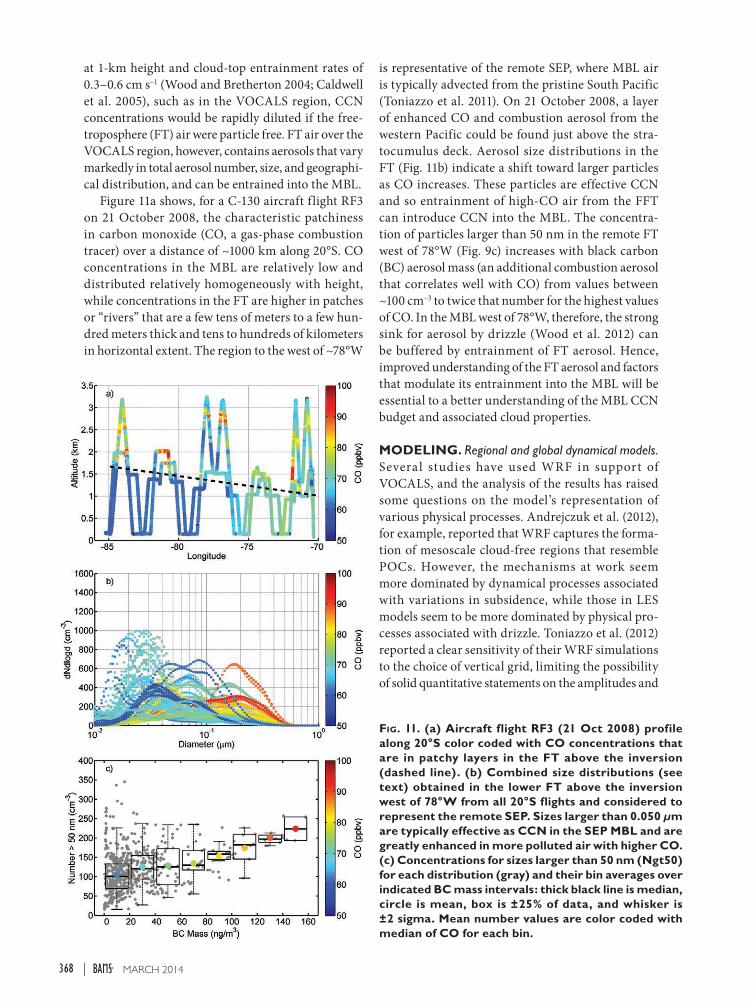
Figure 11a shows, for a C-130 aircraft flight RF3 on 21 October 2008, the characteristic patchiness in carbon monoxide (CO, a gas-phase combustion tracer) over a distance of ~1000 km along 20°S. CO concentrations in the MBL are relatively low and distributed relatively homogeneously with height, while concentrations in the FT are higher in patches or “rivers” that are a few tens of meters to a few hun-dred meters thick and tens to hundreds of kilometers in horizontal extent. The region to the west of ~78°W
is representative of the remote SEP, where MBL air is typically advected from the pristine South Pacific (Toniazzo et al. 2011). On 21 October 2008, a layer of enhanced CO and combustion aerosol from the western Pacific could be found just above the stra-tocumulus deck. Aerosol size distributions in the FT (Fig. 11b) indicate a shift toward larger particles as CO increases. These particles are effective CCN and so entrainment of high-CO air from the FFT can introduce CCN into the MBL. The concentra-tion of particles larger than 50 nm in the remote FT west of 78°W (Fig. 9c) increases with black carbon (BC) aerosol mass (an additional combustion aerosol that correlates well with CO) from values between ~100 cm–3 to twice that number for the highest values of CO. In the MBL west of 78°W, therefore, the strong sink for aerosol by drizzle (Wood et al. 2012) can be buffered by entrainment of FT aerosol. Hence, improved understanding of the FT aerosol and factors that modulate its entrainment into the MBL will be essential to a better understanding of the MBL CCN budget and associated cloud properties.
MODELING. Regional and global dynamical models. Several studies have used WRF in support of VOCALS, and the analysis of the results has raised some questions on the model’s representation of various physical processes. Andrejczuk et al. (2012), for example, reported that WRF captures the forma-tion of mesoscale cloud-free regions that resemble POCs. However, the mechanisms at work seem more dominated by dynamical processes associated with variations in subsidence, while those in LES models seem to be more dominated by physical pro-cesses associated with drizzle. Toniazzo et al. (2012) reported a clear sensitivity of their WRF simulations to the choice of vertical grid, limiting the possibility of solid quantitative statements on the amplitudes and
Fig. 11. (a) Aircraft flight RF3 (21 Oct 2008) profile along 20°S color coded with CO concentrations that are in patchy layers in the FT above the inversion (dashed line). (b) Combined size distributions (see text) obtained in the lower FT above the inversion west of 78°W from all 20°S flights and considered to represent the remote SEP. Sizes larger than 0.050 µm are typically effective as CCN in the SEP MBL and are greatly enhanced in more polluted air with higher CO. (c) Concentrations for sizes larger than 50 nm (Ngt50) for each distribution (gray) and their bin averages over indicated BC mass intervals: thick black line is median, circle is mean, box is ±25% of data, and whisker is ±2 sigma. Mean number values are color coded with median of CO for each bin.
368 MARCH 2014|
phases of the diurnal and semidiurnal components across the domain.
The association based on an analysis of in situ data between marine low cloud cover in the southeast Pacific and lower-tropospheric stability (LTS) proposed by Klein and Hartmann (1993) has been widely used in diagnostic studies as well as in parameterizations. Sun et al. (2011) showed that this relationship is strongly modulated by the seasonal cycle and by ENSO. Sun et al. (2010) demonstrated that errors in stratocu-mulus cover over the SEP in the National Centers for Environmental Prediction (NCEP) Global Forecast System (GFS) model can be alleviated by limiting the strength of shallow convective mixing across the inver-sion with algorithms based on the implementation of direct and physically based improvements in the model parameterizations. Abel et al. (2010) showed that in the remote maritime region the Met Office forecast model provides a good representation of synoptically induced variability in both cloud cover and MBL depth. The simulation of the diurnal cycle phase is also successful, but the coastal clearing of the cloud is missed in certain days. Drizzle is likely to be too strong, and POCs are not captured (see section “Aerosol–cloud–precipitation interactions”).
Regional modeling with integrated chemistry and aerosols. WRF-Chem couples dynamical, chemical, aerosol, and cloud processes and can be run at the re-gional scale (Grell et al. 2005; Fast et al. 2006). Studies with high-resolution WRF-Chem and other LESs are demonstrating that coupled cloud–aerosol–radiation processes are important for the successful simulation of SEP stratocumulus (Wang et al. 2010; Kazil et al. 2011). Q. Yang et al. (2011) used WRF-Chem to show that inclusion of full aerosol–cloud couplings leads to significant improvements in many key features of the simulated stratocumulus clouds (e.g., cloud-top effective radius, cloud water path, and cloud opti-cal thickness). The model is able to capture daily/synoptic-scale variations of aerosol and cloud prop-erties. Saide et al. (2012b) argued that WRF-Chem simulates marine cloud–aerosol interactions at a level sufficient for applications in forecasting weather and air quality and studying aerosol climate forcing and may do so with the reliability required for policy analysis. Both studies emphasize the importance of reproducing gradients of aerosol and cloud droplet concentrations that typify the SEP. Saide et al. (2012b), on the basis of the remarkably robust correspondence of satellite-derived cloud droplet concentrations to in situ VOCALS data (Painemal and Zuidema 2011; King et al. 2013; Min et al. 2012), are assimilating
satellite-observed cloud droplet concentration into WRF-Chem to better constrain aerosol properties below the clouds. WRF-Chem has also been used to provide the first model-based regional quantifica-tion over the SEP of the aerosol indirect effects on climate (Q. Yang et al. 2011) and to describe a free-tropospheric transport pathway for aerosol transport to the remote SEP (George et al. 2013).
Model development. Process-level understanding developed from VOCALS observations and large-eddy simulation modeling is being applied to improve physical parameterizations in global models. It can be said that VOCALS has contributed significantly to accelerate the improvement in the representation of MBL clouds in models at major centers around the world. For example, in situ cloud and drizzle observations from VOCALS-REx have been used to refine the microphysical parameterization in the Met Office Unified Model (Boutle and Abel 2012). One of the VOCALS case studies is being used in the World Meteorological Organization (WMO) Cloud Modeling program (http://slayoo.github.com /icmw2012-case1/) to examine how different models represent the processing of aerosols by clouds.
Observations from REx are a central component of two NSF/NOAA-sponsored Climate Process Teams (CPTs) that began in 2010. The CPTs bring together observational scientists, process modelers, and model developers in order to accelerate the rate at which field observational knowledge is translated into improved large-scale models. Both CPTs focus on cloud processes. One CPT, led by Vincent Larson at the University of Wisconsin–Milwaukee, concentrates on the improved representation of subgrid variability in the NCAR Community Atmospheric Model (CAM) and the GFDL Atmospheric Model based on the incorporation of a higher-order closure parameterization that accounts for the covariability of moisture, temperature, and vertical velocity. VOCALS-REx observations are being exploited in a number of different ways to evaluate the parameterization and the models into which it is being incorporated (Yamaguchi et al. 2013). A second CPT, led by Joao Teixeira at the National Aeronautics and Space Administration (NASA) Jet Propulsion Laboratory, aims to improve the representation of the stratocumulus-to-cumulus transition in the CAM and the NCEP Global Forecast System models.
COMMUNITY CAPACITY BUILDING. Many students participated in VOCALS-REx alongside seasoned scientists, both out at sea and in the air. Students served as flight scientists on many aircraft
369MARCH 2014AMERICAN METEOROLOGICAL SOCIETY |

missions and helped in mission planning and debrief-ing. These activities are leading to numerous doctoral theses and student-led publications in refereed jour-nals (e.g., Berner et al. 2011; George and Wood 2010; Hawkins et al. 2010; Jones et al. 2011; Painemal et al. 2010; Painemal and Zuidema 2011; Shank et al. 2012; Terai et al. 2012; X. Zheng et al. 2011).
VOCALS-REx participants also reached out to both English- and Spanish-speaking K–12 classrooms through the Windows to the Universe (W2U) project led by R. Johnson at NCAR. Within W2U, dozens of “postcards from the field” were sent describing research experiences to inspire the next generation of scientists. VOCALS also provided learning opportunities to K–12 students and teachers. NOAA’s Teacher at Sea Program permitted one teacher to participate in the RHB cruise.
SUMMARY OF FINDINGS AND REMAIN-ING QUESTIONS. VOCALS set very ambitious goals, and progress has been achieved on several fronts:
• VOCALS-REx produced a unique dataset, which is available to the research community through the VOCALS Data Archive (www.eol.ucar.edu /projects/vocals/). The data provide constraints on the representation of aerosol–chemistry–cloud interactions to be used in climate and chemical transport models.
• The WHOI buoy data are currently not used for model assimilation and so they represent a unique independent resource for model validation.
• The air–sea exchanges across the region at 20°S, from 85° to 75°W, are well described and are providing in situ data for model validation and improvement.
• It is firmly established that both mean advection and eddy advection contribute importantly to the heat budget of the ocean column in the SEP, though to varying degrees depending upon loca-tion along the coast and offshore distance.
• The existence of a daytime wave initiated by Andean slope heating that propagates over 1500 km offshore over the southeastern Pacific stratocumulus region was confirmed. The wave impacts clouds by strengthening the diurnal cycle, which reduces cloud albedo and increases nocturnal precipitation.
• Precipitation in POCs has a fundamentally distinct character from that in the surrounding cloud, with cold pools driving a reorganization of the meso-scale structure and dynamics. The interaction between these cold pools helps regenerate clouds.
• Strong depletion of aerosols driven by precipitation losses appears to be a fundamental component of a POC. Slow aerosol replenishment in the ultraclean POC environment permits the maintenance of open cells.
• Along 20°S, the submicron aerosol is dominated by sulfates. The increased sulfate loading near the coast is driven by anthropogenic pollutants pri-marily from the Santiago megacity and secondarily from smelters rather than by enhanced DMS near the coast. DMS is the primary source in the sulfate mass budget over the remote ocean west of 80°W.
• The first aerosol indirect effect has been observa-tionally quantified over the SEP, with cloud thin-ning of the more polluted coastal clouds mitigating the overall radiative impact. The effects were also quantified using a regional model.
• However, several issues and questions remain. The VOCALS community is actively engaged in research motivated by these questions.
• Some controversy remains in the understanding of the vertical heat transports by turbulence, submesoscale eddies, and possibly other processes and on the role of such processes in determining the SST in the SEP.
• The relative contributions of surface, entrainment, and nucleation aerosol sources to the aerosol budget in the remote MBL remains poorly understood.
• The frequency and climatic importance of POCs remains poorly characterized. The ability of anthropogenic pollutants to hinder the formation of POCs is also not yet known, with the implied significant increase in albedo important for geo-engineering (Rosenfeld et al. 2006).
The impetus on the research on VOCALS issues continues unabated. One year after VOCALS-REx—in late spring 2009—the Chilean Upwelling Experi-ment (CUpEx) in the nearshore region of 30°S focused on the ocean–atmosphere interaction in a major upwelling center off northern Chile (Garreaud et al. 2011). CUpEx included two radiosonde stations, sev-eral ground stations, buoys, and marine radars. This experiment has confirmed findings of VOCALS-REx in the coastal SEP and provided additional detailed information on coastal processes.
VOCALS is also motivating research in other major upwelling regions. Coupled GCMs suffer from common biases in the eastern Atlantic Ocean that resemble those in the Pacific. Observational research has an active history in the equatorial Atlantic also: for example, the Prediction and Research Moored Array in the Tropical Atlantic (PIRATA) buoy
370 MARCH 2014|
array and research cruises, aircraft campaigns, and the recent African Monsoon Multidisciplinary Analysis (AMMA) program. VOCALS and Atlantic researchers are planning joint activities under the U.S. CLIVAR Working Group on Eastern Tropical Ocean Synthesis (www.usclivar.org/working-groups /etos) with the ultimate goal of further reducing the SST biases of CGCMs using targeted process studies and model assessments.
ACKNOWLEDGMENTS. The authors are grateful to Casey D. Burleyson, Matt Wilbanks, Matt Wyant, Vincent Echevin, and Alice Pietri for their contributions to the man-uscript. Three anonymous reviewers provided constructive and useful comments. Kathleen Schiro carefully read the manuscript. Many people have contributed to VOCALS; we next attempt to recognize at least some of the key groups. The cooperation of the Chilean Navy Hydrographic and Oceanographic Service (SHOA) on work on the mooring at 75°W is gratefully acknowledged. VOCALS is grateful to the support staff, crew, and scientists of its six aircraft platforms (the NSF/NCAR C-130; the U.K. FAAM BAe-146; the DoE G-1; the CIRPAS Twin Otter; the U.K. NERC Dornier 228; and, in the 2010 CUpEx phase, the Chilean King Air), the two ships (the NOAA Ronald H. Brown and the Peruvian IMARPE José Olaya), and the land stations at Iquique and Paposo. José Meitin and colleagues at the NCAR Earth Observing Laboratory coordinated and executed field logistics and data archive support for VOCALS-REx. Mike Patterson at NOAA and currently at U.S. CLIVAR championed VOCALS during its development stages. W. Robinson at NSF, J. Huang at NOAA, and Howard Cattle and David Legler at CLIVAR's international and U.S. project offices, respectively, coordinated the U.S. agency support.
REFERENCESAbel, S. J., D. N. Walters, and G. Allen, 2010: Evaluation
of stratocumulus cloud prediction in the Met Office forecast model during VOCALS-REx. Atmos. Chem. Phys., 10, 10 541–10 559.
Ackerman, A. S., O. B. Toon, D. E. Stevens, and J. A. Coakley Jr., 2003: Enhancement of cloud cover and suppression of nocturnal drizzle in stratocumulus polluted by haze. Geophys. Res. Lett., 30, 1381, doi:10.1029/2002GL016634.
Allen, G., and Coauthors, 2011: South east Pacific atmo-spheric composition and variability sampled along 20°S during VOCALS-REx. Atmos. Chem. Phys., 11, 5237–5262, doi:10.5194/acp-11-5237-2011.
—, and Coauthors, 2013: Gravity-wave-induced per-turbations in marine stratocumulus. Quart. J. Roy. Meteor. Soc., 139, 32–45, doi:10.1002/qj.1952.
Andrejczuk, M., W. W. Grabowski, A. Gadian, and R. Burton, 2012: Limited-area modelling of strato-cumulus over south-eastern Pacific. Atmos. Chem. Phys., 12, 3511–3526.
Bennartz, R., 2007: Global assessment of marine boundary layer cloud droplet number concentra-tion from satellite. J. Geophys. Res., 112, D02201, doi:10.1029/2006JD007547.
Berner, A. H., C. S. Bretherton, and R. Wood, 2011: Large-eddy simulation of mesoscale dynamics and entrainment around a pocket of open cells observed in VOCALS-REx. Atmos. Chem. Phys., 11, 10 525–10 540.
Bony, S., and J.-L. Dufresne, 2005: Marine boundary layer clouds at the heart of tropical cloud feedback uncertainties in climate models. Geophys. Res. Lett., 32, L20806, doi:10.1029/2005GL023851.
Boutle, I. A., and S. J. Abel, 2012: Microphysical controls on the stratocumulus topped boundary-layer structure during VOCALS-REx. Atmos. Chem. Phys., 12, 2849–2863, doi:10.5194/acp-12-2849-2012.
Bretherton, C. S., T. Uttal, C. W. Fairall, S. E. Yuter, R. A. Weller, D. Baumgardner, K. Comstock, and R. Wood, 2004: The EPIC 2001 stratocumulus study. Bull. Amer. Meteor. Soc., 85, 967–977.
—, J. Uchida, and P. N. Blossey, 2010a: Slow manifolds and multiple equilibria in stratocumulus-capped boundary layers. J. Adv. Model. Earth Syst., 2 (4), doi:10.3894/JAMES.2010.2.14.
—, R. Wood, R. C. George, D. Leon, G. Allen, and X. Zheng, 2010b: Southeast Pacific stratocumulus clouds, precipitation and boundary layer structure sampled along 20°S during VOCALS-REx. Atmos. Chem. Phys., 10, 10 639–10 654.
Burleyson, C. D., S. P. de Szoeke, S. E. Yuter, M. Wilbanks, and W. A. Brewer, 2013: Observations of the diurnal cycle of southeast Pacific marine stratocumulus clouds and precipitation. J. Atmos. Sci., 70, 3876–3894.
Caldwell, P., C. S. Bretherton, and R. Wood, 2005: Mixed layer budget analysis of stratocumulus dynamics during EPIC. J. Atmos. Sci., 62, 3775–3791.
Chaigneau, A., M. Le Texier, G. Eldin, C. Grados, and O. Pizarro, 2011: Vertical structure of mesoscale eddies in the eastern South Pacific Ocean: A composite analysis from altimetry and Argo profiling floats. J. Geophys. Res., 116, C11025, doi:10.1029/2011JC007134.
Chand, D., D. A. Hegg, R. Wood, G. E. Shaw, D. Wallace, and D. S. Covert, 2010: Source attribution of cli-matically important aerosol properties measured at Paposo (Chile) during VOCALS. Atmos. Chem. Phys., 10, 10 789–10 801, doi:10.5194/acp-10-10789-2010.
Chelton, D. B., P. Gaube, M. G. Schlax, J. J. Early, and R. M. Samelson, 2011: The influence of mesoscale
371MARCH 2014AMERICAN METEOROLOGICAL SOCIETY |
eddies on near-surface oceanic chlorophyll. Science, 334, 328–332, doi:10.1126/science.1208897.
Colas, F., J. C. McWilliams, X. Capet, and K. Jaison, 2012: Heat balance and eddies in the Peru-Chile cur-rent system. Climate Dyn., 39, 509–529, doi:10.1007/s00382-011-1170-6.
—, X. Capet, J. C. McWilliams, and Z. Li, 2013: Mesoscale eddy buoyancy f lux and eddy-induced circulation in eastern boundary currents. J. Phys. Oceanogr., 43, 1073–1095.
Colbo, K., and R. Weller, 2007: The variability and heat budget of the upper ocean under the Chile-Peru stratus. J. Mar. Res., 65, 607–637.
—, and —, 2009: The accuracy of the IMET sensor package in the subtropics. J. Atmos. Oceanic Technol., 26, 1867–1890.
Comstock, K. K., C. S. Bretherton, and S. E. Yuter, 2005: Mesoscale variability and drizzle in southeast Pacific stratocumulus. J. Atmos. Sci., 62, 3792–3807.
—, S. E. Yuter, R. Wood, and C. S. Bretherton, 2007: The three-dimensional structure and kinematics of drizzling stratocumulus. Mon. Wea. Rev., 135, 3767–3784.
Davey, M. K., and Coauthors, 2001: STOIC: A study of coupled model climatology and variability in tropical ocean regions. Climate Dyn., 18, 403–420.
Davies, T., M. J. P. Cullen, A. J. Malcolm, M. H. Mawson, A. Staniforth, A. A. White, and N. Wood, 2005: A new dynamical core for the Met Office’s global and regional modeling of the atmosphere. Quart. J. Roy. Meteor. Soc., 131, 1759–1782.
de Szoeke, S. P., and S.-P. Xie, 2008: The tropical east-ern Pacific seasonal cycle: Assessment of errors and mechanisms in IPCC AR4 coupled ocean–general circulation models. J. Climate, 21, 2573–2590.
—, C. W. Fairall, D. E. Wolfe, L. Bariteau, and P. Zuidema, 2010: Surface flux observations on the southeastern tropical Pacific Ocean and attribution of SST errors in coupled ocean–atmosphere models. J. Climate, 23, 4152–4174.
—, S. Yuter, D. Mechem, C. Fairall, C. Burleyson, and P. Zuidema, 2012: Observations of stratocumulus clouds and their effect on the eastern Pacific surface heat budget along 20°S. J. Climate, 25, 8542–8567.
Donner, L. J., and Coauthors, 2011: The dynamical core, physical parameterizations, and basic simulation characteristics of the atmospheric component AM3 of the GFDL global coupled model CM3. J. Climate, 24, 3484–3519.
Fast, J. D., W. I. Gustafson Jr., R. C. Easter, R. A. Zaveri, J. C. Barnard, E. G. Chapman, G. A. Grell, and S. E. Peckham, 2006: Evolution of ozone, particulates, and aerosol direct radiative forcing in the vicinity
of Houston using a fully coupled meteorology-chemistry-aerosol model. J. Geophys. Res., 111, D21305, doi:10.1029/2005jd006721.
Feingold, G., I. Koren, H. Wang, H. Xue, and W. A. Brewer, 2010: Precipitation-generated oscillations in open cellular cloud fields. Nature, 466, 849–852.
Garreaud, R. D., and R. Muñoz, 2004: The diurnal cycle in circulation and cloudiness over the subtropical south-east Pacific: A modeling study. J. Climate, 17, 1699–1710.
—, and —, 2005: The low-level jet off the subtropical west coast of South America: Structure and variabil-ity. Mon. Wea. Rev., 133, 2246–2261.
—, J. Rutllant, J. Quintana, J. Carrasco, and P. Minnis, 2001: CIMAR-5: A snapshot of the lower atmosphere over the subtropical southeast Pacific. Bull. Amer. Meteor. Soc., 82, 2193–2207.
—, —, R. C. Muñoz, D. A. Rahn, M. Ramos, and D. Figueroa, 2011: VOCALS-CUpEx: The Chilean upwelling experiment. Atmos. Chem. Phys., 11, 2015–2029, doi:10.5194/acp-11-2015-2011.
George, R. C., and R. Wood, 2010: Subseasonal vari-ability of low cloud radiative properties over the southeast Pacific Ocean. Atmos. Chem. Phys., 10, 4047–4063, doi:10.5194/acp-10-4047-2010.
—, —, C. S. Bretherton, and G. Painter, 2013: Devel-opment and impact of hooks of high droplet concen-tration on remote southeast Pacific stratocumulus. Atmos. Chem. Phys., 13, 6305–6328.
Grados, C., A. Chaigneau, K. Takahashi, B. Dewitte, R. Garreaud, and L. Gallardo, 2010: VOCALS-REx coastal component. CLIVAR Exchanges, No. 52, International CLIVAR Project Office, Southampton, United Kingdom, 23–28.
Grell, G. A., S. E. Peckham, R. Schmitz, S. A. McKeen, G. Frost, W. C. Skamarock, and B. Eder, 2005: Fully coupled “online” chemistry within the WRF model. Atmos. Environ., 39, 6957–6975, doi:10.1016/j.atmosenv.2005.04.027.
Hawkins, L. N., L. M. Russell, D. S. Covert, P. K. Quinn, and T. S. Bates, 2010: Carboxylic acids, sulfates, and organosulfates in processed continental organic aerosol over the southeast Pacific Ocean during VOCALS-REx 2008. J. Geophys. Res., 115, D13201, doi:10.1029/2009JD013276.
Holte, J., F. Straneo, C. Moffat, R. A. Weller, and J. T. Farrar, 2013: Structure and surface properties of ed-dies in the southeast Pacific Ocean. J. Geophys. Res., 118, 2295–2309, doi:10.1002/jgrc.20175.
Huneeus, N., L. Gallardo, and J. A. Rutllant, 2006: Offshore transport episodes of anthropogenic sulfur in northern Chile: Potential impact on the stratocumulus deck. Geophys. Res. Lett., 33, L19819, doi:10.1029/2006GL026921.
372 MARCH 2014|
Jiang, C., M. F. Cronin, K. A. Kelly, and L. Thompson, 2005: Evaluation of a hybrid satellite- and NWP-based turbulent heat f lux product using Tropical Atmosphere-Ocean (TAO) buoys. J. Geophys. Res., 110, C09007, doi:10.1029/2004JC002824.
Jones, C., C. S. Bretherton, and D. Leon, 2011: Coupled vs. decoupled boundary layers in VOCALS-REx. Atmos. Chem. Phys., 11, 7143–7153, doi:10.5194/acp-11-7143-2011.
Kazil, J., H. Wang, G. Feingold, A. D. Clarke, J. R. Snider, and A. R. Bandy, 2011: Modeling chemical and aerosol processes in the transition from closed to open cells during VOCALS-REx. Atmos. Chem. Phys., 11, 7491–7514.
King, N. J., K. N. Bower, J. Crosier, and I. Crawford, 2013: Evaluating MODIS cloud retrievals with in situ observations from VOCALS-REx. Atmos. Chem. Phys. Discuss., 13, 191–209.
Klein, S. A., and D. L. Hartmann, 1993: The seasonal cycle of low stratiform clouds. J. Climate, 6, 1587–1606.
Lauer, A., Y. Wang, V. T. J. Phillips, C. S. McNaughton, R. Bennartz, and A. D. Clarke, 2009: Simulating marine boundary layer clouds over the eastern Pacific in a regional climate model with double-moment cloud microphysics. J. Geophys. Res., 114, D21205, doi:10.1029/2009JD012201.
Leon, D. C., Z. Wang, and D. Liu, 2008: Climatology of drizzle in marine boundary layer clouds based on 1 year of data from CloudSat and Cloud-Aerosol Lidar and Infrared Pathfinder Satellite Observa-tions (CALIPSO). J. Geophys. Res., 113, D00A14, doi:10.1029/2008JD009835.
Lohmann, U., and J. Feichter, 2005: Global indirect aero-sol effects: A review. Atmos. Chem. Phys., 5, 715–737, doi:10.5194/acp-5-715-2005.
Ma, C.-C., C. R. Mechoso, A. W. Robertson, and A. Arakawa, 1996: Peruvian stratus clouds and the tropical Pacific circulation: A coupled ocean–atmo-sphere GCM study. J. Climate, 9, 1635–1645.
Mechem, D. B., S. E. Yuter, and S. P. de Szoeke, 2012: Thermodynamic and aerosol controls in southeast Pacific stratocumulus. J. Atmos. Sci., 69, 1250–1266.
Mechoso, C. R., and R. Wood, 2010: An abbreviated history of VOCALS. CLIVAR Exchanges, No. 53, International CLIVAR Project Office, Southampton, United Kingdom, 3–5.
—, and Coauthors, 1995: The seasonal cycle over the tropical Pacific in general circulation models. Mon. Wea. Rev., 123, 2825–2838.
Min, Q., and Coauthors, 2012: Comparison of MODIS cloud microphysical properties with in-situ mea-surements over the southeast Pacific. Atmos. Chem.
Phys., 12, 11 261–11 273, doi:10.5194/acp-12-11261-2012.
O’Dell, C. W., F. J. Wentz, and R. Bennartz, 2008: Cloud liquid water path from satellite-based passive micro-wave observations: A new climatology over the global oceans. J. Climate, 21, 1721–1739.
Painemal, D., and P. Zuidema, 2010: Microphysical variability in southeast Pacific stratocumulus clouds: Synoptic conditions and radiative response. Atmos. Chem. Phys., 10, 6255–6269, doi:10.5194/acp-10-6255-2010.
—, and —, 2011: Assessment of MODIS cloud effective radius and optical thickness retrievals over the southeast Pacific with VOCALS-REx in situ measurements. J. Geophys. Res., 116, D24206, doi:10.1029/2011JD016155.
—, and —, 2013: The first aerosol indirect effect quantified through airborne remote sensing during VOCALS-REx. Atmos. Chem. Phys., 13, 917–931, doi:10.5194/acp-13-917-2013.
—, R. Garreaud, J. Rutllant, and P. Zuidema, 2010: Southeast Pacific stratocumulus: High-frequency variability and mesoscale structures over San Félix Island. J. Appl. Meteor. Climatol., 49, 463–477.
Painter, G., 2012: A Lagrangian study of southeast Pacific boundary layer clouds. M.S. thesis, Dept. of Atmospheric Sciences, University of Washington, 48 pp.
Petters, M. D., J. R. Snider, B. Stevens, G. Vali, I. Faloona, and L. Russell, 2006: Accumulation mode aerosol, pockets of open cells, and particle nucleation in the remote subtropical Pacific marine boundary layer. J. Geophys. Res., 111, D02206, doi:10.1029/2004JD005694.
Philander, S. G. H., D. Gu, D. Halpern, G. Lambert, N. C. Lau, T. Li, and R. C. Pacanowski, 1996: Why the ITCZ is mostly north of the equator. J. Climate, 9, 2958–2972.
Pietri, A., P. Testor, V. Echevin, A. Chaigneau, L. Mortier, G. Eldin, and C. Grados, 2013: Finescale vertical structure of the upwelling system off southern Peru as observed from glider data. J. Phys. Oceanogr., 43, 631–646.
Quaas, J., and Coauthors, 2009: Aerosol indirect effects—General circulation model intercomparison and evaluation with satellite data. Atmos. Chem. Phys., 9, 8697–8717, doi:10.5194/acp-9-8697-2009.
Rahn, D., and R. Garreaud, 2010a: Marine boundary layer over the subtropical southeast Pacific during VOCALS-REx. Part I: Mean structure and diurnal cycle. Atmos. Chem. Phys., 10, 4047–4063.
—, and —, 2010b: Marine boundary layer over the subtropical southeast Pacific during VOCALS-REx.
373MARCH 2014AMERICAN METEOROLOGICAL SOCIETY |
Part II: Synoptic variability. Atmos. Chem. Phys., 10, 4491–4505.
—, —, and J. Rutllant, 2011: The low-level atmo-spheric circulation near Tongoy Bay–Point Lengua de Vaca (Chilean coast, 30°S). Mon. Wea. Rev., 139, 3628–3647.
Rosenfeld, D., Y. J. Kaufman, and I. Koren, 2006: Switch-ing cloud cover and dynamical regimes from open to closed Benard cells in response to the suppression of precipitation by aerosols. Atmos. Chem. Phys., 6, 2503–2511, doi:10.5194/acp-6-2503-2006.
Rutllant, J. A., R. C. Muñoz, and R. D. Garreaud, 2013: Meteorological observations in the northern Chilean coast during VOCALS-REx. Atmos. Chem. Phys., 13, 3409–3422, doi:10.5194/acp-13-3409-2013.
Saide, P. E., and Coauthors, 2012a: Evaluating WRF-Chem aerosol indirect effects in southeast Pacific marine stratocumulus during VOCALS-REx. Atmos. Chem. Phys., 12, 3045–3064, doi:10.5194/acp-12-3045-2012.
—, G. R. Carmichael, S. N. Spak, P. Minnis, J. K. Ayers, 2012b: Improving aerosol distributions below clouds by assimilating satellite-retrieved cloud droplet number. Proc. Natl. Acad. Sci., 109, 11 939–11 943.
Savic-Jovcic, V., and B. Stevens, 2008: The structure and mesoscale organization of precipitating stratocumu-lus. J. Atmos. Sci., 65, 1587–1605.
Schneider, W., R. Fuenzalida, E. Rodríguez-Rubio, J. Garcés-Vargas, and L. Bravo, 2003: Charac-teristics and formation of eastern South Pacific Intermediate Water. Geophys. Res. Lett., 30, 1581, doi:10.1029/2003GL017086.
Serpetzoglou, E., B. Albrecht, P. Kollias, and C. Fairall, 2008: Boundary layer, cloud, and drizzle variability in the southeast Pacific stratocumulus regime. J. Climate, 21, 6191–6214.
Shank, L. M., and Coauthors, 2012: Organic carbon and non-refractory aerosol over the remote southeast Pacific: Oceanic and combustion sources. Atmos. Chem. Phys., 12, 557–576, doi:10.5194/acp-12-557-2012.
Sharon, T. M., B. A. Albrecht, H. H. Johnson, P. Minnis, M. M. Khaiyer, T. Van Reken, J. Seinfeld, and R. Flagan, 2006: Aerosol and cloud microphysical characteristics of rifts and gradients in maritime stratocumulus clouds. J. Atmos. Sci., 63, 983–997.
Sherman, K., and G. Hempel, Eds., 2008: The UNEP large marine ecosystem report: A perspective on changing conditions in LMEs of the world’s regional seas. UNEP Regional Seas Rep. 182, 40 pp.
Stevens, B., G. Vali, K. Comstock, R. Wood, M. Van Zanten, P. H. Austin, C. S. Bretherton, and D. H. Lenschow, 2005: Pockets of open cells (POCs) and drizzle in ma-rine stratocumulus. Bull. Amer. Meteor. Soc., 86, 51–57.
Sun, F., A. Hall, and X. Qu, 2011: On the relationship between low cloud variability and lower tropospheric stability in the southeast Pacific. Atmos. Chem. Phys., 11, 9053–9065.
Sun, R., S. Moorthi, H. Xiao, and C. R. Mechoso, 2010: Simulation of low clouds in the southeast Pacific by the NCEP GFS: Sensitivity to vertical mixing. Atmos. Chem. Phys., 10, 12 261–12 272, doi:10.5194/acp-10-12261-2010.
Terai, C. R., R. Wood, D. C. Leon, and P. Zuidema, 2012: Does precipitation susceptibility vary with increasing cloud thickness in marine stratocumulus? Atmos. Chem. Phys., 12, 4567–4583, doi:10.5194/acp-12-4567-2012.
Tomlinson, J. M., R. Li, and D. R. Collins, 2007: Phy s ic a l a nd c hem ic a l prop er t ie s o f t he aerosol within the southeastern Pacific marine boundary layer. J. Geophys. Res., 112, D12211, doi:10.1029/2006JD007771.
Toniazzo, T., C. R. Mechoso, L. Shaffrey, and J. M. Slingo, 2009: Upper-ocean heat budget and ocean eddy transport in the south-east Pacific in a high-resolution coupled model. Climate Dyn., 35, 1309–1329, doi:10.1007/s00382-009-0703-8.
—, S. J. Abel, R. Wood, C. R. Mechoso, and L. C. Shaffrey, 2011: Large-scale and synoptic meteorol-ogy in the south-east Pacific during the observations campaign VOCALS-REx in austral spring 2008. Atmos. Chem. Phys., 11, 4997–5009, doi:10.5194/acp-11-4977-2011.
—, F. Sun, C. R. Mechoso, and A. Hall, 2012: A re-gional modeling study of the diurnal cycle in the lower troposphere in the south-eastern tropical Pacific. Climate Dyn., 41, 1899–1922, doi:10.1007/s00382-012-1598-3.
Twohy, C. H., and Coauthors, 2013: Impacts of aerosol particles on the microphysical and radiative prop-erties of stratocumulus clouds over the southeast Pacific Ocean. Atmos. Chem. Phys., 13, 2541–2562, doi:10.5194/acp-13-2541-2013.
Twomey, S., 1974: Pollution and the planetary albedo. Atmos. Environ., 8, 1251–1256.
—, 1977: The influence of pollution on the shortwave albedo of clouds. J. Atmos. Sci., 34, 1149–1152.
Van Zanten, M. C., and B. Stevens, 2005: Observations of the structure of heavily precipitating marine stra-tocumulus. J. Atmos. Sci., 62, 4327–4342.
Waliser, D. E., and Coauthors, 2012: The “year” of tropi-cal convection (May 2008–April 2010): Climate vari-ability and weather highlights. Bull. Amer. Meteor. Soc., 93, 1189–1218.
Wang, H., and G. Feingold, 2009a: Modeling mesoscale cellular structures and drizzle in marine stratocumulus.
374 MARCH 2014|

Part I: Impact of drizzle on the formation and evolution of open cells. J. Atmos. Sci., 66, 3237–3256.
—, and —, 2009b: Modeling mesoscale cellular structures and drizzle in marine stratocumulus. Part II: The microphysics and dynamics of the boundary region between open and closed cells. J. Atmos. Sci., 66, 3257–3275.
—, —, R. Wood, and J. Kazil, 2010: Modelling microphysical and meteorological controls on pre-cipitation and cloud cellular structures in southeast Pacific stratocumulus. Atmos. Chem. Phys., 10, 6347–6362, doi:10.5194/acp-10-6347-2010.
Wang, S., L. W. O’Neill, Q. Jiang, S. P. de Szoeke, X. Hong, H. Jin, W. T. Thompson, and X. Zheng, 2011: A regional real-time forecast of marine boundary layers during VOCALS-REx. Atmos. Chem. Phys., 11, 421–437.
Whelan, S. P. J., and Coauthors, 2009: Stratus 9/VOCALS ninth setting of the stratus ocean reference station & VOCALS regional experiment: Cruise RB-08-06, September 29–December 2, 2008, Leg 1: Charleston–Arica, September 29–November 3, 2008, Leg 2: Arica–Arica, November 9–December 2, 2008. Woods Hole Oceanographic Institution Tech. Rep. WHOI-2009-03, 127 pp.
Wood, R., and C. S. Bretherton, 2004: Boundary layer depth, entrainment, and decoupling in the cloud-capped subtropical and tropical marine boundary layer. J. Climate, 17, 3576–3588.
—, and D. L. Hartmann, 2006: Spatial variability of liquid water path in marine boundary layer clouds: The importance of mesoscale cellular convection. J. Climate, 19, 1748–1764.
—, K. K. Comstock, C. S. Bretherton, C. Cornish, J. Tomlinson, D. R. Col l ins, and C. Faira l l, 2008: Open cellular structure in marine strato-cumulus sheets. J. Geophys. Res., 113, D12207, doi:10.1029/2007JD009371.
—, M. Köhler, R. Bennartz, and C. O’Dell, 2009: The diurnal cycle of surface divergence over the global oceans. Quart. J. Roy. Meteor. Soc., 135, 1484–1493.
—, and Coauthors, 2011a: The VAMOS Ocean-Cloud-Atmosphere-Land Study Regional Experiment (VOCALS-REx): Goals, platforms, and field opera-tions. Atmos. Chem. Phys., 11, 627–654.
—, C. S. Bretherton, D. Leon, A. D. Clarke, P. Zuidema, G. Allen, and H. Coe, 2011b: An aircraft case study of the spatial transition from closed to open mesoscale cellular convection over the southeast Pacific. Atmos. Chem. Phys., 11, 2341–2370.
—, D. Leon, M. Lebsock, J. Snider, and A. D. Clarke, 2012: Precipitation driving of droplet concentration variability in marine low clouds. J. Geophys. Res., 117, D19210, doi:10.1029/2012JD018305.
Wyant, M. C., and Coauthors, 2010: The PreVOCA experiment: Modeling the lower troposphere in the southeast Pacific. Atmos. Chem. Phys., 10, 4757–4774, doi:10.5194/acp-10-4757-2010.
Yamaguchi, T., W. A. Brewer, and G. Feingold, 2013: Evaluation of Modeled Stratocumulus-Capped Boundary Layer Turbulence with Shipborne Data. J. Atmos. Sci., 70, 3895–3919, doi:10.1175/JAS-D-13-050.1.
Yang, M., and Coauthors, 2011: Atmospheric sulfur cycling in the southeastern Pacific—Longitudinal distribution, vertical profile, and diel variability observed during VOCALS-REx. Atmos. Chem. Phys., 11, 5079–5097, doi:10.5194/acp-11-5079-2011.
Yang, Q., and Coauthors, 2011: Assessing regional scale predictions of aerosols, marine stratocumulus, and their interactions during VOCALS-REx using WRF-Chem. Atmos. Chem. Phys., 11, 11 951–11 975.
Yu, J.-Y., and C. R. Mechoso, 1999a: A discussion on the errors in the surface heat fluxes simulated by a coupled GCM. J. Climate, 12, 416–426.
—, and —, 1999b: Links between annual variations of Peruvian stratus clouds and of SST in the eastern equatorial Pacific. J. Climate, 12, 3305–3318.
Zhang, M. H., and Coauthors, 2005: Comparing clouds and their seasonal variations in 10 atmo-spheric general circulation models with satellite measurements. J. Geophys. Res., 110, D15S02, doi:10.1029/2004JD005021.
Zheng, J., T. Shinoda, G. N. Kiladis, J. Lin, E. J. Metzger, H. E. Hurlburt, and B. S. Giese, 2010: Upper-ocean processes under the stratus cloud deck in the southeast Pacif ic Ocean. J. Phys. Oceanogr., 40, 103–120.
—, —, J.-L. Lin, and G. N. Kiladis, 2011: Sea surface temperature biases under the stratus cloud deck in the southeast Pacific Ocean in 19 IPCC AR4 coupled general circulation models. J. Climate, 24, 4139–4164.
Zheng, X., and Coauthors, 2011: Observations of the boundary layer, cloud, and aerosol variability in the southeast Pacific near-coastal marine stratocumu-lus during VOCALS-REx. Atmos. Chem. Phys., 11, 9943–9959, doi:10.5194/acp-11-9943-2011.
Zuidema, P., D. Painemal, S. de Szoeke, and C. Fairall, 2009: Stratocumulus cloud-top height estimates and their climatic implications. J. Climate, 22, 4652–4666.
—, D. Leon, A. Pazmany, and M. Cadeddu, 2012: Aircraft millimeter-wave passive sensing of cloud liquid water and water vapor during VOCALS-REx. Atmos. Chem. Phys., 12, 355–369, doi:10.5194/acp-12-355-2012.
375MARCH 2014AMERICAN METEOROLOGICAL SOCIETY |